Ghana. Malaria Indicator Survey
|
|
|
- Alisha McLaughlin
- 6 years ago
- Views:
Transcription


1 Ghana Malaria Indicator Survey 2016
2


3 GHANA Malaria Indicator Survey 2016 Ghana Statistical Service Accra, Ghana National Malaria Control Programme Accra, Ghana National Public Health Reference Laboratory Accra, Ghana The DHS Program ICF Rockville, Maryland, USA May 2017
4 The 2016 Ghana Malaria Indicator Survey (2016 GMIS) was implemented by the Ghana Statistical Service (GSS), in close collaboration with the Ghana National Malaria Control Programme (NMCP) and the National Public Health Reference Laboratory (NPHRL) of the Ghana Health Service. Financial support for the survey was provided by the United States Agency for International Development, the Global Fund to Fight AIDS, Tuberculosis, and Malaria, and the Government of Ghana. ICF provided technical assistance through The DHS Program, a USAID-funded project that offers support and technical assistance in the implementation of population and health surveys in countries worldwide. Additional information about the 2016 GMIS may be obtained from the Ghana Statistical Service, Head Office, P.O. Box GP 1098, Accra, Ghana; Telephone: / ; Fax: ; info@statsghana.gov.gh. Information about The DHS Program may be obtained from ICF, 530 Gaither Road, Suite 500, Rockville, MD 20850, USA; Telephone: ; Fax: ; info@dhsprogram.com; Internet: Recommended citation: Ghana Statistical Service (GSS), Ghana Health Service (GHS), and ICF Ghana Malaria Indicator Survey Accra, Ghana, and Rockville, Maryland, USA: GSS, GHS, and ICF.
5 CONTENTS TABLES AND FIGURES... v FOREWORD... ix READING AND UNDERSTANDING TABLES FROM THE 2016 GHANA MIS (GMIS)... xi ACRONYMS AND ABBREVIATIONS... xix MAP OF GHANA... xx 1 INTRODUCTION AND SURVEY METHODOLOGY Survey Objectives Sample Design Questionnaires Anaemia and Malaria Testing Pretest Training of Field Staff Fieldwork Data Processing Ethical Considerations Response Rates HOUSING CHARACTERISTICS, HOUSEHOLD POPULATION, AND WOMEN S CHARACTERISTICS Drinking Water Sources and Treatment Sanitation (Toilet Facility) Housing Characteristics Household Wealth Household Population and Composition Background Characteristics of Women Respondents Educational Attainment of Women Literacy of Women Health Insurance Coverage MALARIA PREVENTION Ownership of Mosquito Nets Household Access and Use of LLINs Use of ITNs by Children and Pregnant Women Malaria in Pregnancy MALARIA IN CHILDREN Care Seeking for Fever in Children Diagnostic Testing of Children with Fever Use of Recommended Antimalarials Prevalence of Low Haemoglobin in Children Prevalence of Malaria in Children MALARIA KNOWLEDGE AND MESSAGING Exposure to Malaria Messages Knowledge and Awareness Self-report of Malaria Episodes and Care Seeking Contents iii
6 REFERENCES APPENDIX A SAMPLE DESIGN A.1 Introduction A.2 Sample Frame A.3 Sample Allocation and Sampling Procedures A.4 Sample Probabilities and Sampling Weights A.5 Survey Implementation APPENDIX B ESTIMATES OF SAMPLING ERRORS APPENDIX C DATA QUALITY TABLES APPENDIX D PERSONS INVOLVED IN THE 2016 GMIS APPENDIX E QUESTIONNAIRES Contents iv
7 TABLES AND FIGURES 1 INTRODUCTION AND SURVEY METHODOLOGY... 1 Table 1.1 Results of the household and individual interviews HOUSING CHARACTERISTICS, HOUSEHOLD POPULATION, AND WOMEN S CHARACTERISTICS... 7 Table 2.1 Household drinking water Table 2.2 Household sanitation facilities Table 2.3 Household characteristics Table 2.4 Household possessions Table 2.5 Wealth quintiles Table 2.6 Household population by age, sex, and residence Table 2.7 Household composition Table 2.8 Women s background characteristics Table 2.9 Women s educational attainment Table 2.10 Women s literacy Table 2.11 Women s health insurance coverage Figure 2.1 Household drinking water by residence... 8 Figure 2.2 Household sanitation facilities by residence... 9 Figure 2.3 Household wealth by residence Figure 2.4 Population pyramid Figure 2.5 Educational attainment of women by residence Figure 2.6 Trends in national health insurance coverage by region MALARIA PREVENTION Table 3.1 Household possession of mosquito nets Table 3.2 Source of mosquito nets Table 3.3 Access to a long-lasting insecticidal net Table 3.4 Use of mosquito nets by persons in the household Table 3.5 Use of existing long-lasting insecticidal nets Table 3.6 Use of mosquito nets by children Table 3.7 Use of mosquito nets by pregnant women Table 3.8 Use of intermittent preventive treatment (IPTp) by women during pregnancy Figure 3.1 Household ownership of LLINs Figure 3.2 Trends in household ownership of LLINs Figure 3.3 LLIN ownership by household wealth Figure 3.4 LLIN ownership by region Figure 3.5 Source of mosquito nets Figure 3.6 Access to and use of LLINs Figure 3.7 LLIN access by region Figure 3.8 LLIN use by household population Figure 3.9 LLIN use by children and pregnant women Figure 3.10 Trends in IPTp use by pregnant women MALARIA IN CHILDREN Table 4.1 Prevalence, diagnosis, and prompt treatment of children with fever Tables and Figures v
8 Table 4.2 Source of advice or treatment for children with fever Table 4.3 Type of antimalarial drugs used Table 4.4 Coverage of testing for anaemia and malaria in children Table 4.5 Haemoglobin <8.0 g/dl in children Table 4.6 Prevalence of malaria in children Figure 4.1 Trends in care seeking for fever in children under age Figure 4.2 Diagnostic testing of children with fever by region Figure 4.3 Prevalence of low haemoglobin in children by region Figure 4.4 Low haemoglobin in children by household wealth Figure 4.5 Trends in malaria prevalence among children Figure 4.6 Prevalence of malaria in children by region Figure 4.7 Prevalence of malaria in children by household wealth MALARIA KNOWLEDGE AND MESSAGING Table 5.1 Exposure to messages on malaria by media source Table 5.2 Exposure to specific messages and information on malaria Table 5.3 Exposure to messages on malaria treatment by media source Table 5.4 Women's knowledge of malaria causes, symptoms, and treatment Table 5.5 Self-reported episodes, diagnosis, and treatment of malaria Table 5.6 Source of advice or treatment for malaria in the previous 12 months Table 5.7 Use of specific antimalarial drugs Figure 5.1 Reach of behaviour change communication messages Figure 5.2 Reach of behaviour change communication messages by region Figure 5.3 Reach of behaviour change communication messages by household wealth Figure 5.4 Knowledge of malaria causes, symptoms, and treatment Figure 5.5 Self-reported episodes, diagnosis, and treatment of malaria Figure 5.6 Malaria testing and treatment REFERENCES APPENDIX A SAMPLE DESIGN Table A.1 Distribution of residential population by region and type of residence Table A.2 Distribution of residential households by region and type of residence Table A.3 Enumeration areas and households Table A.4 Sample allocation of clusters and households Table A.5 Sample allocation of expected number of women age and expected number of children under age Table A.6 Sample implementation APPENDIX B ESTIMATES OF SAMPLING ERRORS Table B.1 List of indicators for sampling errors, Ghana MIS Table B.2 Sampling errors: Total sample, Ghana MIS Table B.3 Sampling errors: Urban sample, Ghana MIS Table B.4 Sampling errors: Rural sample, Ghana MIS Table B.5 Sampling errors: Western sample, Ghana MIS Table B.6 Sampling errors: Central sample, Ghana MIS Table B.7 Sampling errors: Greater Accra sample, Ghana MIS Table B.8 Sampling errors: Volta sample, Ghana MIS Table B.9 Sampling errors: Eastern sample, Ghana MIS Table B.10 Sampling errors: Ashanti sample, Ghana MIS Table B.11 Sampling errors: Brong Ahafo sample, Ghana MIS Tables and Figures vi
9 Table B.12 Sampling errors: Northern sample, Ghana MIS Table B.13 Sampling errors: Upper East sample, Ghana MIS Table B.14 Sampling errors: Upper West sample, Ghana MIS APPENDIX C DATA QUALITY TABLES Table C.1 Household age distribution Table C.2 Age distribution of eligible and interviewed women Table C.3 Completeness of reporting Table C.4 Births by calendar years Tables and Figures vii
10
11 FOREWORD The Ghana Statistical Service (GSS), in collaboration with the Ministry of Health/Ghana Health Service, conducted the 2016 Ghana Malaria Indicator Survey (MIS). The 2016 Ghana MIS was a national survey designed to obtain population-based estimates of malaria indicators to complement routine administrative data that are used to inform strategic planning and evaluation of Ghana s malaria control programme. The survey provides information on malaria prevention, treatment, and prevalence in Ghana. More specifically, the survey collected data on the ownership and use of mosquito bednets, assessed the coverage of intermittent preventive treatment to protect pregnant women against malaria, identified practices and specific medications used to treat malaria, measured indicators of malaria knowledge and communication messages, and estimated the prevalence of malaria and anaemia among children age 6-59 months. The data were collected via the computer-assisted personal interviewing (CAPI) system on tablet computers and paper questionnaires. Three questionnaires were used in the 2016 Ghana MIS: the Household Questionnaire, the Woman s Questionnaire, and the Biomarker Questionnaire. Interviewers completed the Household Questionnaire and the Woman s Questionnaire with the CAPI system, while health technicians completed the Biomarker Questionnaire on paper. The Statistical Service is grateful to the Ministry of Health, the Ghana Health Service, and the National Malaria Control Programme for their valuable partnership and especially for providing vehicles and artemisinin-based combination therapy (ACT) for the field work. The GSS extends its appreciation to the National Public Health & Reference Laboratory for its contribution during the training of field personnel, field supervision, and microscopic reading of the malaria slides to determine malaria parasite infections, and to the Noguchi Memorial Institute for Medical Research for conducting the external quality assurance. The GSS would also like to thank the Ethical Review Committee for the ethical clearance that allowed the performance of the anaemia and malaria testing, and is also grateful to the Global Fund, USAID, and the Government of Ghana for co-funding the survey. The GSS further acknowledges the technical assistance provided by ICF through the DHS program during the preparation and finalization of the survey instruments, pre-test of the instruments, training of fieldworkers, monitoring of the field data collection, and preparation of the final report. We extend our appreciation to all who participated in this survey: the authors, who are cited in this report, the field staff, and other survey personnel. We appreciate the co-operation of all survey respondents for making the 2016 GMIS a success. We hope that this report will be useful for advocacy, evidence-based decision making, and informed service delivery. We encourage data users to conduct further analytical work to deepen understanding on the topics in the survey. Baah Wadieh Acting Government Statistician Ghana Statistical Service Foreword ix
12


13 READING AND UNDERSTANDING TABLES FROM THE 2016 GHANA MIS (GMIS) T he 2016 GMIS final report is based on tables of data located for quick reference through links in the text (electronic version) and at the end of each chapter. In addition, the report features figures that clearly highlight trends, subnational patterns, and background characteristics. Large colourful maps display data by the regions in Ghana. The text has been simplified to highlight key points in bullets and to clearly identify indicator definitions in boxes. Although the text and figures featured in each chapter highlight some of the most important findings, not every finding can be discussed or displayed graphically. For this reason, 2016 GMIS data users should be comfortable reading and interpreting data tables. The following pages provide an introduction to the organization of the 2016 GMIS tables, the presentation of background characteristics, and a brief summary of sampling prodedures used and understanding denominators. In addition, this section provides some exercises for users as they practice their new skills in interpreting 2016 GMIS tables. Reading and Understanding Tables from the 2016 Ghana MIS xi
14 Example 1: Exposure to Messages on Malaria Treatment by Media Source A Question Asked of All Survey Respondents Table 5.3 Exposure to messages on malaria treatment by media source Percentage of women age who, in the past 6 months, have seen or heard an advertisement on the use of ACTs or malaria medicines by media sources, according to background characteristics, Ghana MIS Background characteristic Television Radio Sources of exposure to messages on the use of ACTs/malaria treatment medicines in the past 6 months Newspaper/ magazine Poster/ leaflets Billboard Other Percentage of women who, in past 6 months, saw or heard an advertisement on the use of ACTs or malaria medicines Number of women Age Residence Urban ,768 Rural ,382 Region Western Central Greater Accra Volta Eastern Ashanti Brong Ahafo Northern Upper East Upper West Education No education Primary Middle/JSS/JHS ,010 Secondary/SSS/SHS or higher ,271 Wealth quintile Lowest Second Middle ,046 Fourth ,100 Highest ,213 Total ,150 ACT = Artemisinin-based combination therapy Step 1: Read the title and subtitle. These tell you the topic and the specific population group being described. In this example, the table describes women s exposure to messages on malaria treatment in the 6 months before the survey by media source. All eligible female respondents age were asked these questions. Step 2: Scan the column headings highlighted in green. The headings describe the categories of information. In this table, the first six columns of data show different sources of messages on the use of artemisinin-based combination therapy (ACT)/malaria medicines that women were exposed to in the 6 months before the survey. The seventh column shows women who were exposed to messages on the use of ACT or malaria medicines via any source in the 6 months before the survey. The last column lists the number of women interviewed in the survey. Step 3: Scan the row headings the first column highlighted in blue. These headings show the different ways in which the data are divided into categories based on population characteristics. In this example, the table presents women s exposure to messages about ACTs or malaria medicines by age, urban-rural xii Reading and Understanding Tables from the 2016 Ghana MIS
15 residence, region, educational level, and wealth quintile. Most of the tables in the 2016 GMIS report are divided into these same categories. Step 4: Look at the row at the bottom of the table highlighted in pink. These percentages represent the totals of all women age and their exposure to messages about ACTs or malaria medicines by different media sources. In this example, 21.9%* of women saw a message about ACTs or malaria medicines on television and 9.5% heard a message about ACTs or malaria medicines on the radio in the 6 months before the survey. Television and radio were the most common sources for messages about ACTs or malaria medicines. Step 5: To determine the percentage of women with secondary/sss/shs or higher education who saw a message on ACTs or malaria medicines on a poster or leaflets in the 6 months before the survey, draw two imaginary lines, as shown on the table. This shows that 1.8% of women with secondary/sss/shs or higher education saw a message on ACTs or malaria medicines on a poster or leaflets in the 6 months before the survey. By looking at patterns by background characteristics, you can see how exposure to messages about ACTs or malaria medicines varies across Ghana. Mass media are often used to communicate health messages. Knowing how mass media exposure varies among different groups can help program planners and policy makers determine how to most effectively reach their target populations. *For the purpose of this document, data are presented exactly as they appear in the table including decimal places. However, the text in the remainder of this report rounds data to the nearest whole percentage point. Practice: Use the table in Example 1 to answer the following questions: a) What percentage of women in Ghana were exposed to a message on ACTs or malaria medicines via any source in the 6 months before the survey? b) What age group was most likely to have heard a message on ACTs or malaria medicines on the radio in the 6 months before the survey? c) Compare women in urban areas to women in rural areas which group is more likely to have seen a message on ACTs or malaria medicines on television in the 6 months before the survey? d) What are the lowest and highest percentages (range) of women who were exposed to a message on ACTs or malaria medicines via any media source in the six months before the survey by region? e) Is there a clear pattern in exposure to messages on ACTs or malaria medicines via television by education level? f) Is there a clear pattern in exposure to messages on ACTs or malaria medicines via posters/leaflets by wealth quintile? Answers: a) 27.6% b) Women age 45-49: 13.5% of women in this age group heard a message on ACTs or malaria medicines on the radio in the 6 months before the survey. c) Women in urban areas: 31.2% of women in urban areas saw a message on ACTs or malaria medicines on television in the 6 months before the survey, compared to 11.2% of women in rural areas. d) 10.0% of women in Northern were exposed to a message on ACTs or malaria medicines via any media source in the 6 months before the survey, compared to 52.1% of women in Greater Accra. e) Exposure to messages on ACTs or malaria medicines on television increases as a woman s level of education increases; 7.8% of women with no education saw a message on ACTs or malaria medicines on television in the 6 months before the survey, compared to 37.4% of women secondary/sss/shs or higher education. f) There is no clear pattern in exposure to messages on ACTs or malaria medicines via posters/leaflets by wealth quintile. Reading and Understanding Tables from the 2016 Ghana MIS xiii
16 Example 2: Use of Mosquito Nets by Pregnant Women A Question Asked of a Subgroup of Survey Respondents Table 3.7 Use of mosquito nets by pregnant women Percentages of pregnant women age who, the night before the survey, slept under a mosquito net (treated or untreated), and under a long-lasting insecticidal net (LLIN); and among pregnant women age in households with at least one LLIN, percentage who slept under an LLIN the night before the survey, according to background characteristics, Ghana MIS 2016 Background characteristic 2 Among pregnant women age in all households Percentage who slept under any mosquito net last night Percentage who slept under an LLIN last night Number of women Among pregnant women age in households with at least one LLIN Percentage who slept under a LLIN last night Number of women Residence Urban Rural Region Western * * 23 * 14 Central (58.2) (58.2) 4 43 (66.6) 37 Greater Accra (36.6) (36.6) 49 * 43 Volta (56.3) (56.3) 19 * 4 17 Eastern (40.9) (40.9) 24 * 19 Ashanti (46.2) (46.2) 77 (56.5) 63 Brong Ahafo (57.7) (55.6) 34 (64.3) 30 Northern Upper East (72.9) a (72.9) 19 (72.9) 19 b Upper West (67.1) (67.1) 11 (71.0) 10 Education No education Primary Middle/JSS/JHS Secondary/SSS/SHS or Higher Wealth quintile Lowest Second Middle Fourth (53.0) 53 Highest (41.0) 64 Total Note: Table is based on women who stayed in the household the night before the interview. Figures in parentheses are based on unweighted cases. An asterisk indicates that a figure is based on fewer than 25 unweighted cases and has been suppressed Step 1: Read the title and subtitle. In this example, the table describes two separate groups of pregnant women age 15-49: pregnant women in all households (a) and pregnant women in households with at least one long-lasting insecticidal net (LLIN) (b). Step 2: Identify the two panels. First, identify the columns that refer to pregnant women age in all households (a), and then isolate the columns that refer only to pregnant women age in households with at least one long-lasting insecticidal net (LLIN) (b). Step 3: Look at the first panel. How many pregnant women age in all households were interviewed? 353. Now look at the second panel. How many pregnant women age in households with at least one LLIN were interviewed? 297. The second panel is a subset of the first panel. Step 4: Now examine the table for signs that the data should be interpreted with caution. Only 353 pregnant women age in all households and 297 pregnant women age in households with at least one LLIN were interviewed in the 2016 GMIS. After these pregnant women are further divided into the background characteristic categories, there may be too few cases for the percentages to be reliable. xiv Reading and Understanding Tables from the 2016 Ghana MIS
17 What percentage of pregnant women age in all households in Central Region slept under an LLIN the night before the survey? 58.2%. This percentage is in parentheses because there are between 25 and 49 pregnant women (unweighted) in this category. Readers should use this number with caution it may not be reliable. (For more information on weighted and unweighted numbers, see Example 3.) What percentage of pregnant women age in households with at least one LLIN in Volta region slept under an LLIN the night before the survey? There is no number in this cell only an asterisk. This is because fewer than 25 pregnant women in households with at least one LLIN in Volta region were interviewed in the 2016 GMIS. Results for this group are not reported. The subgroup is very small, and therefore the data are not reliable. Note: When parentheses or asterisks are used in a table, the explanation will be noted under the table. If there are no parentheses or asterisks in a table, you can proceed with confidence that enough cases were included in all categories and that the data are reliable. Reading and Understanding Tables from the 2016 Ghana MIS xv
18 Example 3: Understanding Sampling Weights in 2016 GMIS Tables A sample is a group of people who have been selected for a survey. In the 2016 GMIS, the sample is designed to represent the national population of women age In addition to national data, most countries want to collect and report data on smaller geographical or administrative areas. However, doing so requires a minimum sample size per area. For the 2016 GMIS, the survey sample is representative at the national and regional levels, and for urban and rural areas. Table 2.8 Women s background characteristics Percent distribution of women age by selected background characteristics, Ghana MIS 2016 Background characteristic Weighted percent Number of women Weighted number Unweighted number Western Central Greater Accra Volta Eastern Ashanti Brong Ahafo Northern Upper East Upper West To generate statistics that are representative of Total ,150 5,150 Ghana as a whole and the 10 regions, the number of women surveyed in each region should contribute to the size of the total (national) sample in proportion to size of the region. However, if some regions have small populations, then a sample allocated in proportion to each region s population may not include sufficient women from each region for analysis. To solve this problem, regions with small populations are oversampled. For example, let s say that you have sufficient funds to interview 5,150 women and want to produce results that are representative of Ghana as a whole and its regions (as in Table 2.8). However, the total population of Ghana is not evenly distributed among the regions: some regions, such as Ashanti, are heavily populated while others, such as the Upper East are not. Thus, the Upper East must be oversampled. A sampling statistician determines how many women should be interviewed in each region in order to obtain reliable statistics. The blue column (1) in the table at the right shows the actual number of women interviewed in each region. Within the regions, the number of women interviewed ranges from 437 in the Upper West to 591 in the Northern region. The number of interviews is sufficient to obtain reliable results in each region. With this distribution of interviews, some regions are overrepresented and some regions are underrepresented. For example, the population in Ashanti is about 19% of the population in Ghana, while the Upper East s population contributes only about 4% of the population in Ghana. As the blue column illustrates, the number of women interviewed in Ashanti accounts for only about 11% of the total sample of women interviewed (563/5,150) and the number of women interviewed in Upper East accounts for almost the same percentage of the total sample of women interviewed (10%, or 528/5,150). This unweighted distribution of women does not accurately represent the population. In order to obtain statistics that are representative of Ghana, the distribution of the women in the sample needs to be weighted (or mathematically adjusted) so that it resembles the true distribution in the Ghana. Women from a small region, like the Upper East, should only contribute a small amount to the national total. Women from a large region, like Ashanti, should contribute much more. Therefore, DHS statisticians mathematically calculate a weight which is used to adjust the number of women from each region so that each region s contribution to the total is proportional to the actual population of the region. The numbers in the purple column (2) represent the weighted values. The weighted values can be smaller or larger than the unweighted values at the regional level. The total national sample size of 5,150 women has not changed after weighting, although the distribution of the women in the regions has been changed to represent their contribution to the total population size. How do statisticians weight each category? They take into account the probability that a woman was selected in the sample. If you were to compare the green column (3) to the actual population distribution of Ghana, you would see that women in each region are contributing to the total sample with the same xvi Reading and Understanding Tables from the 2016 Ghana MIS
19 weight that they contribute to the population of the Ghana. The weighted number of women in the survey now accurately represents the proportion of women who live in Ashanti region and the proportion of women who live in the Upper East region. With sampling and weighting, it is possible to interview enough women to provide reliable statistics at national and regional levels. In general, only the weighted numbers are shown in each of the 2016 GMIS tables, so don t be surprised if these numbers seem low: they may actually represent a larger number of women who were interviewed. Reading and Understanding Tables from the 2016 Ghana MIS xvii
20
21 ACRONYMS AND ABBREVIATIONS ACT AIDS CAPI CHPS CSPro EA GDHS GFATM GHS GMIS GSS ILO IPTp ITN LLIN LPG MoH NHIS NMCP NMIMR NPHRL PHC RDT USAID WASH WHO artemisinin-based combination therapy acquired immunodeficiency syndrome computer-assisted personal interviewing community-based health planning and services Census and Survey Processing System enumeration area Ghana Demographic and Health Survey Global Fund to Fight AIDs, Tuberculosis, and Malaria Ghana Health Service Ghana Malaria Indicator Survey Ghana Statistical Service International Labour Organization intermittent preventive treatment in pregnancy insecticide-treated net long-lasting insecticidal net liquified petroleum gas Ministry of Health National Health Insurance Scheme National Malaria Control Programme Noguchi Memorial Institute for Medical Research National Public Health and Reference Laboratory population and housing census rapid diagnostic test United States Agency for International Development water, sanitation, and hygiene World Health Organization Acronyms and Abbreviations xix

22 Map of Ghana xx
23 INTRODUCTION AND SURVEY METHODOLOGY 1 T he 2016 Ghana Malaria Indicator Survey (2016 GMIS) was implemented by the Ghana Statistical Service (GSS), in close collaboration with the Ghana National Malaria Control Programme (NMCP), and the National Public Health Reference Laboratory (NPHRL) of the Ghana Health Service. Financial support for the survey was provided by the United States Agency for International Development (USAID); the Global Fund to Fight AIDs, Tuberculosis, and Malaria (GFATM); and the Government of Ghana. ICF provided technical assistance through The DHS Program, a USAID-funded project that offers support and technical assistance in the implementation of population and health surveys in countries worldwide. 1.1 SURVEY OBJECTIVES The primary objective of the 2016 GMIS is to provide current estimates of key malaria indicators. Specific objectives were: To measure the extent of ownership and use of mosquito bednets To assess coverage of intermittent preventive treatment to protect pregnant women To identify practices and specific medications used for treating malaria among children under age 5 To measure indicators of behaviour change communication messages, knowledge, and practices about malaria To measure the prevalence of malaria and anaemia among children age 6-59 months The findings from the 2016 GMIS will assist policy makers and program managers in evaluating and designing programs and strategies for improving malaria control interventions in Ghana. 1.2 SAMPLE DESIGN The sample for the 2016 GMIS was designed to provide estimates of key malaria indicators for the country as a whole, for urban and rural areas separately, and for each of the 10 administrative regions in Ghana (Western, Central, Greater Accra, Volta, Eastern, Ashanti, Brong Ahafo, Northern, Upper East, and Upper West). The sampling frame used for the 2016 GMIS is the frame of the 2010 Population and Housing Census (PHC) conducted in Ghana. The 2010 PHC frame is being maintained by GSS and updated periodically as new information is received from various surveys. The frame is a complete list of all census enumeration areas (EAs) created for the PHC. An EA is a geographic area that covers an average of 145 households. The EA size is the number of residential households in the EA according to the 2010 PHC. The average size of urban EAs is slightly larger than the average size of rural EAs; the urban EA average size is 185 households compared with an average size of 114 households in rural EAs. The sampling frame contains information about the EAs location, type of residence (urban or rural), and the estimated number of residential households. The 2016 GMIS sample was stratified and selected from the sampling frame in two stages. Each region was separated into urban and rural areas; this yielded 20 sampling strata. Samples of EAs were selected independently in each stratum in two stages. Implicit stratification and proportional allocation were achieved at each of the lower administrative levels by sorting the sampling frame within each sampling Introduction and Survey Methodology 1
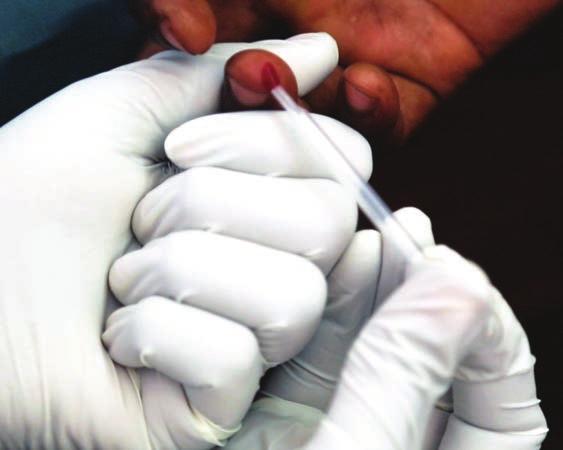
24 achieved at each of the lower administrative levels by sorting the sampling frame within each sampling stratum before the sample selection, according to administrative units in different levels, and by using a probability proportional to size selection at the first stage of sampling. In the first stage, 200 EAs, including 93 EAs in urban areas and 107 EAs in rural areas, were selected with probability proportional to the EA size and with independent selection in each sampling stratum. A household listing operation was implemented from July to August 2016 in all the selected EAs, and the resulting lists of households then served as a sampling frame for the selection of households in the second stage. Some of the selected EAs were very large. To minimise the task of household listing, each large EA selected for the 2016 GMIS was segmented. Only one segment was selected for the survey with the probability proportional to the segment size. Household listing was conducted only in the selected segment. Thus, in the 2016 GMIS, a cluster is either an EA or a segment of an EA. As part of the listing, the field teams updated the necessary maps and recorded the geographic coordinates of each cluster. The listing was conducted by 10 teams that included a supervisor or mapper, 3 listers, and a driver. In the second stage of selection, a fixed number of 30 households was selected from each cluster to make up a total sample size of 6,000 households. Replacement of non-responding households was not allowed. Due to the non-proportional allocation of the sample to the different regions and the possible differences in response rates, sampling weights are required for any analysis that uses the 2016 GMIS data. This ensures the actual representation of the survey results at the national and regional levels. Results shown in this report have been weighted to account for the complex sample design. All women age who were either permanent residents of the selected households or visitors who stayed in the household the night before the survey were eligible to be interviewed. With the parent s or guardian s consent, children age 6-59 months were tested for anaemia and malaria infection. 1.3 QUESTIONNAIRES Three types of questionnaires were used for the 2016 GMIS the Household Questionnaire, the Woman s Questionnaire, and the Biomarker Questionnaire. The questionnaires were adapted to reflect issues relevant to Ghana. Modifications were determined after a series of meetings with various stakeholders from the National Malaria Control Programme (NMCP) and other government ministries and agencies, nongovernmental organisations, and international partners. The questionnaires in English and three local Ghanaian languages (Akan, Ewe, and Ga) were programmed into tablet computers, which enabled the use of computer-assisted personal interviewing (CAPI) for the survey. The Household Questionnaire was used to list all the usual members of and visitors to the selected households. Basic information was collected on the characteristics of each person listed in the household, including age, sex, and relationship to the head of the household. The data on the age and sex of household members, obtained from the Household Questionnaire, were used to identify women eligible for an individual interview and children age 6-59 months eligible for anaemia and malaria testing. Additionally, the Household Questionnaire captured information on characteristics of the household s dwelling unit, such as the source of water, type of toilet facilities, materials used for the floor, ownership of various durable goods, and ownership and use of mosquito nets. The Woman s Questionnaire was used to collect information from women age who were asked questions on the following topics: Background characteristics (age, residential history, education, literacy, religion, and ethnicity) Reproductive history for the last 5 years Preventive malaria treatment for the most recent birth 2 Introduction and Survey Methodology
25 Prevalence and treatment of fever among children under age 5 Knowledge about malaria (symptoms, causes, prevention, and types of antimalarial medications) Exposure and source of media messages about malaria The Biomarker Questionnaire was used to record the results of the anaemia and malaria testing of children age 6-59 months. 1.4 ANAEMIA AND MALARIA TESTING Blood samples for anaemia and malaria testing were collected by finger- or heel-prick from children age 6-59 months. Anaemia testing. A single-use, retractable, spring-loaded, sterile lancet was used for the finger- or heelprick. A drop of blood from the site was then collected in a microcuvette. Haemoglobin analysis was conducted on site with a battery-operated portable HemoCue analyser, which produces a result in less than one minute. Results of the anaemia test were recorded in the Biomarker Questionnaire and on a brochure left in the household that also contained information on the causes and prevention of anaemia. Parents of children with a haemoglobin level under 8 g/dl were advised to take the child to a health facility for follow-up care and were given a referral letter with the haemoglobin reading to show to the health worker at the health facility. Malaria testing with a rapid diagnostic test (RDT). Another drop of blood was tested for malaria with SD BIOLINE Malaria Ag P.f./pan rapid diagnostic test (RDT). This test detects the histidine-rich protein II (HRP-II) antigen of malaria, Plasmodium falciparum (Pf), and other species in human whole blood. The diagnostic test includes a disposable sample applicator that comes in a standard package. A tiny volume of blood is captured on the applicator and placed in the well of the testing device. Like the anaemia testing, malaria RDT results were recorded in the Biomarker Questionnaire and the result shared with the child s parent or guardian. Children who tested positive for malaria and had one of these conditions - Hb less than 8 g/dl, signs and symptoms of severe malaria, or who had taken antimalarial medication within the two weeks before the survey - were considered to have severe malaria and were referred to a health facility. Children who tested positive with uncomplicated malaria were offered a full course of medication according to the standard treatment protocol in Ghana. Prior to treatment, the health technicians asked about any medications the child had taken or was currently taking. Age-appropriate doses of Artemisinin-Based Combination Therapy (ACT) were provided along with instructions on how to administer the medicine to the child. Malaria testing with blood smears. In addition to the RDT, thick blood smears were prepared in the field. Each blood smear slide was given a bar code label, with a duplicate affixed to the Biomarker Questionnaire. An additional copy of the bar code label was affixed to a blood sample transmittal form to track the blood samples from the field to the National Public Health and Reference Laboratory (NPHRL). The slides were dried in a dust-free environment and stored in slide boxes. The thick smear slides were collected regularly from the field and transported to the laboratory for logging and microscopic reading. Upon arrival at NPHRL, thick blood smears were stained with Giemsa stain and examined to determine the presence of Plasmodium infection. All stained slides were read by two independent microscopists who were masked from the RDT results. Slides with discordant results were reanalysed by a third microscopist for final validation. The microscopic results were quality checked by internal and external quality control processes. Internal quality control included an independent microscopist who read 5% of all slides in the study. External quality control was conducted by the Noguchi Memorial Institute for Medical Research (NMIMR) which independently read 10% of the slides. The external quality control testing yielded a 95% agreement between NPHRL and NMIMR results Introduction and Survey Methodology 3
26 1.5 PRETEST Prior to the start of the main fieldwork, a pretest training workshop was conducted to test the data collection programs on tablet computers, survey instruments, and procedures. The training for the pretest took place from 25 July 12 August Seventeen (17) field officers with 3 supervisors, 5 biomarker technicians, 7 interviewers, and 2 laboratory scientists participated in the training. Officers from GSS, NMCP, NPHRL and ICF facilitated the training and supervised the pretest fieldwork. Participants were trained on administering paper questionnaires, using computer-assisted personal interviewing (CAPI), and collecting blood samples for anaemia and parasitaemia testing. The pretest fieldwork was conducted in rural and urban clusters that were not selected for the actual survey sample. At the end of the fieldwork, a debriefing session was held, and the questionnaires and CAPI application were modified based upon feedback from the field. 1.6 TRAINING OF FIELD STAFF The training for the main fieldwork was facilitated by GSS, NMCP, NPHRL, and ICF. The training was held from September 2016 at Winneba, Central Region. Seventy-two field staff including 15 biomarker technicians, 43 interviewers, and 14 supervisors were trained for 3 weeks. Sixty-one field staff were selected for the fieldwork and 11 were placed on stand-by. The training course included instruction on interviewing techniques and field procedures, a detailed review of the questionnaire content, instruction on administering the paper and electronic questionnaires, mock interviews between participants in the classroom, and practice interviews with real respondents in areas outside of the survey sample. There were three days of field practice exercises. Health technicians were also trained on recording children s anaemia and malaria results in the respective brochures and completing the referral slip for any child who was found to be severely anaemic or to have severe malaria. The health technicians completed a separate field practice at the Winneba Municipal Hospital and two other communities to enhance their skills. 1.7 FIELDWORK Field data collection was conducted during a 6-week period from 3 October 1 December Twelve teams were formed, with each including a supervisor, 3 interviewers, a driver, and a health technician. Each team was allocated at least 16 clusters according to local language competency. The team spent an average of 3 days working in a cluster. Information on selected clusters and sampled households was provided to each team for easy location. When eligible respondents were absent from their homes, two or more calls were made to offer respondents the opportunity to participate in the survey. Two officers were responsible for the timely collection of slides and blood samples from the field teams to the NPHRL. In addition to the field supervisors, there were national and regional monitors who supervised field activities and assured the collection and transmission of the blood slides to the laboratory. 1.8 DATA PROCESSING Data for the 2016 GMIS were collected through questionnaires programmed into the CAPI application. The CAPI application was programmed by ICF and loaded into the computers along with the Household, Biomarker, and Woman s Questionnaires. Using the cloud, the field supervisors transferred data on a daily basis to a central location for data processing in the GSS office located in Accra. To facilitate communication and monitoring, each field worker was assigned a unique identification number. The Census and Survey Processing (CSPro) system was used for data editing, cleaning, weighting, and tabulation. Data received from the field teams CAPI applications were registered and checked for any inconsistencies and outliers at the GSS Head Office. Data editing and cleaning included an extensive range of structural and internal consistency checks. All anomalies were communicated to field teams which 4 Introduction and Survey Methodology
27 resolved data discrepancies. The corrected results were maintained in master CSPro data files at ICF and then used for analysis in producing tables for the final report. 1.9 ETHICAL CONSIDERATIONS The protocol for the 2016 GMIS was approved by the Ghana Health Service Ethical Review Committee and ICF s Institutional Review Board. All data and other information collected were confidential. Respondents names and identification numbers were removed from the electronic database during analysis. Blood samples were stored with barcodes identifiers to protect the respondents identity. The risk and benefits of participation in the survey were explained to respondents, and informed consent for the interview or blood collection was sought and obtained from all respondents RESPONSE RATES Table 1.1 presents the results of the household and individual interviews. A total of 6,003 households were selected for the survey of which 5,929 were occupied at the time of fieldwork. Among the occupied households, 5,841 were successfully interviewed, for a response rate of 99%. In the interviewed households, 5,186 eligible women were identified for individual interview and 5,150 were successfully interviewed, for a response rate of 99%. Table 1.1 Results of the household and individual interviews Number of households, number of interviews, and response rates, according to residence (unweighted), Ghana MIS 2016 Residence Result Urban Rural Total Household interviews Households selected 2,912 3,091 6,003 Households occupied 2,876 3,053 5,929 Households interviewed 2,815 3,026 5,841 Household response rate Interviews with women age Number of eligible women 2,395 2,791 5,186 Number of eligible women interviewed 2,369 2,781 5,150 Eligible women response rate Households interviewed/households occupied. 2 Respondents interviewed/eligible respondents. Introduction and Survey Methodology 5
28
29 HOUSING CHARACTERISTICS, HOUSEHOLD 2 POPULATION, AND WOMEN S CHARACTERISTICS Key Findings Drinking water: Most urban households (95%) have access to an improved source of drinking water, while only three-quarters (76%) of rural households have such access. Sanitation: Eighty-five percent of households use unimproved sanitation; 59% have a toilet facility that would be classified as improved if not shared with other households, 12% use an unimproved toilet facility, and 14% practice open defecation. Household wealth: Thirty-five percent of the population in urban areas is in the highest wealth quintile compared with only 6% of the population in the rural areas. Electricity: Nine in ten (90%) urban households and 67% of rural households have electricity. Education: Nineteen percent of women age have no education. Literacy: Overall, 55% of women age are literate. I nformation on the socioeconomic characteristics of the household population in the 2016 GMIS provides context for interpreting demographic and health indicators and can furnish an approximate indication of the representativeness of the survey. In addition, this information sheds light on the living conditions of the population. This chapter presents information on the sources of drinking water, sanitation, wealth, ownership of durable goods, and composition of the household population. In addition, the chapter presents characteristics of the survey respondents such as age, education, and literacy. Socioeconomic characteristics are useful for understanding the factors that affect use of health services and other health behaviours related to malaria control. 2.1 DRINKING WATER SOURCES AND TREATMENT Improved sources of drinking water Include piped water, public taps, standpipes, tube wells, boreholes, protected dug wells and springs, and rainwater. Households that use bottled or sachet water for drinking are classified as using an improved source only if their water for cooking and handwashing come from an improved source. Sample: Households Improved sources of water protect against outside contamination so that water is more likely to be safe to drink. In Ghana, 86% of households have access to an improved source of drinking water (Table 2.1). Ninety-five percent of urban households and 76% of rural households have access to improved water sources. Housing Characteristics, Household Population, and Women s Characteristics 7
30 Urban and rural households rely on different sources of drinking water. Nearly a quarter (24%) of urban households have piped water in their dwelling, yard, plot or to neighbour (Figure 2.1). A high percentage (46%) of households in urban areas access drinking water from bottled/ sachet water but also have water for cooking and handwashing, which comes from an improved source. In contrast, rural households rely on public tap/ standpipe (29%) and tube well or borehole (26%). Nearly a quarter (24%) of rural households use an unimproved source of water for drinking. Forty percent of total households 5 Unimproved source have water on their premises or piped from a neighbour and do not Urban Rural Total spend much time fetching drinking water. On the other hand, 9% spend 30 minutes or more to fetch drinking water outside their premises and 50% spend less than 30 minutes (Table 2.1). Households in rural areas are 5 times more likely (17% versus 3%) to spend 30 minutes or longer in obtaining drinking water than households in urban areas. 2.2 SANITATION (TOILET FACILITY) Figure 2.1 Household drinking water by residence Percent distribution of households by source of drinking water Improved toilet facilities Include any non-shared toilet of the following types: flush/pour flush toilets to piped sewer systems, septic tanks, and pit latrines; ventilated improved pit (VIP) latrines; pit latrines with slabs; and composting toilets. Sample: Households Piped water into dwelling/yard/plot/ to neighbour Public tap/ standpipe Tubewell or borehole Protected well or spring Bottled/sachet water Nationally, only 15% of households use an improved toilet facility, which is defined as a non-shared facility with other households and constructed to prevent likely contact with human waste and reduce the transmission of cholera, typhoid, and other diseases. Eighty-five percent of households use unimproved sanitation; 59% of the households have a toilet facility that would be classified as improved if not shared with other households, 12% use an unimproved toilet facility, and 14% practice open defecation (Table 2.2). 8 Housing Characteristics, Household Population, and Women s Characteristics
31 Households in urban areas are more likely to use improved toilet facilities (19%) compared with rural households (10%) (Figure 2.2). Seventy percent of urban households use a toilet facility that would be classified as improved if it was not shared with other households, compared with 46% of rural households. Households in rural areas are more likely to practice open defecation than households in urban areas (24% versus 6%). 2.3 HOUSING CHARACTERISTICS Figure 2.2 Household sanitation facilities by residence Percent distribution of households by type of toilet/latrine facilities Open defecation (no facility/bush/ field) Unimproved facility Shared facility The 2016 GMIS collected data on housing characteristics such as access to electricity, flooring material, number of sleeping rooms, and types of fuel Urban Rural Total used for cooking. The information on these characteristics, along with other information on the ownership of household durable goods, contributes to the creation of the household wealth index and provides information that may be relevant for other health indicators. Exposure to smoke, especially smoke produced from solid fuels, is potentially harmful to health. Seven in ten households (71%) use solid fuels for cooking in Ghana. While charcoal (45%), and liquefied petroleum gas (LPG), natural gas or biogas (37%) are the two most common types of cooking fuel in urban areas, rural households rely primarily on wood (65%) and charcoal (21%) (Table 2.3). Overall, 79% of households in Ghana have access to electricity. Ninety percent of urban households and 67% of rural households have access to electricity. The most common flooring material for dwelling units in Ghana is cement (61%). Carpet is the second most common flooring material, used by 17% of all households. Sixteen percent of rural households have floors made of earth or sand compared with 10% of households in urban areas. The number of rooms a household uses for sleeping is an indicator of socioeconomic level and crowding in the household, which can facilitate the spread of disease. In Ghana, 60% of households use only one room for sleeping, while 15% use three rooms or more for sleeping. Household Durable Goods Table 2.4 provides data on the ownership of household effects, means of transport, agricultural land, and farm animals. Higher proportions of urban households than rural households own a radio (68% versus 62%), television (77% versus 47%), mobile telephone (95% versus 85%), and car or truck (13% versus 4%). In contrast, higher percentages of rural households than urban households own agricultural land (64% versus 22%) and farm animals (52% versus 19%) Improved sanitation Housing Characteristics, Household Population, and Women s Characteristics 9
32 2.4 HOUSEHOLD WEALTH Wealth index Households are given scores based on the number and kinds of consumer goods they own, ranging from a television to a bicycle or car, and housing characteristics such as the source of drinking water, toilet facilities, and flooring materials. These scores are derived by principal component analysis. National wealth quintiles are compiled by assigning the household score to each usual household member, ranking each person in the household population by their score, and then dividing the distribution into five equal categories, each with 20% of the population. Sample: Households The majority of the population in the urban areas is in the upper two of the wealth quintiles, while in the rural areas, the majority of the population is in the bottom two of the wealth quintiles. Table 2.5 shows that there are variations in the distribution of wealth quintiles at the regional level. The Upper East, Upper West, and Northern regions have the highest percentage of population in the lowest quintile (68%, 60%, and 54% respectively) while Greater Accra (less than 1%) and Ashanti (7%) have the lowest percentage of the population in the lowest wealth quintile. On the other hand, Greater Accra has the highest percentage of population in the highest wealth quintile (48%). Thirty-five percent of the urban population is in the highest wealth quintile (35%) while 6% is in the lowest wealth quintile. In contrast, 34% of rural population is in the lowest wealth quintile while 6% are in the highest wealth quintile (Figure 2.3). Figure 2.3 Household wealth by residence Urban Percent distribution of the de jure population by wealth quintiles Rural Highest Fourth Middle Second Lowest 10 Housing Characteristics, Household Population, and Women s Characteristics
33 2.5 HOUSEHOLD POPULATION AND COMPOSITION Household A person or group of related or unrelated persons who live together in the same dwelling unit(s), who acknowledge one adult male or female as the head of the household, who share the same housekeeping arrangements, and who are considered a single unit. De facto population All persons who stayed in the selected households the night before the interview (whether usual residents or visitors). De jure population All persons who are usual residents of the selected households, whether or not they stayed in the household the night before the interview. How data are calculated All tables are based on the de facto population, unless specified otherwise. In the 2016 GMIS, 20,708 people stayed overnight in 5,841 households. The sex ratio is 92 males per 100 females. The sex ratio is 86 males per 100 females in urban areas and 97 males to 100 females in rural areas. Fifty-one percent of the population lives in rural areas. Age and sex are important demographic variables and are the primary basis of demographic classification. Table 2.6 shows the distribution of the population by 5-year age groups, sex, and residence. The population pyramid in Figure 2.4 shows the population distribution by sex and by 5-year age groups. The broad base of the pyramid shows that the Ghana population is young, which is typical of developing countries with a high fertility rate and low life expectancy. Forty-one percent of the population is under age 15, 53% is age 15-64, and only 5% of the population is age 65 and older (Table 2.6). On average, households in Ghana include four persons (Table 2.7). Men predominantly head households (69%). The percentage of households headed by women is higher in urban areas than in rural areas (36% versus 26%). Figure 2.4 Population pyramid Percent distribution of the household population Age Male Female < Housing Characteristics, Household Population, and Women s Characteristics 11
34 2.6 BACKGROUND CHARACTERISTICS OF WOMEN RESPONDENTS The purpose of this section is to describe the demographic and socioeconomic profile of women in Ghana. Table 2.8 shows the weighted and unweighted numbers and the weighted percent distributions of women who were interviewed in the 2016 GMIS, by background characteristics. More than half of the respondents age (51% of women) are under age 30, which reflects the young age of the population. The vast majority of respondents are Christians. More than 4 in 10 women (42%) are Pentecostal or Charismatic, and 36% of women are Catholic, Anglican, Methodist, Presbyterian, or other Christian. Nineteen percent of women are Muslims. As expected, the Akans form the largest ethnic group, with half of respondents (50%) belonging to this group, followed by the Mole-Dagbanis, which account for 18% of women, and the Ewes, which account for 12% of women. More than 5 out of 10 women (54%) live in urban areas. By region, the largest percentage of women is in Greater Accra and Ashanti (19% each), and the smallest percentage is in the Upper West region (3%). In general, most women in Ghana have some formal education. However, 19% have never attended school. Almost one-fourth of women (25%) have a secondary or higher education. 2.7 EDUCATIONAL ATTAINMENT OF WOMEN Table 2.9 shows the percent distribution of women age by highest level of schooling attended or completed, and median years completed, according to background characteristics. The results show that about 19% of women age have no education. Only 19% of women have completed secondary education or higher (Figure 2.5). Overall, women have completed a median of 8 years of education. Patterns by background characteristics Three in ten (29%) women in rural areas have no education compared with 10% in urban areas (Table 2.9). Urban Rural Total At the regional level, the Northern region recorded the highest percentage of women with no education (60%), while Ashanti and Greater Accra regions recorded the lowest percentages (8% and 9% respectively). The percentage of women with no education decreases with increasing wealth quintile, from 52% of women in the lowest quintile to 4% of women in the highest quintile. 2.8 LITERACY OF WOMEN Figure 2.5 Educational attainment of women by residence Literacy Respondents who have attended higher than secondary school are assumed to be literate. All other respondents were given a sentence to read, and were considered to be literate if they could read all or part of the sentence Percent distribution of women age by highest level of schooling attended or completed Completed secondary or higher Some secondary Some primary/ completed primary No education 12 Housing Characteristics, Household Population, and Women s Characteristics
35 The ability to read and write is an important personal asset that empowers women and men by increasing opportunities in life. Knowing the distribution of the literate population of a country can help programme managers especially those concerned with health and family planning reach their targeted audiences with their messages. The 2016 GMIS assessed literacy by asking women to read a simple sentence in the local language or in English. Respondents were scored on whether they could not read at all, or could read part or the entire sentence shown to them. Women who had never attended school and those who had primary, middle/jss/jhs, or secondary/sss/shs education were asked to read the sentence in the language with which they were most familiar. Only those who have gone to higher than secondary school were assumed to be literate; all others, including those who have attended or completed secondary school, are asked to read the literacy card. In previous DHS surveys, however, women and men who had attended at least some secondary education were assumed to be literate and only those with primary education and below were asked to read a card in their local language or in English to test for literacy. Respondents with higher than secondary education were assumed to be literate. Those who were blind or visually impaired were excluded. In past DHS surveys, persons who have attended secondary school and higher were considered literate. The results show that 8% of women have higher than secondary education. Among those with secondary education or lower and those with no schooling, 38% can read a whole sentence, 10% can read part of a sentence, and 45% cannot read at all. Overall, 55% of women age are literate (Table 2.10). Patterns by background characteristics Literacy is much higher among the youngest women age (81%), and decreases steadily with age to 34% among the oldest women age (Table 2.10). Literacy varies by place of residence; 67% of women in urban areas are literate, compared with 42% of rural women. Regional differences in literacy are notable; literacy is highest among women in the Greater Accra region (69%) and lowest among women in the Northern region (31%). By wealth, literacy ranges from 26% among women in the lowest wealth quintile to 83% among women in the highest quintile. 2.9 HEALTH INSURANCE COVERAGE The National/District Health Insurance Scheme (N/DHIS) is a national health care financing policy introduced to promote universal access to health care in Ghana. In 2003, the scheme was passed into law by Act 650. The Ghana National Health Insurance Authority was established to license, monitor, and regulate the operation of health insurance schemes in the country. In 2012, Act 650 was repealed and replaced with Act 852, which presently governs health insurance practices in Ghana. Table 2.11 shows the percentage of women age with specific types of health insurance coverage, according to the background characteristics. More than 4 out of 10 (42%) of women are not covered by any type of health insurance. Patterns by background characteristics The percentage of women with no health insurance coverage is higher in rural than in urban areas (44% versus 39%). Housing Characteristics, Household Population, and Women s Characteristics 13
36 Sixty-one percent of women in Central region have no health insurance compared with 19% of their counterparts in the Upper West. Forty-nine percent of women with no education have no health insurance compared with 33% of those with higher education. Trends: At the national level, the percentage of women with no health insurance increased slightly from 38% in the 2014 GDHS to 42% in the 2016 GMIS. With the same period, the N/DHIS coverage decreased slightly from 62% to 58%. In contrast to the trend at the national level and in most regions, the N/DHIS coverage increased in Ashanti and Upper East regions between 2014 GDHS and 2016 GMIS (from 52% in 2014 to 69% in 2016) and remained at the same level in Brong Ahafo region (76% both in 2014 and in 2016) (Figure 2.6). Figure 2.6 Trends in national health insurance coverage by region Percent of women age with health insurance provided by National/District Health Insurance Scheme (N/DHIS) Western Central Greater Accra Volta Eastern Ashanti Brong Ahafo GDHS 2016 GMIS Northern Upper East Upper West Total Housing Characteristics, Household Population, and Women s Characteristics
37 LIST OF TABLES For detailed information on housing characteristics, household population, and women s characteristics, see the following tables: Table 2.1 Household drinking water Table 2.2 Household sanitation facilities Table 2.3 Household characteristics Table 2.4 Household possessions Table 2.5 Wealth quintiles Table 2.6 Household population by age, sex, and residence Table 2.7 Household composition Table 2.8 Women s background characteristics Table 2.9 Women s educational attainment Table 2.10 Women s literacy Table 2.11 Women s health insurance coverage Housing Characteristics, Household Population, and Women s Characteristics 15
38 Table 2.1 Household drinking water Percent distribution of households and de jure population by source of drinking water and by time to obtain drinking water, according to residence, Ghana MIS 2016 Households Population Characteristic Urban Rural Total Urban Rural Total Source of drinking water Improved source Piped into dwelling/yard/plot Piped to neighbour Public tap/standpipe Tube well/borehole Protected dug well Protected spring Rainwater Bottled water/sachet water, improved source for cooking/handwashing Unimproved source Unprotected dug well Unprotected spring Tanker truck/cart with small tank Surface water Bottled water/sachet water, unimproved source for cooking/handwashing Total Time to obtain drinking water (round trip) Water on premises Less than 30 minutes minutes or longer Don t know/missing Total Number of households/population 3,195 2,646 5,841 10,442 10,646 21,088 1 Households using bottled water or sachet water for drinking are classified as using an improved or unimproved source according to their water source for cooking and handwashing. 2 Includes water piped to a neighbour. Table 2.2 Household sanitation facilities Percent distribution of households and de jure population by type of toilet/latrine facilities, according to residence, Ghana MIS 2016 Households Population Type of toilet/latrine facility Urban Rural Total Urban Rural Total Improved sanitation Flush/pour flush to piped sewer system Flush/pour flush to septic tank Flush/pour flush to pit latrine Ventilated improved pit (VIP) latrine Pit latrine with a slab Unimproved sanitation Shared facility Flush/pour flush to piped sewer system Flush/pour flush to septic tank Flush/pour flush to pit latrine Ventilated improved pit (VIP) latrine Pit latrine with a slab Unimproved facility Flush/pour flush not to sewer/septic tank/pit latrine Pit latrine without slab/open pit Bucket Hanging toilet/hanging latrine Open defecation (no facility/bush/field) Total Number of households/population 3,195 2,646 5,841 10,442 10,646 21,088 1 Facilities that would be considered improved if they were not shared by two or more households. 16 Housing Characteristics, Household Population, and Women s Characteristics
39 Table 2.3 Household characteristics Percent distribution of households and de jure population by housing characteristics, percentage using solid fuel for cooking, according to residence, Ghana MIS 2016 Households Population Housing characteristic Urban Rural Total Urban Rural Total Electricity Yes No Total Flooring material Earth/sand Dung Wood/planks Parquet or polished wood Vinyl or asphalt strips Ceramic tiles Cement Carpet Other Total Rooms used for sleeping One Two Three or more Total Cooking fuel Electricity LPG/natural gas/biogas Kerosene Coal/lignite Charcoal Wood Straw/shrubs/grass Agricultural crop residue No food cooked in household Total Percentage using solid fuel for cooking Number of households/ population 3,195 2,646 5,841 10,442 10,646 21,088 LPG = Liquefied petroleum gas. 1 Includes coal/lignite, charcoal, wood, straw/shrubs/grass, agricultural crop residue, and animal dung. Housing Characteristics, Household Population, and Women s Characteristics 17
40 Table 2.4 Household possessions Percentage of households that possess various household effects, means of transportation, agricultural land, and livestock/farm animals by residence, Ghana MIS 2016 Residence Possession Urban Rural Total Household effects Radio Television Mobile phone Non-mobile telephone Computer/tablet computer Refrigerator Electric generator/invertor Means of transport Bicycle Animal drawn cart Motorcycle/scooter Car/truck Boat with a motor Boat without a motor Ownership of agricultural land Ownership of farm animals Number of households 3,195 2,646 5,841 1 Cows, bulls, other cattle, horses, donkeys, mules, goats, sheep, chickens or other poultry, pigs, rabbits, or grasscutter. Table 2.5 Wealth quintiles Percent distribution of the de jure population by wealth quintiles and the Gini coefficient, according to residence and region, Ghana MIS 2016 Wealth quintile Residence/region Lowest Second Middle Fourth Highest Total Number of persons Gini coefficient Residence Urban , Rural , Region Western , Central , Greater Accra , Volta , Eastern , Ashanti , Brong Ahafo , Northern , Upper East Upper West Total , Housing Characteristics, Household Population, and Women s Characteristics
41 Table 2.6 Household population by age, sex, and residence Percent distributions of the de facto household population by various age groups and percentage of the de facto household population age 10-19, according to sex and residence, Ghana MIS 2016 Urban Rural Total Age Male Female Total Male Female Total Male Female Total < Don t know/missing Total Dependency age groups Don t know/missing Total Child and adult populations Don t know/missing Total Adolescents Number of persons 4,750 5,499 10,249 5,160 5,299 10,460 9,910 10,798 20,708 Table 2.7 Household composition Percent distribution of households by sex of head of household, and by household size and mean size of household, according to residence, Ghana MIS 2016 Residence Characteristic Urban Rural Total Household headship Male Female Total Number of usual members Total Mean size of households Number of households 3,195 2,646 5,841 Note: Table is based on de jure household members, or usual residents. Housing Characteristics, Household Population, and Women s Characteristics 19
42 Table 2.8 Women s background characteristics Percent distribution of women age by selected background characteristics, Ghana MIS 2016 Background characteristic Weighted percent Number of women Weighted number Unweighted number Age Religion Catholic Anglican/ Methodist/ Presbyterian Pentecostal/Charismatic ,137 1,898 Other Christian Islam ,147 Traditional/spiritualist No religion Other Ethnic group Akan ,593 2,066 Ga/Dangme Ewe Guan Mole-Dagbani ,293 Grusi Gurma Mande Other Residence Urban ,768 2,369 Rural ,382 2,781 Region Western Central Greater Accra Volta Eastern Ashanti Brong Ahafo Northern Upper East Upper West Education No education ,283 Primary Middle/JSS/JHS ,010 1,838 Secondary/SSS/SHS or higher ,271 1,111 Wealth quintile Lowest ,440 Second Middle , Fourth , Highest , Total ,150 5,150 Note: Education categories refer to the highest level of education attended, whether or not that level was completed. 20 Housing Characteristics, Household Population, and Women s Characteristics
43 Table 2.9 Women s educational attainment Percent distribution of women age by highest level of schooling attended or completed, and median years completed, according to background characteristics, Ghana MIS 2016 Highest level of schooling Background characteristic No education Some primary Completed primary 1 Some secondary 2 Completed secondary 3 More than secondary Total Median years completed Number of women Age , Residence Urban ,768 Rural ,382 Region Western Central Greater Accra Volta Eastern Ashanti Brong Ahafo Northern Upper East Upper West Wealth quintile Lowest Second Middle ,046 Fourth ,100 Highest ,213 Total ,150 1 Completed 6th grade at the primary level. 2 Includes some middle/jss/jhs and completed middle/jss/jhs, and some secondary/sss/shs but have not completed secondary/sss/shs. 3 Completed 6th grade at the secondary level. Housing Characteristics, Household Population, and Women s Characteristics 21
44 Table 2.10 Women s literacy Percent distribution of women age by level of schooling attended, level of literacy, and percentage literate, according to background characteristics, Ghana MIS 2016 No schooling, primary or secondary school Background characteristic Higher than secondary schooling Can read a whole sentence Can read part of a sentence Cannot read at all No card with required language Blind/visually impaired Total Percentage literate 1 Number of women Age , Residence Urban ,768 Rural ,382 Region Western Central Greater Accra Volta Eastern Ashanti Brong Ahafo Northern Upper East Upper West Wealth quintile Lowest Second Middle ,046 Fourth ,100 Highest ,213 Total ,150 1 Refers to women who attended schooling higher than the secondary level and women who can read a whole sentence or part of a sentence. 22 Housing Characteristics, Household Population, and Women s Characteristics
45 Table 2.11 Women s health insurance coverage Percentage of women age with specific types of health insurance coverage, according to background characteristics, Ghana MIS 2016 Background characteristic National/District Health Insurance (N/DHIS) Employer based health insurance Mutual Health Organization/ community based insurance Privately purchased commercial insurance None Number of women Age Residence Urban ,768 Rural ,382 Region Western Central Greater Accra Volta Eastern Ashanti Brong Ahafo Northern Upper East Upper West Education No education Primary Middle/JSS/JHS ,010 Secondary/SSS/SHS or higher ,271 Wealth quintile Lowest Second Middle ,046 Fourth ,100 Highest ,213 Total ,150 Housing Characteristics, Household Population, and Women s Characteristics 23
46
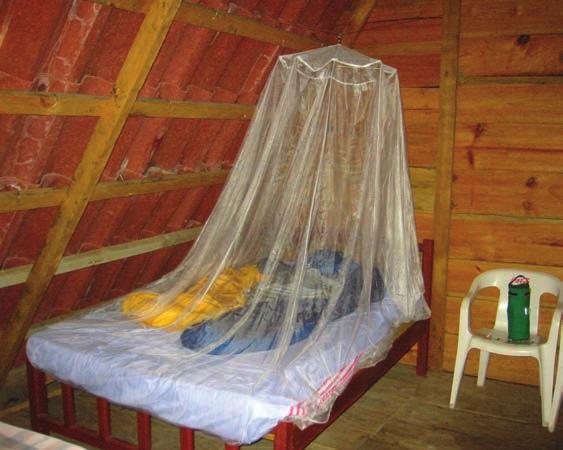
47 MALARIA PREVENTION 3 Key Findings Ownership of long-lasting insecticidal nets (LLINs): Seventy-three percent of households in Ghana own at least one LLIN. Fifty-one percent of households have one LLIN for every two people who stayed in the household the night before the survey. Sources of LLINs: More than 8 in 10 (85%) LLINs owned by households were obtained from mass distribution campaigns. Access to an LLIN: Two-thirds (66%) of the household population in Ghana have access to an LLIN. The percentage of the population with access to an LLIN decreases with increasing level of household wealth from 76% in the lowest wealth quintile to 57% in the highest wealth quintile. Use of LLINs: Forty-two percent of the household population slept under an LLIN the night before the survey. About half of children under age 5 and women age slept under an LLIN the night before the survey. Intermittent Preventive Therapy (IPTp): Six in ten women received three or more doses of SP/Fansider for the prevention of malaria in pregnancy. T his chapter describes the population coverage rates of some key malaria control interventions in Ghana, including ownership and use of mosquito nets and intermittent preventive treatment in pregnancy (IPTp). The Ghana Strategic Plan for Malaria Control focuses on scaling-up these interventions to reduce the malaria morbidity and mortality burden by 75% by The Ghana Strategic Plan also seeks to increase the coverage of long-lasting insecticidal nets (LLINs) by distribution through mass campaigns and continuous distribution at antenatal clinics (ANC), child welfare clinics (CWC), and primary schools in order to reduce the burden of malaria (NMCP 2014). In Ghana, LLINs are routinely distributed free to children under age 1 on successful completion of Penta 3 immunisation (third dose of a vaccine against diphtheria, pertussis, tetanus; Haemophilus influenzae type b; and hepatitis B) and to pregnant women during their first antenatal care (ANC) visit. Malaria Prevention 25
48 3.1 OWNERSHIP OF MOSQUITO NETS Ownership of long-lasting insecticidal nets Households that have at least one long-lasting insecticidal net (LLIN). An LLIN is a factory-treated net that does not require any further treatment. Sample: Households Full household LLIN coverage Percentage of households with at least one LLIN for every two people. Sample: Households The distribution and use of LLINs is one of the central interventions for preventing malaria infection in Ghana. The National Malaria Control Programme Strategic Plan aims to achieve universal coverage with LLINs, defined as one net for every two people (GMOP 2016). To achieve this objective, the Plan supports time-limited, national, free distribution campaigns of LLINs. In the recent past, Ghana has implemented two major LLIN mass distribution campaigns. In the first campaign that ended in 2012, more than 12.4 million LLINs were distributed in all 10 regions of Ghana. During this campaign, volunteers distributed nets door-to-door and hung them immediately in the recipient households. Between 2014 and 2016, a second LLIN mass distribution campaign was implemented in all ten regions of Ghana. In the Eastern and Volta regions, the LLIN distribution was conducted in 2014 while Ashanti, Brong Ahafo, and the Central and Western regions were covered in In the remaining four regions (Greater Accra, Northern, Upper East, and Upper West), the LLIN distribution campaign was conducted in The longer the time between the most recent LLIN distribution campaign and the 2016 GMIS data collection, the lower the coverage of the LLINs. While mass campaigns rapidly increase the ownership of LLINs, the coverage gaps appear almost immediately post-campaign through net deterioration, loss of nets, and population growth. Thus, complementary continuous distribution channels are required. Data from the National Malaria Control Programme (NMCP) show that for the Greater Accra and Western regions, the campaign reached only approximately 80% of the households. In contrast, the LLIN distribution campaign reached 95% of the households or more in all the other regions. The 2016 GMIS indicates that 73% of households in Ghana own at least one LLIN (Table 3.1). Fifty-one percent of households have one LLIN for every two people who stayed in the household the night before the survey, while 22% of households own at least one LLIN but have an insufficient supply for the number of household members and 27% of households do not own any LLINs. (Figure 3.1). Figure 3.1 Household ownership of LLINs Percent distribution of households At least 1 LLIN for every 2 people in the HH 51% No LLINs 27% At least 1 LLIN, but not enough for all HH members 22% 26 Malaria Prevention
49 Trends: The data show an increase in households that own at least one LLIN from 2008 to In 2008, only 31% of households owned at least one LLIN. In 2014, the percentage of households owning at least one LLIN more than doubled to 64%. This increased to 73% in 2016 (Figure 3.2). Patterns by background characteristics Ownership of LLINs is higher in rural households (82%) compared with urban households (65%) (Table 3.1). Sixty-three percent of households in the highest wealth quintile and 66% of households in the fourth wealth quintile own an LLIN, while 86% of households in the lowest wealth quintile and 81% of households in the second wealth quintile own at least one LLIN (Figure 3.3). The Upper East region has the highest household ownership of LLINs (94%) followed by the Upper West region with household ownership of LLIN of 90%. The Greater Accra region (61%) and the Western region (67%) are the regions with the lowest household ownership of LLINs (Figure 3.4). Figure 3.2 Trends in household ownership of LLINs Figure 3.3 LLIN ownership by household wealth 86 Percentage of households owning at least one long-lasting insecticidal net (LLIN) GDHS 2014 GDHS 2016 GMIS Percentage of households with at least one LLIN Figure 3.4 LLIN ownership by region Percentage of households with at least one LLIN Lowest Second Middle Fourth Highest Poorest Wealthiest Source of nets There are several ways to obtain a mosquito net in Ghana. Mosquito nets can be obtained during mass distribution campaigns, ANC visits by pregnant women, and visits to child welfare clinics. Nets can also Malaria Prevention 27
50 be purchased directly at various sales points. Figure 3.5 shows the percentage distribution of LLINs by source in interviewed households. The main source of mosquito net acquisition in Ghana was mass national distribution campaigns between 2014 and 2016, accounting for 85% of nets in households. Four percent of households obtained their mosquito nets through ANC, with 2% obtaining their mosquito nets either through immunisation distribution or from shops/markets. Patterns by background characteristics At the regional level, a higher proportion of households in the Northern, Upper West, and Upper East regions obtain their mosquito nets through mass national campaigns compared with the Greater Accra and Volta regions. Figure 3.5 Source of mosquito nets Percent distribution of mosquito nets by source of net National distribution ANC 4 distribution Immunisation 2 distribution Shop/Market Other Five percent of households from the Greater Accra region and 5% of households from the Volta region acquired their mosquito nets from shops or the market (Table 3.2). 3.2 HOUSEHOLD ACCESS AND USE OF LLINS Access to an LLIN Percentage of the population that could sleep under an LLIN if each LLIN in the household were used by up to two people. Sample: De facto household population Use of LLINs Percentage of population that slept under an LLIN the night before the survey. Sample: De facto household population The LLINs act as both a physical and chemical barrier against mosquitoes. By reducing the vector population, LLINs may help to reduce malaria risk at the community level and of the individuals who use them. Comparing LLIN access and LLIN use indicators can help programmes identify if there is a behavioural gap in which available LLINs are not being used. If the difference between these indicators is substantial, the programme may need to focus on behaviour change and identification of the main drivers or barriers to LLIN use to design an appropriate intervention. This analysis helps LLIN programmes determine whether they need to achieve higher LLIN coverage, promote LLIN use, or both. Figure 3.6 indicates that 66% of the household population in Ghana have access to an LLIN, while only 42% of the household population slept under an LLIN the night before the survey (Figure 3.6). The Figure 3.6 Access to and use of LLINs Percentage of the household population with access to an LLIN and who slept under an LLIN the night before the survey Access to an LLIN Slept under an LLIN 66 Urban Rural Total Malaria Prevention
51 gap between access to and use of LLINs is larger in urban (59% versus 30%) than in rural households (72% versus 54%). In households with at least one LLIN, 53% of the population slept under an LLIN the previous night (Table 3.4). Overall, 48% of all existing LLINs were used the night before the survey (Table 3.5). Patterns by background characteristics The percentage of the population with access to an LLIN decreases with increasing level of household wealth from 76% in the highest wealth quintile to 57% in the lowest wealth quintile (Table 3.3). The three northern regions in Ghana have the highest percentage of the population with access to an LLIN compared with regions in the southern part of the country. The Upper East region has the highest percentage (88%) of the population with access to a LLIN, while the Greater Accra region has the lowest percentage (54%) of the population with access to a LLIN (Figure 3.7). Similar to access to an LLIN, the Upper East region has the highest percentage (63%) of the population that slept under an LLIN the night before the survey, while the Greater Accra region has the lowest percentage (18%) of the population that used an LLIN (Figure 3.8). Figure 3.7 LLIN access by region Percent of the household population that could sleep under an LLIN if each LLIN in the household were used by up to 2 people Figure 3.8 LLIN use by household population Percentage of the household population who slept under an LLIN the previous night Children under age 5 are more likely to sleep under an LLIN than persons age 50 and older (52% versus 41%) (Table 3.4). The percentage of the household population that slept under an LLIN the night before the survey decreases substantially with increasing level of wealth. Six in ten household members (61%) from the lowest wealth quintile slept under an LLIN the previous night, as compared with 23% of the household population from the highest wealth quintile. Malaria Prevention 29
52 3.3 USE OF ITNS BY CHILDREN AND PREGNANT WOMEN Malaria is endemic in Ghana with transmission occurring year-round with seasonal variations. Partial immunity to the disease is acquired over time for those living in the high malaria transmission areas (Doolan et al. 2009). Children under age 5 are prone to severe malaria infection because they lack acquired immunity. For about 6 months after birth, antibodies acquired from the mother during pregnancy protect the child, although this maternal immunity is gradually lost when the child begins to develop his/her own immunity to malaria. Age is an important factor in determining levels of acquired immunity to malaria because acquired immunity does not prevent infection but protects against severe disease and death. The pace at which immunity develops depends upon the exposure to malarial infection. In high malariaendemic areas, children are thought to attain a high level of immunity by their fifth birthday. These children may experience episodes of malaria illness but usually do not suffer from severe, life-threatening conditions (Shulman and Dorman 2003). Adults usually acquire some degree of immunity. However, since pregnancy suppresses immunity, women in their first pregnancies are at increased risk for severe malaria. Malaria in pregnancy is frequently associated with the development of anaemia, which interferes with the maternal-foetus exchange and may lead to low-birth-weight infants, placental parasitaemia, foetal death, abortion, stillbirth, and prematurity (Shulman and Dorman 2003). As stated in the Strategic Plan for Malaria Control in Ghana , children under age 5 and pregnant women should sleep under an LLIN every night to prevent malaria complications. Fifty-two percent of children under age 5 slept under an LLIN the night before the survey and 62% of children under age 5 in households with at least one LLIN slept under an LLIN the night before the survey (Table 3.6). Overall, 50% of pregnant women age slept under an LLIN the night before the survey and 59% of pregnant women who live in households with at least one LLIN slept under an LLIN the night before the survey (Table 3.7). Trends: The percentage of children under age 5 who slept under an LLIN the night before the survey increased from 43% in 2014 to 52% in The percentage of pregnant women who slept under an LLIN increased from 39% in 2014 to 50% in 2016 (Figure 3.9). Patterns by background characteristics Children in rural areas are more likely than children in urban areas to sleep under an LLIN (62% and 41% respectively) (Table 3.6). The use of LLINs among children under age 5 decreases with an increase in wealth quintile. Sixty-seven percent of children in the lowest wealth quintile slept under an LLIN compared with 36% of children in the highest wealth quintile. Figure 3.9 LLIN use by children and pregnant women Percentage of children and pregnant women using an LLIN the night before the survey Children under age Pregnant women 2014 GDHS 2016 GMIS The use of LLINs among children under age 5 is highest in the Upper East region (76%) and lowest in the Greater Accra region (33%). Pregnant women in the rural areas are more likely to use LLINs than those who live in urban areas (60% versus 39%) (Table 3.7). 30 Malaria Prevention
53 Sleeping under an LLIN is highest among women with no education (68%) and among those in the lowest wealth quintile (70%). 3.4 MALARIA IN PREGNANCY Intermittent preventive treatment (IPTp) during pregnancy (IPTp2+) Percentage of women who took at least two doses of SP/Fansidar. Sample: Women age with a live birth in the 2 years before the survey Intermittent preventive treatment (IPTp) during pregnancy (IPTp3+) Percentage of women who took at least three doses of SP/Fansidar. Sample: Women age with a live birth in the 2 years before the survey In Ghana, intermittent preventive treatment of malaria in pregnancy (IPTp) is a full therapeutic course of antimalarial medicine given to pregnant women at routine ANC visits to prevent malaria. IPTp helps prevent maternal malaria episodes, maternal and foetal anaemia, placental parasitaemia, low birth weight, and neonatal mortality. The World Health Organization (WHO) recommends a three-pronged approach for reducing the negative health effects associated with malaria in pregnancy (MIP): prompt diagnosis and treatment of confirmed infection, use of long-lasting insecticidal nets (LLINs), and IPTp (WHO 2004). Sulfadoxine-pyrimethamine (SP), also known as Fansidar, is the recommended drug for IPTp in Ghana. Over the years, the Ministry of Health (MoH) and the Ghana Health Service (GHS) have been implementing IPTp, defined as provision of sulfadoxine-pyrimethamine (SP)/Fansidar to protect the mother and her unborn child from malaria during routine ANC visits after the first trimester of pregnancy with one month between doses. In 2013, the National Malaria Control Programme revised its policy based on a WHO recommendation from only three doses to three or more doses (WHO 2012a; WHO 2012b). The 2016 GMIS measured coverage of this intervention among women with a live birth in the 2 years before the survey. Eighty-five percent of women age with live birth in the 2 years before the survey reported receiving one or more doses of SP/Fansider during the pregnancy of the most recent live birth and 78% received two or more doses. Six in ten women received three or more doses of SP/Fansider as recommended by the National Malaria Control Strategy (Table 3.8). Malaria Prevention 31
54 Trends: The percentage of women with a live birth in the 2 years before the survey who received 2 doses of SP/Fansider increased from 46% in 2008 to 68% in 2014 and to 78% in The percentage of women with a live birth in the 2 years before the survey who received 3 doses of SP/Fansider was estimated at 28% in 2008 but has more than Figure 3.10 Trends in IPTp use by pregnant women doubled since then (Figure 3.10). Patterns by background characteristics Sixty-four percent of urban pregnant women received at least three doses of SP/Fansider during pregnancy compared with 56% of rural women (Table 3.8). Receiving at least three doses of SP/Fansider increases with an increase in a woman s education. Fifty-one percent of pregnant women with no education received at least three doses of SP/Fansider, compared with 71% of women with a secondary or higher education. Percentage of women with a live birth in the 2 years before the survey who received at least 1, 2, or 3 doses of SP/Fansidar IPTp1+ 85 IPTp IPTp GDHS 2014 GDHS 2016 GMIS A higher percentage of women in the wealthiest households (68%) received at least three doses of SP/Fansider compared with women in the lowest wealth quintiles (51%). 32 Malaria Prevention
55 LIST OF TABLES For detailed information on malaria, see the following tables: Table 3.1 Household possession of mosquito nets Table 3.2 Source of mosquito nets Table 3.3 Access to a long-lasting insecticidal net Table 3.4 Use of mosquito nets by persons in the household Table 3.5 Use of existing long-lasting insecticidal nets Table 3.6 Use of mosquito nets by children Table 3.7 Use of mosquito nets by pregnant women Table 3.8 Use of intermittent preventive treatment by women during pregnancy Malaria Prevention 33
56 Table 3.1 Household possession of mosquito nets Percentage of households with at least one mosquito net (treated or untreated), and long-lasting insecticidal net (LLIN); average number of nets, and LLINs per household; and percentage of households with at least one net, and LLIN per two persons who stayed in the household last night, according to background characteristics, Ghana MIS 2016 Background characteristic Percentage of households with at least one mosquito net Any mosquito net Long-lasting insecticidal net (LLIN) Average number of nets per household Any mosquito net Long-lasting insecticidal net (LLIN) Number of households Percentage of households with at least one mosquito net for every two persons who stayed in the household last night Any mosquito net Long-lasting insecticidal net (LLIN) Number of households with at least one person who stayed in the household last night Residence Urban , ,151 Rural , ,619 Region Western Central Greater Accra , ,151 Volta Eastern Ashanti , ,267 Brong Ahafo Northern Upper East Upper West Wealth quintile Lowest Second , ,129 Middle , ,181 Fourth , ,300 Highest , ,258 Total , , Malaria Prevention
57 Table 3.2 Source of mosquito nets Percent distribution of mosquito nets by source of net, according to background characteristics, Ghana MIS 2016 Background characteristic mass distribution campaign ANC visit Immunization visit Government health facility Private health facility Pharmacy/ chemist/drug store Shop/market Community health worker Religious institution Community based agent Primary school Other Don t know Total Number of mosquito nets Residence Urban ,444 Rural ,251 Region Western Central ,292 Greater Accra ,432 Volta Eastern Ashanti ,839 Brong Ahafo Northern ,135 Upper East Upper West Wealth quintile Lowest ,060 Second ,156 Middle ,955 Fourth ,806 Highest ,719 Total ,696 ANC = Antenatal care. Malaria Prevention 35
58 Table 3.3 Access to a long-lasting insecticidal net Percentage of the de facto population with access to a longlasting insecticidal net (LLIN) in the household, according to background characteristics, Ghana MIS 2016 Background characteristic Percentage of the de facto population with access to an LLIN 1 Residence Urban 59.4 Rural 72.1 Region Western 59.1 Central 76.1 Greater Accra 53.9 Volta 66.4 Eastern 60.5 Ashanti 59.9 Brong Ahafo 72.1 Northern 76.7 Upper East 88.1 Upper West 80.5 Wealth quintile Lowest 75.6 Second 72.0 Middle 64.5 Fourth 59.9 Highest 57.2 Total Percentage of the de facto household population who could sleep under an LLIN if each LLIN in the household were used by up to two people. 36 Malaria Prevention
59 Table 3.4 Use of mosquito nets by persons in the household Percentage of the de facto household population who slept the night before the survey under a mosquito net (treated or untreated), and under a long-lasting insecticidal net (LLIN); and among the de facto household population in households with at least one LLIN, the percentage who slept under an LLIN the night before the survey, according to background characteristics, Ghana MIS 2016 Background characteristic Percentage who slept under any mosquito net last night Household population Percentage who slept under an LLIN last night Number of persons Household population in households with at least one LLIN Percentage who slept under an LLIN last night Number of persons Age < , , , , , , , , , ,238 Sex Male , ,774 Female , ,629 Residence Urban , ,400 Rural , ,003 Region Western , ,218 Central , ,008 Greater Accra , ,382 Volta , ,326 Eastern , ,472 Ashanti , ,100 Brong Ahafo , ,422 Northern , ,080 Upper East Upper West Wealth quintile Lowest , ,705 Second , ,527 Middle , ,192 Fourth , ,044 Highest , ,934 Total , ,403 Note: Total includes 49 persons for whom information on age is missing. Table 3.5 Use of existing long-lasting insecticidal nets Percentage of long-lasting insecticidal nets (LLINs) that were used by anyone the night before the survey, according to background characteristics, Ghana MIS 2016 Background characteristic Percentage of existing LLINs used last night Number of LLINs Residence Urban ,356 Rural ,152 Region Western Central ,262 Greater Accra ,412 Volta Eastern Ashanti ,804 Brong Ahafo Northern ,127 Upper East Upper West Wealth quintile Lowest ,038 Second ,115 Middle ,910 Fourth ,773 Highest ,672 Total ,508 Malaria Prevention 37
60 Table 3.6 Use of mosquito nets by children Percentage of children under age 5 who, the night before the survey, slept under a mosquito net (treated or untreated), and under a long-lasting insecticidal net (LLIN); and among children under age 5 in households with at least one LLIN, the percentage who slept under an LLIN the night before the survey, according to background characteristics, Ghana MIS 2016 Background characteristic Children under age 5 in all households Percentage who slept under any mosquito net last night Percentage who slept under an LLIN last night Number of children Children under age 5 in households with at least one LLIN Percentage who slept under an LLIN last night Age in months < Sex Male , ,389 Female , ,334 Residence Urban , ,151 Rural , ,572 Region Western Central Greater Accra Volta Eastern Ashanti Brong Ahafo Northern Upper East Upper West Number of children Wealth quintile Lowest Second Middle Fourth Highest Total , ,723 Note: Table is based on children who stayed in the household the night before the interview. 38 Malaria Prevention
61 Table 3.7 Use of mosquito nets by pregnant women Percentages of pregnant women age who, the night before the survey, slept under a mosquito net (treated or untreated),, and under a long-lasting insecticidal net (LLIN); and among pregnant women age in households with at least one LLIN, percentage who slept under an LLIN the night before the survey, according to background characteristics, Ghana MIS 2016 Background characteristic Among pregnant women age in all households Percentage who slept under any mosquito net last night Percentage who slept under an LLIN last night Number of women Among pregnant women age in households with at least one LLIN Percentage who slept under a LLIN last night Number of women Residence Urban Rural Region Western * * 23 * 14 Central (58.2) (58.2) 43 (66.6) 37 Greater Accra (36.6) (36.6) 49 * 43 Volta (56.3) (56.3) 19 * 17 Eastern (40.9) (40.9) 24 * 19 Ashanti (46.2) (46.2) 77 (56.5) 63 Brong Ahafo (57.7) (55.6) 34 (64.3) 30 Northern Upper East (72.9) (72.9) 19 (72.9) 19 Upper West (67.1) (67.1) 11 (71.0) 10 Education No education Primary Middle/JSS/JHS Secondary/SSS/SHS or Higher Wealth quintile Lowest Second Middle Fourth (53.0) 53 Highest (41.0) 64 Total Note: Table is based on women who stayed in the household the night before the interview. Figures in parentheses are based on unweighted cases. An asterisk indicates that a figure is based on fewer than 25 unweighted cases and has been suppressed. Malaria Prevention 39
62 Table 3.8 Use of intermittent preventive treatment (IPTp) by women during pregnancy Percentage of women age with a live birth in the 2 years before the survey who, during the pregnancy of the most recent live birth, received one or more doses of SP/Fansidar, two or more doses of SP/Fansidar, and three or more doses of SP/Fansidar, according to background characteristics, Ghana MIS 2016 Background characteristic Percentage who received one or more doses of SP/Fansidar Percentage who received two or more doses of SP/Fansidar Percentage who received three or more doses of SP/Fansidar Number of women with a live birth in the 2 years preceding the survey Residence Urban Rural Region Western Central Greater Accra Volta Eastern Ashanti Brong Ahafo Northern Upper East Upper West Education No education Primary Middle/JSS/JHS Secondary/SSS/SHS or higher Wealth quintile Lowest Second Middle Fourth Highest Total , Malaria Prevention
63 MALARIA IN CHILDREN 4 Key Findings Fever prevalence: One in three children (30%) under age 5 had fever in the 2 weeks before the survey. Care-seeking for fever: Advice or treatment was sought for 72% of children with fever in the 2 weeks before the survey. Source of advice or treatment: Among children with recent fever for whom care was sought, 51% received advice or treatment from the private health sector, 48% from the public health sector, and 2% elsewhere. Testing: Thirty percent of children with a recent fever received a finger or heel prick for testing. Type of antimalarial drug used: Among children under age 5 with a recent fever who received an antimalarial, 59% received artemisinin combination therapy. Severe anaemia: Seven percent of children age 6-59 months have a haemoglobin level less than 8 g/dl. Malaria: Two in ten children age 6-59 months tested positive for malaria via microscopy. T his chapter presents data useful for assessing how well fever management strategies are implemented. Specific topics include care seeking for febrile children, diagnostic testing of children with fever, and therapeutic use of antimalarial drugs. Prevalence of anaemia and malaria among children age 6-59 months is also assessed. 4.1 CARE SEEKING FOR FEVER IN CHILDREN Care seeking for children under age 5 with fever Percentage of children under age 5 with a fever in the 2 weeks before the survey for whom advice or treatment was sought from a health provider, a health facility, or a pharmacy. Sample: Children under age 5 with a fever in the 2 weeks before the survey One of the key case management objectives of the National Malaria Control Programme (NMCP) is to ensure that all suspected malaria cases have access to confirmatory diagnosis and receive effective treatment if positive for malaria. Fever is a key symptom of malaria and other acute infections in children. Malaria fevers require prompt and effective treatment to prevent malaria morbidity and mortality. Thirty percent of children under age 5 had fever in the 2 weeks before the survey. Advice or treatment was sought for 72% of the children with Malaria in Children 41
64 fever in the 2 weeks before the survey, and timely care seeking (the same or next day after fever onset) occurred for 48% of the febrile children (Table 4.1). Among children with recent fever for whom care was sought, most received advice or treatment from the private health sector (51%), including 30% who sought care from a pharmacy/chemist/drug store, 20% from a private hospital/ clinic, and 1% from a private doctor. Forty-eight percent of children with recent fever sought care from public health sector (Table 4.2). Trends: Among those with fever, advice or treatment seeking was slightly less likely in the 2016 GMIS than in the 2014 GDHS (72% to 77%). While the percentage of children with fever in the 2 weeks before the survey for whom advice or treatment was sought from the public sector decreased between 2014 and 2016 (from 60% to 48%), the percentage of those for whom advice or treatment was sought in the private sector increased from 38% to 51% within the same period (Figure 4.1). Figure 4.1 Trends in care seeking for fever in children under age 5 77 Among children under age 5 with fever for whom advice or treatment was sought, percentage for whom advice or treatment was sought from specific source 2014 GDHS 2016 GMIS Patterns by background characteristics Advice or treatment for children with fever was sought for 75% of children age months and those age months, compared with 68% of children age months (Table 4.1). Any source Public sector Private sector 4 2 Other source The percentage of children with fever for whom advice or treatment was sought is higher in the urban areas than the rural areas (80% and 66%). The percentage of children with fever for whom advice or treatment was sought ranges from 85% in the Upper East region to 58% in the Western region. Advice or treatment for children with fever was higher among children whose mothers have secondary or higher education than among those whose mothers have less education. 4.2 DIAGNOSTIC TESTING OF CHILDREN WITH FEVER Diagnosis of malaria in children under age 5 with fever Percentage of children under age 5 with a fever in the 2 weeks before the survey who had blood taken from a finger or heel for testing. This is a proxy measure of diagnostic testing for malaria. Sample: Children under age 5 with a fever in the two weeks before the survey The NMCP policy recommends prompt parasitological confirmation by microscopy or, alternatively, rapid diagnostic tests (RDTs) for all patients suspected of malaria before treatment is started. Adherence to this policy cannot be directly measured through household surveys. However, the 2016 GMIS asked women with children under age 5 who had a fever in the 2 weeks before the survey if the child had blood taken from a finger or heel for testing during the illness. This information is used as a proxy measure for adherence to the NMCP policy of conducting diagnostic testing for all suspected malaria cases. In the 2016 GMIS, 30% of children with a fever in the 2 weeks before the survey had blood taken from a finger or heel, presumably for malaria testing (Table 4.1). 42 Malaria in Children
65 Trends: The percentage of children who had blood taken from a finger or heel for testing decreased from 34% in the 2014 GDHS to 30% in the 2016 GMIS. Patterns by background characteristics Thirty-five percent of children under age 5 with recent fever from urban areas had blood taken from a finger or heel for testing, compared with 27% in rural areas. Sixty-nine percent of children under age 5 with recent fever in the Upper East region had blood taken from a finger or heel for testing, compared with 21% in the Ashanti region (Figure 4.2). Figure 4.2 Diagnostic testing of children with fever by region Percent of children under age 5 with fever in the 2 weeks preceding the survey who had blood taken from a finger or heel for testing Western Central Greater Accra Volta Eastern Ashanti Brong Ahafo Northern Upper East Upper West Total USE OF RECOMMENDED ANTIMALARIALS Artemisinin-based combination therapy (ACT) for children under age 5 with fever Among children under age 5 with a fever in the 2 weeks before the survey who took any antimalarial drugs, the percentage who took an artemisinin-based combination therapy (ACT). Sample: Children under age 5 with a fever in the two weeks before the survey Artemisinin-based combination therapy (ACT) is the recommended first-line antimalarial drug for the treatment of uncomplicated malaria in Ghana. According to the results shown in Table 4.3, 59% of children under age 5 with recent fever who received an antimalarial took an ACT, either artemether + lumefantrine (AL) (37%), artesunate + amodiaquine (ASAQ) tablet (22%), or dihydroartemisinin piperaquine (less than 1%). Although monotherapy is not recommended for the treatment of uncomplicated malaria, 31% of children with fever who received an antimalarial took SP/Fansidar, 1% took chloroquine, 8% took quinine pills, and 1% received a quinine injection. 4.4 PREVALENCE OF LOW HAEMOGLOBIN IN CHILDREN Prevalence of low haemoglobin in children Percentage of children age 6-59 months who had a haemoglobin measurement of less than 8 grams per decilitre (g/dl) of blood. The cut-off of 8 g/dl is often used to classify malaria-related anaemia. Sample: Children age 6-59 months Anaemia, defined as a reduced level of haemoglobin in blood, decreases the amount of oxygen reaching the tissues and organs of the body and reduces their capacity to function. Anaemia is associated with impaired motor and cognitive development in children. The main causes of anaemia in children are malaria and inadequate intake of iron, folate, vitamin B12, or other nutrients. Other causes of anaemia include intestinal worms, haemoglobinopathy, and sickle cell disease. Although anaemia is not specific to malaria, trends in anaemia prevalence reflect malaria morbidity, and respond to changes in the coverage of malaria Malaria in Children 43
66 interventions (Korenromp 2004). Malaria interventions have been associated with a 60% reduction in the risk of anaemia using a cut-off of 8 g/dl (RBM 2003). During the 2016 GIMS, consent was obtained and testing for anaemia was conducted on almost all (99%) eligible children age 6-59 months from the interviewed households (Table 4.4). Table 4.5 shows the percentage of children age 6-59 months classified as having severe anaemia defined as a haemoglobin concentration of less than 8 g/dl. Overall, 7% of children age 6-59 months are severely anaemic. Patterns by background characteristics The prevalence of low haemoglobin in children age 6-59 months is more than twice as high in rural compared with urban areas (9% and 4%, respectively). The Central region has the highest percentage of children age 6-59 months with low haemoglobin (14%). The Northern region has the second highest (12%), and Greater Accra the lowest (1%) (Figure 4.3). The prevalence of low haemoglobin in children age 6-59 months decreases as mother s level of education increases, from 11% for mothers with no education to 2% for mothers with secondary or higher education Figure 4.3 Prevalence of low haemoglobin in children by region Percentage of children age 6-59 months with haemoglobin <8g/dl The prevalence of low haemoglobin in children age 6-59 months decreases with increasing wealth quintile, from 12% among children in the lowest and in the second lowest wealth quintile to 1% among children in the highest quintile (Figure 4.4). Figure 4.4 Low haemoglobin in children by household wealth Percentage of children age 6-59 months with haemoglobin lower than 8.0 g/dl Lowest Second Middle Fourth Highest Poorest Wealthiest 44 Malaria in Children
67 4.5 PREVALENCE OF MALARIA IN CHILDREN Malaria prevalence in children Percentage of children age 6-59 months classified as infected with malaria according to microscopy results. Sample: Children age 6-59 months Malaria is endemic in all regions of Ghana. Those living in areas of high malaria transmission acquire partial immunity to the disease over time (Doolan et al. 2009). However, many people, including children, may have malaria parasites in their blood without showing any signs of infection. Such asymptomatic infection not only contributes to further transmission of malaria, but also increases the risk of anaemia and other associated morbidity among the infected individuals. In the 2016 GMIS, 21% of children age 6-59 months were positive for malaria parasites according to microscopy results (Table 4.6). Rapid diagnostic tests (RDTs) were done in conjunction with microscopy to facilitate the treatment of infected children during the survey fieldwork. Results from these RDTs are also presented in Table 4.6 for reference. Twenty-eight percent of children age 6-59 months tested positive for malaria antigens with RDTs. The differences in malaria prevalence observed between the RDT and microscopy results are expected. Microscopic detection of malaria parasites depends on the visualisation of stained parasites under a microscope, whereas the diagnosis of malaria by RDT relies on the interaction between a parasite antigen present in the blood and an antibody in the RDT formulation. Therefore, direct comparisons of malaria results from microscopy with those from RDTs should be avoided. The First Response SD Bioline, like many other commercially available RDTs, detects the P. falciparum-specific, histidine-rich protein-2 (HRP-2) rather than the parasite itself. The HRP-2 remains in the blood for up to a month after parasite clearance with antimalarials (Moody 2002). In areas highly endemic for P. falciparum, its persistence often leads to higher malaria prevalence estimates detected with RDTs as compared with those measured with microscopy. Results presented in this section are based on the microscopy analysis of blood samples. Trends: National malaria prevalence has decreased between the 2014 GDHS and the 2016 GMIS, from 27% to 21% (Figure 4.5). Patterns by background characteristics By age, malaria prevalence is highest (25%) in children age months and lowest (16%) in children age months (Table 4.6). Malaria prevalence is more than twice as high in rural areas (28%) as in urban areas (11%). According to region, the Eastern and Central regions have the highest (31%) and the second highest (30%) malaria prevalence, followed by the Volta (28%) and Northern (25%) regions. Malaria prevalence is lowest (5%) in the Greater Accra region (Figure 4.6). Figure 4.5 Trends in malaria prevalence among children Percentage of children age 6-59 months who tested positive for malaria by microscopy GDHS 2016 GMIS Malaria in Children 45
68 Malaria prevalence decreases with an increase in mother s level of education, from 30% among children whose mothers have no formal education to 5% among those whose mothers have secondary or higher education. Figure 4.6 Prevalence of malaria in children by region Percentage of children age 6-59 months who tested positive for malaria by microscopy Malaria prevalence decreases with increase in wealth quintile, from 37% among children in the lowest wealth quintiles to 2% in the highest wealth quintile (Figure 4.7). Figure 4.7 Prevalence of malaria in children by household wealth Percentage of children age 6-59 months who tested positive for malaria by microscopy Lowest Second Middle Fourth Highest Poorest Wealthiest 46 Malaria in Children
69 LIST OF TABLES For detailed information on malaria, see the following tables: Table 4.1 Prevalence, diagnosis, and treatment of children with fever Table 4.2 Source of advice or treatment for children with fever Table 4.3 Types of antimalarial drugs used Table 4.4 Coverage of testing for anaemia and malaria in children Table 4.5 Haemoglobin <8.0 g/dl in children Table 4.6 Prevalence of malaria in children Malaria in Children 47
70 Table 4.1 Prevalence, diagnosis, and prompt treatment of children with fever Percentage of children under age 5 with fever in the 2 weeks before the survey; and among children under age 5 with fever, percentage for whom advice or treatment was sought, percentage for whom advice or treatment was sought the same or next day after the onset of fever, and percentage who had blood taken from a finger or heel for testing, according to background characteristics, Ghana MIS 2016 Background characteristic Children under age 5 Percentage with fever in the 2 weeks before the survey Number of children Percentage for whom advice or treatment was sought 1 Children under age 5 with fever Percentage for whom advice or treatment was sought the same or next day Percentage who had blood taken from a finger or heel for testing Number of children Age in months < Sex Male , Female , Residence Urban , Rural , Region Western Central Greater Accra Volta Eastern Ashanti Brong Ahafo Northern Upper East Upper West Mother s education No education Primary Middle/JSS/JHS , Secondary/SSS/SHS or higher Wealth quintile Lowest Second Middle Fourth Highest Total , Excludes advice or treatment from a traditional practitioner. 48 Malaria in Children
71 Table 4.2 Source of advice or treatment for children with fever Percentage of children under age 5 with fever in the 2 weeks before the survey for whom advice or treatment was sought from specific sources; and among children under age 5 with fever in the 2 weeks before the survey for whom advice or treatment was sought, the percentage for whom advice or treatment was sought from specific sources, by background characteristics, Ghana MIS 2016 Background characteristic Percentage for whom advice or treatment was sought from each source: Among children with fever Among children with fever for whom advice or treatment was sought Any public sector source Government hospital Government health centre Government health post/chps Mobile clinic Fieldworker/CHW Any private sector source Private hospital/clinic Pharmacy Chemist/Drug Store Private doctor Fieldworker/CHW Any other source Traditional practitioner Itinerant drug seller Other Number of children CHW = Community health worker. CHPS = Community-Based Health Planning and Services. Malaria in Children 49
72 Table 4.3 Type of antimalarial drugs used Among children under age 5 with fever in the 2 weeks preceding the survey who took any antimalarial medication, percentage who took specific antimalarial drugs, according to background characteristics, Ghana MIS 2016 Background characteristic Any ACT Artemether- Lumefantrine Dihydroartemisinin + piperaquine Artesunate + amodiaquine rectal/tablet Artesunate + amodiaquine injection/iv Percentage of children who took: Number of SP/Sulpha- doxine- Pyrimethaminer Chloroquine Artemisinin Quinine pills Quinine injection/iv Other antimalarial children with fever who took antimalarial drug Age in months < 6 * * * * * * * * * * * Sex Male Female Residence Urban Rural Mother s education No education Primary Middle/JSS/JHS Secondary/SSS/SHS or higher Wealth quintile Lowest Second Middle Fourth Highest (78.6) (64.4) (0.0) (14.2) (5.2) (16.2) (1.1) (0.0) (4.1) (0.0) (0.0) 80 Total Note: Figures in parentheses are based on unweighted cases. An asterisk indicates that a figure is based on fewer than 25 unweighted cases and has been suppressed. ACT = Artemisinin-based combination therapy 50 Malaria in Children
73 Table 4.4 Coverage of testing for anaemia and malaria in children Percentage of eligible children age 6-59 months who were tested for anaemia and for malaria, according to background characteristics (unweighted), Ghana MIS 2016 Percentage tested for: Background characteristic Anaemia Malaria with RDT Malaria with microscopy Number of eligible children Age in months Sex Male ,577 Female ,503 Mother s interview status Interviewed ,687 Not interviewed Residence Urban ,168 Rural ,912 Region Western Central Greater Accra Volta Eastern Ashanti Brong Ahafo Northern Upper East Upper West Mother s education 1 No education Primary Middle/JSS/JHS Secondary/SSS/SHS or higher Wealth quintile Lowest ,102 Second Middle Fourth Highest Total ,080 RDT = Rapid diagnostic test. 1 Excludes children whose mothers were not interviewed. Malaria in Children 51
74 Table 4.5 Haemoglobin <8.0 g/dl in children Percentage of children age 6-59 months with haemoglobin lower than 8.0 g/dl, according to background characteristics, Ghana MIS 2016 Background characteristic Haemoglobin <8.0 g/dl Number of children Age in months Sex Male 8.2 1,478 Female 5.5 1,396 Mother s interview status Interviewed 7.3 2,501 Not interviewed Residence Urban 4.1 1,276 Rural 9.1 1,598 Region Western Central Greater Accra Volta Eastern Ashanti Brong Ahafo Northern Upper East Upper West Mother s education 1 No education Primary Middle/JSS/JHS Secondary/SSS/SHS or higher Wealth quintile Lowest Second Middle Fourth Highest Total 6.9 2,874 Note: Table is based on children who stayed in the household the night before the interview. Haemoglobin levels are adjusted for altitude using CDC formulas (CDC 1998). Haemoglobin is measured in grams per decilitre (g/dl). 1 Excludes children whose mothers were not interviewed. 52 Malaria in Children
75 Table 4.6 Prevalence of malaria in children Percentage of children age 6-59 months classified as having malaria, according to RDT and microscopy, and according to background characteristics, Ghana MIS 2016 Background characteristic Malaria prevalence according to RDT Number of RDT positive children Malaria prevalence according to microscopy Microscopy positive Number of children Age in months Sex Male , ,478 Female , ,396 Mother s interview status Interviewed , ,501 Not interviewed Residence Urban , ,276 Rural , ,598 Region Western Central Greater Accra Volta Eastern Ashanti Brong Ahafo Northern Upper East Upper West Mother s education 1 No education Primary Middle/JSS/JHS Secondary/SSS/SHS or higher Wealth quintile Lowest Second Middle Fourth Highest Total , ,874 RDT = Rapid diagnostic test. 1 Excludes children whose mothers were not interviewed. Malaria in Children 53
76
77 MALARIA KNOWLEDGE AND MESSAGING 5 Key Findings Exposure to malaria messages: Forty-six percent of women reported having seen or heard general malaria messages. Television (38%), radio (33%), and a health worker (26%) are the most common sources of exposure to malaria messages. Thirty percent have heard or seen an advertisement in which people were asked to test first before taking malaria medicines. Twenty-eight percent have heard or seen an advertisement by Kwabena Kwabena, a musician, who recommends everyone should sleep under a treated net. Knowledge and awareness: Eighty-four percent of women age reported mosquito bites as the cause of malaria. Seventy-seven percent reported the use of a mosquito net as a malaria prevention method. Only 55% recognized fever as a symptom of malaria. Self-reported malaria episodes and care seeking: Thirty-four percent of women reported experiencing an episode of malaria in the 12 months before the survey. Among women who reported experiencing an episode of malaria in the 12 months before the survey, 85% sought advice or treatment. T his chapter assesses the extent to which malaria communication messages reach women age and the channels through which women receive such messages. The chapter also provides data on women s basic knowledge about causes, symptoms, treatment, and prevention of malaria. Using self-report of malaria episodes, the chapter presents malaria prevalence among women age over a 12-month period and care seeking behaviour. Malaria Knowledge and Messaging 55
78 5.1 EXPOSURE TO MALARIA MESSAGES Exposure to communication messages Percentage of women age who recall seeing or hearing a message about malaria through various sources in the past 6 months. Sample: Women age Exposure of the target population to communication messages is the primary outcome of behaviour change communication. Exposure is the critical first step in increasing knowledge of the malaria prevention methods, as well as attitudes and practices about malaria. The target populations ability to recall messages about malaria is an indicator of how widely malaria communications have penetrated the target audience. Women age were asked if they had seen or heard any messages about malaria in the 6 months before the survey. Those who had heard or seen malaria messages were asked to indicate the medium from which they saw or heard the messages. Forty-six percent reported that they saw or heard a message on malaria from the various media sources in the 6 months before the survey (Figure 5.1). Television (38%), radio (33%), and a health worker (26%) are the most common sources of exposure to malaria messages. In addition, 1 in 5 women age saw malaria messages on posters or billboards (Table 5.1). Figure 5.1 Reach of behaviour change communication messages Percentage of women age who saw or heard a message on malaria in the past 6 months Women age were asked if they had seen or heard certain specific messages about malaria in the 6 months before the survey. Forty-one percent indicated that they had seen or heard specific messages about malaria (Table 5.2) Sleep under an insecticide treated net (25%) and malaria kills (22%) are the most common malaria messages heard or seen from any source. Urban Rural Total Me a menya me net, Ntontom mpo suro 1 music video/song (35%) was the most common message heard or seen on radio or television. Thirty percent have heard or seen an advertisement in which people were asked to test first before taking malaria medicines and 28% have heard or seen an advertisement that recommends everyone should sleep under treated net by Kwabena, a musician. Twenty-eight percent of women age have seen or heard an advertisement on the use of ACTs or malaria medicines through various media sources (Table 5.3). Patterns by background characteristics Fifty-four percent of women in urban areas have been exposed to malaria messages from any source compared with 37% of women in rural areas (Table 5.1). A higher percentage of women in the Greater Accra (69%) and Upper East (68%) regions have been exposed to malaria messages compared with 21% in the Northern region (Figure 5.2). 1 I have gotten my net, even mosquito fears. 56 Malaria Knowledge and Messaging

79 Exposure to malaria messages increases with an increase in women s education, from 29% among women with no education to 61% among those with secondary or higher education. Figure 5.2 Reach of behaviour change communication messages by region Percentage of women age who saw or heard a message on malaria in the past 6 months Exposure to malaria messages increases with an increase in wealth quintile, from 30% among women in the lowest quintile to 64% among those in the highest quintile (Figure 5.3). Figure 5.3 Reach of behaviour change communication messages by household wealth Percentage of women age who saw or heard a message on malaria in the past 6 months Lowest Second Middle Fourth Highest Poorest Wealthiest 5.2 KNOWLEDGE AND AWARENESS Perceptions, beliefs, and attitudes about malaria causation, symptom identification, treatment, and prevention influence efforts to address malaria and are often overlooked in malaria control. Understanding who already knows about malaria, malaria prevention, and mosquito avoidance practices and who is at risk of malaria infection are necessary precursors to identifying and targeting vulnerable populations and ensuring the successful implementation and sustainability of malaria control efforts. The failure to consider knowledge, attitudes, and practices about malaria contributes to the inability of programs to achieve sustainable control. Eighty-four percent of women age reported mosquito bites as the cause of malaria, while 77% reported the use of a mosquito net as a malaria prevention method. Ninety-five percent of women age are aware that malaria can be treated, although only 55% recognized fever as a symptom of malaria (Figure 5.4). Malaria Knowledge and Messaging 57
80 Table 5.4 provides a composite indicator that measures the basic knowledge of malaria causes, symptoms, and prevention method. tbasic knowledge is defined as knowing that mosquito bite is a cause of malaria, fever is a sign or symptom of malaria, and sleeping under a mosquito net can protect against malaria. Overall, 41% of women age have basic knowledge of malaria causes, symptoms, and a prevention method. Patterns by background characteristics Figure 5.4 Knowledge of malaria causes, symptoms, and treatment 84 Reported mosquito bites as a cause of malaria Percentage of women age who know malaria causes, symptoms, and treatment 55 Recognize fever as a symptom of malaria 77 Reported mosquito nets as a malaria prevention method 95 Are aware that malaria can be treated The percentage of women with basic knowledge of malaria causes, symptoms, and a prevention method is lowest in the Western region (28%) and highest in the Northern region (50%) (Table 5.4). Women with secondary or higher education are more likely (47%) to have basic knowledge of malaria causes, symptoms, and a prevention method compared with women with lower or no education. 5.3 SELF-REPORT OF MALARIA EPISODES AND CARE SEEKING Early diagnosis and appropriate treatment are essential to reducing morbidity and mortality related to malaria. This is always influenced by treatment-seeking behaviour and is related to cultural beliefs about the cause and cure of illness. The choice of treatment source is found to be influenced by accessibility, disease type and severity, the patient s gender, and the parents educational level. Attitude toward providers is also an important factor. Patients are more likely to begin with self-treatment at home since this allows them to decrease the cost of treatment. To ensure an efficient malaria control program, it is necessary to evaluate the attitudes and practices of those living in at-risk areas. This will help to identify approaches for involving the full participation of the community in surveillance and control activities such as early, prompt treatment of confirmed cases. The strategic plan for malaria control in Ghana recommends that all suspected malaria cases are confirmed in accordance with the T3 initiative (Test, Treat, and Track). Thirty-four percent of women reported experiencing an episode of malaria in the 12 months before the survey. Among these women, 85% sought advice or treatment. However, only 54% of women who reported experiencing malaria provided a blood sample for malaria testing to confirm the diagnosis. Most (96%) of the women who reported experiencing an episode of malaria in the 12 months before the survey took an antimalarial drug. (Table 5.5 and Figure 5.5). 58 Malaria Knowledge and Messaging
81 Among women age who sought advice or treatment for malaria and took an antimalarial drug, 36% had not provided a blood sample for malaria testing to confirm the diagnosis (Figure 5.6). Figure 5.5 Self-reported episodes, diagnosis, and treatment of malaria Among women age having experienced malaria Fifty-six percent of women who reported experiencing recent malaria sought advice or treatment from the public sector. Government hospitals (29%) and government health centres (23%) are the main sources of advice or treatment seeking in the public sector. The private sector provides advice or treatment for 46% of women with malaria. Among women in urban 34 Percentage of women age who reported having experienced malaria in the 12 months preceding the survey areas, 56% sought advice or treatment from the private health sector, compared with 46% who sought advice or treatment from the public health sector. In the rural areas, however, 68% of women sought advice or treatment from the public health sector, compared with 33% from the private health sector (Table 5.6). 54 Percentage who provided a blood sample for malaria testing Percentage who sought advice or treatment for malaria Percentage who took any antimalarial According to the results shown in Table 5.7, 72% of women with recent malaria who took antimalarial medication took an ACT, either artesunate + amodiaquine (ASAQ), artemether + lumefantrine (AL) or Dihydroartemisinin piperaquine. Artemether + lumefantrine was the most commonly used ACT for treatment (44%). Figure 5.6 Malaria testing and treatment Percent distribution of women age who sought advice or treatment for malaria, and took an antimalarial drug Did not provide blood sample for malaria testing 36% Provided blood sample for malaria testing 64% Malaria Knowledge and Messaging 59
82 LIST OF TABLES For detailed information on malaria, see the following tables: Table 5.1 Exposure to messages on malaria by media source Table 5.2 Exposure to specific messages and information on malaria Table 5.3 Exposure to messages on malaria treatment by media source Table 5.4 Women s knowledge of malaria causes, symptoms, and treatment Table 5.5 Self-reported episodes, diagnosis, and treatment of malaria Table 5.6 Source of advice or treatment for malaria in the previous 12 months Table 5.7 Use of specific antimalarial drugs 60 Malaria Knowledge and Messaging
83 Table 5.1 Exposure to messages on malaria by media source Percentage of women age who, in past 6 weeks, saw or heard a message on malaria through various sources, according to background characteristics, Ghana MIS 2016 Background characteristic Radio Television Poster/ billboard Newspaper/ magazine Sources of exposure to malaria messages in the past 6 months Leaflets/ brochure Health worker Community health worker Volunteer/ CBA Word of mouth Community event Other 1 Percentage of women age who, in past 6 weeks, saw or heard a message on malaria Age Number of women Residence Urban ,768 Rural ,382 Region Western Central Greater Accra Volta Eastern Ashanti Brong Ahafo Northern Upper East Upper West Education No education Primary Middle/JSS/JHS ,010 Secondary/SSS/SHS or higher ,271 Wealth quintile Lowest Second Middle ,046 Fourth ,100 Highest ,213 Total ,150 CBA = Community based agents. 1 Other includes school and other. Malaria Knowledge And Messaging 61
84 Table 5.2 Exposure to specific messages and information on malaria Percentage of women age who heard or saw a specific message or information on malaria in the past 6 months, according to background characteristics, Ghana MIS 2016 Background characteristic If have fever go to health facility Percentage of women who, in the past 6 months, heard or saw the information: Sleep under an insecticide treated mosquito net Pregnant women should take drugs to prevent malaria SP protects pregnant women and unborn baby from getting malaria Always test before treating malaria Treat malaria with ACTs Malaria kills Percentage of women who saw or heard any of the 7 specific messages or information on malaria in past 6 months Percentage of women who, in the past 6 months, heard or saw on television or radio: Mea menya me net, Ntontom mpo suro music video/song Advert that recommended everyone should sleep under treated net by Kwabena (musician) Advert where people were asked to test first before taking malaria medicines Percentage of women who, in past 6 months, saw or heard any of the 3 specific messages or information on TV or radio Number of women Age Residence Urban ,768 Rural ,382 Region Western Central Greater Accra Volta Eastern Ashanti Brong Ahafo Northern Upper East Upper West Education No education Primary Middle/JSS/JHS ,010 Secondary/SSS/SHS or higher ,271 Wealth quintile Lowest Second Middle ,046 Fourth ,100 Highest ,213 Total ,150 ACT = Artemisinin-based combination therapy 62 Malaria Knowledge And Messaging
85 Table 5.3 Exposure to messages on malaria treatment by media source Percentage of women age who, in the past 6 months, have seen or heard an advertisement on the use of ACTs or malaria medicines by media sources, according to background characteristics, Ghana MIS 2016 Background characteristic Television Radio Sources of exposure to messages on the use of ACTs/malaria treatment medicines in the past 6 months Newspaper/ magazine Poster/ leaflets Billboard Other Percentage of women who, in past 6 months, saw or heard an advertisement on the use of ACTs or malaria medicines Number of women Age Residence Urban ,768 Rural ,382 Region Western Central Greater Accra Volta Eastern Ashanti Brong Ahafo Northern Upper East Upper West Education No education Primary Middle/JSS/JHS ,010 Secondary/SSS/SHS or higher ,271 Wealth quintile Lowest Second Middle ,046 Fourth ,100 Highest ,213 Total ,150 ACT = Artemisinin-based combination therapy Malaria Knowledge And Messaging 63
86 Table 5.4 Women's knowledge of malaria causes, symptoms, and treatment Percentage of women age who reported mosquito bites as the cause of malaria, percentage who can recognize fever as a sign or symptom of malaria, percentage who reported that sleeping under a mosquito net can protect against malaria, percentage with basic knowledge of malaria causes, symptoms, and prevention method, and percentage of women aware that malaria can be treated, according to background characteristics, Ghana MIS 2016 Background characteristic Percentage who reported mosquito bites as a cause of malaria Percentage who recognize fever as a sign or symptom of malaria Percentage who reported that sleeping under a mosquito net can protect against malaria Percentage of women with basic knowledge of malaria causes, symptoms, and prevention method 1 Percent of women respondents aware that malaria can be treated Number of women Age Residence Urban ,768 Rural ,382 Region Western Central Greater Accra Volta Eastern Ashanti Brong Ahafo Northern Upper East Upper West Education No education Primary Middle/JSS/JHS ,010 Secondary/SSS/SHS or Higher ,271 Wealth quintile Lowest Second Middle ,046 Fourth ,100 Highest ,213 Total ,150 1 Basic knowledge means stating that mosquito bites are a cause of malaria, fever is a sign or symptom of malaria, and sleeping under a mosquito net can protect against malaria. 64 Malaria Knowledge And Messaging
87 Table 5.5 Self-reported episodes, diagnosis, and treatment of malaria Percentage of women age who reported having experienced malaria in the 12 months before the survey, and among those who have experienced malaria, percentage who provided a blood sample for malaria testing to confirm the diagnosis, percentage who sought advice or treatment for malaria, and percentage who took any antimalarial, according to background characteristics, Ghana MIS 2016 Background characteristic Among all women Percentage that reported having experienced an episode of malaria in the 12 months before the survey Number of women Among those who reported experiencing malaria in the 12 months before the survey Percentage who provided a blood sample for malaria testing to confirm the diagnosis Percentage who sought advice or treatment Percentage who took any antimalarial 1 Number of women Age Residence Urban , Rural , Region Western Central Greater Accra Volta Eastern Ashanti Brong Ahafo Northern Upper East Upper West Education No education Primary Middle/JSS/JHS , Secondary/SSS/SHS or higher , Wealth quintile Lowest Second Middle , Fourth , Highest , Total , ,765 1 Antimalarials were either prescribed or taken without prescription. Malaria Knowledge And Messaging 65
88 Table 5.6 Source of advice or treatment for malaria in the previous 12 months Percentage of women age who reported having received advice or treatment for malaria in the 12 months before the survey, according to source of assistance, Ghana MIS 2016 Percentage of Residence Source women Urban Rural Total Public sector Government hospital Government health centre Government health post/chps Mobile clinic Fieldworker/CHW Private sector Private hospital/clinic Pharmacy Chemist/drug store Private doctor Fieldworker/CHW Number of women 1, ,507 CHW = Community health worker. 66 Malaria Knowledge And Messaging
89 Table 5.7 Use of specific antimalarial drugs Among women who, in the 12 months before the survey, experienced malaria and took antimalarial drugs, percentage who used specific types of antimalarial drugs, according to background characteristics, Ghana MIS 2016 Background characteristic Any ACT Artemetherlumefantrine SP/Fansidar Chloroquine Type of antimalarial drugs taken Dihydro- artemisinin- Piperaquine Quinine Artesunate Amodiaquine Artemisinin Herbal medicine Other antimalarial Number of women Age Residence Urban Rural Region Western Central Greater Accra Volta Eastern Ashanti Brong Ahafo Northern Upper East Upper West Education No education Primary Middle/JSS/JHS Secondary/SSS/SHS or Higher Wealth quintile Lowest Second Middle Fourth Highest Total ,697 Malaria Knowledge And Messaging 67
90
91 REFERENCES Doolan, D. L., C. Dobano, and J. K. Baird Acquired Immunity to Malaria. Clinical Microbiology Review 22: Korenromp, E. L., J. Armstrong-Schellenberg, B. Williams, B. Nahlen, R. W. Snow Impact of Malaria Control on Childhood Anemia in Africa A Quantitative Review. Tropical Medicine & International Health 9(10): Moody, A Rapid Diagnostic Tests for Malaria Parasites. Clinical Microbiology Review 15: National Malaria Control Programme (NMCP) Strategic Plan for Malaria Control in Ghana Accra, Ghana. Roll Back Malaria Partnership Monitoring and Evaluation Reference Group Anemia Task Force Meeting Minutes. Presented at WHO Headquarters. Geneva: October Shulman, C. E., and E. K. Dorman Importance and Prevention of Malaria in Pregnancy. Transactions of the Royal Society of Tropical Medicine and Hygiene 97: World Health Organization A Strategic Framework for Malaria Prevention and Control during Pregnancy in the African Region. Geneva: World Health Organization. World Health Organization. 2012a. Intermittent Preventive Treatment of Malaria in Pregnancy (IPTp) with Sulfadoxine-Pyrimethamine. (SP). Report presented in a meeting at WHO Headquarters, 9-11 July Geneva: World Health Organization. World Health Organization. 2012b. Intermittent Preventive Treatment of Malaria in Pregnancy Using Sulfadoxine-Pyrimethamine (IPTp-SP). Updated WHO Policy Recommendation (October 2012) by the Global Malaria Programme. Geneva: World Health Organization. References 69
92
93 SAMPLE DESIGN APPENDIX A A.1 INTRODUCTION T he 2016 Ghana Malaria Indicator Survey (GMIS 2016) was the first independent Malaria Indicator Survey conducted in Ghana. In 2008 and 2014, Ghana implemented DHS surveys that included the primary malaria indicators. The 2016 GMIS used a nationally representative sample of 200 clusters and about households. The survey was designed to provide information on key malaria control indicators such as the proportion of households with at least one long-lasting insecticidal net (LLIN); the proportion of children under age 5 who slept under a net the previous night and under a LLIN; the proportion of pregnant women who slept under an LLIN the previous night and the proportion of pregnant women who received intermittent preventive treatment (IPT) for malaria during their last pregnancy; and on the prevalence of anemia and malaria parasitemia among children under age 5. The survey was designed to provide estimates of key malaria indicators for the country as a whole, urban and rural areas separately, and each of the 10 administrative regions (Western, Central, Greater Accra, Volta, Eastern, Ashanti, Brong Ahafo, Northern, Upper East and Upper West). A.2 SAMPLE FRAME The sampling frame used for the 2016 GMIS is the frame of the Population and Housing Census (PHC) conducted in Ghana in 2010, provided by the Ghana Statistical Service (GSS), with updated information on identification of the 216 administrative districts defined after the census. The census frame is a complete list of all census enumeration areas (EAs) created for the PHC Ghana is administratively divided into ten geographical regions, with each region sub-divided into a number of districts. In total, there are 216 districts in Ghana. Table A.1 provides the population distribution by region and type of residence. The size of the regions in number of population varies greatly from 2.8% for the Upper West region, to 19.4% for the Ashanti region. The urbanization of the regions also varies greatly, with the Greater Accra region 90.5% urban, to the Upper West region, where the urban area represents only 16.3%. In Ghana, 50.9% of the population lives in urban areas. Table A.1 Distribution of residential population by region and type of residence Distribution of residential population in the sampling frame and the percentage that each region contributes to the total number of population and percentage of each region that is urban, Ghana MIS 2016 Number of residential population Region Urban Rural Total Percentage region contributes to the total number of population Percentage of region that is urban Western 1,007,969 1,368,052 2,376, Central 1,037,878 1,163,985 2,201, Greater Accra 3,630, ,099 4,010, Volta 713,735 1,404,517 2,118, Eastern 1,143,918 1,489,236 2,633, Ashanti 2,897,290 1,883,090 4,780, Brong Ahafo 1,028,473 1,282,510 2,310, Northern 750,712 1,728,749 2,479, Upper East 219, ,899 1,046, Upper West 114, , , Ghana 12,545,229 12,113,594 24,658, Source: The 2010 Ghana Population and Housing Census sampling frame provided by the Ghana Statistical Service (GSS). Appendix A 71
94 Table A.2 presents the household distribution by region and residence type. The household distribution is slightly different from the population distribution because the average urban household size is smaller than the average rural household size. In Ghana, 55.8% of the households live in urban areas. Table A.2 Distribution of residential households by region and type of residence Distribution of residential households in the sampling frame and the percentage that each region contributes to the total number of households and percentage of each region that is urban, Ghana MIS 2016 Number of residential households Region Urban Rural Total Percentage region contributes to the total number households Percentage of region that is urban Western 248, , , Central 255, , , Greater Accra 950,336 86,034 1,036, Volta 178, , , Eastern 293, , , Ashanti 715, ,743 1,126, Brong Ahafo 236, , , Northern 106, , , Upper East 41, , , Upper West 22,628 87, , Ghana 3,049,366 2,417,688 5,467, Source: The 2010 Ghana Population and Housing Census sampling frame provided by the Ghana Statistical Service (GSS). Table A.3 provides the distribution of EAs and their average size in number of households by region and type of residence. There are a total 37,675 EAs, with 16,503 in urban areas and 21,172 in rural areas. The average EA size is 145 households. The urban EAs have a slightly larger size, with an average of 185 households per EA, while the rural EAs are smaller with an average of 114 households per EA. The EA size is adequate for the primary sampling unit (PSU) with a sample take of 30 households per EA. Table A.3 Enumeration areas and households Distribution of enumeration areas (EAs) and the average number of households in a EA by region, according to residence, Ghana MIS 2016 Number of EAs Average EA size Region Urban Rural Total Urban Rural Total Western Central 1,350 1,885 3, Greater Accra 4, , Volta 964 2,646 3, Eastern 1,708 2,705 4, Ashanti 3,618 3,442 7, Brong Ahafo 1,425 2,246 3, Northern 998 2,873 3, Upper East 324 1,403 1, Upper West , Ghana 16,503 21,172 37, Source: The 2010 Ghana Population and Housing Census sampling frame provided by the Ghana Statistical Service (GSS). A.3 SAMPLE ALLOCATION AND SAMPLING PROCEDURES The sample for the 2016 GMIS was a stratified sample selected in two stages from the sampling frame. Stratification was achieved by separating each region into urban and rural areas. In total, 20 sampling strata were created. Samples were selected independently in each sampling stratum, by a two-stage selection. In the first stage, 200 EAs were selected with probability proportional to size (PPS) selection procedure according to the sample allocation given in Table A.4. The EA size is the number of residential 72 Appendix A
95 households in the EA censured in the 2010 PHC. Implicit stratification with proportional allocation was achieved at each of the lower administrative unit levels by sorting the EA frame before the sample selection according to the units, within each of the explicit stratum, and by using a probability proportional to size selection procedure. Table A.4 Sample allocation of clusters and households Number of clusters and households allocated by region according to residence, Ghana MIS 2016 Number of clusters allocated Number of households allocated Region Urban Rural Total Urban Rural Total Western Central Greater Accra Volta Eastern Ashanti Brong Ahafo Northern Upper East Upper West Ghana After the selection of EAs and before the main survey, a household listing operation was conducted in all of the selected EAs. The household listing operation consists of visiting each of the 200 selected EAs; drawing a location map and a detailed sketch map; and recording on the household listing forms all occupied residential households found in the EA with the address and the name of the head of the households. The resulting list of households served as sampling frame for the selection of households in the second stage. Some of the selected EAs are large. To reduce the workload during the household listing, large EAs were segmented by the listing team in the field before the household listing. Only one segment was selected for the survey with probability proportional to the segment size. Household listing was conducted only in the selected segment. Thus, a GMIS 2016 cluster is either an EA or a segment of an EA. In the second stage of selection, a fixed number of 30 households were selected in each cluster, by an equal probability systematic sampling based on the newly updated household listing. A spreadsheet that indicated the selected household numbers for each cluster was prepared. The survey interviewers were asked to interview only the pre-selected households. No replacements and no changes of the pre-selected households were allowed in the implementing stages in order to prevent bias. Table A.4 presents the sample allocation of EAs and households by region and type of residence. The sample allocation of EAs and households were converted to women and children under age 5 allocations by taking into account non-response and the average number of women and children under 5 per household. Table A.5 shows the sample allocation of expected number of women interviews and expected number of children under age 5 included in the survey. The sample allocation features a power allocation with a small adjustment because a proportional allocation would result in a very small sample size for the small regions such as the Upper East and Upper West regions. Appendix A 73
96 Table A.5 Sample allocation of expected number of women age and expected number of children under age 5 Sample allocation of number of women age expected to be interviewed and expected number of children under age 5 by region according to residence, Ghana MIS 2016 Number of women expected to be interviewed Expected number of children under age 5 Region Urban Rural Total Urban Rural Total Western Central Greater Accra Volta Eastern Ashanti Brong Ahafo Northern Upper East Upper West Ghana The parameters used in the sample calculation came from the previous DHS conducted in Ghana in 2014 (2014 GDHS). The 2014 GDHS showed that there were an average of 0.82 women per household and women s response rate was 97.3%. Household completion rate was 92.2%. On average, there were 0.5 children under 5 per household. A.4 SAMPLE PROBABILITIES AND SAMPLING WEIGHTS Due to the nonproportional allocation of the sample across districts and the differential response rates, sampling weights must be used in all analyses of the 2016 GMIS results to ensure that survey results are representative at the national and domain levels. Since the 2016 GMIS sample is a two-stage stratified cluster sample, sampling weights are based on sampling probabilities calculated separately for each sampling stage and for each cluster where: P 1hi : P 2hi : first-stage sampling probability of the i th cluster in stratum h second-stage sampling probability within the i th cluster (households) The following describes the calculation of these probabilities: Let a h be the number of clusters selected in stratum h, M hi the number of households according to the sampling frame in the i th cluster, and M hi the total number of households in the stratum. The probability of selecting the i th cluster in stratum h in the 2016 GMIS sample is calculated as follows: a h M M hi hi Let b hi be the proportion of households in the selected segment compared with the total number of households in cluster i in stratum h if the cluster is segmented, otherwise b 1. Then the probability of selecting cluster i in the sample is: P 1hi ah M = M hi hi b hi hi 74 Appendix A
97 Let let L hi be the number of households listed in the household listing operation in cluster i in stratum h, and g be the number of households selected in the cluster. The second stage s selection probability for hi each household in the cluster is calculated as follows: P 2 hi g L hi hi The overall selection probability of each household in cluster i of stratum h in the 2016 GMIS is therefore the product of the two stages selection probabilities: Phi P1 hi P2 hi The design weight for each household in cluster i of stratum h is the inverse of its overall selection probability: W 1/ hi P hi A spreadsheet with all the sampling parameters and selection probabilities was prepared to facilitate the calculation of the design weights. Design weights were adjusted for household non-response and individual non-response to obtain the sampling weights, for households and women, respectively. The differences of the household sampling weights and the women s individual sampling weights are introduced by individual non-response. The final sampling weights were normalized in order to achieve the total number of un-weighted cases equal to the total number of weighted cases at national level, for both household weights and the women s individual weights, respectively. The normalized weights are relative weights, which are valid for estimating means, proportions, and ratios, but are not valid for estimating population totals and pooled data. No weights were calculated for children under age 5. For the biomarker indicators for children under age 5, the household weight was applied. For the prevalence of fever and the treatment fever, the child s mother s weight was applied. Sampling errors were calculated for selected indicators for the national sample, the urban and rural areas separately, and each of the ten regions. A.5 SURVEY IMPLEMENTATION An examination of response rates for the 2016 GMIS indicates that the survey was successfully implemented. Table A.5 present interview completion rates for household and individual women in the 2016 GMIS by urban and rural areas, and region. The rates of completed household and women interviews are generally higher than expected and the average number of women per household slightly higher than in the 2014 GDHS. Appendix A 75
98 Percent distribution of households and eligible women by results of the household and individual interviews and household, eligible women and overall women response rates, according to urban-rural residence and region (unweighted), Ghana MIS 2016 Table A.6 Sample implementation Result Urban Rural Western Central Residence Region Greater Accra Volta Eastern Ashanti Brong Ahafo Northern Upper East Upper West Selected households Completed (C) Household present but no competent respondent at home (HP) Refused (R) Dwelling not found (DNF) Household absent (HA) Dwelling vacant/address not a dwelling (DV) Total Number of sampled households 2,912 3, ,003 Household response rate (HRR) Eligible women Completed (EWC) Not at home (EWNH) Refused (EWR) Incapacitated (EWI) Total Number of women 2,395 2, ,186 Eligible women response rate (EWRR) Overall women response rate (ORR) Using the number of households falling into specific response categories, the household response rate (HRR) is calculated as: 100 * C C + HP + P + R + DNF 2 The eligible women response rate (EWRR) is equivalent to the percentage of interviews completed (EWC). 3 The overall women response rate (OWRR) is calculated as: OWRR = HRR * EWRR/100. Total 76 Appendix A
99 ESTIMATES OF SAMPLING ERRORS APPENDIX B T he estimates from a sample survey are affected by two types of errors: (1) nonsampling errors and (2) sampling errors. Nonsampling errors result from mistakes made in implementing data collection and data processing, such as the failure to locate and interview the selected households, misunderstanding of the questions by interviewers or respondents, and data entry errors. Although numerous efforts were made during the implementation of the 2016 GMIS to minimize nonsampling errors, they are impossible to avoid and difficult to evaluate statistically. Sampling errors, on the other hand, can be evaluated statistically. The sample of respondents selected for the 2016 GMIS is one of many samples that could have been selected from the same population, with the same design and identical size. Each of these samples would yield results that differ somewhat from the results of the actual sample. Sampling error is a measure of the variability between all possible samples. The exact degree of variability is unknown, but can be estimated from the survey results. A sampling error is usually measured in terms of the standard error for a particular statistic (such as the mean or percentage), which is the square root of the variance. The standard error can be used to calculate confidence intervals within which the true value for the population can reasonably be assumed to fall. For example, for any given statistic calculated from a sample survey, the value of that statistic will fall within a range of plus or minus two times the standard error of that statistic in 95% of all possible samples of identical size and design. If the sample were selected as a simple random sample, it would have been possible to use straightforward formulas for calculating sampling errors. However, the 2016 GMIS sample is the result of a multi-stage, stratified design. Consequently, it was necessary to use more complex formulae. The computer software used to calculate sampling errors for the 2016 GMIS is a SAS program that used the Taylor linearization method for variance estimation for survey estimates that are means or proportions. The Taylor linearization method treats any percentage or average as a ratio estimate, r = y/x, where y represents the total sample value for variable y, and x represents the total number of cases in the group or subgroup under consideration. The variance of r is computed with the formula below, with the standard error being the square root of the variance: SE 2 ( r) var( r) 1 2 x H m h 2 m h 2 zh 1 f h zhi 1 mh 1 i 1 mh h in which z hi yhi rxhi, and zh yh rxh where h m h y hi x hi f h represents the stratum which varies from 1 to H is the total number of clusters selected in the h th stratum is the sum of the weighted values of variable y in the i th cluster in the h th stratum is the sum of the weighted number of cases in the i th cluster in the h th stratum is the sampling fraction of PSU in the h th stratum which is small and ignored Appendix B 77
100 In addition to the standard error, the program computes the design effect (DEFT) for each estimate, which is defined as the ratio between the standard error that uses the given sample design and the standard error that would result if a simple random sample had been used. A DEFT value of 1.0 indicates that the sample design is as efficient as a simple random sample. A value greater than 1.0 indicates that the increase in the sampling error is due to the use of a more complex, less statistically efficient design, such as multistage and cluster selection. The program also computes the relative standard error and the confidence limits for the estimates. Sampling errors for the 2016 GMIS are calculated for selected variables of primary interest for households, children under age 5, and pregnant women, respectively. The results are presented in this appendix for the country as a whole, urban and rural areas separately, and each of the ten regions. For each variable, the type of statistic (mean, proportion, or rate) and the base population are provided in Table B.1. Tables B.2 to B.14 present the value of the statistic (R), its standard error (SE), the number of unweighted (N-UNWE) and weighted (N-WEIG) cases, the design effect (DEFT), the relative standard error (SE/R), and the 95% confidence limits (R±2SE) for each variable. The DEFT is considered undefined when the standard error for the simple random sample is zero (when the estimate is close to 0 or 1). In the case of the total fertility rate, the number of unweighted cases is not relevant, since there is no known unweighted value for woman-years of exposure to childbearing. The confidence interval (as calculated for the average number of mosquito nets per household) can be interpreted as the overall average from the total sample at 1.66, with its standard error at Therefore, to obtain the 95% confidence limits, twice the standard error is added or subtracted to the sample estimate, i.e., 1.66± There is a high probability (95%) that the true average number of mosquito nets per household falls between 1.58 and For the total sample, the value of the design effect (DEFT), averaged over all variables, is This means that, due to multistage and clustering of the sample, the average standard error increases by a factor of above that in an equivalent simple random sample. 78 Appendix B
101 Table B.1 List of indicators for sampling errors, Ghana MIS 2016 Variable Type of Estimate Base Population HOUSEHOLDS Ownership of at least one mosquito net of any type Proportion All households Number of any mosquito nets Mean All households Ownership of at least one LLIN Proportion All households Number of LLIN Mean All households Ownership of at least one LLIN for two persons Proportion Households with at least one LLIN CHILDREN Slept under any mosquito net last night Proportion All children under age 5 Slept under an LLIN last night Proportion All children under age 5 Slept under an LLIN last night in household with at least one LLIN Proportion Children under age 5 in households with at least one LLIN Had fever in last 2 weeks Proportion All children under age 5 Had a haemoglobin level less than 8 g/dl Proportion Children under age 5 who were tested Has malaria (based on rapid test) Proportion Children under age 5 who were tested Has malaria (based on microscopy test) Proportion Children under age 5 who were tested PREGNANT WOMEN Slept under any mosquito net last night Proportion Pregnant women age Slept under an LLIN last night Proportion Pregnant women age Slept under an LLIN last night in household with at least one LLIN Proportion Pregnant women age in households with at least one LLIN Received one or more doses of SP/Fansidar during pregnancy of the most recent live birth Proportion Women age with a live birth in the 2 years preceding the survey Received 2 or more doses of SP/Fansidar during pregnancy of the most recent live birth Proportion Women age with a live birth in the 2 years preceding the survey Table B.2 Sampling errors: Total sample, Ghana MIS 2016 Variable Value (R) Standard error (SE) Number of cases Design Confidence limits Unweighted (N) Weighted (WN) effect (DEFT) Relative error (SE/R) R-2SE R+2SE HOUSEHOLDS Ownership of at least one mosquito net of any type ,841 5, Number of any mosquito nets ,841 5, Ownership of at least one LLIN ,841 5, Number of LLIN ,841 5, Ownership of at least one LLIN for two persons ,774 5, CHILDREN Slept under any mosquito net last night ,429 3, Slept under an LLIN last night ,429 3, Slept under an LLIN last night in household with at least one LLIN ,957 2, Had fever in last 2 weeks ,145 3, Had a haemoglobin level less than 8 g/dl ,047 2, Has malaria (based on rapid test) ,047 2, Has malaria (based on microscopy test) ,047 2, PREGNANT WOMEN Slept under any mosquito net last night Slept under an LLIN last night Slept under an LLIN last night in household with at least one LLIN Received one or more doses of SP/Fansidar during pregnancy of the most recent live birth ,291 1, Received 2 or more doses of SP/Fansidar during pregnancy of the most recent live birth ,291 1, Appendix B 79
102 Table B.3 Sampling errors: Urban sample, Ghana MIS 2016 Variable Value (R) Standard error (SE) Number of cases Design Confidence limits Unweighted (N) Weighted (WN) effect (DEFT) Relative error (SE/R) R-2SE R+2SE HOUSEHOLDS Ownership of at least one mosquito net of any type ,815 3, Number of any mosquito nets ,815 3, Ownership of at least one LLIN ,815 3, Number of LLIN ,815 3, Ownership of at least one LLIN for two persons ,772 3, CHILDREN Slept under any mosquito net last night ,309 1, Slept under an LLIN last night ,309 1, Slept under an LLIN last night in household with at least one LLIN ,026 1, Had fever in last 2 weeks ,209 1, Had a haemoglobin level less than 8 g/dl ,145 1, Has malaria (based on rapid test) ,145 1, Has malaria (based on microscopy test) ,145 1, PREGNANT WOMEN Slept under any mosquito net last night Slept under an LLIN last night Slept under an LLIN last night in household with at least one LLIN Received one or more doses of SP/Fansidar during pregnancy of the most recent live birth Received 2 or more doses of SP/Fansidar during pregnancy of the most recent live birth Table B.4 Sampling errors: Rural sample, Ghana MIS 2016 Variable Value (R) Standard error (SE) Number of cases Design Confidence limits Unweighted (N) Weighted (WN) effect (DEFT) Relative error (SE/R) R-2SE R+2SE HOUSEHOLDS Ownership of at least one mosquito net of any type ,026 2, Number of any mosquito nets ,026 2, Ownership of at least one LLIN ,026 2, Number of LLIN ,026 2, Ownership of at least one LLIN for two persons ,002 2, CHILDREN Slept under any mosquito net last night ,120 1, Slept under an LLIN last night ,120 1, Slept under an LLIN last night in household with at least one LLIN ,931 1, Had fever in last 2 weeks ,936 1, Had a haemoglobin level less than 8 g/dl ,902 1, Has malaria (based on rapid test) ,902 1, Has malaria (based on microscopy test) ,902 1, PREGNANT WOMEN Slept under any mosquito net last night Slept under an LLIN last night Slept under an LLIN last night in household with at least one LLIN Received one or more doses of SP/Fansidar during pregnancy of the most recent live birth Received 2 or more doses of SP/Fansidar during pregnancy of the most recent live birth Appendix B
103 Table B.5 Sampling errors: Western sample, Ghana MIS 2016 Variable Value (R) Standard error (SE) Number of cases Design Confidence limits Unweighted (N) Weighted (WN) effect (DEFT) Relative error (SE/R) R-2SE R+2SE HOUSEHOLDS Ownership of at least one mosquito net of any type Number of any mosquito nets Ownership of at least one LLIN Number of LLIN Ownership of at least one LLIN for two persons CHILDREN Slept under any mosquito net last night Slept under an LLIN last night Slept under an LLIN last night in household with at least one LLIN Had fever in last 2 weeks Had a haemoglobin level less than 8 g/dl Has malaria (based on rapid test) Has malaria (based on microscopy test) PREGNANT WOMEN Slept under any mosquito net last night Slept under an LLIN last night Slept under an LLIN last night in household with at least one LLIN Received one or more doses of SP/Fansidar during pregnancy of the most recent live birth Received 2 or more doses of SP/Fansidar during pregnancy of the most recent live birth Table B.6 Sampling errors: Central sample, Ghana MIS 2016 Variable Value (R) Standard error (SE) Number of cases Design Confidence limits Unweighted (N) Weighted (WN) effect (DEFT) Relative error (SE/R) R-2SE R+2SE HOUSEHOLDS Ownership of at least one mosquito net of any type Number of any mosquito nets Ownership of at least one LLIN Number of LLIN Ownership of at least one LLIN for two persons CHILDREN Slept under any mosquito net last night Slept under an LLIN last night Slept under an LLIN last night in household with at least one LLIN Had fever in last 2 weeks Had a haemoglobin level less than 8 g/dl Has malaria (based on rapid test) Has malaria (based on microscopy test) PREGNANT WOMEN Slept under any mosquito net last night Slept under an LLIN last night Slept under an LLIN last night in household with at least one LLIN Received one or more doses of SP/Fansidar during pregnancy of the most recent live birth Received 2 or more doses of SP/Fansidar during pregnancy of the most recent live birth Appendix B 81
104 Table B.7 Sampling errors: Greater Accra sample, Ghana MIS 2016 Variable Value (R) Standard error (SE) Number of cases Design Confidence limits Unweighted (N) Weighted (WN) effect (DEFT) Relative error (SE/R) R-2SE R+2SE HOUSEHOLDS Ownership of at least one mosquito net of any type , Number of any mosquito nets , Ownership of at least one LLIN , Number of LLIN , Ownership of at least one LLIN for two persons , CHILDREN Slept under any mosquito net last night Slept under an LLIN last night Slept under an LLIN last night in household with at least one LLIN Had fever in last 2 weeks Had a haemoglobin level less than 8 g/dl Has malaria (based on rapid test) Has malaria (based on microscopy test) PREGNANT WOMEN Slept under any mosquito net last night Slept under an LLIN last night Slept under an LLIN last night in household with at least one LLIN Received one or more doses of SP/Fansidar during pregnancy of the most recent live birth Received 2 or more doses of SP/Fansidar during pregnancy of the most recent live birth Table B.8 Sampling errors: Volta sample, Ghana MIS 2016 Variable Value (R) Standard error (SE) Number of cases Design Confidence limits Unweighted (N) Weighted (WN) effect (DEFT) Relative error (SE/R) R-2SE R+2SE HOUSEHOLDS Ownership of at least one mosquito net of any type Number of any mosquito nets Ownership of at least one LLIN Number of LLIN Ownership of at least one LLIN for two persons CHILDREN Slept under any mosquito net last night Slept under an LLIN last night Slept under an LLIN last night in household with at least one LLIN Had fever in last 2 weeks Had a haemoglobin level less than 8 g/dl Has malaria (based on rapid test) Has malaria (based on microscopy test) PREGNANT WOMEN Slept under any mosquito net last night Slept under an LLIN last night Slept under an LLIN last night in household with at least one LLIN Received one or more doses of SP/Fansidar during pregnancy of the most recent live birth Received 2 or more doses of SP/Fansidar during pregnancy of the most recent live birth Appendix B
105 Table B.9 Sampling errors: Eastern sample, Ghana MIS 2016 Variable Value (R) Standard error (SE) Number of cases Design Confidence limits Unweighted (N) Weighted (WN) effect (DEFT) Relative error (SE/R) R-2SE R+2SE HOUSEHOLDS Ownership of at least one mosquito net of any type Number of any mosquito nets Ownership of at least one LLIN Number of LLIN Ownership of at least one LLIN for two persons CHILDREN Slept under any mosquito net last night Slept under an LLIN last night Slept under an LLIN last night in household with at least one LLIN Had fever in last 2 weeks Had a haemoglobin level less than 8 g/dl Has malaria (based on rapid test) Has malaria (based on microscopy test) PREGNANT WOMEN Slept under any mosquito net last night Slept under an LLIN last night Slept under an LLIN last night in household with at least one LLIN Received one or more doses of SP/Fansidar during pregnancy of the most recent live birth Received 2 or more doses of SP/Fansidar during pregnancy of the most recent live birth Table B.10 Sampling errors: Ashanti sample, Ghana MIS 2016 Variable Value (R) Standard error (SE) Number of cases Design Confidence limits Unweighted (N) Weighted (WN) effect (DEFT) Relative error (SE/R) R-2SE R+2SE HOUSEHOLDS Ownership of at least one mosquito net of any type , Number of any mosquito nets , Ownership of at least one LLIN , Number of LLIN , Ownership of at least one LLIN for two persons , CHILDREN Slept under any mosquito net last night Slept under an LLIN last night Slept under an LLIN last night in household with at least one LLIN Had fever in last 2 weeks Had a haemoglobin level less than 8 g/dl Has malaria (based on rapid test) Has malaria (based on microscopy test) PREGNANT WOMEN Slept under any mosquito net last night Slept under an LLIN last night Slept under an LLIN last night in household with at least one LLIN Received one or more doses of SP/Fansidar during pregnancy of the most recent live birth Received 2 or more doses of SP/Fansidar during pregnancy of the most recent live birth Appendix B 83
106 Table B.11 Sampling errors: Brong Ahafo sample, Ghana MIS 2016 Variable Value (R) Standard error (SE) Number of cases Design Confidence limits Unweighted (N) Weighted (WN) effect (DEFT) Relative error (SE/R) R-2SE R+2SE HOUSEHOLDS Ownership of at least one mosquito net of any type Number of any mosquito nets Ownership of at least one LLIN Number of LLIN Ownership of at least one LLIN for two persons CHILDREN Slept under any mosquito net last night Slept under an LLIN last night Slept under an LLIN last night in household with at least one LLIN Had fever in last 2 weeks Had a haemoglobin level less than 8 g/dl Has malaria (based on rapid test) Has malaria (based on microscopy test) PREGNANT WOMEN Slept under any mosquito net last night Slept under an LLIN last night Slept under an LLIN last night in household with at least one LLIN Received one or more doses of SP/Fansidar during pregnancy of the most recent live birth Received 2 or more doses of SP/Fansidar during pregnancy of the most recent live birth Table B.12 Sampling errors: Northern sample, Ghana MIS 2016 Variable Value (R) Standard error (SE) Number of cases Design Confidence limits Unweighted (N) Weighted (WN) effect (DEFT) Relative error (SE/R) R-2SE R+2SE HOUSEHOLDS Ownership of at least one mosquito net of any type Number of any mosquito nets Ownership of at least one LLIN Number of LLIN Ownership of at least one LLIN for two persons CHILDREN Slept under any mosquito net last night Slept under an LLIN last night Slept under an LLIN last night in household with at least one LLIN Had fever in last 2 weeks Had a haemoglobin level less than 8 g/dl Has malaria (based on rapid test) Has malaria (based on microscopy test) PREGNANT WOMEN Slept under any mosquito net last night Slept under an LLIN last night Slept under an LLIN last night in household with at least one LLIN Received one or more doses of SP/Fansidar during pregnancy of the most recent live birth Received 2 or more doses of SP/Fansidar during pregnancy of the most recent live birth Appendix B
107 Table B.13 Sampling errors: Upper East sample, Ghana MIS 2016 Variable Value (R) Standard error (SE) Number of cases Design Confidence limits Unweighted (N) Weighted (WN) effect (DEFT) Relative error (SE/R) R-2SE R+2SE HOUSEHOLDS Ownership of at least one mosquito net of any type Number of any mosquito nets Ownership of at least one LLIN Number of LLIN Ownership of at least one LLIN for two persons CHILDREN Slept under any mosquito net last night Slept under an LLIN last night Slept under an LLIN last night in household with at least one LLIN Had fever in last 2 weeks Had a haemoglobin level less than 8 g/dl Has malaria (based on rapid test) Has malaria (based on microscopy test) PREGNANT WOMEN Slept under any mosquito net last night Slept under an LLIN last night Slept under an LLIN last night in household with at least one LLIN Received one or more doses of SP/Fansidar during pregnancy of the most recent live birth Received 2 or more doses of SP/Fansidar during pregnancy of the most recent live birth Table B.14 Sampling errors: Upper West sample, Ghana MIS 2016 Variable Value (R) Standard error (SE) Number of cases Design Confidence limits Unweighted (N) Weighted (WN) effect (DEFT) Relative error (SE/R) R-2SE R+2SE HOUSEHOLDS Ownership of at least one mosquito net of any type Number of any mosquito nets Ownership of at least one LLIN Number of LLIN Ownership of at least one LLIN for two persons CHILDREN Slept under any mosquito net last night Slept under an LLIN last night Slept under an LLIN last night in household with at least one LLIN Had fever in last 2 weeks Had a haemoglobin level less than 8 g/dl Has malaria (based on rapid test) Has malaria (based on microscopy test) PREGNANT WOMEN Slept under any mosquito net last night Slept under an LLIN last night Slept under an LLIN last night in household with at least one LLIN Received one or more doses of SP/Fansidar during pregnancy of the most recent live birth Received 2 or more doses of SP/Fansidar during pregnancy of the most recent live birth Appendix B 85
108
109 DATA QUALITY TABLES APPENDIX C Table C.1 Household age distribution Single-year age distribution of the de facto household population by sex (weighted), Ghana MIS 2016 Female Male Female Age Number Percent Number Percent Age Number Percent Number Percent Don t know/ missing Total 10, , Note: The de facto population includes all residents and non residents who stayed in the household the night before the interview. Male Appendix C 87
110 Table C.2 Age distribution of eligible and interviewed women De facto household population of women age 10-54, number and percent distribution of interviewed women age 15-49, and percentage of eligible women who were interviewed (weighted), by 5-year age groups, Ghana MIS 2016 Household Interviewed women age Age group population of women age Number Percentage Percentage of eligible women interviewed ,318 na na na na na na ,921 4, Note: The de facto population includes all residents and non residents who stayed in the household the night before the interview. Weights for both the household population of women and interviewed women are household weights. Age is based on the Household Questionnaire. na = Not applicable. 88 Appendix C
111 Table C.3 Completeness of reporting Percentage of observations missing information for selected demographic and health questions (weighted), Ghana MIS 2016 Subject Percentage with information missing Number of cases Month Only (Births in the 15 years before the survey) ,676 Month and Year (Births in the 15 years before the survey) ,676 Respondent s education (All women age 15-49) ,150 Anaemia (Living children age 6-59 months from the Household Questionnaire) ,935 1 Both year and age missing. Table C.4 Births by calendar years Number of births, percentage with complete birth date, sex ratio at birth, and calendar year ratio by calendar year, according to living (L), dead (D), and total (T) children (weighted), Ghana MIS 2016 Number of births Percentage with complete birth date 1 Sex ratio at birth 2 Calendar year ratio 3 Calendar year L D T L D T L D T L D T na na na na na na , , na na na na na na All 3, , na na na na = Not applicable. 1 Both year and month of birth given. 2 (Bm/Bf)x100, where Bm and Bf are the numbers of male and female births, respectively. 3 [2Bx/(Bx-1+Bx+1)]x100, where Bx is the number of births in calendar year x. Appendix C 89
112
113 PERSONS INVOLVED IN THE 2016 GMIS APPENDIX D 2016 GDHS SENIOR MANAGEMENT TEAM Baah Wadieh Anthony Amuzu Philomena Nyarko Abena Asamoebea Osei-Akoto Peter Takyi Peprah Godwin Odei Gyebi Emmanuel Boateng Robertson Adjei Gershon Togoh Lucy Twumwaa Afriyie Samilia Enyamah Mintah Nana Yaw Peprah Wahjib Mohammed Samuel Oppong Acting Government Statistician/Project Director (GSS) Deputy Government Statistician/Deputy Project Director (GSS) Former Government Statistician/Project Director (GSS) Director, Survey Organisation & Census Directorate (GSS) Project Coordinator & Head, Field Operations and Logistics Section (GSS) Trainer/Field Coordinator (GSS) Trainer/Field Coordinator (GSS) Trainer/Field Coordinator (GSS) Trainer/Field Coordinator (GSS) Trainer/Field Coordinator (GSS) Trainer/Field Coordinator (GSS) Trainer/Field Coordinator (NMCP) Trainer/Field Coordinator (NMCP) Trainer/Field Coordinator (NMCP) DATA PROCESSING AND SECONDARY EDITING Kwamena Arkafra Albert Riss Wilson LISTING EXERCISE Supervisors Alhaji Enum Ernest Afful Emmanuel Okpoti Mensah Timothy Bansah Francis Asante Agyekum Gabriel Opoku Nyarko Kwamena Mensah Mohammed Awal Alabira Jonathan Enchill John Gambo Listers Samuel Ansong Stella Maame Esi Arthur Samuel Sefa Owusu Sophia Arhinful Alex Bonney Eric Kunutsor Sheikh Borquaye Prosper Gameli Adzigbli Vida Acheampong Mark Amedzrator Robert Kabutey Samuel Asante Michael Agyinor Dennis Addo Shirley Yaa Brago Charity Frempong Onesimus Fearon Seth Ohene Okae Priscilla Cleyland Bernard Badu-Peprah Alex Ntim Charles Arthur Shirley Oduro Peprah Yussif Anass Vida Ayangba James Adema Dominic Dasoberi Abdallah Mogtar Alexander Kankpe Abdul-Samad B. Gbanha Appendix E 91
114 FIELD WORK Supervisors Orlando Ackumey George Osafo Frimpong Moses Ansah Comfort Ashitey Faustine Adzroe Samuel Adotevi Lawford B. Acheamfuor Anthony Appoh Bright Worlanyo Neku Emmanuel Baidoo Alhaji Salihu Enum Umuhera Braimah Interviewers Evelove Rashee Acquah Linda Atiayao James Christian Adu Francis Klah Judith Addo Karikari Gyimah George Nana Efua Acheampong Dominic Quansah Rita Acheampong Angelina Amerley Laryea Benedicta Allotey Caroline Anipah Esther Pearl Akoto Silvia Ovulley Hilary Kwesi Ketemepi James Bonsu Lydia Afful Forson Mary Nyarko Isaac Asamoah Anita Owusua Baffoe Yaw Boateng Felicity Kuwornu Kofi Kwakye-Kani Mary Osei John K. Dzah Bernice Peprah Rebecca Mensah Richard Buadu-Mensah Gilbert Yinbil Atibila Rukaya Mangotiba Richard Wilson Ohene Larbi Maame Gyesiwaa Sam Priscilla Ayamba Bukari Dimah Safia Suweba Jibrine Yvonne Atsutse Biomarkers Grace Amenu Francisca Andoh Mary Narkie Quaynor Richard Kutame Beatrice Nornyibey Eric Aborgah Nana Yaa Williams Dorothy Budu-Arthur Lawrencia Nsiah Akoto Darling Anita Eshun Patricia Yankey James Aninyinga Abdellah Yussif Ibn Yahaya MALARIA TESTING STAFF National Public Health Reference Laboratory (NPHRL) Dr. David Opare Director, Biomarker Field Monitoring and Supervision Esther Aryee Deputy Director, Laboratory Manager, Malaria and HIV Testing Gifty Boateng Laboratory Scientist Michael Amakye Laboratory Scientist, Biomarker Field Monitoring Supervisor/HIV Supervisor Rexford B. Adade Laboratory Scientist, Biomarker Field Monitoring Supervisor J. T. Addo Laboratory Scientist 92 Appendix E
115 EXTERNAL QUALITY ASSURANCE FOR MALARIA TESTING Noguchi Memorial Institute for Medical Research (NMIMR) Jacob Arthur-Quarm Chief Technologist, Virology Department Evelyn Bonney Research Fellow, Virology Department Anthony Amuzu Peter Takyi Peprah Emmanuel Boateng Francis Nyarkoh-Larbi Godwin Odei Gyebi Jeremiah Sixtus Dery Michael Beckoe Samuel Oppong Victor Owusu Boateng REPORT WRITING Ghana Statistical Service Ghana Statistical Service Ghana Statistical Service Ghana Statistical Service Ghana Statistical Service Ghana Statistical Service Ghana Statistical Service National Malaria Control Programme Ghana Statistical Service TECHNICAL SUPPORT: ICF INTERNATIONAL Gulnara Semenov Regional Coordinator Jean de Dieu Bizimana Survey Manager Claudia Marchena Data Processing Specialist Mercy Guech-Ongey Biomarker Specialist Ruilin Ren Sampling Specialist Lutwama Geofrey Data Processing Consultant Sam Nsobya Lubwama Biomarker Consultant Nancy Johnson Editor Diane Stoy Editor Joan Wardell Report Production Specialist Chris Gramer Report Production Specialist Sarah Balian Dissemination Specialist Trinadh Dontamsetti GIS Specialist Tom Fish GIS Specialist Cameron Taylor Technical Reviewer Appendix E 93
116
117 QUESTIONNAIRES APPENDIX E Appendix E 95
118
119 MINISTRY OF HEALTH 2016 GHANA MALARIA INDICATOR SURVEY HOUSEHOLD QUESTIONNAIRE IDENTIFICATION FORMATTING DATE: ENGLISH LANGUAGE: 29 Sep Sep GHANA STATISTICAL SERVICES LOCALITY NAME NAME OF HOUSEHOLD HEAD REGION DISTRICT CLUSTER NUMBER HOUSEHOLD NUMBER INTERVIEWER VISITS FINAL VISIT DATE INTERVIEWER'S NAME RESULT* DAY MONTH YEAR INT. NO. RESULT* NEXT VISIT: DATE TIME TOTAL NUMBER OF VISITS *RESULT CODES: TOTAL PERSONS IN HOUSEHOLD 1 COMPLETED 2 NO HOUSEHOLD MEMBER AT HOME OR NO COMPETENT RESPONDENT AT HOME AT TIME OF VISIT TOTAL ELIGIBLE 3 ENTIRE HOUSEHOLD ABSENT FOR EXTENDED PERIOD OF TIME WOMEN 4 POSTPONED 5 REFUSED 6 DWELLING VACANT OR ADDRESS NOT A DWELLING 7 DWELLING DESTROYED 8 DWELLING NOT FOUND 9 OTHER (SPECIFY) LINE NO. OF RESPONDENT TO HOUSEHOLD QUESTIONNAIRE 0 1 LANGUAGE OF LANGUAGE OF NATIVE LANGUAGE TRANSLATOR USED QUESTIONNAIRE** INTERVIEW** OF RESPONDENT** (YES = 1, NO = 2) ENGLISH LANGUAGE OF **LANGUAGE CODES: QUESTIONNAIRE** 01 ENGLISH 03 GA 06 OTHER 02 AKAN 04 EWE SUPERVISOR (SPECIFY) NAME NUMBER HH-1 Appendix E 97
120 THIS PAGE IS INTENTIONALLY BLANK 98 Appendix E HH-2
121 INTRODUCTION AND CONSENT Hello. My name is. I am working with Ghana Statistical Service and the Ministry of Health. We are conducting a survey about malaria all over Ghana. The information we collect will help the government to plan health services. Your household was selected for the survey. I would like to ask you some questions about your household. The questions usually take about 15 to 20 minutes. All of the answers you give will be confidential and will not be shared with anyone other than members of our survey team. You don't have to be in the survey, but we hope you will agree to answer the questions since your views are important. If I ask you any question you don't want to answer, just let me know and I will go on to the next question or you can stop the interview at any time. In case you need more information about the survey, you may contact the person listed on this card. GIVE CARD WITH CONTACT INFORMATION Do you have any questions? May I begin the interview now? SIGNATURE OF INTERVIEWER DATE RESPONDENT AGREES RESPONDENT DOES NOT AGREE TO BE INTERVIEWED.. 1 TO BE INTERVIEWED.. 2 END 100 RECORD THE TIME. HOURS MINUTES HH-3 Appendix E 99
122 HOUSEHOLD SCHEDULE IF AGE 0-6 YEARS LINE NO. USUAL RESIDENTS AND VISITORS RELATIONSHIP TO HEAD OF HOUSEHOLD SEX RESIDENCE AGE DATE OF BIRTH ELIGIBILITY A 8 9 Please give me the names of the persons who usually live in your household and guests of the household who stayed here last night, starting with the head of the household. What is the relationship of (NAME) to the head of the household? Is (NAME) male or female? Does (NAME) usually live here? Did (NAM E) stay here last night? How old is (NAME)? What is (NAME)'s date of birth? On what day, month, and year was (NAME) born? CIRCLE CIRCLE LINE LINE NUMBER NUMBER OF ALL OF ALL WOMEN CHILDREN AGE AGE AFTER LISTING THE NAMES AND RECORDING THE RELATIONSHIP AND SEX FOR EACH PERSON, ASK QUESTIONS 2A-2C TO BE SURE THAT THE LISTING IS COMPLETE. IF 95 IF DON'T KNOW DAY, RECORD '98'. THEN ASK APPROPRIATE OR MORE, IF DON'T KNOW MONTH, RECORD '98'. QUESTIONS IN COLUMNS SEE CODES RECORD IF DON'T KNOW YEAR, RECORD '9998.' 5-9 FOR EACH PERSON. BELOW. '95'. M F Y N Y N IN YEARS DAY MONTH YEAR A) Just to make sure that I have a complete listing: are there CODES FOR Q. 3: RELATIONSHIP TO HEAD OF HOUSEHOLD any other people such as small children or infants that we ADD TO YES NO have not listed? TABLE 01 = HEAD 07 = PARENT-IN-LAW 2B) Are there any other people who may not be members of 02 = WIFE OR HUSBAND 08 = BROTHER OR SISTER your family, such as domestic servants, lodgers, or friends ADD TO 03 = SON OR DAUGHTER 09 = OTHER RELATIVE YES NO who usually live here? TABLE 04 = SON-IN-LAW OR 10 = ADOPTED/FOSTER/ 2C) Are there any guests or temporary visitors staying here, or DAUGHTER-IN-LAW anyone else who stayed here last night, who have not been ADD TO 05 = GRANDCHILD 11 = NOT RELATED YES NO listed? TABLE 06 = PARENT 98 = DON'T KNOW 100 Appendix E HH-4
123 HOUSEHOLD SCHEDULE IF AGE 0-6 YEARS LINE NO. USUAL RESIDENTS AND VISITORS RELATIONSHIP TO HEAD OF HOUSEHOLD SEX RESIDENCE AGE DATE OF BIRTH ELIGIBILITY A 8 9 Please give me the names of the persons who usually live in your household and guests of the household who stayed here last night, starting with the head of the household. What is the relationship of (NAME) to the head of the household? Is (NAME) male or female? Does (NAME) usually live here? Did (NAM E) stay here last night? How old is (NAME)? What is (NAME)'s date of birth? On what day, month, and year was (NAME) born? CIRCLE CIRCLE LINE LINE NUMBER NUMBER OF ALL OF ALL WOMEN CHILDREN AGE AGE AFTER LISTING THE NAMES AND RECORDING THE RELATIONSHIP AND SEX FOR EACH PERSON, ASK QUESTIONS 2A-2C TO BE SURE THAT THE LISTING IS COMPLETE. IF 95 IF DON'T KNOW DAY, RECORD '98'. THEN ASK APPROPRIATE OR MORE, IF DON'T KNOW MONTH, RECORD '98'. QUESTIONS IN COLUMNS SEE CODES RECORD IF DON'T KNOW YEAR, RECORD '9998.' 5-9 FOR EACH PERSON. BELOW. '95'. M F Y N Y N IN YEARS DAY MONTH YEAR TICK HERE IF CONTINUATION SHEET USED CODES FOR Q. 3: RELATIONSHIP TO HEAD OF HOUSEHOLD 01 = HEAD 07 = PARENT-IN-LAW 02 = WIFE OR HUSBAND 08 = BROTHER OR SISTER 03 = SON OR DAUGHTER 09 = OTHER RELATIVE 04 = SON-IN-LAW OR 10 = ADOPTED/FOSTER/ STEPCHILD DAUGHTER-IN-LAW STEPCHILD 05 = GRANDCHILD 11 = NOT RELATED 06 = PARENT 98 = DON'T KNOW HH-5 Appendix E 101
124 HOUSEHOLD CHARACTERISTICS NO. QUESTIONS AND FILTERS CODING CATEGORIES SKIP 101 What is the main source of drinking water for members PIPED WATER of your household? PIPED INTO DWELLING PIPED TO YARD/PLOT PIPED TO NEIGHBOR PUBLIC TAP/STANDPIPE TUBE WELL OR BOREHOLE DUG WELL PROTECTED WELL UNPROTECTED WELL WATER FROM SPRING PROTECTED SPRING UNPROTECTED SPRING RAINWATER TANKER TRUCK CART WITH SMALL TANK SURFACE WATER (RIVER/DAM/ LAKE/POND/STREAM/CANAL/ IRRIGATION CHANNEL) BOTTLED WATER SACHET WATER OTHER (SPECIFY) 102 What is the main source of water used by your PIPED WATER household for other purposes such as cooking and PIPED INTO DWELLING handwashing? PIPED TO YARD/PLOT PIPED TO NEIGHBOR PUBLIC TAP/STANDPIPE TUBE WELL OR BOREHOLE DUG WELL PROTECTED WELL UNPROTECTED WELL WATER FROM SPRING PROTECTED SPRING UNPROTECTED SPRING RAINWATER TANKER TRUCK CART WITH SMALL TANK SURFACE WATER (RIVER/DAM/ LAKE/POND/STREAM/CANAL/ IRRIGATION CHANNEL) OTHER 96 (SPECIFY) 103 Where is that water source located? IN OWN DWELLING IN OWN YARD/PLOT ELSEWHERE How long does it take to go there, get water, and come back? MINUTES DON'T KNOW Appendix E HH-6
125 HOUSEHOLD CHARACTERISTICS NO. QUESTIONS AND FILTERS CODING CATEGORIES SKIP 105 What kind of toilet facility do members of your FLUSH OR POUR FLUSH TOILET household usually use? IF NOT POSSIBLE TO DETERMINE, ASK PERMISSION TO OBSERVE THE FACILITY. FLUSH TO PIPED SEWER SYSTEM FLUSH TO SEPTIC TANK FLUSH TO PIT LATRINE FLUSH TO SOMEWHERE ELSE FLUSH, DON'T KNOW WHERE PIT LATRINE VENTILATED IMPROVED PIT LATRINE PIT LATRINE WITH SLAB PIT LATRINE WITHOUT SLAB/OPEN PIT.. 23 COMPOSTING TOILET BUCKET TOILET HANGING TOILET/HANGING LATRINE NO FACILITY/BUSH/FIELD OTHER 96 (SPECIFY) 106 Do you share this toilet facility with other households? YES NO Including your own household, how many households NO. OF HOUSEHOLDS use this toilet facility? IF LESS THAN OR MORE HOUSEHOLDS DON'T KNOW What type of fuel does your household mainly use for ELECTRICITY cooking? LPG NATURAL GAS BIOGAS KEROSENE COAL, LIGNITE CHARCOAL WOOD STRAW/SHRUBS/GRASS AGRICULTURAL CROP RESIDUE ANIMAL DUNG NO FOOD COOKED IN HOUSEHOLD OTHER 96 (SPECIFY) 109 How many rooms in this household are used for sleeping? ROOMS Does this household own any livestock, herds, other YES farm animals, or poultry? NO How many of the following animals does this household own? IF NONE, RECORD '00'. IF 95 OR MORE, RECORD '95'. IF UNKNOWN, RECORD '98'. a) Milk cows or bulls? a) COWS/BULLS b) Other cattle? b) OTHER CATTLE c) Horses, donkeys, or mules? c) HORSES/DONKEYS/MULES..... d) Goats? d) GOATS e) Sheep? e) SHEEP f) Chickens or other poultry? f) CHICKENS/POULTRY g) Pigs? g) PIGS..... h) Rabbits? h) RABBITS i) Grasscutter? i) GRASSCUTTER HH-7 Appendix E 103
126 HOUSEHOLD CHARACTERISTICS NO. QUESTIONS AND FILTERS CODING CATEGORIES SKIP 112 Does any member of your household own any YES agricultural land? NO How many hectares or acres or plots of agricultural land do members of this household own? HECTARES ACRES IF 95 OR MORE HECTARES, CIRCLE '950' IF 95 OR MORE ACRES, RECORD IN HECTARES IF 95 OR MORE PLOTS, RECORD IN ACCRES PLOTS OR MORE HECTARES DON'T KNOW Does your household have: YES NO a) Electricity? a) ELECTRICITY b) A radio? b) RADIO c) A television? c) TELEVISION d) A non-mobile telephone? d) NON-MOBILE TELEPHONE e) A computer/tablet computer? e) COMPUTER f) A refrigerator? f) REFRIGERATOR g) A freezer g) FREEZER h) An electric generator/invertor? h) GENERATOR i) A washing machine? i) WASHING MACHINE j) A photo camera? (NOT ON PHONE) j) CAMERA k) A video deck/dvd/vcd? k) VIDEO/DVD/VCD l) A sewing machine? l) SEWING MACHINE m) A bed? m) BED n) A table? n) TABLE o) A chair o) CHAIR p) A Cabinet/cupboard? p) CABINET Does any member of this household own: YES NO a) A wrist watch? a) WRIST WATCH b) A mobile phone? b) MOBILE PHONE c) A bicycle? c) BICYCLE d) A motorcycle or motor scooter? d) MOTORCYCLE/SCOOTER e) An animal-drawn cart? e) ANIMAL-DRAWN CART f) A car or truck? f) CAR/TRUCK g) A boat with a motor? g) BOAT WITH MOTOR h) A boat without a motor? h) BOAT WITHOUT MOTOR Does any member of this household have a bank YES account? NO At any time in the past 12 months, has anyone come YES into your dwelling to spray the interior walls against NO mosquitoes? DON'T KNOW Who sprayed the dwelling? GOVERNMENT WORKER/PROGRAM A PRIVATE COMPANY B NONGOVERNMENTAL ORGANIZATION (NGO).. C OTHER DON'T KNOW X (SPECIFY) Z 119 Does your household have any mosquito nets? YES NO How many mosquito nets does your household have? IF 7 OR MORE NETS, RECORD '7'. NUMBER OF NETS Appendix E HH-8
127 MOSQUITO NETS NET #1 NET #2 NET #3 121 ASK THE RESPONDENT TO SHOW YOU ALL THE NETS IN THE HOUSEHOLD. IF MORE THAN 3 NETS, USE ADDITIONAL QUESTIONNAIRE(S). OBSERVED HANGING.. 1 OBSERVED HANGING.. 1 OBSERVED HANGING.. 1 OBSERVED NOT HANGING/ OBSERVED NOT HANGING/ OBSERVED NOT HANGING/ PACKAGED PACKAGED PACKAGED NOT OBSERVED NOT OBSERVED NOT OBSERVED How many months ago did MONTHS MONTHS MONTHS your household get the AGO..... AGO..... AGO..... mosquito net? MORE THAN 36 MORE THAN 36 MORE THAN 36 IF LESS THAN ONE MONTH MONTHS AGO MONTHS AGO MONTHS AGO AGO, RECORD '00'. NOT SURE NOT SURE NOT SURE OBSERVE OR ASK LONG-LASTING LONG-LASTING LONG-LASTING BRAND/TYPE OF MOSQUITO INSECTICIDE- INSECTICIDE- INSECTICIDE- NET. TREATED NET (LLIN) TREATED NET (LLIN) TREATED NET (LLIN) OLYSET OLYSET OLYSET IF BRAND IS UNKNOWN AND PERMANET PERMANET PERMANET YOU CANNOT OBSERVE INTERCEPTOR INTERCEPTOR INTERCEPTOR THE NET, SHOW PICTURES NETPROTEC NETPROTEC NETPROTEC OF TYPICAL NET DURANET DURANET DURANET TYPES/BRANDS TO LIFE NET LIFE NET LIFE NET RESPONDENT. DAWA PLUS DAWA PLUS DAWA PLUS MAGNET MAGNET MAGNET YORKOOL YORKOOL YORKOOL OTHER/DON'T KNOW OTHER/DON'T KNOW OTHER/DON'T KNOW BRAND BRAND BRAND (SKIP TO 126) (SKIP TO 126) (SKIP TO 126) OTHER TYPE OTHER TYPE OTHER TYPE DON'T KNOW TYPE.. 98 DON'T KNOW TYPE.. 98 DON'T KNOW TYPE Since you got the net, was it YES YES YES ever soaked or dipped in a NO NO NO liquid to kill or repel (SKIP TO 126) (SKIP TO 126) (SKIP TO 126) mosquitoes? NOT SURE NOT SURE NOT SURE How many months ago was MONTHS MONTHS MONTHS the net last soaked or dipped? AGO..... AGO..... AGO..... IF LESS THAN ONE MONTH AGO, RECORD '00'. MORE THAN 24 MORE THAN 24 MORE THAN 24 MONTHS AGO MONTHS AGO MONTHS AGO NOT SURE NOT SURE NOT SURE Did you get the net through the YES, YES, YES, mass distribution MASS DIST. MASS DIST. MASS DIST. campaign, during an antenatal CAMPAIGN CAMPAIGN CAMPAIGN care visit, or during an YES, ANC YES, ANC YES, ANC immunization visit? YES, IMMUNIZATION YES, IMMUNIZATION YES, IMMUNIZATION VISIT VISIT VISIT (SKIP TO 128) (SKIP TO 128) (SKIP TO 128) NO NO NO Where did you get the net? GOVERNMENT HEALTH GOVERNMENT HEALTH GOVERNMENT HEALTH FACILITY FACILITY FACILITY PRIVATE HEALTH PRIVATE HEALTH PRIVATE HEALTH FACILITY FACILITY FACILITY PHARMACY/ CHEMIST/ PHARMACY/ CHEMIST/ PHARMACY/ CHEMIST/ DRUG STORE DRUG STORE DRUG STORE SHOP/MARKET SHOP/MARKET SHOP/MARKET COMMUNITY HEALTH COMMUNITY HEALTH COMMUNITY HEALTH WORKER (CHW) WORKER (CHW) WORKER (CHW) RELIGIOUS RELIGIOUS RELIGIOUS INSTITUTION INSTITUTION INSTITUTION NGO NGO NGO COMMUNITY BASED.. COMMUNITY BASED.. COMMUNITY BASED.. AGENTS (CBAs) AGENTS (CBAs) AGENTS (CBAs) PETROL STATION/ PETROL STATION/ PETROL STATION/ MOBILE MART MOBILE MART MOBILE MART PRIMARY SCHOOLS.. 10 PRIMARY SCHOOLS.. 10 PRIMARY SCHOOLS.. 10 OTHER OTHER OTHER DON T KNOW DON T KNOW DON T KNOW HH-9 Appendix E 105
128 NET #1 MOSQUITO NETS NET #2 NET #3 128 Did anyone sleep under this YES YES YES mosquito net last night? NO NO NO (SKIP TO 130) (SKIP TO 130) (SKIP TO 130) NOT SURE NOT SURE NOT SURE Who slept under this mosquito net last night? RECORD THE PERSON'S NAME AND LINE NUMBER FROM HOUSEHOLD SCHEDULE. NAME NAME NAME LINE LINE LINE NO NO NO NAME NAME NAME LINE LINE LINE NO NO NO NAME NAME NAME LINE LINE LINE NO NO NO NAME NAME NAME LINE LINE LINE NO NO NO GO BACK TO 121 FOR NEXT NET; OR, IF NO MORE NETS, GO TO 131. GO BACK TO 121 FOR NEXT NET; OR, IF NO MORE NETS, GO TO 131. GO TO 121 IN FIRST COLUMN OF A NEW QUESTIONNAIRE; OR, IF NO MORE NETS, GO TO Appendix E HH-10
129 ADDITIONAL HOUSEHOLD CHARACTERISTICS NO. QUESTIONS AND FILTERS CODING CATEGORIES SKIP 131 OBSERVE MAIN MATERIAL OF THE FLOOR OF THE NATURAL FLOOR DWELLING. EARTH/SAND DUNG RECORD OBSERVATION. RUDIMENTARY FLOOR WOOD PLANKS PALM/BAMBOO FINISHED FLOOR PARQUET OR POLISHED WOOD VINYL OR ASPHALT STRIPS CERAMIC/MARBLE/PORCELAIN TILES/TERRAZO CEMENT WOOLEN CARPET/SYNTHETIC CARPET.. 35 LINOLEUM/RUBBER CARPET OTHER 96 (SPECIFY) 132 OBSERVE MAIN MATERIAL OF THE ROOF OF THE NATURAL ROOFING DWELLING. NO ROOF THATCH/PALM LEAF RECORD OBSERVATION. SOD RUDIMENTARY ROOFING RUSTIC MAT PALM/BAMBOO WOOD PLANKS CARDBOARD FINISHED ROOFING ZINC/ALUMINIUM WOOD CALAMINE/CEMENT FIBER CERAMIC/BRICK TILES CEMENT ROOFING SHINGLES ASBESTOS/SLATE ROOFING SHEETS.. 37 OTHER 96 (SPECIFY) 133 OBSERVE MAIN MATERIAL OF THE EXTERIOR NATURAL WALLS WALLS OF THE DWELLING. NO WALLS CANE/PALM/TRUNKS RECORD OBSERVATION. MUD/LANDCRETE RUDIMENTARY WALLS BAMBOO WITH MUD STONE WITH MUD UNCOVERED ADOBE PLYWOOD CARDBOARD REUSED WOOD FINISHED WALLS CEMENT STONE WITH LIME/CEMENT BRICKS CEMENT BLOCKS COVERED ADOBE WOOD PLANKS/SHINGLES OTHER 96 (SPECIFY) 134 RECORD THE TIME. HOURS MINUTES HH-11 Appendix E 107
130 INTERVIEWER'S OBSERVATIONS TO BE FILLED IN AFTER COMPLETING INTERVIEW COMMENTS ABOUT INTERVIEW: COMMENTS ON SPECIFIC QUESTIONS: ANY OTHER COMMENTS: SUPERVISOR'S OBSERVATIONS 108 Appendix E HH-12
131 MINISTRY OF HEALTH 2016 GHANA MALARIA INDICATOR SURVEY BIOMARKER QUESTIONNAIRE IDENTIFICATION FORMATTING DATE: ENGLISH LANGUAGE: 29 Sep Sep GHANA STATISTICAL SERVICES LOCALITY NAME NAME OF HOUSEHOLD HEAD CLUSTER NUMBER HOUSEHOLD NUMBER BIOMARKER TECHNICIAN VISITS FINAL VISIT DATE FIELDWORKER TECH'S NAME DAY MONTH YEAR NEXT VISIT: DATE NOTES: TIME TOTAL NUMBER OF VISITS TOTAL ELIGIBLE CHILDREN 0 1 LANGUAGE OF LANGUAGE OF NATIVE LANGUAGE TRANSLATOR QUESTIONNAIRE** INTERVIEW** OF RESPONDENT** (YES = 1, NO = 2) ENGLISH LANGUAGE OF **LANGUAGE CODES: QUESTIONNAIRE** 01 ENGLISH 03 GA 06 OTHER 02 AKAN 04 EWE SUPERVISOR (SPECIFY) NAME NUMBER BIO-1 Appendix E 109
132 110 Appendix E
133 Appendix E 111

134 112 Appendix E

135 Appendix E 113
136 114 Appendix E

137 Appendix E 115

138 116 Appendix E
SIERRA LEONE 2016 SIERRA LEONE
 SIERRA LEONE Malaria Indicator Survey (MIS) 2016 SIERRA LEONE Malaria Indicator Survey 2016 Final Report National Malaria Control Programme Statistics Sierra Leone College of Medicine and Allied Health
Nigeria. Malaria Indicator Survey Key Indicators
 Nigeria Malaria Indicator Survey 2015 Key Indicators The Federal Republic of Nigeria Nigeria Malaria Indicator Survey 2015 Key Indicators National Malaria Elimination Programme Federal Republic of Nigeria
Lesotho - Demographic and Health Survey 2014
 Microdata Library Lesotho - Demographic and Health Survey 2014 Lesotho Ministry of Health (MOH) - Government of Lesotho Report generated on: June 2, 2017 Visit our data catalog at: http://microdata.worldbank.org
Zimbabwe - Demographic and Health Survey 2015
 Microdata Library Zimbabwe - Demographic and Health Survey 2015 National Statistics Agency (ZIMSTAT) - Government of Zimbabwe Report generated on: June 19, 2017 Visit our data catalog at: http://microdata.worldbank.org
Namibia - Demographic and Health Survey 2013
 Microdata Library Namibia - Demographic and Health Survey 2013 Ministry of Health and Social Services (MoHSS) - Government of Namibia Report generated on: June 5, 2017 Visit our data catalog at: http://microdata.worldbank.org
Tajikistan - Demographic and Health Survey 2012
 Microdata Library Tajikistan - Demographic and Health Survey 2012 Statistical Agency - Republic of Tajikistan, Ministry of Health - Republic of Tajikistan Report generated on: June 8, 2017 Visit our data
Issue 6: January - June 2016 National Malaria Control Programme (NMCP) Box KB 493 Korle - Bu Accra Ghana
 Box KB 493 Korle - Bu Accra Ghana") Issue 6: January - June 2016 National Malaria Control Programme (NMCP) Box KB 493 Korle - Bu Accra Ghana Contents Page Editorial and Report Highlights Page 1 Malaria Burden Page 2 Key Activities undertaken
Issue 6: January - June 2016 National Malaria Control Programme (NMCP) Box KB 493 Korle - Bu Accra Ghana Contents Page Editorial and Report Highlights Page 1 Malaria Burden Page 2 Key Activities undertaken
Issue 9: January March, 2017 National Malaria Control Programme (NMCP) Box KB 493 Korle - Bu Accra Ghana
 Box KB 493 Korle - Bu Accra Ghana") Issue 9: January March, 2017 National Malaria Control Programme (NMCP) Box KB 493 Korle - Bu Accra Ghana Contents Page Editorial and Report Highlights 1 Malaria Burden 2 Key activities undertaken in First
Issue 9: January March, 2017 National Malaria Control Programme (NMCP) Box KB 493 Korle - Bu Accra Ghana Contents Page Editorial and Report Highlights 1 Malaria Burden 2 Key activities undertaken in First
Zimbabwe. Demographic and Health Survey Key Indicators
 Zimbabwe Demographic and Health Survey 2015 Key Indicators GOVERNMENT OF ZIMBABWE Zimbabwe Demographic and Health Survey 2015 Key Indicators Zimbabwe National Statistics Agency Harare, Zimbabwe The DHS
MALARIA INDICATOR SURVEY MODEL BIOMARKER QUESTIONNAIRE IDENTIFICATION (1) CLUSTER NUMBER... HOUSEHOLD NUMBER... FIELDWORKER VISITS FIELDWORKER'S NAME
 CLUSTER NUMBER... HOUSEHOLD NUMBER... FIELDWORKER VISITS FIELDWORKER'S NAME") [NAME OF COUNTRY] [NAME OF ORGANIZATION] MALARIA INDICATOR SURVEY MODEL BIOMARKER QUESTIONNAIRE FORMATTING DATE: ENGLISH LANGUAGE: 14 Mar 2016 23 Oct 2014 IDENTIFICATION (1) PLACE NAME NAME OF HOUSEHOLD
[NAME OF COUNTRY] [NAME OF ORGANIZATION] MALARIA INDICATOR SURVEY MODEL BIOMARKER QUESTIONNAIRE FORMATTING DATE: ENGLISH LANGUAGE: 14 Mar 2016 23 Oct 2014 IDENTIFICATION (1) PLACE NAME NAME OF HOUSEHOLD
PMA2014/UGANDA-R1 SOI SNAPSHOT OF INDICATORS
 PMA2014/UGANDA-R1 SOI SNAPSHOT OF INDICATORS Summary of the sample design for PMA2014/Uganda-R1: PMA2014/Uganda, the first round of data collection in Uganda, used a two- stage cluster design with urban/rural
CHAPTER 1 INTRODUCTION
 CHAPTER 1 INTRODUCTION 1.1 Background Demographic surveys are the primary source of data used in monitoring the progress and evaluating the impact of the population program of the country. The Philippine
Zambia - Demographic and Health Survey
 Microdata Library Zambia - Demographic and Health Survey 2013-2014 Central Statistical Office (CSO) - Government of Zambia, Ministry of Health - Government of Zambia Report generated on: June 16, 2017
5.1. KNOWLEDGE OF CONTRACEPTIVE METHODS
 CHAPTER 5. FAMILY PLANNING This chapter presents results from the 2007 RMIDHS regarding aspects of contraceptive use, knowledge, attitudes, and behavior. Although the focus is on women, some results from
Issue 8: January December 2016 National Malaria Control Programme (NMCP) Box KB 493 Korle - Bu Accra Ghana
 Box KB 493 Korle - Bu Accra Ghana") Issue 8: January December National Malaria Control Programme (NMCP) Box KB 493 Korle - Bu Accra Ghana Contents Page Editorial and Report Highlights 1 Malaria Burden 2 Key Activities Undertaken in 2 Malaria
Issue 8: January December National Malaria Control Programme (NMCP) Box KB 493 Korle - Bu Accra Ghana Contents Page Editorial and Report Highlights 1 Malaria Burden 2 Key Activities Undertaken in 2 Malaria
The DHS Program Demographic and Health Surveys. Collecting Data on Malaria in Household Surveys
 The DHS Program Demographic and Health Surveys Collecting Data on Malaria in Household Surveys Measurement Tools Demographic and Health Survey (DHS) nationally representative, population-based surveys
NIGERIA DEMOGRAPHIC AND HEALTH SURVEY. National Population Commission Federal Republic of Nigeria Abuja, Nigeria
 NIGERIA DEMOGRAPHIC AND HEALTH SURVEY 2013 National Population Commission Federal Republic of Nigeria Abuja, Nigeria ICF International Rockville, Maryland, USA June 2014 USAID FROM THE AMERICAN PEOPLE
Tanzania s Progress in Combating Malaria: Achievement and Challenges
 Tanzania s Progress in Combating Malaria: Achievement and Challenges DR RENATA A MANDIKE DEPUTY PROGRAMME MANAGER NATIONAL MALARIA CONTROL PROGRAMME, MINISTRY OF HEALTH, COMMUNITY DEVELOPMENT, GENDER,
Key Indicators Report Jordan Population and Family Health Survey (JPFHS)
") Key Indicators Report 2017-18 Jordan Population and Family Health Survey (JPFHS) The 2017-18 Jordan Population and Family Health Survey (2017-18 JPFHS) was implemented by the Department of Statistics (DOS)
Key Indicators Report 2017-18 Jordan Population and Family Health Survey (JPFHS) The 2017-18 Jordan Population and Family Health Survey (2017-18 JPFHS) was implemented by the Department of Statistics (DOS)
Key Results Liberia Demographic and Health Survey
 Key Results 2013 Liberia Demographic and Health Survey The 2013 Liberia Demographic and Health Survey (LDHS) was implemented by the Liberia Institute of Statistics and Geo-Information Services (LISGIS)
Nepal - Barriers to Family Planning Use in Eastern Nepal: Results from a Mixed Methods Study 2016
 Microdata Library Nepal - Barriers to Family Planning Use in Eastern Nepal: Results from a Mixed Methods Study 2016 Ministry of Health (MOH) - Government of Nepal Report generated on: May 23, 2018 Visit
PURPOSE The purpose of the Malaria Control Strategic Plan 2005/ /10 is to provide a common platform and detailed description of interventions
 PURPOSE The purpose of the Malaria Control Strategic Plan 2005/06-2009/10 is to provide a common platform and detailed description of interventions for all RBM partners and sectors of society. It encourages
Nigeria - Demographic and Health Survey 2013
 Microdata Library Nigeria - Demographic and Health Survey 2013 National Population Commission (NPC) - Government of Nigeria Report generated on: June 5, 2017 Visit our data catalog at: http://microdata.worldbank.org
Ending Malaria in Nigeria: The WHO Agenda
 Nigeria Institute of Medical Research 2016 World Malaria Day Lecture 27 April, 2016 Ending Malaria in Nigeria: The WHO Agenda Dr Tolu Arowolo Malaria Containment Programme, WHO, Nigeria arowolot@who.int
IMCI Health Facility Survey
 IMCI Health Facility Survey Sudan March - April 23 World Health Organization Regional Office for the Eastern Mediterranean Federal Ministry of Health Republic of Sudan OBJECTIVES 1 To assess the quality
WHO Consultation on universal access to core malaria interventions in high burden countries: main conclusions and recommendations
 WHO Consultation on universal access to core malaria interventions in high burden countries: main conclusions and recommendations 12-15 February 2018 Salle XI, ILO Building, Geneva, Switzerland Country
India - National Family Health Survey
 Microdata Library India - National Family Health Survey 2005-2006 International Institute for Population Sciences (IIPS) - Ministry of Health and Family Welfare (MOHFW) Report generated on: June 16, 2017
Tajikistan Demographic and Health Survey Atlas of Key Indicators
 Tajikistan 2017 Demographic and Health Survey Atlas of Key Indicators This report summarises the regional findings of the (TjDHS) conducted by the Statistical Agency under the President of the Republic
Implementing the Abuja Declaration and Plan of Action: the journey so far
 Implementing the Abuja Declaration and Plan of Action: the journey so far The Abuja Declaration African leaders who met on 25 April 2000 in Abuja, Nigeria, laid out the foundation for a sustained battle
Indonesia Young Adult Reproductive Health Survey
 Indonesia Young Adult Reproductive Health Survey 2002 2003 Indonesia Young Adult Reproductive Health Survey 2002-2003 Badan Pusat Statistik (BPS-Statistics Indonesia) Jakarta, Indonesia National Family
Ethiopia Atlas of Key Demographic. and Health Indicators
 Ethiopia Atlas of Key Demographic and Health Indicators 2005 Ethiopia Atlas of Key Demographic and Health Indicators, 2005 Macro International Inc. Calverton, Maryland, USA September 2008 ETHIOPIANS AND
26/06/ NIMR 2018 Conference - Malaria - a reality
 Malaria Elimination: Reality or Myth? Wellington A. Oyibo ANDI CENTRE OF EXCELLENCE FOR MALARIA DIAGNOSIS WHO/FIND Malaria Specimen Collection Site The International Center for Malaria Microscopy and Malaria
A Data Use Guide ESTIMATING THE UNIT COSTS OF HIV PREVENTION OF MOTHER-TO-CHILD TRANSMISSION SERVICES IN GHANA. May 2013
 May 2013 ESTIMATING THE UNIT COSTS OF HIV PREVENTION OF MOTHER-TO-CHILD TRANSMISSION SERVICES IN GHANA A Data Use Guide This publication was prepared by Andrew Koleros of the Health Policy Project. HEALTH
Indonesia Demographic and Health Survey 2017: Adolescent Reproductive Health
 Indonesia Demographic and Health Survey 2017: Adolescent Reproductive Health Key Indicators Report National Population and Family Planning Board Jakarta, Indonesia Statistics Indonesia Jakarta, Indonesia
Zimbabwe Demographic and Health Survey Key Findings
 Zimbabwe 2010-11 Demographic and Health Survey Key Findings This report summarises the findings of the (), which was implemented by the Zimbabwe National Statistics Agency (ZIMSTAT). The funding for the
India - National Family Health Survey
 Microdata Library India - National Family Health Survey 1998-1999 International Institute for Population Sciences (IIPS) - Ministry of Health and Family Welfare (MOHFW) Report generated on: June 16, 2017
Ethnicity and Maternal Health Care Utilization in Nigeria: the Role of Diversity and Homogeneity
 Ethnicity and Maternal Health Care Utilization in Nigeria: the Role of Diversity and Homogeneity In spite of the significant improvements in the health of women worldwide, maternal mortality ratio has
FACT SHEET DELHI. District Level Household and DLHS - 3. International institute for population sciences (Deemed University) Mumbai
 Mumbai") 2007-2008 DLHS - 3 Ministry of Health and Family Welfare District Level Household and Facility survey FACT SHEET DELHI International institute for population sciences (Deemed University) Mumbai Introduction
2007-2008 DLHS - 3 Ministry of Health and Family Welfare District Level Household and Facility survey FACT SHEET DELHI International institute for population sciences (Deemed University) Mumbai Introduction
Countdown to 2015: tracking progress, fostering accountability
 Countdown to 2015: tracking progress, fostering accountability Countdown to 2015 is a global movement to track, stimulate and support country progress towards achieving the health-related Millennium Development
Public Attitudes and Knowledge about HIV/AIDS in Georgia Kaiser Family Foundation
 Public Attitudes and Knowledge about HIV/AIDS in Georgia Kaiser Family Foundation Chart Pack November 2015 Methodology Public Attitudes and Knowledge about HIV/AIDS in Georgia is a representative, statewide
Evaluation of integrated community case management for malaria, pneumonia, diarrhoea and newborn health in eight districts of central Uganda
 BASELINE SURVEY REPORT ICCM Central Project Evaluation of integrated community case management for malaria, pneumonia, diarrhoea and newborn health in eight districts of central Uganda June 2011 Version
Ghana: Market Segmentation Analysis
 Ghana: Market Segmentation Analysis APRIL 2011 This publication was produced for review by the U.S. Agency for International Development. It was prepared by the USAID DELIVER PROJECT, Task Order 1. Ghana:
/ / 002. District name:
 FOR USE WITH KEY INFORMANTS. Please fill the information below before beginning the interview. Please write clearly, in ink: 001. Date (dd/mm/yyyy): / / 002. District name: 003. District population, in
Malaria Control in Togo
 Malaria Control in Togo Introduction * Dr Kodjo Morgah In Collaboration with Dr Koubagnine Takpa (Director, EPI) Dr Jérome Agbekou (DPC/WHO/Togo) Dr Stephan Tohon (ICP/MAL/WA) Dr Jean Pierre E. Batchassi
FACT SHEET SIKKIM. District Level Household and DLHS - 3. International institute for population sciences (Deemed University) Mumbai
 Mumbai") 2007-2008 DLHS - 3 Ministry of Health and Family Welfare District Level Household and Facility survey FACT SHEET SIKKIM International institute for population sciences (Deemed University) Mumbai Introduction
2007-2008 DLHS - 3 Ministry of Health and Family Welfare District Level Household and Facility survey FACT SHEET SIKKIM International institute for population sciences (Deemed University) Mumbai Introduction
CHARACTERISTICS OF SURVEY RESPONDENTS 3
 CHARACTERISTICS OF SURVEY RESPONDENTS 3 The health, nutrition, and demographic behaviours of women and men vary by their own characteristics, such as age, marital status, religion, and caste, as well as
Annex A: Impact, Outcome and Coverage Indicators (including Glossary of Terms)
") IMPACT INDICATORS (INDICATORS PER GOAL) HIV/AIDS TUBERCULOSIS MALARIA Reduced HIV prevalence among sexually active population Reduced HIV prevalence in specific groups (sex workers, clients of sex workers,
IMPACT INDICATORS (INDICATORS PER GOAL) HIV/AIDS TUBERCULOSIS MALARIA Reduced HIV prevalence among sexually active population Reduced HIV prevalence in specific groups (sex workers, clients of sex workers,
DHS WORKING PAPERS. Global Trends in Care Seeking and Access to Diagnosis and Treatment of Childhood Illnesses DEMOGRAPHIC AND HEALTH SURVEYS
 DHS WORKING PAPERS Global Trends in Care Seeking and Access to Diagnosis and Treatment of Childhood Illnesses Adam Bennett Thom Eisele Joseph Keating Josh Yukich 2015 No. 116 March 2015 This document was
Interpretation of the World Malaria Report Country Profile
 Interpretation of the World Malaria Report Country Profile Acknowledgements This presentation was developed to help explain the components of the World Malaria Report Country Profile. The 2017 World Malaria
Author: Gbemisola Allwell-Brown Supervisors: Andreas Mårtensson & Carina Källestål Word count: 13,359
 Individual and Household-level Determinants of Malaria Infection in under-5 children from Northwest and Southern Nigeria: a cross-sectional comparative study based on the 2015 Nigeria Malaria Indicator
COUNTRY PROFILE: INDIA INDIA COMMUNITY HEALTH PROGRAMS NOVEMBER 2013
 COUNTRY PROFILE: INDIA NOVEMBER 2013 Advancing Partners & Communities Advancing Partners & Communities (APC) is a five-year cooperative agreement funded by the U.S. Agency for International Development
EPIDEMIOLOGICAL SURVEILLANCE REPORT Malaria in Greece, 2017, up to 17/08/2017
 Page 1 EPIDEMIOLOGICAL SURVEILLANCE REPORT Malaria in Greece, 2017, up to 17/08/2017 Introduction Greece was declared free from malaria in 1974, following an intense control program (1946-1960). Since
Antibiotic Resistance Knowledge Survey Results: Comparison of the 1999 and 2000 Surveys October 2000
 Antibiotic Resistance Knowledge Survey Results: Comparison of the 1999 and 2000 Surveys October 2000 North Dakota State Data Center North Dakota State University IACC 424 - P.O. Box 5636 Fargo, North Dakota
Zambia National Malaria Indicator Survey 2015
 Zambia MIS 2015 Zambia National Malaria Indicator Survey 2015 This report summarizes the findings of the 2015 Zambia National Malaria Indicator Survey carried out between April and June 2015 by the Ministry
ACCOUNTABILITY AND QUALITY IMPROVEMENT FOR PERINATAL HEALTH
 ACCOUNTABILITY AND QUALITY IMPROVEMENT FOR PERINATAL HEALTH Attention to health system reforms of the past decade has focused on cost containment through efficiency, choice, and medical necessity controls.
g]kfn ax';"rs &!
![g]kfn ax';rs &!](/thumbs/81/84736118.jpg "g]kfn ax';rs &!") g]kfn ax';"rs ;j]{if0f @)&) &! 25 February, 2016 Krishna Tuladhar Director Central Bureau of Statistics Government of Nepal National Planning Commission Secretariat Central Bureau of Statistics 2 3 An
g]kfn ax';"rs ;j]{if0f @)&) &! 25 February, 2016 Krishna Tuladhar Director Central Bureau of Statistics Government of Nepal National Planning Commission Secretariat Central Bureau of Statistics 2 3 An
Ministry of Health and Family Welfare Government of India
 , Ministry of Health and Family Welfare Government of India District Level Household and Facility Survey under Reproductive and Child Health Project (DLHS-3) District Fact Sheet 27-8 Bihar Madhubani
CHAPTER 3: METHODOLOGY
 CHAPTER 3: METHODOLOGY 3.1 Introduction This study is a secondary data analysis of the 1998 South African Demographic and Health Survey (SADHS) data set of women and households. According to the SADHS
Recent Trends in HIV-Related Knowledge and Behaviors in Rwanda, Further Analysis of the Rwanda Demographic and Health Surveys
 RWANDA FURTHER ANALYSIS Recent Trends in HIV-Related Knowledge and Behaviors in Rwanda, 2005 2010 Further Analysis of the Rwanda Demographic and Health Surveys Republic of Rwanda Recent Trends in HIV-Related
World Toilet Day: Eradicating open defecation still a challenge in Ghana
 Dispatch No. 60 19 November 2015 World Toilet Day: Eradicating open defecation still a challenge in Ghana Afrobarometer Dispatch No. 60 Daniel Armah-Attoh Summary Ghana has been observing Toilet Day since
Programme and Treatment in Rural and Urban Baroda
 Operational Efficiency of Malaria Chapter 1 Programme and Treatment in Rural and Urban Baroda Evaluation of Operational Efficiency of the National Antimalaria Program in High- Risk Rural Areas of Vadodara
HIV/AIDS-RELATED KNOWLEDGE, ATTITUDES, AND BEHAVIOUR 11
 HIV/AIDS-RELATED KNOWLEDGE, ATTITUDES, AND BEHAVIOUR 11 HIV/AIDS was first identified in India in 1986, when serological testing found that 10 of 102 female sex workers in Chennai were HIV positive. The
SUSTAINABLE DEVELOPMENT GOALS
 SUSTAINABLE DEVELOPMENT GOALS (SDGs) ETHIOPIA FACT SHEET JULY 2017 Federal Democratic Republic of Ethiopia Central Statistical Agency (CSA) Demographics Indicator Source Value Total population 2017 Projection
Accelerating the Reduction of Malaria Morbidity and Mortality (ARM3) BENIN Behavior Change Communication (BCC): for Malaria Prevention and Treatment
 BENIN Behavior Change Communication (BCC): for Malaria Prevention and Treatment") Accelerating the Reduction of Malaria Morbidity and Mortality (ARM3) BENIN Behavior Change Communication (BCC): for Malaria Prevention and Treatment Malaria is endemic in Benin and everyone in the country
Accelerating the Reduction of Malaria Morbidity and Mortality (ARM3) BENIN Behavior Change Communication (BCC): for Malaria Prevention and Treatment Malaria is endemic in Benin and everyone in the country
NIGERIA SUMMARY REPORT. Multiple Indicator Cluster Survey Monitoring the situation of children and women
 NIGERIA Monitoring the situation of children and women Multiple Indicator Cluster Survey 2011 SUMMARY REPORT Federal Republic of Nigeria National Bureau of Statistics United Nations Population Fund United
Introduction to Household Surveys
 05_XXX_MM1 Introduction to Household Surveys Khin Win Thin RHR\TCC Training Course in Reproductive Health/Sexual Health Research Geneva 2008 Type of Studies Observational Retrospective: Case-control Prospective:
COUNTRY PROFILE: ZAMBIA ZAMBIA COMMUNITY HEALTH PROGRAMS DECEMBER 2013
 COUNTRY PROFILE: ZAMBIA DECEMBER 2013 Advancing Partners & Communities Advancing Partners & Communities (APC) is a five-year cooperative agreement funded by the U.S. Agency for International Development
Global Malaria Initiative
 Global Malaria Initiative Appeal No. MAA00031 21/04/2009 This report covers the period 01/01/2008 to 31/12/2008. Volunteers from the Madagascar Red Cross participate in malaria behaviour change communication
Eritrea Health Weekly Update 9 th to 15 th October, 2006
 Eritrea Health Weekly Update 9 th to 15 th October, 26 HIGHLIGHTS Weekly outbreak Monitoring WCO Meets to Develop Strategies HH/C-IMCI Survey Findings Weekly Outbreak Monitoring Week 41 (9 th to 15 th
COUNTRY PROFILE: ETHIOPIA ETHIOPIA COMMUNITY HEALTH PROGRAMS DECEMBER 2013
 COUNTRY PROFILE: ETHIOPIA DECEMBER 2013 Advancing Partners & Communities Advancing Partners & Communities (APC) is a five-year cooperative agreement funded by the U.S. Agency for International Development
District Level Household and Facility Survey under Reproductive and Child Health Project (DLHS-3)
") Ministry of Health and Family Welfare Government of India District Level Household and Facility Survey under Reproductive and Child Health Project (DLHS3) District Fact Sheet 278 Kerala Palakkad International
Ministry of Health and Family Welfare Government of India District Level Household and Facility Survey under Reproductive and Child Health Project (DLHS3) District Fact Sheet 278 Kerala Palakkad International
MODULE 7. Understanding and Using the Demographic and Health Surveys. DHS Curriculum Facilitator s Guide August 2016
 MODULE 7 Understanding and Using the Demographic and Health Surveys DHS Curriculum Facilitator s Guide August 2016 About the DHS Curriculum Facilitator s Guide The following persons (in alphabetical order)
Drug Use in New Zealand Analysis of the 2003 New Zealand Health Behaviours Survey Drug Use. Public Health Intelligence Occasional Bulletin No.
 Drug Use in New Zealand Analysis of the 2003 New Zealand Health Behaviours Survey Drug Use Public Health Intelligence Occasional Bulletin No. 45 This report was written by Niki Stefanogiannis (Senior Advisor,
Botswana - Botswana AIDS Impact Survey 2001
 Statistics Botswana Data Catalogue Botswana - Botswana AIDS Impact Survey 2001 Central Statistics Office (CSO) - Ministry of Finance and Development Planning Report generated on: September 28, 2016 Visit
2014 Traffic Safety Behaviors Report Minnesota Department of Public Safety, Office of Traffic Safety
 This document is made available electronically by the Minnesota Legislative Reference Library as part of an ongoing digital archiving project. http://www.leg.state.mn.us/lrl/lrl.asp 2014 Traffic Safety
The countries included in this analysis are presented in Table 1 below along with the years in which the surveys were conducted.
 Extended Abstract Trends and Inequalities in Access to Reproductive Health Services in Developing Countries: Which services are reaching the poor? Emmanuela Gakidou, Cecilia Vidal, Margaret Hogan, Angelica
Zambia National Malaria Indicator Survey Zambia National Malaria Indicator Survey 2010 Government of the Republic of Zambia, Ministry of Health
 79 Zambia National Malaria Indicator Survey 2010 Government of the Republic of Zambia, Ministry of Health ii This report summarizes the findings of the 2010 Zambia National Malaria Indicator Survey carried
INTRODUCTION GEOGRAPHY, HISTORY, AND THE ECONOMY. Louis M. Magombo GEOGRAPHY
 INTRODUCTION 1 Louis M. Magombo 1.1 GEOGRAPHY, HISTORY, AND THE ECONOMY GEOGRAPHY Malawi is a landlocked country south of the equator in sub-saharan Africa. It is bordered to the north and northeast by
FERTILITY AND FAMILY PLANNING TRENDS IN URBAN NIGERIA: A RESEARCH BRIEF
 Your Resource for Urban Reproductive Health FERTILITY AND FAMILY PLANNING TRENDS IN URBAN NIGERIA: A RESEARCH BRIEF BACKGROUND Rapid urbanization in Nigeria is putting pressure on infrastructure and eroding
The Millennium Development Goals Report. asdf. Gender Chart UNITED NATIONS. Photo: Quoc Nguyen/ UNDP Picture This
 The Millennium Development Goals Report Gender Chart asdf UNITED NATIONS Photo: Quoc Nguyen/ UNDP Picture This Goal Eradicate extreme poverty and hunger Women in sub- are more likely than men to live in
Attitudes and Behaviour towards Alcohol Survey 2013/14 to 2015/16: Hawke s Bay Regional Analysis
 Attitudes and Behaviour towards Alcohol Survey 13/14 to 15/16: Hawke s Bay egional Analysis October 17 1 ISBN: 978-0-478-44915-0 Citation: Health Promotion Agency (17). Attitudes and Behaviour towards
Jayapura City Young Adult Reproductive Health Survey
 Jayapura City Young Adult Reproductive Health Survey 2002 2003 Jayapura City Young Adult Reproductive Health Survey 2002-2003 Badan Pusat Statistik (BPS-Statistics Indonesia) Jakarta, Indonesia National
Attitudes and Behaviour towards Alcohol Survey 2013/14 to 2015/16: Bay of Plenty regional analysis
 Attitudes and Behaviour towards Alcohol Survey 2013/14 to 2015/16: Bay of Plenty regional analysis December 2017 1 ISBN: 978-0-478-44922-8 Citation: Health Promotion Agency (2017). Attitudes and Behaviour
Obstetric Referral in the Cambodian Health System What Works?
 Validation Workshop Report Obstetric Referral in the Cambodian Health System What Works? Tuesday 19 th May, 2015 Navy Hotel, Prey Veng Province, Cambodia Prepared and Compiled by: SUON Sokneat, Research
EPIDEMIOLOGICAL SURVEILLANCE REPORT Malaria in Greece, 2018, up to 22/10/2018
 Page 1 EPIDEMIOLOGICAL SURVEILLANCE REPORT Malaria in Greece, 2018, up to 22/10/2018 Introduction Greece was declared free from malaria in 1974, following an intense control program (1946-1960). Since
Swaziland National Malaria Elimination Policy
 DRAFT 21 April 2010 Swaziland National Malaria Elimination Policy Version 1.0 May 2010 Kingdom of Swaziland Ministry of Health National Malaria Control Programme TABLE OF CONTENTS Acronyms... 3 Foreword...
The incidence of abortion in Ethiopia: Current levels and trends
 The incidence of abortion in Ethiopia: Current levels and trends Abstract: In 2005, the Ethiopian Parliament amended the penal code to allow abortion in cases of rape/incest, if the woman has physical
Newborn Screening for Sickle Cell Disease in Ghana Update
 National Programme of Newborn Screening for Sickle Cell Disease Newborn Screening for Sickle Cell Disease in Ghana ---------- Update Prof. Kwaku Ohene-Frempong, MD Children s Hospital of Philadelphia University
Mortality in Mozambique
 Mortality in Mozambique Results from a 2007 2008 Post-Census Mortality Survey TECHNICAL REPORT Mortality in Mozambique Results from a 2007 2008 Post-Census Mortality Survey 2012 National Institute of
REPRODUCTIVE HEALTH SURVEY JAMAICA YOUNG ADULTS REPORT. Prepared by: STATISTICAL INSTITUTE OF JAMAICA. Survey Commissioned by:
 REPRODUCTIVE HEALTH SURVEY JAMAICA 2008 YOUNG ADULTS REPORT Prepared by: STATISTICAL INSTITUTE OF JAMAICA Survey Commissioned by: NATIONAL FAMILY PLANNING BOARD FEBRUARY 2010 Copyright National Family
Zimbabwe Demographic and Health Survey Key Findings
 Zimbabwe 2015 Demographic and Health Survey Key Findings The (2015 ZDHS) was implemented by the Zimbabwe National Statistics Agency from July through December 2015. The HIV testing component was implemented
Toolbox for conducting integrated HIV bio-behavioral surveillance (IBBS) in key populations Improving health and reducing inequities worldwide
 in key populations Improving health and reducing inequities worldwide") Toolbox for conducting integrated HIV bio-behavioral surveillance (IBBS) in key populations Improving health and reducing inequities worldwide Copyright The Regents of the University of California, 2014.
Toolbox for conducting integrated HIV bio-behavioral surveillance (IBBS) in key populations Improving health and reducing inequities worldwide Copyright The Regents of the University of California, 2014.
Swaziland Demographic and Health Survey
 Child Health and Nutrition One child in twelve born in Swaziland dies before reaching his fifth birthday; 70 percent of these deaths take place during the child s first year. The infant mortality rate
Summary World Malaria Report 2010
 Summary The summarizes information received from 106 malaria-endemic countries and other partners and updates the analyses presented in the 2009 Report. It highlights continued progress made towards meeting
2009 Namibia Health Facility Census. Sexually Transmitted Infections, Tuberculosis, and Malaria
 2009 Namibia Health Facility Census Sexually Transmitted Infections, Tuberculosis, and Malaria Outline Sexually Transmitted Infections (STIs) Tuberculosis Malaria STIs: Background Untreated STIs can lead
Epidemiology and control profile of malaria in. Sierra Leone 2017 Supplement
 Epidemiology and control profile of malaria in Sierra Leone 2017 Supplement About this supplement In 2015, the Sierra Leone National Malaria Control Programme released a comprehensive malaria control profile
Stop Delirium! A complex intervention for delirium in care homes for older people
 Stop Delirium! A complex intervention for delirium in care homes for older people Final report Summary September 2009 1 Contents Abstract...3 Lay Summary...4 1. Background...6 2. Objectives...6 3. Methods...7
Spatial variation in the use of reproductive health services over time: a decomposition analysis
 Abekah-Nkrumah BMC Pregnancy and Childbirth (2018) 18:63 https://doi.org/10.1186/s12884-018-1695-3 RESEARCH ARTICLE Open Access Spatial variation in the use of reproductive health services over time: a
CHAPTER 5 FAMILY PLANNING
 CHAPTER 5 FAMILY PLANNING The National Family Welfare Programme in India has traditionally sought to promote responsible and planned parenthood through voluntary and free choice of family planning methods
Key Results November, 2016
 Child Well-Being Survey in Urban s of Bangladesh Key Results November, 2016 Government of the People s Republic of Bangladesh Bangladesh Bureau of Statistics (BBS) Statistics and Informatics (SID) Ministry