Kinetics and phenotype of the draining lymph node and pulmonary B cell response to an influenza A virus-like particle vaccine
|
|
|
- Curtis Copeland
- 6 years ago
- Views:
Transcription


1 University of Iowa Iowa Research Online Theses and Dissertations 2013 Kinetics and phenotype of the draining lymph node and pulmonary B cell response to an influenza A virus-like particle vaccine Lea Nichole Goldman University of Iowa Copyright 2013 Lea Nichole Goldman This thesis is available at Iowa Research Online: Recommended Citation Goldman, Lea Nichole. "Kinetics and phenotype of the draining lymph node and pulmonary B cell response to an influenza A viruslike particle vaccine." MS (Master of Science) thesis, University of Iowa, Follow this and additional works at: Part of the Pathology Commons
2 KINETICS AND PHENOTYPE OF THE DRAINING LYMPH NODE AND PULMONARY B CELL RESPONSE TO AN INFLUENZA A VIRUS-LIKE PARTICLE VACCINE by Lea Nichole Goldman A thesis submitted in partial fulfillment of the requirements for the Master of Science degree in Pathology in the Graduate College of The University of Iowa May 2013 Thesis Supervisor: Professor Thomas J. Waldschmidt
3 Graduate College The University of Iowa Iowa City, Iowa CERTIFICATE OF APPROVAL MASTER S THESIS This is to certify that the Master s thesis of Lea Nichole Goldman has been approved by the Examining Committee for the thesis requirement for the Master of Science degree in Pathology at the May 2013 graduation. Thesis Committee: Thomas J. Waldschmidt, Thesis Supervisor Kevin L. Legge Steven M. Varga
4 To my family, for your love, guidance, and support ii
5 TABLE OF CONTENTS LIST OF TABLES... vi LIST OF FIGURES... vii LIST OF ABBREVIATIONS... ix CHAPTER I: INTRODUCTION... 1 Influenza Virus... 1 Immune Response to IAV... 3 Vaccination... 5 Virus-like Particles... 7 Purpose of the Study CHAPTER II: T CELL DRIVEN B CELL RESPONSE IN THE DRAINING LYMPH NODES AFTER VIRUS-LIKE PARTICLE VACCINATION Introduction Hypothesis Materials and Methods Mice Preparation of antigens Immunizations Flow cytometry IAV-specific ELISA Statistical analysis Results Influenza VLPs induce a robust GC response in the dlns following vaccination Isotype switching pattern in the dlns after VLP vaccination is route independent.. 20 IAV-specific serum Ab responses reflect the distribution of GC B cell subsets T FH cell induction in the dlns following vaccination Discussion CHAPTER III: T CELL DRIVEN B CELL RESPONSE IN THE UPPER AND LOWER AIRWAY FOLLOWING VIRUS-LIKE PARTICLE VACCINATION Introduction Mucosal immunity Respiratory mucosal immune response to IAV infection Mucosal vaccination iii
6 Hypothesis Materials and Methods Mice Preparation of antigens and immunizations Flow cytometry IAV-specific ELISA Statistical analysis Results Intranasal immunization with influenza VLPs induces GCs in the lungs Isotype distribution of GC B cells in the lung after vaccination with VLPs GC B cells in the NALT following VLP vaccination IAV-specific BAL Ab response Discussion CHAPTER IV: REGULATION AND ENHANCEMENT OF THE GERMINAL CENTER RESPONSE TO IAV AND VLPS Introduction T regulatory cells TLR agonists as vaccine adjuvants Inactivated IAV vaccines Hypothesis Materials and Methods Mice Preparation of antigens and immunizations Treg disruption Flow cytometry Statistical analysis Results Identification of T FR cells in the lung after IAV infection Treg disruption and the GC response after IAV infection The potential role of TLR agonists in modulating the GC response to VLPs Vaccination with γ-ray inactivated IAV induces GC B cell responses in the lung Isotype distribution of GC B cells after vaccination with γ-irradiated IAV Discussion CHAPTER V: DISCUSSION Introduction Chapter II: Conclusions and Future Directions Conclusions Future directions Chapter III: Conclusions and Future Directions Conclusions Future directions iv
7 Chapter IV: Conclusions and Future Directions Conclusions Future directions REFERENCES v
8 LIST OF TABLES Table 2-1. Total GC B cells and T FH cells in the dlns 12 days post-challenge Table 4-1. Infectivity and hemagglutination activity of live and inactivated..hhhhhhiav preparations vi
9 LIST OF FIGURES Figure 1-1. Schematic diagrams of the influenza virion and influenza HA M1 VLPs Figure 2-1. Immunization with influenza VLPs induces robust GCs in the dlns Figure 2-2. GC B cells undergo isotype switching in the dlns following VLP hhhhhhhhh immunization Figure 2-3. Distribution of isotype-switched GC B cells in the dlns following VLP immunization Figure 2-4. IAV-specific serum Ab response Figure 2-5. T FH cell induction in the dlns following VLP vaccination Figure 3-1. Dose dependent induction of GCs in the lungs and dlns after hhhhhhhhh intranasal immunization with influenza VLPs Figure 3-2. Intranasal immunization with influenza VLPs induces GCs in the lungs Figure 3-3. GC B cells undergo isotype switching in the lungs following VLP hhhhhhhhh vaccination Figure 3-4. Distribution of isotype-switched GC B cells in the lungs after VLP hhhhhhhhh vaccination Figure 3-5. NALT formation following i.n. immunization with influenza VLPs Figure 3-6. Isotype distribution in the NALT following VLP vaccination Figure 3-7. IAV-specific Ab response in BAL fluid of VLP vaccinated mice Figure 4-1. Identification of TFR cells in FoxP3 reporter mice after PR8 infection Figure 4-2. Treg disruption and the GC B cell response following PR8 infection Figure 4-3. DTA-1 alters the isotype switching pattern early but not late in the dlns and lungs after PR8 infection Figure 4-4. GC B cell response in the dlns and lungs of PR8 infected mice treated with DTA-1 i.p. and i.n vii
10 Figure 4-5. Treatment with DTA-1 induces a GC B cell response in the dlns hhhhhhhhh and lungs of non-infected mice Figure 4-6. GC B cell response in the lungs of mice immunized with VLPs plus hhhhhhhhh R Figure 4-7. GC B cell response in the lungs of mice immunized with VLPs plus Poly(I:C) Figure 4-8. GC B cell response induced in the lungs after i.n. challenge with a hhhhhhhhh high dose of γ-irradiated PR Figure 4-9. GC B cells in the lungs undergo isotype switching after i.n. challenge hhhhhhhhh with a high dose of γ-irradiated PR viii
11 LIST OF ABBREVIATIONS Ab AFC APC Au BAL CSR CTL CXCR DC dlns dsrna ELISA FDA GC HA HBV HI HIV HPV IAV ibalt Antibody Antibody-forming cell Antigen presenting cell Australia antigen Bronchoalveolar lavage Class switch recombination Cytotoxic T lymphocyte Chemokine (C-X-C) motif receptor Dendritic cell Draining lymph nodes Double strand ribonucleic acid Enzyme-linked immunosorbant assay Food and Drug administration Germinal center Hemagglutinin Hepatitis B virus Hemagglutination inhibition Human immunodeficiency virus Human papilloma virus Influenza A virus Induced bronchus-associated lymphoid tissue ix
12 IFN Ig i.m. i.n. ISC LAIV ldlns M1 Interferon Immunoglobulin Intramuscular Intranasal Interferon stimulated genes Live-attenuated influenza vaccine Lung draining lymph nodes Matrix 1 M2 Matrix 2 MDA-5 Melanoma differentiation-associated protein 5 MDCK NA NALT NP Madin-Darby Canine Kidney Neuraminidase Nasal-associated lymphoid tissue Nucleoprotein NS1 Non-structural protein 1 NS2 Non-structural protein 2 PA PAMP Polymerase acidic protein Pathogen-associated molecular pattern PB1 Polymerase basic protein 1 PB1-F2 Polymerase basic protein 1 from segment 2 PB2 Polymerase basic protein 2 plns PNA Popliteal lymph nodes Peanut agglutinin x
13 rbv Recombinant baculovirus RIG-1 Retinoic acid inducible gene 1 RNA s.c. SRBCs Ribonucleic acid Subcutaneous Sheep red blood cells Sf9 Spodoptera frugiperda 9 ssrna T FH T FR T H TIV TLR Treg VLP WIV Single strand ribonucleic acid T follicular helper cell T follicular regulatory cell T helper cell Trivalent inactivated vaccine Toll-like receptor T regulatory cell Virus-like particle Whole inactivated virus xi
14 1 CHAPTER I INTRODUCTION Influenza Virus Influenza virus is a highly contagious respiratory pathogen associated with significant morbidity and morality throughout the world. In the United States, 12-20% of the population is infected with seasonal influenza, resulting in over 200,000 hospitalizations and up to 48,000 deaths [1]. All age groups are affected, however infection rates are highest among children. Infants, elderly, pregnant women, and patients with underlying health conditions are at greater risk to develop pneumonia and even death [2,3,4,5]. Influenza viruses are enveloped, single-stranded RNA viruses belonging to the Orthomyxoviridae family [6,7]. There are three types (A, B, and C), which differ in host range and pathogenicity. Influenza B and C are isolated almost exclusively from humans, though influenza C has also been isolated from pigs, and usually cause less severe disease. Influenza A (IAV), on the other hand, can infect a wide range of species including humans, birds, horses, and pigs, and is by far the most commonly encountered subtype of influenza and typically causes the most serious illness in humans. IAV contains a segmented genome consisting of eight RNA segments that encode eleven viral proteins including: hemagglutinin (HA), neuraminidase (NA), matrix 1 (M1), matrix 2 (M2), nucleoprotein (NP), non-structural protein 1 (NS1), non-structural protein 2 (NS2), polymerase acidic protein (PA), polymerase basic protein 1 (PB1), polymerase basic protein 2 (PB2), and polymerase basic protein 1-F2 (PB1-F2) [6,7]. IAV is
15 2 classified based upon antigenic properties of the major surface glycoproteins HA and NA, which also serve as the main targets of the host s humoral immune response [7,8]. HA mediates the interaction of the viral particle with sialic acid residues on the surface of the host cell and promotes fusion of the viral and endosomal membranes. NA is necessary for the release of newly synthesized virions from infected cells. Sixteen IAV HA (H1-H16) subtypes and nine IAV NA (N1-N9) subtypes have been described [9]. Aquatic bird species are the natural reservoir for all known subtypes of IAV, while only H1, H2, H3, N1 and N2 are typically found in human-adapted IAV [10]. Avian strains do not typically infect humans, however, H5, H7, and H9 viruses have been isolated from human infections [11]. Like other RNA viruses, mutations in the influenza genome are common due to the low fidelity of RNA polymerase and the lack of a proofreading mechanism by the virus replication machinery. Mutations that change amino acids in the antigenic portion of surface glycoproteins allow the virus to evade preexisting humoral immunity of the host [12]. This phenomenon, known as antigenic drift, often results in yearly influenza epidemics and drives the need for annual vaccination programs. More worrisome than antigenic drift of IAV, however, is the ability of the virus to exchange genetic material in cells infected with multiple viral subtypes [11]. Antigenic shift, or the reassortment of viral segments, can result in antigenically and genetically novel viruses. This potentially leaves the population without protective immunity, increasing the morbidity and mortality rates associated with IAV infection. In the 20 th century there were three reassortment events that caused pandemics: 1918 Spanish flu (H1N1), 1957 Asian flu (H2N2), and 1968 Hong Kong flu (H3N2) [13,14]. The Spanish flu was the most
16 3 devastating, caused by an extremely pathogenic virus, killing an estimated 50 million people worldwide [15]. The most recent pandemic was caused by the 2009 H1N1 virus, which arose from a reassortment of two swine influenza viruses [16,17]. Immune Response to IAV The host response plays a crucial role in the defense against influenza infection, involving activation of the innate and adaptive branches of the immune system. The innate immune response is the first line of host defense against IAV infection, which acts in an antigen-independent fashion to limit viral spread. Viral recognition occurs in infected airway epithelia and alveoli through pattern recognition receptors like Toll-like receptors (TLRs) 3 (dsrna) and 7 (ssrna) in the endosome, and RIG-1 and MDA-5 in the cytosol [18]. Activation of these receptors initiates a signaling cascade leading to the production of type I interferons (IFNs) and proinflammatory cytokines and chemokines. Type I IFNs elicit anti-viral activity through activation of interferon stimulated genes (ISGs) that restrict viral replication, while the proinflammatory cytokines and chemokines play a critical role in recruitment of innate immune cells [18,19]. B-1 B cells in the respiratory tract also contribute to immune protection through secretion of natural antibodies and rapid induction of antiviral IgM [20]. In addition, the innate immune response provides appropriate signals required for activation of the adaptive immune response. In the event the virus evades these early defense mechanisms, the adaptive immune response is activated, resulting in the production of antigen-specific T cells that target the virus directly, or antigen-specific plasma cells that secrete protective antibodies.
17 4 The adaptive immune response is mediated by CD8 + cytotoxic T lymphocytes (CTLs), CD4 + T helper cells, and antibody (Ab) producing B cells. Induction of antigenspecific T and B cell responses in the draining lymph nodes (dlns) requires their activation by antigen presenting cells (APCs), primarily dendritic cells (DCs) migrating from the lungs [21]. During influenza infection, viral antigens are acquired by DCs, which then mature and migrate from the lungs to the dlns in search of influenza-specific CD8 + T cells and CD4 + T cells [21]. DC: naïve CD8 + T cell interactions drive their activation, differentiation, and subsequent migration to the lungs where they eliminate virus-infected cells [22,23]. CD8 + T cells are the main effector cells responsible for eliminating virus-infected host cells upon primary exposure; however, influenza-specific effector CD4 + T cells also contribute to the response. The latter secrete cytokines that inhibit virus replication, enhance CTL proliferation, and importantly, provide help for generation of humoral immunity [8,24]. Long-term immunity and protection against subsequent infection is provided by high affinity Abs secreted by memory B cells and long-lived antibody forming cells (AFCs) [25,26]. These cells are the products of the germinal center (GC) reaction, a T follicular helper (T FH ) cell-driven B cell response. GCs develop within B cell follicles of secondary lymphoid organs or ectopic sites during a T cell-dependent response. GCs are the site of B cell clonal expansion and differentiation, including somatic mutation, affinity selection, and class switch recombination (CSR), processes that result in the formation of high affinity B cell clones [26,27]. GC reactions are crucial for protective immunity against many pathogens and the generation of this response is critical for the development of effective vaccines.
18 5 Vaccination Annual vaccination is the most effective way to prevent influenza infection and its potentially severe complications. There are two types of vaccines currently available in the United States: (i) the traditional trivalent inactivated vaccine (TIV) and (ii) a liveattenuated influenza vaccine (LAIV), both of which contain two strains of influenza A virus (H3N2 and H1N1) and one influenza B virus (Fiore 2009). Due to the high viral mutation rate, the antigenic composition of the vaccine is reviewed yearly and updated to match the predicted seasonal strains. The protective efficacy provided by vaccination, therefore, depends upon the degree of similarity between the virus strains in the vaccine and those in circulation, as well as the age and immune competence of the vaccine recipient. While both types of influenza vaccine contain the same virus strains, there are several differences, including administration route, toxicity profile, and anticipated immune response. TIV is a killed virus vaccine, and in the United States only subvirion and purified surface antigen preparations are available [28]. TIV is administered intramuscularly and can be given to any person over six months of age, including high-risk immune compromised individuals. The efficacy of vaccination with TIV is lower among immunologically naïve individuals, and therefore requires a prime-boost vaccine schedule [28]. Immunization with TIV cannot cause influenza infection and is typically well tolerated, though some individuals report fever and reactions at the injection site [28]. TIV vaccination contains antigens present on the surface of the inactivated virus,
19 6 inducing anti-ha Abs and to a lesser extent anti-na Abs. Thus, it is highly protective against homologous virus, and elicits higher hemagglutination inhibition (HI) titers (abs directed against HA) compared to vaccination with LAIV. However, TIV is less effective against heterologous virus challenge and is a poor inducer of mucosal immunity [29]. The live attenuated influenza virus vaccine (LAIV) is a cold-adapted live virus vaccine [30]. It is administered intranasally using a syringe-like device to deliver the large particle aerosol [31] and is currently licensed for healthy, non-pregnant persons 2 to 49 years of age [28,32]. Similar to immunization with TIV, immunologically naïve recipients should receive two doses of the vaccine. LAIV vaccination does not require the use of needles or trained personnel for delivery. Although LAIV viruses are attenuated, they can replicate in the mucosa of the nasopharynx, causing an array of adverse side effects including rhinorrhea, nasal congestion, headache, fever, and pharyngitis [31]. Since LAIV is a live virus vaccine and is administered in a manner that mimics natural infection, immune responses elicited more closely resemble the response to natural influenza infection [31,33]. Local production and secretion of IgA antibodies in the upper airways helps neutralize subsequent virus exposures at the site of entry, inhibiting the manifestation and dissemination of infection [34]. Studies have demonstrated the relative efficacy of LAIV compared to TIV against antigenically similar strains of influenza increases over time [32,35]. Furthermore, efficacy trials in children have demonstrated intranasal vaccination with LAIV can induce heterotypic immunity and provide protection against antigenically drifted strains [36]. The efficacy of current vaccines is well established, however, several factors limit its availability and universal application. Both vaccines are produced using fertilized
20 7 chicken eggs, prolonging length of production time, risk associated with handling live virus, susceptibility to pandemic outbreak limiting egg availability, and individuals with egg allergies cannot be vaccinated. Thus, more effective vaccine technologies need to be further explored. Virus-like Particles The discovery of the Australia antigen (Au) in the sera of leukemia patients [37], and subsequent association with hepatitis [38] in 1965 is considered the first example of naturally occurring virus-like particles (VLPs). Shortly thereafter, Brady and colleagues developed a system to experimentally generate VLPs through the expression of viral capsid proteins [39]. It did not take long for scientists to realize the seemingly unlimited therapeutic potential of VLPs. Since their discovery, VLPs have been generated for more than 30 different enveloped and non-enveloped viruses [40]. Virus-like particles are organized complexes composed of viral structural proteins that spontaneously self-assemble into structures that mimic the corresponding native virus (Figure 1-1). They do not contain viral genomic material and are therefore noninfectious and non-replicative [41]. Like their corresponding native virus, VLPs display a high density of repetitive epitopes on their surface, enabling recognition by host immune cells and induction of cellular and humoral responses [42]. They are particulate in nature, facilitating efficient uptake by APCs, particularly DCs, which present antigen to T and B cells [41,43]. Depending on their size, VLPs can also diffuse freely to lymph nodes [41]. In addition, VLPs can be used as antigen display platforms to broaden or enhance the
21 8 immune response [42,44]. Genetic fusion or chemical conjugation of foreign epitopes to VLPs has been demonstrated to enhance activation of the host s immune response [44,45]. Currently, VLP-based vaccines are commercially available for hepatitis B virus (HBV) and human papilloma virus (HPV). The HBV VLP vaccine, which was FDA approved in 1986, has been highly effective in preventing HBV infection and has significantly reduced the rate of chronic infection in children [46]. The HPV vaccine has also been successful in preventing two types of HPV infection, types 16 and 18, which cause 70% of cervical cancers [47]. There are several other VLP-based vaccine candidates currently being evaluated in clinical or preclinical trials, such as influenza virus, norovirus, human immunodeficiency virus (HIV), parvovirus, and rotavirus (listed in Generation of VLPs requires the use of expression systems to overexpress target viral structural proteins. Several different expression systems exist, including: bacteria, yeast, plant cells, insect cells and mammalian cells [42]. The expression system of choice depends upon many factors, such as ease of expression, protein modification, correct assembly, and large-scale applicability [42,48]. With regards to influenza VLPs, a favored method is the recombinant baculovirus/insect cell expression system [44,48]. Galarza and Latham were the first to report formation of influenza VLPs using a single recombinant baculovirus that simultaneously expressed multiple components: M1, M2, HA, and NA of influenza virus A/Udorn/72 (H3N2) [49]. VLPs were generated by infecting Sf9 insect cells with the recombinant baculovirus and purifying the particles from culture media by sucrose gradient centrifugation. Western blot analysis and
22 9 immunofluorescence were used to confirm the presence of HA, NA, and M1 in the VLPs, and electron microscopy examination showed the VLPs resembled influenza virus in size and morphology. Although the contribution each protein makes during the assembly and release of influenza VLPs is not completely understood, VLPs have been successfully generated with various combinations of structural proteins from a variety of influenza subtypes and strains, including pandemic strains [50]. Importantly, subsequent studies have demonstrated influenza VLPs are immunogenic and confer protection against lethal challenge with homologous and heterologous strains [51,52,53,54]. The protective efficacy of influenza VLPs is enhanced compared to a whole inactivated virus (WIV) vaccine, and VLPs are capable of inducing antibodies against a broad panel of influenza isolates in mice [55]. Clinical trials have also demonstrated influenza VLPs are safe and immunogenic in healthy adults [56]. Influenza VLPs are a novel vaccine candidate that offers a number of advantages over the current influenza virus vaccines: (i) no live IAV is involved in production, making it much safer; (ii) VLPs are not generated in chicken eggs, so individuals with egg allergies are not exempt from vaccination; (iii) VLPs can be rapidly produced on a large scale [44]; (iv) VLPs are well tolerated and more immunogenic; (v) and they can be administered by a number of routes, including subcutaneous (s.c.), intramuscular (i.m.), intradermal, and intranasal (i.n.). Influenza VLPs may be a promising alternative vaccine, however, there are basic immunologic questions that remain to be addressed.
23 10 Purpose of the Study It has been widely documented that influenza VLPs induce strong protective humoral responses, however studies to date have only examined serum antibodies. The T cell driven B cell response to VLP vaccination has not been characterized at the cellular level. Furthermore, it is unclear how the immune response to VLPs would compare to natural infection with IAV. Previous work from our laboratory and others have characterized the T cell dependent B cell response following influenza infection [57]. Upon infection with IAV, GCs can be found in the dlns, lung, spleen, and NALT. Examination of the GC B cell isotypes revealed that, in agreement with previous studies, influenza infection induces a T H 1-like response. Influenza VLPs contain only two viral proteins, HA and M1, and thus theoretically lack some of the pathogen-associated molecular patterns (PAMPs), such as ssrna, that play a key role in directing the immune response. Therefore, we sought to characterize the GC response following VLP vaccination.
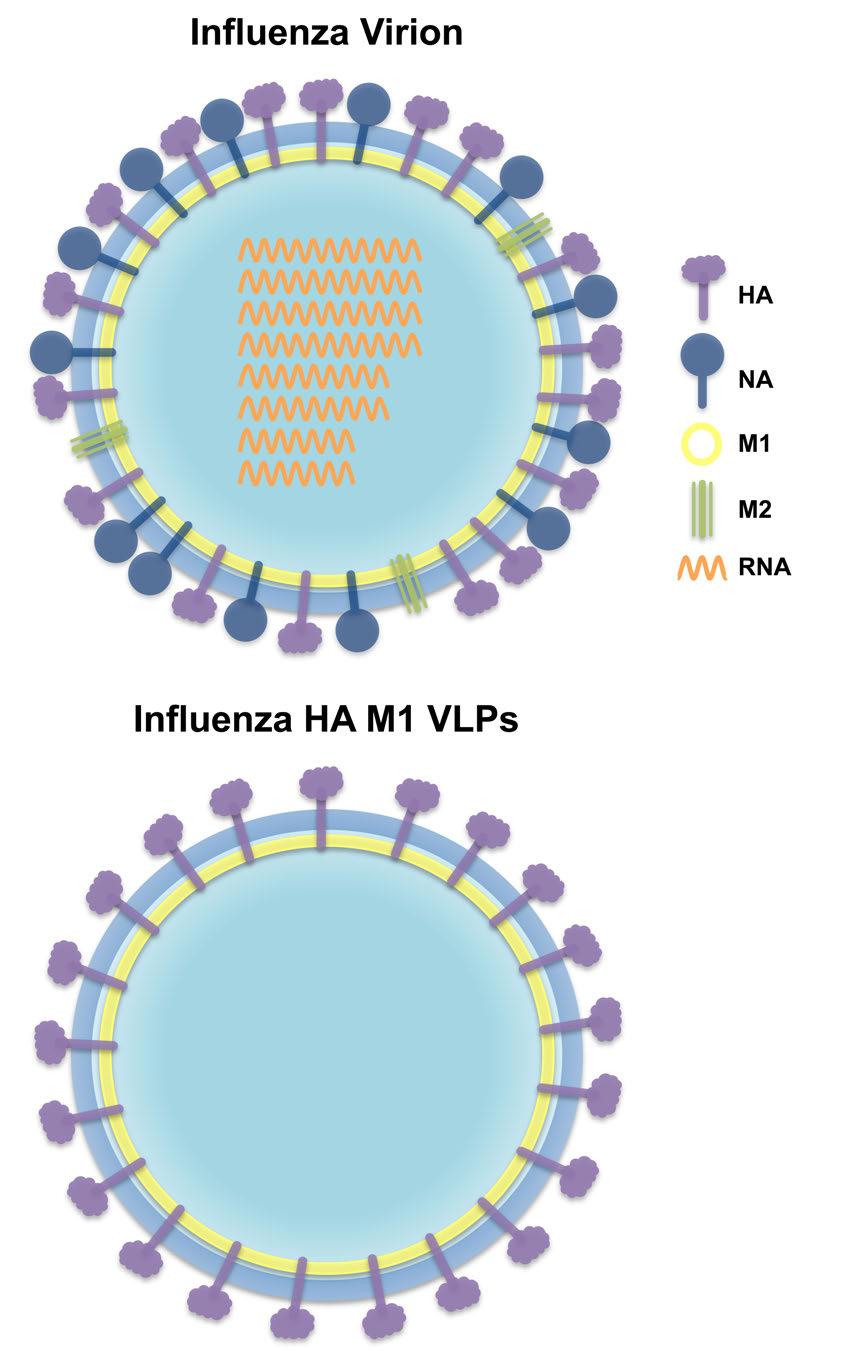
24 11 Figure 1-1. Schematic diagrams of the influenza virion and influenza HA M1 VLPs. (A) A cartoon illustrating the various structural and genetic components of the influenza virion. (B) A cartoon illustrating the structural components of influenza HA M1 VLPs.
25 12
26 13 CHAPTER II T CELL DRIVEN B CELL RESPONSE IN THE DRAINING LYMPH NODES AFTER VIRUS-LIKE PARTICLE VACCINATION Introduction Studies using influenza VLPs have demonstrated they are immunogenic in multiple animal models (mice, pigs, ferrets, humans), and provide protection against lethal challenge with homotypic and heterotypic strains. Many components of the VLPinduced immune response remain to be elucidated, however, it is known influenza HAspecific neutralizing Abs play a critical role in providing protection [51]. In fact, immunization with HA-negative VLPs or heat-treated VLPs fails to induce IAV (PR8)- specific Abs and fails to provide protective immunity, thus demonstrating intact HA is necessary for induction of protective immune responses [51]. While the serum antibody response to VLPs has been studied extensively, the humoral response has not been investigated at the cellular level. Furthermore, it was initially unclear how the character of the immune response would compare to natural infection with influenza virus. Since VLPs are non-infectious and should not contain IAV genetic material, they theoretically lack PAMPs, such as viral ssrna and dsrna, which play a key role in shaping the immune response to IAV. Towards this end, experiments in this chapter focused on assessing the germinal center response in dlns following immunization with influenza VLPs. However, first it is important to review the GC response to natural infection with IAV.
27 14 The kinetics and character of the GC reaction to IAV was recently examined by Boyden et al. [57]. Following pulmonary challenge with IAV, GC reactions were observed in the dlns, lung, spleen, and nasopharynx-associated lymphoid tissues (NALT) (lung and NALT data will be discussed in the next chapter). Interestingly, the kinetics, magnitude, and isotype distribution differed between each organ. The peak of the response in the dlns and spleen was on day 18 post-infection. On a percent basis, the largest response was observed in the dlns, however the total number of recovered GC B cells was largest in the spleen. Isotype switching patterns were site-specific; in the dlns, there was a steady ratio of switched to non-switched GC B cells throughout the response, while a dynamic switching pattern was observed in the spleen. Within the switched GC B cell subset, IgG2 + GC B cells (IgG2a + IgG2b) represented the majority. Serum Ab responses were evaluated by ELISA and of the IAV-specific IgG Abs, IgG2a had the highest titer. These findings are consistent with previous reports examining the humoral response to IAV infection and demonstrate a bias towards a T H 1-polarized response. Given these findings, and the lack of knowledge regarding the immune response to influenza VLP vaccination, the GC response in the dlns was examined using three different vaccination routes: subcutaneous (s.c.) (footpad), intramuscular (i.m.) (back haunch) and intranasal (i.n.). Hypothesis It was hypothesized that influenza VLPs will induce a strong GC response that is T H 1-biased, similar to the response induced by natural infection with IAV.
28 15 Materials and Methods Mice Specific pathogen free female BALB/c mice were purchased from NCI and housed in barrier rooms at the University of Iowa Animal Care Facility. All mice used in experiments were at least 8 weeks of age. Animal procedures were approved by the University of Iowa Institutional Animal Care and Use Committee in accordance with the Association for Assessment and Accreditation of Laboratory Animal Care, International (AAALAC International) and PHS Animal Welfare mandates. Preparation of antigens Influenza VLPs were kindly provided by Sang-Moo Kang at Georgia State University. VLPs containing HA and M1 proteins derived from A/Puerto Rico/8/1934 (PR8) (H1N1) were prepared using the recombinant baculovirus (rbv) expression system as described previously [51,58]. Briefly, Sf9 insect cells were co-infected with rbvs expressing HA and M1. Culture supernatants were harvested three days post-infection and centrifuged (2000 x g for 20 min at 4 C) to remove debris. VLPs in the supernatant were pelleted by ultracentrifugation (100,000 x g for 60 min), resuspended in phosphatebuffered saline (PBS) and further purified through a 20%-30%-60% discontinuous sucrose gradient (100,000 x g for 60 min at 4 C). The VLP band was collected and analyzed by Western blot. HA content in purified VLPs were estimated by hemagglutination activity assay and was found to constitute approximately 10% of total protein.
29 16 Mouse adapted influenza virus PR8 was inactivated with β-propriolactone as previously described [59]. Briefly, purified influenza virus was treated with 15mM β- propriolactone for 15 minutes at 25 C. Sodium thiosulfate was used to neutralized the reaction and the inactivated virus was resuspended in sterile PBS. Total viral protein concentration, determined using a bicinchoninic acid protein assay kit (Pierce Biotechnology), was 2.29mg/mL. Inactivation was confirmed by MDCK plaque assay. Immunizations Three routes of immunization with VLPs were investigated: subcutaneous (footpad), intramuscular (back haunch), and intranasal. 5.0µg (total protein) VLPs were suspended in 50 µl or 200 µl PBS, for s.c. or i.m. immunization, respectively. For i.n. immunization, 10µg VLPs were suspended in 50 µl serum-free Iscove s media and administered to mice anesthetized by isoflurane inhalation. For the fixed vaccine studies, mice were immunized s.c. or i.m with 20µg β-propriolactone inactivated IAV suspended in 50 µl or 200 µl PBS respectively. Flow cytometry Popliteal lymph nodes (LNs) were harvested from mice vaccinated s.c. and i.m. and mediastinal and peribronchial LNs from mice vaccinated i.n. dlns were minced with frosted slides to obtain a single cell suspension. Cell suspensions were washed with balanced salt solution, subjected to Fico/Lite-LM (Atlanta Biologicals, Norcross, GA) density centrifugation to obtain viable mononuclear cells, and resuspended in staining buffer (balanced salt solution, 5% bovine calf serum, and 0.1% sodium azide). 5 x 10 5 to
30 17 1 x 10 6 cells were stained with combinations of fluorochrome-conjugated antibodies to identify various cell subsets. Non-specific binding of conjugated Abs was inhibited by blocking cells with 10 µl of rat serum (Pel Freez, Rogers, AR) and 10µg of 2.4G2, an anti-fcγr monoclonal Ab. The rat anti-mouse mabs used were anti-igm (b76), anti- B220 (6B2), anti-cd44 (9F3), anti-cd4 (PerCP/Cy5.5 conjugate, BioLegend, San Diego, CA) and anti-cxcr5 (biotin conjugate; BD Pharmingen, San Diego, CA). The goat antimouse Abs used were biotin-labeled anti-igg1, -IgG2a, -IgG2b, -IgG3, and -IgA (Southern Biotechnology Associates, Birmingham, AL). FITC-conjugated peanut agglutinin (PNA) was purchased from Vector Laboratories (Burlingame, CA). 2.4G2, b76, 6B2, and 9F3 were semi-purified from HB101 serum-free supernatants using 50% ammonium sulfate precipitation. b76 was conjugated to biotin (Sigma-Aldrich, St. Louis, MO) and 6B2 and 9F3 were conjugated to Cy5 (Amersham Pharmacia, Piscataway, NJ) using standard procedures. Purified rat IgG (Jackson Immunoresearch Laboratories, West Grove, PA) was conjugated to biotin, Cy5, and FITC and used for isotype controls. Primary mabs and PNA were added to cells and incubated for 20 minutes on ice. For cells stained with anti-cxcr5, the primary incubation was 30 minutes at room temperature. Cells were then washed twice with staining buffer and PE-conjugated streptavidin (Southern Biotechnology Associates) was added to detect biotinylated Abs, except cells stained with anti-cxcr5, which was detected with PE-Cy7-conjugated streptavidin (ebioscience, San Diego, CA). Stained cells were analyzed on a BD FACS Canto II flow cytometer (Becton Dickinson, San Jose, CA) and analyzed with FlowJo software (Tree Star, Ashland, OR).
31 18 IAV-specific ELISA Influenza virus-specific antibody subtypes were measured in d24 postimmunization sera by ELISA as previously described [57]. Briefly, 96-well microtiter plates (Nalgene Nunc International, Rochester, NY) were coated with 2.85x10 4 TCID 50 (per well) PR8 IAV in 100µl carbonate coating buffer and incubated at 4 C overnight. The next day, virus was removed and plates were blocked with 1% BSA for 1 hour at 37 C. Serum samples were added with an initial dilution of 1:100 and serially diluted down the length of the plate at a 1:2 dilution. Plates were incubated for 1.5 hours at 37 C, then washed three times with PBS-Tween buffer. IAV-specific serum Ab responses were detected with biotinylated goat anti-mouse IgG1, IgG2a, IgG2b, IgG3, and IgA Abs (Southern Biotechnology Associates). Streptavidin-alkaline phosphatase (Invitrogen, Carlsbad, CA) and phosphatase substrate (Sigma-Aldrich) were used to develop color. Optical density was read at 405nm on an EL311 Microplate Autoreader from Bio-Tek Instruments (Winooski, VT). Statistical analysis The unpaired Student s t test was used to assess statistical significance using the GraphPad InStat software program (La Jolla, CA).
32 19 Results Influenza VLPs induce a robust GC response in the dlns following vaccination Previous reports have demonstrated vaccination with influenza VLPs elicits a strong humoral immune response [50,51,52,54,55,60,61,62,63,64]. However, characterization of the GC response that drives production of protective Abs has not been examined. To investigate the GC reaction, BALB/c mice were immunized with influenza VLPs s.c., i.m., or i.n. To compare the efficacy of VLPs to a conventional inactivated influenza vaccine, mice were immunized with fixed (β-propriolactone inactivated) PR8 s.c. or i.m. dlns were harvested at various times points post-immunization, single cell suspensions were prepared and cellular responses assessed by multicolor flow cytometry. Naïve, unimmunized mice did not have an apparent GC (B220 + PNA hi ) B cell population in the dlns (Figure 2-1A). Upon vaccination with VLPs, a robust GC B cell population was observed on day 12 post-vaccination in the dlns, regardless of immunization route (Figure 2-1A). Vaccination with fixed PR8 also induced a GC reaction, however, it was not as robust compared to VLPs. Kinetic analysis of the GC response after s.c. challenge revealed the peak of the GC response, as measured by both percent and total number, was day 12 post-immunization (Figure 2-1B). While both measurements are revealing, the total number of GC B cells is the most informative metric when evaluating a GC response because (unlike the percent) its value is not affected by other cellular dynamics. The peak in the percent of GC B cells following i.m. and i.n. vaccination was similarly at day 12 (Figure 2-1C and Figure 2-1D), however based on the total number of recovered
33 20 GC B cells, the maximal response (of the time points tested) was observed on day 8. When comparing the response induced by the VLPs and fixed vaccine, the percent of GC B cells was significantly greater at all time points in the VLP vaccinated group (Figure 2-1B and Figure 2-1C). However, the difference in the total number of GC B cells was not statistically significant, except on day 8 following i.m. vaccination (Figure 2-1B and Figure 2-1C). Isotype switching pattern in the dlns after VLP vaccination is route independent Isotype switching in GCs is a highly regulated process, and dependent on many factors including antigen, strain, and site examined [65,66]. Previous studies in our laboratory documented this variability using experimental model antigens as well as IAV [57,65,66]. Immunization with experimental antigens, such as sheep red blood cells (SRBCs) or phycoerythrin, induced splenic GCs that displayed a steady ratio of IgM + (non-switched) B cells to switched GC B cells [65]. However, GCs induced after IAV infection exhibited site-specific isotype switching characteristics with some sites displaying steady state attributes, and others exhibiting a dynamic pattern [57]. To characterize isotype switching in the GC response to VLPs, B220 + PNA hi GC B cells in the dlns were assessed for their expression of IgM. Figure 2-2A is a representative plot demonstrating the gating strategy used to define IgM + and IgM - GC B cells. In mice vaccinated s.c. with VLPs, the percent of switched GC B cells increased over time with approximately 70% switched GC B cells early in the response (day 8) and nearly 90% by day 24 (Figure 2-2B). Vaccination with VLPs i.m. and i.n. led to similar results, with the
34 21 percent of switched GC B cells increasing over the course of the reaction (Figure 2-2C and Figure 2-2D). The results from mice challenged with fixed PR8 s.c. was similar to VLPs s.c. early in the response, with approximately 65% of the GC B cell population displaying a switched phenotype. However, unlike VLPs s.c., the ratio of IgM + and IgM - GC B cells remained in a steady state over the course of the reaction (Figure 2-2B). This pattern was also observed in mice that received the fixed vaccine i.m. (Figure 2-2C). Thus, even though VLPs and fixed vaccine were administered similarly (s.c. and i.m.), the former induced a dynamic and the latter a steady pattern of switching. To further characterize the response, isotype switched GC B cells were examined for surface expression of IgG1, IgG2 (IgG2a + IgG2b), and IgG3. Switched GC B cells expressing IgA in the dlns were very rare, comprising less than one percent of the GC B cell population. Representative plots illustrating the gating strategy used to identify IgG1 +, IgG2 +, and IgG3 + B220 + PNA hi GC B cells are shown in Figure 2-3A. Throughout the response, IgG2 was the dominant isotype, a consistent feature regardless of immunization route or immunogen (Figure 2-3B, 2-3C, and 2-3D). Interestingly, the isotype switching pattern was remarkably similar between each route of VLP immunization (s.c., i.m. or i.n.). The fixed PR8 vaccine had a comparable switching pattern, however, the percent of IgG2 + GC B cells was lower compared to the VLPs (higher percent of IgM + GC B cells with the fixed vaccine accounts for the difference). While IgG2 remained the dominant isotype, the percent of IgG1 and IgG3 increased as the response matured. These data are consistent with a study by Kang et al. demonstrating a single dose of influenza VLPs i.n. drives antibody responses with different levels of IgG subclasses, with IgG2a Abs representing the dominant isotype [62]. These data demonstrate that influenza VLPs are
35 22 capable of inducing a T H 1-biased cellular response in the dlns independent of vaccination route. Importantly, this response is similar to that induced by the inactivated influenza virus vaccine and natural IAV infection [57]. IAV-specific serum Ab responses reflect the distribution of GC B cell subsets Previous studies with influenza VLPs have shown vaccination induces the production of virus-specific Abs in the serum [50,51,62]. To determine if Ab in the serum is a reflection of the GC B cell response in dlns, serum was collected from mice 24 days post-vaccination (with VLPs s.c., i.m., and i.n., or fixed PR8 s.c.) and IAV-specific ELISA measurements performed. Serum was analyzed for IgG subclass Abs and IgG2a was found to be the dominant IAV-specific IgG Ab, regardless of vaccination route or immunogen (Figure 2-4A). Importantly, these data are consistent with previous reports examining the IAV-specific Ab response in the serum of BALB/c mice following IAV infection [57,62,67,68,69]. The relative levels of IgG2a anti-iav Abs were directly compared between the various immunogens and vaccination routes (Figure 2-4B). Mice immunized with the fixed PR8 vaccine s.c. produced the highest titer. Vaccination with VLPs s.c. and i.m. induced IgG2a Ab titers that were less than the fixed PR8 s.c., but the difference did not reach statistical significance. Mice vaccinated with VLPs i.n. had the lowest levels of serum IgG2a Abs. The basis for this result is currently not understood, but may be due to a difference in the ability to generate a systemic response. Notably, the serum Ab response correlated closely with the GC response (Figure 2-3 and Figure 2-4).
36 23 T FH cell induction in the dlns following vaccination Recent studies have demonstrated T FH cells play a critical role in the induction and maintenance of GCs and in the generation of plasma cells and memory B cells [57,70]. Since T FH cells are a limiting factor in the GC reaction, this population was analyzed at the height of the response. Based on findings by Crotty et al, T FH cells were identified as CD4 + CD44 hi CXCR5 + CD150 lo [71]. Figure 2-5A depicts a representative plot identifying CD4 + CD44 hi CXCR5 + CD150 lo T FH cells in VLP vaccinated mice. Naïve, unimmunized mice did not have an apparent T FH cell population in the dlns (Figure 2-5A). The percent and total cell number of CXCR5 + CD150 lo T FH cells within the CD4 + CD44 hi population in the dlns of mice 12 days post-vaccination were calculated (Figure 2-5B and Figure 2-5C). It is assumed the induced T FH cell population is directed against primarily (but not exclusively) the HA protein in the VLPs, though this can be verified by assessing the T FH response to VLPs containing only the M1 protein. When examining the percent of T FH cells, the values were remarkably similar in VLP vaccinated mice, regardless of immunization route and were significantly higher than fixed virus vaccination (Figure 2-5B). The greatest total number of T FH cells was found in mice immunized with VLPs s.c. (Figure 2-5C). Interestingly, this group also had the largest GC response in terms of frequency and total cell number, and demonstrated the greatest degree of isotype switching throughout the response. This is likely a result of the degree of T FH cell induction early in the response, and is consistent with previous reports showing the magnitude and character of the GC response is directly related to the size of the T FH cell pool [72]. The ratio of GC B cells to T FH cells was determined for each
37 24 vaccination group, and independent of immunization route, the lowest values were observed with VLPs, with an approximate ratio of 10:1 (Table 2-1). Discussion Previous studies have demonstrated VLPs induce potent protective immune responses that are capable of inducing a broad range of cross-reactive Abs and provide complete protection against homologous and heterologous viral challenge. A critical component of this protection is mediated by influenza HA-specific neutralizing Abs produced by AFCs, the cellular product of the T cell-driven B cell response. While studies have examined the humoral immune response, characterization of the GC response that drives production of protective Abs has not been studied, nor has this response been compared to a conventional inactivated influenza vaccine. VLP vaccination clearly induces robust GC reactions in the dlns, however differences in the immune response were observed between immunization routes (Figure 2-1). In terms of total number of GC B cells recovered, the largest response was observed following s.c. vaccination at every time point analyzed. Given the similarity in the frequency of GC B cells between routes, these findings were initially surprising. However, the number of dlns involved in the response and thus the concentration of antigen likely account for these differences. Following s.c. vaccination in the footpad, virtually all of the antigen drains to the popliteal LNs, whereas i.m. vaccination in the back haunch allows antigen to be transported to the popliteal and inguinal LNs [72]. Notably, only popliteal LNs were collected following i.m. immunization. Intranasal
38 25 vaccination also involves multiple dlns, including the peribronchial and mediastinal LNs. Furthermore, due to their small size; VLPs are likely trapped in mucus after i.n. immunization, thus only a fraction of the administered dose enters mucosal inductive sites. Therefore, it stands to reason footpad vaccination facilitates the concentration of antigen, resulting in a higher antigen load and an enhanced GC response. Vaccination with influenza VLPs and fixed vaccine induced GC reactions in the dlns. However, independent of the route of immunization (s.c. or i.m.), the response to the fixed vaccine was not as robust compared to VLPs. In terms of frequency, VLPs induced significantly greater GC B cells at each time point tested, however there was no statistical difference when comparing total GC B cell numbers except on day 8 after i.m. vaccination (Figure 2-1B and Figure 2-1C). While the vaccination dose was different between VLPs and the fixed vaccine, 5µg and 20µg respectively, this is unlikely explain the variations observed. The difference in magnitude may be a result of β-propriolactone treatment. In theory, β-propriolactone inactivates the virus by modifying nucleic acids to inhibit replication, while leaving the outer virion coat intact. However, a recent study has shown β-propriolactone actually modifies amino acid residues more readily than nucleic acids [73]. β-propriolactone inactivation may therefore alter the integrity of surface proteins, thus decreasing its immunogenicity. Another factor that may contribute to the difference in magnitude between VLPs and fixed vaccine is the number of T FH cells. Based on frequency and total number, VLP vaccination resulted in a greater induction of T FH cells (Figure 2-5B and Figure 2-5C). These findings are consistent with previous work, which has demonstrated the magnitude of the GC response is directly linked to the number of T FH cells [72].
39 26 Further examination of the GC response in the dlns following vaccination also revealed differences in the isotype switching pattern between VLPs and the fixed vaccine. While the percent of switched GC B cells increased over the course of the response to VLPs, a steady-state ratio of non-switched IgM + to switched GC B cells was observed throughout the response to the fixed vaccine (Figure 2-2). These findings are independent of vaccination route; however, the most significant differences are observed following s.c. immunization. Once again, T FH cells may be responsible for these differences, as they produce cytokines that are class switch factors, providing necessary signals to facilitate CSR [70]. Since vaccination with VLPs induced a greater frequency and total number of T FH cells compared to the fixed vaccine, GC B cells induced by VLPs were therefore more likely to receive switching signals. While differences were observed in isotype switching patterns between VLPs and fixed vaccine (dynamic versus steady-state switching), the IgG subclass distribution of the switched GC B cells were remarkably similar between immunogens. Throughout the response, IgG2 (IgG2a + IgG2b) was the dominant isotype, with IgG1 and IgG3 constituting smaller subsets (Figure 2-3). In addition, a similar isotype distribution pattern is observed following IAV infection [57], indicative of a T H 1-biased cellular response. Considering influenza VLPs are composed only two viral proteins, HA and M1, and theoretically lack other PAMPs that play an important role in directing the immune response, these results were perplexing. Recent proteomic studies, however, may be able to explain this phenomenon, revealing a significant number of insect cell and baculovirus derived proteins in VLPs [74]. In addition, it was recently reported that baculovirusderived VLPs are more immunogenic than mammalian-derived VLPs [75]. Importantly,
40 27 they hypothesized this difference is due to residual baculovirus particles in the VLP preparations, which can trigger an innate immune response through activation of TLR9 [75]. While further studies will need to determine their effects, it is likely non-influenza components recognized by TLRs can enhance the immunogenicity of VLP vaccines. The serum Ab responses were analyzed for IgG subclass Abs, and expectedly, they reflected the composition of the GC B cell subsets defined by surface Ig isotypes. Similar titers were observed with VLPs s.c., and i.m., while VLPs i.n. induced the lowest titer, likely reflecting the magnitude of the dln response (the smallest compared to other vaccination routes). IgG2a was the dominant IAV-specific IgG Ab, regardless of vaccination route or immunogen, while IgG1, IgG2b, and IgG3 IAV-specific Abs were present in lower levels (Figure 2-4). Importantly, the serum Ab profile also closely resembles the serum Ab response to native IAV infection, once again underscoring the ability of VLPs to mimic natural infection and the T H 1 nature of the response. The levels of IgG2a anti-iav Abs were directly compared between the various immunogens and vaccination routes, and surprisingly, the fixed vaccine induced the highest titer (Figure 2-4B); yet significantly fewer IgG2 + GC B cells were induced compared to VLP vaccination (Figure 2-3). These findings are likely due to the Ab detection method; IAVspecific ELISAs use whole virus as the ELISA antigen, thus HA and NA epitopes are targets. However, unlike the fixed vaccine that can induce anti-ha and anti-na Abs, influenza VLPs can only induce anti-ha Abs. T FH cell induction was analyzed following vaccination as recent studies have demonstrated they are critical for the formation and maintenance of GCs. Based on percentage and total recovery, there were significantly greater T FH cells on day 12 post-
41 28 VLP vaccination compared to the fixed vaccine (Figure 2-5B). Interestingly, a more robust GC response (Figure 2-1) and larger degree of isotype switching (Figure 2-2) were also observed with VLP vaccination. These findings are likely a result of enhanced T FH cell induction, and are consistent with previous work that has shown the total number of induced T FH cells determines the magnitude and character of the GC response [72].
42 29 Figure 2-1. Immunization with influenza VLPs induces robust GCs in the dlns. Mice were immunized with fixed PR8 or influenza VLPs either s.c., i.m., or i.n. Draining lymph nodes (dlns) were harvested at various time points postimmunization and cell suspensions stained with anti-b220 mab and PNA to delineate GC B cells. (A) Representative plots demonstrating the gating strategy used to identify GC B cells (B220 + PNA hi ) from dlns of naïve (popliteal or lung dlns), fixed PR8, or VLP-vaccinated mice 12 days post-immunization. The value above each gate represents the individual percent of GC B cells from that sample. (B) Bar graphs depict the percent (left) and total number (right) of GC B cells in the popliteal LNs (plns) at various time points following s.c. immunization with VLPs (closed bars) or fixed PR8 (open bars). (C) Bar graphs show the percent (left) and total number (right) of GC B cells in the plns following i.m. immunization with VLPs (closed bars) or fixed PR8 (open bars). (D) Bar graphs represent the percent (left) and total number (right) of GC B cells in the lung dlns (ldlns) at the indicated time points following i.n. immunization with VLPs. Total cell numbers are expressed per lymph node. Statistical analyses were performed between mice vaccinated with VLPs and fixed PR8 at each time point using the unpaired Student s t test. Standard error bars represent mean ± SEM. n = 6-9 mice per group per time-point. *p < 0.05; **p < 0. 01; ***p <
43 30
44 31
45 32 Figure 2-2. GC B cells undergo isotype switching in the dlns following VLP immunization. Mice were immunized with fixed PR8 or influenza VLPs either s.c., i.m., or i.n.. Draining lymph nodes were harvested and single cell suspensions stained with anti- B220 mab, PNA, and anti-igm mab. (A) Representative plots demonstrating the gating strategy used to define non-switched (IgM + ) and switched (IgM - ) GC B cells in the dln on day 12 post-immunization with VLPs i.n. The value next to each gate represents the percent of non-switched (IgM + ) and switched (IgM - ) GC B cells from that sample. (B) Bar graphs depict the percent of non-switched (IgM +, closed bars) and switched (IgM -, open bars) B cells within the B220 + PNA hi GC population at various times following s.c immunization with VLPs (left) or fixed PR8 (right). (C) Bar graphs depict the percent of non-switched (IgM +, closed bars) and switched (IgM -, open bars) GC B cells after i.m. immunization with VLPs (left) or fixed PR8 (right). (D) Bar graphs depict the percent of non-switched (IgM +, closed bars) and switched (IgM -, open bars) GC B cells after i.n. immunization with VLPs. Statistical analyses were performed between IgM - GC B cells from mice vaccinated with VLPs and fixed PR8 at each time point using the unpaired Student s t test. Standard error bars represent mean ± SEM. n = 6-9 mice per group per time-point. ***p <
46 33
47 34 Figure 2-3. Distribution of isotype-switched GC B cells in the dlns following VLP immunization. Mice were immunized with fixed PR8 or influenza VLPs either s.c., i.m., or i.n.. Draining lymph nodes were harvested and single cell suspensions were stained with anti-b220 mab, PNA, and either goat anti-mouse IgG1, IgG2 (IgG2a + IgG2b), or IgG3 specific Abs. (A) Representative plots (from B220 + PNA hi parent gates) demonstrating the gating strategy used to define IgG1 +, IgG2 +, and IgG3 + GC B cells in the dln on day 12 post-immunization with VLPs i.n. IgG2a and IgG2b Abs were combined due to limited cell recovery. IgA + GC B cells are not included because they are infrequent in the dlns. The value above each gate represents the percent IgG1 +, IgG2 +, and IgG3 + GC B cells from that sample. (B) Bar graphs depict the percent of IgG + subsets within the B220 + PNA hi GC population at the indicated times following s.c immunization with VLPs (left) or fixed PR8 (right). (C) Bar graphs show the percent of IgG + subsets within the GC B cell population following i.m. immunization with VLPs (left) or fixed PR8 (right). (D) Bar graph illustrates the percent of IgG + subsets within the GC B cell population after i.n. immunization with VLPs. Standard error bars represent mean ± SEM. n = 6-9 mice per group per time-point.
48 35
49 36 Figure 2-4. IAV-specific serum Ab response. Mice were vaccinated with fixed PR8 or influenza VLPs either s.c., i.m., or i.n. Serum samples were collected at day 24 post-immunization and Ab responses were analyzed using an IAV-specific whole virus ELISA. (A) IAV-specific IgG1, IgG2a, IgG2b, and IgG3 Abs were detected in the sera of mice vaccinated with VLPs s.c. (top left), i.m. (top right), i.n. (bottom left), and fixed PR8 s.c. (bottom right). (B) Direct comparison of the dominant IgG Ab, IgG2a, levels in the sera of vaccinated mice. Standard error bars represent mean ± SEM. Results are representative of two separate ELISA tests with separate groups of mice. n = 3 mice per group.
50 37
51 38 Figure 2-5. T FH cell induction in the dlns following VLP vaccination. Mice were vaccinated with fixed PR8 or influenza VLPs either s.c., i.m., or i.n. Draining lymph nodes were harvested at day 12 post-immunization and single cell suspensions were stained with anti-cd4, anti-cd44, anti-cxcr5 and anti-cd150 mabs. (A) Representative plots demonstrating the gating strategy used to define CD4 + CD44 hi CXCR5 + CD150 lo T FH cells in VLP-vaccinated or naïve mice. The value above each gate represents the percent of T FH cells from that sample. (B) Bar graph depicts the percent of CXCR5 + CD150 lo T FH cells within the CD4 + CD44 hi population from dlns of vaccinated mice. (C) Bar graph represents the total number of T FH cells in mice immunized with VLPs or fixed PR8. Total cell numbers are expressed per lymph node. Statistical analyses were performed between mice vaccinated with VLPs and fixed PR8 using the unpaired Student s t test. Standard error bars represent mean ± SEM. n = 6 mice per group. *p < 0.05; **p <
52 39
53 40 Table 2-1. Total GC B cells and T FH cells in the dlns 12 days post-challenge. Vaccine/route Total number of GC Total number of T FH Ratio GC B B cells 1 cells 2 cells/t FH VLPs s.c x 10 5 ± 5.38 x x 10 3 ± 8.89 x VLPs i.m x 10 4 ± 3.47 x x 10 2 ± 3.19 x VLPs i.n x 10 4 ± 2.80 x x 10 3 ± 3.63 x Fixed i.m x 10 3 ± 5.12 x x 10 2 ± 1.07 x Total number of GC cells per node 2 Total number of T FH cells per node
54 41 CHAPTER III T CELL DRIVEN B CELL RESPONSE IN THE UPPER AND LOWER AIRWAY FOLLOWING VIRUS-LIKE PARTICLE VACCINATION Introduction Mucosal immunity Immune responses at mucosal surfaces are the first and most significant barriers in preventing viral infections, including influenza. In the upper respiratory tract, local immune responses are induced in the nasopharyngeal-associated lymphoid tissue (NALT), while the response in the lower airway occurs in induced bronchus-associated lymphoid tissue (ibalt) [8]. The NALT consists of a pair of lymphoid structures situated above the soft palate and is an inductive site for virus-specific cellular immune responses, providing local secretory IgA (S-IgA) and neutralizing Abs that are critical for protection against infection [8]. Importantly, vaccination studies have demonstrated nasal immunization evokes local mucosal immune responses more effectively than other routes [33,34]. Unlike the NALT, which is constitutively present, formation of ibalt occurs upon encounter with certain infections, chronic inflammation, or autoimmunity [76,77]. Once formed, this ectopic lymphoid structure enhances and accelerates primary immune responses to subsequent respiratory virus infections, resulting in decreased morbidity and mortality [77]. While the mechanisms that control ibalt induction and its role in respiratory immunity are not completely understood, previous studies from our laboratory
55 42 and others have demonstrated GC induction in the lungs following infection with IAV [57,78]. Respiratory mucosal immune response to IAV infection The kinetics and character of the IAV-induced GC response were recently examined by Boyden et al. [57] and data concerning the upper and lower airway will be briefly reviewed. Upon IAV infection, GC B cell populations were observed between days 8 and 30 in the lungs and NALT. The percent of GC B cells in the NALT peaked at day 12 post-infection and were maintained into the fourth week after challenge, while the peak of the response in the lungs occurred at day 24 post-infection (based on total number of GC B cells) [57]. Further characterization of the GC response revealed that the majority of GC B cells in the NALT were IgM + early, but as the response matured IgM + and IgG + GC B cells were present in equal proportions. Interestingly, the NALT contained a population of IgA + cells, representing 10-15% of the GC response at each time point tested. In the lungs, an equal proportion of IgM + and switched GC B cells were observed throughout the response. Of the switched GC B cells, IgG2 + cells represented the largest subset, while IgG1 + and IgG3 + cells were minor constituents. IAV-specific Ab levels in the bronchoalveolar lavage (BAL) were evaluated by ELISA and revealed high titers of both IgG and IgA. Of the IAV-specific IgG Abs, IgG2a composed the majority. These data are consistent with previous studies and underscore the T H 1 nature of the response to IAV infection.
56 43 Mucosal vaccination Influenza VLP studies have demonstrated i.n. vaccination provides protective immunity, however these studies have only examined mucosal and systemic Ab responses [51,54,62]. Induction of local immune responses in the upper and lower airway following i.n. VLP vaccination has not been examined at the cellular level. Since VLPs are non-replicative and should not contain viral genetic material, they theoretically lack TLR agonists that play a key role in shaping the immune response to IAV. Thus, it was unclear how the immune response to VLP vaccination would compare to natural infection with influenza virus. To address these questions, this chapter will examine the cellular response in the upper and lower airway following VLP vaccination. Hypothesis We hypothesize that i.n. immunization with influenza VLPs will induce a GC response in the upper and lower airways that is T H 1-biased, similar to the response induced by natural infection with IAV. Materials and Methods Mice Specific pathogen free female BALB/c mice were purchased from NCI and housed in barrier rooms at the University of Iowa Animal Care Facility. All mice used in experiments were at least 8 weeks of age. Animal procedures were approved by the
57 44 University of Iowa Institutional Animal Care and Use Committee in accordance with The Association for Assessment and Accreditation of Laboratory Animal Care International (AAALAC International) and PHS Animal Welfare mandates. Preparation of antigens and immunizations Influenza VLPs containing HA and M1 proteins (derived from H1N1 (A/PR/8/1934)) were prepared using the recombinant baculovirus (rbv) expression system as described previously [51]. Mice were anesthetized by isoflurane inhalation and immunized intranasally with 10µg VLPs or a sublethal 0.1LD 50 dose of mouse-adapted influenza A virus (A/PR/8/34 (PR8) H1N1) suspended in 50 µl serum-free Iscove s media. Flow cytometry Whole lungs were harvested from immunized mice and ground through wire mesh to obtain single-cell suspensions. NALT was excised from the upper palate as previously described [79], pooled, and minced with frosted slides to obtain single-cell suspensions. Cell suspensions were washed with balanced salt solution, subjected to Fico/Lite-LM (Atlanta Biologicals, Norcross, GA) density centrifugation to obtain viable mononuclear cells, and resuspended in staining buffer (balanced salt solution, 5% bovine calf serum, and 0.1% sodium azide). 5 x 10 5 to 1 x 10 6 cells were stained with combinations of fluorochrome-conjugated antibodies to identify various cell subsets. Non-specific binding of conjugated Abs was inhibited by blocking cells with 10 µl of rat serum (Pel Freez, Rogers, AR) and 10µg of 2.4G2, an anti-fcγr monoclonal Ab. The rat
58 45 anti-mouse mabs used were anti-igm (b76) and anti-b220 (6B2) The goat anti-mouse Abs used were biotin-labeled anti-igg1, -IgG2a, -IgG2b, -IgG3, and -IgA (Southern Biotechnology Associates, Birmingham, AL). FITC-conjugated peanut agglutinin (PNA) was purchased from Vector Laboratories (Burlingame, CA). 2.4G2, b76 and 6B2 were semi-purified from HB101 serum-free supernatants using 50% ammonium sulfate precipitation. b76 was conjugated to biotin (Sigma-Aldrich, St. Louis, MO) and 6B2 was conjugated to Cy5 (Amersham Pharmacia, Piscataway, NJ) using standard procedures. Purified rat IgG (Jackson Immunoresearch Laboratories, West Grove, PA) was biotin, Cy5, and FITC conjugated and used for isotype controls. Primary mabs and PNA were added to cells and incubated for 20 minutes on ice. Cells were then washed twice with staining buffer and PE-conjugated streptavidin (Southern Biotechnology Associates) was added to detect biotinylated Abs. Stained cells were analyzed on a BD FACS Canto II flow cytometer (Becton Dickinson, San Jose, CA) and analyzed with FlowJo software (Tree Star, Ashland, OR). IAV-specific ELISA Influenza virus-specific antibody subtypes were determined in d24 postimmunization BAL by ELISA as previously described [57]. Briefly, 96-well microtiter plates (Nalgene Nunc International, Rochester, NY) were coated with 2.85x10 4 TCID 50 (per well) PR8 IAV in 100µl carbonate coating buffer and incubated at 4 C overnight. The next day, virus was removed and plates were blocked with 1% BSA for 1 hour at 37 C. BAL samples were added with an initial dilution of 1:5 and serially diluted down the length of the plate at a 1:2 dilution. Plates were incubated for 1.5 hours at 37 C, then
59 46 washed three times with PBS-Tween buffer. IAV-specific BAL Ab responses were detected with biotinylated goat anti-mouse IgG and IgA Abs (Southern Biotechnology Associates). Streptavidin-alkaline phosphatase (Invitrogen, Carlsbad, CA) and phosphatase substrate (Sigma-Aldrich) was used to develop color. Optical density was read at 405nm on an EL311 Microplate Autoreader from Bio-Tek Instruments (Winooski, VT). Statistical analysis The unpaired Student s t test was used to assess statistical significance using the GraphPad InStat software program (La Jolla, CA). Results Intranasal immunization with influenza VLPs induces GCs in the lungs Previous studies from our laboratory and others have demonstrated the formation of GCs in the lung following pulmonary virus infection [57,76,80]. Additionally, studies with influenza VLPs have shown i.n. immunization induces a mucosal immune response resulting in neutralizing and cross-reactive antibodies [52,54,62]. These studies have measured Ab responses in the upper (nasal wash) and lower airways (BAL and lung homogenate), but have not addressed where these Abs come from. Therefore, the B cell response in the lung was evaluated. BALB/c mice were immunized i.n. with influenza VLPs and the lungs were harvested at various time points post-vaccination. Single cell
60 47 suspensions were prepared as previously described and assessed by multicolor flow cytometry. Initially, a dose response was performed: 5.0, 10, or 50µg VLPs were administered i.n. and the pulmonary GC response was evaluated days postimmunization (Figure 3-1A). Of the three doses, 50µg induced the most robust response when measuring the percent and total number of GC B cells in the lungs and dln (Figure 3-1A and Figure 3-1B). However, whether assessing percentage or total GC B cell numbers, the responses in the lung after a 10µg or 50µg challenge were not statistically different. Due to limited substrate availability, the 10µg dose was used for the remaining i.n. vaccination studies. Expectedly, the lungs of naïve mice did not contain a GC B cell population (Figure 3-2A). Upon immunization with VLPs, GC B cells were observed in the lungs (Figure 3-2A). For comparison, the GC response in lungs of influenza-infected mice is shown (data provided by Alex Boyden). Interestingly, the kinetics and magnitude late in the response were quite different between VLP vaccinated and IAV-infected mice. Based on percent and total number, the GC B cell response was remarkably similar between VLP vaccinated and IAV-infected mice at early time points (days 8 and 12). The peak of the response to VLP vaccination, measured by total number of GC B cells, was on day 12 post-challenge (Figure 3-1B). The response following IAV infection, on the other hand, did not peak until day 24 post-infection [57] and the total number of GC B cells was an order of magnitude greater than VLPs (Figure 3-1C). These differences, while striking, are not surprising for a number of reasons: (i) IAV infects and replicates in epithelial cells of the upper airway, thus exponentially increasing the amount of viral antigen, while VLPs are non-replicative and therefore the response is generated against a fixed number
61 48 of particles; (ii) VLPs theoretically lack many TLR agonists that play a significant role in the B cell response to IAV infection; (iii) recent studies have demonstrated the persistence of viral antigen in the lungs following infection with IAV [81], a phenomenon that likely does not occur with VLP vaccination. Despite these differences, studies have demonstrated VLP vaccination confers complete protection against lethal IAV challenge [53,63,64,82,83,84,85,86]. It would appear that VLPs are sufficiently immunogenic to generate a protective humoral response, but this response may be focused in sites other than the lung, such as the dlns (Figure 2-1) or upper airway (Figure 3-5). Isotype distribution of GC B cells in the lung after vaccination with VLPs Pulmonary infection with IAV induces a GC response in the lungs that exhibits site-specific isotype switching [57]. To determine if VLP vaccination induces a similar pattern of switching in the lungs, IgM + and isotype switched IgM - GC B cells were assessed. Figure 3-3A is a representative plot demonstrating the gating strategy used to define IgM + and IgM - GC B cells. There was a steady-state ratio of switched to nonswitched GC B cells throughout the response to VLPs, with approximately 45% GC B cells expressing a switched phenotype (Figure 3-3B). Interestingly, a similar pattern was observed following IAV infection (Figure 3-3C, [57]). Compared to the dln response (Figure 2-2D), there was a greater frequency of IgM + non-switched GC B cells in the lungs, 60% versus 45% in the dlns after VLP challenge. To further examine the population of isotype switched GC B cells in the lungs, surface expression of IgG1, IgG2 (IgG2a + IgG2b), and IgG3 was determined over the
62 49 course of the response. Switched GC B cells expressing IgA in the lungs were rare, comprising less than four percent of the GC B cell pool. Representative plots illustrating the gating strategy used to identify IgG1 +, IgG2 +, and IgG3 + B220 + PNA hi GC B cells are shown in Figure 3-4A. At each time point analyzed, IgG2 was the dominant isotype among the switched GC B cells (Figure 3-4B), similar to IAV infection (Figure 3-4C, [57]). IgG1 + and IgG3 + GC B cells were present, but were a minor constituent. Based on frequency, there were significantly fewer IgG1 + and IgG3 + GC B cells at each time point, except day 12, compared to the response observed with IAV infection (Figure 3-4B and Figure 3-4C). These findings may be explained by modest differences in the cytokine milieu induced by each stimulus. Specifically, several differences between VLPs and IAV, such as infectivity, replicative capacity, and viral antigens may affect the activation and differentiation of T H cells, which secrete cytokines to direct isotype switching. Overall, however, the isotype distribution of switched GC B cells was similar in VLP vaccinated and IAV infected lungs. These data indicated i.n. immunization with influenza VLPs induces a T H 1 biased response in the lungs, closely mimicking the immune response following natural infection with IAV. GC B cells in the NALT following VLP vaccination Previous influenza VLP studies have shown i.n. vaccination induces neutralizing and cross-reactive antibodies in the mucosa [52,54,62]. Specifically, they have identified IgA + AFCs in upper (nasal) and lower (tracheal and lung) respiratory tract washes [52,54,62]. Analysis of the GC B cell populations in the lungs and dlns revealed very few IgA + GC B cells, thus the source of IgA + AFCs remains to be elucidated. In the
63 50 mouse, the NALT is the only mucosal-associated lymphoid tissue in the upper airway [8]. Previous studies have shown i.n. immunization with an inactivated IAV vaccine elicited antigen-specific B-cell responses in the NALT that were dominated by IgA + AFCs [87]. In addition, IAV infection induced a GC response in the NALT which contained isotype switched IgA + GC B cells [57]. Based on these findings, the NALT from VLP-vaccinated mice was examined. Mice were immunized i.n. with 10µg VLPs, NALT was harvested at various time points post-immunization and subjected to flow cytometric analysis. Depicted in Figure 3-5A are representative plots of the B220 + PNA hi GC B cell population within the viable lymphocyte gate from NALT of naïve, VLP-vaccinated, and IAV-infected mice. As expected, the NALT of naïve mice did not have a distinct GC B cell population, and while background levels were higher than other tissues examined (dln and lung), this is likely a consequence of anatomical location and constant antigen exposure. Challenge with VLPs induced a robust GC B cell population in the NALT, comparable to the previously documented response to PR8 infection (Figure 3-5A, [57]). The kinetics and magnitude of the response was remarkably similar between the VLPs and IAV, with the peak at day 12 post-challenge (Figure 3-5B). Total cell numbers are not shown due to the inherent difficult in harvesting NALT in a quantitatively precise manner. The response in the NALT was further characterized by examining the isotype distribution of GC B cells (Figure 3-6A). At day 8 post-challenge, the majority of the GC B population was composed of non-switched IgM + GC B cells (Figure 3-6A). As the response matured, approximately equal proportions of switched and non-switched GC B cells were observed (Figure 3-6A). Within the switched population, IgA + GC B cells were detected,
64 51 representing 5-15% of the GC response at each time point (Figure 3-6B). Isotype distribution of GC B cells in the NALT following VLP vaccination was similar to that observed after IAV infection. These data suggest that NALT may be a source of IgA + AFCs in the upper airway, capable of secreting IAV-specific IgA Abs. IAV-specific BAL Ab response Given the modest and short-lived GC response in the lung after i.n. VLP challenge, it was of interest to assess local Ab production. BAL samples were therefore collected 24 days post-immunization and Ab responses were analyzed using an IAVspecific whole virus ELISA (Figure 3-7). Relative levels of IgG and IgA anti-iav Abs were compared between VLP-vaccinated and IAV-infected or naïve uninfected mice. Upon VLP vaccination, a modest level of IgG anti-iav Abs were detected, however, virtually no IgA anti-iav Abs were found (Figure 3-7). Ab responses in BAL following IAV infection, on the other hand, had high levels of IgG and IgA Abs specific for the virus (Figure 3-7, [57]). Lack of IgA anti-iav Abs in the BAL following VLP vaccination was surprising, however this may be a reflection of the overall poor ability of VLPs to generate strong and sustained ectopic GC responses after challenge. Alternatively, because IgA AFCs have a relatively short half-life (approximately six days) [88], higher levels may have been detected if BAL samples were analyzed earlier in the response.
65 52 Discussion A number of previous reports have shown i.n. immunization with influenza VLPs effectively induces systemic and mucosal immune responses resulting in long-lived antibody responses that provide complete protection against lethal challenge with homologous or heterologous virus strains [51,52,62]. Studies have also demonstrated high levels of mucosal IgG and IgA IAV-specific Abs can be detected in the upper and lower airway after i.n. VLP vaccination [51,52]. While local (and systemic) antibody responses have been examined extensively, the current study is the first to characterize GC responses in the upper and lower airway following i.n. VLP vaccination. Intranasal vaccination with influenza VLPs induced a relatively small and transient GC reaction in the lungs. Early in the response (days 8 and 12), the percentage and total number of GC B cells were similar to the response following natural infection with IAV (Figure 3-2). However, at later time points, the kinetics and magnitude were quite different. The height of the VLP response occurred 8-12 days post-vaccination, and then quickly waned, returning to baseline by day 24. The response to IAV, on the other hand, reached its peak 24 days post-infection, at which time the total number of GC B cells was approximately ten times greater than the maximal response to VLPs. Despite these differences, a similar isotype switching pattern was observed between VLPs and IAV, with a fairly steady ratio of IgM + non-switched to switched GC B cells throughout the response (Figure 3-3). Within the population of switched GC B cells, IgG2 was the dominant isotype at each time point analyzed (Figure 3-4), similar to the findings in the
66 53 dln (Figure 2-3). These data demonstrate, therefore, VLPs induce a T H 1-biased response, mimicking the response to natural infection with IAV. Though the basis for the differences in kinetics and magnitude of the GC response between VLPs and IAV is not well understood, a possible explanation may be the inability of VLPs to induce sufficient ibalt. VLPs contain viral antigens, insect celland baculovirus-derived contaminating elements that engage pattern recognition receptors and initiate a T H 1-biased response [74,75], however, it is likely they do not contain or invoke the necessary signals that lead to the formation of well-established ibalt (although the required signals are not known, inflammatory stimuli are believed to be important). While we do not have any direct evidence, our data suggest VLPs induce local lymphoid aggregates that are capable of supporting small, short-lived pulmonary GCs. As a result, a sufficient AFC response was not established in the lung, and consequently, very little IgG and IgA Abs were detected in the BAL (Figure 3-7). The magnitude of the pulmonary GC response to VLP vaccination was relatively modest, however, a robust GC response was observed in the upper airway. Immunization with influenza VLPs resulted in strong GC responses in the NALT; the kinetics and magnitude of which closely resembled the response to IAV (Figure 3-5). Although it was not examined in the present study, the NALT GC response likely led to a local response (AFCs and Abs, especially siga) in the upper mucosa, thus providing protective Abs at the site of administration. In addition to mucosal immunity, induction of systemic immunity by virtue of the dln response (data presented in Chapter II) contributes to the protective capacity of i.n. VLP vaccination. Finally, preliminary results by Hemann and Legge demonstrate i.n. VLP challenge leads to the induction of HA-specific CTLs
67 54 (personal communication). One could argue, therefore, that collectively these responses are sufficient to block a viral challenge in the absence of a robust, long-lived humoral response in the lung. Taken together, our data suggest i.n. immunization with VLPs fails to induce a local, sustained Ab response in the lung. However, a number of previous reports have concluded i.n. vaccination with VLPs does in fact induce local humoral immune responses. The findings from these studies will be reviewed briefly. In a study from 2007, Kang and colleagues demonstrated that i.n. immunization with VLPs containing influenza (H1N1) proteins HA and M1 induces mucosal immune responses. Using two different immunization strategies, 40µg of VLPs two times (weeks 0 and 3) or 10µg of VLPs three times (weeks 0, 3, and 6), influenza-specific Ab responses were measured in mucosal samples from the nose, trachea, and lungs of mice 4.5 weeks after the final immunization [51]. Modest levels of IAV-specific IgG Abs were observed in nasal washes while moderate to high levels were found in the trachea (BAL) and lung extracts of mice immunized with 40µg (2x) or 10µg (3x) VLPs [51]. IAVspecific IgA Abs were also observed in the lungs of immunized mice, although the levels were much lower compared to IgG [51]. Interestingly, after challenge infection with IAV, significant increases in virus-specific IgG Abs were found in all mucosal samples (nose, trachea, and lungs) [51]. Higher levels of lung IgA Abs were also observed after challenge, and surprisingly, the greatest response was in the group immunized three times with 10µg of VLPs [51]. This study demonstrates Ab responses in the upper and lower airway are effectively induced after a multi-dose challenge regimen, and these responses can be rapidly expanded upon viral challenge.
68 55 In a subsequent study, Kang and colleagues examined the immune response to influenza VLPs containing HA, NA, and M1 from a highly pathogenic avian strain, H5N1 [52]. Mice were i.n. vaccinated with VLPs containing H5 HA at weeks 0 and 4, and mucosal Ab responses measured. Significant levels of virus-specific IgG Abs were induced in nasal and tracheal washes and lung extracts, while virus-specific IgA Abs were only detected in lung extracts [52]. Upon challenge with an inactivated H5N1 virus, virus-specific IgG Abs increased significantly in all mucosal samples, however, an increase in IgA was only observed in the trachea [52]. These data reveal, therefore, i.n. delivery of two influenza H5N1 VLP doses induces mucosal Ab responses in the upper and lower airway, which can be expanded upon subsequent antigen challenge. Using VLPs derived from the RNA bacteriophage Qβ, Bachman and colleagues examined the systemic and mucosal Ab responses following i.n. vaccination [60]. It is important to note these VLPs contained E. coli-derived ssrna [60]. Upon immunization of mice with a single dose of 50 or 100µg of Qβ-VLPs, IgG and IgA Abs specific for the VLPs were detected in sera and BAL [60]. In addition, a significant number of Qβ-VLPspecific IgG- and a moderate number of IgA- producing AFCs were found in the dlns (mediastinal LNs) and lung [60]. However, histological analysis of lung tissue failed to reveal ibalt or GC-like structures. Bachman postulated, therefore, IgA was locally produced by AFCs that migrated from the dlns to the lung. In another study, Harmsen and colleges utilized two VLP-like immunomodulatory antigens, small heat shock protein cage nanoparticles (shsp) and P22 phage-derived VLP to elicit local lung Ab production [89]. Rather than measuring the response to a single dose, these studies used multiple doses of shsp and P22 to prime the lung before antigen
69 56 challenge. They found that i.n. pretreatment with 100µg of shsp or P22 daily for five days accelerates and intensifies the humoral response in the lung when challenged with OVA conjugated to shsp (OVA-sHsp) or IAV [89]. This finding was likely due to the ability of particle pretreatment (shsp or P22) to induce ibalt, thereby providing a preexisting lymphoid structure for rapid responses to subsequent OVA or IAV challenge [89]. Importantly, they also showed OVA-sHsp challenge in the absence of pretreatment induced low levels of IgG and virtually no IgA, similar to our studies. Collectively, these studies clearly demonstrate the induction of systemic and mucosal immune responses following VLP vaccination. However, similar to our findings, they indicate local sustained lung responses cannot be induced after a single i.n. immunization, and required multiple exposures and/or the inclusion of inflammatory stimuli.
70 57 Figure 3-1. Dose dependent induction of GCs in the lungs and dlns after intranasal immunization with influenza VLPs. Mice were immunized i.n. with 5µg, 10µg, or 50µg VLPs. Lungs and dlns were harvested days post-immunization and cell suspensions stained with anti-b220 mab and PNA to identify the GC B population. (A) Bar graphs depict the percent (left) and total number (right) of GC B cells after i.n. vaccination with the indicated VLP dose in the lungs. Statistical analyses were performed using the ANOVA test to compare GC B cell induction between each dose. (B) Bar graphs depict the percent (left) and total number (right) of GC B cells in the dlns following i.n. vaccination with the indicated VLP dose. Statistical analyses were performed using the unpaired Student s t test to compare GC B cell induction between groups vaccinated with 10µg and 50µg VLPs. The dlns from the group that received 5µg VLPs were pooled due to limited cell recovery and thus statistical analysis could not be performed. Standard error bars represent the mean ± SEM. n = 3-6 mice per group. *p < 0.05; **p < 0. 01; ***p <
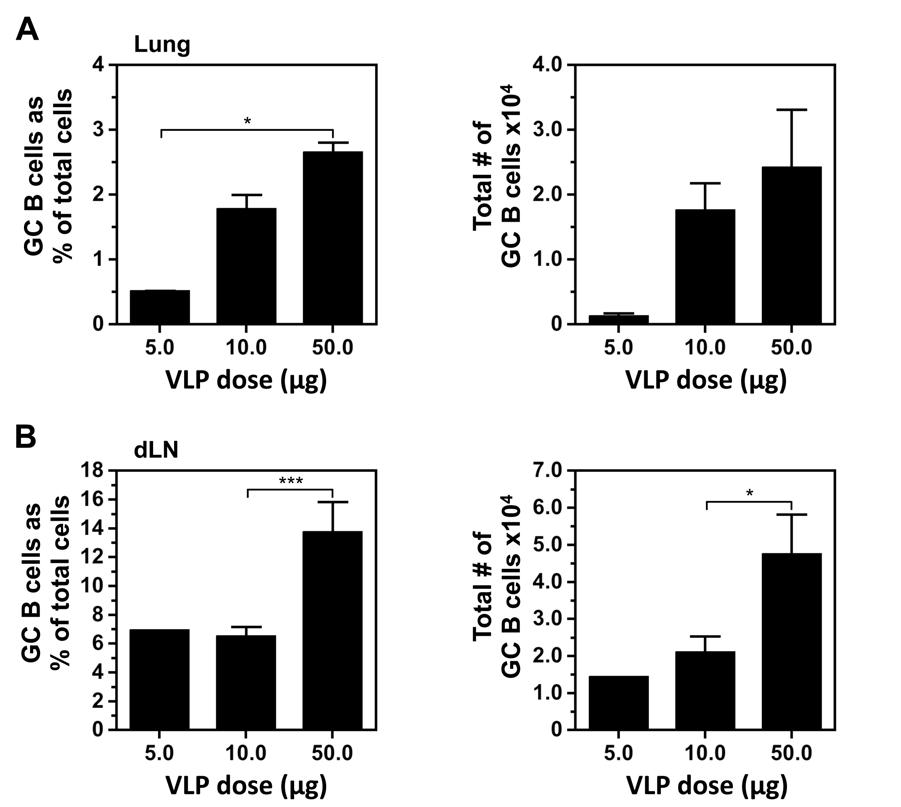
71 58
72 59 Figure 3-2. Intranasal immunization with influenza VLPs induces GCs in the lungs. Mice were immunized i.n. with 10µg VLPs. Lungs were harvested at various time points post-immunization and cell suspensions stained with anti-b220 mab and PNA to delineate GC B cells. (A) Representative plots demonstrating the gating strategy used to identify GC B cells (B220 + PNA hi ) from the lungs of naïve, VLP-vaccinated, or PR8-infected (0.1LD 50 dose of IAV) mice 12 days post-challenge. The value above each gate represents the individual percent of GC B cells from that sample. (B) Bar graphs depict the percent (top) and total number (bottom) of GC B cells in the lungs at the indicated time points after i.n. VLP vaccination. (C) Bar graphs depict the percent (top) and total number (bottom) of GC B cells in the lungs of mice infected with a 0.1LD 50 dose of PR8 (data provided by Alex Boyden). Standard error bars represent mean ± SEM. n = 6-9 mice per group per time-point.
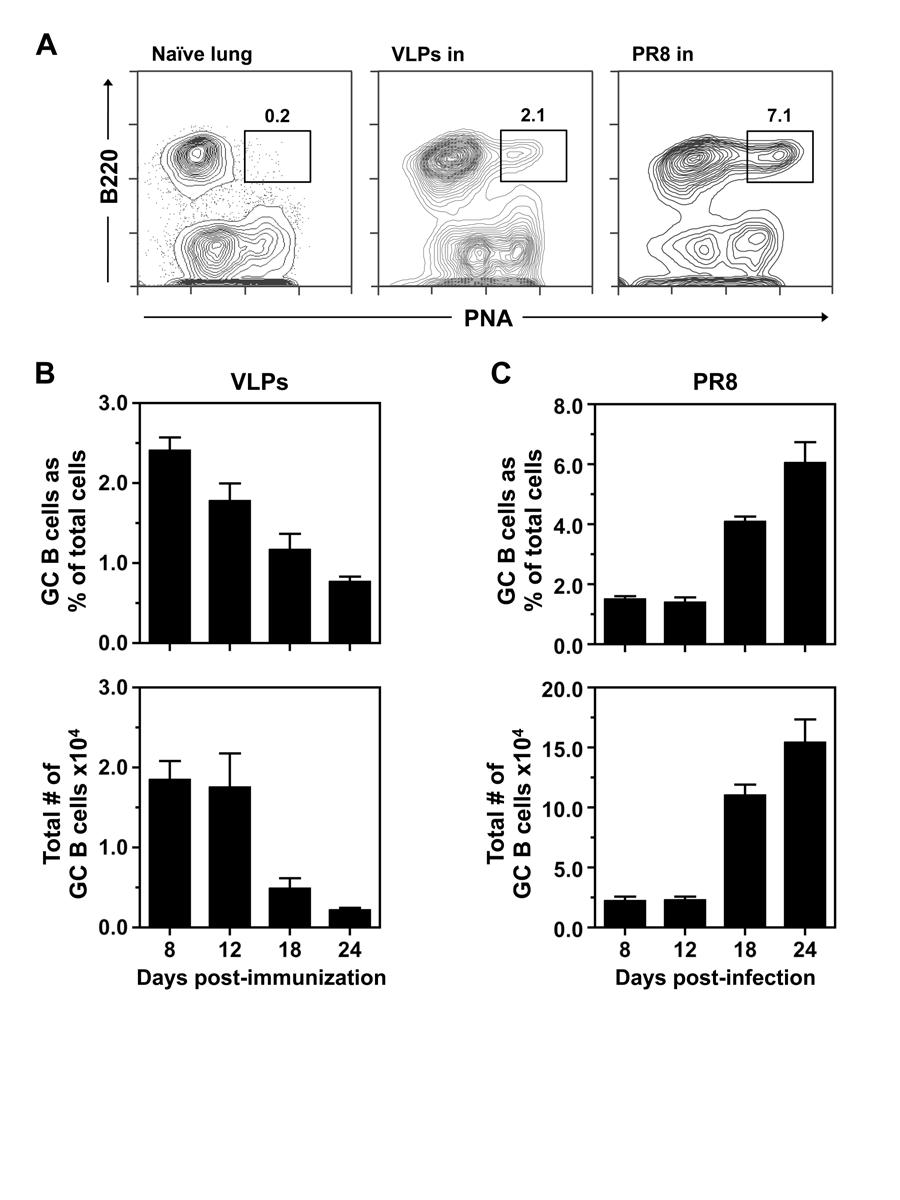
73 60
74 61 Figure 3-3. GC B cells undergo isotype switching in the lungs following VLP vaccination. Lungs were harvested and single cell suspensions stained with anti-b220 mab, PNA, and anti-igm mab. (A) Representative plot demonstrating the gating strategy used to define non-switched (IgM + ) and switched (IgM - ) GC B cells in lungs on day 12 after i.n. immunization with VLPs. The value next to each gate represents the percent of non-switched (IgM + ) and switched (IgM - ) GC B cells in that sample. (B) Bar graph shows the percent of non-switched (IgM + ) and isotype switched (IgM - ) GC B cells in the lungs after vaccination with VLPs i.n. (C) Bar graph illustrates the percent of nonswitched (IgM + ) and isotype switched (IgM - ) GC B cells in the lungs after challenge with a 0.1LD 50 dose of PR8 (data provided by Alex Boyden). Standard error bars represent the mean ± SEM. n = 6-9 mice per group per time-point.
75 62
76 63 Figure 3-4. Distribution of isotype-switched GC B cells in the lungs after VLP vaccination. Lungs were harvested and single cell suspensions stained with anti-b220 mab, PNA, and IgG subclass-specific Abs (either IgG1, IgG2 (IgG2a + IgG2b), or IgG3) to analyze the surface IgG isotype of switched GC B cells. (A) Representative plots (B220 + PNA hi parent gate) demonstrating the gating strategy used to define IgG1 +, IgG2 +, or IgG3 + GC B cells in the lungs 12 days post-immunization with VLPs. The value above each gate represents the percent IgG1 +, IgG2 +, and IgG3 + GC B cells from that sample. (B) Bar graph depicts the percent of isotype switched IgG + subsets within the GC B cell population at the indicated time points in the lungs following i.n. VLP vaccination. (C) Bar graph illustrates the percent of isotype switched IgG + subsets within the GC B cell population at the indicated time points after challenge with a 0.1LD 50 dose of PR8 (data provided by Alex Boyden). Standard error bars represent mean ± SEM. n = 6-9 mice per group per time-point.
77 64
78 65 Figure 3-5. NALT formation following i.n. immunization with influenza VLPs. Mice were immunized i.n. with 10µg VLPs. NALT was harvested at various time points post-immunization and single cell suspensions stained with anti-b220 mab and PNA to identify GC B cells. (A) Representative plots of the B220 + PNA hi GC B cell population within the viable lymphocyte gate in the NALT of naïve, VLP-vaccinated, or PR8-infected (0.1LD 50 dose of PR8) mice 12 days post-challenge. The number above each gate represents the percent of GC B cells of the particular sample shown. (B) Bar graph depicts the percent of GC B cells in the NALT at the indicated time points following VLP vaccination (closed bars) or PR8 infection (open bars). PR8 data provided by Alex Boyden. n = 1-3 experiments per time-point containing pooled NALT from 4 mice.
79 66
80 67 Figure 3-6. Isotype distribution in the NALT following VLP vaccination. Mice were immunized i.n. with 10µg VLPs. NALT was harvested at various time points post-immunization and single cell suspensions stained with anti-b220 mab, PNA, and either anti-igm mab, goat anti-mouse IgG cocktail (IgG1, IgG2a, IgG2b, and IgG3 specific Abs), or goat anti-mouse IgA specific Ab. (A) Bar graphs represent the percent of non-switched (IgM + ) and isotype switched (IgM - ) GC B cells at the indicated time points in the NALT from VLP vaccinated (left) or PR8 infected (right) mice. (B) Bar graphs represent the percent of IgM +, IgG +, and IgA + GC B cells in the NALT at the indicated time points following VLP vaccination (left) or PR8 infection (right). PR8 data provided by Alex Boyden. n = 1-3 experiments per time-point containing pooled NALT from 4 mice.
81 68
82 69 Figure 3-7. IAV-specific Ab response in BAL fluid of VLP vaccinated mice. Mice were vaccinated i.n. with 10µg influenza VLPs. BAL samples were collected at day 24 post-immunization and Ab responses were analyzed using an IAV-specific whole virus ELISA. IAV-specific IgG (top) and IgA (bottom) Abs were tested in BAL samples collected from mice vaccinated i.n. with VLPs and compared to either PR8- infected (left) or naïve uninfected mice (right). Standard error bars represent mean ± SEM. Results are representative of two separate ELISA tests with separate groups of mice. n = 3 mice per group.
83 70
84 71 CHAPTER IV REGULATION AND ENHANCEMENT OF THE GERMINAL CENTER RESPONSE TO IAV AND VLPS Introduction Our studies and others have demonstrated VLPs are immunogenic and induce systemic Abs, however, we found the magnitude and kinetics of the response is quite different compared to natural infection with IAV. Intranasal vaccination with VLPs induced a robust GC response in the dlns, but a modest and transient response in the lungs. Infection with IAV, on the other hand, induced potent and sustained responses in the lungs, in addition to strong GC reactions in dln. While VLPs and IAV differ in many regards, such as infectivity and replicative capacity, the specific elements that contribute to differences in the immune response remain unknown. Therefore, we sought to address two related aspects of the GC reaction: regulation and enhancement. Towards this end, studies were aimed at assessing Treg involvement and the effects of inhibiting their suppressive activity, and the role of TLR agonists in enhancing the immune response to VLPs and/or IAV. T regulatory cells T regulatory (Treg) cells that develop in a Foxp3-dependent manner represent a unique subset of T cells that possess regulatory properties capable of controlling T H cellmediated Ab responses [65,90,91,92]. While their mechanism of regulation remains
85 72 poorly understood, previous work from our laboratory and others has demonstrated the ability of Tregs to enter the B cell follicle and influence GC responses in secondary lymphoid tissues [65,90,91,92]. In addition, studies have shown Tregs play a role in ibalt formation, as CCR7-deficient mice spontaneously develop BALT due to an inability of Tregs to properly home [93]. This study is noteworthy as it suggests that under basal conditions, Tregs in the lung suppress ibalt and GC formation to inert particles or antigens that do not have sufficient danger signals to alert the innate immune system. Recently, it was determined that Treg control of GC responses is limited to a subset of Tregs known as T follicular regulatory (T FR ) cells [90,91,92]. These studies demonstrated T FR cells localize to GCs in secondary lymphoid organs and regulate the magnitude and character of the resulting Ab response by limiting the size of the T FH cell compartment, and inhibiting the selection of GC B cells. TLR agonists as vaccine adjuvants TLRs play a critical role in shaping immune responses to pathogens and have been shown to improve vaccine efficacy. While there are only a few licensed adjuvants available for vaccines in humans, several TLR-based adjuvants are currently in clinical and pre-clinical trials [94]. In fact, a handful of influenza VLP studies have examined the effects of adding TLR-based adjuvants. In one study, chimeric VLPs were developed to express membrane-bound flagellin, a TLR-5 ligand. The authors demonstrated chimeric VLPs were more immunogenic compared to standard VLPs and importantly, they found this adjuvant effect was dependent on the physical association of VLPs and flagellin [45]. Another study examined the effect of adding CpG, a TLR-9 agonist, to the VLP vaccine.
86 73 Although the serum Ab response was not enhanced with VLPs plus CpG, and viral titers in nasal tissue and lungs were not significantly different, mice that received CpG were able to clear the virus 2 days earlier than the group vaccinated with VLPs alone [95]. Inactivated IAV vaccines In addition to providing TLR agonists along with VLPs, an alternative approach is to immunize with inactivated virus. Although inactivated viruses are no longer lytic, they are still immunogenic and contain many of the same danger signals as the wild type virus. Many different inactivation methods have been used for influenza virus including: chemical treatment with formalin or β-propriolactone, γ-irradiation, UV irradiation, and heat treatment [96]. Chemical treatment is the current method used in the production of inactivated influenza vaccines, however, it can not be safely administered i.n., so other inactivation methods were explored. γ-irradiation has been used for the preparation of a number of infectious disease vaccines, including influenza, and when compared to other inactivation methods, has demonstrated superior immunogenicity [97]. Furthermore, γ- irradiation is a highly reliable inactivation method, can be applied to frozen viral samples, and has little impact on antigenic structure and biological integrity of proteins [98,99]. Inactivation of influenza by UV irradiation, on the other hand, has been shown to cause a number of undesirable outcomes such as decreased immunogenicity and low penetrative strength [97].
87 74 Hypothesis The small transient GC response in the lung after VLP immunization is to due an insufficient level of danger signals provided by the VLP particle. Materials and Methods Mice Specific pathogen free female BALB/c mice were purchased from NCI and housed in barrier rooms at the University of Iowa Animal Care Facility. B6.Foxp3-GFP mice were kindly provided by Dr. Alexander Rudensky (Department of Immunology, Sloan Kettering Cancer Center, New York). All mice used in experiments were at least 8 weeks of age. Animal procedures were approved by the University of Iowa Institutional Animal Care and Use Committee in accordance with The Association for Assessment and Accreditation of Laboratory Animal Care, International (AAALAC International) and PHS Animal Welfare mandates. Preparation of antigens and immunizations Mice were anesthetized by isoflurane inhalation and immunized intranasally with a sublethal 0.1LD 50 dose of mouse-adapted IAV (A/PR/8/1934) or 10ug VLPs plus 25ug R848 suspended in 50 µl serum-free Iscove s media. R848 is a TLR7 agonist, and was a gift of 3M Pharmaceuticals. For γ-ray inactivation, PR8 virus was treated with a dose of 10 kgy from a 137 Cs source (81-16A J.L. Shepherd Co. San Fernando, CA). Virus stocks were kept frozen on
88 75 dry ice during irradiation. Loss of viral infectivity was confirmed by infecting MDCK cells with inactivated samples and testing culture supernatants for viral replication using an HA assay (method adapted from Current Protocols in Immunology [100]). Hemagglutination assay was performed to ensure HA activity was retained. Inactivated virus preparations were serially twofold-diluted in a 100µl volume on a 96-well roundbottom microtiter plate. A 1% chicken eryothrocyte suspension was added to all wells and the plate was incubated for 30 minutes at room temperature [100]. The HAU titer of the γ-ray inactivated virus stock and the non-radiated control was 2.56 x 10 5 HAU/ml (Table 3-1). BALB/c mice were immunized i.n. with γ-ray inactivated virus. Two doses were tested; low dose, which contained the equivalent number of viral particles to a 0.1LD 50 dose of IAV on day 0, and high dose, which contained the approximate number of viral particles at the peak of replication after infection (i.e. 48 hours). Since the γ- irradiated virus and the non-radiated control had a similar number of viral particles, the low dose was obtained by diluting the γ-irradiated virus 1:1,000,000 (0.1LD 50 dose). Previous studies have shown IAV expands by approximately 3 logs within the first 48 hours after infection, thus to achieve a high dose, the γ-irradiated virus was diluted 1:1,000. Treg disruption Anti-GITR mab was obtained from the DTA-1 hybridoma and semi-purified from HB101 (Irvine Scientific, Santa Ana, CA) serum free supernatants by 50% ammonium sulfate precipitation. IgG protein concentration was quantified with rat IgG specific ELISA (Jackson Immunoresearch Laboratories, West Grove, PA). Endotoxin
89 76 levels were tested with the Limulus Amebocyte assay (Associates of Cape Cod, East Falmouth, MA) during preparation to ensure minimal endotoxin contamination. For Treg disruption experiments, anti-gitr (DTA-1) mab was injected intraperitoneally (i.p.) at a dose of 250µg on days -2, 1, and 5. For dual administration experiments, DTA-1 was given i.p. at a dose of 250µg and i.n. at a dose of 125µg on days -2, 1, and 5. Flow cytometry dlns (peribronchial and mediastinal) were minced with frosted slides and whole lungs were ground through wire mesh to obtain single-cell suspensions. Cell suspensions were washed with balanced salt solution, subjected to Fico/Lite-LM (Atlanta Biologicals, Norcross, GA) density centrifugation to obtain viable mononuclear cells, and resuspended in staining buffer (balanced salt solution, 5% bovine calf serum, and 0.1% sodium azide). 5 x 10 5 to 1 x 10 6 cells were stained with combinations of fluorochromeconjugated antibodies to identify various cell subsets. Non-specific binding of conjugated Abs was inhibited by blocking cells with 10 µl of rat serum (Pel Freez, Rogers, AR) and 10µg of 2.4G2, an anti-fcγr monoclonal Ab. The rat anti-mouse mabs used were anti- IgM (b76), anti-b220 (6B2), anti-cd4 (PerCP/Cy5.5 conjugate, BioLegend, San Diego, CA) and anti-cxcr5 (biotin conjugate; BD Pharmingen, San Diego, CA). The goat antimouse Abs used were biotin-labeled anti-igg1, -IgG2a, -IgG2b, and -IgG3 (Southern Biotechnology Associates, Birmingham, AL). FITC-conjugated peanut agglutinin (PNA) was purchased from Vector Laboratories (Burlingame, CA). 2.4G2, b76, and 6B2 were semi-purified from HB101 serum-free supernatants using 50% ammonium sulfate precipitation. b76 was conjugated to biotin (Sigma-Aldrich, St. Louis, MO) and 6B2 was
90 77 conjugated to Cy5 (Amersham Pharmacia, Piscataway, NJ) using standard procedures. Purified rat IgG (Jackson Immunoresearch Laboratories, West Grove, PA) was conjugated to biotin, Cy5, and FITC and used for isotype controls. Primary mabs and PNA were added to cells and incubated for 20 minutes on ice. For cells stained with anti- CXCR5, the primary incubation was 30 minutes at room temperature. Cells were then washed twice with staining buffer and PE-conjugated streptavidin (Southern Biotechnology Associates) was added to detect biotinylated Abs, except cells stained with anti-cxcr5, which was detected with PE-Cy7-conjugated streptavidin (ebioscience, San Diego, CA). Stained cells were analyzed on a BD FACS Canto II flow cytometer (Becton Dickinson, San Jose, CA) and analyzed with FlowJo software (Tree Star, Ashland, OR). Statistical analysis The unpaired Student s t test was used to assess statistical significance using the GraphPad InStat software program (La Jolla, CA). Results Identification of T FR cells in the lung after IAV infection Previous work has suggested a specialized subset of Tregs, known as T FR cells, localize to follicular regions and are responsible for controlling GC reactions in secondary lymphoid tissues [91,92]. Since the requirements for induction and regulation of GCs in the lungs are not well understood, we wanted to determine if T FR cells could be
91 78 identified in the lungs after IAV infection. Towards this end, B6.FoxP3-GFP mice were infected with 0.1LD 50 dose of PR8. Lungs were harvested at various time points postinfection and single cell suspensions were prepared and analyzed by flow cytometry. Figure 4-1 depicts the gating strategy used to identify CD4 + CXCR5 hi FoxP3 + T FR cells. As anticipated, T FR cells were identified in the lungs at days 18 and 24 post-infection. Due to limited substrate availability, these studies were not performed with VLPs. Treg disruption and the GC response after IAV infection While striking differences are observed in the magnitude and kinetics of the pulmonary GC reaction between VLPs and PR8, the cause(s) remains to be elucidated. Previous studies have demonstrated Tregs play an important role in controlling ibalt formation and GC reactions [65,93]. In particular, work by Forster and colleagues suggest Tregs in the lung may work to prevent spurious reactions to foreign antigens that are constantly inhaled, but do not pose a substantial threat. Furthermore, our laboratory has shown Treg disruption leads to more robust GC responses and disregulated isotype switching [65]. It is plausible therefore; Tregs may be contributing to the differences observed between VLPs and PR8 by inhibiting an immune response to VLPs. To address this possibility, and determine if the pulmonary GC response can be manipulated by altering the Treg compartment, mice were treated with an agonistic anti-gitr mab (DTA-1), which acts to disrupt the suppressive activity of Tregs [101]. Following a previously established protocol, 250µg of DTA-1 was injected on days -2, 1, and 5 [65]. Mice were infected with a 0.1LD 50 dose of PR8 i.n. (day 0) and GCs in the lungs and dlns were analyzed at the indicated time points post-infection (Figure 4-2). Data for
92 79 control mice (infected with a 0.1LD 50 dose of PR8) were provided by Alex Boyden. Early in the response, the percent of GC B cells in the dlns was significantly greater in mice treated with DTA-1, although this was not the case when total cell recoveries were assessed (Figure 4-2A). When examining the kinetics, measured by total cell number, the dln response in DTA-1 treated mice reached its height at the earliest time point tested and remained relatively steady into the fourth week post-infection, while the response in control mice peaked at day 18. Although the difference in total number of recovered GC B cells was not statistically significant at any point, the percent of GCs was greater in controls on day 24 post-infection (Figure 4-2A). In the lungs, DTA-1 treatment enhanced the GC B cell compartment in terms of percent but not total number early in the response (day 8). However, as the response matured, the total number of GC B cells was markedly reduced compared to controls (Figure 4-2B). Previous work from our laboratory has shown Treg disruption with DTA-1 leads to uncontrolled isotype switching in splenic GCs after challenge with SRBCs [65]. To determine if a similar situation occurs following IAV infection, the frequency of IgM + and switched GC B cells was evaluated. In the dlns, disruption of Tregs did not alter the frequency of switched GC B cells compared to controls (Figure 4-3A). In the lungs, the frequency of switched GC B cells was significantly greater at day 8 in DTA-1 treated mice, but quickly equalized with frequencies similar to controls for the remainder of the response (Figure 4-3B). Taken together, the data show DTA-1 treatment fails to result in larger GC responses and enhanced switching over the course of the reaction in the dlns and lung after IAV infection. Except for the earliest time point (day 8), Treg disruption
93 80 resulted in generally smaller total GC responses and relatively normal ratios of IgM + and switched B cells. Since previous studies have not used DTA-1 to abrogate Tregs in the lungs, a question arose regarding the ability of DTA-1 to reach the lungs when administered i.p. Towards this end, an alternative DTA-1 treatment protocol was established whereby DTA-1 was administered both i.p. and i.n. Mice were infected with a 0.1LD 50 dose of PR8 on day 0, and given 250µg of DTA-1 mab i.p. and 125µg of DTA-1 mab i.n on days -2, 1, and 5. On day 18 post-infection, dlns and lungs were harvested to evaluate the GC response. Based on percent and total number of GC B cells, dual administration of DTA-1 did not enhance the GC response in the dlns or lungs compared to PR8- infected controls (Figure 4-4A and Figure 4-4B). In fact, the total number of GC B cells was significantly reduced in DTA-1 treated mice, similar to the previous experiment. Additionally, further examination of GC B cells in the dlns and lungs revealed a similar pattern of isotype switching in DTA-1 treated mice and controls (Figure 4-4C and Figure 4-4D). Thus, the dose of DTA-1 delivered i.n., in addition to the standard i.p. dose, was unable to enhance the GC response or lead to uncontrolled switching in the dlns or lungs in IAV-infected mice compared to controls. These experiments suggest that Treg control of GC responses may differ depending upon route of antigen exposure (i.p. versus i.n.), or on the nature of the challenge (active infection versus inert antigen). Treg disruption did not enhance the GC response in the dlns and lungs or induce uncontrolled isotype switching, although there was one exception early in the response. On day 8 post-infection the percent of GC B cells in the dlns and lungs of mice treated with DTA-1 was significantly greater compared to controls (Figure 4-2). To investigate
94 81 this further, uninfected mice were treated with DTA-1 alone (in the absence of PR8 infection), dlns and lungs were harvested on day 8 and analyzed for GC B cell populations. Surprisingly, treatment with DTA-1 alone resulted in the formation of GCs in the dlns and lungs (Figure 4-5). It can be hypothesized therefore, that the enhanced GC response observed at day 8 in the previous experiments was a result of spontaneous GCs (not directed against IAV) that arose proximal to Treg disruption, a finding consistent with the report by Forster and colleagues [93]. Importantly, these results again suggest that Tregs may regulate GC responses to inert particles and infectious agents quite differently. Based on these unexpected findings, and limited substrate, Treg disruption studies with VLPs were not pursued. The potential role of TLR agonists in modulating the GC response to VLPs Since influenza VLPs theoretically lack TLR agonists that IAV contains, it is possible their addition will enhance the magnitude of the pulmonary response to VLPs, allowing it to more closely resemble IAV. Towards this end, studies were designed to investigate the effect of adding TLR agonists to the VLP vaccine. Two agonists were tested: R848 (resiquimod) a TLR7 ligand and Poly(I:C), a synthetic analog of dsrna recognized by TLR3. Mice were immunized i.n. with 10µg VLPs plus 25µg R848 and lungs were harvested at the indicated time points. Unexpectedly, the addition of R848 did not significantly alter the magnitude of the GC B cell response in the lungs at either day 12 or 18 (Figure 4-6). Compared to vaccination with VLPs alone, the percent of GC B cells was smaller on day 18 post-immunization, however this difference was not observed
95 82 when examining total cell number. Similar results were observed when these experiments were performed with VLPs plus poly(i:c) (Figure 4-7). To determine if the character of the response was altered with the addition R848, GC B cells were evaluated for the surface expression of IgM, IgG1, IgG2 (IgG2a + IgG2b), and IgG3. While some subtle differences were observed, in general R848 did not significantly affect isotype distribution, with IgG2 + GC B cells still representing the dominant switched isotype (Figure 4-6). Despite previous work showing that immunogenicity of VLP vaccines can be increased with the addition of TLR agonists, R848 and poly(i:c) did not enhance the pulmonary GC response, increase the frequency of switching, or alter the T H 1 character of the reaction. The reason for this is unclear, however it may have to do with the way in which the TLR agonist was included in the vaccine. According to a recent study, adjuvant effects of TLR agonists may be dependent on their physical association with VLPs [45]. However, given the limited availability of VLPs, and our inability to alter their contents, an alternative approach was used to pursue this question. Vaccination with γ-ray inactivated IAV induces GC B cell responses in the lung An important distinction between vaccination with VLPs and IAV infection is the presence of an intact, lytic virus with the ability to greatly expand antigen load during the first several days after infection. Consequently, differences in the magnitude and kinetics of the pulmonary response may be due to dose effects, or the ability to induce a stronger response against an intact viral particle, which contains natural TLR agonists. To address
96 83 this possibility, we sought to examine the pulmonary GC response to different doses of a replication-deficient form of the virus. Efforts were originally focused on using UV irradiation to inactivate IAV. UV irradiation is a fairly common method of viral inactivation, however, after multiple attempts, generation of a complete replication deficient IAV preparation proved to be unachievable. Thus, efforts were focused on studying the response to γ-ray-inactivated IAV. Based on previous work, the γ-rayinactivated IAV vaccine was prepared using a radiation dose of 10kGy [98]. To verify loss of infectivity, MDCK cells were inoculated with inactivated samples and five days later culture supernatants were tested for the presence of newly synthesized virions using an HA assay. Titers were negative in the γ-irradiated samples, illustrating a complete loss of viral infectivity (Table 3-1). Hemagglutination activity was evaluated by HA assay and compared to a live virus control (Table 3-1). Importantly, γ-irradiated IAV preparations retained full HA activity, indicating intact structure and immunogenicity. To evaluate the GC response, two doses of the γ-irradiated IAV vaccine were tested in BALB/c mice; a low dose, which contained the equivalent number of viral particles to a 0.1LD 50 dose of IAV on day 0, and a high dose, which contained the approximate number of viral particles at the peak of replication. Mice were immunized i.n. and lungs were harvested at the indicated time points. Initial studies using the low dose revealed a lack of pulmonary GC induction, once again demonstrating the ability of the lung environment to suppress responses to non-threatening challenges. Given these findings, only high dose studies were pursued. Upon vaccination with a high dose of γ- irradiated IAV, robust GC B cell responses were induced in lungs (Figure 4-8). GC responses following infection with a live IAV control (data provided by Alex Boyden) or
97 84 i.n. VLP vaccination are shown for comparison. γ-irradiated IAV mimicked IAV in terms of the kinetics, reaching the maximal response (of the time points tested) on day 24 postchallenge (Figure 4-8A and Figure 4-8B), but quite different than the VLP-induced response, which reached its height on days 8-12 (Figure 4-8C and Figure 4-8D). Despite similarities in kinetics however, the magnitude of the response to γ-irradiated IAV was significantly smaller than live IAV at every time point analyzed, except day 12 (Figure 4-8B). Differences in magnitude were also observed between γ-irradiated IAV and VLPs, with VLPs inducing a stronger response on day 8 and γ-irradiated IAV dominating on day 24 (Figure 4-8D). These data demonstrate, therefore, that challenge with γ-irradiated IAV induces a response that more closely mimics a live virus infection (compared to VLPs) in terms of the kinetics, but not magnitude. Isotype distribution of GC B cells after vaccination with γ-irradiated IAV To determine if vaccination with γ-irradiated IAV induces site-specific isotype switching in the lungs, IgM + and isotype switched IgM - GC B cells were assessed. The proportion of switched and non-switched GC B cells was fairly steady throughout the response, with IgM - switched cells representing approximately 60% of the GC pool (Figure 4-9A). Importantly, a similar pattern was observed following vaccination with VLPs (Figure 3-3B) and IAV infection (Figure 3-3C, [57]). Isotype switched GC B cells were further characterized by surface expression of IgG1, IgG2 (IgG2a + IgG2b), and IgG3. At each time point analyzed, IgG2 was the dominant isotype among the switched GC B cells in the lungs (Figure 4-9B). IgG1 + and IgG3 + GC B cells were present, but
98 85 were a minor constituent. Importantly, the isotype distribution of switched GC B cells in the lungs was remarkably similar to IAV infection and VLP vaccination, although it appears that γ-irradiated IAV is a better inducer of IgG1 + and IgG3 + GC B cells compared to VLPs. Overall, these data indicate that challenge with γ-irradiated IAV induces a T H 1 biased response in the lungs, closely mimicking the GC response following natural infection with IAV and i.n. VLP vaccination. Discussion Our studies and others have shown immunization with influenza VLPs elicits protective immune responses including systemic and mucosal Abs. However, as discussed previously, the T H cell-mediated GC response to VLPs was quite different than natural infection with IAV in terms of the kinetics and magnitude, particularly at late time points. VLPs induced a relatively modest and transient pulmonary response that peaked 12 days post-vaccination, whereas IAV generated a strong response that peaked 24 days post-infection. Although the GC response to both antigens was equivalent at early time points (days 8 and 12), the response to VLPs quickly dissipated while the IAVinduced response continued to increase, resulting in a significantly greater population of lung GC B cells (Figure 3-2, [57]). While the specific features that contribute to these differences are not clear, one interpretation was that early GC responses to both agents occur in loosely organized lymphoid aggregates, whereas late robust GC responses are a result of ibalt formation. If true, this raises an important question: why can IAV induce ibalt when VLPs cannot?
99 86 To answer this question, our first approach was to determine if Tregs were playing a role. Previous work from our laboratory and others demonstrated the ability of Tregs to localize to follicular regions and influence the magnitude and character of GC reactions. Although their mechanism of regulation remains to be elucidated, studies have shown disruption or deletion of Tregs leads to enhanced GC responses with an increased proportion of switched B cells in secondary lymphoid tissues [65]. In addition, Forster and colleagues have shown that Tregs in the lungs suppress the formation of spontaneous ibalt (and GCs) [93]. Consistent with their role in immune regulation, one could postulate that Tregs in the lung function to suppress the induction of pulmonary GCs to inert particles that are continuously inhaled, or even pathogenic particles that are below the threshold to pose a threat. It was hypothesized, therefore, that Tregs might be operating to suppress VLP-induced GCs in the lung, resulting in a modest, short-lived response. Although we were not able to test this hypothesis with VLPs (due to limited substrate availability), experiments were devised to examine the effects of Treg disruption on the pulmonary GC response to IAV infection. The results from these studies were paradoxical, however, in that the absence of Treg activity resulted in fewer, not larger GC responses (Figure 4-2). One exception was observed on day 8 postinfection, where Treg disruption led to a significant increase in the percent (but not total number) of GC B cells in the dlns and lung. Additional studies suggested these findings were likely due to spontaneous, non-specific GC induction upon Treg disruption (Figure 4-5); however, the necessary reagents to distinguish between antigen-specific and spontaneous GCs are not currently available. Consequently, further experiments were not pursued.
100 87 Studies have shown influenza VLPs resemble intact influenza virions in structure and morphology, and contain pathogen-associated molecular patterns (most likely including TLR agonists) that induce Th1-biased GC responses. However, it has not been determined if the strength of these signals are equivalent. Perhaps the level of danger signals between the two challenges can explain the difference in the response at late time points. Since TLR3 and TLR7 are involved in recognizing intracellular viral dsrna and ssrna, respectively, experiments were performed to analyze the effects of adding these agonists to the VLPs (as a mixture). Surprisingly, whether testing a TLR3 or TLR7 agonist, an enhanced pulmonary GC response was not observed (Figure 4-6). While these findings were unexpected, a few possible explanations exist. First, the amount of TLR agonist chosen may not have been sufficient. Along these lines, a recent study by Randall et al. demonstrated that in a neonatal model of ibalt formation, repeated doses of LPS were required to induce ibalt [102]. Similarly, Harmsen and colleagues had to administer multiple doses of a protein cage nanoparticle to induce ibalt [103]. Thus, maybe higher levels or multiple doses of a TLR agonist are necessary to enhance the response in the lung. The second possibility is that neither TLR3 nor TLR7 agonists were the correct danger signals; rather, another key danger signal or combination of signals may be required that was not tested. Lastly, ibalt formation may require the correct danger signal and antigen to be part of the same particle. Towards this end, a study by Compans et al. demonstrated the adjuvant effects of flagellin was dependent on its incorporation into VLPs, and that a mixture of soluble flagellin plus VLPs failed to show similar adjuvant effects [45]. Furthermore, previous work by Blander and colleagues has shown DCs preferentially process and present antigen from compartments that also
101 88 contain TLR ligands [104]. Unfortunately, to test this possibility we would need to challenge mice with VLPs loaded with a TLR7 (or other) agonist, a technology that we do not have access to at this time. It was further reasoned that if IAV contains elements that VLPs do not, a stronger response should be invoked by IAV, regardless of whether the virus is lytic or not. To address this hypothesis, we challenged mice with inactivated (non-lytic) IAV, and compared the response to VLPs and wild-type (lytic) IAV. Because lytic IAV greatly expands during the first hours after infection, antigen load may also be a factor in the pulmonary response. Therefore, mice were tested with two doses of inactivated IAV, one that represented the initial challenge dose and a second that approximated the number of viral particles at the peak of replication after infection. Interestingly, the low dose of inactivated IAV did not invoke a response in the lungs (though a GC response in the dlns was observed on day 18 post-challenge in one of the three mice tested). Once again, these data suggest the lung environment is regulated in a manner whereby responses to either inert particles or low dose challenge are suppressed, perhaps by Tregs. Unlike the low dose, the high dose of inactivated IAV did invoke a GC response, which was similar to both VLPs and lytic IAV at early time points (Figure 4-8). At later time points (day 24), the response was lower than that invoked by lytic IAV, but significantly higher than VLPs (Figure 4-8). Thus, it appears a high dose of inactivated IAV induces an intermediate pulmonary response. While the significance of these findings is not clear, we propose that inactivated IAV is inducing ibalt, though not to the same extent as lytic IAV. Along these lines, previous work in our laboratory has demonstrated persistent GCs in the lungs at days 50 and 100 after IAV infection, a finding thought to be
102 89 dependent on ibalt formation during the primary response. Accordingly, mice were immunized with VLPs or inactivated IAV and evaluated for long-term GCs in the lungs. GC B cells were at background levels in the lung at day 50 after VLP challenge, whereas persistent GCs were clearly detectable following inactivated IAV challenge (representing approximately one percent of the total cell recovery, or 6.0x10 3 GC B cells). Although the latter were not as strong as the GCs induced by lytic IAV (at day 50 approximately four percent of the total recovered cells were GC B cells, or 1.17x10 4 GC B cells), a demonstrable population was observed. Taken together, these data support our notion that early transient GC responses in the lung are due to the formation of loosely organized lymphoid aggregates. VLPs, inactivated IAV and lytic IAV can induce this response. Stronger and sustained GC responses, on the other hand, are likely dependent on the formation of ibalt. Our data suggest only inactivated IAV and lytic IAV can induce these structures, indicating they likely contain elements necessary for ibalt formation that are lacking in VLPs. However, histological analysis of lung tissue will be necessary to validate these theories.
103 90 Figure 4-1. Identification of T FR cells in FoxP3 reporter mice after PR8 infection. B.6FoxP3-GFP mice were infected with a 0.1LD 50 dose of PR8 on day 0. Lungs were harvested on days 12, 18, and 24 and single cell suspensions stained with anti-cd4 and anti-cxcr5. (A) Representative plots of the CD4 + FoxP3 + T regulatory cells (Tregs) at the indicated time points post-infection. The value next to each gate represents the percent of Tregs from that sample. (B) Representative plots illustrating further characterization of Tregs with anti-cxcr5 to identify T follicular regulatory (T FR ) cells (CD4 + CXCR5 + ). The value next to each gate represents the percent of T FR cells from that sample.
104 91
105 92 Figure 4-2. Treg disruption and the GC B cell response following PR8 infection. All mice were infected intranasally with a 0.1LD 50 dose of PR8. The DTA-1 treated group were also injected i.p. with 250µg of DTA-1 mab on days -2, 1, and 5. The dlns and lungs were harvested at the indicated time points post-infection and single cell suspensions stained with anti-b220 mab and PNA to delineate GC B cells. (A) Bar graphs depict the percent (left) and total number (right) of GC B cells in the dlns of mice infected with PR8 and treated with DTA-1 (closed bars) or PR8 alone (open bars). (B) Bar graphs represent the percent (left) and total number (right) of GC B cells in the lungs of mice infected with PR8 and treated with DTA-1 (closed bars) or PR8 alone (open bars). Statistical analyses were performed between DTA-1 treated and non-treated groups at each time point using the unpaired Student s t test. Standard error bars represent mean ± SEM. n = 6 mice per group per time-point. *p < 0.05; **p < 0. 01; ***p <
106 93
107 94 Figure 4-3. DTA-1 alters the isotype switching pattern early but not late in the dlns and lungs after PR8 infection. All mice were infected intranasally with a 0.1LD 50 dose of PR8. The DTA-1 treated mice were also injected i.p. with 250µg of DTA-1 mab on days -2, 1, and 5. The dlns and lungs were harvested at the indicated time points post-infection and single cell suspensions stained with anti-b220 mab, PNA, and anti-igm mab. (A) Bar graphs depict the percent of non-switched (IgM + ) (closed bars) and isotype switched (IgM - ) (open bars) GC B cells in the dlns after PR8 infection and DTA-1 treatment (left) or PR8 infection alone (right). (B) Bar graphs show the percent of non-switched (IgM + ) and isotype switched (IgM - ) GC B cells in the lungs after PR8 infection and DTA-1 treatment (left) or PR8 infection alone (right). Statistical analyses were performed between IgM + GC B cells from DTA-1 treated and non-treated groups at each time point using the unpaired Student s t test. Standard error bars represent mean ± SEM. n = 6 mice per group per time-point. ***p <
108 95
109 96 Figure 4-4. GC B cell response in the dlns and lungs of PR8 infected mice treated with DTA-1 i.p. and i.n. All mice were infected intranasally with a 0.1LD 50 dose of PR8. The DTA-1 treated group was also injected with 250µg of DTA-1 mab i.p. and 125µg of DTA-1 mab i.n on days -2, 1, and 5. The dlns and lungs were harvested on day 18 post-infection and single cell suspensions stained with anti-b220 mab, PNA, and anti-igm mab. (A) Bar graphs represent the percent (top) and total number (bottom) of GC B cells in the dlns of mice infected with PR8 and treated with DTA-1 i.p. and i.n. or mice infected with PR8 alone. (B) Bar graphs show the percent (top) and total number (bottom) of GC B cells in the lungs of mice infected with PR8 and treated with DTA-1 i.p. and i.n. or mice infected with PR8 alone. (C) Bar graph illustrates the percent of non-switched (IgM + ) (closed bars) and isotype switched (IgM - ) (open bars) GC B cells in the dlns after PR8 infection and DTA-1 treatment i.p. and i.n. or PR8 infection alone. dln data are shown as total cells per lymph node. (D) Bar graph shows the percent of nonswitched (IgM - ) and isotype switched (IgM - ) GC B cells in the lungs after PR8 infection and DTA-1 treatment i.p. and i.n. or PR8 infection. Statistical analyses were performed between DTA-1 treated and non-treated groups at each time point using the unpaired Student s t test. Standard error bars represent mean ± SEM. n = 3-6 mice per group per time-point. ***p <
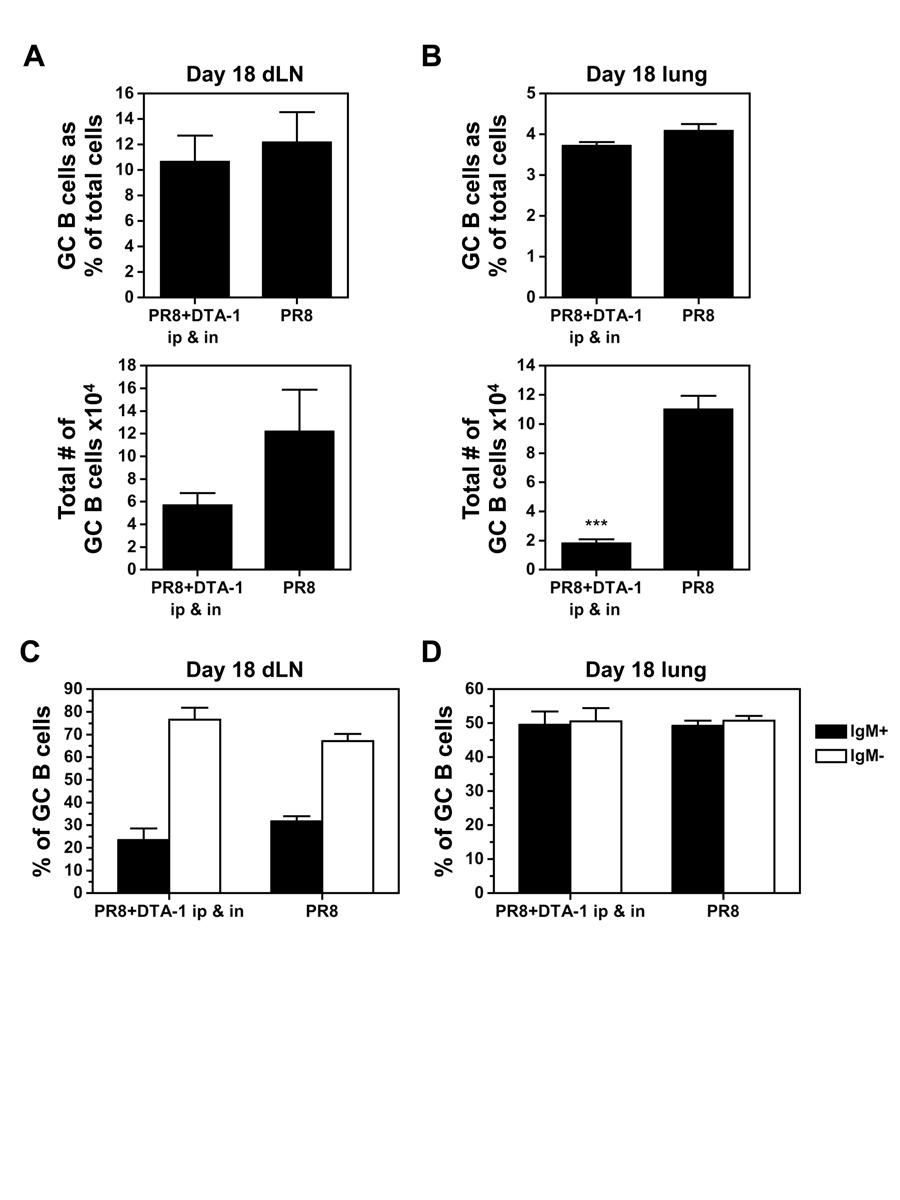
110 97
111 98 Figure 4-5. Treatment with DTA-1 induces a GC B cell response in the dlns and lungs of non-infected mice. Mice were injected with 250µg DTA-1 i.p. on days -2, 1, and 5. The dlns and lungs were harvested on day 8 post-infection and single cell suspensions stained with anti- B220 mab and PNA to identify the GC B cell population. (A) Bar graph represents the percent of GC B cells in the dlns of naïve or DTA-1 treated mice. (B) Bar graph shows the percent of GC B cells in the lungs of naïve or DTA-1 treated mice. Statistical analyses were performed between DTA-1 treated and non-treated naïve mice using the unpaired Student s t test. Standard error bars represent mean ± SEM. n = 5-6 mice per group. *p < 0.05.
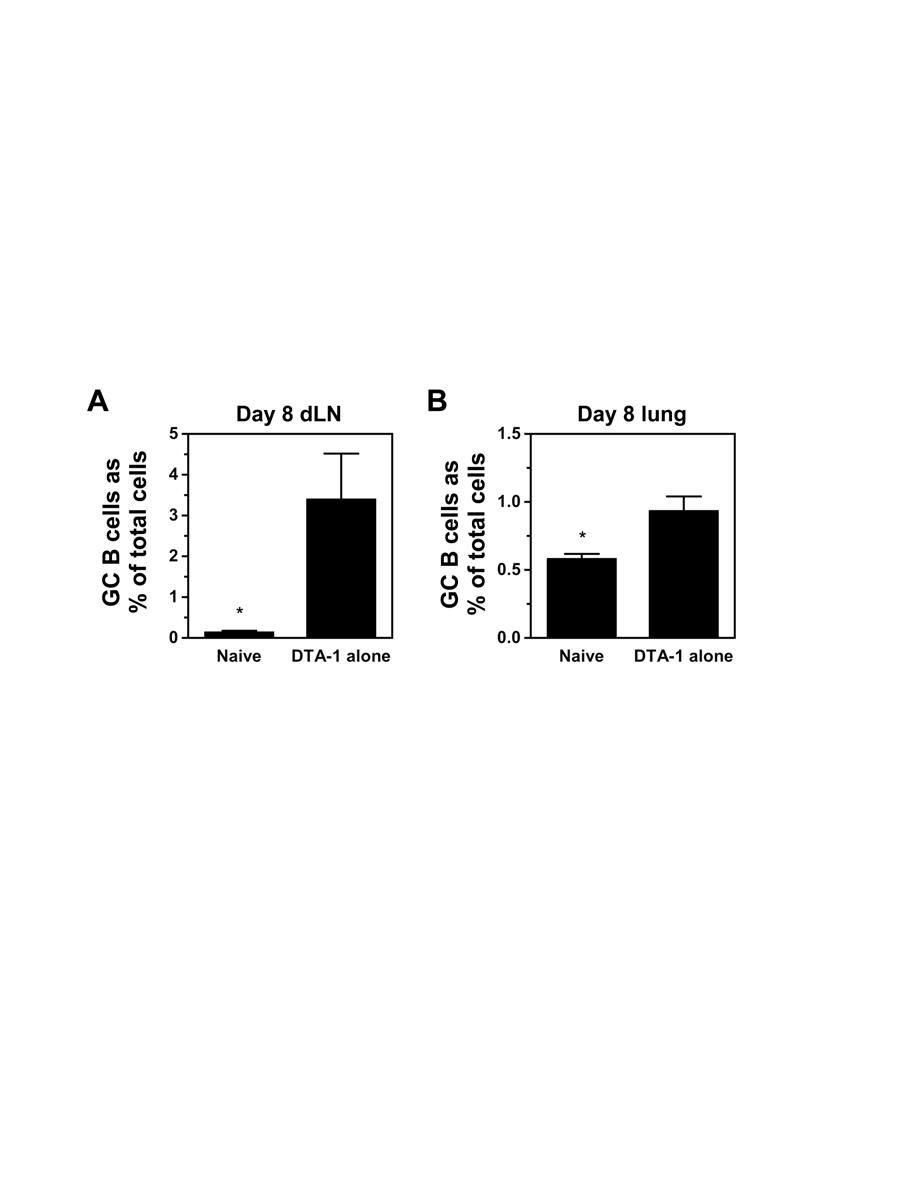
112 99
Cover Page. The handle holds various files of this Leiden University dissertation
 Cover Page The handle http://hdl.handle.net/1887/35908 holds various files of this Leiden University dissertation Author: Soema, Peter Title: Formulation of influenza T cell peptides : in search of a universal
Supporting Information
 Supporting Information Valkenburg et al. 10.1073/pnas.1403684111 SI Materials and Methods ELISA and Microneutralization. Sera were treated with Receptor Destroying Enzyme II (RDE II, Accurate) before ELISA
Patricia Fitzgerald-Bocarsly
 FLU Patricia Fitzgerald-Bocarsly October 23, 2008 Orthomyxoviruses Orthomyxo virus (ortho = true or correct ) Negative-sense RNA virus (complementary to mrna) Five different genera Influenza A, B, C Thogotovirus
24 26 January 2013, Hong Kong SAR, CHINA. TITLE from VIEW and SLIDE MASTER February 27, 2013
 The first WHO integrated meeting on development and clinical trials of influenza vaccines that induce broadly protective and long-lasting immune responses 24 26 January 2013, Hong Kong SAR, CHINA 1 TITLE
Influenza or flu is a
 Clinical and Research Area Infectious Diseases Influenza Virus Types A and B Influenza or flu is a respiratory illness that is caused by influenza viruses. Influenza viruses type A and type B cause seasonal
Respiratory Viruses. Respiratory Syncytial Virus
 Adam Ratner, MD Respiratory Viruses Respiratory viruses are among the most common causes of disease throughout life. Often mild and self-limited, they are still associated with tremendous economic and
Clinical Trials of Pandemic Vaccines: Key Issues. John Treanor University of Rochester Rochester, NY
 Clinical Trials of Pandemic Vaccines: Key Issues John Treanor University of Rochester Rochester, NY Inactivated vaccine approach Proven technology Used successfully in 1957 and 1968 Abundant efficacy data
1918 Influenza; Influenza A, H1N1. Basic agent information. Section I- Infectious Agent. Section II- Dissemination
 1918 Influenza; Influenza A, H1N1 Basic agent information Section I- Infectious Agent Risk Group: - RG3 Synonym or Cross reference: - Spanish Flu - 1918 Flu - El Grippe Characteristics: - SELECT AGENT
Human Influenza. Dr. Sina Soleimani. Human Viral Vaccine Quality Control 89/2/29. November 2, 2011 HVVQC ١
 Human Influenza Dr. Sina Soleimani Human Viral Vaccine Quality Control 89/2/29 November 2, 2011 HVVQC ١ Presentation outline 1. Introduction 2. Virology 3. Classification 4. Hosts 5. Antigenic Specifications
Blocking antibodies and peptides. Rat anti-mouse PD-1 (29F.1A12, rat IgG2a, k), PD-
, PD-") Supplementary Methods Blocking antibodies and peptides. Rat anti-mouse PD-1 (29F.1A12, rat IgG2a, k), PD- L1 (10F.9G2, rat IgG2b, k), and PD-L2 (3.2, mouse IgG1) have been described (24). Anti-CTLA-4 (clone
Supplementary Methods Blocking antibodies and peptides. Rat anti-mouse PD-1 (29F.1A12, rat IgG2a, k), PD- L1 (10F.9G2, rat IgG2b, k), and PD-L2 (3.2, mouse IgG1) have been described (24). Anti-CTLA-4 (clone
Adaptive Immunity: Humoral Immune Responses
 MICR2209 Adaptive Immunity: Humoral Immune Responses Dr Allison Imrie 1 Synopsis: In this lecture we will review the different mechanisms which constitute the humoral immune response, and examine the antibody
Influenza viruses. Virion. Genome. Genes and proteins. Viruses and hosts. Diseases. Distinctive characteristics
 Influenza viruses Virion Genome Genes and proteins Viruses and hosts Diseases Distinctive characteristics Virion Enveloped particles, quasi-spherical or filamentous Diameter 80-120 nm Envelope is derived
Medical Virology Immunology. Dr. Sameer Naji, MB, BCh, PhD (UK) Head of Basic Medical Sciences Dept. Faculty of Medicine The Hashemite University
 Head of Basic Medical Sciences Dept. Faculty of Medicine The Hashemite University") Medical Virology Immunology Dr. Sameer Naji, MB, BCh, PhD (UK) Head of Basic Medical Sciences Dept. Faculty of Medicine The Hashemite University Human blood cells Phases of immune responses Microbe Naïve
Medical Virology Immunology Dr. Sameer Naji, MB, BCh, PhD (UK) Head of Basic Medical Sciences Dept. Faculty of Medicine The Hashemite University Human blood cells Phases of immune responses Microbe Naïve
The humoral immune responses to IBV proteins.
 The humoral immune responses to IBV proteins. E. Dan Heller and Rosa Meir The Hebrew University of Jerusalem, Israel COST FA1207 meeting WG2 + WG3, Budapest, Jan. 2015 1 IBV encodes four major structural
Evolution of influenza
 Evolution of influenza Today: 1. Global health impact of flu - why should we care? 2. - what are the components of the virus and how do they change? 3. Where does influenza come from? - are there animal
Nanoparticulate Vaccine Design: The VesiVax System
 Nanoparticulate Vaccine Design: The VesiVax System Gary Fujii, Ph.D. President and CEO Molecular Express, Inc. May 16, 2006 Orlando, Florida Influenza Each year up to 20% of the world's population contracts
Influenza A H1N1 HA ELISA Pair Set
 Influenza A H1N1 HA ELISA Pair Set for H1N1 ( A/Puerto Rico/8/1934 ) HA Catalog Number : SEK11684 To achieve the best assay results, this manual must be read carefully before using this product and the
Justus Hallam Iowa State University. Iowa State University Capstones, Theses and Dissertations. Graduate Theses and Dissertations
 Graduate Theses and Dissertations Iowa State University Capstones, Theses and Dissertations 2013 Exercise-mediated changes in plasmacytoid dendritic cell production of IFNα and the effects of moderate
Application of Reverse Genetics to Influenza Vaccine Development
 NIAID Application of Reverse Genetics to Influenza Vaccine Development Kanta Subbarao Laboratory of Infectious Diseases NIAID, NIH Licensed Vaccines for Influenza Principle: Induction of a protective
Studying Repeated Immunization in an Animal Model. Kanta Subbarao Laboratory of Infectious Diseases, NIAID
 Studying Repeated Immunization in an Animal Model Kanta Subbarao Laboratory of Infectious Diseases, NIAID Animal models in Influenza Research Commonly used Mice Ferrets Guinea pigs Non human primates Less
Supporting Online Material for
 www.sciencemag.org/cgi/content/full/1175194/dc1 Supporting Online Material for A Vital Role for Interleukin-21 in the Control of a Chronic Viral Infection John S. Yi, Ming Du, Allan J. Zajac* *To whom
NK cell flow cytometric assay In vivo DC viability and migration assay
 NK cell flow cytometric assay 6 NK cells were purified, by negative selection with the NK Cell Isolation Kit (Miltenyi iotec), from spleen and lymph nodes of 6 RAG1KO mice, injected the day before with
Technology Overview. Summary
 Live Attenuated Influenza Vaccines with Altered NS1 Technology Overview Summary Transformative Technology: Live attenuated influenza vaccines (LAIVs) with precise, genetically stable truncations of the
ORTHOMYXOVIRUSES INFLUENZA VIRUSES. (A,B and C)
") ORTHOMYXOVIRUSES INFLUENZA VIRUSES (A,B and C) Orthomyxoviridae Influenza Viruses Epidemiology: Influenza A virus is so subjected to major antigenic changes that cause occasional world wide pandemics when
ORTHOMYXOVIRUSES INFLUENZA VIRUSES (A,B and C) Orthomyxoviridae Influenza Viruses Epidemiology: Influenza A virus is so subjected to major antigenic changes that cause occasional world wide pandemics when
Acute respiratory illness This is a disease that typically affects the airways in the nose and throat (the upper respiratory tract).
.") Influenza glossary Adapted from the Centers for Disease Control and Prevention, US https://www.cdc.gov/flu/glossary/index.htm and the World Health Organization http://www.wpro.who.int/emerging_diseases/glossary_rev_sept28.pdf?ua=1
Influenza glossary Adapted from the Centers for Disease Control and Prevention, US https://www.cdc.gov/flu/glossary/index.htm and the World Health Organization http://www.wpro.who.int/emerging_diseases/glossary_rev_sept28.pdf?ua=1
Influenza: The past, the present, the (future) pandemic
 pandemic") Influenza: The past, the present, the (future) pandemic Kristin Butler, MLS (ASCP) cm Department of Clinical Laboratory Sciences Louisiana Health Sciences Center - Shreveport Fall 2017 Objectives 1) Detail
Influenza: The past, the present, the (future) pandemic Kristin Butler, MLS (ASCP) cm Department of Clinical Laboratory Sciences Louisiana Health Sciences Center - Shreveport Fall 2017 Objectives 1) Detail
Trends in vaccinology
 Trends in vaccinology Mathieu Peeters, MD Joint Conference of European Human Pharmacological Societies and Joint Conference of European Human Pharmacological Societies and 20th Anniversary of AGAH March
3. Lymphocyte proliferation (fig. 15.4): Clones of responder cells and memory cells are derived from B cells and T cells.
: Clones of responder cells and memory cells are derived from B cells and T cells.") Chapter 15 Adaptive, Specific Immunity and Immunization* *Lecture notes are to be used as a study guide only and do not represent the comprehensive information you will need to know for the exams. Specific
Chapter 15 Adaptive, Specific Immunity and Immunization* *Lecture notes are to be used as a study guide only and do not represent the comprehensive information you will need to know for the exams. Specific
Third line of Defense
 Chapter 15 Specific Immunity and Immunization Topics -3 rd of Defense - B cells - T cells - Specific Immunities Third line of Defense Specific immunity is a complex interaction of immune cells (leukocytes)
Influenza. By Allison Canestaro-Garcia. Disease Etiology:
 Influenza By Allison Canestaro-Garcia Disease Etiology: The flu is an infectious disease caused by a subset of viruses of the family Orthomyxoviridae. There are 7 different viruses in this family, four
HS-LS4-4 Construct an explanation based on evidence for how natural selection leads to adaptation of populations.
 Unit 2, Lesson 2: Teacher s Edition 1 Unit 2: Lesson 2 Influenza and HIV Lesson Questions: o What steps are involved in viral infection and replication? o Why are some kinds of influenza virus more deadly
Zheng, BJ; Du, LY; Zhao, GY; Lin, YP; Sui, HY; Chan, C; Ma, S; Guan, Y; Yuen, KY. Citation Hong Kong Medical Journal, 2008, v. 14 suppl. 4, p.
 Title Studies of SARS virus vaccines Author(s) Zheng, BJ; Du, LY; Zhao, GY; Lin, YP; Sui, HY; Chan, C; Ma, S; Guan, Y; Yuen, KY Citation Hong Kong Medical Journal, 2008, v. 14 suppl. 4, p. 39-43 Issued
Nothing to disclose. Influenza Update. Influenza Biology. Influenza Biology. Influenza A 12/15/2014
 Influenza Update Nothing to disclose. Lisa Winston, MD UCSF / San Francisco General Hospital Divisions of Infectious Diseases and Hospital Medicine Influenza Biology Influenza Biology Influenza viruses
Orthomyxoviridae and Paramyxoviridae. Lecture in Microbiology for medical and dental medical students
 Orthomyxoviridae and Paramyxoviridae Lecture in Microbiology for medical and dental medical students Orthomyxoviridae and Paramyxoviridae are ss RNA containng viruses Insert Table 25.1 RNA viruses 2 SIZE
INFLUENZA VIRUS. INFLUENZA VIRUS CDC WEBSITE
 INFLUENZA VIRUS INFLUENZA VIRUS CDC WEBSITE http://www.cdc.gov/ncidod/diseases/flu/fluinfo.htm 1 THE IMPACT OF INFLUENZA Deaths: PANDEMICS 1918-19 S p a n is h flu 5 0 0,0 0 0 U S 2 0,0 0 0,0 0 0 w o rld
The Adaptive Immune Response. B-cells
 The Adaptive Immune Response B-cells The innate immune system provides immediate protection. The adaptive response takes time to develop and is antigen specific. Activation of B and T lymphocytes Naive
Supplementary Information:
 Supplementary Information: Follicular regulatory T cells with Bcl6 expression suppress germinal center reactions by Yeonseok Chung, Shinya Tanaka, Fuliang Chu, Roza Nurieva, Gustavo J. Martinez, Seema
Biotechnology-Based Vaccines. Dr. Aws Alshamsan Department of Pharmaceutics Office: AA87 Tel:
 Biotechnology-Based Vaccines Dr. Aws Alshamsan Department of Pharmaceutics Office: AA87 Tel: 4677363 aalshamsan@ksu.edu.sa Objectives of this lecture By the end of this lecture you will be able to: 1.
Viral Genetics. BIT 220 Chapter 16
 Viral Genetics BIT 220 Chapter 16 Details of the Virus Classified According to a. DNA or RNA b. Enveloped or Non-Enveloped c. Single-stranded or double-stranded Viruses contain only a few genes Reverse
Conflict of Interest and Disclosures. Research funding from GSK, Biofire
 Pandemic Influenza Suchitra Rao, MBBS, Assistant Professor, Pediatric Infectious Diseases, Hospital Medicine and Epidemiology Global Health and Disasters Course, 2018 Conflict of Interest and Disclosures
GOVX-B11: A Clade B HIV Vaccine for the Developed World
 GeoVax Labs, Inc. 19 Lake Park Drive Suite 3 Atlanta, GA 3 (678) 384-72 GOVX-B11: A Clade B HIV Vaccine for the Developed World Executive summary: GOVX-B11 is a Clade B HIV vaccine targeted for use in
Principles of Vaccination
 Immunology and Vaccine-Preventable Diseases Immunology is a complicated subject, and a detailed discussion of it is beyond the scope of this text. However, an understanding of the basic function of the
Vaccinology 101 for Fellows
 Vaccinology 101 for Fellows Meg Fisher, MD Medical Director, The Children s Hospital Monmouth Medical Center An affiliate of the Saint Barnabas Health Care System Long Branch, NJ Disclosures I have no
Coronaviruses cause acute, mild upper respiratory infection (common cold).
.") Coronaviruses David A. J. Tyrrell Steven H. Myint GENERAL CONCEPTS Clinical Presentation Coronaviruses cause acute, mild upper respiratory infection (common cold). Structure Spherical or pleomorphic enveloped
Coronaviruses David A. J. Tyrrell Steven H. Myint GENERAL CONCEPTS Clinical Presentation Coronaviruses cause acute, mild upper respiratory infection (common cold). Structure Spherical or pleomorphic enveloped
Immunobiology 7. The Humoral Immune Response
 Janeway Murphy Travers Walport Immunobiology 7 Chapter 9 The Humoral Immune Response Copyright Garland Science 2008 Tim Worbs Institute of Immunology Hannover Medical School 1 The course of a typical antibody
Active and Passive Immunization for Avian Influenza Virus Infections
 NIAID Active and Passive Immunization for Avian Influenza Virus Infections Kanta Subbarao, MD, MPH Laboratory of Infectious Diseases NIAID, NIH Immortalizing H5 HA-Specific Memory B Cells Collection of
B cell activation and antibody production. Abul K. Abbas UCSF
 1 B cell activation and antibody production Abul K. Abbas UCSF 2 Lecture outline B cell activation; the role of helper T cells in antibody production Therapeutic targeting of B cells 3 Principles of humoral
CELL BIOLOGY - CLUTCH CH THE IMMUNE SYSTEM.
 !! www.clutchprep.com CONCEPT: OVERVIEW OF HOST DEFENSES The human body contains three lines of against infectious agents (pathogens) 1. Mechanical and chemical boundaries (part of the innate immune system)
SUPPLEMENTARY INFORMATION
 Complete but curtailed T-cell response to very-low-affinity antigen Dietmar Zehn, Sarah Y. Lee & Michael J. Bevan Supp. Fig. 1: TCR chain usage among endogenous K b /Ova reactive T cells. C57BL/6 mice
Challenges in Vaccine Production and Rapid Scale up to Meet Emerging Pandemic Threats
 Challenges in Vaccine Production and Rapid Scale up to Meet Emerging Pandemic Threats Susan Dana Jones, Ph.D. BioProcess Technology Consultants, Inc. BIO 2009 Process Zone Theater Atlanta, GE May 20, 2009
1. Overview of Adaptive Immunity
 Chapter 17A: Adaptive Immunity Part I 1. Overview of Adaptive Immunity 2. T and B Cell Production 3. Antigens & Antigen Presentation 4. Helper T cells 1. Overview of Adaptive Immunity The Nature of Adaptive
All animals have innate immunity, a defense active immediately upon infection Vertebrates also have adaptive immunity
 1 2 3 4 5 6 7 8 9 The Immune System All animals have innate immunity, a defense active immediately upon infection Vertebrates also have adaptive immunity Figure 43.2 In innate immunity, recognition and
Broadly protective influenza vaccines for pandemic preparedness. Suresh Mittal Department of Comparative Pathobiology Purdue University
 Broadly protective influenza vaccines for pandemic preparedness Suresh Mittal Department of Comparative Pathobiology Purdue University Influenza A Virus Orthomyxovirus Consist of s/s (-) sense RNA 8 segments
Determinants of Immunogenicity and Tolerance. Abul K. Abbas, MD Department of Pathology University of California San Francisco
 Determinants of Immunogenicity and Tolerance Abul K. Abbas, MD Department of Pathology University of California San Francisco EIP Symposium Feb 2016 Why do some people respond to therapeutic proteins?
Influenza: The Threat of a Pandemic
 April, 2009 Definitions Epidemic: An increase in disease above what you what would normally expect. Pandemic: A worldwide epidemic 2 What is Influenza? Also called Flu, it is a contagious respiratory illness
MATERIALS AND METHODS. Neutralizing antibodies specific to mouse Dll1, Dll4, J1 and J2 were prepared as described. 1,2 All
 MATERIALS AND METHODS Antibodies (Abs), flow cytometry analysis and cell lines Neutralizing antibodies specific to mouse Dll1, Dll4, J1 and J2 were prepared as described. 1,2 All other antibodies used
Acquired Immunity 2. - Vaccines & Immunological Memory - Wataru Ise. WPI Immunology Frontier Research Center (IFReC) Osaka University.
 Osaka University.") Acquired Immunity 2 - Vaccines & Immunological Memory - Wataru Ise WPI Immunology Frontier Research Center (IFReC) Osaka University Outline 1. What is vaccine (vaccination)? 2. What is immunological memory?
Acquired Immunity 2 - Vaccines & Immunological Memory - Wataru Ise WPI Immunology Frontier Research Center (IFReC) Osaka University Outline 1. What is vaccine (vaccination)? 2. What is immunological memory?
Blocking Interhost Transmission of Influenza Virus by Vaccination in the Guinea Pig Model
 JOURNAL OF VIROLOGY, Apr. 2009, p. 2803 2818 Vol. 83, No. 7 0022-538X/09/$08.00 0 doi:10.1128/jvi.02424-08 Copyright 2009, American Society for Microbiology. All Rights Reserved. Blocking Interhost Transmission
Pandemic Influenza influenza epidemic: realization of a worst-case scenario
 Pandemic Influenza October 9, 2006 1918 influenza epidemic: realization of a worst-case scenario First case: Albert Mitchell, Camp Funston, KS, March 11, 1918 Up to 20% of all humans infected 20-50 million
Comparison of the CD4+ T cell and antibody responses to different Influenza vaccination regimens and to infection in naive and pre-exposed mice
 Sede Amministrativa: Università degli Studi di Padova Dipartimento di SCIENZE BIOMEDICHE SPERIMENTALI SCUOLA DI DOTTORATO DI RICERCA IN BIOSCIENZE INDIRIZZO BIOLOGIA CELLULARE XXII CICLO Comparison of
Patterns of hemagglutinin evolution and the epidemiology of influenza
 2 8 US Annual Mortality Rate All causes Infectious Disease Patterns of hemagglutinin evolution and the epidemiology of influenza DIMACS Working Group on Genetics and Evolution of Pathogens, 25 Nov 3 Deaths
Unit 5 The Human Immune Response to Infection
 Unit 5 The Human Immune Response to Infection Unit 5-page 1 FOM Chapter 21 Resistance and the Immune System: Innate Immunity Preview: In Chapter 21, we will learn about the branch of the immune system
There are 2 major lines of defense: Non-specific (Innate Immunity) and. Specific. (Adaptive Immunity) Photo of macrophage cell
 and. Specific. (Adaptive Immunity) Photo of macrophage cell") There are 2 major lines of defense: Non-specific (Innate Immunity) and Specific (Adaptive Immunity) Photo of macrophage cell Development of the Immune System ery pl neu mφ nk CD8 + CTL CD4 + thy TH1 mye
There are 2 major lines of defense: Non-specific (Innate Immunity) and Specific (Adaptive Immunity) Photo of macrophage cell Development of the Immune System ery pl neu mφ nk CD8 + CTL CD4 + thy TH1 mye
Question 1. Kupffer cells, microglial cells and osteoclasts are all examples of what type of immune system cell?
 Abbas Chapter 2: Sarah Spriet February 8, 2015 Question 1. Kupffer cells, microglial cells and osteoclasts are all examples of what type of immune system cell? a. Dendritic cells b. Macrophages c. Monocytes
Influenza. Gwen Clutario, Terry Chhour, Karen Lee
 Influenza Gwen Clutario, Terry Chhour, Karen Lee Overview Commonly referred to as the flu Defined as a highly contagious viral infection where it starts at the upper respiratory tract and attacks the nose,
Avian influenza Avian influenza ("bird flu") and the significance of its transmission to humans
 and the significance of its transmission to humans") 15 January 2004 Avian influenza Avian influenza ("bird flu") and the significance of its transmission to humans The disease in birds: impact and control measures Avian influenza is an infectious disease
15 January 2004 Avian influenza Avian influenza ("bird flu") and the significance of its transmission to humans The disease in birds: impact and control measures Avian influenza is an infectious disease
Q: If antibody to the NA and HA are protective, why do we continually get epidemics & pandemics of flu?
 Influenza virus Influenza virus Orthomyxoviridae family of viruses RNA enveloped viruses that make up three genera Influenzavirus A Influenzavirus B Influenzavirus C The type A viruses are the most virulent
numbe r Done by Corrected by Doctor
 numbe r 5 Done by Mustafa Khader Corrected by Mahdi Sharawi Doctor Ashraf Khasawneh Viral Replication Mechanisms: (Protein Synthesis) 1. Monocistronic Method: All human cells practice the monocistronic
PATH Influenza Vaccine Projects
 PATH Influenza Vaccine Projects Overview John W. Boslego, MD John Boslego Director, Vaccine Development Global Program March 25 th, 2014 Influenza Vaccine Project (IVP) at PATH IVP Goal: Advance the development
HIV-1 p24 ELISA Pair Set Cat#: orb54951 (ELISA Manual)
") HIV-1 p24 ELISA Pair Set Cat#: orb54951 (ELISA Manual) BACKGROUND Human Immunodeficiency Virus ( HIV ) can be divided into two major types, HIV type 1 (HIV-1) and HIV type 2 (HIV-2). HIV-1 is related to
HIV-1 p24 ELISA Pair Set Cat#: orb54951 (ELISA Manual) BACKGROUND Human Immunodeficiency Virus ( HIV ) can be divided into two major types, HIV type 1 (HIV-1) and HIV type 2 (HIV-2). HIV-1 is related to
Current Strategies in HIV-1 Vaccine Development Using Replication-Defective Adenovirus as a Case Study
 Note: I have added some clarifying comments to the slides -- please click on Comments under View to see them. Current Strategies in HIV-1 Vaccine Development Using Replication-Defective Adenovirus as a
PUBLIC HEALTH SIGNIFICANCE SEASONAL INFLUENZA AVIAN INFLUENZA SWINE INFLUENZA
 INFLUENZA DEFINITION Influenza is an acute highly infectious viral disease characterized by fever, general and respiratory tract catarrhal manifestations. Influenza has 3 Types Seasonal Influenza Avian
Effector T Cells and
 1 Effector T Cells and Cytokines Andrew Lichtman, MD PhD Brigham and Women's Hospital Harvard Medical School 2 Lecture outline Cytokines Subsets of CD4+ T cells: definitions, functions, development New
Biomedical Engineering for Global Health. Lecture 9 Vaccine development: from idea to product
 Biomedical Engineering for Global Health Lecture 9 Vaccine development: from idea to product Review of lecture 8 Pathogens: Bacteria and Virus Levels of Immunity: Barriers First line of defense Innate
VIRUSES. Biology Applications Control. David R. Harper. Garland Science Taylor & Francis Group NEW YORK AND LONDON
 VIRUSES Biology Applications Control David R. Harper GS Garland Science Taylor & Francis Group NEW YORK AND LONDON vii Chapter 1 Virus Structure and 2.2 VIRUS MORPHOLOGY 26 Infection 1 2.3 VIRAL CLASSIFICATION
General Overview of Immunology. Kimberly S. Schluns, Ph.D. Associate Professor Department of Immunology UT MD Anderson Cancer Center
 General Overview of Immunology Kimberly S. Schluns, Ph.D. Associate Professor Department of Immunology UT MD Anderson Cancer Center Objectives Describe differences between innate and adaptive immune responses
VIROLOGY OF INFLUENZA. Subtypes: A - Causes outbreak B - Causes outbreaks C - Does not cause outbreaks
 INFLUENZA VIROLOGY OF INFLUENZA Subtypes: A - Causes outbreak B - Causes outbreaks C - Does not cause outbreaks PATHOGENICITY High pathogenicity avian influenza (HPAI) Causes severe disease in poultry
INFLUENZA-2 Avian Influenza
 INFLUENZA-2 Avian Influenza VL 7 Dec. 9 th 2013 Mohammed El-Khateeb Overview 1. Background Information 2. Origin/History 3. Brief overview of genome structure 4. Geographical Distribution 5. Pandemic Nature
Influenza A H1N1 (Swine Flu 2009) Hemagglutinin / HA ELISA Pair Set
 Hemagglutinin / HA ELISA Pair Set") Influenza A H1N1 (Swine Flu 2009) Hemagglutinin / HA ELISA Pair Set Catalog Number : SEK001 To achieve the best assay results, this manual must be read carefully before using this product and the assay
Influenza A H1N1 (Swine Flu 2009) Hemagglutinin / HA ELISA Pair Set Catalog Number : SEK001 To achieve the best assay results, this manual must be read carefully before using this product and the assay
Influenza vaccines. Cheryl Cohen
 Influenza vaccines Cheryl Cohen cherylc@nicd.ac.za Overview Burden of influenza and risk groups Clinical presentation, diagnosis and treatment Influenza the virus Currently available influenza vaccines
Understanding basic immunology. Dr Mary Nowlan
 Understanding basic immunology Dr Mary Nowlan 1 Immunology Immunology the study of how the body fights disease and infection Immunity State of being able to resist a particular infection or toxin 2 Overview
WHO biosafety risk assessment and guidelines for the production and quality control of human influenza pandemic vaccines: Update
 WHO biosafety risk assessment and guidelines for the production and quality control of human influenza pandemic vaccines: Update 23 July 2009 Introduction This document updates guidance 1 from the World
Unit 2: Lesson 2 Case Studies: Influenza and HIV LESSON QUESTIONS
 1 Unit 2: Lesson 2 Case Studies: Influenza and HIV LESSON QUESTIONS What steps are involved in viral infection and replication? Why are some kinds of influenza virus more deadly than others? How do flu
Ralf Wagner Paul-Ehrlich-Institut
 www.pei.de Other Assays for the Detection of Neuraminidase (NA)-Specific Antibodies Ralf Wagner Paul-Ehrlich-Institut Overview to presented assays Assay principle based on: Chemical substrates: Protein
Transforming The Approach to Vaccines and Protein- Based Therapeutics. Alain Doucet, Ph.D. Manager, Process Development, Medicago
 Transforming The Approach to Vaccines and Protein- Based Therapeutics Alain Doucet, Ph.D. Manager, Process Development, Medicago 2018-08-15 1 Medicago Overview 2 Novel Technologies 3 Robust Pipeline 2
Chapter 22: The Lymphatic System and Immunity
 Bio40C schedule Lecture Immune system Lab Quiz 2 this week; bring a scantron! Study guide on my website (see lab assignments) Extra credit Critical thinking questions at end of chapters 5 pts/chapter Due
What is the immune system? Types of Immunity. Pasteur and rabies vaccine. Historical Role of smallpox. Recognition Response
 Recognition Response Effector memory What is the immune system? Types of Immunity Innate Adaptive Anergy: : no response Harmful response: Autoimmunity Historical Role of smallpox Pasteur and rabies vaccine
Innate Immunity & Inflammation
 Innate Immunity & Inflammation The innate immune system is an evolutionally conserved mechanism that provides an early and effective response against invading microbial pathogens. It relies on a limited
I. Lines of Defense Pathogen: Table 1: Types of Immune Mechanisms. Table 2: Innate Immunity: First Lines of Defense
 I. Lines of Defense Pathogen: Table 1: Types of Immune Mechanisms Table 2: Innate Immunity: First Lines of Defense Innate Immunity involves nonspecific physical & chemical barriers that are adapted for
Viral vaccines. Lec. 3 أ.د.فائزة عبد هللا مخلص
 Lec. 3 أ.د.فائزة عبد هللا مخلص Viral vaccines 0bjectives 1-Define active immunity. 2-Describe the methods used for the preparation of attenuated live & killed virus vaccines. 3- Comparison of Characteristics
Novel H1N1 Influenza. It s the flu after all! William Muth M.D. Samaritan Health Services 9 November 2009
 Novel H1N1 Influenza It s the flu after all! William Muth M.D. Samaritan Health Services 9 November 2009 Influenza A Primer.. What is the flu? How do you get it? What s a virus anyhow? Can the flu be prevented,
2009 H1N1 Influenza ( Swine Flu ) Hemagglutinin ELISA kit
 Hemagglutinin ELISA kit") 2009 H1N1 Influenza ( Swine Flu ) Hemagglutinin ELISA kit Catalog Number : SEK001 To achieve the best assay results, this manual must be read carefully before using this product and the assay is run as
2009 H1N1 Influenza ( Swine Flu ) Hemagglutinin ELISA kit Catalog Number : SEK001 To achieve the best assay results, this manual must be read carefully before using this product and the assay is run as
GSK s Adjuvanted Influenza Vaccines The Taming of the Flu
 GSK s Adjuvanted Influenza Vaccines The Taming of the Flu JITMM, Bangkok, October 2008 Bruce L. Innis, MD Global Clinical Research and Development GlaxoSmithKline Biologicals 1 Annual Burden of Influenza
Influenza. Influenza vaccines (WHO position paper) Weekly Epid. Record (2005, 80: ) 287
 Weekly Epid. Record (2005, 80: ) 287") Program Management 82_19 SAGE encouraged all countries to consider their preparedness for a potential influenza pandemic, recognizing that it would occur before strain-specific vaccine can be made in significant
Program Management 82_19 SAGE encouraged all countries to consider their preparedness for a potential influenza pandemic, recognizing that it would occur before strain-specific vaccine can be made in significant
Class 2: Acquired immunity and vaccination (part 1)
") Class 2: Acquired immunity and vaccination (part 1) Ed Ishiguro Department of Biochemistry and Microbiology And The UVic Speakers Bureau ishiguro@uvic.ca A quick summary Main properties of innate and acquired
Class 2: Acquired immunity and vaccination (part 1) Ed Ishiguro Department of Biochemistry and Microbiology And The UVic Speakers Bureau ishiguro@uvic.ca A quick summary Main properties of innate and acquired
VMC-221: Veterinary Immunology and Serology (1+1) Question Bank
 Question Bank") VMC-221: Veterinary Immunology and Serology (1+1) Objective type Questions Question Bank Q. No. 1 - Fill up the blanks with correct words 1. The British physician, who developed the first vaccine against
VMC-221: Veterinary Immunology and Serology (1+1) Objective type Questions Question Bank Q. No. 1 - Fill up the blanks with correct words 1. The British physician, who developed the first vaccine against
Physiology Unit 3. ADAPTIVE IMMUNITY The Specific Immune Response
 Physiology Unit 3 ADAPTIVE IMMUNITY The Specific Immune Response In Physiology Today The Adaptive Arm of the Immune System Specific Immune Response Internal defense against a specific pathogen Acquired
WHY IS THIS IMPORTANT?
 CHAPTER 16 THE ADAPTIVE IMMUNE RESPONSE WHY IS THIS IMPORTANT? The adaptive immune system protects us from many infections The adaptive immune system has memory so we are not infected by the same pathogen
Principles of Adaptive Immunity
 Principles of Adaptive Immunity Chapter 3 Parham Hans de Haard 17 th of May 2010 Agenda Recognition molecules of adaptive immune system Features adaptive immune system Immunoglobulins and T-cell receptors
Introduction to Immunology Part 2 September 30, Dan Stetson
 Introduction to Immunology Part 2 September 30, 2016 Dan Stetson stetson@uw.edu 441 Lecture #2 Slide 1 of 26 CLASS ANNOUNCEMENT PLEASE NO TREE NUTS IN CLASS!!! (Peanuts, walnuts, almonds, cashews, etc)