Influenza virus exploits tunneling nanotubes for cell-to-cell spread
|
|
|
- Mariah Fox
- 5 years ago
- Views:
Transcription
1 Supplementary Information Influenza virus exploits tunneling nanotubes for cell-to-cell spread Amrita Kumar 1, Jin Hyang Kim 1, Priya Ranjan 1, Maureen G. Metcalfe 2, Weiping Cao 1, Margarita Mishina 1, Shivaprakash Gangappa 1, Zhu Guo 3, Edward S. Boyden 4, Sherif Zaki 2, Ian York 1, Adolfo García-Sastre 5, Michael Shaw 6 and Suryaprakash Sambhara 1* 1 Immunology and Pathogenesis Branch, Influenza Division, Centers for Disease Control and Prevention, 1600 Clifton Road, Atlanta, GA , USA. 2 Infectious Diseases Pathology Branch, Division of High-Consequence Pathogens and Pathology, Centers for Disease Control and Prevention, 1600 Clifton Road, Atlanta, GA , USA. 3 Virus Surveillance and Diagnostics Branch, Influenza Division, Centers for Disease Control and Prevention, 1600 Clifton Road, Atlanta, GA , USA. 4 Media Lab, McGovern Institute, Department of Brain and Cognitive Sciences, MIT, Cambridge, MA, USA. 5 Department of Microbiology, Department of Infectious Disease, Global Health and Emerging Pathogens Institute and Department of Medicine, Division of Infectious Diseases, Icahn School of Medicine at Mount Sinai, New York. 6 Office of Infectious Diseases, Centers for Disease Control and Prevention, 1600 Clifton Road, Atlanta, GA , USA. * Address correspondence to ssambhara@cdc.gov Disclaimer The findings and conclusions in this report are those of the authors and do not necessarily represent the views of Centers for Disease Control and Prevention. 1
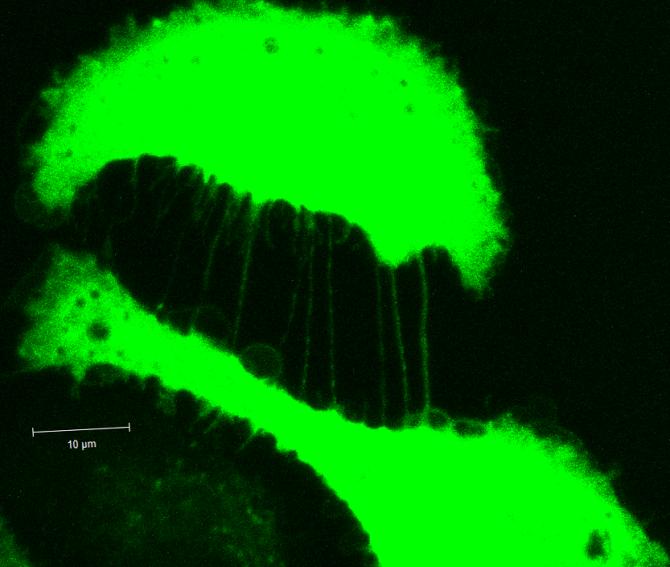
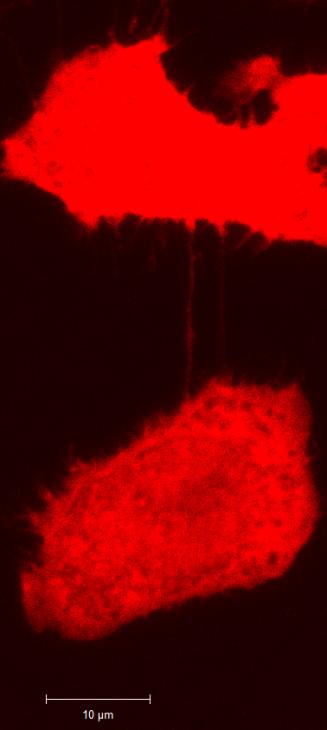
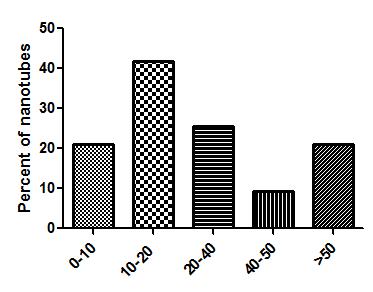
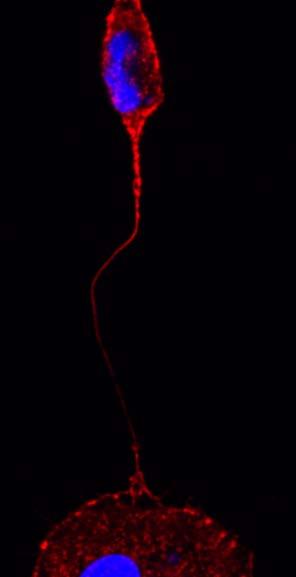
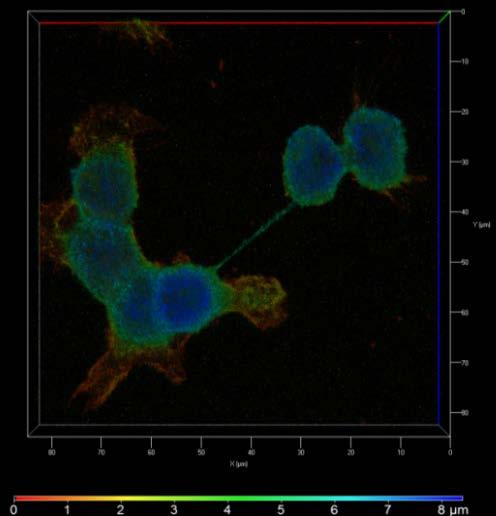
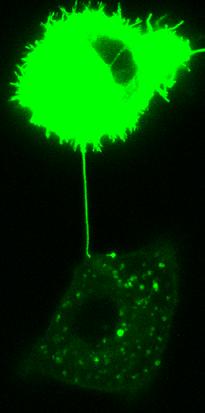
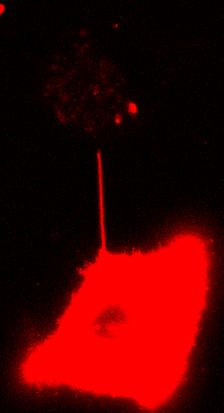
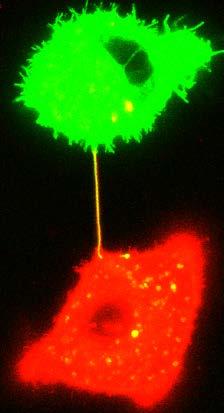
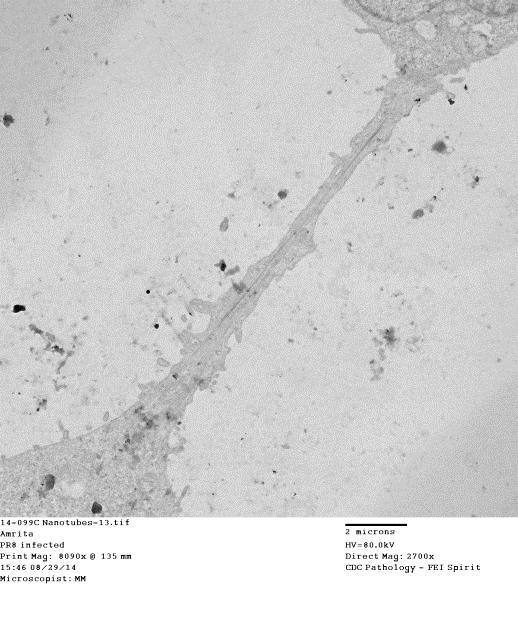
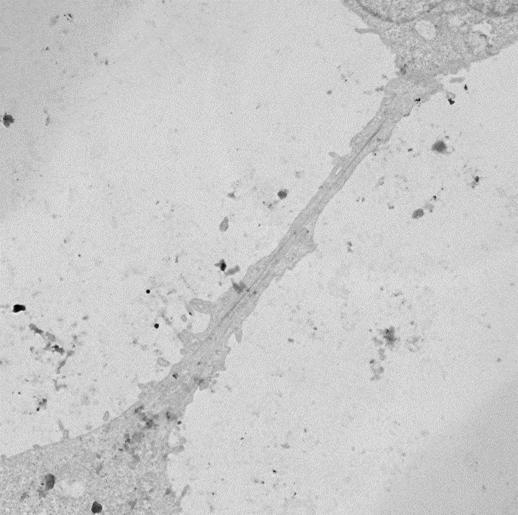
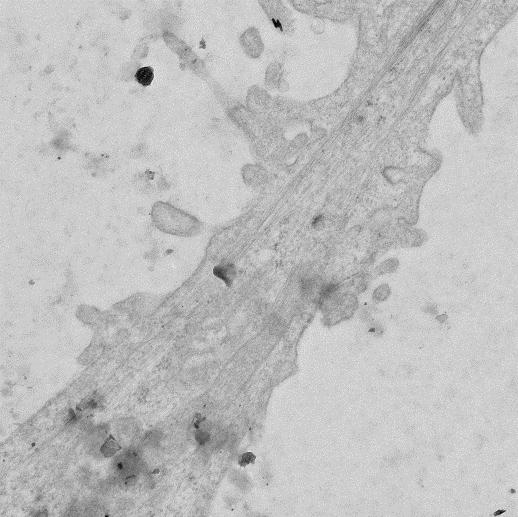
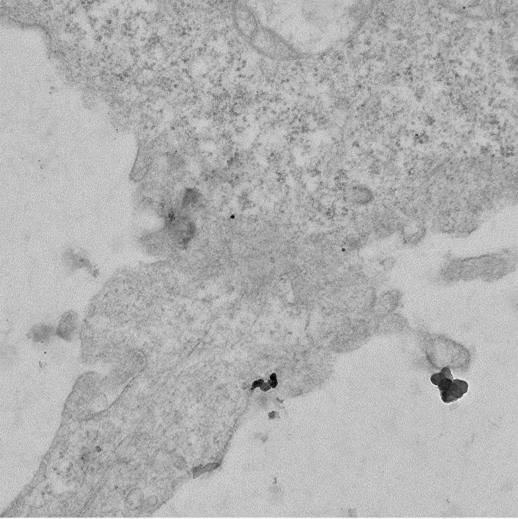
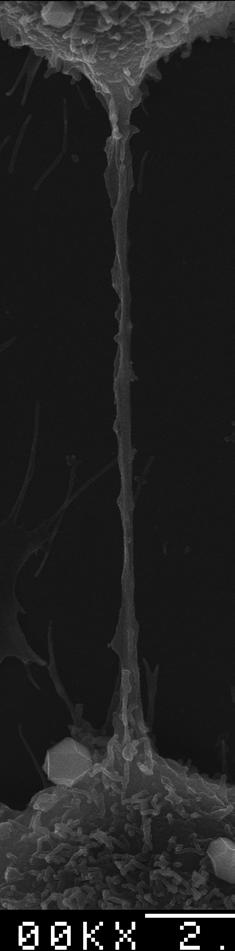
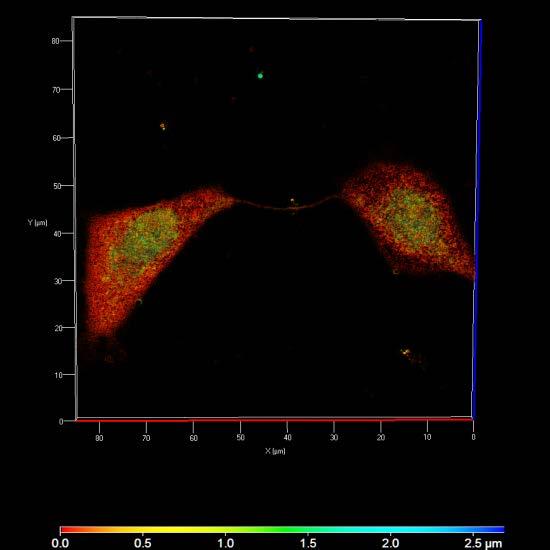
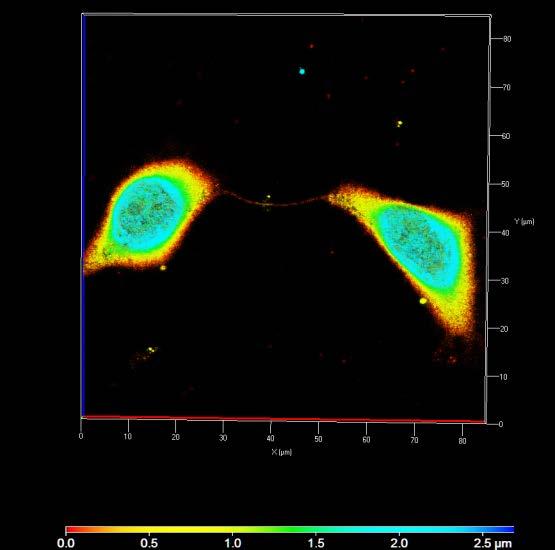
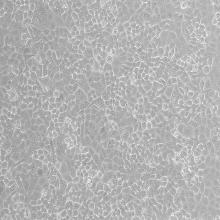
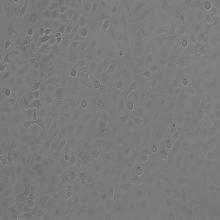
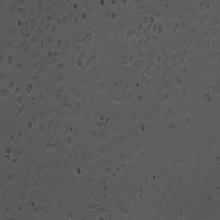
2 SUPPLEMENTAL FIGURE LEGENDS Supplementary Information Supplementary Figure 1. TNTs connect neighboring A549 cells. (a and b) 3D-live microscopy image showing TNT connecting neighboring A549 cells in a non-confluent monolayer (a) and a confluent monolayer (b). For both panels a and b, A549 cells were seeded on a glass-bottom culture dish for 4-6 h and images captured with a Zeiss confocal microscope equipped with a 100X /1.4 NA oil objective. (c) Average length of the TNTs in A549 cells. TNTs (n>250) were analyzed from more than three independent experiments. Percent of cells are plotted as function of the length of the TNTs, showing the heterogeneous nature of TNTs. (d and e) A549 cells connected by a curved (d) or branched (e) TNT, suggesting TNTs can grow in a 3D environment. Cells in (d) were stained with Alexa-594 phalloidin after fixation. (f and g) A549 cells lines stably transfected with either GFP (f) or RFP (g). Cells in e, f, and g were grown on glass bottom culture dish and imaged under live conditions. Supplementary Figure 2. Characterization of TNTs in MDCK and A549 cells. (a) Threedimensional analysis of TNT in A594 labelled with Alexa405-phallodin and as analyzed by depth analysis (Zeiss software). Color represents z-depth standing up on coverslip or the cell along the z-axis. Red indicates the glass cover slip; and blue, indicates distance furthest from the glass bottom. (b) TNT connecting two neighboring MDCK cells labelled with DiD and imaged under live conditions. (c) TNT connecting two neighboring A549 cells labelled with either the DiD (red) or DiO (green) dyes and co-incubated together before imaging. Figure 3. Ultra-structure of TNTs in MDCK cells. (a) Scanning electron microscopy (SEM) shows the ultrastructure of a TNT between two MDCK cells. Scale bar corresponds to 2 m. (b) A TEM section of MDCK cells cultured for 4 h after seeding, indicates the presence of TNTs 2
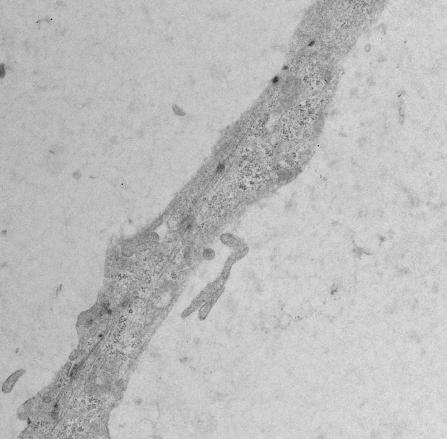
3 Supplementary Information connecting neighboring MDCK cells. The inset within shows lower magnification image of the TNT connecting two neighboring cells. Supplementary Figure 4. TEM images show bundles of fibers running along the length of the TNT. Higher magnification panels of the TNT as observed in MDCK cells by TEM. Blue arrows show bundles of fibers running along the length of the TNT. Supplementary Figure 5. Characterization of TNTs in A549 and MDCK cells. (a) TNTs contain actin and tubulin. Fixed sample of A549 cells stained with phalloidin (green) and antitubulin antibody (red). (b) A549 cells stained with DiD (red) mixed with unstained cells, was imaged for a period of 6 h under live conditions. Panels shows TNTs at 0 h (start time of imaging) and 4.5 h (time post imaging). TNTs shows a continuous connection between the two cells with punctate red staining in unstained cells. (c) SEM images of TNT before (left) and after (right) exposure to a high resolution scan. A breakage in the TNT was observed as it was being scanned. Supplementary Figure 6. TNT like structure showing presence of mitochondria and ribosomes. TEM image showing mitochondria and ribosome within a TNT-like structure. In this TEM grid, the cell was captured at one end of the TNT. Panels i-iv show higher magnifications images of the TNT shown in inset in panel i. Supplementary Figure 7. Tunneling nanotubes serve as a conduit for intracellular transport of IAV proteins. Fluorescent image of TNTs, shown in Fig 3, with color representing z-depth standing up on coverslip. The color coding denotes the cell along the z-axis. Red indicates the 3
4 Supplementary Information glass cover slip; and blue, indicates distance furthest from the glass bottom. The left panel for each viral protein shows the top stack and the right panel shows the bottom stack along the z-axis. Supplementary Figure 8. Two population model to evaluate spread of the viral proteins and genome via TNTs. (a) Panel showing a population of sorted NS1-GFP A549 cells. A549 cells infected with NS1-PR8 were sorted 6 h post-infection and cultured in complete media and monitored for upto 24h to ensure that cells were viable and free of contamination. (b) Panel showing infectivity of the NS1-GFP PR8 virus in the presence of 2000 HI units of neutralizing antibodies and Oseltamivir (100 M) as compared to infection in the presence of serum obtained from uninfected mice used in control panels. (c) Images showing infectivity of culture supernatants after serial passaging the NS1-GFP virus in A549 cells. (d) Plaque assay of culture supernatants from third passage of the NS1-GFP virus. (e) RT-PCR of culture supernatant from third passage of the NS1-GFP virus. For c-e, culture supernatants from A549 infected at an MOI of 1.0 for 96 h, was collected and serially passaged. At the end of the third passage (denoted as P3), culture supernatants were analyzed for the presence of virus as described denoted. No plaques or message for NP were observed in the presence of Oseltamivir and Neutralizing Antibodies. Supplementary Figure 9. (a) Detection of viral RNA in A549 cells using RNA fluorescence in situ hybridization. After experimental conditions, cells were fixed and processed with the ViewRNA ISH Cell Assay kit and a type6-probe set against nucleoprotein (NP) viral genomic segment (yellow). Blue, denotes DNA stained with DAPI; Red, denotes RFP-A549; green denotes A549 cells infected with the NS1-GFP virus and yellow shows the presence of the viral genomic segment. Plaque assay (b) and RT-PCR (c) in NS1-GFP infected cells grown in the presence of neutralizing antibodies (2000 HI units) and Oseltamivir (100 M). Uninfected A549-RFP cells 4
5 Supplementary Information were co-incubated with a NS1-GFP infected cells for 4 h. After co-incubation, the A549-RFP cells were sorted from the green NS1-GFP cells, and cultured in complete media containing Oseltamivir (100 M) and serum antibodies (2000 HI units) for the indicated times. The culture supernatants from samples were collected and subjected to plaque assay (a), and the remaining cells analyzed for expression of NP mrna by RT-PCR (b). Supplementary Movie Legends Supplementary Movie 1. Projection movie of phalloidin-labelled TNT in A549 cells. Images were obtained using a Zeiss Confocal Microscope and the image processed using depth analysis tool in Zen Still from this movie is shown in Supplementary Figure 2a. Shown is the entire depth along the Z- axis, starting at the bottom of the substratum (color coded red) and ending with the top of the cell (color coded blue). In this image the stack has a depth of 8 m and the TNT is colored green demonstrating the TNT is sitting at a depth of 3-5 m. This demonstrates the connection is not attached to the substratum. The video is played at a speed of 2 frames/sec. Supplementary Movie 2. Time-lapse microscopy showing that TNTs formation is dynamic with new connections forming over time. A549 cells were incubated in the microscope chamber with temperature and CO2 control and imaged over time, every 30 mins for 7 hrs. For each time points, multiple Z-stacks were obtained. The movie shows the compressed Z-stack played over time. At time 4 h and 4.5 h new TNTs appear keeping the cell in contact with each other (also shown as static images in supplementary figure 2c). The video is played at a speed of 2 frames/sec. 5
6 Supplementary Information Supplementary Movie 3. Time-lapse microscopy movie showing that TNTs form between two cells when two cells move apart. A549 cells were incubated in the microscope chamber with temperature and CO2 control and imaged over time, every 10 mins for 8 h. For each time points, multiple Z-stacks were obtained and the movie is edited in Z-stack and time. Movie shows the formation of TNT between two cells that move apart over time. The video is played at a speed of 2 frames/sec. Supplementary Movie 4. Time-lapse microscopy showing that TNTs connection are fragile and break under exposure to high laser power. A549 cells stained with DiD (red) were co-incubated and mounted in the microscope chamber with temperature and CO2 control. Z-stacks was collected every 30 mins for 7 h. Movie was made by compressing the Z-stacks at each time point and edited in time. Stills from this movie are shown in figure 1e. 6


7 e a c Fig 1. Length of the nanotubes (microns) b d e d d f e g

8 a a Fig 2. Alexa488-Phalloidin b c 10 µm

9 a b Fig 3 b 2 µm 2 µm


10 a Fig 4. i. ii. iii. iv. v. vi.


11 a Fig mm Anti-tubulin (Cat # 7634) Alexa488-Phalloidin b 0 h 10 µm 0 h 4.5 h c 2.5 µm


12 a Fig 6. i. ii. iii. iv. v.


13 Fig 7. NP HA M M1


14 a Fig 8. Con-1h post sort Inf-1h post sort Inf-24h post sort b Control 2000 HI Units Neutralizing antibodies Uninfected MOI = 0.1 MOI=1.0 MOI=10 d c e Virus titer (Log 10 PFU/ml) Uninfected Infected (P 3 ) Infected + Serum + Osel (P 3 ) MOI=1 MOI=1 +Serum + Oseltamivir Passage 3


")
15 Fig9. a. RFP-uninfected NS1 GFP R/G Quadrant R Quadrant DAPI NP RFP GFP Merge a b b. c. Virus titer (Log 10 PFU/ml) h Post-sort 24 h NP mrna (fold -increase over control) cont. 6 h 24 h post-sort
Supplementary Figure 1. SC35M polymerase activity in the presence of Bat or SC35M NP encoded from the phw2000 rescue plasmid.
 1 2 3 4 5 6 7 8 9 10 11 12 13 14 15 16 17 18 19 20 21 22 23 24 25 26 27 Supplementary Figure 1. SC35M polymerase activity in the presence of Bat or SC35M NP encoded from the phw2000 rescue plasmid. HEK293T
Supplementary table and figures
 3D single molecule tracking with multifocal plane microscopy reveals rapid intercellular transferrin transport at epithelial cell barriers Sripad Ram, Dongyoung Kim, Raimund J. Ober and E. Sally Ward Supplementary
Supplementary information. The Light Intermediate Chain 2 Subpopulation of Dynein Regulates Mitotic. Spindle Orientation
 Supplementary information The Light Intermediate Chain 2 Subpopulation of Dynein Regulates Mitotic Spindle Orientation Running title: Dynein LICs distribute mitotic functions. Sagar Mahale a, d, *, Megha
SUPPLEMENTARY INFORMATION
 DOI:.38/ncb3399 a b c d FSP DAPI 5mm mm 5mm 5mm e Correspond to melanoma in-situ Figure a DCT FSP- f MITF mm mm MlanaA melanoma in-situ DCT 5mm FSP- mm mm mm mm mm g melanoma in-situ MITF MlanaA mm mm
Supplementary Figure 1. Prevalence of U539C and G540A nucleotide and E172K amino acid substitutions among H9N2 viruses. Full-length H9N2 NS
 Supplementary Figure 1. Prevalence of U539C and G540A nucleotide and E172K amino acid substitutions among H9N2 viruses. Full-length H9N2 NS nucleotide sequences (a, b) or amino acid sequences (c) from
SUPPLEMENTARY INFORMATION
 SUPPLEMENTARY INFORMATION Advances in pancreatic islet monolayer culture on glass surfaces enable superresolution microscopy and insights into beta cell ciliogenesis and proliferation Edward A. Phelps,
Supplementary materials
 Supplementary materials Chemical library from ChemBridge 50,240 structurally diverse small molecule compounds dissolved in DMSO Hits Controls: No virus added μ Primary screening at 20 g/ml of compounds
Supplementary Figure 1: GFAP positive nerves in patients with adenocarcinoma of
 SUPPLEMENTARY FIGURES AND MOVIE LEGENDS Supplementary Figure 1: GFAP positive nerves in patients with adenocarcinoma of the pancreas. (A) Images of nerves stained for GFAP (green), S100 (red) and DAPI
J. Cell Sci. 129: doi: /jcs : Supplementary information
 Movie 1. AgLDL is contained in small sub-regions of the lysosomal synapse that are acidic. J774 cells were incubated with agldl dual labeled with a ph sensitive and a ph insensitive fluorophore for 1 hr.
Supplementary Figures
 Supplementary Figures Supplementary Figure 1 Characterization of stable expression of GlucB and sshbira in the CT26 cell line (a) Live cell imaging of stable CT26 cells expressing green fluorescent protein
Santulli G. et al. A microrna-based strategy to suppress restenosis while preserving endothelial function
 ONLINE DATA SUPPLEMENTS Santulli G. et al. A microrna-based strategy to suppress restenosis while preserving endothelial function Supplementary Figures Figure S1 Effect of Ad-p27-126TS on the expression
Supplementary Figure 1. Characterization of NMuMG-ErbB2 and NIC breast cancer cells expressing shrnas targeting LPP. NMuMG-ErbB2 cells (a) and NIC
 and NIC") Supplementary Figure 1. Characterization of NMuMG-ErbB2 and NIC breast cancer cells expressing shrnas targeting LPP. NMuMG-ErbB2 cells (a) and NIC cells (b) were engineered to stably express either a LucA-shRNA
Supplementary Figure 1. Characterization of NMuMG-ErbB2 and NIC breast cancer cells expressing shrnas targeting LPP. NMuMG-ErbB2 cells (a) and NIC cells (b) were engineered to stably express either a LucA-shRNA
MII. Supplement Figure 1. CapZ β2. Merge. 250ng. 500ng DIC. Merge. Journal of Cell Science Supplementary Material. GFP-CapZ β2 DNA
 A GV GVBD MI DNA CapZ β2 CapZ β2 Merge B DIC GFP-CapZ β2 Merge CapZ β2-gfp 250ng 500ng Supplement Figure 1. MII A early MI late MI Control RNAi CapZαβ DNA Actin Tubulin B Phalloidin Intensity(A.U.) n=10
Supplementary Figure 1 Expression of Crb3 in mouse sciatic nerve: biochemical analysis (a) Schematic of Crb3 isoforms, ERLI and CLPI, indicating the
 Schematic of Crb3 isoforms, ERLI and CLPI, indicating the") Supplementary Figure 1 Expression of Crb3 in mouse sciatic nerve: biochemical analysis (a) Schematic of Crb3 isoforms, ERLI and CLPI, indicating the location of the transmembrane (TM), FRM binding (FB)
Supplementary Figure 1 Expression of Crb3 in mouse sciatic nerve: biochemical analysis (a) Schematic of Crb3 isoforms, ERLI and CLPI, indicating the location of the transmembrane (TM), FRM binding (FB)
Nature Medicine: doi: /nm.4322
 1 2 3 4 5 6 7 8 9 10 11 Supplementary Figure 1. Predicted RNA structure of 3 UTR and sequence alignment of deleted nucleotides. (a) Predicted RNA secondary structure of ZIKV 3 UTR. The stem-loop structure
University of Groningen
 University of Groningen Mechanisms of Hemagglutinin Targeted Influenza Virus Neutralization Brandenburg, Boerries; Koudstaal, Wouter; Goudsmit, Jaap; Klaren, Vincent; Tang, Chan; Bujny, Miriam V.; Korse,
T H E J O U R N A L O F C E L L B I O L O G Y
 Supplemental material Chen et al., http://www.jcb.org/cgi/content/full/jcb.201210119/dc1 T H E J O U R N A L O F C E L L B I O L O G Y Figure S1. Lack of fast reversibility of UVR8 dissociation. (A) HEK293T
Supplementary Data Dll4-containing exosomes induce capillary sprout retraction ina 3D microenvironment
 Supplementary Data Dll4-containing exosomes induce capillary sprout retraction ina 3D microenvironment Soheila Sharghi-Namini 1, Evan Tan 1,2, Lee-Ling Sharon Ong 1, Ruowen Ge 2 * and H. Harry Asada 1,3
Supplementary Figure 1. Nature Neuroscience: doi: /nn.4547
 Supplementary Figure 1 Characterization of the Microfetti mouse model. (a) Gating strategy for 8-color flow analysis of peripheral Ly-6C + monocytes from Microfetti mice 5-7 days after TAM treatment. Living
The subcortical maternal complex controls symmetric division of mouse zygotes by
 The subcortical maternal complex controls symmetric division of mouse zygotes by regulating F-actin dynamics Xing-Jiang Yu 1,2, Zhaohong Yi 1, Zheng Gao 1,2, Dan-dan Qin 1,2, Yanhua Zhai 1, Xue Chen 1,
(a) Significant biological processes (upper panel) and disease biomarkers (lower panel)
 Significant biological processes (upper panel) and disease biomarkers (lower panel)") Supplementary Figure 1. Functional enrichment analyses of secretomic proteins. (a) Significant biological processes (upper panel) and disease biomarkers (lower panel) 2 involved by hrab37-mediated secretory
Supplementary Figure 1. Functional enrichment analyses of secretomic proteins. (a) Significant biological processes (upper panel) and disease biomarkers (lower panel) 2 involved by hrab37-mediated secretory
GFP-LC3 +/+ CLU -/- kda CLU GFP. Actin. GFP-LC3 +/+ CLU -/- kda CLU GFP. Actin
 Supplementary Fig. 1 a CQ treatment ScrB OGX11 MG132 I II AZD5363 I II b GFP / / GFP / / GFP / / GFP / / GFP GFP Actin Actin ctrl CQ GFP / / GFP / / GFP / / GFP / / GFP GFP Actin Actin rapamycin rapamycincq
SUPPLEMENTARY INFORMATION
 DOI: 10.1038/ncb2988 Supplementary Figure 1 Kif7 L130P encodes a stable protein that does not localize to cilia tips. (a) Immunoblot with KIF7 antibody in cell lysates of wild-type, Kif7 L130P and Kif7
FIG S1 Examination of eif4b expression after virus infection. (A) A549 cells
 A549 cells") Supplementary Figure Legends FIG S1 Examination of expression after virus infection. () 549 cells were infected with herpes simplex virus (HSV) (MOI = 1), and harvested at the indicated times, followed
Supplementary Figure Legends FIG S1 Examination of expression after virus infection. () 549 cells were infected with herpes simplex virus (HSV) (MOI = 1), and harvested at the indicated times, followed
Supplemental Information. Otic Mesenchyme Cells Regulate. Spiral Ganglion Axon Fasciculation. through a Pou3f4/EphA4 Signaling Pathway
 Neuron, Volume 73 Supplemental Information Otic Mesenchyme Cells Regulate Spiral Ganglion Axon Fasciculation through a Pou3f4/EphA4 Signaling Pathway Thomas M. Coate, Steven Raft, Xiumei Zhao, Aimee K.
Supplementary Fig. 1. Delivery of mirnas via Red Fluorescent Protein.
 prfp-vector RFP Exon1 Intron RFP Exon2 prfp-mir-124 mir-93/124 RFP Exon1 Intron RFP Exon2 Untransfected prfp-vector prfp-mir-93 prfp-mir-124 Supplementary Fig. 1. Delivery of mirnas via Red Fluorescent
Supplemental Information. Autophagy in Oncogenic K-Ras. Promotes Basal Extrusion. of Epithelial Cells by Degrading S1P. Current Biology, Volume 24
 Current Biology, Volume 24 Supplemental Information Autophagy in Oncogenic K-Ras Promotes Basal Extrusion of Epithelial Cells by Degrading S1P Gloria Slattum, Yapeng Gu, Roger Sabbadini, and Jody Rosenblatt
Supplementary material. Supplementary Figure legends
 Supplementary material Supplementary Figure legends Supplementary Figure 1: Senescence-associated proliferation stop in response to oncogenic N-RAS expression Proliferation of NHEM cells without (ctrl.)
Influenza A Virus Transmission Bottlenecks Are Defined by Infection Route and Recipient Host
 Cell Host & Microbe, Volume 16 Supplemental Information Influenza A Virus Transmission Bottlenecks Are Defined by Infection Route and Recipient Host Andrew Varble, Randy A. Albrecht, Simone Backes, Marshall
T H E J O U R N A L O F C E L L B I O L O G Y
 Supplemental material Edens and Levy, http://www.jcb.org/cgi/content/full/jcb.201406004/dc1 T H E J O U R N A L O F C E L L B I O L O G Y Figure S1. Nuclear shrinking does not depend on the cytoskeleton
Supplementary Materials for
 www.sciencetranslationalmedicine.org/cgi/content/full/4/117/117ra8/dc1 Supplementary Materials for Notch4 Normalization Reduces Blood Vessel Size in Arteriovenous Malformations Patrick A. Murphy, Tyson
SUPPLEMENTARY LEGENDS...
 TABLE OF CONTENTS SUPPLEMENTARY LEGENDS... 2 11 MOVIE S1... 2 FIGURE S1 LEGEND... 3 FIGURE S2 LEGEND... 4 FIGURE S3 LEGEND... 5 FIGURE S4 LEGEND... 6 FIGURE S5 LEGEND... 7 FIGURE S6 LEGEND... 8 FIGURE
Supplementary Information. Tissue-wide immunity against Leishmania. through collective production of nitric oxide
 Supplementary Information Tissue-wide immunity against Leishmania through collective production of nitric oxide Romain Olekhnovitch, Bernhard Ryffel, Andreas J. Müller and Philippe Bousso Supplementary
SUPPLEMENTARY INFORMATION
 Supplementary Information included with Nature MS 2008-02-01484B by Colantonio et al., entitled The dynein regulatory complex is required for ciliary motility and otolith biogenesis in the inner ear. This
Supplementary Figure 1. SA-β-Gal positive senescent cells in various cancer tissues. Representative frozen sections of breast, thyroid, colon and
 Supplementary Figure 1. SA-β-Gal positive senescent cells in various cancer tissues. Representative frozen sections of breast, thyroid, colon and stomach cancer were stained with SA-β-Gal and nuclear fast
Tanimoto et al., http ://www.jcb.org /cgi /content /full /jcb /DC1
 Supplemental material JCB Tanimoto et al., http ://www.jcb.org /cgi /content /full /jcb.201510064 /DC1 THE JOURNAL OF CELL BIOLOGY Figure S1. Method for aster 3D tracking, extended characterization of
(A) RT-PCR for components of the Shh/Gli pathway in normal fetus cell (MRC-5) and a
 RT-PCR for components of the Shh/Gli pathway in normal fetus cell (MRC-5) and a") Supplementary figure legends Supplementary Figure 1. Expression of Shh signaling components in a panel of gastric cancer. (A) RT-PCR for components of the Shh/Gli pathway in normal fetus cell (MRC-5) and
Supplementary figure legends Supplementary Figure 1. Expression of Shh signaling components in a panel of gastric cancer. (A) RT-PCR for components of the Shh/Gli pathway in normal fetus cell (MRC-5) and
Supplementary figure 1. Supplementary Figure 1. Flowchart of experimental procedures of in situ hybridization using ViewRNA technology.
 Supplementary figure 1 Supplementary Figure 1. Flowchart of experimental procedures of in situ hybridization using ViewRNA technology. Supplementary figure 2 Supplementary Figure 2. Evidence for existence
F-actin VWF Vinculin. F-actin. Vinculin VWF
 a F-actin VWF Vinculin b F-actin VWF Vinculin Supplementary Fig. 1. WPBs in HUVECs are located along stress fibers and at focal adhesions. (a) Immunofluorescence images of f-actin (cyan), VWF (yellow),
Suppl Video: Tumor cells (green) and monocytes (white) are seeded on a confluent endothelial
 and monocytes (white) are seeded on a confluent endothelial") Supplementary Information Häuselmann et al. Monocyte induction of E-selectin-mediated endothelial activation releases VE-cadherin junctions to promote tumor cell extravasation in the metastasis cascade
Supplementary Information Häuselmann et al. Monocyte induction of E-selectin-mediated endothelial activation releases VE-cadherin junctions to promote tumor cell extravasation in the metastasis cascade
Identification of Microbes Lecture: 12
 Diagnostic Microbiology Identification of Microbes Lecture: 12 Electron Microscopy 106 virus particles per ml required for visualization, 50,000-60,000 magnification normally used. Viruses may be detected
Nature Biotechnology: doi: /nbt Supplementary Figure 1. Analysis of hair bundle morphology in Ush1c c.216g>a mice at P18 by SEM.
 Supplementary Figure 1 Analysis of hair bundle morphology in Ush1c c.216g>a mice at P18 by SEM. (a-c) Heterozygous c.216ga mice displayed normal hair bundle morphology at P18. (d-i) Disorganized hair bundles
ROCK/Cdc42-mediated microglial motility and gliapse formation lead to phagocytosis of degenerating dopaminergic neurons in vivo
 Supplementary Information ROCK/Cdc42-mediated microglial motility and gliapse formation lead to phagocytosis of degenerating dopaminergic neurons in vivo Carlos Barcia* 1,2, Carmen M Ros 1,2, Valentina
genome edited transient transfection, CMV promoter
 Supplementary Figure 1. In the absence of new protein translation, overexpressed caveolin-1-gfp is degraded faster than caveolin-1-gfp expressed from the endogenous caveolin 1 locus % loss of total caveolin-1-gfp
CD3 coated cover slips indicating stimulatory contact site, F-actin polymerization and
 SUPPLEMENTAL FIGURES FIGURE S1. Detection of MCs. A, Schematic representation of T cells stimulated on anti- CD3 coated cover slips indicating stimulatory contact site, F-actin polymerization and microclusters.
ab CytoPainter Golgi/ER Staining Kit
 ab139485 CytoPainter Golgi/ER Staining Kit Instructions for Use Designed to detect Golgi bodies and endoplasmic reticulum by microscopy This product is for research use only and is not intended for diagnostic
Supplementary Information
 Nature Immunology doi:1.138/ni.2477 Supplementary Information Capillary and arteriolar pericytes attract innate leukocytes exiting through venules and instruct them with pattern recognition and motility
mm Distance (mm)
") b a Magnet Illumination Coverslips MPs Objective 2575 µm 1875 µm 1575 µm 1075 µm 875 µm 545 µm 20µm 2 3 0.5 0.3mm 1 1000 100 10 1 0.1 1000 100 10 1 0.1 Field Induction (Gauss) 1.5 0 5 10 15 20 Distance
b a Magnet Illumination Coverslips MPs Objective 2575 µm 1875 µm 1575 µm 1075 µm 875 µm 545 µm 20µm 2 3 0.5 0.3mm 1 1000 100 10 1 0.1 1000 100 10 1 0.1 Field Induction (Gauss) 1.5 0 5 10 15 20 Distance
SUPPLEMENTARY INFORMATION
 b 350 300 250 200 150 100 50 0 E0 E10 E50 E0 E10 E50 E0 E10 E50 E0 E10 E50 Number of organoids per well 350 300 250 200 150 100 50 0 R0 R50 R100 R500 1st 2nd 3rd Noggin 100 ng/ml Noggin 10 ng/ml Noggin
Thursday, October 16 th
 Thursday, October 16 th Good morning. Those of you needing to take the Enzymes and Energy Quiz will start very soon. Students who took the quiz Wednesday: Please QUIETLY work on the chapter 6 reading guide.
Supplementary Figures
 Inhibition of Pulmonary Anti Bacterial Defense by IFN γ During Recovery from Influenza Infection By Keer Sun and Dennis W. Metzger Supplementary Figures d a Ly6G Percentage survival f 1 75 5 1 25 1 5 1
Fluorescence Microscopy
 Fluorescence Microscopy Imaging Organelles Mitochondria Lysosomes Nuclei Endoplasmic Reticulum Plasma Membrane F-Actin AAT Bioquest Introduction: Organelle-Selective Stains Organelles are tiny, specialized
JCB. Supplemental material. Gu et al.,
 Supplemental material Gu et al., http://www.jcb.org/cgi/content/full/jcb.201010075/dc1 T H E J O U R N A L O F C E L L B I O L O G Y Figure S1. S1P directly induces actin assembly. Actin assembly at the
Supporting Information For
 Supporting Information For MicroRNA-Catalyzed Cancer Therapeutics Based on DNA-Programmed Nanoparticle Complex Xucheng Luo, 1 Zhi Li, 1 Ganglin Wang, 1 Xuewen He, 2,3 Xiaoqin Shen, 1 Quanhong Sun, 1 Li
(A) Cells grown in monolayer were fixed and stained for surfactant protein-c (SPC,
 Cells grown in monolayer were fixed and stained for surfactant protein-c (SPC,") Supplemental Figure Legends Figure S1. Cell line characterization (A) Cells grown in monolayer were fixed and stained for surfactant protein-c (SPC, green) and co-stained with DAPI to visualize the nuclei.
Supplemental Figure Legends Figure S1. Cell line characterization (A) Cells grown in monolayer were fixed and stained for surfactant protein-c (SPC, green) and co-stained with DAPI to visualize the nuclei.
nature methods Organelle-specific, rapid induction of molecular activities and membrane tethering
 nature methods Organelle-specific, rapid induction of molecular activities and membrane tethering Toru Komatsu, Igor Kukelyansky, J Michael McCaffery, Tasuku Ueno, Lidenys C Varela & Takanari Inoue Supplementary
SUPPORTING INFORMATION
 SUPPORTING INFORMATION SUPPLEMENTARY FIGURE LEGENDS Fig. S1. Separation of non-dissolved nanoparticles. Tests were conducted on the separation of non-dissolved nanoparticles added in excess to BEGM (A)
Type of file: PDF Title of file for HTML: Supplementary Information Description: Supplementary Figures
 Type of file: PDF Title of file for HTML: Supplementary Information Description: Supplementary Figures Type of file: MOV Title of file for HTML: Supplementary Movie 1 Description: NLRP3 is moving along
Supplementary Figure 1. mrna targets were found in exosomes and absent in free-floating supernatant. Serum exosomes and exosome-free supernatant were
 Supplementary Figure 1. mrna targets were found in exosomes and absent in free-floating supernatant. Serum exosomes and exosome-free supernatant were separated via ultracentrifugation and lysed to analyze
c Ischemia (30 min) Reperfusion (8 w) Supplementary Figure bp 300 bp Ischemia (30 min) Reperfusion (4 h) Dox 20 mg/kg i.p.
 Reperfusion (8 w) Supplementary Figure bp 300 bp Ischemia (30 min) Reperfusion (4 h) Dox 20 mg/kg i.p.") a Marker Ripk3 +/ 5 bp 3 bp b Ischemia (3 min) Reperfusion (4 h) d 2 mg/kg i.p. 1 w 5 w Sacrifice for IF size A subset for echocardiography and morphological analysis c Ischemia (3 min) Reperfusion (8
a Marker Ripk3 +/ 5 bp 3 bp b Ischemia (3 min) Reperfusion (4 h) d 2 mg/kg i.p. 1 w 5 w Sacrifice for IF size A subset for echocardiography and morphological analysis c Ischemia (3 min) Reperfusion (8
Serafino et al. Thymosin α1 activates complement receptor-mediated phagocytosis in human monocyte-derived macrophages. SUPPLEMENTARY FIGURES
 Supplementary Fig. S1. Evaluation of the purity and maturation of macrophage cultures tested by flow cytometry. The lymphocytic/monocytic cellular fraction was isolated from buffy coats of healthy donors
Supplementary Figure 1.
 Supplementary Figure 1. Visualization of endoplasmic reticulum-mitochondria interaction by in situ proximity ligation assay. A) Illustration of targeted proteins in mitochondria (M), endoplasmic reticulum
Supplementary Figure 1. The CagA-dependent wound healing or transwell migration of gastric cancer cell. AGS cells transfected with vector control or
 Supplementary Figure 1. The CagA-dependent wound healing or transwell migration of gastric cancer cell. AGS cells transfected with vector control or 3xflag-CagA expression vector were wounded using a pipette
Supplementary Figure 1: si-craf but not si-braf sensitizes tumor cells to radiation.
 Supplementary Figure 1: si-craf but not si-braf sensitizes tumor cells to radiation. (a) Embryonic fibroblasts isolated from wildtype (WT), BRAF -/-, or CRAF -/- mice were irradiated (6 Gy) and DNA damage
Supplementary Information
 Supplementary Information Supplementary Figure 1. EBV-gB 23-431 mainly exists as trimer in HEK 293FT cells. (a) Western blotting analysis for DSS crosslinked FLAG-gB 23-431. HEK 293FT cells transfected
SHREE ET AL, SUPPLEMENTAL MATERIALS. (A) Workflow for tumor cell line derivation and orthotopic implantation.
 Workflow for tumor cell line derivation and orthotopic implantation.") SHREE ET AL, SUPPLEMENTAL MATERIALS SUPPLEMENTAL FIGURE AND TABLE LEGENDS Supplemental Figure 1. Derivation and characterization of TS1-TGL and TS2-TGL PyMT cell lines and development of an orthotopic
SHREE ET AL, SUPPLEMENTAL MATERIALS SUPPLEMENTAL FIGURE AND TABLE LEGENDS Supplemental Figure 1. Derivation and characterization of TS1-TGL and TS2-TGL PyMT cell lines and development of an orthotopic
Ali Alabbadi. Bann. Bann. Dr. Belal
 31 Ali Alabbadi Bann Bann Dr. Belal Topics to be discussed in this sheet: Particles-to-PFU Single-step and multi-step growth cycles Multiplicity of infection (MOI) Physical measurements of virus particles
SUPPLEMENTARY INFORMATION
 Figure S1 Induction of non-apoptotic death of SV40-transformed and primary DKO MEFs, and DKO thymocytes. (A-F) STS-induced non-apoptotic death of DKO MEF. (A, B) Reduced viability of DKO MEFs after exposure
Nature Immunology: doi: /ni eee Supplementary Figure 1
 eee Supplementary Figure 1 Hyphae induce NET release, but yeast do not. (a) NET release by human peripheral neutrophils stimulated with a hgc1 yeast-locked C. albicans mutant (yeast) or pre-formed WT C.
Supplementary Figure 1: Co-localization of reconstituted L-PTC and dendritic cells
 a CD11c Na + K + ATPase Na + K + ATPase CD11c x-y CD11c Na + K + ATPase Na + K + ATPase CD11c x-z c b x-y view BoNT NAPs CD11c BoNT CD11c NAPs BoNT NAPs CD11c 90 x-z view Apical Basolateral Supplementary
Lai et al 2008 JCI RG-Revision 2
 Lai et al 2008 JCI 36612-RG-Revision 2 Suppmentary Table 1. Epitope specific dystrophin antibodies Name Epitope Dilution Source Dys-3* Hinge 1 1:20 Novocastra Dys-1 Repeats 6-8 1:100 Novocastra Mandys8
Macrophages form functional vascular mimicry channels in vivo. SI Figures and Legend
 Macrophages form functional vascular mimicry channels in vivo Authors: *Faith H. Barnett, *Mauricio Rosenfeld, Malcolm Wood, William Kiosses, Yoshihiko Usui, Valentina Marchetti, Edith Aguilar, and Martin
Nature Medicine: doi: /nm.2109
 HIV 1 Infects Multipotent Progenitor Cells Causing Cell Death and Establishing Latent Cellular Reservoirs Christoph C. Carter, Adewunmi Onafuwa Nuga, Lucy A. M c Namara, James Riddell IV, Dale Bixby, Michael
Wenqin Hu, Cuiping Tian, Tun Li, Mingpo Yang, Han Hou & Yousheng Shu
 Distinct contributions of Na v 1.6 and Na v 1.2 in action potential initiation and backpropagation Wenqin Hu, Cuiping Tian, Tun Li, Mingpo Yang, Han Hou & Yousheng Shu Supplementary figure and legend Supplementary
<20 <20 <20 < <20 <20 <20 <20. Mock
 Cross-Lineage Neutralization PRNT 80 Titers Asian Asian West African Indian Ocean Group NHP Strain 181/25 Strain 99659 Strain 37997 Strain LR 142590 80 80 20 40 EILV/CHIKV 150844 640 640 160 320 Mock 150849
CD4 and CD8 T cells show a similar accumulation in the tumor stroma.
 Fig S1 CD4 Fibronectin EpCM CD8 CD4 and CD8 T cells show a similar accumulation in the tumor stroma. Fluorescently-labeled CD4 (CMFD, green) and CD8 (Hoechst, yellow) T cells were added to a human lung
Supplemental information contains 7 movies and 4 supplemental Figures
 1 2 3 4 5 6 7 8 9 10 11 12 13 14 15 16 17 18 19 20 21 22 23 24 25 26 27 Supplemental information contains 7 movies and 4 supplemental Figures Movies: Movie 1. Single virus tracking of A4-mCherry-WR MV
Topic 9-10: Lab Skills (including 4 NYS required labs)
") 1. Base your answer on the diagram below and on your knowledge of biology. Which statement describes two unsafe laboratory practices represented in the diagram? (1) The flame is too high and the test tube
1. Base your answer on the diagram below and on your knowledge of biology. Which statement describes two unsafe laboratory practices represented in the diagram? (1) The flame is too high and the test tube
Relative activity (%) SC35M
 SC35M") a 125 Bat (H17N) b 125 A/WSN (H1N1) Relative activity (%) 0 75 50 25 Relative activity (%) 0 75 50 25 0 Pos. Neg. PA PB1 Pos. Neg. NP PA PB1 PB2 0 Pos. Neg. NP PA PB1 PB2 SC35M Bat Supplementary Figure
a 125 Bat (H17N) b 125 A/WSN (H1N1) Relative activity (%) 0 75 50 25 Relative activity (%) 0 75 50 25 0 Pos. Neg. PA PB1 Pos. Neg. NP PA PB1 PB2 0 Pos. Neg. NP PA PB1 PB2 SC35M Bat Supplementary Figure
well for 2 h at rt. Each dot represents an individual mouse and bar is the mean ±
 Supplementary data: Control DC Blimp-1 ko DC 8 6 4 2-2 IL-1β p=.5 medium 8 6 4 2 IL-2 Medium p=.16 8 6 4 2 IL-6 medium p=.3 5 4 3 2 1-1 medium IL-1 n.s. 25 2 15 1 5 IL-12(p7) p=.15 5 IFNγ p=.65 4 3 2 1
Temperature-Sensitive Mutants Isolated from Hamster and
 JOURNAL OF VIROLOGY, Nov. 1975, p. 1332-1336 Copyright i 1975 American Society for Microbiology Vol. 16, No. 5 Printed in U.S.A. Temperature-Sensitive Mutants Isolated from Hamster and Canine Cell Lines
Longitudinal tracking of single live cancer cells to understand cell cycle effects of the
 Longitudinal tracking of single live cancer cells to understand cell cycle effects of the nuclear export inhibitor, selinexor Joshua M. Marcus 1, Russell T. Burke 1, John A. DeSisto 1, Yosef Landesman
Supplementary Materials for
 advances.sciencemag.org/cgi/content/full/3/6/e1700338/dc1 Supplementary Materials for HIV virions sense plasma membrane heterogeneity for cell entry Sung-Tae Yang, Alex J. B. Kreutzberger, Volker Kiessling,
18.2 Viruses and Prions
 KEY CONCEPT Infections can be caused in several ways. Viruses, bacteria, viroids, and prions can all cause infection. Any disease-causing agent is called a pathogen. 1 nanometer (nm) = one billionth of
High resolution structural evidence suggests the Sarcoplasmic Reticulum forms microdomains with Acidic Stores (lyososomes) in the heart.
 in the heart.") High resolution structural evidence suggests the Sarcoplasmic Reticulum forms microdomains with Acidic Stores (lyososomes) in the heart. Daniel Aston, Rebecca A. Capel, Kerrie L. Ford, Helen C. Christian,
High resolution structural evidence suggests the Sarcoplasmic Reticulum forms microdomains with Acidic Stores (lyososomes) in the heart. Daniel Aston, Rebecca A. Capel, Kerrie L. Ford, Helen C. Christian,
T H E J O U R N A L O F C E L L B I O L O G Y
 T H E J O U R N A L O F C E L L B I O L O G Y Supplemental material Dunsch et al., http://www.jcb.org/cgi/content/full/jcb.201202112/dc1 Figure S1. Characterization of HMMR and CHICA antibodies. (A) HeLa
Pollen Slide Mounting Protocol
 Pollen Slide Mounting Protocol Materials: Syn-Matrix mounting medium Microcentrifuge Microscope slides Slide coverslips (18mm x 18mm) Coverslip podium (see Figure 1) Capillary tubes Dissecting microscope
activation with anti-cd3/cd28 beads and 3d following transduction. Supplemental Figure 2 shows
 Supplemental Data Supplemental Figure 1 compares CXCR4 expression in untreated CD8 + T cells, following activation with anti-cd3/cd28 beads and 3d following transduction. Supplemental Figure 2 shows the
Dynamic Interaction of Stress Granule, DDX3X and IKK-α Mediates Multiple Functions in
 Dynamic Interaction of Stress Granule, and Mediates Multiple Functions in Hepatitis C Virus Infection Véronique Pène, Qisheng Li#, Catherine Sodroski, Ching-Sheng Hsu, T. Jake Liang# Liver Diseases Branch,
(A) PCR primers (arrows) designed to distinguish wild type (P1+P2), targeted (P1+P2) and excised (P1+P3)14-
 PCR primers (arrows) designed to distinguish wild type (P1+P2), targeted (P1+P2) and excised (P1+P3)14-") 1 Supplemental Figure Legends Figure S1. Mammary tumors of ErbB2 KI mice with 14-3-3σ ablation have elevated ErbB2 transcript levels and cell proliferation (A) PCR primers (arrows) designed to distinguish
1 Supplemental Figure Legends Figure S1. Mammary tumors of ErbB2 KI mice with 14-3-3σ ablation have elevated ErbB2 transcript levels and cell proliferation (A) PCR primers (arrows) designed to distinguish
were isolated from the freshly drawn blood of healthy donors and ACS patients using the
 Supplemental Figure 1. Quality control of CD4 + T-cell purification. CD4 + T cells were isolated from the freshly drawn blood of healthy donors and ACS patients using the RosetteSep CD4 + T Cell Enrichment
Supplementary information - Table (1), Figures (12), and Videos (5)
, Figures (12), and Videos (5)") Supplementary information - Table (1), Figures (12), and Videos (5) A soft, transparent, freely accessible cranial window for chronic imaging and electrophysiology Chaejeong Heo 1, Hyejin Park 1, 2, Yong-Tae
Supplementary information - Table (1), Figures (12), and Videos (5) A soft, transparent, freely accessible cranial window for chronic imaging and electrophysiology Chaejeong Heo 1, Hyejin Park 1, 2, Yong-Tae
SUPPLEMENTARY FIGURES AND TABLES
 SUPPLEMENTARY FIGURES AND TABLES Supplementary Figure S1: CaSR expression in neuroblastoma models. A. Proteins were isolated from three neuroblastoma cell lines and from the liver metastasis of a MYCN-non
(a) Schematic diagram of the FS mutation of UVRAG in exon 8 containing the highly instable
 Schematic diagram of the FS mutation of UVRAG in exon 8 containing the highly instable") Supplementary Figure 1. Frameshift (FS) mutation in UVRAG. (a) Schematic diagram of the FS mutation of UVRAG in exon 8 containing the highly instable A 10 DNA repeat, generating a premature stop codon
Supplementary Figure 1. Frameshift (FS) mutation in UVRAG. (a) Schematic diagram of the FS mutation of UVRAG in exon 8 containing the highly instable A 10 DNA repeat, generating a premature stop codon
33VASTVNGATSANNHGEPPS51PADARPR58
 Pro-rich region Trans-membrane region 214 246 359 381 UL50 1 397 211SSRTAS216PPPPPR222 NLS CR1 CR2 CR3 CR4 UL53 1 376 11RERRS15ALRS19LLRKRRR25 33VASTVNGATSANNHGEPPS51PADARPR58 FIG S1. UL97 phosphorylation
Supplementary Figure S1. Venn diagram analysis of mrna microarray data and mirna target analysis. (a) Western blot analysis of T lymphoblasts (CLS)
 Western blot analysis of T lymphoblasts (CLS)") Supplementary Figure S1. Venn diagram analysis of mrna microarray data and mirna target analysis. (a) Western blot analysis of T lymphoblasts (CLS) and their exosomes (EXO) in resting (REST) and activated
Supplementary Figure S1. Venn diagram analysis of mrna microarray data and mirna target analysis. (a) Western blot analysis of T lymphoblasts (CLS) and their exosomes (EXO) in resting (REST) and activated
SUPPLEMENTARY INFORMATION
 DOI: 10.1038/ncb3021 Supplementary figure 1 Characterisation of TIMPless fibroblasts. a) Relative gene expression of TIMPs1-4 by real time quantitative PCR (RT-qPCR) in WT or ΔTimp fibroblasts (mean ±
hemagglutinin and the neuraminidase genes (RNA/recombinant viruses/polyacrylamide gel electrophoresis/genetics)
") Proc. Natl. Acad. Sci. USA Vol. 73, No. 6, pp. 242-246, June 976 Microbiology Mapping of the influenza virus genome: Identification of the hemagglutinin and the neuraminidase genes (RNA/recombinant viruses/polyacrylamide
Proc. Natl. Acad. Sci. USA Vol. 73, No. 6, pp. 242-246, June 976 Microbiology Mapping of the influenza virus genome: Identification of the hemagglutinin and the neuraminidase genes (RNA/recombinant viruses/polyacrylamide
Supplementary Figure S1
 Supplementary Figure S1 Supplementary Figure S1. PARP localization patterns using GFP-PARP and PARP-specific antibody libraries GFP-PARP localization in non-fixed (A) and formaldehyde fixed (B) GFP-PARPx
Supplementary Figures
 Supplementary Figures Supplementary Figure 1. Confirmation of Dnmt1 conditional knockout out mice. a, Representative images of sorted stem (Lin - CD49f high CD24 + ), luminal (Lin - CD49f low CD24 + )