A Clear View Identifying Australians who live with deafblindness and dual sensory loss
|
|
|
- Bonnie Cole
- 5 years ago
- Views:
Transcription


1 A Clear View Identifying Australians who live with deafblindness and dual sensory loss Prepared for Senses Australia by Paula Dyke, July 2013
2 About the Author Paula Dyke Paula Dyke originally qualified as a physiotherapist and has spent the last 30 years working initially as a clinician and manager of large allied health teams before completing her Master s degree in Public Health in Since that time her interest has been in research and evaluation within the disability sector. Over the last seven years, Paula has undertaken a wide variety of evaluative and research consultancy work for a range of organisations including Curtin University of Western Australia, Uniting Care West, Disability Services Commission of Western Australia, Activ, The Centre for Cerebral Palsy and The Telethon Institute of Child Health Research. Paula has extensive qualitative and quantitative research skills, well established project management skills and has lectured undergraduate medical and allied health students in both epidemiology and research methods. Paula has also written a number of reports and has had her work published in internationally peer reviewed journals including the Journal of Intellectual and Developmental Disability, Acta Paediatrica and Academic Medicine. This work is copyright. Except as is provided below, Senses Australia reserves and withholds all intellectual property rights. Senses Australia hereby grants you a non-exclusive, perpetual licence to broadcast, lend and distribute this work for training or educational purposes subject to Senses Australia being acknowledged as the source. Apart from any use permitted under the Copyright Act 1968, you must not make any other use of this work including copying, hiring, lending, duplication, distribution, reproduction or on-selling, of this work, without the prior written consent of the Senses Australia. A Clear View i


3 A Clear View Identifying Australians who live with deafblindness and dual sensory loss Contents Executive Summary ii-ix 1. Background to the Project The Literature Congenital deafblindness Acquired Deafblindness Methodology Survey of Disability, Ageing and Carers Disability Services National Minimum Data Set Definitions 24 Results Age and Gender Geographical location Core Activity Limitation Long-term health conditions Living Arrangements Carer Characteristics Support needs Discussion and Key Findings References Appendices 75 A Clear View ii

4 A Clear View Identifying Australians who live with deafblindness and dual sensory loss A snapshot of the key findings. A Clear View iii
5 Executive Summary Individuals who have a combined sensory disability of vision and hearing loss face a number of challenges not experienced by others with different types of disability. The impact of a concurrent sensory impairment on a person s life is considered to be more severe than that of two separate single impairments. The prevalence of deafblindness has been described as difficult to ascertain and often underestimated. In 2009 in Australia, findings from the Survey of Disability, Ageing and Carers (SDAC) indicated that 87,164 people reported having diseases of the eye and adnexa as their primary disability and 305,074 people reported having diseases of the ear and mastoid process as their primary disability. Similarly in Western Australia (WA), 9,940 people reported having diseases of the eye and adnexa as their primary disability and 31,731 people reported having diseases of the ear and mastoid process as their primary disability. 1 There is no report of the estimated number of people who are deafblind in either WA or Australia. This project and resulting report builds on initial work by the Senses Foundation, completed in 2007, to identify demographic characteristics of those who were blind with additional disabilities and people who were deafblind throughout Western Australia. It focused on obtaining a picture of the demographic characteristics and service needs of those with a dual vision and hearing impairment within WA and across Australia. The specific aims of the project were to identify: n the number of individuals with a dual sensory disability of vision and hearing loss within WA and across Australia; n the age and gender of these individuals; n the geographical distribution of these individuals, with a specific aim of ascertaining the number of individuals living in rural and remote areas of the country; and n the degree of activity and participation limitations for the target group. 1 Australian Bureau of Statistics (ABS) Disability, Ageing and Carers, Australia: Summary of Findings Available at A Clear View iv

, as presented in a report produced by the Australian Institute of Health and Welfare for the 2009-10 period.")

6 The methodology involved using existing population based statistical data to determine the key outcome objectives related to the target population. The primary source of data was the 2009 Survey of Disability, Ageing and Carers. Senses Australia used the Australian Bureau of Statistics consultancy service to produce data, from the 2009 SDAC, specific to the target group. The secondary data source was the Disability Services National Minimum Dataset (DS NMDS), as presented in a report produced by the Australian Institute of Health and Welfare for the period. 2 The results of this project produced eleven key findings related to those with a dual sensory impairment of vision and hearing loss living in both WA and Australia. The results from the data analysis produced more extensive information than the original project aims, providing some additional information related to carers of those with a dual sensory disability along with some detail regarding the need for assistance in a range of broad activity tasks. Key Finding 1 In 2009, an estimated 7,900 Western Australians and 99,800 Australians had a dual sensory disability of loss of vision and loss of hearing. The target group made up 0.35% and 0.5% of the resident population for WA and Australia respectively. 2 Australian Institute of Health and Welfare ( AIHW). Disability Support Services Canberra; A Clear View v

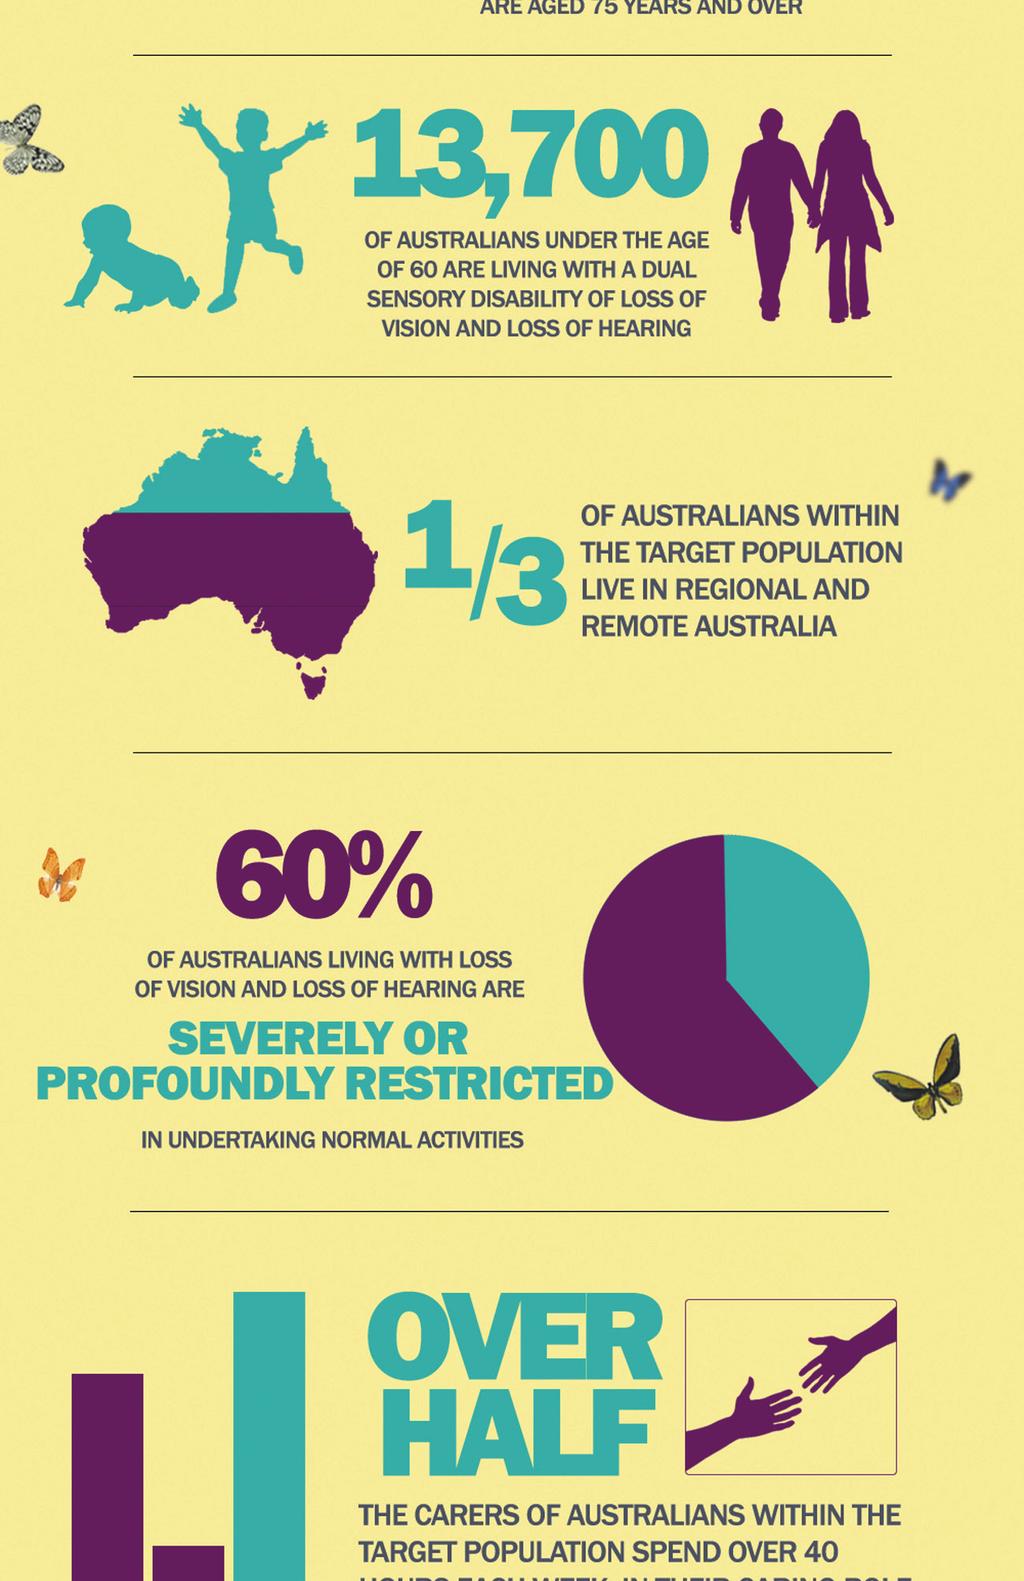
7 Key Finding 2 Individuals with a primary disability of deafblind made up 0.2% (n = 679) of all users of disability support services. Key Finding 3 For both WA and Australia, overall there was a greater proportion of women than men reporting having the dual sensory disability of loss of vision and loss of hearing. However in the younger age groups more males than females reported having this disability type. Up to two-thirds of people in this target group were the elderly, aged 75 years and older (62% in WA and 67% in Australia). A Clear View vi
 of deafblind service users compared with 6% (n = 18,006) of all disability support service users in this age group.")

8 Key Finding 4 Similar proportions of males and females with a primary disability of deafblindness were users of disability support services. Those 65 years and older made up 20% (n = 140) of deafblind service users compared with 6% (n = 18,006) of all disability support service users in this age group. Key Finding 5 Approximately a third (n = 38,100 in Australia, n = 2,400 in WA) of people with diseases of the eye and adnexa and diseases of the ear and mastoid process live in regional and remote areas of Australia. In both Australia and WA more males than females with diseases of the eye and adnexa and diseases of the ear and mastoid process live in regional and remote areas. A Clear View vii
 of people with loss of hearing and loss of vision reported having no specific limitation in core activities.")
9 Key Finding 6 The degree of activity and participation limitations among those with the dual sensory disability of vision and hearing loss increased with age and was greatest among those aged 75 years and older both within WA and Australia. Only an estimated 4.2% (n = 4,200) of people with loss of hearing and loss of vision reported having no specific limitation in core activities. Over half (61%, n = 60,800) of those with loss of vision and loss of hearing in Australia reported a profound or severe core activity limitation and almost a third a moderate or mild core activity limitation. Key Finding 7 In Australia, labour force participation rates were lower for males with loss of sight and loss of hearing than those for all males with disabilities (47.2% compared to 60% respectively) and for females in the target group compared to all females with disabilities (28.2% compared to 49% respectively). A Clear View viii
10 Key Finding 8 For those over 60 years with diseases of the eye and adnexa and diseases of the ear and mastoid process more than three quarters of people reported living in private dwellings in both WA and Australia. In Australia, 40% (n = 35,800) of those with diseases of the eye and adnexa and diseases of the ear and mastoid process who lived in private dwellings had profound or core activity limitations compared to almost all (97%, n = 20,600 ) of those living in non-private dwellings. Key Finding 9 There is an estimated 700 carers of people who have diseases of the eye and adnexa and diseases of the ear and mastoid process in WA and 17,000 primary carers of the target group across Australia. Key Finding 10 In WA the primary carers of people who have diseases of the eye and adnexa and diseases of the ear and mastoid process are all women, however across Australia a third of carers of the target group are males (33%, n = 5,700). A Clear View ix

11 Key Finding 11 Just over half (n = 8,900) of primary carers of persons with diseases of the eye and adnexa and diseases of the ear and mastoid process spend 40 hours or more per week in the caring role. A Clear View x
12 1. Background to the Project A Clear View was commissioned by Senses Australia in In 2013, Senses Foundation converted from an incorporated association to a company limited by guarantee, called Senses Australia, in order to take advantage of new opportunities opening up within the National disability agenda. Senses Australia will use the results of this project to assist in determining the specific service needs of individuals who are deafblind and people who have a dual sensory disability of vision and hearing loss in WA and Australia along with providing direction in terms of future strategic planning, policy change and development and planning of the provision of services. In 2004, the Senses Foundation undertook a major review of its strategic direction and in doing so refined the definition of its clients, their geographical distribution and their age from the very narrow focus which it held previously to a considerably larger target population. This refining of the target population saw a shift to include the provision of services to people from birth to death and changes in eligibility for services to include persons who may be congenitally deafblind or acquire a dual vision and hearing disability as a result of disease, injury or ageing. In beginning to implement the new strategic plan, Senses Foundation was unaware of the number of people in Western Australia (WA) who were likely to fall within their new broader target population. As a result Senses Foundation conducted their own research, using a Research Consultant and the Australian Institute of Health A Clear View 01
13 and Welfare (AIHW) to identify demographic characteristics of those who were blind with additional disabilities and people who were deafblind throughout Western Australia. This work resulted in a report known as Unseen and Unheard: The identification of people who are deafblind and people who are vision impaired with additional disabilities in Western Australia. 1 This project and resulting report, A Clear View, builds on the initial work completed in 2007, to obtain a picture of the demographic characteristics and service needs of those with a dual vision and hearing impairment within Western Australia and across Australia. The specific aims of the project were to identify: the number of individuals with a dual sensory disability of vision and hearing loss within WA and across Australia; the age and gender of these individuals; the geographical distribution of these individuals, with a specific aim of ascertaining the number of individuals living in rural and remote areas of the country; and the degree of activity and participation limitations for the target group. 2. The Literature Four million people in Australia (18.5%) reported having a disability in 2009, with males and females being similarly affected by disability (18% and 19% respectively). 2 Disability is defined as any limitation, restriction or impairment, which has lasted, or A Clear View 02
14 is likely to last, for at least six months and restricts everyday activities. 3 The prevalence of disability has fallen 1.5 percentage points since 2003, that is, 20% of Australians in 2003 had a reported disability compared with 18.5% in The Australian Bureau of Statistics (ABS) states that the decrease in the prevalence of disability between 2003 and 2009 is due to a decline in the proportion of Australians disabled by physical health conditions such as asthma and heart disease. 2 In 2009 in Australia, findings from the Survey of Disability, Ageing and Carers (SDAC) indicated that 87,164 people reported having diseases of the eye and adnexa as their primary disability and 305,074 people reported having diseases of the ear and mastoid process as their primary disability. Similarly in WA, 9,940 people reported having diseases of the eye and adnexa as their primary disability and 31,731 people reported having diseases of the ear and mastoid process as their primary disability. 2 There is no report of the estimated number of people who are deafblind in either WA or Australia. Individuals who have a combined sensory disability of vision and hearing loss face a number of challenges not experienced by others with different types of disability. The impact of a concurrent sensory impairment on a person s life is more severe than that of two separate single impairments. 4 In the United States (US), where most of the research on people who are deafblind has been carried out, the legal definition of blindness is vision acuity for distant vision 20/200 for the better eye. 5 The World Health Organisation (WHO) defines deafness as a permanent unaided hearing threshold for the better ear of 81dB for the 0.5-2kHz range. cited in 5 Researchers and A Clear View 03
15 professionals in the field of sensory impairment consider that an individual demonstrates deafblindness when the hearing loss in the better ear is >35 decibels, and the reduction in vision is <0.3 (equivalent to <20/60). 4 The Australian DeafBlind Council defines deafblindness in the following way: Deafblindness is a unique and isolating sensory disability resulting from the combination of both a hearing and vision loss or impairment which significantly affects communication, socialisation, mobility and daily living 6, p.12 The prevalence of deafblindness has been described as difficult to ascertain and often underestimated. 6,7 Difficulties determining prevalence has been attributed to inconsistent definitions of deafblindness; difficulties in assessing sensory functioning in persons with severe cognitive and behavioural issues; inappropriate placement of many deafblind persons in programs designed for other populations of disabilities (for example, autism) and underestimation of self-reported measures of concurrent vision and hearing impairments amongst the aged. 8,9 Until recently, from both a national and international perspective, the population of deafblind has received little attention in the literature. The topic of dual sensory disability and its rehabilitation, has been the focus of increasing research and commentary in large due to the rapidly increasing numbers of older adults with vision and hearing impairment. 10 A Clear View 04
16 Individuals with dual sensory loss have been described as being classified into three categories: those with congenital or early postnatal vision and hearing impairments; those individuals with a congenital or early postnatal impairment in either vision or hearing and acquired dual sensory impairment through late-onset changes; and those who develop a dual sensory impairment in adulthood through the onset of age related changes or age related disease to sensory organs. 11 More commonly, those who are deafblind are described as having congenital deafblindness or acquired deafblindness. Recent research has highlighted the significant differences between those who are congenitally deafblind and those with acquired deafblindness. Differences in living arrangements, marital status, communication modes and employment status have been found with those with acquired deafblindness more likely to be married, live in private dwellings, be employed and communicate with speech. 9 Persons with congenital deafblindness have multiple challenges in the functions of communication, social interaction, mobility and activities of daily living. Those with acquired deafblindness also have a unique set of issues that are often dominated by social isolation, feelings of loneliness and depression from adjusting to loss of life roles. 9 Despite an increase in the cited literature related to dual sensory disability, there continues to be a paucity of literature and well-designed research on both the epidemiology of deafblind disabilities and effective assessment, interventions and outcomes. The remainder of this section of the report will highlight the relevant literature sourced related to the epidemiology and aetiology of deafblindness. A Clear View 05
17 2.1 Congenital deafblindness Congenital deafblindness is related to several aetiologies, including several rare hereditary syndromes. The overall prevalence of congenital deafblindness in children is estimated to be 1:19,000 and is lower among adults where estimates are 1:34, The aetiology of congenital deafblindness has been classified into hereditary causes; pre-natal, peri-natal and post-natal causes and unknown or undetermined causes. The results from three aetiological studies on congenital deafblindess in children are detailed below, indicating a dominance of hereditary and chromosomal causes and unknown or undetermined causes. Table 1: The aetiology of congenital deafblindness as described in three studies:63 children in Denmark with deafblindness aged 0-18 years 8, the 2007 national child count of 10,174 individuals 0-21 years 12 and the study of 57 deafblind pupils. 13 Aetiology Dammeyer (2010) The 2007 National Child Count (The National Admiraal and Huygen (2000) Consortium on Deafblindness,2008) % (n) Hereditary 49 (31) 35 (3607) 31 (18) Pre-natal 3 (2) 18 (1836) 40 (23) Peri-natal 16 (10) 12 (1194)* 11 (6) Post-natal 8 (5) 15 (1525) 2 (1) Unknown/Undetermined 24 (15) 20 (2012) 16 (9) Total 100 (63) 100 (10174) 100 (57) *In study, was named complication of prematurity A Clear View 06
18 The aetiology of congenital deafblindness has changed over the years primarily due to advances in medicine and medical technology. Immunisation programs for rubella virus have almost eliminated maternal rubella as a cause of congenital deafblindness in developed countries. Further, the improved medical procedures for retinopathy of prematurity is considered by some in the field as likely to reduce the incidence of congenital deafblindness. 14 The most common causes of congential deafblindness in children are reported to be CHARGE syndrome and Usher syndrome. 8 CHARGE syndrome has an estimated prevalence of affecting one in ten thousand children. 15 It is an autosomal dominant disorder with mutations in the gene CHD7 being identified as causative for CHARGE syndrome in approximately two thirds of children with this clinical diagnosis. The acronym CHARGE is based on the clinical features identified when the syndrome was delineated in 1981: Coloboma, Heart malformation, choanal Atresia, Retardation of growth and /or development, Genital anomalies and Ear anomalies. Since that time, new frequent clinical findings have been added to the clinical spectrum of CHARGE syndrome, such as dysmorphic features, rhombencephalic dysfunction, hypoplasia of the semicircular canals and arhinencephaly. 15,16 The majority of children with CHARGE have a vision and hearing loss along with balance problems that delay both their overall development and communication. 17 Usher syndrome is an autosomal recessive genetic disorder and is characterised by congenital moderate to profound hearing loss, a progressive loss of vision from a disorder known as retinitis pigmentosa and vestibular dysfunction. Clinically, Usher A Clear View 07
19 syndrome has typically been classified into three types, each type manifested by differing clinical presentations of the three core affected areas of the body. Types 1 and 2 are the more common types of Usher and Type 3 is considered the rarer form of Usher syndrome with the exception being in Finland and Ashkenazi Jewish families. Usher syndrome has been found to involve multiple genes and therefore is not considered a single gene mutation. To date, 12 Usher syndrome loci have been described and nine causative genes identified. 18,19,20 Usher syndrome is estimated to affect between per 100,000 people in developed countries. Recent research carried out in the US, highlighting the prevalence of Usher syndrome reported that Usher syndrome is more prevalent than has been reported before the genome project era. 21 (p.513) This work found that the population prevalence for Usher syndrome was estimated to be 1 in 6,000 individuals. Prenatal exposure to maternal infections such as toxoplasmosis, rubella and cytomegalovirus can result in congenital deafblindness. While rubella is almost eliminated from developed countries, both toxoplasmosis and cytomegalovirus are reportedly on the increase as a cause of congenital deafblindness. 22,23 Congenital toxoplasmosis (CT), transmitted transplacentally from mother to fetus can have serious effects in infected, untreated children at varying times in their lives. It is estimated that between 400 and 4,000 infected children are born each year in the US and are likely to have severe recurring and progressive visual symptoms, seizures, as A Clear View 08
20 well as hearing, motor and cognitive impairments. 23,24 In Australia there is limited data related to the incidence of unborn babies being infected with toxoplasmosis, although it is considered to be relatively rare. Congenital Cytomegalovirus (CMV) infection is the most common intrauterine infection in the US, with the live birth prevalence being % in the developed world. 25 Of those infected, 10% are symptomatic as neonates however greater than 90% develop long term neurological sequelae including sensorineural hearing loss, intellectual disability, cerebral palsy and impaired vision from chorioretinitis. 25,26 One of the most important risk factors for primary CMV infection during pregnancy is prolonged exposure to young children since CMV infected children will secrete virus in the saliva and urine for an average of 24 months. This is thought to place those women with children in day care as well as women of child bearing age working in day care facilities at an increased risk of primary CMV infection during pregnancy. 26 Recent research in Australia collected national data from across Australia via the Australian Paediatric Surveillance Unit with monthly reporting by more than 1000 clinicians between January 1999 and February It was found that congenital CMV infection is underreported in Australia with it being estimated that approximately 240 infected infants per year will develop permanent sequelae. 27 Based on a live birth rate of 285,000 per year in Australia, and a CMV birth prevalence of around 0.64%, the predicted incidence is about 1800 infected infants per year, which is substantially more than the national rates of 5-25 cases per year. Critically, most of these infected A Clear View 09
21 infants will be asymptomatic at birth and are unlikely to be identified without screening. 27, p.628 Endemic transmission of rubella in the US was declared to be eliminated in October, 2004, on the basis of evidence showing high levels of vaccine coverage and population immunity. 28 Rubella is of public health significance as when acquired in the first trimester of pregnancy it is associated with spontaneous abortion or, in survivors, with abnormalities of congenital rubella syndrome (CRS) in up to 80% of cases. These include cataract, retinopathy, deafness, heart defects and neurological deficit. 29 In Australia, the successful control of rubella through immunisation programs is reported as rubella notification rates remain at very low levels. 28 However, there is evidence to suggest that Indigenous women living in rural and remote areas of Australia have inadequate immunity to rubella. 30 There is also concern that migrants from areas without established rubella vaccination programs, particularly Asia, South America and sub-saharan Africa, are at greater risk of not being immune to rubella than the general Australian population. 31 Aetiologies of maternal alcohol and drug addiction and pre and post-natal trauma such as hypoxia and prematurity are also associated with congenital deafblindness. 32 Advances in perinatal care over the last three decades have resulted in improved survival rates of preterm infants and extremely pre term infants. However, this has resulted in an increase in the incidence of major neonatal diseases causing significant morbidity. Long-term studies indicate these children have higher vulnerability in A Clear View 10
22 several developmental domains including somatic growth, learning abilities, behaviour, motor performance and sensory domains Retinopathy of prematurity (ROP) is responsible for up to 15% of all causes of blindness in developed countries with the most common risk factor being the degree of immaturity measured by birth weight and gestational age and prolonged exposure to supplementary oxygen. 37 It is suggested that the incidence of severe ROP may be decreasing primarily due to improved management of respiratory distress syndrome. However, this is disputed by some in the field who describe damage to the visual pathways by lesions such as periventricular leucomalacia is an even more important cause of vision impairment in the very preterm. 38 In addition, a review of the epidemiological data and causes of deafness found that very low birth weight as a result of less than 25 weeks gestation ranks as the fifth or sixth most identifiable cause of permanent hearing loss, comparable to cytomegalovirus. 22 According to the AIHW, over the twelve-month period in 2010, 299,563 babies were born in Australia of which: 8.3% were pre-term, with most births occurring at gestational age of weeks (6.6%). A small proportion of mothers gave birth at weeks (0.8%) or weeks (0.8%); and there were 18,522 (6.2%) live born babies considered low birth weight (that is, less than 2,500 grams). There were 3,120 very low birth weight (less than 1500 grams) babies, constituting 1% of live births and 1,396 extremely low birth weight (less than 1000 grams) babies, constituting 0.5%. 39 A Clear View 11
23 In WA, in 2010, 31,266 infants were born alive with the percentage of low birth weight babies being 6.6 % (n = 2062). The percentage of low birth weight babies born to Aboriginal mothers (13.9%) in 2010 was more than twice the percentage of low birth weight babies born to non-aboriginal mothers (6.2 per cent) Acquired Deafblindness Acquired deafblindness can result from infections such as meningitis and encephalitis; brain tumour; head injury; trauma and ageing. There was little literature found that described deafblindness specifically related to these conditions with the exception of ageing. The dual disability of loss of sight and loss of hearing in the elderly has received increasing attention in the literature and will be the focus of this section of the report. The increasing life expectancy and increasing numbers of older people, particularly in developed countries, means increasing individuals will be faced with a dual sensory disability. The proportion of the US population aged 65 years and older will double between 2000 and 2030, from 35 to 72 million. 41 In Australia, the proportion of those aged 65 years and older is expected to rise from 13% in 2006 to 26% by As a result there has been an increasing focus on ageing and dual sensory impairment in the literature and a recognition that now, by definition, the elderly with a vision and hearing loss are being acknowledged as deafblind. 6,7,43 Previously this was not recognised as a distinctive disability type in the aged and many assumed it to be an inevitable and inescapable consequence of growing old. 43 A Clear View 12
24 Large population based studies in several countries have described associations between vision and hearing impairments. 41,44-46 The second cross-sectional analysis of the Blue Mountains Eye Study (BMES) found for each one line reduction in presenting and best-corrected visual acuity, hearing loss prevalence increased by 13% and 18%, respectively. This study also found that the two major causes of visual impairment in older adults, cataract and age-related macular degeneration, were independently associated with hearing loss. 44 Prevalence of vision and hearing impairment among the elderly varies greatly and this variation has been largely due to differences in methodologies used to measure the impairment. That is, self-report measures versus more objective measures of vision and hearing loss and varying definitions as to what constitutes a significant vision and hearing loss. The more reliable studies on dual sensory impairment in older adults using population based samples with participants aged 50 years or older, have reported prevalence to range from 4.6% to 9.7%. 44,45 This prevalence is thought to significantly increase in the elderly, with one study reporting 3% of people with a dual sensory impairment in the 65 to 69 age group increasing to 13.6% in those aged 85 years and older. 45 The prevalence of dual sensory impairment has also been found to be higher in those seeking aged care services and among those in nursing homes. 47 Older people with a dual sensory disability have been found to be at increased risk for a range of issues and problems including social isolation, depression, cognitive impairment, dependence and mortality Impairment in the two senses is thought to have a cumulative effect on function and well-being significantly affecting quality A Clear View 13
25 of life in both physical and mental domains. 44 The reaction of older adults to dual sensory losses and the communication limitations they impose influences psychosocial functioning which then acts to reduce social interaction and may result in social isolation. 53 A Clear View 14
26 Progression of sensory losses over time Phase 1 Phase 2 Phase 3 Premorbid status Decline in sensory acuity Diagnosis of sensory loss Living with increasing sensory loss Preconceived ideas Grief, anger, depression Acceptance of sensory loss Frustration, anger, depression Compromise, depression Uses established communication habits Experiences communication difficulties Experiences frequent communication breakdown Pursues usual social contacts Uses usual communication strategies Experiences social disruption Uses usual and new communication strategies Tendency to social avoidance Uses usual strategies but continued breakdowns, increasing likelihood of social isolation Ongoing communication and psychosocial adaptation Ongoing communication and psychosocial adaptation New strategies reduce breakdown and isolation Figure 1: A model of the psychosocial and communication responses to dual sensory loss (adapted from 53 ) A Clear View 15
27 Much of the research on dual sensory impairment in older adults and the aged urges health practitioners and disability service providers to re-direct services to this previously neglected group to assist in preventing the significant functional, psychosocial and health related deficits that accompany this disability. There was no literature cited that described the prevalence of the dual sensory disability of vision and hearing loss in Aboriginal and Torres Strait Islander Australians. However, recent literature was located describing vision and hearing issues in this population that are highlighted here for consideration regarding the potential demographic make-up of those with vision and hearing impairment in Australia. Trachoma is a leading cause of preventable blindness and is said to account for approximately 50% of blindness worldwide. In Australia, it is almost exclusively a disease of Aboriginal Australians, and has been described as remaining hyperendemic in many areas of remote Australia. 54 A large scale population study of the prevalence of trachoma in the Northern Territory found that across the five communities (n = 1316) active trachoma (assessed as the presence of either follicles or inflammation in one or both eyes) was at an endemic level (>10%). 55 A paper released by the AIHW in 2011 describes the findings of the 2008 National Indigenous Eye Health Survey (NIEHS). 56 This was the first national survey of eye health in Aboriginal and Torres Strait Islander people since The survey reports on the overall prevalence of blindness and vision impairment in Aboriginal and Torres Strait Islander children aged 5 to 15 years and adults over the age of 40 years. Key findings were: A Clear View 16
28 Over the age of 40 years, Aboriginal and Torres Strait Islander people have six times the rate of blindness of other Australians (Table 2). Aboriginal and Torres Strait Islander children have less poor vision than other Australian children (Table 2). Ninety four per cent of vision loss in Indigenous Australians is preventable or treatable. Trachoma was found in one-half of the Very Remote communities at endemic levels. Cataracts caused one-third (32%) of blindness in Aboriginal and Torres Strait Islander adults. Both low vision and blindness in adults increases markedly with age. Among Indigenous adults over the age of 80 years, 53% had low vision and 13% were blind. Glaucoma and age-related macular degeneration are still uncommon causes of vision loss of Aboriginal and Torres Strait Inlander people. 56 A Clear View 17
29 Table 2: Age adjusted (to the Australian population) prevalence of vision loss in Indigenous and non-indigenous children and adults (Taken directly from 57 ) Vision loss National survey Mainstream Australia Relative risk (NIEHS) Low vision Children 1.40 ( ) 6.36 ( ) 0.2 Adults ( ) 5.19 ( ) 2.8 Blindness Children 0.18 ( ) 0.28 ( ) 0.6 Adults 2.79 ( ) 0.45 ( ) 6.2 Further, a comprehensive overview of the health and well-being of Australia s Aboriginal and Torres Strait Islander people 58 found that: In children who had received a Child Health Check in 2009 almost 12% had chronic suppurative otitis media. This is more than three times the rate the World Health Organisation classes as a massive health problem. The association between chronic otitis media and hearing loss is well known In 2008, an estimated 8% of Indigenous adults had a profound or severe core activity limitation with the level of need for assistance among Indigenous Australians being more than twice as high as that among non-indigenous Australians. A Clear View 18
30 Physical disability is the most common disability type experienced by Aboriginal and Torres Strait Islander people, with sensory (sight, hearing and speech) disabilities (42%) being the next most common type of disability. 58 It would appear then that there is some evidence to suggest the possibility of high levels of dual sensory impairment among Indigenous populations but to date this has not been a focus of any cited research. Before concluding this section on the literature it is important to highlight recent research focusing on deafblindness in adults with intellectual disabilities. The literature reports that dual sensory loss is often not recognised by adults with intellectual disabilities, their carers and physicians. A number of barriers are likely to contribute to the poor levels of recognition, screening and treatment of dual sensory impairment including a failure to complain, diagnostic overshadowing and examination difficulties. 4 Research carried out in the Netherlands report the first population based study of combined vision and hearing impairment in adults with intellectual disabilities that is based on ophthalmologic and audiologic assessments. A prevalence of 5% of combined sensory impairment was found among the total adult client population of Dutch intellectual disability service providers (homes, day activities, supported living, or working). The risk increases significantly with more severe intellectual disability and with Down syndrome. 61 Dual sensory impairment in those with intellectual disabilities has been described as an unnoticed, undiagnosed, untreated problem. 62 A Clear View 19
31 3. Methodology This project built on the methodology used in the previous work, in 2007, by the Senses Foundation. Existing population based statistical data was used to determine the key outcome objectives related to the target population for this project, that is, those with the dual sensory disability of vision and hearing loss. 3.1 Survey of Disability, Ageing and Carers The primary source of data used was that from the 2009 Survey of Disability, Ageing and Carers (SDAC). The SDAC was conducted by the ABS from April to December in The aims of the survey were to measure the prevalence of disability in Australia; measure the need for support of older people and those with disabilities; provide a demographic and socio-economic profile of people with disabilities, older people and carers compared to the general population; and estimate the number of and provide information about people who provide care to older people and people with disabilities. The survey collected information related to three key population groups: People with disabilities- information about their long-term health conditions, need for and receipt of assistance, use of aids and equipment such as wheelchairs and hearing aids, and participation in community activities. Older people, that is those aged 60 years and over information about their need for, and receipt of assistance, and participation in community activities. A Clear View 20
32 People who provide assistance to older people and people with disabilities information about the type of care they provide, the support available to them, and the characteristics of carers and some of the effects that the caring role has on their lives. The scope of the SDAC was persons in both urban and rural areas in all states and territories, living in both private and non-private dwellings (including persons in cared accommodation). Persons whose usual residence was outside Australia, members of non-australian defence forces stationed in Australia and persons living in very remote areas were excluded from the survey. A representative sample of 27,600 households and occupants of 1,100 health care establishments completed the survey. The final sample for the 2009 SDAC comprised 64,313 persons for the household component and 9,470 persons for the cared-accommodation component. 2 The ABS produces a series of data cubes which are summaries of all of the data presented in tables in their publications in spreadsheet format. For the 2009 SDAC, the consultant used these data cubes to examine the type of data that was available to Senses Australia to achieve the aims of this project focusing on those with a dual sensory disability of vision and hearing loss. After an examination of the data, it was clear that the target group for this population required additional data analysis not readily available in the standard productions and publications produced by the Australian Bureau of Statistics. The ABS has a fee based consultancy service that is able to undertake, subject to confidentiality and standard error constraints, tabulations A Clear View 21
33 from the survey incorporating data items, populations and geographic areas selected to meet individual requirements. Senses Australia used the ABS consultancy service to produce data specific to the target group of interest. From the data cubes, a total of 33 tables were requested of the ABS consultancy service to allow for a comprehensive picture of those with a dual sensory disability of vision and hearing loss. Over the period November 2012 to March 2013, the ABS consultancy service undertook analysis of the requested data items which resulted in 21 tabulations. Several tables were not able to be released by the ABS due to high standard error. In addition, several demographic outcomes were adjusted due to concerns with regard to reliability and large standard error; this adjustment primarily being in the reduction of the number of groups within a particular measure, for example, age. Data included in the results section of this report is data released by the ABS consultancy service to the Consultant and Senses Australia in relation to the target group of this project. 63 The SDAC does not routinely collect information related to Indigenous Australians. Due to very small numbers and difficulties in data extraction, no attempt was made to examine data that specifically related to people from culturally and linguistically diverse backgrounds. A Clear View 22
34 3.2 Disability Services National Minimum Data Set Seven years of national data have been collected as part of the Disability Services National Minimum Dataset (DS NMDS) and an earlier agreement, the Commonwealth State/Territory Disability Agreement. The National Disability Agreement (NDA) commits all jurisdictions to work towards the objective People with disability and their carers have an enhanced quality of life and participate as valued members of the community. 64 The DS NMDS collects information on services and service users where funding has been provided, during the specified period, by a government organisation operating under the National Disability Agreement. In the collection, data on individual service users and the services they received was collected by NDA-funded agencies. This information was collated by the responsible government-funding organisation in each jurisdiction and then provided to the AIHW for collation into the Disability Services National Minimum Dataset. In 2011, the AIHW produced a report on services provided under the NDA for the period. 65 The report has some limited data and information on service users who are deafblind, which has been sourced and presented in the results section of this report. The AIHW produces disability data cubes that are able to be manipulated by the general public to produce specific data. A data cube is a multidimensional representation of data which provides fast retrieval and drill down facilities. 65 The data in the disability cubes are presented as a national picture of services received by people with a disability and do not allow for examination at the state or jurisdictional level. The consultant used these cubes to explore information available related to the A Clear View 23
35 target group of those with a dual sensory disability of vision and hearing loss in Australia. Unfortunately the data cubes did not allow for specific information to be gathered related to the target group, however some limited information was able to be extracted related to those described as having a sensory disability ( that is, individuals who have a primary disability of speech, hearing, vision and deafblind). 65 This group, is broader than the target group for the Senses Australia, hence the data resulting from the use of data cubes has been included as an Appendix to this report Definitions Disability within both the SDAC and DS NMDS is defined within the International Classification of Functioning, Disability and Health where disability is used as an umbrella term for impairments, activity limitations and participation restrictions. In the SDAC a person is defined as having a disability if they have a limitation, restriction or impairment, which has lasted, or is likely to last, for at least six months and restricts everyday activities. 2 The ABS consultancy service used two different approaches to generate the data related to the target group: Those individuals reporting a disability due to loss of sight (not corrected by glasses or contact lenses) and loss of hearing where communication is restricted, or an aid to assist with, or substitute for, hearing is used. Those individuals with the long term conditions diseases of the eye and adnexa and diseases of the ear and mastoid process. A Clear View 24
36 The International Statistical Classification of Diseases and Related Health Problems, 10 th Revision (ICD-10) was used in the SDAC as the basis of coding of long-term health conditions and is defined as a disease or disorder which has lasted, or is likely to last, for six months or more. Individuals may or may not have a long-term condition with a resulting disability. Alternatively individuals with a loss of sight may not have diseases of the eye and adnexa, for example, the loss of sight may be due to an injury. The ABS consultancy service, while undertaking the work for Senses Australia, used these two groups interchangeably to generate tables and data that would be the most reliable. 63 Those tables released to Senses Australia are reported on in the results section according to the approach taken to generate the data. The DS NMDS uses the category deafblind disability to refer to dual sensory impairments associated with severe restrictions in communication, and in the ability to participate in community life. The DS NMDS describes deafblindness as not just vision impairment with a hearing loss, or a hearing loss with vision impairment, but rather as a unique disability of its own requiring distinct communication and teaching practices. 65 In this report, the terminology dual sensory impairment, dual sensory disability and deafblind will be used interchangeably to describe the target group. A Clear View 25
37 4. Results The ABS consultancy service generated a series of tables related to those persons in WA and Australia with a dual sensory impairment. 63 These tables are presented in the results section, along with any relevant data from the DS NMDS, to describe demographic characteristics, geographical location, level of limitation, long term health conditions, living arrangements, carer characteristics and need for assistance among those with a dual sensory impairment. Key outcomes of this project were to identify the number, age, gender and geographical location of people who have a dual sensory disability of vision and hearing loss. In 2009, the estimated resident population of WA was 2,224,300 and 21,791,000 in Australia. The estimated target population for Senses Australia makes up 0.35 % (n = 7,900) of the population of WA and 0.46% (n = 99,800) of the population of Australia (Table 3). 63 In , the data from the DS NMDS reported that 295,024 people with disability accessed services across Australia. The median age of service users was 33.0 years and the age group with the largest number of disability support service users was those aged years. The smallest number of disability support service users was in the 65 years and older age group. Those individuals with a primary disability of deafblind made up 0.2% (n = 679) of all disability support service users. 65 A Clear View 26
) reporting having the dual sensory disability of vision and hearing loss (Figure 2).")
38 4.1. Age and Gender For both WA and Australia there was a greater proportion of women ((56% (n = 4,400) in WA and 58% (n = 58,500) in Australia)) than men ((44% (n = 3,500) in WA and 42% (n = 41,500) in Australia)) reporting having the dual sensory disability of vision and hearing loss (Figure 2) Percentage Males Females 10 0 WA Australia Figure 2: Proportion of males and females with dual sensory disability of loss of vision and loss of hearing in WA and Australia. (Based on ABS data 63 ) There was little difference in the distribution of people with dual sensory disability of vision and hearing loss in WA and Australia according to age. However, proportionally in WA (31.4 %, n = 1,100) there were more males in the 60 to 74 year age group A Clear View 27
39 with this form of disability compared to males of this age in Australia (23.9%, n =9,900). In both WA and Australia, there were proportionally more males than females with a vision and hearing loss in those under 60 years of age and those in the year age group. By far the greatest proportion of people with dual sensory disability of vision and hearing loss in both WA and Australia were aged 75 years and older and there were higher proportions of women than men in this age group both within the state and Australia wide. (Table 3) Table 3: All persons with loss of sight and loss of hearing by age, gender and geographical location (Western Australia and Australia) (Based on ABS data 63 ) Western Australia Australia n % n % Males 0 59 years 600** , years 1,100* , years 1,800* , Total 3, , Females 0-59 years 600** ,000* years 700** , years 3, , Total 4, , Persons 0-59 years 1,200* , years 1,800* , years 4, , Total 7, , *estimate has a relative standard error between 25% and 50% and should be interpreted with caution ** estimate has a relative standard error greater than 50% and is considered too unreliable for general use A Clear View 28
 (Based on ABS data 63 ) The DS NMDS reported the age and gender of people who have a primary disability of being")
40 Percentage Males 0-59 years years 75+ years Females 0-59 years years 75+ years Western Australia Australia Figure 3: All persons with loss of sight and loss of hearing by age, gender and geographical location (Western Australia and Australia) (Based on ABS data 63 ) The DS NMDS reported the age and gender of people who have a primary disability of being deafblind. There are similar proportions of males (52.7%, n =358) and females (47.2, n =321) who are deafblind and disability supports service users, a slightly different profile to that of all service users where the majority were male (59%, n =174,912). Similarly, the age group distribution for those who are deafblind and service users is slightly different from all service users, with those 65 years and older making up 20% (n = 140) of deafblind service users compared with 6% (n = 18,006) of all disability support service users (Table 4). 65 A Clear View 29
41 Table 4: Disability support service users who have a primary disability of deafblind according to age (adapted from Table 4.1) 65 Age group n % 0-14 years years years years Total Geographical location As part of the Australian Standard Geographical Location, the ABS uses the Accessibility/Remoteness Index of Australia (ARIA) to describe areas of Australia according to an aggregation of non-contiguous geographical areas which share a common characteristic of remoteness. The categories are Major Cities of Australia; Inner Regional Australia; Outer Regional Australia; Remote Australia; Very Remote Australia; and Migratory. 66 Due to small estimates in several of these categories in the target group of interest for the project, the ABS have used Major Cities of Australia and grouped all the other categories into Regional and Remote Australia. Similar proportions of people with diseases of the eye and adnexa and diseases of the ear and mastoid process lived in Major Cities of Australia and Regional and Remote Australia for both WA and Australia (Table 5). An estimated 2,400 (29.7% of the A Clear View 30
42 target group in WA) of people with diseases of the eye and adnexa and diseases of the ear and mastoid process live in regional and remote areas of WA, and an estimated 38,000 (34.7% of the target group in Australia) of people with diseases of the eye and adnexa and diseases of the ear and mastoid process live in regional and remote areas of Australia. Table 5: All persons with diseases of the eye and adnexa and diseases of the ear and mastoid process, by Accessibility and Remoteness Index of Australia (ARIA) and gender. 63 Males Females Total n % n % n % Western Australia Major cities 2,500* , , Regional and Remote 1,500* * ,400* 29.7 Total 4,000* 100 4, , Australia Major cities 30, , , Regional and Remote 19, , , Total 49, , ,700* 100 *estimate has a relative standard error between 25% and 50% and should be interpreted with caution ** estimate has a relative standard error greater than 50% and is considered too unreliable for general use Some gender differences in geographical location were evident, with proportionally more males than females with diseases of the eye and adnexa and diseases of the ear and mastoid process residing in regional and remote areas of both WA and Australia. This gender difference was particularly evident in WA, with 37.5% (n = 1,500) of A Clear View 31

43 males residing and rural and remote part of WA compared with 22% (n = 900) of females (Figure 4). Regional and remote Major cities Australia Regional and remote Major cities WA Percentage Females Males Figure 4: All persons with diseases of the eye and adnexa and diseases of the ear and mastoid process, by ARIA and gender. (Based on ABS data 63 ) The DS NMDS collects information related to Indigenous service users of disability support services. Five per cent (n = 36) of users of disability support services with a primary disability of deafblind were of Indigenous background. Proportionally, this was the third highest reported primary disability of Indigenous users of disability support services following intellectual (5.7%, n =4809) and physical disability (5.25, n = 2,513). Overall, 5% (n = 14,251) of all users of disability support services were of Indigenous background. 65 A Clear View 32
44 4.3 Core Activity Limitation The SDAC reports level of impairment according to levels of limitation within three main core activities of life: self-care, mobility and communication. Four levels of core activity limitation are determined, based on whether a person needs personal assistance with, has difficulty with, or uses aids or equipment for any of the core activities. 66 The four levels of core activity limitation are: Profound unable to perform a core activity or always needing assistance; Severe sometimes needs assistance to perform a core activity, or has difficulty understanding or being understood by family and friends, or can communicate more easily using sign language or other non-spoken forms of communication; Moderate does not need assistance, but has difficulty performing a core activity; and Mild has no difficulty performing a core activity but uses aids or equipment because of disability. A specific limitation or restriction is defined as a limitation in core activities or a restriction in schooling or employment. The severity of impairment among the target group of those with a dual sensory disability of vision and hearing loss was greatest in those aged 75 years and older both within WA and Australia (Figure 5). A Clear View 33

45 Percentage years years 75+ years Profound/severe core activity limitation Moderate/mild core activity limitation Figure 5: All persons with loss of sight and loss of hearing, Disability status by age. (Based on ABS data 63 ) Amongst the target group, the estimates for WA reported that there were few persons without a specific restriction and while it was evident some, in the 0-59 years age range, had a schooling or employment restriction the estimates were too small for publication. In Australia, approximately 4.2% (n = 4,200) with a dual sensory loss of vision and hearing reported having no specific restriction in core activities and 2.4 % (n = 2,400) a schooling or employment restriction. Over half (61%, n = 60,800) of the target group within Australia reported a profound or severe core activity limitation and almost a third (32.5%, n = 32,500) a moderate or mild core activity limitation (Table 6). Due to some of the data being suppressed due to high standard error amongst the reported data for WA for this target group, estimates for those with a A Clear View 34
46 profound or severe core activity limitation were not able to be published. However, from the total numbers and distribution according to disability status it is likely the highest proportion of those with a dual sensory disability in WA have a profound or severe core activity limitation (Table 7). There was a gender difference in the reported level of impairment both within WA and Australia. In WA, proportionally more women (87.1%, n = 2,700) than men (77.8 %, n = 1,400) reported a profound or severe core activity limitation. This trend was similar for those with a vision and hearing loss within Australia, with proportionally more women (78.4%, n = 33,800) than men (59.8%, n = 14,300) reporting a profound or severe core activity limitation (Tables 6 and 7). A Clear View 35
47 Table 6: All persons with loss of sight and loss of hearing, Disability status by age and gender in Australia. 63 Profound /severe core activity limitation Moderate/mild core activity limitation Schooling/ employment restriction Without specific restriction Total n % n % n % n % n % Males 0 59 years 2, , , , years 2, , np np np np 9, years 14, , np np np np 23, Total 19, , , , , Females 0-59 years 2, , np np np np 6,000* years 4, , np np np np 9, years 33, , np np np np 43, Total 41, , np np 1, , Persons 0-59 years 5, , , , , years 7, , np np np np 19, years 48, , np np np np 66, Total 60, , , , , *estimate has a relative standard error between 25% and 50% and should be interpreted with caution. ** estimate has a relative standard error greater than 50% and is considered too unreliable for general use. np not available for publication but included in totals where applicable, unless otherwise indicated A Clear View 36
48 Table 7: All persons with loss of sight and loss of hearing, Disability status by age and gender in Western Australia. 63 Profound /severe core Moderate/mild core activity Schooling/employment Without specific Total activity limitation limitation restriction restriction n % n % n % n % n % Males 0 59 years 0 0 np np np np np np 600** years ,100* years 1, ,800* 100 Total np np np np , Females 0-59 years np np np np ** years np np np np ** years 2, , Total 2, , , Persons 0-59 years np np np np np np 1,200* years , ,800* years 4, , Total np np 3, np np np np 7, *estimate has a relative standard error between 25% and 50% and should be interpreted with caution ** estimate has a relative standard error greater than 50% and is considered too unreliable for general use np not available for publication but included in totals where applicable, unless otherwise indicated A Clear View 37
 (Figure 6).")
49 In WA, proportionally more of the target population living in regional and remote parts of WA than the estimated number of people living in regional and remote areas of Australia with diseases of the eye and adnexa and diseases of the ear and mastoid process report having a profound or severe core activity limitation (58%, n = 1,400 in WA; 49%, n= 18,700) (Figure 6) Percentage Western Australia Major cities Regional & Remote Australia Major cities Regional & Remote Profound or severe core activity limitation Moderate or mild care activity limitation Figure 6: Persons with loss of sight and loss of hearing, Disability status according to ARIA in WA and Australia. (Based on ABS data 63 ) An individual s ability to participate in employment provides further information as to the level of impairment being experienced by an individual and the degree to which they are actively participating in their community and civic life. Estimates for WA were A Clear View 38
50 not able to be released publically, however for the target group in Australia more males (47.2%, n= 5,100) than females (28.2, n = 2,200) aged years with loss of sight and hearing are estimated to be in the labour force (Table 8). Table 8: All persons aged years living in households with loss of sight and loss of hearing, by gender and labour force status. 63 Males Females Persons n % n % n % In the labour force 5,100* ,200* , Not in the labour 5,700* ,500* , force Total 10, ,800* , *estimate has a relative standard error between 25% and 50% and should be interpreted with caution In Australia, the labour force participation rate for persons with a dual sensory loss was 39.6%, lower than that for all people with disabilities aged years and living in households (54%). Similarly compared to all people with disabilities, labour force participation rates were lower for males with loss of sight and loss of hearing (60% compared to 47.2% respectively) and for females in the target group (49% compared to 28.2% respectively) (Figure 7 ). 2 A Clear View 39

51 60 50 Participation rate Males Females Persons People with disabilities People with dual sensory loss Figure 7: Participation rate of persons aged years living in households with loss of sight and loss of hearing and all people with disability in Australia, by gender. The DS NMDS reported approximately 98,000 service users received open employment services (assist people to retain paid employment in the open market) and 22,000 service users received supported employment services (assist people to work in specialised and supported work environments). Those described as having a primary disability of deafblind made up 0.1% of those in open employment and 0.3% of those in supported employment. Those users of open employment services aged years according to the largest primary disability groups and those who are deafblind are described in Table 9. Those who are deafblind have the third highest proportion of individuals who are unemployed, following those with a physical disability and those with a psychiatric disability. 65 A Clear View 40
52 Table 9: Users of open employment services aged years, labour force status, by primary disability (adapted from Table ) Employed Unemployed Total n % n % n % Intellectual 6, , , Physical 7, , , Autism 1, , , Psychiatric 10, , , Deafblind Long-term health conditions The target group reported a number of other long-term health conditions other than diseases of the eye and adnexa and diseases of the ear and mastoid process. The types of long term health conditions reported for the target group was similar within both WA and Australia, with the highest estimates of people being in the all other physical conditions followed by diseases of the circulatory system (Table 10). A Clear View 41
53 Table 10: All persons with diseases of the eye and adnexa and diseases of the ear and mastoid process, Type of long-term condition by geographical area. 63 Long Term Health Condition WA Australia Neoplasms 300** 4,900 Endocrine, nutritional, metabolic 3,200 35,900 disorders Diseases of the nervous system 500** 13,400 Diseases of the eye and adnexa 8, ,700 Diseases of the ear and mastoid 8, ,700 process Diseases of the circulatory 4,000 67,400 system Diseases of the respiratory 1,200** 17,200 system Diseases of the digestive 800** 12,900 system Injury, poisoning and other 1,500* 18,900 external causes All other physical conditions 6,200 83,900 Mental and behavioural disorders 2,400* 36,700 *Estimate has a relative standard error between 25% and 50% and should be used with caution **Estimate has a relative standard error greater than 50% and is considered too unreliable for general use The DS NMDS described 41% of service users having at least one other significant disability. Service users who reported their primary disability as being intellectual A Clear View 42
54 (58%), acquired brain injury (61%) neurological (55%) or deafblind (52%) were the most likely to report other significant disabilities Living Arrangements The SDAC gathers information related to where an individual lives along with data related to people who care for people with disabilities and older people. It was estimated that almost all of the persons with diseases of the eye and adnexa and diseases of the ear and mastoid process aged 59 years or younger lived in private dwellings (Table 11). A Clear View 43
55 Table 11: All persons living in establishments with diseases of the eye and adnexa and diseases of the ear and mastoid process by age and geographical location (WA and Australia). 63 Western Australia Australia Age groups n % n % 0-59 years Lives in private dwelling 700** , Lives in non-private ** 0.8 dwelling Total 700** , years Lives in private dwelling 6, , Lives in non-private 1, , dwelling Total 7, , Total Lives in private dwelling 7, , Lives in non-private 1, , dwelling Total 8, , *estimate has a relative standard error between 25% and 50% and should be interpreted with caution ** estimate has a relative standard error greater than 50% and is considered too unreliable for general use For those over sixty years with diseases of the eye and adnexa and diseases of the ear and mastoid process more than three quarters of people reported living in private dwellings in both WA and Australia, with proportionally more people living in non- A Clear View 44

56 private dwellings in Australia (21.3%, n = 20,800) when compared to Western Australia (13,5%, n=1000) (Figure 8). Percentage Lives in private dwelling WA Lives in non-private dwelling Australia Figure 8: Persons living in establishments with diseases of the eye and adnexa and diseases of the ear and mastoid process by geographical location (WA and Australia). (Based on ABS data 63 ) In Australia, 40% ( n= 35,800) of those with diseases of the eye and adnexa and diseases of the ear and mastoid process reporting living in private dwellings had profound or severe core activity limitations compared to almost all (96.8%, n= 20,600) of those living in non-private dwellings. Similar levels of impairment were found between those living in private and nonprivate dwellings in Western Australia (Table 12 and Table 13). A Clear View 45
57 Table 12: All persons with diseases of the eye and adnexa and diseases of the eye and mastoid process, Disability status by age and by dwelling type in Western Australia. 63 Profound /severe core Moderate/mild core activity Without specific restriction Total activity limitation limitation n % n % n % n % 0-59 years Lives in private dwelling 0 0 np np ** 100 Lives in non-private dwelling Total 0 0 np np ** years Lives in private dwelling 3,200* , np np 6, Lives in non-private dwelling np np 1, Total 4, np np np np 7, Total Lives in private dwelling 3,200* 45.1 np n/a np n/a 7, Lives in non-private dwelling np n/a 1, Total 4, ,200* 39.5 np n/a 8, *estimate has a relative standard error between 25% and 50% and should be interpreted with caution; ** estimate has a relative standard error greater than 50% and is considered too unreliable; np not available for publication but included in totals where applicable, unless otherwise indicated A Clear View 46
58 Table 13: All persons with diseases of the eye and adnexa and diseases of the ear and mastoid process, Disability status by age and by dwelling type in Australia. 63 Profound /severe core activity Moderate/mild core activity Without specific restriction Total limitation limitation n % n % n % n % 0-59 years Lives in private dwelling 2,000** ,300* ,300* , Lives in non-private dwelling 100** ** 100 Total 2,100** ,300* ,300* , years Lives in private dwelling 33, , , , Lives in non-private dwelling 20, * , Total 54, , , , Total Lives in private dwelling 35, , , , Lives in non-private dwelling 20, * , Total 56, , , , *estimate has a relative standard error between 25% and 50% and should be interpreted with caution; ** estimate has a relative standard error greater than 50% and is considered too unreliable for general use A Clear View 47
59 4.6 Carer Characteristics The ABS defines a primary carer as a person who provides the most informal assistance, in terms of help or supervision, to a person with one or more disabilities or aged 60 years and over. The assistance has to be ongoing, or likely to be ongoing, for at least six months and be provided for one or more of the core activities (communication, mobility and self-care). 2,p.34 There is an estimated 700 carers of people who have diseases of the eye and adnexa and diseases of the ear and mastoid process in WA and 17,000 primary carers of the target group across Australia. The majority of primary carers of people with diseases of the eye and adnexa and diseases of the ear and mastoid process live in the major cities of Australia (n = 12,300, 72.3%) and the remainder (n = 4,700, 27.7%) in regional and remote areas of the country. In WA the primary carers are all women, however within Australia a third of the carers of people who have diseases of the eye and adnexa and diseases of the ear and mastoid process are males (33.5%, n = 5,700) (Table 14). There is variation in the gender of the carer according to age, with similar estimates of male (n= 1,400, 49.6%) and female (n = 1,400, 50.4%) carers among those aged 75 years and older and a dominance of female carers among those aged 60 to 74 years (n = 5,400, 76.8%) and those less than 60 years of age (n = 4,400, 62.6%) with this dominance much greater in the middle age group (Figure 9). A Clear View 48

60 Table 14: Primary Carers of a main recipient with diseases of the eye and adnexa and diseases of the ear and mastoid process by geographical region and gender. 63 Western Australia Australia n % n % Males 0 0 5, Females , Total , Percentage years years 75+ years Total Males Females Figure 9: Primary carers of a main recipient with diseases of the eye and adnexa and diseases of the ear and mastoid process by age and gender in Australia (All estimates with the exception of the total for females have a relative standard error between 25% and 50% and should be used with caution). (Based on ABS data 63 ) A Clear View 49
61 Just over half (n = 8,900) of primary carers of persons with diseases of the eye and adnexa and diseases of the ear and mastoid process spend 40 hours or more per week in the caring role and approximately 40% (n = 6,500) of carers spend less than 20 hours per week in this role (Table 15). Table 15: Primary carers of a main recipient with diseases of the eye and adnexa and diseases of the ear and mastoid process, by time spent caring for main recipient per week in Australia. 63 n % Less than 20 hours 6, hours 1, hours or more 8, Total 17, The number of years for which a carer had cared for a person with diseases of the eye and adnexa and diseases of the ear and mastoid process was variable with the largest proportion of carers reporting they had assumed this role for between five to nine years (n = 6,400, 37.7%) (Figure 10). A Clear View 50

62 Percentage Less than 2 years 2-4 years 5-9 years years 25 years or more Figure 10: Primary carers of a main recipient with diseases of the eye and adnexa and diseases of the ear and mastoid process by years of care provided to main recipient of care in Australia (all estimates except 5-9 years should be interpreted with caution as have a relative standard error between 25% and 50%) Support needs The need for assistance among persons aged 60 and over with diseases of the eye and adnexa and diseases of the ear and mastoid process living in households increased with age with the highest proportion of people indicating they needed assistance with at least one activity in the 85 years and older age group (n = 38,700, 92.8%) (Figure 11). A Clear View 51

63 Percentage years years 85 years and over All needing assistance with at least one activity Assistance not needed Figure 11: All persons with diseases of the eye and adnexa and diseases of the ear and mastoid process, aged 60 years and over, by need for assistance and age (estimates for assistance not needed in those aged 85 years and over should be interpreted with caution as has a relative standard error between 25% and 50%) (Based on ABS data 63 ) In WA, it is estimated that 5,200 persons with diseases of the eye and adnexa and diseases of the ear and mastoid process needed assistance with broad activity areas and 4,200 received assistance. Within Australia, it is estimated 82,000 persons with diseases of the eye and adnexa and diseases of the ear and mastoid process needed assistance with broad activity areas and 59,400 received assistance (Figure 12). A Clear View 52
.")
64 Percentage WA Needs assistance with broad activity area Australia Receives assistance Figure 12: All persons with diseases of eye and adnexa and diseases of the ear and mastoid process by assistance need and geographical area (WA and Australia). 63 The areas of activity in which people with diseases of the eye and adnexa and diseases of the ear and mastoid process require assistance is similar within WA and Australia. Health care, mobility and reading and writing tasks were the three most common areas of activity in which the target group required assistance in WA and health care, mobility and self-care were the more common areas of activity in which persons required assistance within Australia (Table 16). A Clear View 53
65 Table 16: All persons living in establishments with diseases of the eye and adnexa and diseases of the ear and mastoid by type of activity for which assistance needed. 63 Western Australia Australia n % n % Self-care 3, , Mobility 4, , Communication 900* , Cognitive/emotional tasks 3,200* , Health care 5, , All needing assistance 6, , with personal activities Reading or writing tasks 3,800* , Transport 3,800* , Household chores 3,200* , Property maintenance 3,300* , Meal preparation 1,400* , All needing assistance with at least one activity 6, , *Estimate has a relative standard error between 25% and 40% and should be used with caution Across Australia, persons with diseases of the eye and adnexa and diseases of the ear and mastoid process aged 60 years and over and living in households received some form of assistance from an informal provider (eg partner, daughter, relative) and/or a formal provider (eg government, private non-profit organisation, private commercial organisation). Eighty two per cent (n = 45,800) of the target group aged 60 years and over living in households reported receiving assistance from an informal provider and 73.6% (n = 41,000) received assistance from formal providers. Informal providers provided assistance primarily in the areas of mobility, reading or writing A Clear View 54

66 tasks, transport, meal preparation and self-care. Help from formal providers was primarily received for healthcare, household chores, property maintenance and cognitive or emotional tasks (Figure 13). Percentage Formal providers Informal providers Figure 13: All persons with diseases of the eye and adnexa and diseases of the ear and mastoid process, aged 60 years and over, living in households, needing assistance, activities by provider type (The estimates provided for formal providers have a relative standard error between 25% and 50% and should be used with caution). (Based on ABS data 63 ) Within Australia, approximately 80% (n = 87,300) of all persons with diseases of the eye and adnexa and diseases of the ear and mastoid use aids or equipment to assist them in the core activities of self-care, mobility, communication and managing their health conditions (Figure 14). A Clear View 55
 Within the target group, just over half of people (54.")
67 Percentage All using aids and equipment Does not use aids or equipment Figure 14: All persons living in establishments with diseases of the eye and adnexa and diseases of the ear and mastoid by use of aids and equipment. (Based on ABS data 63 ) Within the target group, just over half of people (54.9%, n =60,300) reported using some form of communication aid with by far the most common aid being used being a hearing aid (45.8%, n= 50,200) (Table 17). Table 17: All persons living in establishments with diseases of the eye and adnexa and ear and mastoid process by type of communication aids used. (Based on ABS data 63 ) Communication aids n % Hearing aid 50, Other hearing aids including cochlear implants 4,100* 3.7 Low tech reading, writing or speech aids 5,200* 4.7 High tech reading, writing or speech aids 5,500* 5.0 Mobile or cordless telephone 8,800* 8.1 Reading, writing or speaking aid not specified 5,600* 5.1 Does not use a communication aid 49, Total 109, *estimate has a relative standard error between 25% and 50% and should be used with caution A Clear View 56
68 The DS NMDS reported on the use of multiple service type outlets by users of disability support services. Multiple service users are people who accessed more than one service type outlet providing services under the National Disability Agreement. The use of multiple service type outlets was most common among users with a primary disability of intellectual (2.2 outlets per service) and deafblind (2.0 outlets per user). The AIHW describes users with the highest level of support need for activities of daily living as being much more likely to access multiple outlets than service users with less frequent need for help with activities of daily living. The use of multiple service groups was most common among users with a primary disability of intellectual (1.6 service users per group) and deafblind (1.5 service users per group). 65 A Clear View 57
69 5. Discussion and Key Findings This work produced a number of key findings related to those with a dual sensory impairment of vision and hearing loss living in both WA and Australia. The primary source of information was data manipulated from the 2009 Survey of Ageing, Disability and Carers. Some limited data from the DS NMDS related to users of disability support services who are deafblind was also collated and reported. The results from the data analysis produced more extensive information than the original project aims, providing some additional information related to carers of those with a dual sensory disability along with some detail regarding the need for assistance in a range of broad activity tasks. The support needs of those with diseases of the eye and adnexa and diseases of the ear and mastoid process were reported only for those aged 60 years and over and therefore will not be presented as key findings. Key findings are highlighted and discussed for each outcome of the project. i) To identify the number, age, gender and geographical location of people who have a dual sensory disability of vision and hearing loss. In 2009, an estimated 7,900 Western Australians and 99,800 Australians had a dual sensory disability of vision and hearing loss. The target group made up 0.35% and 0.5% of the resident population for WA and Australia respectively. These estimates are much higher than those identified by Prain in and significantly less than those described by Access Economics who estimated 332,400 people in 2010 had a dual sensory disability (confidential report prepared for Able Australia). These differences in estimates are likely to be a reflection of the reported ongoing difficulties A Clear View 58
70 highlighted in the literature in accurately ascertaining the prevalence of deafblindness within a population. 6,7,8,9, However, the SDAC is considered to be the best Australian source of information on the number of people with a disability and is a key dataset for estimating prevalence information on disability and carers. 67 Key Finding 1 In 2009, an estimated 7,900 Western Australians and 99,800 Australians had a dual sensory disability of loss of vision and loss of hearing. The target group made up 0.35% and 0.5% of the resident population for WA and Australia respectively. Key Finding 2 Individuals with a primary disability of deafblind made up 0.2% (n = 679) of all users of disability support services. A Clear View 59
71 Individuals with a primary disability of deafblind made up 0.2% (n = 679) of all users of disability support services. The small number of users of disability support services who are deafblind may be a reflection of people with this disability type not accessing services for a range of reasons such as geographical accessibility and suitability of available services. It has been demonstrated that the use of services by those who are deafblind differ significantly from those of the general population. Key factors that have been identified as barriers to the deafblind population accessing services include misinformation, miscommunication and lack of knowledge about the disability by health professionals. 68,69 The finding of a dominance of females among those with dual sensory impairment in this work is a similar finding to that of other research focusing on combined loss of vision and hearing in older people. 52,70 While larger proportions of women than men overall had a dual sensory impairment, in the younger age groups more males than females reported a dual sensory impairment. Research has highlighted more men than women report a hearing loss, with risk factors being exposure to loud noises over long periods of time, smoking and a history of middle ear infections. 71 A Clear View 60
72 Key Finding 3 For both WA and Australia, overall there was a greater proportion of women than men reporting having the dual sensory disability of loss of vision and loss of hearing. However in the younger age groups more males than females reported having this disability type. Up to two-thirds of people in this target group were the elderly, aged 75 years and older (62% in WA and 67 % in Australia). Key Finding 4 Similar proportions of males and females with a primary disability of deafblindness were users of disability support services. Those 65 years and older made up 20% (n =140) of deafblind service users compared with 6% (n = 18,006) of all disability support service users in this age group. Population projections by the ABS suggest that by the year 2052 the average life expectancy for Australian women could be as high as 95 years and for men more than A Clear View 61
73 92 years. The report by Access Economics indicated that of the 288,000 people estimated to have deafblindness in 2010, 97.6% (n = 281,000) were aged 65 years and over. Although the greatest proportion of people with a dual sensory impairment was in those 75 years and older, this work did not demonstrate such a dominance of dual sensory impairment in those over 65 years as that found by Access Economics. Research in Australia has found that dual sensory impairments are likely to be markers of biological ageing rather than chronological ageing as these two impairments share common risk factors in addition to age such as genetic, lifestyle and environmental factors. 44 Overall, approximately two thirds of people with diseases of the eye and adnexa and diseases of the ear and mastoid process live in the major cities of Australia. Of interest was the higher number of males than females within the target group who live in rural and remote regions of WA and Australia. The SDAC data was not able to indicate whether people were of Aboriginal and Torres Strait Islander background, however the DS NMDS data found that five per cent of users of disability support services with a primary disability of deafblind were of Indigenous background. A Clear View 62
74 Key Finding 5 Approximately a third ( n = 38,100 in Australia, n = 2,400 in WA) of people with diseases of the eye and adnexa and diseases of the ear and mastoid process live in regional and remote areas of Australia. In both Australia and WA more males than females with diseases of the eye and adnexa and diseases of the ear and mastoid process live in regional and remote areas. ii) The degree of activity and participation limitations for those with dual sensory disability of vision and hearing loss The degree of activity and participation limitations among those with the dual sensory disability of vision and hearing loss increased with age and was greatest among those aged 75 years and older both within WA and Australia. Only an estimated 4.2% (n = 4,200) of people with loss of vision and loss of hearing reported having no specific limitation in core activities. Over half (61%, n = 60,800) of those with loss of vision and loss of hearing in Australia reported a profound or severe core activity limitation and almost a third a moderate or mild core activity limitation. Significant levels of functional impairment among those with congenital deafblindness and acquired deafblindness has been described by several researchers. 5,8, 9,32, 70 Loss of function A Clear View 63
75 among older people with loss of vision and loss of hearing has been found to contribute to depression and a decreased quality of life. 44, 46 Key Finding 6 The degree of activity and participation limitations among those with the dual sensory disability of loss of sight and loss of hearing increased with age and was greatest among those aged 75 years and older both within WA and Australia. Over half (61%, n = 60,800) of those with loss of vision and loss of hearing in Australia reported a profound or severe core activity limitation and almost a third (32.5%, n = 32,500) a moderate or mild core activity limitation. A Clear View 64
76 Key Finding 7 In Australia, labour force participation rates were lower for males with loss of sight and loss of hearing than those for all males with disabilities (47.2% compared to 60% respectively) and for females in the target group compared to all females with disabilities (28.2% compared to 49% respectively). Workforce participation rates for people with disabilities are significantly less than those for the non-disabled population. In 2009, the overall participation rate for people with disabilities aged years and living in households was 54%, significantly less than that for the non-disabled population where the participation rate was 83%. 2 It appears that those with a dual sensory impairment are more disadvantaged than those overall with disabilities in terms of their ability to participate in the workforce. The National Disability Strategy (2011) describes the importance of work for people with disabilities, stating it is essential to an individual s economic security and is important to achieving social inclusion. 72 Research focusing on workforce participation in those acquiring a dual sensory disability as they age, reported people wanted to continue working past retirement age. However, higher A Clear View 65
77 proportions of people with loss of vision and loss of hearing felt they were forced into retirement when compared to those who did not have a dual sensory disability. 73 Key Finding 8 For those over 60 years with diseases of the eye and adnexa and diseases of the ear and mastoid process more than three quarters of people reported living in private dwellings in both WA and Australia. In Australia, 40% (n = 35,800) of those with diseases of the eye and adnexa and diseases of the ear and mastoid process who lived in private dwellings had profound or core activity limitations compared to almost all (97%, n = 20,600 ) of those living in nonprivate dwellings. A Clear View 66
78 iii) Carer characteristics There is an estimated 700 carers of people who have diseases of the eye and adnexa and diseases of the ear and mastoid process in WA and 17,000 primary carers of the target group across Australia. The majority of carers live in the major cities of Australia, a similar geographical profile to that of all carers in Australia in 2003 where 68% (1.1 million carers) of the 1.6 million carers aged 15 years and over lived in Major Cities of Australia. 74 Just over half (53%, n = 8,900) of primary carers of persons with diseases of the eye and adnexa and diseases of the ear and mastoid process spend 40 hours or more per week in the caring role. This is equivalent to a traditional full time job of 40 hours per week, and again reflects the profile of carers in Australia where reportedly almost half of carers (48%) spend more than 40 hours a week or more in the caring role. 74 Key Finding 9 There is an estimated 700 carers of people who have diseases of the eye and adnexa and diseases of the ear and mastoid process in WA and 17,000 primary carers of the target group across Australia. A Clear View 67
79 Key Finding 10 In WA the primary carers of people who have diseases of the eye and adnexa and diseases of the ear and mastoid process are all women, however across Australia a third of carers of the target group are males (33%, n = 5,700). Key Finding 11 Just over half (n = 8,900) of primary carers of persons with diseases of the eye and adnexa and diseases of the ear and mastoid process spend 40 hours or more per week in the caring role. This report may be the first in Australia to describe the demographic characteristics, carer characteristics and activity and participation limitations among those with a dual sensory disability of vision and hearing loss. A number of key findings have been A Clear View 68
80 reported to assist Senses Australia and other agencies around Australia to gain some further insight into the specific service needs of those who are deafblind. A Clear View 69
81 6. References 1. Dyke P. Unseen and Unheard: The identification of people who are vision impaired with additional disabilities in Western Australia. Western Australia: Senses Foundation Inc WA; Australian Bureau of Statistics (ABS) Disability, Ageing and Carers, Australia: Summary of Findings Available at Accessed October Australian Institute of Health and Welfare (AIHW). Disability prevalence and trends. Disability series. Canberra: AIHW; Fellinger J, Holzinger D, Dirmhirn A, Van Dijk J, Goldberg D. Failure to detect deafblindness in a population of people with intellectual disability. Journal of Intellectual Disability Research. 2009;53(10): Ronnberg JBE. A review and evaluation of research on the deaf-blind from perceptual, communicative, social and rehabilitative perspectives. Scandinavian Audiology. 2001;30(2): Prain M. An Update of the 1994 report: Investigation into the needs of and services for people in Australia who are deaf-blind. Victoria; National Society for the Deaf-Blind. A study of deaf-blind demographics and services in Canada Available at Accessed March Dammeyer J. Interaction of dual sensory loss, cognitive function, and communication in people who are congenitally deaf-blind. Journal of Visual Impairment & Blindness. 2010;104(11): Dalby DM, Hirdes JP, Stolee P, Strong JG, Poss J, Tjam EY, et al. Characteristics of individuals with congenital and acquired deaf-blindness. Journal of Visual Impairment & Blindness. 2009;103(2): Wittich W, Watanabe DH, Gagné J-P. Sensory and demographic characteristics of deafblindness rehabilitation clients in Montréal, Canada. Ophthalmic and Physiological Optics.2012;32(3): Brennan M, Bally SJ. Psychosocial adaptations to dual sensory loss in middle and late adulthood. Trends in Amplification. 2007;11(4): The National Consortium on Deaf-Blindness. The 2007 National Child Count of Children and Youth who are Deaf-Blind. Monmouth, Oregon: The National Consortium on Deaf- Blindness; Admiraal RJH. Changes in the aetiology of hearing impairment in deaf-blind pupils and deaf infant pupils at an institute for the deaf. International Journal of Pediatric Otorhinolaryngology. 2000;55: A Clear View 70
82 14. Schiariti VM, C. Hoube, SJ & Synes, AR. Severe retinopathy of prematurity and visual outcomes in British Columbia: a 10-year analysis. Journal of Perinatology. 2008;28: Sanlaville D, Verloes A. CHARGE syndrome: an update. European Journal of Human Genetics. 2007;15(4): Verloes A. Updated diagnostic criteria for CHARGE syndrome: A proposal. American Journal of Medical Genetics Part A. 2005;133A(3): The Charge Foundation ( TCS). About CHARGE Available at Accessed March Scarola D. Making progress with Usher syndrome. Volta Voices. 2007;14(2): Cohen M B-G, Luxon L. The changing face of Usher syndrome: Clinical implications. International Journal of Audiology. 2007;46: Millan JM, Aller AM, Jaijo T, et al. An update on the genetics of Usher syndrome. Journal of Opthalmology. 2011;10: Kimberling WJ, Hildebrand MS, Eliot Shearer A, et al. Frequency of Usher syndrome in two pediatric populations: Implications for genetic screening of deaf and hard of hearing children. Genetics in Medicine. 2010;12(8): Picard M. Children with permanent hearing loss and associated disabilities: Revisiting current epidemiological data and causes of deafness. The Volta Review. 2004;104(4): Stillwaggon E, Carrier CS, Sautter M, McLeod R. Maternal serologic screening to prevent congenital toxoplasmosis: A decision-analytic economic model. Neglected Tropical Diseases. 5(9):e Petersen E. Prevention and treatment of congenital toxoplasmosis. Expert Review of Anti-Infective Therapy. 2007;5(2): Bristow BN, Shafir SC, Sorvillo FJ. Congenital Cytomegalovirus mortality in the United States, Neglected Tropical Diseases.5(4):e Gaytant M SE, Semmekrot B, et al. Congenital Cytomegalovirus infection: Review of the epidemiology and outcome. Obstetrical and Gynecological Survey. 2002;57(4): McMullan BP, Palasanthirian P, Jones C, et al. Congenital cytomegalovirus - time to diagnosis, management and clinical sequelae in Australia: opportunities for early identification. Medical Journal of Australia. 2011;194(12): Communicable Diseases Network (CD). Vaccine preventable diseases in Australia, Communicable Diseases Intelligence. 2010; Best J. Rubella. Semin Fetal Neonatal Med. 2007;12(7): A Clear View 71
83 30. Hunt JL, Lumley J. Top end rural and remote indigenous women: An Australian population group vulnerable to rubella. Communicable Diseases Intelligence. 2004;28(4): Tiong ACD, Patel MS, Gardiner J, Ryan R, et al. Health issues in newly arrived African refugees attending general practice clinics in Melbourne. Medical Journal of Australia. 2006;185(11/12): Chen D. Young children who are deaf-blind: Implications for professionals in deaf and hard of hearing services. The Volta Review.2004;104(4): Stoll BJ, Hansen NI, Bell EF, Shankaran S, Laptook AR, Walsh MC, et al. Neonatal outcomes of extremely preterm infants from the NICHD Neonatal Research Network. Pediatrics. 2010;126(3): Marret SP, Marchand-Martin L, Picaud J-C, Hasco J-M, Arnaud C, Roza J-C, et al. Brain injury in very preterm children and neurosensory and cognitive disabilities during childhood: The EPIPAGE Cohort Study. One.8(5). 35. Hack M, Taylor G, Drotar D, Schluchter M, et al. Neurodevelopment and predictors of outcomes of children with birth weights of less than 1000 g: Archives of Pediatrics & Adolescent Medicine. 2000;154(7): Mwaniki MK, Atieno M, Lawn JE, Newton CRJC. Long-term neurodevelopmental outcomes after intrauterine and neonatal insults: a systematic review. The Lancet. 2012;379(9814): Gogate P, Gilbert C, Zin A. Severe visual impairment and blindness in infants: Causes and opportunities for control. Middle East African Journal of Ophthalmology.18(2): Cooke RWI, Foulder-Hughes L, Newsham D, Clarke D. Ophthalmic impairment at 7 years of age in children born very preterm. Archives of Disease in Childhood - Fetal and Neonatal Edition. 2004;89(3):F249-F Li Z, Zeki R, Hilder L & Sullivan EA. Australia's Mothers and Babies Canberra: AIHW; Joyce A, Hutchison M. Western Australia s Mothers and Babies, 2010: Twenty-eighth Annual Report of the Western Australian Midwives Notification System. Western Australia: Department of Health; Schneider JM, Gopinath B, McMahon CM, Leeder SR, Mitchell P, Wang JJ. Dual sensory impairment in older age. Journal of Aging and Health. 2011;23(8): Australian Bureau of Statistics (ABS) Population projection. Australian Government. Canberra Available at Accesssed March Valios N. Dual sensory impairment in older people. Community Care. 2007:34-5. A Clear View 72
84 44. Chia E, Mitchell P, Rochtchina E, Foran S, Golding M, Wang J. Association between vision and hearing impairments and their combined effects on quality of life. Archives of Ophthalmology. 2006;124(10): Harada S, Nishiwaki Y, Michikawa T, Iwawaw S, Nakano M, Takebayashi T. Gender difference in the relationships between vision and hearing impairments and negative well-being. Preventative Medicine. 2008;47(4); Capella-McDonnall ME. The effects of single and dual sensory loss on symptoms of depression in the elderly. International Journal of Geriatric Psychiatry. 2005;20(9): Jee J, Wang JJ, Rose KA, Lindley R, Landau P, Mitchell P. Vision and hearing impairment in aged care clients. Ophthalmic Epidemiology. 2005;12(3): LeJeune BJ, Steinman B, Mascia J. Enhancing socialization of older people experiencing loss of both vision and hearing. Generations. 2003;27(1): Gauchard GrC, Deviterne D, Guillemin F, Sanchez Js, Perrin PP, Mur J-M, et al. Prevalence of sensory and cognitive disabilities and falls, and their relationships: A community-based study. Neuroepidemiology. 2006;26(2): Saunders G, Echt K. Dual sensory impairment in an aging population. ASHA Leader. 2011;16(3): Lupsakko T, Mäntyjärvi M, Kautiainen H, Sulkava R. Combined hearing and visual impairment and depression in a population aged 75 years and older. International Journal of Geriatric Psychiatry. 2002;17(9): Crews JE, Campbell VA. Vision impairment and hearing loss among community-dwelling older americans: Implications for health and functioning. American Journal of Public Health. 2004;94(5): Heine C, Browning CJ. The communication and psychosocial perceptions of older adults with sensory loss: A qualitiative study. Ageing and Society. 2004;24: Landers J, Kleinschmidt A, Wu J, Burt B, Ewald D, Henderson T. Prevalence of cicatricial trachoma in an indigenous population of Central Australia: the Central Australian Trachomatous Trichiasis Study (CATTS). Clinical & Experimental Ophthalmology. 2005;33(2): Roper KG. Prevalence of Trachoma in Aboriginal communities in the Katherine Region of the Northern Territory in Medical Journal of Australia. 2008;189(7): Australian Institute of Health and Welfare (AIHW). Eye Health in Aboriginal and Torres Strait Islander people. Canberra: AIHW; Taylor HR, Keeffe JE, Vu HTV, Jie Jin W, et al. Vision loss in Australia. Medical Journal of Australia. 2005;182(11): A Clear View 73
85 58. Australian Institute of Health and Welfare (AIHW). The Health and Welfare of Australia's Aboriginal and Torres Strait Islander People, an Overview Canberra: AIHW; Acuin J. Chronic suppurative otitis media. BMJ Clinical Evidence 2007; 02: O'Leary S, Triolo R. Surgery for otitis media among Indigenous Australians. Medical Journal of Australia (9); Meuwese-Jongejeugd A, van Splunder J, Vink M, Stilma JS, van Zanten B, Verschuure H, et al. Combined sensory impairment (deaf-blindness) in five percent of adults with intellectual disabilities. American Journal on Mental Retardation. 2008;113(4): Newsam H, Walley RM, McKie K. Sensory impairment in adults with intellectual disabilities - An exploration of the awareness and practices of social care providers. Journal of Policy and Practice in Intellectual Disabilities. 2010; (3): Australian Bureau of Statistics (ABS) Customised report 2010; Council of Australian Governments meeting (COAG) Available at Accessed March Australian Institute of Health and Welfare ( AIHW). Disability Support Services Canberra: AIHW; Disability, ageing and carers, Australia: Summary of Findings Available at Accessed March Qu, L. Edwards, B. Gray, M. Aging parent carers of people with a disability. Canberra: Australian Institute of Family Studies; Barnett S. Communication with deaf and hard-of-hearing people: A guide for medical education. Academic Medicine. 2002;77: Lock E. A workshop for medical students on deafness and hearing impairments. Academic Medicine. 2003;78(12): Raina PW, M. Massfeller, H. The relationship between sensory impairment and functional independence among elderly. BMC Geriatrics. 2004;4(3). 71. Desai MP, L. Lentzner, H. Robinson, K. Trends in vision and hearing among older Americans. Centers for Disease Control and Prevention: The Aging Trends Series; National Disability Strategy: An initiatve of the Council of Australian governments. Canberra: Commonwealth of Australia; Capella-McDonnall ME. Employment Among Older Adults with Combined Hearing and Vision Loss. Journal of Applied Rehabilitation Counselling. 2008;39(3): Australian Bureau of Statistics (ABS) A profile of carers in Australia Available at Accessed March A Clear View 74
86 7. Appendices Appendix 7.1: Major Causes of Deaf-Blindness according to the Oklahoma Deaf- Blind Technical Assistance Project (downloaded from Hereditary Syndromes and Disorders Aicardi Syndrome Alport Syndrome Alstrom Syndrome Apert Syndrome (Acrocephalosyndactyly. Type 1) Bardet-Biedl Syndrome (Lawrence Moon- Biedl) Batten Disease Marshall Syndrome Maroteaux-Lamy Syndrome (MPS VI) Moebius Syndrome Monosomy 10P Morquio Syndrome (MPS IV-B) NF 1- Neurofibramatosis (von Recklinghausen Disease) NF 2 Bilateral Acoustic Neurofibramatosis Norrie Disease Optico-Cochleo-Dentate Degeneration Pfieffer Syndrome Prader-Willi Pierre-Robin Syndrome CHARGE Association Chromosome 18, Ring 18 Cockayne Syndrome Cogan Syndrome Cornelia de Lange Cri du chat Syndrome (Chromosome 5psyndrome) Crigler-Najjar Syndrome Refsum Syndome Crouzon Syndrome (Craniofacial Dysotosis) Scheie Syndrome (MPS I-S) Dandy Walker Syndrome Smith-Lemli-Opiz (SLO) Syndrome Down Syndrome (Trisomy 21 syndrome) Stickler Syndrome Goldenhar Syndrome Sturge-Weber Syndrome Hand-Schuller-Christian (Histiocytosis X) Treacher Collins Syndrome Hallgren Syndrome Trisomy 13 (Trisomy 13-15, Patau Syndrome) Herpes Zoster (or Hunt) Trisomy 18 (Edwards Syndrome) Hunter Syndrome (MPS II) Turner Syndrome Hurler Syndrome (MPS I-H) Usher I Syndrome Kearns-Sayre Syndrome Usher II Syndrome Klippel-Feil Sequence Usher III Syndrome Klippel-Trenaunay-Weber Syndrome Vogt-Koyanagi-Harada Syndrome Kniest Dysplasia Waardenburg Syndrome Leber Congenital Amaurosis Wildervanck Syndrome Leigh Disease Wolf-Hirschom Syndrome (Trisomy 4p) Marfan Syndrome Other A Clear View 75
87 Pre-Natal/Congenital Complications Congenital Rubella Cytomegalovirus (CMV) Fetal Alcohol Syndrome Hydrocephaly Maternal Drug Use Microcephaly Neonatal Herpes Simplex (HSV) Other Related to Prematurity Complication of Pre-maturity Post-Natal/Non-Congenital Complications Asphyxia Infections Meningitis Severe Head Injury Stroke Tumours Chemically Induced Other Undiagnosed No Determination of Etiology A Clear View 76
88 Appendix 7.2: Results from AIHW data cubes for those described as having a sensory disability (those individuals with a primary disability of speech, hearing, vision and deafblind) using disability support services in A Clear View 77
89 Table A1: Persons with a sensory disability by age and gender. Male Female Not stated Total n % n % n % n % 0-9 years 2, , , years , years 1, , years 1, , , years 1, , , years 1, , , years and over 4, , , Total 12, , , A Clear View 78
90 Table A2: Persons with a sensory disability by age and Indigenous and Non-Indigenous background. Indigenous Non-Indigenous Not stated Total n % n % n % n % 0-9 years , , years , years , years , , years , , years , , years and over , , , Total , , , A Clear View 79
91 Table A3: Persons with a sensory disability by age and employment status. Employed Unemployed Not in the labour Not stated Total force n % n % n % n % n % years years , years , years , years , years and over , , , Total 4, , , , , A Clear View 80
92 Appendix 7.3: Technical Appendix on the ABS 2009 Survey of Disability, Ageing and Carers 2 Introduction The 2009 Survey of Disability, Ageing and Carers (SDAC) was conducted throughout Australia from April to December The aims of the survey were to: Measure the prevalence of disability in Australia. Measure the need for support of older people and those with a disability. Provide a demographic and socio-economic profile of people with disabilities, older people and carers compared with the general population. Estimate the number of and provide information about people who provide care to older people and people with disabilities. The survey collected the following information from the three target populations: People with a disability information about their long-term health conditions, need for and receipt of assistance, use of aids and equipment such as wheelchairs and hearing aids, and participation in community activities. Older people(i.e. those aged 60 years and over) information about their need for, and receipt of assistance, and participation in community activities. People who care for persons with a disability and older people information about the type of care they provide, the support available to them, and the characteristics of carers and some of the effects that the caring role has on their lives. A Clear View 81
93 Scope The scope of SDAC was persons in both urban and rural areas in all states and territories, living in both private and non-private dwellings (including persons in caredaccommodation), but excluding: diplomatic personnel of overseas governments; persons whose usual residence was outside Australia; members of non-australian defence forces (and their dependants) stationed in Australia; and persons living in very remote areas. Survey Design & Data Collection Multi-stage sampling techniques were used to select the sample for the survey. After sample loss, the household sample included approximately 27,600 private dwellings and 200 non-private dwellings, while the cared accommodation sample included approximately 1,100 establishments. After exclusions due to scope and coverage, the final sample comprised 64,213 persons for the household component and 9,470 persons for the caredaccommodation component. Data Collection The household component covered persons in: Private dwellings such as houses, flats, home units and townhouses. A Clear View 82
94 Non-private dwellings such as hotels, motels, boarding houses, short term caravan parks, and self-care components of retirement villages. Household component Data for the household component of the survey were collected by trained interviewers, who conducted computer assisted personal interviews. Where possible, a personal interview was conducted with people identified in any of the above populations. Proxy interviews were conducted for: Children aged less than 15 years. Those aged 15 to 17 years whose parents did not permit them to be personally interviewed. Those with a disability that prevented them from having a personal interview. People with a disability were asked questions relating to help and assistance needed and received for communication, mobility, self-care, cognition or emotion, health care, household chores, property maintenance, meal preparation, reading and writing tasks, and transport activities. They were also asked questions relating to their computer and Internet use and participation in community activities. Those aged 15 to 64 years were asked about employment restrictions. People aged 60 years and over without a disability were asked questions about need for, and receipt of, help for household chores, property maintenance, meal preparation, reading and writing tasks and transport activities. They were also asked A Clear View 83
95 questions relating to computer and Internet use and participation in community activities. Persons who confirmed they were the primary carer of a person with a disability or an older person were asked about the assistance they provided, the assistance they could call on, and their employment experience. They were also asked to complete a selfenumeration form which collected information about their attitudes to, and experience of, their caring role. Estimates Estimates (numbers and percentages) with RSEs less than 25% are considered sufficiently reliable for most purposes. However, estimates with larger RSEs are included and preceded by an asterisk (e.g.*3.9) to indicate they are subject to high SEs and should be used with caution. Estimates with RSEs greater than 50% are preceded by a double asterisk (e.g.**1.2) to indicate that they are considered too unreliable for general use. A Clear View 84
96 LMITATIONS AND RESTRICTIONS Table of limitations, Restrictions, Activities and Tasks To identify whether a person has a particular type of limitation or restriction, the SDAC collects information on need for assistance, difficulty experienced, or use of aids or equipment to perform selected tasks. Below are listed the tasks associated with each type of limitation and restriction. LIMITATION OR RESTRICTION, Specific limitation or restriction, Core activity limitations ACTIVITY TASKS Communication Understanding family or friends Being understood by family or friends Being understood by strangers Mobility Getting into or out of bed Moving about usual place of residence Moving about a place away from usual residence Walking 200 metres A Clear View 85
97 Walking up and down stairs without a handrail Bending and picking up an object from the floor Using public transport Self-care Showering or bathing Dressing Eating Toileting Bladder or bowel control Schooling or employment restrictions Schooling Unable to attend school Attends a special school Attends special classes at an ordinary school Needs at least one day a week off school on average Has difficulty at school Employment Permanently unable to work Restricted in the type of work they can or could do Need, or would need, at least one day a week off work on average Restricted in the number of hours they can, or could, work A Clear View 86
98 Requires special equipment or modified work environment Needs ongoing assistance or supervision Would find it difficult to change jobs or get a preferred job Needs assistance from a disability job placement program or agency LIMITATION OR RESTRICTION Other activities ACTIVITY Health Care Foot care Taking medications or administering injections Dressing wounds Using medical machinery Manipulating muscles or limbs Reading or writing Checking bills or bank statements Writing letters Filling in forms Transport Going to places away from the usual place of residence Household Chores Washing A Clear View 87
99 Vacuuming Dusting Property maintenance Changing light bulbs, taps, washers or car registration stickers Making minor home repairs Mowing lawns, watering, pruning shrubs, light weeding or planting Removing rubbish Meal preparation Preparing ingredients Cooking food Cognition or emotion Making friendships, interacting with others or maintaining relationships Coping with feelings or emotions Decision making or thinking through problems A Clear View 88
100 Appendix 5: DS NMDS Collection Definitions and Scope 65 Scope of the DS NMDS collection The DS NMDS collects information on services and service users (see below) where funding has been provided, during the specified period, by a government organisation operating under the NDA. An agency (see below) may receive funding from multiple sources. Where an agency is unable to differentiate service users and/or staff according to funding source (that is, NDA or other), it is asked to provide details of all service users and staff (for each service type). It is also important to note that the DS NMDS collection only provides for information on one informal carer per service user (see below for definition of carer). Agency An organisation that delivers one or more service types provided under the NDA (service type outlets). Agencies are usually legal entities, and are generally responsible for providing DS NMDS data to jurisdictions. Where an agency operates only one service type outlet, the service type outlet and the agency are one and the same. Carer (informal) An informal carer is a person such as a family member, friend or neighbour who provides regular and sustained care and assistance to the person requiring support. This includes people who may receive a pension or benefit associated with their caring role, but does not include people, either paid or voluntary, whose services are A Clear View 89
101 arranged by formal service organisation. Informal carers can be defined as primary if they help with one or more of the activities of daily living: self-care, mobility or communication. Primary disability The primary disability group is one that most clearly expresses the experience of disability by a person. The primary disability group can also be considered as the disability group causing the most difficulty to the person (overall difficulty in daily life, not just within the context of the support offered by this service). Service A support activity delivered to a service user, in accordance with the NDA. Services within the scope of collection are those for which funding has been provided, during the specified period, by a government organisation operating under the NDA. Service type and service group The support activity that is provided to the client. The DS NMDS classifies services according to the service type, arranging services into seven distinct categories known as service groups. They are: accommodation support; community support; community access; respite; employment; advocacy, information and alternative forms of communication; and other support. Within each of these service groups are various service types. A Clear View 90
102 Service type outlet A counting unit managed by an agency that delivers one type of NDA service from a discrete location. If an agency provides, for example, both accommodation support and respite services, it is counted as two service type outlets. Similarly, if an agency provides more than one accommodation support service type (for example, group homes and attendant care) then it is providing ( and is usually separately funded for) two different service types; that is, there are two service type outlets for the agency. Service user A person with disability who receives a service provided under the NDA. A service user may receive more than one service over a period of time or on a single day. A Clear View 91
103


104 A Clear View Identifying Australians who live with deafblindness and dual sensory loss Prepared for Senses Australia by Paula Dyke, July Tel Fax TTY Kitchener Avenue, Burswood WA 6100 PO Box 143, Burswood WA
Goldfields population and health snapshot
 Goldfields population and health snapshot The Goldfields region is located in the south east corner of Western Australia and incorporates eight local government areas. It is the largest health region in
Copyright Australian Hearing Demographic Details
 1 Demographic Details Of young Australians aged less than 26 years with a hearing loss, who have been fitted with a hearing aid or cochlear implant at 31 December 2017 2 Summary: This circular contains
Kimberley population and health snapshot
 Kimberley population and health snapshot The Kimberley is the State s most northern region and forms one sixth of Western Australia s total landmass. The Kimberley is remote from metropolitan areas with
Primary Health Networks
 Primary Health Networks Drug and Alcohol Treatment Activity Work Plan 2016-17 to 2018-19 Hunter New England & Central Coast Please note: This Activity Work Plan was developed in response to the HNECC PHN
Section F: Discussing the diagnosis and developing a management plan
 Section E: Formulating a diagnosis Information collected during the diagnostic assessment should be reviewed, ideally in a multi-disciplinary team context, to evaluate the strength of evidence to: Support
3. Queensland Closing the Health Gap Accountability Framework. COAG national targets and indicators
 3. Queensland Closing the Health Gap Accountability Framework The accountability framework articulated in this section is designed to measure progress against the health targets and indicators included
Vision and eye healthcare study in residential aged care facilities
 Vision and eye healthcare study in residential aged care facilities Study report Report prepared by: Rob Cummins, Director, Research & Policy Julie Heraghty, Former Chief Executive Officer Macular Disease
Early Identification of Young Children with Deaf-Blindness
 Early Identification of Young Children with Deaf-Blindness Jerry G. Petroff & Madeline Appell Based on the work of.. Dr. Sarah Cawthon, M.D. What is Deaf-Blindness? the term deaf-blind, with respect to
Congenital Cytomegalovirus (CMV)
") August 2011 Congenital Cytomegalovirus (CMV) Revision Dates Case Definition Reporting Requirements Remainder of the Guideline (i.e., Etiology to References sections inclusive) August 2011 August 2011 June
August 2011 Congenital Cytomegalovirus (CMV) Revision Dates Case Definition Reporting Requirements Remainder of the Guideline (i.e., Etiology to References sections inclusive) August 2011 August 2011 June
Medical Professionals Guide. children with deafblindness. for the identification of. Systems Development & Improvement Center
 Medical Professionals Guide for the identification of children with deafblindness Systems Development & Improvement Center Medical Professionals Guide for the Identification of Children with Deafblindness*
9. Sensory Impairment and Physical Disability
 9. Sensory Impairment and Physical Disability Introduction This section focuses on the needs of the Borough s adults with sensory impairment and physical disabilities. For this Joint Strategic Needs Assessment
EPIREVIEW INVASIVE PNEUMOCOCCAL DISEASE, NSW, 2002
 EPIREVIEW INVASIVE PNEUMOCOCCAL DISEASE, NSW, 2002 Robyn Gilmour Communicable Diseases Branch NSW Department of Health BACKGROUND Infection with the bacterium Streptococcus pneumoniae is a major cause
We are nearly there. Close the Gap for Vision
 We are nearly there Close the Gap for Vision Executive summary Australia is on the verge of closing the gap in Indigenous eye health Elimination of trachoma Sight restoration for ~4,000 Indigenous Australians
CLINICAL AUDIT SUMMARY CLINICAL AUDIT SUMMARY. Diagnosis and Recognition of Congenital Cytomegalovirus in Northern Ireland
 Regional Virology Issue Date: 08/09/14 Page(s): Page 1 of 6 1.0 Name of audit Diagnosis and Recognition of Congenital Cytomegalovirus in Northern Ireland 2.0 Personnel involved Peter Coyle, Han Lu, Daryl
Birth mother Foster carer Other
 PATIENT DETAILS NAME Sex Female Male Other Date of birth (DD/MM/YYYY) / / Age at assessment: Racial/ ethnic background Preferred language Hospital number (if applicable) Referral source, date, provider
Disability Care and Support Response to the Productivity Commission s Draft Report April 2011
 Disability Care and Support Response to the Productivity Commission s Draft Report April 2011 About the Australian Advisory Board on Autism Spectrum Disorders The Australian Advisory Board on Autism Spectrum
Aboriginal Health Data for Our Region. Newcastle/Hunter Aboriginal Partnership Forum Planning Day July 2017
 Aboriginal Health Data for Our Region Newcastle/Hunter Aboriginal Partnership Forum Planning Day July 2017 Aboriginal Health Needs Assessment Aimed to identify local health priorities for action, and inform
Joint Standing Committee on the National Disability Insurance Scheme (NDIS) The Provision of Hearing Services under the NDIS
 The Provision of Hearing Services under the NDIS") Joint Standing Committee on the National Disability Insurance Scheme (NDIS) The Provision of Hearing Services under the NDIS Children and Young People with Disability Australia Submission January 2017
Joint Standing Committee on the National Disability Insurance Scheme (NDIS) The Provision of Hearing Services under the NDIS Children and Young People with Disability Australia Submission January 2017
Congenital Rubella Syndrome. Name. English 012 Section 35. Professor Paul Marchbanks. September 29, 2005
 Congenital Rubella Syndrome Name English 012 Section 35 Professor Paul Marchbanks September 29, 2005 1 Congenital rubella syndrome, by definition, is a group of physical abnormalities that occur in an
NIDAC Online Consultation 1: Alcohol. Summary of Findings
 NIDAC Online Consultation 1: Alcohol Summary of Findings 1 BACKGROUND Between 28 March and 30 April 2011, NIDAC undertook an online consultation on alcohol using Survey Monkey, a specialised online survey
The Cost to Close the Gap for Vision
 The to Close the Gap for Vision This report was prepared by Dr Ya-Seng (Arthur) Hsueh*, Mr Alex Brando*, Professor David Dunt, Mr Mitchell Anjou* and Professor Hugh Taylor of the Centre for Health Policy,
Primary Health Networks
 Primary Health Networks Drug and Alcohol Treatment Activity Work Plan 2016-17 to 2018-19 Drug and Alcohol Treatment Budget Gippsland When submitting this Activity Work Plan 2016-2018 to the Department
BCG vaccine and tuberculosis
 PART 2: Vaccination for special risk groups 2.1 Vaccination for Aboriginal and Torres Strait Islander people Aboriginal and Torres Strait Islander people historically had a very high burden of infectious
Needle and Syringe Programs - 17 October 2013
 Needle and Syringe Programs - 17 October 2013 ANCD Position Paper: Needle and Syringe Programs MEDIA RELEASE 17 October 2013 The Australian National Council on Drugs (ANCD) has today released a position
The Silent Disease Inquiry into Hepatitis C in Australia
 Australian Government response to the House of Representatives Standing Committee on Health report: The Silent Disease Inquiry into Hepatitis C in Australia November 2016 LIST OF ABBREVIATIONS AHPPC Australian
Specialist Eye Health Guidelines
 Specialist Eye Health Guidelines for use in Aboriginal and Torres Strait Islander Populations Cataract Diabetic Retinopathy Trachoma Commonwealth of Australia 2001 This work is copyright. It may be reproduced
April 2019 NATIONAL POLICY PLATFORM
 April 2019 NATIONAL POLICY PLATFORM There are crisis services available 24/7 if you or someone you know is in distress Lifeline: 13 11 14 www.lifeline.org.au people took their own lives in 2017 1 Over
INDIGENOUS MALE HEALTH
 INDIGENOUS MALE HEALTH A report for Indigenous males, their families and communities, and those committed to improving Indigenous male health Dr Mark Wenitong Executive Officer, Australian Indigenous Doctors
Criteria for Registering as a Developmental Paediatrician
 Criteria for Registering as a Developmental Paediatrician A doctor can apply to be registered as a Developmental Paediatrician if he/she fulfils ALL the following requirements: 1 A recognised basic medical
Improving Eye Health. Cardiff and Vale University Health Board
 Improving Eye Health Cardiff and Vale University Health Board Local Eye Care Plan 2013-2018 1. Introduction On the 18 th September 2013 the Welsh Government published Together for Health: Eye Health Care,
Executive Board of the United Nations Development Programme and of the United Nations Population Fund
 United Nations Executive Board of the United Nations Development Programme and of the United Nations Population Fund Distr.: General 9 April 2010 Original: English DP/FPA/DCP/PRK/5 Annual session 2010
The 2004 National Child Count of Children and Youth who are Deaf-Blind
 The 2004 National Child Count of Children and Youth who are Deaf-Blind NTAC The Teaching Research Institute Western Oregon University The Helen Keller National Center Sands Point, New York The National
Aboriginal and Torres Strait Islander Health Performance Framework Report
 Aboriginal and Torres Strait Islander Health Performance Framework 26 Report Report Findings Tier 1: Health Status and Outcomes Improvements: Mortality Infant Mortality Deaths due to Circulatory Disease
Australian Political Studies Association Survey Report prepared for the APSA Executive
 Australian Political Studies Association Survey 2017 Report prepared for the APSA Executive September 2017 1 Survey of the Australian Political Studies Association Membership 2017 Table of Contents 1.
HEALTH. Sexual and Reproductive Health (SRH)
") HEALTH The changes in global population health over the last two decades are striking in two ways in the dramatic aggregate shifts in the composition of the global health burden towards non-communicable
HEALTH The changes in global population health over the last two decades are striking in two ways in the dramatic aggregate shifts in the composition of the global health burden towards non-communicable
NSW Annual Vaccine-Preventable Disease Report, 2011
 NSW Annual Vaccine-Preventable Disease Report, 211 Alexander Rosewell A,B, Paula J. Spokes A and Robin E. Gilmour A A Health Protection NSW B Corresponding author. Email: arosw@doh.health.nsw.gov.au Abstract:
Updated Activity Work Plan : Drug and Alcohol Treatment
 Web Version HPRM DOC/17/1043 Updated Activity Work Plan 2016-2019: Drug and Alcohol Treatment This Drug and Alcohol Treatment Activity Work Plan template has the following parts: 1. The updated strategic
ACCOUNTABILITY AND QUALITY IMPROVEMENT FOR PERINATAL HEALTH
 ACCOUNTABILITY AND QUALITY IMPROVEMENT FOR PERINATAL HEALTH Attention to health system reforms of the past decade has focused on cost containment through efficiency, choice, and medical necessity controls.
SOUTH AFRICAN DECLARATION ON THE PREVENTION AND CONTROL OF NON-COMMUNICABLE DISEASES
 SOUTH AFRICAN DECLARATION ON THE PREVENTION AND CONTROL OF NON-COMMUNICABLE DISEASES We, the participants in the South African Summit on the Prevention and Control of Non- Communicable diseases gathered
Primary Health Networks
 Primary Health Networks Drug and Alcohol Treatment Activity Work Plan 2016-17 to 2018-19 Drug and Alcohol Treatment Budget Murray PHN When submitting this Activity Work Plan 2016-2018 to the Department
Mid-term Review of the UNGASS Declaration of. Commitment on HIV/AIDS. Ireland 2006
 Mid-term Review of the UNGASS Declaration of Commitment on HIV/AIDS Ireland 2006 Irish Role in Global Response Just as the HIV/AIDS epidemic is a global threat, addressing the challenge of the epidemic
A summary of guidance related to viral rash in pregnancy
 A summary of guidance related to viral rash in pregnancy Wednesday 12 th July 2017 Dr Rukhsana Hussain Introduction Viral exanthema can cause rash in pregnant women and should be considered even in countries
Policy Statement Delivery of Oral Health: Special groups: Aboriginal and Torres Strait Islander Australians
 Policy Statement 2.3.5 Delivery of Oral Health: Special groups: Aboriginal and Torres Strait Islander Australians Position Summary Research must be funded to better understand the dental needs and issues
Towards universal access
 Key messages Towards universal access Scaling up priority HIV/AIDS interventions in the health sector September 2009 Progress report Towards universal access provides a comprehensive global update on progress
The Healthcare Cost of Symptomatic Congenital CMV Disease in Privately Insured US Children: Estimates from Administrative Claims Data
 National Center on Birth Defects and Developmental Disabilities The Healthcare Cost of Symptomatic Congenital CMV Disease in Privately Insured US Children: Estimates from Administrative Claims Data Scott
Autism Advisor Program NSW
 Information Sheet What is the Autism Advisor Program? The NSW Autism Advisor Program offers the following support to families: information about autism spectrum disorders information about family support
Part I. Health-related Millennium Development Goals
 11 1111111111111111111111111 111111111111111111111111111111 1111111111111111111111111 1111111111111111111111111111111 111111111111111111111111111111 1111111111111111111111111111111 213 Part I Health-related
Consultation on the Draft National Strategies for Blood Borne Viruses and Sexually Transmissible Infections
 Consultation on the Draft National Strategies for Blood Borne Viruses and Sexually Transmissible Infections AFAO comments on draft Third National Sexually Transmissible Infections Strategy 2014 2017 AFAO
National and International Comparisons of Selected Health Measures for Western Australians
 Epidemiology Occasional Paper 24 ISSN 1329-7252 National and International Comparisons of Selected Health Measures for Western ns August 2004 Health Information Centre Department of Health, Western Citation
Sexual & Reproductive Health in the Context of Zika Virus
 Contents 1 The Zika Epidemic & its Impact on Health 2 Transmission, Pregnancy & Human Rights 3 GTR s Program & Public Policy Recommendations 4 GTR's Recommendations for Health Care Providers 5 GTR's Sexual
Version for the Silent Procedure 29 April Agenda item January Hepatitis
 Version for the Silent Procedure 29 April 2014 134th session EB134.R18 Agenda item 10.5 25 January 2014 Hepatitis The Executive Board, Having considered the report on hepatitis, 1 RECOMMENDS to the Sixty-seventh
Technical matters: Viral hepatitis
 REGIONAL COMMITTEE Provisional Agenda item 8.6 Sixty-seventh Session SEA/RC67/29 Dhaka, Bangladesh 9 12 September 2014 28 July 2014 Technical matters: Viral hepatitis Viral hepatitis is a serious public
The Aboriginal Maternal and Infant Health Service: a decade of achievement in the health of women and babies in NSW
 The Aboriginal Maternal and Infant Health Service: a decade of achievement in the health of women and babies in NSW Elisabeth Murphy A,B and Elizabeth Best A A Maternity, Children and Young People s Health
Primary Health Networks
 Primary Health Networks Drug and Alcohol Treatment Activity Work Plan 2016-17 to 2018-19 South Eastern Melbourne PHN When submitting this Activity Work Plan 2016-2018 to the Department of Health, the PHN
SOUTH AFRICAN DECLARATION ON THE PREVENTION AND CONTROL OF NON-COMMUNICABLE DISEASES
 SOUTH AFRICAN DECLARATION ON THE PREVENTION AND CONTROL OF NON-COMMUNICABLE DISEASES We, the participants in the South African Summit on the Prevention and Control of Non- Communicable diseases gathered
Women s Knowledge of Congenital Cytomegalovirus: Baseline Results from the HealthStyles Survey
 Women s Knowledge of Congenital Cytomegalovirus: Baseline Results from the HealthStyles Survey Early Hearing Detection and Intervention (EHDI) Centers for Disease Control and Prevention National Center
Assessment and Diagnosis
 Amaze Position Statement Assessment and Diagnosis Key points Autism assessment and diagnostic services should be available to all people who require them, irrespective of age, gender, locality, financial
Burden of end-stage renal disease
 Summary of Indigenous health: End-stage renal disease Neil Thomson and Sasha Stumpers Australian Indigenous HealthInfoNet, Edith Cowan University www.healthinfonet.ecu.edu.au This summary of end-stage
Deaf Children and Young People
 Deaf Children and Young People Professor Barry Wright Clinical Lead - National Deaf Children Young People and Family Service, York National Deaf Child and Adolescent Mental Health Service (NDCAMHS) Definitions
Education Options for Children with Autism
 Empowering children with Autism and their families through knowledge and support Education Options for Children with Autism Starting school is a major milestone in a child s life, and a big step for all
No RXXX 21 November 2009 HEALTH PROFESSIONS COUNCIL OF SOUTH AFRICA REGULATIONS DEFINING THE SCOPE OF THE PROFESSION OF AUDIOLOGY
 No RXXX 21 November 2009 HEALTH PROFESSIONS COUNCIL OF SOUTH AFRICA REGULATIONS DEFINING THE SCOPE OF THE PROFESSION OF AUDIOLOGY In terms of section 33(1) of the Medical, Dental and Supplementary Health
Executive Board of the United Nations Development Programme, the United Nations Population Fund and the United Nations Office for Project Services
 United Nations DP/FPA/CPD/NGA/7 Executive Board of the United Nations Development Programme, the United Nations Population Fund and the United Nations Office for Project Services Distr.: General 18 July2013
OBSTETRIC FISTULA. Introduction WHEN CHILDBIRTH HARMS: 1 Updated with technical feedback December 2012
 WHEN CHILDBIRTH HARMS: OBSTETRIC FISTULA Updated with technical feedback December 2012 Introduction Obstetric fistula is a preventable and in most cases, treatable childbirth injury that leaves women incontinent,
PCC4U. Uptake of the PCC4U Resources. Funded by the Australian Government through the National Palliative Care Program
 Issue No. 19 July 2010 The Australian Government has committed to improving the quality of care provided to Australians at end of life, by supporting the inclusion of palliative care education as an integral
SUBMISSION. Inquiry into the Hearing Health and Wellbeing of Australia
 ROYAL AUSTRALASIAN COLLEGE OF SURGEONS AUSTRALIAN SOCIETY OF OTOLARYNGOLOGY HEAD AND NECK SURGERY SUBMISSION Inquiry into the Hearing Health and Wellbeing of Australia Date 23 December 2016 The Royal Australasian
MOVEMBER FUNDED MEN S HEALTH INFORMATION RESOURCES EVALUATION BRIEF. 1 P age
 MOVEMBER FUNDED MEN S HEALTH INFORMATION RESOURCES EVALUATION BRIEF 1 P age Contents 1. Purpose... 3 2. Background... 3 3. beyondblue, the national depression and anxiety initiative... 4 4. Movember funded
AFL NSW/ACT Exemption & Dispensation Policy
 AFL NSW/ACT Exemption & Dispensation Policy Last reviewed 14 May 2012. AFL NSW/ACT s policy is that age exceptions and/or dispensations will only exist in cases of disability These exemptions require approval
Programs and services for people with vision or hearing loss
 Programs and services for people with vision or hearing loss www.ridbc.org.au About RIDBC Royal Institute for Deaf and Blind Children (RIDBC) is Australia s largest non-government provider of therapy,
HIV in Australia Annual surveillance short report 2018
 HIV in Australia Annual surveillance short report 218 The Kirby Institute for infection and immunity in society 218 ISSN 226-163 (Online) This publication and associated data are available at internet
AUSTRALIAN AND NEW ZEALAND STILLBIRTH ALLIANCE. A regional office of the International Stillbirth Alliance
 AUSTRALIAN AND NEW ZEALAND STILLBIRTH ALLIANCE A regional office of the International Stillbirth Alliance STRATEGIC DIRECTIONS AND GOALS FOR 2010-2014 This document outlines the mission, vision, guiding
Faculty/Presenter Disclosure
 Faculty/Presenter Disclosure Jane Freemantle has no relevant financial relationships with the manufacturer(s) of commercial services discussed in this CME activity Jane Freemantle does not intend to discuss
Autism Advisor Program NSW
 What is the Autism Advisor Program? Information Sheet The NSW Autism Advisor Program offers the following support to families: information about autism spectrum disorders information about family support
Improving health service delivery through telehealth expansion in Queensland
 Improving health service delivery through telehealth expansion in Queensland Andrew Bryett, Acting Director, Statewide Telehealth Services, Queensland Health, Australia Queensland 22% of the land mass
Experts warn that reduced vaccination may lead to increased health risks this flu season
 It s coming back Experts warn that reduced vaccination may lead to increased health risks this flu season EMBARGOED: 05:00am: Wednesday 30 March 2011: As the flu season begins, new findings released today
Congenital CMV infection. Infectious and Tropical Pediatric Division Department of Child Health Medical Faculty, University of Sumatera Utara
 Congenital CMV infection Infectious and Tropical Pediatric Division Department of Child Health Medical Faculty, University of Sumatera Utara Congenital CMV infection Approximately 0.15 2% of live births
Mental Health and AoD Community Briefing Outcomes
 The Community Briefing on 28 June was attended by almost 100 participants and data from 7 stations were gathered on the following topics: Suicide Prevention CALD and Indigenous Child and Youth Severe and
New survey highlights impact of Aboriginal and Torres Strait Islander mental health conditions
 ITEM 1. New survey highlights impact of Aboriginal and Torres Strait Islander mental health conditions 28 April 2016 The National Mental Health Commission welcomes today s release of the Australian Bureau
AUSTRALIAN INFLUENZA SURVEILLANCE SUMMARY REPORT
 AUSTRALIAN INFLUENZA SURVEILLANCE SUMMARY REPORT No.19, 29, REPORTING PERIOD: 12 September 29 18 September 29 Key Indicators The counting of every case of pandemic influenza is no longer feasible in the
SAFEMINDS EVALUATION OF IACC BUDGET Green denotes SafeMinds Recommendations, Red denotes IACC future action. IACC Budget Recommendation 5,300,000
 Green denotes SafeMinds s, Red denotes IACC future action 1. When Should I Be Concerned? ST 1.1 Develop, with existing tools, at least one efficient diagnostic instrument (e.g., briefer, less time intensive)
Worcestershire's Autism Strategy
 Worcestershire Health and Well-being Board Worcestershire's Autism Strategy 2014-17 Fulfilling and Rewarding Lives for adults with autism spectrum conditions Find out more online: www.worcestershire.gov.uk/healthandwellbeingboard
Cancer screening: Breast
 Cancer control in NSW: 2016 Cancer screening: Breast Introduction In NSW, breast cancer accounted for 27.4 per cent of all new cancer cases in women, and 14.6 per cent of all cancer mortality in women
Community Needs Analysis Report
 Grampians Medicare Local Community Needs Analysis Report Summary October 2013 2 Contents Introduction 3 Snapshot of results 4 Stakeholder feedback 5 Health status of residents 6 Health behaviour of residents
JCIH Recommendations for Following Children At Risk for Hearing Loss
 JCIH Recommendations for Following Children At Risk for Hearing Loss With newborn hearing screening, the Joint Commission on Infant Hearing (JCIH) has recommendations for following children who may be
Prof Marion Eckert Rosemary Bryant AO Research Centre
 Willingness of cancer survivors to complete patient reported outcomes (PRO) surveys: a pilot study at Flinders Centre for Innovation in Cancer (FCIC), South Australia Prof Marion Eckert Rosemary Bryant
Blood-borne. Viruses. Chapter overview. Chapter
 Chapter 1 hepatitis B virions Blood-borne Viruses Chapter overview The blood-borne viruses summarised in this chapter are hepatitis B, hepatitis C, and hepatitis D. HIV is covered in the sexually transmissible
The adult social care workforce supporting people with learning disabilities and/or autism Data from the National Minimum Data Set for Social Care
 The adult social care workforce supporting people with learning disabilities and/or autism Data from the National Minimum Data Set for Social Care July 2016 2 The adult social care workforce supporting
JOuRNAL OF CLiNiCAL ViROLOGY 46S (2009) S11 S15
 S11 S15") JOURNAL OF CLINICAL VIROLOGY 46S (2009) S11 S15 4 DOCTORS AWARENESS OF CONGENITAL CYTOMEGALOVIRUS AMONG IN THE NETHERLANDS A.M.H. KORVER J.J.C. DE VRIES J.W. DE JONG F.W. DEKKER A.C.T.M. VOSSEN A.M. OUDESLUYS-MURPHY
JOURNAL OF CLINICAL VIROLOGY 46S (2009) S11 S15 4 DOCTORS AWARENESS OF CONGENITAL CYTOMEGALOVIRUS AMONG IN THE NETHERLANDS A.M.H. KORVER J.J.C. DE VRIES J.W. DE JONG F.W. DEKKER A.C.T.M. VOSSEN A.M. OUDESLUYS-MURPHY
Population approaches to the primary prevention of birth defects. Carol Bower RACP Conference Adelaide 2016
 Population approaches to the primary prevention of birth defects Carol Bower RACP Conference Adelaide 2016 Acknowledgements Research collaborators Consumer and community advisors and representatives Stakeholders
Global health sector strategies on HIV, viral hepatitis and sexually transmitted infections ( )
") Regional Committee for Europe 65th session EUR/RC65/Inf.Doc./3 Vilnius, Lithuania, 14 17 September 2015 2 September 2015 150680 Provisional agenda item 3 ORIGINAL: ENGLISH Global health sector strategies
Regional Committee for Europe 65th session EUR/RC65/Inf.Doc./3 Vilnius, Lithuania, 14 17 September 2015 2 September 2015 150680 Provisional agenda item 3 ORIGINAL: ENGLISH Global health sector strategies
Children and AIDS Fourth Stocktaking Report 2009
 Children and AIDS Fourth Stocktaking Report 2009 The The Fourth Fourth Stocktaking Stocktaking Report, Report, produced produced by by UNICEF, UNICEF, in in partnership partnership with with UNAIDS, UNAIDS,
Referral Process Children age 0-3
 Referral Process Children age 0-3 Score on a developmental screen falls below the tool's empirical cutoff in one or more of the five domains,or there is an established condition, or parent concern. Children's
Response to the Consultation Draft National Alcohol Strategy by NOFASD Australia
 Response to the Consultation Draft National Alcohol Strategy 2018-2026 by NOFASD Australia Opening Comments The National Organisation for Fetal Alcohol Spectrum Disorder (NOFASD, Australia) is dedicated
Cancer control in NSW
 Cancer control in NSW Annual performance report 2015 Cancer control in NSW: 2015 Publisher Cancer Institute NSW Cancer control in NSW Annual performance report 2015 Contact details Cancer Institute NSW
WHAT IS AUTISM? Chapter One
 WHAT IS AUTISM? Chapter One Autism is a life-long developmental disability that prevents people from understanding what they see, hear, and otherwise sense. This results in severe problems with social
TELEPHONIC COMMUNICATION DEVICE LOAN APPLICATION. Personal Information. Date of Application. City County State Zip Code
 West Virginia Commission for the Deaf and Hard-of-Hearing 405 Capitol Street, Suite 800 Charleston, West Virginia 25301 (304) 558-1675 or (866) 461-3578 TELEPHONIC COMMUNICATION DEVICE LOAN APPLICATION
Special Education: Contemporary Perspectives for School Professionals Fourth Edition. Marilyn Friend. Kerri Martin, Contributor
 Special Education: Contemporary Perspectives for School Professionals Fourth Edition By Marilyn Friend Kerri Martin, Contributor 0 Special Education: Contemporary Perspectives for School Professionals,
Overview. Retinal vascularisation during development. Classification of ROP. Visual loss from retinopathy of prematurity: first global estimates
 Visual loss from retinopathy of prematurity: first global estimates Overview ROP - the condition, risk factors and control ROP as a cause of visual loss Earlier estimates New global estimates MARCH seminar,
Primary Health Networks
 Primary Health Networks Drug and Alcohol Treatment Activity Work Plan 2016-17 to 2018-19 Drug and Alcohol Treatment Budget Murray PHN When submitting this Activity Work Plan 2016-2018 to the Department
NATIONAL ORAL HEALTH PLAN MONITORING GROUP. KEY PROCESS AND OUTCOME PERFORMANCE INDICATORS Second follow-up report
 NATIONAL ORAL HEALTH PLAN MONITORING GROUP KEY PROCESS AND OUTCOME PERFORMANCE INDICATORS Second follow-up report 22-28 ARCPOH NOVEMBER 29 ACTION AREA ONE POPULATION ORAL HEALTH... 1 INDICATOR 1: NATIONAL
Prematurity as a Risk Factor for ASD. Disclaimer
 Prematurity as a Risk Factor for ASD Angela M. Montgomery, MD, MSEd Assistant Professor of Pediatrics (Neonatology) Director, Yale NICU GRAD Program Suzanne L. Macari, PhD Research Scientist, Child Study