WISCONSIN DENTIST WORKFORCE REPORT 2001
|
|
|
- Anna Atkins
- 6 years ago
- Views:
Transcription

1 434 WISCONSIN DENTIST WORKFORCE REPORT 2001 Written by: Gayle R. Byck Hollis Russinof Judith A. Cooksey June 2002
2 Table of Contents Executive Summary -3- Background -5- Methods -7- Findings Characteristics of Wisconsin Dentists Supply and Distribution of Dentists Race and Ethnicity of Wisconsin Primary Care Dentists Dental School Attended Dentist Participation in Medicaid Volunteer and Charity Care Retirement Plans -28- Analysis Projected Dentist Capacity Required to Serve Medicaid Enrollees -30- Discussion -33- Appendices -37- Appendix A Dental Advisory Committee Appendix B Survey Methodology and Instrument Appendix C Counties by Wisconsin Region Appendix D Counties by Rural/Urban Status Appendix E Data Tables This report was written by Gayle R. Byck, PhD, Hollis J. Russinof, MUPP and Judith A. Cooksey, MD, MPH at the University of Illinois at Chicago, Illinois Regional Health Workforce Center. Funding for this study was provided by the Wisconsin Primary Health Care Association in collaboration with the Health Resources and Services Administration, Bureau of Health Professions and Bureau of Primary Health Care.
3 Executive Summary In early 2001, the State of Wisconsin conducted a survey of licensed dentists to learn more about their dental workforce. This survey was required by state statute. The Wisconsin Primary Health Care Association contracted with the Illinois Regional Health Workforce Center to analyze and assess the survey data in terms of the supply, distribution, and characteristics of Wisconsin dentists as well as their participation in Medicaid, volunteer work, and retirement plans. Major findings are presented below. Characteristics of Wisconsin Dentists Ninety-four percent of licensed dentists responded to the survey. Of those, 66% (2,842) reported that they were currently practicing in Wisconsin. The majority of dentists practicing in Wisconsin were: in general practice (81%), white (95%), graduates of an in-state dental school (67%), in practice more than 20 years (57%), solo practitioners (53%). Supply and Distribution of Dentists Statewide, there were 53 dentists per population, or 1,887 people per dentist. The Southern and Western regions and the rural categories had the lowest dentist supply. There was a great deal of variation in dentist supply by county. The most common specialists were orthodontists (5%) and oral surgeons (4%). Rural areas had proportionately fewer specialists than metropolitan areas. Only 17 counties had a pediatric dentist. Pediatric dentists were concentrated in the metropolitan areas and in the Southeastern region. Primary care dentist supply varied by region and urban/rural status based on dental school attended, with most dentists in the Southeastern region and the metro-central category being in-state graduates. Race and Ethnicity of Wisconsin Primary Care Dentists There were proportionately fewer non-white primary care dentists than minorities in the state population, except for Asian/Pacific Islanders. Proportionately fewer non-white than white dentists attended an in-state dental school and more attended a dental school in other states. Non-white dentists had been in practice fewer years than white dentists. Dental School Attended by Wisconsin Dentists 70% of primary care dentists attended an in-state dental school. Half of in-state graduates practiced in the Southeastern region (which includes Milwaukee), and over 70% practiced in metropolitan areas. Graduates from border state dental schools were more evenly distributed by region and were most likely to practice in rural areas. The proportion of graduates who were non-white was much higher from other states than from in-state or border state dental schools. Dentists who attended an in-state dental school had been in practice longer than dentists from out-of-state dental schools. 3
4 Dentist Participation in Medicaid While 93% of dentists accepted new patients in their practice, only 1 in 5 (20%) dentists reported accepting new Medicaid patients. 42% of dentists reported treating Medicaid patients. Dentists in the two rural categories had the highest rates of Medicaid participation (53% and 60%). Medicaid participation was lowest in the Southeastern region (30%). Medicaid participation varied by: specialty (higher for pediatric dentists), dental school attended (lowest for in-state), and race/ethnicity (higher for non-white); it did not vary based on years in practice. 15 counties had no primary care dentists willing to accept new Medicaid patients. Volunteer and Charity Care 58% of all dentists provided some form of volunteer or charity care. Almost half of all dentists provided some pro bono (free) care. Few dentists volunteered at a clinic serving uninsured or underinsured patients or participated in the WDA/State Donated Dental Services Program. Retirement Plans Almost 1 in 7 (433) dentists planned to retire or leave practice in the next 5 years. About 1 of 3 (996) planned to retire or leave practice in the next 10 years. An even higher percentage of prosthodontists, periodontists, and oral surgeons planned to retire or leave practice in the next 10 years. In the next 5 and 10 years, 46% and 74% of dentists, respectively, with more than 30 years of experience planned to retire or leave practice. 14% and 35% of dentists who participated in Medicaid planned to retire or leave practice in the next 5 and 10 years, respectively. Conclusions. There are a number of findings that should be addressed by dentists, policy makers and planners in Wisconsin. Dentist supply was low in certain regions of the state, specifically the rural areas and the Southern and Western regions. The majority of dentists graduated from an instate dental school and these dentists tended to be concentrated in the Southeastern region, were less racially diverse, and had lower rates of Medicaid participation. Dentists who attended dental school in Minnesota, Illinois, or Iowa were more geographically dispersed throughout the state. With a growing Medicaid enrollment and few dentists reporting a willingness to accept new Medicaid patients, access to dental care for Medicaid patients is of concern. An analysis of dentist capacity needed to serve the Medicaid population shows that dentist participation in Medicaid will need to increase dramatically in order for large percentages of Medicaid enrollees to receive dental care. Finally, the large number of dentists planning to retire or leave practice in the next 5 and 10 years requires further study and attention. 4
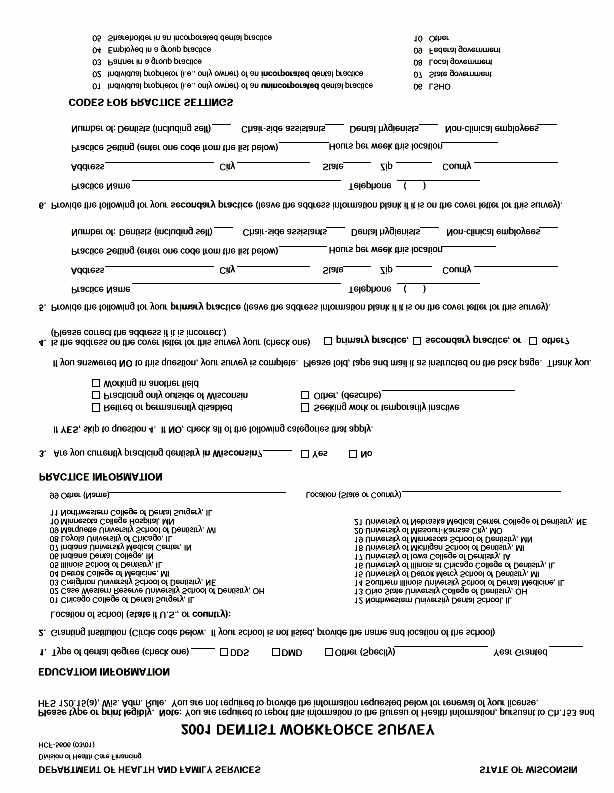
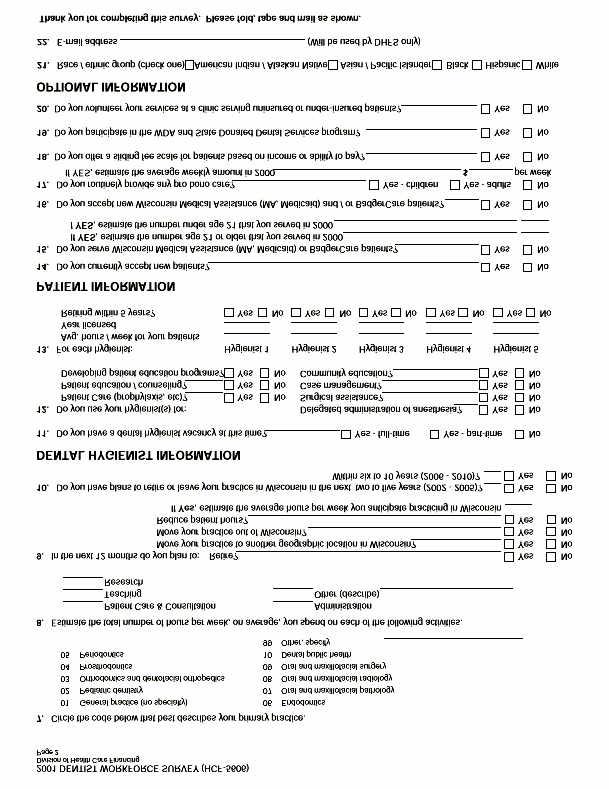
5 Background A Wisconsin statute required a survey of all Wisconsin dentists in The Wisconsin Primary Health Care Association (WPHCA) contracted with the University of Illinois at Chicago Illinois Regional Health Workforce Center (IRHWC) to examine the primary care dental workforce in Wisconsin. One reason for the survey was to better understand the supply and distribution of dentists, as well as to examine issues related to access to care. This assessment can assist policymakers and oral health professionals in their discussions about both workforce planning and improving access to dental care for underserved populations. This report provides the following information: 1. The characteristics of dentists currently practicing in Wisconsin in The supply and distribution of primary care (general and pediatric) dentists in the state. 3. The extent to which primary care dentists reflected the racial and ethnic diversity of the state population and the impact of in-state and border state dental schools on the racial/ethnic diversity of the primary care dental workforce. 4. The impact of location of dental school attended on the overall number and statewide distribution of primary care dentists in the State and participation in Medicaid or volunteer activities and provision of charity care. 5. The characteristics of dentists who did and did not bill for Medicaid services 6. The characteristics of dentists who did and did not participate in volunteer activities or provide charity care. 7. Projected short-term changes in dentist supply based on reported plans to reduce workload or retire within the next year or five years. 8. Projected dentist capacity required to serve Medicaid enrollees. Preliminary findings were presented to a group of stakeholders in March 2002 in Madison, Wisconsin for comment and review. A list of these stakeholders can be found in Appendix A. 5
6 6
7 Methods Data Sources 2001 Dentist Workforce Survey. The primary data source for this study was the 2001 Dentist Workforce Survey, 1 which was developed and administered by the Wisconsin Bureau of Health Information (BHI). The survey, required by state statute, was mailed in spring 2001 to all 4,563 dentists licensed in Wisconsin as of November 7, Appendix B contains the questionnaire and a description of BHI's methodology. Census data. Data from the 2000 census were used to provide population figures for each of the counties. These data were publicly available via the Internet. 2 Wisconsin Medicaid data. The State of Wisconsin's web site provides monthly enrollment data on the number of Medicaid, BadgerCare, and Medical Assistance enrollees by county. 3 These numbers were used for participating dentist-per-medicaid-population ratios. Variables and Definitions Wisconsin regions. Much of the data in this report are presented for the entire state and/or by the following five regions, defined by the BHI as: Northeastern, Northern, Southeastern, Southern, and Western. A map and a list of counties in each region are provided in Appendix C. Urban/rural status. The Wisconsin counties were categorized as: Central metropolitan ( metro-central ; 3 counties, all in the Milwaukee area, which is where the state s dental school is located). Other metropolitan ( metro-other ; 17 counties, which include cities such as Madison, Green Bay, La Crosse, Racine, Eau Claire, Sheboygan, Oshkosh, and Appleton). Rural counties adjacent to metropolitan counties ( rural-adjacent ; 26 counties, scattered throughout the state). Rural counties nonadjacent to metropolitan counties ( rural-nonadjacent ; 26 counties, 14 of which are in the northern part of the state, the remaining are scattered throughout). A map showing the urban/rural categories and a list of the counties in each category are provided in Appendix D. These urban/rural classifications were based on the 1993 rural-urban continuum codes (RUCC). 4 The RUCC classify metropolitan counties based on size. Non-metropolitan counties were grouped according to degree of urbanization and proximity to metropolitan areas. The RUCC includes 10 urban-rural categories (4 metropolitan and 6 non-metropolitan). We combined these categories to form the four major categories described above Dentist Workforce Survey, [Electronic Data File]. (September 2001). Bureau of Health Information, Division of Health Care Financing, Wisconsin Department of Health and Family Services. 2 GCT-P5. Age and Sex: Data Set: Census 2000 Summary File 1 (SF 1) 100-Percent Data. Geographic Area: Wisconsin -- County Source: U.S. Census Bureau, Census 2000 Summary File 1, Matrices PCT12 and P Wisconsin Department of Health & Family Services. See caseload.htm 4 Economic Research Service, U.S. Department of Agriculture. (2000). Measuring rurality: rural-urban continuum codes. 7
8 Years in Practice. The survey did not ask the dentist to provide his/her age. However, it did ask for the year that the dentist received his/her dental degree. Therefore, as a proxy for age, years in practice is discussed. (Note that this variable had a large number, 876, of non-responses.) Race/Ethnicity. There were 5 race/ethnicity categories on the survey: American Indian/Alaskan Native, Asian/Pacific Islander, Black, Hispanic, and White. For all analyses using race/ethnicity, we combined the first four categories as "non-white" and the latter category remained "white". Hours worked. Dentists were asked to indicate the number of hours per week that they spent at each practice location. Dental school attended. The survey questionnaire listed 21 dental schools and provided space for the respondent to fill in a school not listed. These schools were organized by state into three categories: In-state (the only dental school in Wisconsin is located at Marquette University in Milwaukee). Border or neighboring states - Minnesota, Illinois, and Iowa (University of Minnesota in Minneapolis, University of Iowa in Iowa City, University of Illinois at Chicago and Southern Illinois University in Edwardsville, as well as other schools in these states that are now closed). Other states This category included all other states. While Michigan also borders Wisconsin, there were very few dentists practicing in Wisconsin who graduated from a Michigan dental school. Medicaid participation. Dentists were asked two questions regarding Medicaid participation: (1) Do you serve Wisconsin Medical Assistance (MA, Medicaid) or BadgerCare patients? and (2) Do you accept new Wisconsin Medical Assistance (MA, Medicaid) or BadgerCare patients? Respondents were also asked to estimate the number of Medicaid Assistance and BadgerCare patients treated in year 2000; however, BHI did not publicly release these data because the data were found to be inconsistent with actual figures obtained from the Medicaid program. 5 5 Wisconsin Bureau of Health Information. Public Use Data File Documentation Dentist Workforce Survey. 8
9 Findings The 2001 Wisconsin Dental Workforce Survey had a 94% response rate (4,301 of the 4,563 licensed dentists). Of the 4,301 respondents, 2,842 dentists (66%) indicated that they were currently practicing in Wisconsin, while 1,459 were not currently practicing in Wisconsin. Of those who were not currently practicing in Wisconsin, 84% did not indicate their status (e.g., practicing outside of Wisconsin, retired, etc.). The American Dental Association reports 2,890 professionally active dentists in Wisconsin in The remainder of this analysis describes the 2,842 dentists practicing in Wisconsin. The following pages provide detailed findings on: 1. Characteristics of Wisconsin dentists, 2. Supply and distribution of Wisconsin dentists, 3. Race and ethnicity of Wisconsin primary care dentists, 4. Dental school attended, 5. Dentist participation in Medicaid, 6. Volunteer and charity care, 7. Retirement plans, and 8. Projected dentist capacity required to treat Medicaid enrollees. 6 American Dental Association, Survey Center, Distribution of Dentists in the United States by Region and State. Chicago, Illinois. January
10 1. Findings: Characteristics of Wisconsin Dentists Almost 84% of the respondents who listed a specialty were primary care dentists - either general practice dentists (2,272; 81%) or pediatric dentists (71; 2.5%). Thirty-one respondents did not list a specialty (Appendix E, Table E1). There were 461 dental specialists with the largest numbers being in orthodontics (152) and oral surgery (122); regardless of region or urban/rural status, oral surgeons and orthodontists were the most common specialists (Appendix E, Tables E1 and E2). There was minimal variation by region in the proportion of dentists who were general practitioners. However, rural areas had proportionately more general practitioners and fewer specialists (Appendix E, Table E2. See also Tables E3 and E4 for characteristics of dentists by region and urban/rural status). Over 95% of Wisconsin dentists were white, 3% were Asian-American, 1 % were Hispanic, 0.5% were Black, and 0.2% were American Indian/Alaskan Native. The proportions were similar for all dentists and for primary care dentists only. In their primary practice, more than half (57%) of all Wisconsin dentists were individual proprietors, 39% were in group practice, and less than 2% worked for the government (Table 1). Primary care dentists were more likely to be solo practitioners (60%) than dentists in other specialties (42%). Two-thirds of Wisconsin dentists attended an in-state dental school. Almost one-fourth attended a dental school in MN, IL, or IA (Figure 1). Looking just at primary care dentists: 70% attended an in-state dental school; 23% attended a school in MN, IL, or IA; and 7% attended an out-of-state school not in MN, IL, or IA. Over half (57%) of Wisconsin dentists had been in practice more than 20 years (Figure 2). The proportions were similar for primary care dentists. The median number of hours worked in the primary practice was the same for all dentists and for primary care dentists 35 hours. Median hours worked was 35 or 36 hours per week regardless of region, urban/rural status, dental school attended, race/ethnicity, solo or group practice, accepting new patients, or participating in Medicaid. Dentists who had been in practice more than 30 years had a slightly lower median number of hours worked 32 hours. Twenty-eight percent of dentists reported working fewer than 32 hours per week and 7% reported working more than 42 hours per week. 10
11 Findings: Characteristics of Wisconsin Dentists Table 1. Practice Setting of Dentists Practice Setting* Individual proprietor Group practice Employed Partner Shareholder Government Other All Dentists Primary Care Only Other Specialties * 532 respondents did not answer the question, 439 of which were primary care dentists. Figure 1. Location of Dental School Attended, All Dentists Other (9%) Figure 2. Years in Practice, All Dentists >30 yrs. (20%) <10 yrs. (13%) MN/IL/IA (24%) In-state (67%) yrs. (37%) yrs. (30%) 11
12 2. Findings: Supply and Distribution of Wisconsin Dentists For all dentists, the statewide ratio of dentists per 100,000 population was 53 (Table 2). For comparison, the ADA reported 55 professionally active dentists per 100,000 people in Wisconsin in 1998, 7 and the national ratio was 59 in We can also reverse this ratio to discuss the population per dentist. The statewide ratio for all residents was 1,887 persons to one dentist. o By region, the Southern and Western regions had the lowest dentists per population ratio - 45 and 46 dentists, respectively. In contrast, the Southeastern region had the highest ratio at 58 dentists (Table 2). o Differences were also apparent by urban/rural status, with a ratio of dentists per population of 64 in the metro-central category compared to ratios of 42 and 41 dentists in the two rural categories (Table 3). Similar distribution gaps were found among primary care dentists. Statewide, the ratio of primary care dentists per 100,000 population was 44. The distribution of primary care dentists by region and urban/rural status was similar to all dentists. Primary care dentist supply varied by region and urban/rural status based on dental school attended: o Region: Most (86%) dentists in the Southeastern were graduates from the in-state dental school. Only the Western region had a greater proportion of out-of-state graduates than in-state graduates (Figure 3). o Urban/Rural Status: About 9 out of 10 dentists in the metro-central category graduated from the in-state dental school, compared to about 6 of 10 dentists in the metro-other, rural-adjacent, and rural-nonadjacent categories (Figure 4). 7 American Dental Association, Survey Center, Distribution of Dentists in the United States by Region and State. Chicago, Illinois. January American Dental Association, Health Policy Resource Center, Future of Dentistry. Chicago, Illinois. 12
13 Findings: Supply and Distribution of Wisconsin Dentists Table 2. Dentist Supply by Region Wisconsin Northeastern Northern Southeastern Southern Western Total population 5,363,675 1,160, ,311 2,006, , ,539 All dentists 2, , Dentists per ,000 population Population per dentist 1,887 1,914 1,891 1,714 2,246 2,175 Primary care dentists 2, Dentist per 100,000 population Population per dentist 2,289 2,302 2,233 2,104 2,771 2,620 Table 3. Dentist Supply by Urban/Rural Status Ruralnonadjacent Wisconsin Metro-central Metro-other Rural-adjacent Total population 5,363,675 1,383,248 2,257,060 1,230, ,882 All dentists Dentists per ,000 population Population per dentist 1,887 1,563 1,875 2,394 2,428 Primary care dentists 2, Dentist per 100,000 population Population per dentist 2,289 1,916 2,349 2,759 2,754 Figure 3. Region Practicing by Dental School Attended Figure 4. Urban/Rural Status by Dental School Attended 100% 100% 80% 80% 60% 60% 40% 40% 20% 20% 0% Northeastern Northern Southeastern Southern Western 0% Metro-central Metro-other Rural-adjacent Ruralnonadjacent Legend In-state MN/IL/IA Other State 13
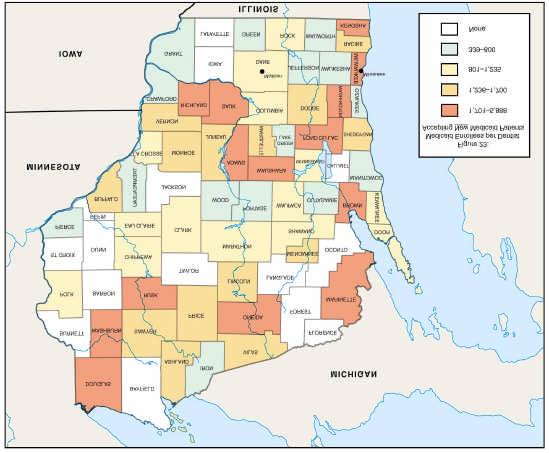
14 Findings: Supply and Distribution of Wisconsin Dentists (continued) There was a great deal of variation by county in terms of total dentists and dentist per 100,000 population. All counties had at least one dentist. Among the three smallest counties: o Menominee county had 3 dentists (2 in general practice) and 4,562 people (46 dentists /100,000 population) o Iron county had 2 dentists (both in general practice) and 6,861 people (29/100,000) o Florence county had 1 general practice dentist and 5,088 people (20/100,000) Among the three largest counties: o Milwaukee county had 563 dentists (461 in primary care) and 940,164 people (60/100,000) o Dane county had 229 dentists (179 in primary care) and 426,526 people (54/100,000) o Waukesha county had 260 dentists (213 in primary care) and 360,767 people (72/100,000) Figure 5 shows the number of primary care dentists in each county adjusted to the population. Only 17 counties had a pediatric dentist. Figure 6 shows counties in Wisconsin that had at least one pediatric dentist. Pediatric dentists were concentrated in the Southeastern region (36 pediatric dentists) along with a few counties in the middle of the state. Pediatric dentists also tended to practice in metropolitan areas. There were 13 metropolitan and 4 rural (all ruraladjacent, 5 pediatric dentists total) counties with at least one pediatric dentist. 14


15 Findings: Supply and Distribution of Wisconsin Dentists 15
16 3. Findings: Race and Ethnicity of Wisconsin Primary Care Dentists 9 The population of Wisconsin was predominantly white (90%) with relatively small numbers of racial/ethnic minorities. The percentage of the primary care dentist workforce that was white was higher than the general population (95%). Other than Asian-Americans, nonwhites were underrepresented among primary care dentists (Table 4). Characteristics of non-white dentists included: o Proportionately more practiced in the Southeastern region, while few practiced in the Northern and Western regions, as well as in rural areas (Appendix E, Table E5). o A larger proportion (27%) attended an out-of-state dental school in a non-neighboring state than white dentists (7%) (Figure 7). o They were in practice fewer years than white dentists. About 12% of white dentists had been in practice fewer than 10 years and 22% had 30 or more years of experience, compared to 42% and 11% of non-white dentists, respectively (Figure 8). 9 There were no racial/ethnic data for 606 primary care dentists. 16
17 Findings: Race and Ethnicity of Wisconsin Primary Care Dentists Table 4. Wisconsin Population and Primary Care Dental Workforce by Race/Ethnicity Race/Ethnicity White Black Asian/Pacific Islander Am. Indian/Al. Native Other State Population Primary Care Dentists Hispanic 4 1 *Data were missing for 606 dentists. State population data are from the U.S. Census Bureau, 2000 Census. Hispanic was a separate category from race in the census, but not in the WI dental workforce survey. 100% Figure 7. Race/Ethnicity by Dental School Attended 100% Figure 8. Race/Ethnicity by Years in Practice 80% 60% 40% 20% In-state MN/IL/IA Other 80% 60% 40% 20% >10 years years years >30 years 0% White Non-white 0% White Non-white 17
18 4. Findings: Dental School Attended 67% of all dentists attended an in-state dental school, 24% attended a dental school in a border state, and 9% attended a dental school in another state (see Appendix E, Table E6). o Specialty: A greater proportion (85%) of in-state graduates were general practitioners than out-of-state graduates (border states 77%, other states 60%). The highest proportion of specialists by dental school attended was from dental schools in other states (5% pediatric dentists, 35% other specialists) (Figure 9). The findings below apply to primary care dentists only (see Appendix E, Table E7). Region: Half of in-state dental school graduates practiced in the Southeastern region (which includes Milwaukee). Graduates from dental schools in MN, IL, and IA were more evenly distributed by region than graduates from in-state or other state dental schools (Figure 10). Of graduates from the border state dental schools (Appendix E, Figures E1 and E2): o Almost half (46%) of Wisconsin dentists from a Minnesota dental school practiced in the Western region. o Wisconsin dentists from an Iowa dental school primarily practiced in the Southern (39%) and Northeastern (25%) regions. o Illinois graduates who practiced in Wisconsin were located throughout the state. Urban/rural status : Graduates from MN, IL, and IA schools were more likely to practice in rural areas than graduates from in-state or other state dental schools. Most instate graduates (75%) practiced in metropolitan areas (Figure 11). Race/ethnicity: The proportion of graduates from other states (16%) who were nonwhite was considerably higher than from border state (5%) and in-state (3%) dental schools (Figure 12). Years in Practice: Dentists from out-of-state dental schools had been in practice fewer years than dentists from the in-state dental school. Almost one-fourth of in-state graduates had been in practice more than 30 years (Figure 13). 18
19 Findings: Dental School Attended 100% 80% 60% 40% 20% Figure 9. Specialty by Dental School Attended General Pediatric Other Specialists 100% 80% 60% 40% 20% Figure 10. Region Practicing by Dental School Attended Northeastern Northern Southeastern Southern Western 0% In-state MN/IL/IA Other states 0% In-state MN/IL/IA Other states 100% 80% 60% 40% Figure 11. Urban/Rural Status by Dental School Attended Metro-central Metro-other Rural-adjacent 100% 80% 60% 40% Figure 12. Race/Ethnicity by Dental School Attended White Non-white 20% 0% In-state MN/IL/IA Other states Ruralnonadjacent 20% 0% In-state MN/IL/IA Other states 100% Figure 13. Years in Practice by Dental School Attended 80% 60% 40% 20% <10 years years years >30 years 0% In-state MN/IL/IA Other states 19
20 5. Findings: Dentist Participation in Medicaid The State of Wisconsin provides dental services to enrollees in Medicaid, BadgerCare, and Medical Assistance programs (referred to from now on as "Medicaid"). Enrollment in these programs has been steadily increasing from 493,821 in January 2001, to 507,595 in July 2001, to 554,262 in January Table 5 shows the distribution of Medicaid enrollees by region and urban/rural status for July Almost half of enrollees (46%) were in the Southeastern region and 69% were in the metro categories. The Northeastern and Western regions had the lowest proportion of their population enrolled in Medicaid, as did the metro-other and rural-adjacent categories. Although an overwhelming majority (94%) of dentists accepted any new patients (although this proportion was lower in rural areas), their willingness to participate in Medicaid was much lower: o When asked about their participation in Medicaid, 42% (1,143) of all dentists reported treating Medicaid patients (Figure 14). In comparison to these self-reported data, Medicaid claims show that 1,421 dentists submitted claims for dental services in FY o Only 20% (539) of dentists reported accepting new Medicaid patients (Figure 15). o Pediatric dentists were significantly more likely to report treating Medicaid patients (73%), and accepting new Medicaid patients (64%), than both general practitioners (41%, 16%) and other specialists (39%, 34%). Other specialists were significantly more likely than general practitioners to accept new Medicaid patients (Figure 16). 10 Wisconsin Department of Health & Family Services. See caseload.htm 11 Wisconsin Department of Health and Family Services. (August 2000). Wisconsin Medicaid Dental Facts FY
21 Findings: Dentist Participation in Medicaid Table 5. Medicaid Enrollees by Region and Urban/Rural Status, July 2001 Category Medicaid Enrollees % of state enrollees % of population enrolled Region Northeastern Northern Southeastern Southern Western Tribes TOTAL 77,867 48, ,480 71,051 71,390 2, , Urban/Rural Status Metro-central Metro-other Rural-adjacent Rural-nonadjacent Tribes TOTAL 188, ,794 95,054 57,574 2, , Figure 14. Percentage of Wisconsin Dentists Who Reported Treating Medicaid Patients Figure 15. Percentage of Wisconsin Dentists Who Reported Accepting New Medicaid Patients Does Not Treat 58% Treats 42% Does Not Accept New 80% Accepts New 20% 100% 80% 60% 40% 20% 0% Figure 16. Medicaid Participation by Specialty General Practice Pediatric Dentistry Other Specialty Treats Accepts New 21
22 Findings: Dentist Participation in Medicaid (continued) Among primary care dentists, there were differences in Medicaid participation based on dentist and practice characteristics (also see Appendix E, Table E8): o Region: The Medicaid participation rate was highest in the Western region (60%). The Southeastern region had the lowest proportion (30%, 165 dentists) of dentists treating Medicaid patients, but the highest total number of participating dentists (280). In terms of accepting new Medicaid patients, the highest proportions were in the Northern (23%, 108 dentists) and Southern (21%, 164 dentists) regions (Figure 17). o Urban/Rural Status: A higher proportion of dentists in rural areas (53% in ruraladjacent, 235 dentists, and 60% in rural-nonadjacent, 105 dentists) reported treating Medicaid patients compared to dentists in metropolitan areas (45% in metro-other, 424 dentists, and 26% in metro-central, 182 dentists). The two rural categories also had proportionately more dentists accepting new Medicaid patients than the metropolitan categories, although the differences were smaller (Figure 18). o Dental school attended: Primary care dentists who attended an out-of-state dental school, particularly in MN/IL/IA, were more likely to treat Medicaid patients than dentists who attended an in-state school. Dentists who attended an out-of-state dental school were also more likely to accept new Medicaid patients than dentists who attended an in-state school (Figure 19). Even when examining participation of graduates by the region in which they are practicing, in-state graduates in the Southeastern region had the lowest participation of in-state graduates practicing in any region (Appendix E, Figure E3). o Race/ethnicity: Non-white primary care dentists were significantly more likely than white dentists to treat Medicaid patients (53% vs. 42%) and accept new Medicaid patients (37% vs. 17%) (Figure 20). o Practice Setting: Private practice dentists who were individual proprietors or in group practice had similar Medicaid participation, which was lower than dentists in other types of practice (e.g., government) (Figure 21). 22
23 Findings: Dentist Participation in Medicaid Legend: Treats Medicaid Patients Accepts New Medicaid Patients 100% 80% 60% 40% 20% 0% Figure 17. Medicaid Participation by Region Northeastern Northern Southeastern Southern Western 100% Figure 18. Medicaid Participation by Urban/Rural Status 100% Figure 19. Medicaid Participation by Dental School Attended 80% 80% 60% 60% 40% 40% 20% 20% 0% Metro-other Metrocentral Ruraladjacent Ruralnonadjacent 0% In-state MN/IL/IA Other State 100% Figure 20. Medicaid Participation by Race/Ethnicity 100% Figure 21. Medicaid Participation by Ownership Status 80% 80% 60% 60% 40% 40% 20% 20% 0% White Non-white 0% Individual Proprietor Group Practice Other 23
24 Findings: Dentist Participation in Medicaid Medicaid participation varied by county. One way to compare counties is to examine the number of Medicaid enrollees per participating dentist: o The range of Medicaid enrollees per primary care dentist currently treating Medicaid patients was 145:1 (145 Medicaid enrollees to 1 participating dentist) to 2,035:1 (Figure 22). o Only one county did not have a primary care dentist who reported treating Medicaid patients. o The range of Medicaid enrollees per primary care dentist accepting new Medicaid patients was 339:1 to 5,888:1 (Figure 23). o Fifteen counties were without a primary care dentist who accepted new Medicaid patients; these counties had a total of 32,744 Medicaid enrollees as of July

25 Findings: Dentist Participation in Medicaid 25
26 6. Findings: Volunteer and Charity Care When asked about whether they provided any pro bono (free) care, volunteered at a clinic serving uninsured or underinsured patients, or participated in the Wisconsin Dental Association Donated Dental Services Program 12 (WDA/DDSP), participation among all dentists varied: (Appendix E, Table E9). : o 58% (1,654) provided some form of volunteer or charity care o 48% (1,269) provided pro bono (free) care, o 16% (436) volunteered at a clinic serving uninsured or underinsured patients, o 21% (566) participated in the WDA/DDSP. Overall, there were no consistent differences in volunteer and charity care by region and urban/rural status (Appendix E, Table E9). Regarding volunteering at a clinic, there were differences by specialty and years in practice: o Pediatric dentists were significantly more likely to report having volunteered at a clinic serving uninsured and underinsured patients (29%) than both general practitioners (15%) and other specialists (18%) (Figure 24). o Higher proportions of dentists with less than 20 years experience volunteered at a clinic serving uninsured or underinsured patients than did dentists with more than 20 years of experience. (Figure 25). Volunteering at a clinic was likely affected by the number and location of safety net dental clinics: o Only 20 Wisconsin counties had a safety net dental clinic 13 (Figure 26). o Sixty-one percent (1,424) of general and pediatric dentists resided in a county with a safety net dental clinic. o About the same proportion (15%) of dentists reported volunteering at a clinic serving uninsured or underinsured patients, regardless of whether their primary practice was in a county with or without a safety net dental clinic. 12 "The Donated Dental Services(DDS) is a program directed at those people who are unable to afford needed dental care because of a limited income which is clearly linked to a permanent disability, chronic illness or advanced age (65 or over)." Since 1998, about 375 people have received treatment through this program. See 13 Children's Health Alliance of Wisconsin. Dental Care Access Programs for Uninsured and Underinsured in Wisconsin. Updated April

27 Findings: Volunteer and Charity Care 100% Figure 24. Volunteer and Charity Care by Specialty 100% Figure 25. Volunteer and Charity Care by Years of Experience 80% 80% 60% 40% 20% 0% General Practice Pediatric Dentisty Other Specialty 60% 40% 20% 0% <10 years years years >30 years Legend Any Volunteer Charity Care Any Free Care Clinic Volunteer WDA/DDSP Participant 27
28 7. Findings: Retirement Plans Almost 1 in 7 (433) dentists planned to retire or leave practice in the next 5 years. About 1 in 3 (996) were expected to retire/leave within the next 10 years. The ratios were similar for primary care dentists as well. (Table 6) Among dental specialists, almost half of prosthodontists (49%) and periodontists (47%) were expected to retire/leave within the next 10 years, as were 40% of oral surgeons (Table 7). There was little variation in retirement plans in the next 5 or 10 years based on region. While plans were similar over the next 5 years for urban and rural dentists, the rural-adjacent category was expected to lose slightly more dentists (41%) over the next 10 years than metropolitan areas (34% for both). (Appendix E, Table E10). Other notable findings included (Appendix E, Table E10): o Of dentists with more than 30 years experience, 46% and 74% planned to retire or leave practice in the next 5 and 10 years, respectively. o A higher percentage of graduates from in-state and other state dental schools (each 37%) were planning to retire/leave practice in the next 10 years than graduates from border state dental schools (29%). o About 1 in 7 (14%) and 1 in 3 (35%) dentists who participated in Medicaid planned to retire or leave practice in the next 5 and 10 years, respectively. At the county level, 9 counties were projected to lose more than 25% of their dentists to retirement/leaving practice (Figure 27). In the next 6-10 years, 61 counties were projected to lose more than 25% of their dentists to retirement/leaving practice (Figure 28). An estimated 56 new dentists will enter practice in Wisconsin each year between 2000 and (This number is based on a recent study by the Wisconsin Dental Association, which also noted that Wisconsin's population is expected to increase 4.25% during this same time period. 14 ) But significantly more dentists planned to leave Wisconsin during this same period of time: o Within five years, there will be 153 fewer dentists in Wisconsin (433 dentists retiring/leaving minus 280 new dentists). o Within ten years, there will be 436 fewer dentists in Wisconsin (996 dentists retiring/leaving minus 560 new dentists). 14 Beazoglou, T, Bailit, H & Heffley, D. (2001). Analysis of Workforce, Population Needs, and Policy Options in Wisconsin for the Next 10 Years. Wisconsin Dental Association. 28
29 Findings: Retirement Plans Table 6. Retirement Plans, by Number of Dentists Retirement Plans All Dentists (#) Primary Care Only (#) Other Specialties (#) Within the next 12 months: Retire Move outside WI Reduce patient hours Retire/leave WI in next 2 to 5 years Total retiring or leaving Wisconsin in next 5 years 433 (15%) 357 (15%) 70 (15%) Retire/leave WI in next 6 to 10 years Total retiring or leaving Wisconsin in next 10 years 996 (35%) 808 (34%) 179 (39%) Total dentists in practice 2,842 2, Table 7. Retirement Plans of Specialty Dentists, by Number of Dentists Retirement Plans Orthodontists (#) Prosthodontists (#) Within the next 12 months: Retire Move outside WI Reduce patient hours Retire/leave WI in next 2 to 5 years Periodontists (#) Endodontists (#) Oral Surgeons (#) Total retiring or leaving Wisconsin in next 5 years 24 (16%) 10 (21%) 4 (8%) 6 (10%) 22 (18%) Retire/leave WI in next 6 to 10 years Total retiring or leaving Wisconsin in next 10 years 53 (35%) 23 (49%) 25 (47%) 21 (36%) 49 (40%) Total dentists in practice # counties Figure 27. Dentists Retiring/Leaving Practice in <5 Years by County # counties Figure 28. Dentists Retiring/Leaving Practice in <10 Years by County % 1-25% 26-50% 51-75% % 0 0% 1-25% 26-50% 51-75% % % of all dentists retiring/leaving % of all dentists retiring/leaving 29
30 Analysis: Projected Dentist Capacity Required to Serve Medicaid Enrollees The scenarios in Table 8 present one approach for analyzing the required dentist capacity to treat larger volumes of Medicaid enrollees (see Appendix E, Tables E11 and E12 for these scenarios by region and urban/rural status). The output from this analysis is the number of Medicaid enrollees that would have to be treated by a single dentist under these scenarios. In reality, Medicaid patients are not evenly distributed among dentist, rather, a small number of dentists generally treat a large number of Medicaid enrollees. The assumptions for all scenarios are as follows: 1) the number of Medicaid enrollees was held constant at the July 2001 count (507,595 Medicaid enrollees); and 2) the total number of Wisconsin primary care dentists was held constant for each scenario (a) accepting new Medicaid patients (372 dentists statewide), (b) treating Medicaid patients (946 dentists statewide), and (c) accepting any new patients (2,139 dentists statewide). The scenarios vary by the number of adult and children Medicaid enrollees targeted to receive at least one dental visit per year at the following utilization levels: 1) 23% of Wisconsin Medicaid enrollees, which is the FY 2000 level of enrollees who received at least one dental service (116,747 enrollees) 15 ; 2) 57% of all Medicaid enrollees, based on the Healthy People 2010 objective of lowincome children receiving preventive dental care (289,329); and 3) 83% of Medicaid enrollees, based on the Healthy People 2010 target of children and adults using the oral health care system each year (421,304) 16. One way to examine required capacity is to keep the supply of dentists constant, while increasing utilization. Focusing on the number of dentists who reported treating Medicaid patients: a) To maintain current Medicaid utilization for dental services (23% in FY '00), each dentist treating Medicaid patients would need to treat 123 Medicaid enrollees. At two visits per year per enrollee, this would total 246 Medicaid visits. Nationally, in 1999, the average annual number of visits provided by a general practitioner in private practice was 2,621 (not including dental hygienist visits) and 3,883 (including dental hygienist visits). 17 Thus, these Medicaid enrollees' visits would take up between 9% and 6% of the dentist s total scheduled visits. b) To meet the Healthy People % objective (applying the objective to both children and adults), then each dentist treating Medicaid patients would need to treat 306 Medicaid enrollees (612 annual visits), accounting for between 23% and 16% of all scheduled visits. Another way to examine how dentist participation affects utilization by Medicaid enrollees is to increase the supply of available dentists and keep utilization constant. Using the 57% objective, if all primary care dentists who accepted any new patients were to participate in Medicaid (2, Wisconsin Medicaid Dental Facts FY 2000; see 16 U.S. Department of Health and Human Services (2000). Healthy People nd ed. With Understanding and Improving Health and Objectives for Improving Health. 2 vols. Washington, DC: U.S. Government Printing Office. 17 American Dental Association. The 1999 Survey of Dental Practice. Chicago
31 dentists), each dentist would need to treat 135 Medicaid enrollees (270 annual visits). This accounts for between 10% and 7% of all scheduled visits, a marked decrease from b) above. Table 8. Number of Medicaid Enrollees Per Primary Care Dentist, Statewide, Using Different Scenarios of Utilization and Dentist Participation % of Medicaid enrollees with at least one dental visit: Number of Medicaid Enrollees per Primary Care Dentist: Accepting New Medicaid Patients (n=372) 23% (FY 2000 rate) 1 57% (Healthy People 2010 objective) 2 83% (Healthy People 2010 objective) ,133 Treating Medicaid Patients (n=946) Accepting Any New Patients (n=2,139) % of Wisconsin Medicaid enrollees, which is the FY 2000 level of enrollees who received at least one dental service (equals 116,747 enrollees, based on July 2001 enrollment); 2 57% of all Medicaid enrollees, based on the Healthy People 2010 object ive of low-income children receiving preventive dental care (289,329 enrollees); and 3 83% of Medicaid enrollees, based on the Healthy People 2010 target of children and adults using the oral health care system each year (421,304 enrollees). 31
32 32
33 Discussion This report describes the many attributes of Wisconsin dentists based on self-reported survey data collected in Spring The survey count of active dentists in Wisconsin (2,842) was very close to estimates by the ADA (2,890 in 1998); thus, the survey captured most Wisconsin dentists. The information collected from this survey may be used by a wide audience to better understand the Wisconsin dental workforce. Major findings are described below. The Supply of Dentists in Wisconsin State Supply. Overall, Wisconsin ranks about 15 th highest among all states in total dentist supply, and about 19 th highest when the dentist supply is adjusted to the state s population. 18 In Wisconsin, there were 53 dentists per 100,000 people, or one dentist per almost 1,900 people. The national average was 59 dentists per 100,000 people. Thus, the Wisconsin supply ranks fairly well among states, but is below the national average. Dentist Distribution Across Wisconsin. The supply of dentists varied across regions of the state. The greater Milwaukee area and other metropolitan areas had a substantially higher supply than rural areas (all of these data adjust for population differences). Most (81%) Wisconsin dentists are general dentists, 3% are pediatric dentists, and the remainder are other dental specialists (16%). In addition to an overall low dentist supply, rural areas also had a much lower supply of specialists. Pediatric Dentists. Of specific concern for children's access to oral health care was the low number of pediatric dentists 19 and their concentration in metropolitan areas, particularly the Southeastern region. While there is no ideal standard for the number of pediatric dentists to 100,000 children, in 1995 there were 5.4 pediatric dentists per 100,000 children nationally. For comparison, there were 5.1 in Wisconsin; the ratio ranged from 2.8 in Idaho, North Dakota and South Dakota to 10.3 in Connecticut. 20 Characteristics of Wisconsin Dentists Dental School Attended. A majority (70%) of Wisconsin dentists attended the only dental school in Wisconsin (Marquette University School of Dentistry in Milwaukee). Substantial numbers graduated from schools in neighboring states: Minnesota, 11%; Illinois, 7%; and Iowa, 5%. There were differences in the demographics and practice characteristics of in-state dental graduates compared to graduates from neighboring and other states. The out-of-state dentists were more likely to be more recent graduates, practice as specialists, and participate in Medicaid. The practice locations of graduates from neighboring states were more often in rural areas and showed some proximity to the state where they graduated (e.g., Minnesota graduates practicing in the Western region of Wisconsin). The graduates from other states were more diverse by race 18 Bureau of Health Professions, National Center for Health Workforce Information & Analysis, Health Resources & Services Administration, U.S. Department of Health and Human Services. HRSA State Health Workforce Profiles: Wisconsin. Rockville, MD: December Pediatric dentists provide both specialty dental care to children with complex medical, dental and psychosocial needs, and basic dental care to all children. There are limited data on the portion of children s dental care that is provided by pediatric dentists, however due to their numbers, general dentists are considered to be the major provider of dental care for children. Because of the reluctance of some general dentists to treat the very young or preschool aged child, pediatric dentists may provide care to a larger number of the very young children. 20 Waldman HB. Are we maintaining the ratio of private practicing pediatric dentists to the number of children? Journal of Dentistry for Children July-August 1998:
34 and ethnicity (overall 95% of all dentists were white). Thus, Wisconsin depends upon these graduates to fill key dental care needs throughout the state. What is not known from this study is whether there are differences among the dental schools (e.g., curriculum, scholarships) that attract different types of students or what influences dentists from out-of-state dental schools to choose to practice in Wisconsin. Race/Ethnicity. Non-white dentists tended to have been in practice fewer years, attended out-of-state dental schools, and had higher Medicaid participation than white dentists. Research supports the importance of non-white health professionals in providing access to poor and nonwhite patients. One study found that non-white dentists were 2.7 times more likely to participate in Medicaid than white dentists. 21 This finding is consistent with studies of physician s behavior. 22 Rural Issues. As stated above, overall dentist supply, as well as the supply of dental specialists, was low in rural areas. Access to dental care is likely difficult for rural residents regardless of insurance status. Interestingly, despite being fewer in number and accepting fewer new patients, more rural dentists reported treating Medicaid patients than metro-central and metro-other dentists. This finding coincides with those from an Illinois study, where 51% and 45% of dentists in the rural-adjacent and rural-nonadjacent categories participated in Medicaid compared to 22% and 32% of dentists in the metro-central and metro-other categories. 23 Dentist Medicaid Participation Findings from this study showed important differences in Medicaid participation based on dentist characteristics and practice location, both of which impact current and future access to dental care for Medicaid enrollees. While 42% of dentists reported treating Medicaid patients, only 20% dentists reported that they would accept new Medicaid patients. Participation was highest in the rural areas (similar to what was found in the Illinois study, described above). Participation was also high in the Southern and Western regions, where dentist supply was lowest. In the Southeastern region, where 86% of dentists were in-state graduates, Medicaid participation was lowest. In fact, by region, participation was lowest for in-state graduates practicing in the Southeastern region (29%) compared to in-state graduates practicing in other regions. Also, pediatric dentists were most likely to participate in Medicaid, although there were few of them. Non-white dentists also had higher Medicaid participation. Our current aggregate estimate is that the 946 primary care dentists who reported treating Medicaid patients would each have to treat 123 Medicaid patients to maintain the 23% utilization reported in FY 2000 by the State. Projections of the number of Medicaid enrollees each dentist would need to treat, based on varying utilization levels, indicate that the current dentist workforce is insufficient to care for the Medicaid population. For example, to meet the Healthy 21 Mayer ML, Stearns SC, Norton EC, Rozier RG. The effects of Medicaid expansions and reimbursement increases on dentists participation. Inquiry. Spring 2000;37: Brotherton SE, Stoddard JJ, Tang SS. Minority and Non-minority pediatricians care of minority and poor children. Arch Pediatr Adolesc Med. 2000;154: Also, Xu G, Fields SK, Laine C, Veloski JJ, Barzansky B & Martini CJM. The relationship between the race/ethnicity of generalist physicians and their care for under-served populations. Am J Public Health. 1997;87: Byck GR, Walton SM, Cooksey, JA. Access to dental care services for Medicaid children: Variations by urban/rural categories in Illinois. Journal of Rural Health. Forthcoming, Fall
35 People 2010 objective of 57% of low-income children receiving preventive dental care 24, each currently participating primary care dentist would need to treat 306 Medicaid enrollees annually (6/week). At 2 visits per enrollee per year, this constitutes between 16% and 23% of all annual patient visits. Historically, dentists have not participated at these levels. Given the trend in increased Medicaid enrollment, the current level of dentist participation in Medicaid is insufficient to maintain current utilization levels (23% in FY 2000) much less increase utilization rates for Medicaid enrollees. Dentist Retirement Plans Wisconsin dentists reported on their plans for retiring or leaving practice and indicated substantial attrition in the next 5 to 10 years. Almost 1 in 7 (433) dentists planned to retire or leave practice in the next 5 years, and about 1 in 3 (996) reported the same in the next 10 years. Based on estimates of new dentists from the WDA study, this represents a net loss of 153 dentists in 5 years and 436 dentists in 10 years. In addition, Medicaid participation will be affected by dentists' retirement plans. Study Limitations In contrast to many studies of health care professionals, this study had a very high response rate. However, there were some limitations to this study which should be noted. First, the data were all self-reported, however, when compared to other published data, there were similarities. The number of currently practicing dentists from the survey (2,842) closely matched numbers published by the ADA (2,890). Also, the number of dentists who reported treating Medicaid patients (1,143) was similar to the number reported by the Wisconsin Department of Health and Family Services for FY 2000 (1,421), although the reported volume of Medicaid services reported by dentists responding to the survey did not match actual Medicaid claims data maintained by the State of Wisconsin. Among the issues that could not be studied here, but could be explored in future studies: estimates of productivity, such as volume of services provided (to either all patients or Medicaid patients, specifically) and the effect on dentist supply estimates. the hometown or home state of dentists, in order to further examine differences in practice location (region, urban/rural) based on dental school attended (for example, did dentists who attended dental school in Minnesota settle in Wisconsin's Western region because they were originally from that area, or was there something that attracted them there?). information on where dentists did their dental residencies and whether that influenced their decision to stay in the area or relocate. whether there were any differences in practice characteristics by dentists' gender. 24 U.S. Department of Health and Human Services (2000b). Healthy People nd ed. With Understanding and Improving Health and Objectives for Improving Health. 2 vols. Washington, DC: U.S. Government Printing Office. 35
36 36
37 Appendix A: Dental Stakeholders Committee Sandy Breitborde, Director Bureau of Health Information Department of Health and Family Services PO Box 309 Madison, WI Michael W Donohoo, DDS Wisconsin Dental Association 7623 West Burleigh St Milwaukee, WI Anne Dopp, Chief Clinical Officer Department of Health and Family Services 1 West Wilson Street, Room 218 Madison, WI Tammy Filipiak, RDH Wisconsin Dental Hygienists Association Northcentral Technical College 473 Locker Road Mosinee, WI Dr. Richard Gartner Department of Health and Family Services PO Box 7850 Madison, WI Steven Geiermann, DDS Regional Dental Consultant HRSA Midwest Field Office 233 North Michigan Avenue, Suite 200 Chicago, IL Robert Jecklin, Executive Director Scenic Bluffs Community Health Center 238 Front Street, PO Box 39 Cashton, WI Sarah V. Lewis, JD, Executive Director Mari Freiberg, Associate Director Wisconsin Primary Health Care Association 5721 Odana Road, Suite 105 Madison, WI William K Lobb, DDS Dean, Marquette University School of Dentistry PO Box 1881 Milwaukee, WI Doug Long, Dental Policy Analyst Division of Health Care Financing, DHFS 1 West Wilson Street, PO Box 309 Madison, WI Darryl D Pendleton, DDS Executive Director Milwaukee AHEC 2220 East North Avenue Milwaukee, WI Midge Pfeffer, RDH Program Coordinator, Eastern Wisconsin AHEC 2220 East North Avenue Milwaukee, WI Dr. Martin Venneman Executive Director, La Crosse Medical Health Science Consortium 1300 Badger Street La Crosse, WI Warren LeMay, DDS Chief Dental Officer Division of Public Health Department of Health and Family Services PO Box 2659 Madison, WI
38 38
39 Appendix B: Survey Instrument and BHI Methodology WISCONSIN BUREAU OF HEALTH INFORMATION PUBLIC USE DATA FILE DOCUMENTATION 2001 DENTIST WORKFORCE SURVEY I. General Description (Included herein) II. Methodology (Included herein) III. Data Specifications Shaded items are not included herein. A. Explanation of Data Elements and Limitations B. Selected Frequencies C. Wisconsin County Codes D. Dataset Layout E. Survey Instrument (Included herein) I. General Description The data contained in the public use file for the 2001 Dentist Workforce Survey were reported by dentists to the Bureau of Health Information (BHI) under requirements created by Chapter 153, Wis. Stats., and HFS , Wis. Admin. Code. This file contains data on approximately 94% of the 4563 dentists who were licensed in Wisconsin as of November 7, A previous survey of Wisconsin dentists was conducted in Public use files for that survey are available for purchase from BHI. Neither the original source nor BHI bears any responsibility for the analysis or interpretations that users may make. Data purchasers are strongly urged to inform BHI of any errors and discrepancies they discover when using these data. Please contact BHI at ASKBHI@DHFS.STATE.WI.US To assist others in acquiring our data and to assure that data analysis can be replicated, we request that the source of these data, regardless of medium (including data summaries, data tables, and/or subsets of the data), be cited as stated below2. 1. A list of licensed dentists was obtained on November 7,2000 from the Wisconsin Department of Regulation and Licensing. 2. Source: 2001 Dentist Workforce Survey, [Electronic data file]. (September 2001). Bureau of Health Information, Division of Health Care Financing, Wisconsin Department of Health and Family Services. 39
40 II. Methodology WISCONSIN BUREAU OF HEALTH INFORMATION PUBLIC USE DATA FILE DOCUMENTATION Preparation for the 2001 Dentist Workforce Survey began in November The survey instrument relied on previous surveys and was revised after receiving comments from various data users, including the Wisconsin Dental Association 3, the Wisconsin Division of Health Care Financing 4 the Division of Public Health 5, the Center for Health Systems Research and Analysis 6, Department of Regulation and Licensing 7 Southwest Wisconsin AHEC 8, EDS 9 Wisconsin Primary Care Association 10, MATC Health Occupations Program 11 and Marquette Dental School 12. Dentist mailing addresses were obtained from the Department of Regulation and Licensing. The first surveys were mailed on March 23, A follow-up mailing was sent on May The final response rate was 94%, with 4301 of 4563 licensed dentists returning the survey. survey forms for quality control purposes. Records were cleaned prior to data set completion. Names of educational institutions activity descriptions and other text information were standardized where possible. 3. Maryann T Dillon, CAE, Director; Dr. Kathy Roth, Past President; Dr Thomas Hughes 4. Mary Laughlin 5. Warren LeMay DDS, MPH; Denise Carty MS, RN; Char White; Anne Dopp, Chief Clinical Officer Primary Care 6. Bridget Booske, Ph.D. 7. Patrick Braatz 8. Joel Davidson, Executive Director 9. Stan Henkel Dental Consultant 10. Sarah Lewis 11. A. Sido 12. Bill Lobb 40
41 41
42 42

43 Appendix C: Counties by Wisconsin Region Northeastern Northern Southeastern Southern Western Brown Calumet Door Fond du Lac Green Lake Kewaunee Manitowoc Marinette Marquette Menominee Oconto Outagamie Shawano Sheboygan Waupaca Waushara Winnebago Ashland Bayfield Florence Forest Iron Langlade Lincoln Marathon Oneida Portage Price Sawyer Taylor Vilas Wood Jefferson Kenosha Milwaukee Ozaukee Racine Walworth Washington Waukesha Adams Columbia Crawford Dane Dodge Grant Green Iowa Juneau Lafayette Richland Rock Sauk Barron Buffalo Burnett Chippewa Clark Douglas Dunn Eau Claire Jackson La Crosse Monroe Pepin Pierce Polk Rusk St Croix Trempealeau Vernon Washburn 43

44 Appendix D: Counties by Urban/Rural Status- Metro-central Metro-other Rural adjacent Rural nonadjacent Milwaukee Ozaukee Waukesha Brown Calumet Chippewa Dane Douglas Eau Claire Kenosha La Crosse Marathon Outagamie Pierce Racine Rock Sheboygan St Croix Washington Winnebago Clark Columbia Dodge Dunn Fond du Lac Grant Green Green Lake Iowa Jackson Jefferson Kewaunee Langlade Lincoln Manitowoc Monroe Oconto Polk Portage Sauk Shawano Taylor Vernon Walworth Waupaca Wood Adams Ashland Barron Bayfield Buffalo Burnett Crawford Door Florence Forest Iron Juneau Lafayette Marinette Marquette Menominee Oneida Pepin Price Richland Rusk Sawyer Trempealeau Vilas Washburn Waushara 44
North Dakota Dentists Survey Results Health Profession Tracking Program
 http://medicine.nodak.edu/crh CR H Center for Rural Health University of North Dakota School of Medicine & Health Sciences North Dakota Dentists Survey Results Health Profession Tracking Program Mary Amundson,
Access to Oral Health Care for Medicaid Children in Illinois: A Focus on Rural Illinois. February 2001
 Access to Oral Health Care for Medicaid Children in Illinois: A Focus on Rural Illinois February 2001 Prepared for the Illinois Rural Health Association Gayle R. Byck, PhD, Judith A. Cooksey, MD, MPH,
The Distribution and Composition of Arizona s Dental Workforce and Practice Patterns: Implications for Access to Care
 The Distribution and Composition of Arizona s Dental Workforce and Practice Patterns: Implications for Access to Care Center for California Health Workforce Studies July 2004 Elizabeth Mertz, MA Kevin
The Oral Health Workforce in Maine
 The Oral Health Workforce in Maine December 2012 Prepared for: Maine Oral Health Funders Augusta, Maine Project Completed by: The Center for Health Workforce Studies School of Public Health, University
HIV/AIDS IN WISCONSIN
 HIV/AIDS IN WISCONSIN While the federal government s investment in treatment and research is helping people with HIV/AIDS live longer and more productive lives, HIV continues to spread at a staggering
A PROFILE OF DENTAL HYGIENISTS IN NEW YORK
 A PROFILE OF DENTAL HYGIENISTS IN NEW YORK Center for Health Workforce Studies School of Public Health, University at Albany http://chws.albany.edu HIGHLIGHTS Dental hygienists are unevenly distributed
Millions of Americans face significant barriers
 Dental School Applicants by State Compared to Population and Dentist Workforce Distribution Lauren E. Mentasti, B.S.; Edward A. Thibodeau, D.M.D., Ph.D. Abstract: Millions of Americans face significant
Changes in Iowa Dentist Workforce Composition, : First in a Series of Issue Briefs
 Health Policy 5-1-2015 Changes in Iowa Dentist Workforce Composition, 1997-2013: First in a Series of Issue Briefs Julie Christine Reynolds University of Iowa Susan Christine McKernan University of Iowa
Seniors Plans to Teach at Some Point in Career, 2009
 Seniors Plans to Teach at Some Point in Career, 2009 50% 45% 40% 35% 30% 25% 20% 15% 10% 5% 0% 44% Yes No Unsure 18% Plans to Teach 38% Source:, Senior Survey, 2009 Seniors Perceptions of Degree to Which
HIV/AIDS IN MINNESOTA
 HIV/AIDS IN MINNESOTA While the federal government s investment in treatment and research is helping people with HIV/AIDS live longer and more productive lives, HIV continues to spread at a staggering
Minnesota s Dental Hygienist Workforce,
 Minnesota s Dental Hygienist Workforce, 2014-2015 HIGHLIGHTS FROM THE 2014-2015 DENTAL HYGIENIST WORKFORCE SURVEY i Overall According to the Minnesota Board of Dentistry, there were 5,625 actively licensed
Minnesota s Dental Assistant Workforce,
 Minnesota s Dental Assistant Workforce, 2014-2015 HIGHLIGHTS FROM THE 2014-2015 DENTAL ASSISTANT WORKFORCE SURVEY i Overall According to the Minnesota Board of Dentistry, as of December 2015, there were
Oral Health in Children in Iowa
 December 2012 Oral Health in Children in Iowa An Overview From the 2010 Iowa Child and Family Household Health Survey Peter C. Damiano Director Jean C. Willard Senior Research Assistant Ki H. Park Graduate
Pharmacy & Dental Workforce in Iowa
 Pharmacy & Dental Workforce in Iowa Susan McKernan, DMD, MS, PhD 13 October, 2014 susan-mckernan@uiowa.edu Data Sources Iowa Health Professions Inventory University of Iowa Carver College of Medicine Iowa
La Follette School of Public Affairs
 Robert M. La Follette School of Public Affairs at the University of Wisconsin-Madison Working Paper Series La Follette School Working Paper No. 2009-027 http://www.lafollette.wisc.edu/publications/workingpapers
Minnesota s Dental Therapist Workforce, 2016 HIGHLIGHTS FROM THE 2016 DENTAL THERAPIST SURVEY
 Minnesota s Dental Therapist Workforce, 2016 HIGHLIGHTS FROM THE 2016 DENTAL THERAPIST SURVEY Table of Contents Minnesota s Dental Therapist Workforce, 2016... 1 Overall... 3 Demographics... 3 Education...
Table of Contents. 2 P age. Susan G. Komen
 WISCONSIN Table of Contents Table of Contents... 2 Introduction... 3 About... 3 Susan G. Komen Affiliate Network... 3 Purpose of the State Community Profile Report... 4 Quantitative Data: Measuring Breast
Use of Dental Services by Children Enrolled in Wisconsin Medicaid Program
 Use of Dental Services by Children Enrolled in Wisconsin Medicaid Program P. Bhagavatula 1, Q. Xiang 2, A. Szabo 2, C. Okunseri 1 1 Marquette University School of Dentistry, 2 Medical College of Wisconsin
The State of Oral Health & Access to Care in North Dakota
 The State of Oral Health & Access to Care in North Dakota North Dakota Dental Hygienists Association September 16, 2016 Shawnda Schroeder, PhD Assistant Professor, Research Center for Rural Health Established
Oral Health Workforce: Trends & Pipeline Incentives
 Oral Health Workforce: Trends & Pipeline Incentives Presentation to: Healthy Teeth. Healthy Baby Nitika Moibi and Deb Jahnke Office of Rural Health & Primary Care March 16, 2018 Oral health workforce Source:
The Aging of the Population: Impacts on the Health Workforce
 The Aging of the Population: Impacts on the Health Workforce Presentation to the Advisory Committee on Interdisciplinary Community-Based Linkages Rockville, Maryland May 3, 2004 Jean Moore Director School
North Dakota Oral Health Status
 North Dakota Oral Health Status Dental Services Network Team Meeting Community HealthCare Association of the Dakotas July 14, 2016 Shawnda Schroeder, PhD Assistant Professor, Research Center for Rural
Biography for Brian J Quinlan DDS
 Biography for Brian J Quinlan DDS Northwestern University Dental School, Chicago, IL DDS 1986 Nothing Cum Laude Private practice, 3 locations: Chicago, Strum, WI & Twin Cities 1986-1991 Park Dental 1991-1996
Oral Health in Michigan
 2015 Oral Health in Michigan School of Public Health University at Albany, State University of New York Oral Health in Michigan April 2015 Project completed by: The Center for Health Workforce Studies
What Do We Know about the Current and Future Psychologist Workforce?
 What Do We Know about the Current and Future Psychologist Workforce? Karen Stamm, PhD Director, Center for Workforce Studies Virginia Behavioral Health Summit September 27, 2018 The opinions expressed
MINNESOTA S ORAL HEALTH WORKFORCE October 2015
 MINNESOTA S ORAL HEALTH WORKFORCE 2012-2014 October 2015 2 Index Background Info 4-12 About this data Reference Maps 4-5 6-9 Additional Professional Information 10-12 All Oral Health Professions 12-30
Oral Health in Children in Iowa: An Overview From the 2010 Iowa Child and Family Household Health Survey
 Health Policy 12-1-2012 Oral Health in Children in Iowa: An Overview From the 2010 Iowa Child and Family Household Health Survey Peter C. Damiano University of Iowa Jean C. Willard University of Iowa Ki
Our Vision Healthy Kansans living in safe and sustainable environments.
 www.kdheks.gov www.kdheks.gov/ohi Our Vision Healthy Kansans living in safe and sustainable environments. Daniel Lassley Bureau of Oral Health Kansas Department of Health and Environment 785-296-1314 dlassley@kdheks.gov
ARE STATES DELIVERING?
 The Promise of Quality, Affordable Health Care for Women ARE STATES DELIVERING? A 50-State Report Card on Women s Health OCTOBER 2014 TAKING ACTION, MAKING CHANGE The Alliance for a Just Society s mission
Missouri Statewide Integrated HIV Prevention and Care Plan, including the Statewide Coordinated Statement of Need, CY
 Missouri Statewide Integrated HIV Prevention and Care Plan, including the Statewide Coordinated Statement of Need, CY 2017-2021 September 20, 2016 Developed through the collaborative efforts of the following
HEALTH DISPARITIES AMONG ADULTS IN OHIO
 OHIO MEDICAID ASSESSMENT SURVEY 2012 Taking the pulse of health in Ohio HEALTH DISPARITIES AMONG ADULTS IN OHIO Amy K. Ferketich, PhD 1 Ling Wang, MPH 1 Timothy R. Sahr, MPH, MA 2 1The Ohio State University
The increasing involvement of corporate entities
 Practice Location Characteristics of Non-Traditional Dental Practices Eric S. Solomon, DDS, MA; Daniel L. Jones, DDS, PhD Abstract: Current and future dental school graduates are increasingly likely to
HIV/AIDS IN ILLINOIS
 HIV/AIDS IN ILLINOIS While the federal government s investment in treatment and research is helping people with HIV/AIDS live longer and more productive lives, HIV continues to spread at a staggering national
Assessing the Contribution of the Dental Care System to Oral Health Care Disparities
 UCLA CENTER FOR HEALTH POLICY RESEARCH Assessing the Contribution of the Dental Care System to Oral Health Care Disparities Final Report to The National Institute for Dental and Craniofacial Research Project
Perinatal Health in the Rural United States, 2005
 Perinatal Health in the Rural United States, 2005 Policy Brief Series #138: LOW BIRTH WEIGHT RATES IN THE RURAL UNITED STATES, 2005 #139: LOW BIRTH WEIGHT RATES AMONG RACIAL AND ETHNIC GROUPS IN THE RURAL
Table of Contents. 2 P age. Susan G. Komen
 RHODE ISLAND Table of Contents Table of Contents... 2 Introduction... 3 About... 3 Susan G. Komen Affiliate Network... 3 Purpose of the State Community Profile Report... 4 Quantitative Data: Measuring
Changes in Dentist Retirement, Relocation, and Net Inflow of Dentist Supply in Iowa, : Fifth Brief in a Series
 Issue Brief June 2016 Changes in Dentist Retirement, Relocation, and Net Inflow of Dentist Supply in Iowa, 1997-2014: Fifth Brief in a Series Julie C. Reynolds, DDS, MS Visiting Assistant Professor Susan
Identifying Dental Deserts in the Los Angeles County Safety Net using GIS Maps. Maritza Cabezas, DDS, MPH Dental Director Oral Health Program
 Identifying Dental Deserts in the Los Angeles County Safety Net using GIS Maps Maritza Cabezas, DDS, MPH Dental Director Oral Health Program Background: Los Angeles County is the most populous and most
Access to Dental Services in. Reimbursement Rates and Administrative Streamlining
 Access to Dental Services in Medicaid: The Effect of Reimbursement Rates and Administrative Streamlining Shelly Gehshan, M.P.P., and Andrew Snyder, M.P.A. National Academy for State Health Policy March
Dental Public Health Activity Descriptive Report
 Dental Public Health Activity Descriptive Report Practice Number: 04006 Submitted By: Office of Oral Health, Arizona Department of Health Services Submission Date: May 2002 Last Reviewed: September 2017
Data Report 2016 Indiana Physician Licensure Survey
 Data Report 2016 Indiana Physician Licensure Survey May 2016 0 010 0 010 0 0110101010 0110 0 010 011010 010 0 010 0 0110110 0110 0110 0 010 010 0 010 0 01101010 0110 0 010 010 0 010 0 0 PH YS I C IAN 0
Research Brief. State Variation in Primary Care Physician Supply: Implications for Health Reform Medicaid Expansions
 Research Brief Findings From HSC NO. 19, MARCH 2011 State Variation in Primary Care Physician Supply: Implications for Health Reform Medicaid Expansions BY PETER J. CUNNINGHAM Under the Patient Protection
STATE AND COMMUNITY MODELS FOR IMPROVING ACCESS TO DENTAL CARE FOR THE UNDERSERVED
 American Dental Association STATE AND COMMUNITY MODELS FOR IMPROVING ACCESS TO DENTAL CARE FOR THE UNDERSERVED October 2004 Executive Summary American Dental Association. State and Community Models for
North Carolina Dental Workforce Trends Jacqueline Burgette, DMD Julie Spero, MSPH
 North Carolina Dental Workforce Trends Jacqueline Burgette, DMD Julie Spero, MSPH with Katie Gaul Program on Health Workforce Research and Policy North Carolina Committee for Dental Health January 21,
HIV Integrated Epidemiological Profile December 2011 State of Alabama
 HIV Integrated Epidemiological Profile December 2011 State of Alabama 12/31/2011 Alabama Department of Public Health Division of HIV/AIDS Prevention and Control TABLE OF CONTENTS List of Figures 3 List
Survey of Dentists in Delaware
 Survey of Dentists in Delaware To determine the current capacity and needs of dentists in Delaware to address the oral health needs of Delawareans with Complete the questions on the pages that follow and
Oral Health Need in North Dakota
 Oral Health Need in North Dakota Shawnda Schroeder, PhD Kris6n Schuller, PhD Ken Hall, JD Center for Rural Health WORKING PRESENTATION: DATA PRESENTED on 6.24.2014 Established in 1980, at The University
While the current crisis in state finances is
 Critical Issues in Dental Education State Financing of Dental Education: Impact on Supply of Dentists Howard L. Bailit, D.M.D., Ph.D.; Tryfon J. Beazoglou, Ph.D. Abstract: In 2000, the thirty-six states
The Roles Local Health Departments Play in the Organization and Provision of Perinatal Services
 The Roles Local Health Departments Play in the Organization and Provision of Perinatal Services Public health efforts to reduce maternal complications and poor pregnancy outcomes encompass a wide array
Significant disparities in oral health exist according to. Rural Versus Urban Analysis of Dental Procedures Provided to Virginia Medicaid Recipients
 Scientific Article Rural Versus Urban Analysis of Dental Procedures Provided to Virginia Medicaid Recipients Frank C. Pettinato II, DMD, MS Frank H. Farrington, DDS, MS Arthur Mourino, DDS, MSD Al M. Best,
Dental Public Health Activities & Practices
 Dental Public Health Activities & Practices Practice Number: 37002 Submitted By: North Dakota Department of Health, Family Health Division Submission Date: January 2010 Last Updated: January 2010 SECTION
Massachusetts Head Start Oral Health Initiative and 2004 Head Start Oral Health Survey
 Massachusetts Head Start Oral Health Initiative and 2004 Head Start Oral Health Survey Preface Oral health is an integral component to overall health and well being, Surgeon General David Satcher in the
ACKNOWLEDGMENTS. Funding was provided by Colorado Department of Public Health and Environment s (CDPHE) Oral Health Program.
 Oral Health Program.") TABLE OF CONTENTS ACKNOWLEDGMENTS... 1 INTRODUCTION... 2 2009 COLORADO DENTIST WORKFORCE SURVEY... 2 Methods... 2 Response rate... 2 Sampling methods... 3 Weighting up to the population... 3 RESEARCH DATA
TABLE OF CONTENTS ACKNOWLEDGMENTS... 1 INTRODUCTION... 2 2009 COLORADO DENTIST WORKFORCE SURVEY... 2 Methods... 2 Response rate... 2 Sampling methods... 3 Weighting up to the population... 3 RESEARCH DATA
Lack of access to dental Medicaid services (Title
 ABSTRACT Dentists participation and children s use of services in the Indiana dental Medicaid program and SCHIP Assessing the impact of increased fees and administrative changes RYAN J. HUGHES, D.D.S.,
Access to Oral Health Care in Iowa
 Health Policy 2-1-2004 Access to Oral Health Care in Iowa Public Policy Center, The University of Iowa Copyright 2004 Public Policy Center, the University of Iowa Hosted by Iowa Research Online. For more
Florida Department of Health: Oral Health Workforce
 Florida Department of Health: Oral Health Workforce Florida Board of Governors Meeting June 23, 2011 Tampa, Florida Amy Cober RD LD MPH Public Health Dental Program Florida Department of Health County
Center for Health Workforce Studies School of Public Health University at Albany, State University of New York
 2016 Utilization of Oral Health Services by Medicaid-Insured Adults in New York, 2012-2013 Center for Health Workforce Studies School of Public Health University at Albany, State University of New York
HRSA Oral Health Programs 2010 Dental Management Coalition June 27, 2010 Annapolis, MD
 HRSA Oral Health Programs 2010 Dental Management Coalition June 27, 2010 Annapolis, MD Jay R. Anderson, DMD, MHSA HRSA Chief Dental Officer US Department of Health and Human Services Health Resources and
The Rural Health Workforce. Policy Brief Series. Data and Issues for Policymakers in: Washington Wyoming Alaska Montana Idaho
 The Rural Health Workforce Data and Issues for Policymakers in: Washington Wyoming Alaska Montana Idaho Policy Brief Series ISSUE #1: THE RURAL HEALTH WORKFORCE: CHALLENGES AND OPPORTUNITIES ISSUE #2:
Overview of State Initiatives to Bolster the Dental Workforce
 Overview of State Initiatives to Bolster the Dental Workforce Tara Lubin Policy Associate Forum for State Health Policy Leadership National Conference of State Legislatures 202-624-3558 tara.lubin@ncsl.org
STATES BEST PRACTICES IN IMPROVING STATE ORAL HEALTH PROGRAM WORKFORCE CAPACITY
 STATES BEST PRACTICES IN IMPROVING STATE ORAL HEALTH PROGRAM WORKFORCE CAPACITY UCSF DPH 175 Dental Public Health Lecture Series January 26, 2016 Dr. Harry Goodman Immediate Past-President, Association
Dentist Income Levels Slow to Recover
 Dentist Income Levels Slow to Recover Authors: Marko Vujicic, Ph.D.; Thomas P. Wall, M.A., M.B.A.; Kamyar Nasseh, Ph.D.; Bradley Munson, B.A. The ADA Health Policy Resources Center (HPRC) is a thought
Shawnda Schroeder, PhD and Nathan Fix, MPH
 DATA BRIEF ruralhealth.und.edu Data Brief Dentists Knowledge, Support, and Participation in Proposed Dental Care Access Solutions: Results of the North Dakota Survey of Practicing Dentists This data brief
Impact of Dental Therapists on Federally Qualified Health Center Finances
 Impact of Dental Therapists on Federally Qualified Health Center Finances HOWARD BAILIT, DMD, PHD TRYFON BEAZOGLOU, PHD SHELLY GEHSHAN, M PP Presentation to the National Network for Oral Health Access
ADEA Survey of Dental School Seniors, 2015 Graduating Class Tables Report
 ADEA Survey of Dental School Seniors, 2015 Graduating Class Tables Report Published March 2016 Suggested Citation American Dental Education Association. (March 2016). ADEA Survey of Dental School Seniors,
Dentists & Allied Dental Health Professionals
 Health Professions Resource Center Under the Governance of the Statewide Health Coordinating Council Dentists & Allied Dental Health Professionals Demographics and Trends 2014 Background The link between
HIV/AIDS IN INDIANA. Total Reported AIDS Cases i 7,415 6,927 6,515 6,149 5,762 3,906 3,521 2,944 2,461 2,706 7,000 6,000 5,000 4,000 3,000 2,000 1,000
 HIV/AIDS IN INDIANA While the federal government s investment in treatment and research is helping people with HIV/AIDS live longer and more productive lives, HIV continues to spread at a staggering national
The Health centers have become the largest primary care system in the United States. They provide timely treatment & preventive care There are more
 The Health centers have become the largest primary care system in the United States. They provide timely treatment & preventive care There are more than 700 new centers that have opened up as a result
HEALTH OF WISCONSIN. Children and young adults (ages 1-24) B D REPORT CARD 2016
 B D REPORT CARD 2016") HEALTH OF WISCONSIN Summary Grades Life stage Health grade Health disparity grade Infants (less than 1 year of age) C D Children and young adults (ages 1-24) B D Working-age adults (ages 25-64) B C Older
HEALTH OF WISCONSIN Summary Grades Life stage Health grade Health disparity grade Infants (less than 1 year of age) C D Children and young adults (ages 1-24) B D Working-age adults (ages 25-64) B C Older
Pediatric Oral Health in North Dakota
 Center for Rural Health Pediatric Oral Health in North Dakota North Dakota Department of Oral Health Webinar February 16, 2017 Shawnda Schroeder, Ph.D. Center for Rural Health University of North Dakota
Minnesota s Alcohol and Drug Counselor Workforce,
 OFFICE OF RURAL HEALTH AND PRIMARY CARE Minnesota s Alcohol and Drug Counselor Workforce, 2014-2016 HIGHLIGHTS FROM THE 2014 LADC WORKFORCE SURVEY i Overall According to the Board of Behavioral Health
Improving Oral Health Care Delivery in Medicaid and CHIP. A Toolkit for States. February 2014
 Improving Oral Health Care Delivery in Medicaid and CHIP A Toolkit for States February 2014 This toolkit is a product of the Medicaid/CHIP Health Care Quality Measures Technical Assistance and Analytic
SCOPE OF HIV/AIDS IN MINNESOTA
 SCOPE OF HIV/AIDS IN MINNESOTA National Perspective Compared to the rest of the nation, Minnesota is considered to be a low- to-moderate HIV/AIDS incidence state. In 2013 (the most recent year for which
The Oral Health Status of Nebraska s Children Compared to the General U.S. Population
 Nebraska Nebraska Department Oral of Health Survey & Human of Young Services Children Data Brief June 2017 The Oral Health Status of Nebraska s Children Compared to the General U.S. Population Head Start
RURAL HEALTH CARE. Lanis L. Hicks Professor Department of Health Management and Informatics. October 9, 2002
 RURAL HEALTH CARE Lanis L. Hicks Professor Department of Health Management and Informatics October 9, 2002 URBANIZATION LEVELS DEFINED LARGE CENTRAL METRO Counties in large metropolitan areas (1 million
Access to Dental Care in the US
 Access to Dental Care in the US Time for Change?? Dr. Ana Karina Mascarenhas Immediate Past President, AAPHD Associate Dean of Research, Chief of Primary Care, Nova Southeastern University College of Dental
Ohio Department of Health Oral Health Section 2013 Plan
 Ohio Department of Health Oral Health Section 2013 Plan OUR MISSION: To promote and improve the oral health of all Ohioans. The Oral Health Section (OHS) has four goals that support our mission: Goal 1:
HIV/AIDS IN NEVADA. Total Reported AIDS Cases i 4,972 5,461 4,665 5,000 4,420 4,116 4,000 3,000 2,249 2,502 2,654 2,000 2,032 2,094 1,000
 HIV/AIDS IN NEVADA While the federal government s investment in treatment and research is helping people with HIV/AIDS live longer and more productive lives, HIV continues to spread at a staggering national
Dental Therapists: Increasing Access to Dental Care. Kristen R. Boilini Pivotal Policy Consulting. Dental Care for AZ. Dental Care for AZ
 Dental Therapists: Increasing Access to Dental Care Kristen R. Boilini Pivotal Policy Consulting July 14, 2017 Why Dental Therapy? Vast rural areas and Tribal reservations 2.3 million Arizonans lack access
Table of Contents. 2 P a g e. Susan G. Komen
 NEW HAMPSHIRE Table of Contents Table of Contents... 2 Introduction... 3 About... 3 Susan G. Komen Affiliate Network... 3 Purpose of the State Community Profile Report... 4 Quantitative Data: Measuring
HIV/AIDS IN VERMONT. Total Reported AIDS Cases i. Living with AIDS Cumulative Cases
 HIV/AIDS IN VERMONT While the federal government s investment in treatment and research is helping people with HIV/AIDS live longer and more productive lives, HIV continues to spread at a staggering national
Table of Contents. 2 P age. Susan G. Komen
 WYOMING Table of Contents Table of Contents... 2 Introduction... 3 About... 3 Susan G. Komen Affiliate Network... 3 Purpose of the State Community Profile Report... 4 Quantitative Data: Measuring Breast
STATE ALZHEIMER S DISEASE PLANS: WORKFORCE DEVELOPMENT
 STATE ALZHEIMER S DISEASE PLANS: WORKFORCE DEVELOPMENT Recommendations to increase the number of health care professionals that will be necessary to treat the growing aging and Alzheimer s populations
HIV/AIDS IN PENNSYLVANIA
 HIV/AIDS IN PENNSYLVANIA While the federal government s investment in treatment and research is helping people with HIV/AIDS live longer and more productive lives, HIV continues to spread at a staggering
HIV/AIDS IN THE DISTRICT OF COLUMBIA
 HIV/AIDS IN THE DISTRICT OF COLUMBIA While the federal government s investment in treatment and research is helping people with HIV/AIDS live longer and more productive lives, HIV continues to spread at
How Wheaton Franciscan is meeting the NEEDS of our community. NSWERING HE CALL
 ANSWERING THE CALL MEETING OUR COMMUNITY NEEDS S July 1, 2013 June 30, 2016 How Wheaton Franciscan is meeting the NEEDS of our community. NSWERING HE CALL COMMUNITY HEALTH NEEDS IMPLEMENTATION PLAN: ST.
The Public and Private Dental Safety Net: Implementation of the ACA and their Roles in Access to Care for Medicaid and Expansion Populations
 Health Policy 12-1-2014 The Public and Private Dental Safety Net: Implementation of the ACA and their Roles in Access to Care for Medicaid and Expansion Populations Peter C. Damiano University of Iowa
Index. Note: Page numbers of article titles are in boldface type.
 Index Note: Page numbers of article titles are in boldface type. A Advanced Dental Health Practitioner (ADHP), 563, 564 Age, as barrier to oral health care, 525 Alcohol consumption, and tobacco use, oral
The Prevalence of Smoking in Wisconsin: Variability at the County Level
 RESEARCH BRIEF > September 2011 Karen A. Palmersheim, PhD Center for Urban Initiatives and Research Kristen R. Voskuil, MA Population Health Institute Randal L. Glysch, MS Wisconsin Division of Public
An Analytical Review of the Pew Report Entitled, It Takes A Team and the Accompanying Productivity and Profit Calculator
 An Analytical Review of the Pew Report Entitled, It Takes A Team and the Accompanying Productivity and Profit Calculator The report, It Takes a Team, was released by the Pew Center on the States in December
Synthesis of survey findings and implications for policy
 Synthesis of survey findings and implications for policy Colorado Health Institute 1576 Sherman Street, Suite 300 Denver, CO 80203-1728 www.coloradohealthinstitute.org Acknowledgments This report was prepared
Oral Health in Colorado
 Oral Health in Colorado Progress and Opportunities Sara Schmitt Director of Community Health Policy Prepared for the Delta Dental of Colorado Foundation September 2017 About Us: Inform State and National
Department of Legislative Services
 Department of Legislative Services Maryland General Assembly 2007 Session SB 105 FISCAL AND POLICY NOTE Revised Senate Bill 105 (The President, et al.) (By Request Administration) Education, Health, and
Improving Oral Health:
 Improving Oral Health: New Tools for State Policy Makers Cassie Yarbrough, MPP Lead Public Policy Analyst Health Policy Institute Lansing, MI June 1, 2017 The ADA Health Policy Institute 2017 American
Pennsylvania Autism Needs Assessment
 Pennsylvania Autism Needs Assessment A Survey of Individuals and Families Living with Autism Report #3: Barriers and Limitations to Accessing Services Pennsylvania Department of Public Welfare Bureau of
Christy Jo Fogarty, ADT, RDH, BSDH, MSOHP Advanced Dental Therapist Licensed Dental Hygienist
 Christy Jo Fogarty, ADT, RDH, BSDH, MSOHP Advanced Dental Therapist Licensed Dental Hygienist Neither I nor members of my immediate family have any financial interests to disclose relating to the content
HIV/AIDS IN NORTH CAROLINA
 HIV/AIDS IN NORTH CAROLINA While the federal government s investment in treatment and research is helping people with HIV/AIDS live longer and more productive lives, HIV continues to spread at a staggering
Substance Abuse Services. AIDS Drug Assistance. Oral Health Care. Program (ADAP) Medical Care
 Medical Care") 2017-2018 Council for HIV/AIDS Care and Prevention Core Medical Service Area Paired Comparison Analysis Prioritization Worksheet Medical Case Management Services Substance Abuse Services - Outpatient AIDS
2017-2018 Council for HIV/AIDS Care and Prevention Core Medical Service Area Paired Comparison Analysis Prioritization Worksheet Medical Case Management Services Substance Abuse Services - Outpatient AIDS
HealthVoices. Health and Healthcare in Rural Georgia. The perspective of rural Georgians
 HealthVoices Health and Healthcare in Rural Georgia Issue 3, Publication #100, February 2017 Samantha Bourque Tucker, MPH; Hilton Mozee, BA; Gary Nelson, PhD The perspective of rural Georgians Rural Georgia