Introduction to SPSS. Katie Handwerger Why n How February 19, 2009
|
|
|
- Loreen Williamson
- 6 years ago
- Views:
Transcription
1 Introduction to SPSS Katie Handwerger Why n How February 19, 2009
2 Overview Setting up a data file Frequencies/Descriptives One-sample T-test Paired-samples T-test Independent-samples T-test One-way ANOVA
3 Study Three Diagnostic Groups MDD, Bipolar, and Dysthymia Subjects receive either Drug or Placebo Measure of success: Beck Depression Inventory (BDI) score BDI Assessed at 3 points: Pre Treatment After 4 Weeks After 8 Weeks

4 Setting Up A Data File
5 Setting Up A Data File Important: Always Use Labels

6 Setting Variable Types

7 Setting Value Labels
8 Setting Value Labels Important: THESE VALUES ARE ARBITRARY!!

9 Accounting for Missing Variables Important: Account for Missing Variables with A Value That Would Never Be Found in the Dataset

10 Setting Up A Date File

11 Setting Up A Data File New Variable Labels Will Appear Up Top
12 Setting Up A Data File
13 Viewing Value Labels
14 Viewing Value Labels
15 Now we have our data set up What can we do with it???
16 G 1 g 2 g 3 g 4 g 5 g 6 g 7 g 8 g 9 g 1 0 g 1 2 g 1 3 g 1 4 g 1 5 G 1 g 2 g 3 g 4 g 5 g 6 g 7 g 8 g 9 g 1 0 g 1 2 g 1 3 g 1 4 g 1 5 Descriptives Mean Median Mode Range Skewness Measure of the asymmetry of the probability distribution Good way to check for outliers 16 Negative Skew Positive Skew G 1 g 2 g 3 g 4 g 5 g 6 g 7 g 8 g 9 g 1 0 g 1 2 g 1 3 g 1 4 g 1 5 0
17 Running Descriptives
18 Running Descriptives
19 Running Descriptives
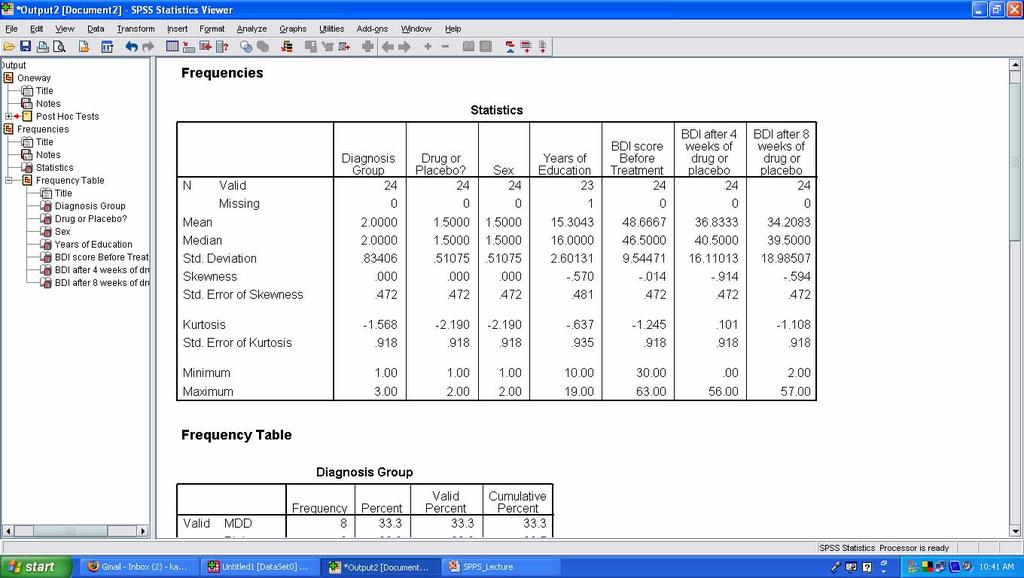
20 Descriptives Output

21 Descriptives Output

22 Descriptives Output Missing Values Accounted For
23 Selecting Only Certain Cases
24 Selecting Only Certain Cases What if I only want to include a certain population in my analyses? i.e. people with SEVERE Depression Defined as: BDI>40 at pre treatment
25 Selecting Only Certain Cases

26 Selecting Only Certain Cases
27 Selecting Only Certain Cases
28 Selecting All Cases IMPORTANT NOTE: All analyses after you select certain cases will only include those cases UNTIL you go back and select ALL

29 Selecting All Cases
30 Computing New Variables I have BDI Scores at Pre, Week 4, and Week 8 What if I want to have a new column that gives me the change from: Pre to Week 4? Pre to Week 8?
31 Computing New Variables

32 Computing New Variables
33 Computing New Variables
34 Computing New Variables Don t Forget To Give Your New Variable a Label!

35 Computing New Variables

36 Computing New Variables
37 Computing New Variables
38 T-Tests Paired-Samples Assesses the difference between the two variables for each case Tests to see if the average difference is sig different from zero. One Sample Comparing Mean Scores to an existing predetermined unit Independent-Samples Comparing Mean of Two Groups (IV) on a DV
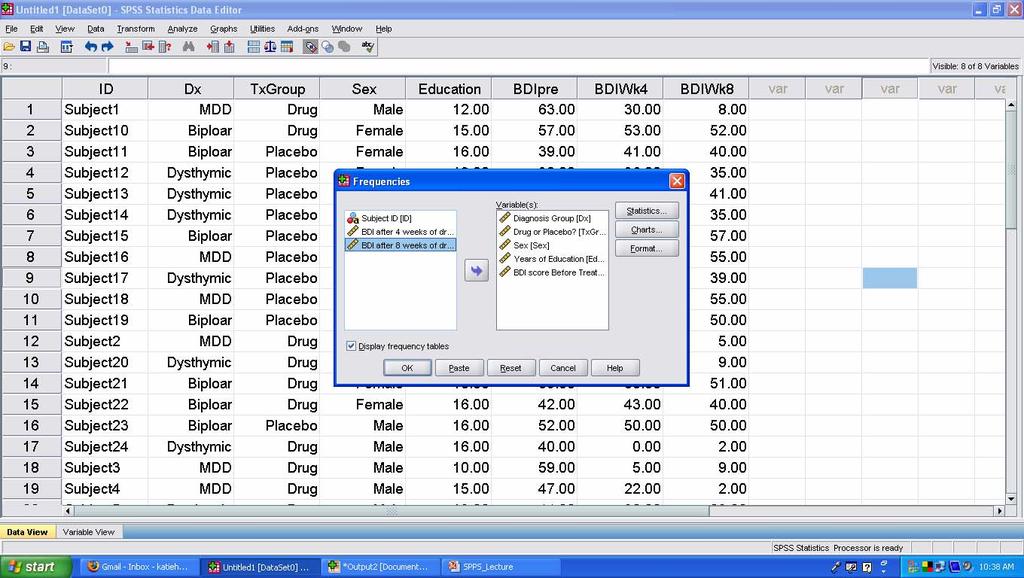
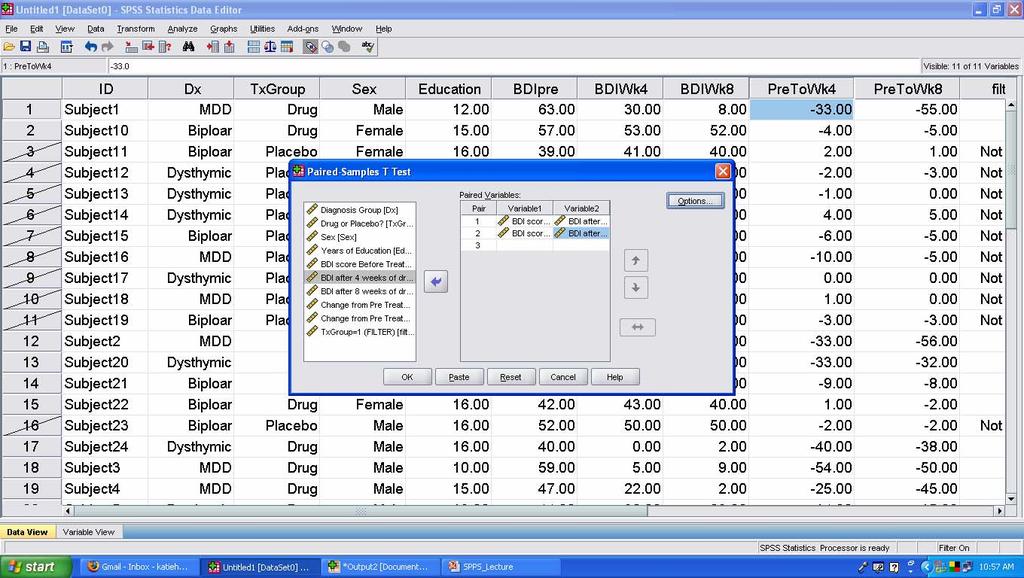
39 Paired T-Tests Two continuous variables i.e. In the Tx group alone, did subjects display a sig. change in BDI score from pre to Week 4? Week 8? Is the change (difference) from Time 1 to Time 2 is sig. different from zero

40 Selecting Cases
41 Paired-Samples T-Test
42 Paired-Samples T-Test
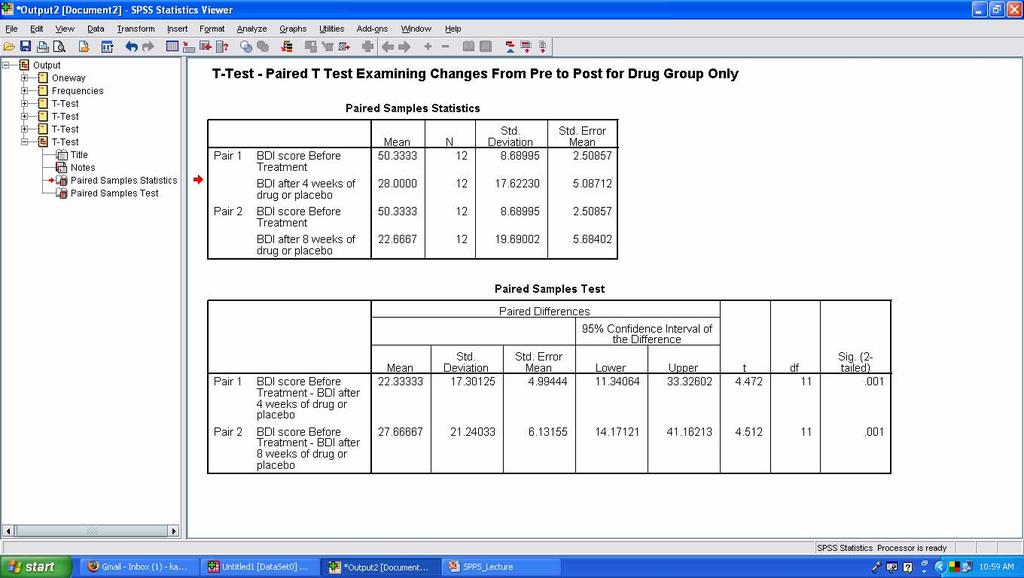
43 Paired-Samples T-Test
44 One-Sample T-Test Question: Does our sample as a whole at pre have BDI scores significantly different from what clinicians deem to be the cutoff for severe depression (BDI=30)?
45 One-Sample T-Test
46 One-Sample T-Test
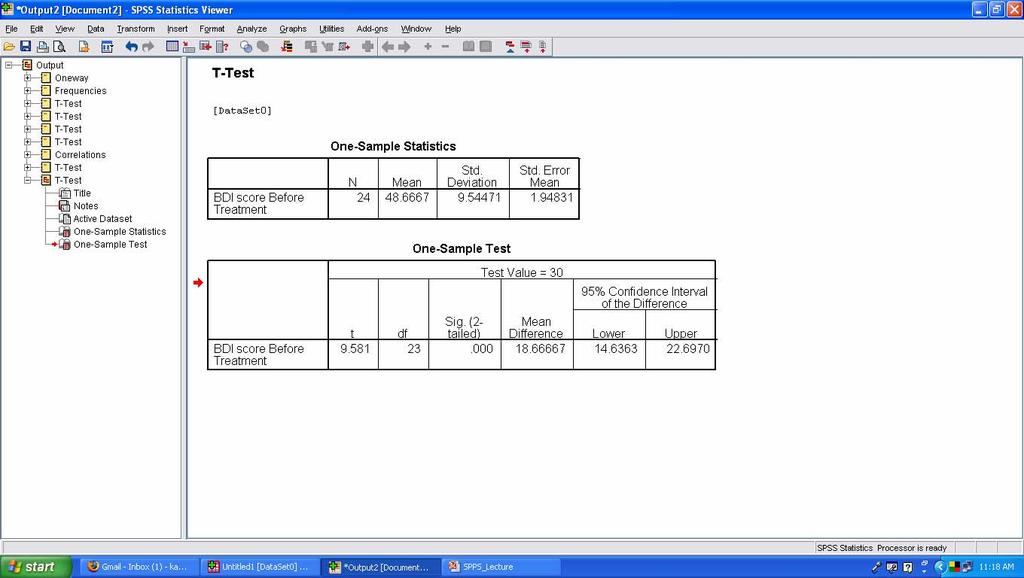
47 One-Sample T-Test
48 Independent Samples T-Test Do two groups different on a continuous measure? IV = Categorical (Only 2 Groups) DV = Continuous i.e. Does our sample differ in any important measure pre-treatment on the basis of sex? i.e. BDI Scores Pre-Treatment IV = Sex DV = Pre BDI Score
49 Independent-Sample T-Test
50 Independent-Sample T-Test
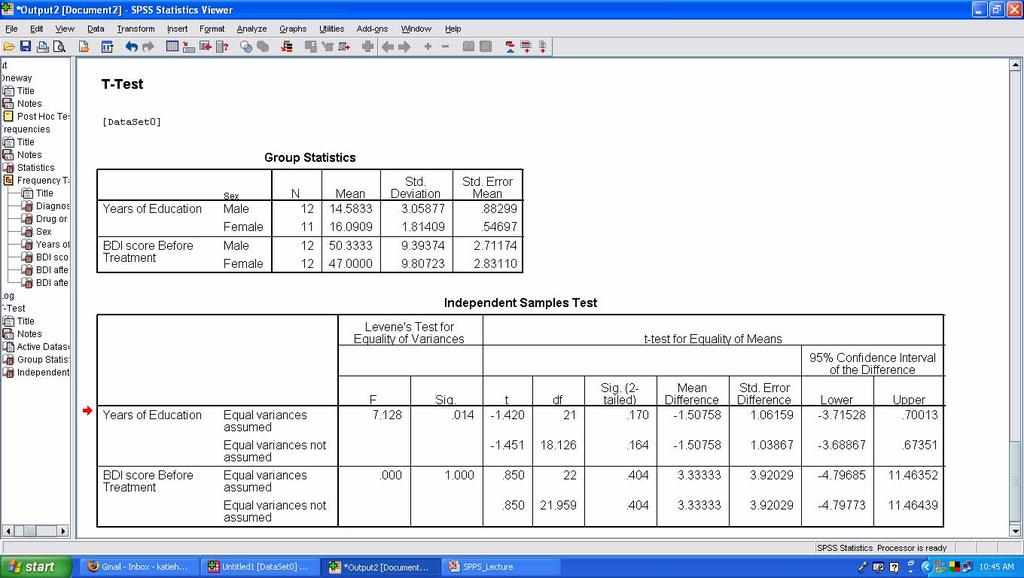
51 Independent-Sample T-Test
52 Independent Samples T-Test Is there a significant difference in the BDI change score from Pre to Week 4 between those who received the drug and those who were in the placebo group? IV = Treatment Group (drug vs placebo) DV = BDI Change Score
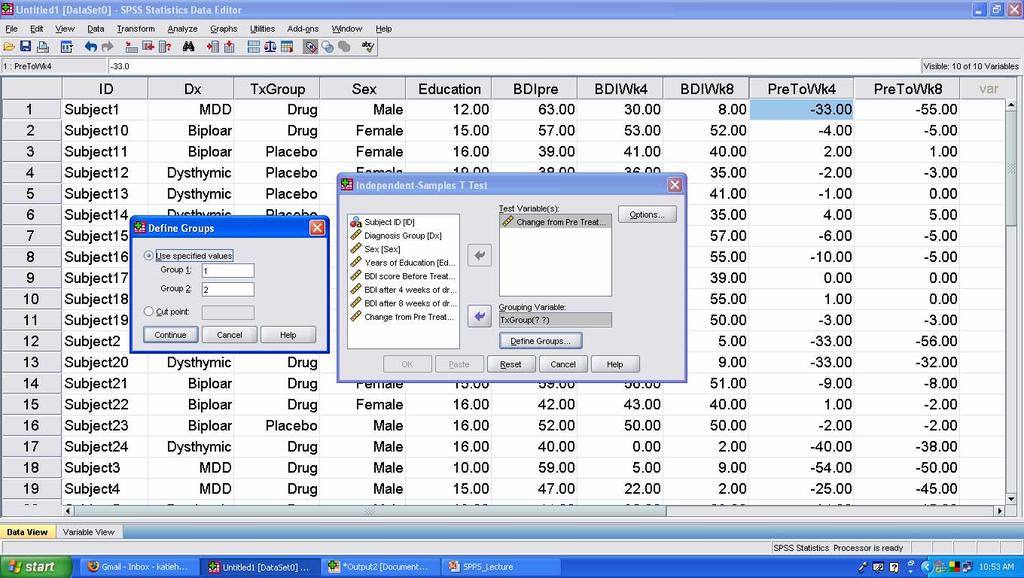
53 Independent-Sample T-Test
54 Independent-Sample T-Test
55 Levene s Test: homogeneity of variance
56 Levene s Test: homogeneity of variance
57 One-Way ANOVA IV = Categorical DV = Continuous Two or more groups Note: An Ind-T-Test can only have 2 groups i.e. Did the three Diagnostic Groups Differ in Pre-Treatment BDI Scores?
58 One-Way ANOVA
59 One-Way ANOVA

60 One-Way ANOVA
61 One-Way ANOVA

62 One-Way ANOVA

63 Post Hoc Tests
64 One-Way ANOVA

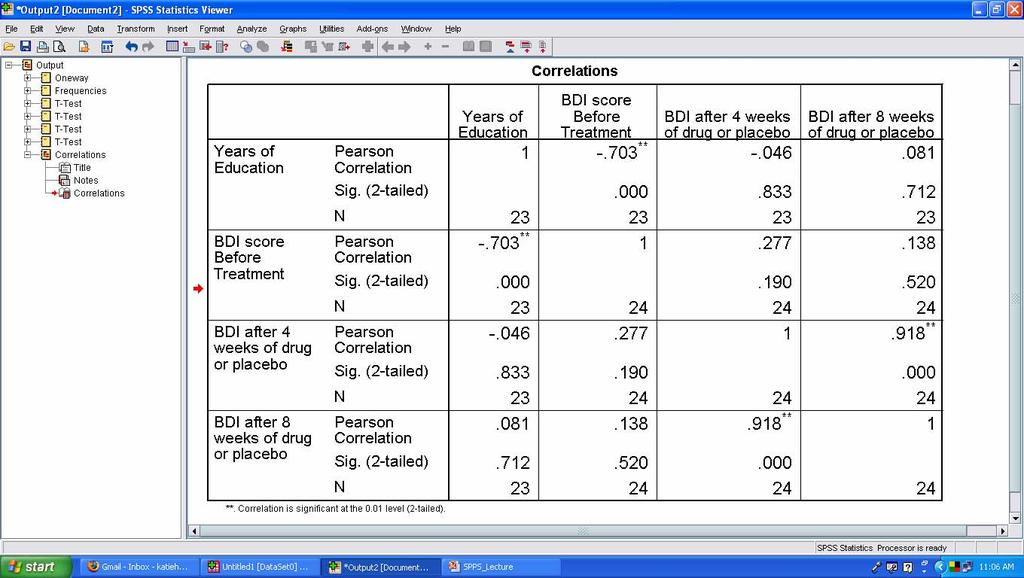
65 One-Way ANOVA NOTE: Don t Run Post-Hoc If p=ns
66 Comparing Groups So we know that the change from Pre to Week 8 was not sig. different between the groups BUT, was each group s change statistically significant?

67 Comparing Groups

68 Comparing Groups
69 Comparing Groups

70 Comparing Groups

71 Comparing Groups
72 Correlations Strength and direction of a linear relationship between two continuous variables Pearson product-moment correlation dividing the covariance of the two variables by the product of their SD
73 Correlations
74 Correlations
75 Correlations

76 Do NOT Run Correlations on Categorical Variables!! Important: THESE VALUES ARE ARBITRARY!!
77 Correlations What NOT To Do

78 Correlations What NOT To Do
79 The End
EPS 625 INTERMEDIATE STATISTICS TWO-WAY ANOVA IN-CLASS EXAMPLE (FLEXIBILITY)
") EPS 625 INTERMEDIATE STATISTICS TO-AY ANOVA IN-CLASS EXAMPLE (FLEXIBILITY) A researcher conducts a study to evaluate the effects of the length of an exercise program on the flexibility of female and male
EPS 625 INTERMEDIATE STATISTICS TO-AY ANOVA IN-CLASS EXAMPLE (FLEXIBILITY) A researcher conducts a study to evaluate the effects of the length of an exercise program on the flexibility of female and male
Quantitative Methods in Computing Education Research (A brief overview tips and techniques)
") Quantitative Methods in Computing Education Research (A brief overview tips and techniques) Dr Judy Sheard Senior Lecturer Co-Director, Computing Education Research Group Monash University judy.sheard@monash.edu
Quantitative Methods in Computing Education Research (A brief overview tips and techniques) Dr Judy Sheard Senior Lecturer Co-Director, Computing Education Research Group Monash University judy.sheard@monash.edu
One-Way Independent ANOVA
 One-Way Independent ANOVA Analysis of Variance (ANOVA) is a common and robust statistical test that you can use to compare the mean scores collected from different conditions or groups in an experiment.
Intro to SPSS. Using SPSS through WebFAS
 Intro to SPSS Using SPSS through WebFAS http://www.yorku.ca/computing/students/labs/webfas/ Try it early (make sure it works from your computer) If you need help contact UIT Client Services Voice: 416-736-5800
Statistics as a Tool. A set of tools for collecting, organizing, presenting and analyzing numerical facts or observations.
 Statistics as a Tool A set of tools for collecting, organizing, presenting and analyzing numerical facts or observations. Descriptive Statistics Numerical facts or observations that are organized describe
Daniel Boduszek University of Huddersfield
 Daniel Boduszek University of Huddersfield d.boduszek@hud.ac.uk Introduction to Correlation SPSS procedure for Pearson r Interpretation of SPSS output Presenting results Partial Correlation Correlation
ANOVA in SPSS (Practical)
") ANOVA in SPSS (Practical) Analysis of Variance practical In this practical we will investigate how we model the influence of a categorical predictor on a continuous response. Centre for Multilevel Modelling
ANOVA in SPSS (Practical) Analysis of Variance practical In this practical we will investigate how we model the influence of a categorical predictor on a continuous response. Centre for Multilevel Modelling
Daniel Boduszek University of Huddersfield
 Daniel Boduszek University of Huddersfield d.boduszek@hud.ac.uk Introduction to Logistic Regression SPSS procedure of LR Interpretation of SPSS output Presenting results from LR Logistic regression is
HOW STATISTICS IMPACT PHARMACY PRACTICE?
 HOW STATISTICS IMPACT PHARMACY PRACTICE? CPPD at NCCR 13 th June, 2013 Mohamed Izham M.I., PhD Professor in Social & Administrative Pharmacy Learning objective.. At the end of the presentation pharmacists
Basic Biostatistics. Chapter 1. Content
 Chapter 1 Basic Biostatistics Jamalludin Ab Rahman MD MPH Department of Community Medicine Kulliyyah of Medicine Content 2 Basic premises variables, level of measurements, probability distribution Descriptive
Analysis of Variance: repeated measures
 Analysis of Variance: repeated measures Tests for comparing three or more groups or conditions: (a) Nonparametric tests: Independent measures: Kruskal-Wallis. Repeated measures: Friedman s. (b) Parametric
PSYCHOLOGY 320L Problem Set #4: Estimating Sample Size, Post Hoc Tests, and Two-Factor ANOVA
 PSYCHOLOGY 320L Problem Set #4: Estimating Sample Size, Post Hoc Tests, and Two-Factor ANOVA Name: Score: 1. Suppose you are planning an experiment for a class project with a group of students and you
Day 11: Measures of Association and ANOVA
 Day 11: Measures of Association and ANOVA Daniel J. Mallinson School of Public Affairs Penn State Harrisburg mallinson@psu.edu PADM-HADM 503 Mallinson Day 11 November 2, 2017 1 / 45 Road map Measures of
Preliminary Report on Simple Statistical Tests (t-tests and bivariate correlations)
") Preliminary Report on Simple Statistical Tests (t-tests and bivariate correlations) After receiving my comments on the preliminary reports of your datasets, the next step for the groups is to complete
Preliminary Report on Simple Statistical Tests (t-tests and bivariate correlations) After receiving my comments on the preliminary reports of your datasets, the next step for the groups is to complete
Two-Way Independent ANOVA
 Two-Way Independent ANOVA Analysis of Variance (ANOVA) a common and robust statistical test that you can use to compare the mean scores collected from different conditions or groups in an experiment. There
Theoretical Exam. Monday 15 th, Instructor: Dr. Samir Safi. 1. Write your name, student ID and section number.
 بسم االله الرحمن الرحيم COMPUTER & DATA ANALYSIS Theoretical Exam FINAL THEORETICAL EXAMINATION Monday 15 th, 2007 Instructor: Dr. Samir Safi Name: ID Number: Instructor: INSTRUCTIONS: 1. Write your name,
Daniel Boduszek University of Huddersfield
 Daniel Boduszek University of Huddersfield d.boduszek@hud.ac.uk Introduction to Multinominal Logistic Regression SPSS procedure of MLR Example based on prison data Interpretation of SPSS output Presenting
Simple Linear Regression One Categorical Independent Variable with Several Categories
 Simple Linear Regression One Categorical Independent Variable with Several Categories Does ethnicity influence total GCSE score? We ve learned that variables with just two categories are called binary
Profile Analysis. Intro and Assumptions Psy 524 Andrew Ainsworth
 Profile Analysis Intro and Assumptions Psy 524 Andrew Ainsworth Profile Analysis Profile analysis is the repeated measures extension of MANOVA where a set of DVs are commensurate (on the same scale). Profile
THE STATSWHISPERER. Introduction to this Issue. Doing Your Data Analysis INSIDE THIS ISSUE
 Spring 20 11, Volume 1, Issue 1 THE STATSWHISPERER The StatsWhisperer Newsletter is published by staff at StatsWhisperer. Visit us at: www.statswhisperer.com Introduction to this Issue The current issue
One-Way ANOVAs t-test two statistically significant Type I error alpha null hypothesis dependant variable Independent variable three levels;
 1 One-Way ANOVAs We have already discussed the t-test. The t-test is used for comparing the means of two groups to determine if there is a statistically significant difference between them. The t-test
Tutorial 3: MANOVA. Pekka Malo 30E00500 Quantitative Empirical Research Spring 2016
 Tutorial 3: Pekka Malo 30E00500 Quantitative Empirical Research Spring 2016 Step 1: Research design Adequacy of sample size Choice of dependent variables Choice of independent variables (treatment effects)
Survey research (Lecture 1) Summary & Conclusion. Lecture 10 Survey Research & Design in Psychology James Neill, 2015 Creative Commons Attribution 4.
 Summary & Conclusion. Lecture 10 Survey Research & Design in Psychology James Neill, 2015 Creative Commons Attribution 4.") Summary & Conclusion Lecture 10 Survey Research & Design in Psychology James Neill, 2015 Creative Commons Attribution 4.0 Overview 1. Survey research 2. Survey design 3. Descriptives & graphing 4. Correlation
Summary & Conclusion Lecture 10 Survey Research & Design in Psychology James Neill, 2015 Creative Commons Attribution 4.0 Overview 1. Survey research 2. Survey design 3. Descriptives & graphing 4. Correlation
Survey research (Lecture 1)
") Summary & Conclusion Lecture 10 Survey Research & Design in Psychology James Neill, 2015 Creative Commons Attribution 4.0 Overview 1. Survey research 2. Survey design 3. Descriptives & graphing 4. Correlation
Summary & Conclusion Lecture 10 Survey Research & Design in Psychology James Neill, 2015 Creative Commons Attribution 4.0 Overview 1. Survey research 2. Survey design 3. Descriptives & graphing 4. Correlation
Before we get started:
 Before we get started: http://arievaluation.org/projects-3/ AEA 2018 R-Commander 1 Antonio Olmos Kai Schramm Priyalathta Govindasamy Antonio.Olmos@du.edu AntonioOlmos@aumhc.org AEA 2018 R-Commander 2 Plan
Regression. Page 1. Variables Entered/Removed b Variables. Variables Removed. Enter. Method. Psycho_Dum
 Regression Model Variables Entered/Removed b Variables Entered Variables Removed Method Meds_Dum,. Enter Psycho_Dum a. All requested variables entered. b. Dependent Variable: Beck's Depression Score Model
Statistics: A Brief Overview Part I. Katherine Shaver, M.S. Biostatistician Carilion Clinic
 Statistics: A Brief Overview Part I Katherine Shaver, M.S. Biostatistician Carilion Clinic Statistics: A Brief Overview Course Objectives Upon completion of the course, you will be able to: Distinguish
Advanced ANOVA Procedures
 Advanced ANOVA Procedures Session Lecture Outline:. An example. An example. Two-way ANOVA. An example. Two-way Repeated Measures ANOVA. MANOVA. ANalysis of Co-Variance (): an ANOVA procedure whereby the
Analysis of Variance (ANOVA) Program Transcript
 Program Transcript") Analysis of Variance (ANOVA) Program Transcript DR. JENNIFER ANN MORROW: Welcome to Analysis of Variance. My name is Dr. Jennifer Ann Morrow. In today's demonstration, I'll review with you the definition
Analysis of Variance (ANOVA) Program Transcript DR. JENNIFER ANN MORROW: Welcome to Analysis of Variance. My name is Dr. Jennifer Ann Morrow. In today's demonstration, I'll review with you the definition
Overview of Lecture. Survey Methods & Design in Psychology. Correlational statistics vs tests of differences between groups
 Survey Methods & Design in Psychology Lecture 10 ANOVA (2007) Lecturer: James Neill Overview of Lecture Testing mean differences ANOVA models Interactions Follow-up tests Effect sizes Parametric Tests
Repeated Measures ANOVA and Mixed Model ANOVA. Comparing more than two measurements of the same or matched participants
 Repeated Measures ANOVA and Mixed Model ANOVA Comparing more than two measurements of the same or matched participants Data files Fatigue.sav MentalRotation.sav AttachAndSleep.sav Attitude.sav Homework:
Summary & Conclusion. Lecture 10 Survey Research & Design in Psychology James Neill, 2016 Creative Commons Attribution 4.0
 Summary & Conclusion Lecture 10 Survey Research & Design in Psychology James Neill, 2016 Creative Commons Attribution 4.0 Overview 1. Survey research and design 1. Survey research 2. Survey design 2. Univariate
Choosing the Correct Statistical Test
 Choosing the Correct Statistical Test T racie O. Afifi, PhD Departments of Community Health Sciences & Psychiatry University of Manitoba Department of Community Health Sciences COLLEGE OF MEDICINE, FACULTY
Survey Project Data Analysis Guide
 Survey Project Data Analysis Guide I. Computing Scale Scores. - In the data file that I have given you, I have already done the following. - Reverse scored all of the appropriate items. For: Aggression
SUMMER 2011 RE-EXAM PSYF11STAT - STATISTIK
 SUMMER 011 RE-EXAM PSYF11STAT - STATISTIK Full Name: Årskortnummer: Date: This exam is made up of three parts: Part 1 includes 30 multiple choice questions; Part includes 10 matching questions; and Part
Explore. sexcntry Sex according to country. [DataSet1] D:\NORA\NORA Main File.sav
![Explore. sexcntry Sex according to country. [DataSet1] D:\NORA\NORA Main File.sav](/thumbs/82/84761267.jpg "Explore. sexcntry Sex according to country. [DataSet1] D:\NORA\NORA Main File.sav") EXAMINE VARIABLES=nc228 BY sexcntry /PLOT BOXPLOT HISTOGRAM NPPLOT /COMPARE GROUPS /STATISTICS DESCRIPTIVES /CINTERVAL 95 /MISSING LISTWISE /NOTOTAL. Explore Notes Output Created Comments Input Missing
EXAMINE VARIABLES=nc228 BY sexcntry /PLOT BOXPLOT HISTOGRAM NPPLOT /COMPARE GROUPS /STATISTICS DESCRIPTIVES /CINTERVAL 95 /MISSING LISTWISE /NOTOTAL. Explore Notes Output Created Comments Input Missing
Chapter 14: More Powerful Statistical Methods
 Chapter 14: More Powerful Statistical Methods Most questions will be on correlation and regression analysis, but I would like you to know just basically what cluster analysis, factor analysis, and conjoint
Regression Including the Interaction Between Quantitative Variables
 Regression Including the Interaction Between Quantitative Variables The purpose of the study was to examine the inter-relationships among social skills, the complexity of the social situation, and performance
04/12/2014. Research Methods in Psychology. Chapter 6: Independent Groups Designs. What is your ideas? Testing
 Research Methods in Psychology Chapter 6: Independent Groups Designs 1 Why Psychologists Conduct Experiments? What is your ideas? 2 Why Psychologists Conduct Experiments? Testing Hypotheses derived from
Hypothesis Testing. Richard S. Balkin, Ph.D., LPC-S, NCC
 Hypothesis Testing Richard S. Balkin, Ph.D., LPC-S, NCC Overview When we have questions about the effect of a treatment or intervention or wish to compare groups, we use hypothesis testing Parametric statistics
STATISTICS AND RESEARCH DESIGN
 Statistics 1 STATISTICS AND RESEARCH DESIGN These are subjects that are frequently confused. Both subjects often evoke student anxiety and avoidance. To further complicate matters, both areas appear have
Daniel Boduszek University of Huddersfield
 Daniel Boduszek University of Huddersfield d.boduszek@hud.ac.uk Introduction to Multiple Regression (MR) Types of MR Assumptions of MR SPSS procedure of MR Example based on prison data Interpretation of
PSY 216: Elementary Statistics Exam 4
 Name: PSY 16: Elementary Statistics Exam 4 This exam consists of multiple-choice questions and essay / problem questions. For each multiple-choice question, circle the one letter that corresponds to the
What you should know before you collect data. BAE 815 (Fall 2017) Dr. Zifei Liu
 Dr. Zifei Liu") What you should know before you collect data BAE 815 (Fall 2017) Dr. Zifei Liu Zifeiliu@ksu.edu Types and levels of study Descriptive statistics Inferential statistics How to choose a statistical test
What you should know before you collect data BAE 815 (Fall 2017) Dr. Zifei Liu Zifeiliu@ksu.edu Types and levels of study Descriptive statistics Inferential statistics How to choose a statistical test
Psychology Research Process
 Psychology Research Process Logical Processes Induction Observation/Association/Using Correlation Trying to assess, through observation of a large group/sample, what is associated with what? Examples:
Supplementary Materials Are taboo words simply more arousing?
 Supplementary Materials Are taboo words simply more arousing? Our study was not designed to compare potential differences on memory other than arousal between negative and taboo words. Thus, our data cannot
HS Exam 1 -- March 9, 2006
 Please write your name on the back. Don t forget! Part A: Short answer, multiple choice, and true or false questions. No use of calculators, notes, lab workbooks, cell phones, neighbors, brain implants,
Data Analysis with SPSS
 Data Analysis with SPSS A First Course in Applied Statistics Fourth Edition Stephen Sweet Ithaca College Karen Grace-Martin The Analysis Factor Allyn & Bacon Boston Columbus Indianapolis New York San Francisco
Chapter 11 Nonexperimental Quantitative Research Steps in Nonexperimental Research
 Chapter 11 Nonexperimental Quantitative Research (Reminder: Don t forget to utilize the concept maps and study questions as you study this and the other chapters.) Nonexperimental research is needed because
Statistical questions for statistical methods
 Statistical questions for statistical methods Unpaired (two-sample) t-test DECIDE: Does the numerical outcome have a relationship with the categorical explanatory variable? Is the mean of the outcome the
Here are the various choices. All of them are found in the Analyze menu in SPSS, under the sub-menu for Descriptive Statistics :
 Descriptive Statistics in SPSS When first looking at a dataset, it is wise to use descriptive statistics to get some idea of what your data look like. Here is a simple dataset, showing three different
1. Introduction. 2. Objectives. 2.1 Primary objective
 1. Introduction This document describes the statistical analysis and reporting to be undertaken for paroxetine adult suicidality data. The data include trials submitted, or planned to be submitted, as
Correlation and Regression
 Dublin Institute of Technology ARROW@DIT Books/Book Chapters School of Management 2012-10 Correlation and Regression Donal O'Brien Dublin Institute of Technology, donal.obrien@dit.ie Pamela Sharkey Scott
Quantitative Data and Measurement. POLI 205 Doing Research in Politics. Fall 2015
 Quantitative Fall 2015 Theory and We need to test our theories with empirical data Inference : Systematic observation and representation of concepts Quantitative: measures are numeric Qualitative: measures
Analysis and Interpretation of Data Part 1
 Analysis and Interpretation of Data Part 1 DATA ANALYSIS: PRELIMINARY STEPS 1. Editing Field Edit Completeness Legibility Comprehensibility Consistency Uniformity Central Office Edit 2. Coding Specifying
ANALYSIS OF VARIANCE (ANOVA): TESTING DIFFERENCES INVOLVING THREE OR MORE MEANS
: TESTING DIFFERENCES INVOLVING THREE OR MORE MEANS") ANALYSIS OF VARIANCE (ANOVA): TESTING DIFFERENCES INVOLVING THREE OR MORE MEANS REVIEW Testing hypothesis using the difference between two means: One-sample t-test Independent-samples t-test Dependent/Paired-samples
ANALYSIS OF VARIANCE (ANOVA): TESTING DIFFERENCES INVOLVING THREE OR MORE MEANS REVIEW Testing hypothesis using the difference between two means: One-sample t-test Independent-samples t-test Dependent/Paired-samples
Study Guide #2: MULTIPLE REGRESSION in education
 Study Guide #2: MULTIPLE REGRESSION in education What is Multiple Regression? When using Multiple Regression in education, researchers use the term independent variables to identify those variables that
Statistics Guide. Prepared by: Amanda J. Rockinson- Szapkiw, Ed.D.
 This guide contains a summary of the statistical terms and procedures. This guide can be used as a reference for course work and the dissertation process. However, it is recommended that you refer to statistical
Understandable Statistics
 Understandable Statistics correlated to the Advanced Placement Program Course Description for Statistics Prepared for Alabama CC2 6/2003 2003 Understandable Statistics 2003 correlated to the Advanced Placement
On the purpose of testing:
 Why Evaluation & Assessment is Important Feedback to students Feedback to teachers Information to parents Information for selection and certification Information for accountability Incentives to increase
Midterm Exam MMI 409 Spring 2009 Gordon Bleil
 Midterm Exam MMI 409 Spring 2009 Gordon Bleil Table of contents: (Hyperlinked to problem sections) Problem 1 Hypothesis Tests Results Inferences Problem 2 Hypothesis Tests Results Inferences Problem 3
Business Research Methods. Introduction to Data Analysis
 Business Research Methods Introduction to Data Analysis Data Analysis Process STAGES OF DATA ANALYSIS EDITING CODING DATA ENTRY ERROR CHECKING AND VERIFICATION DATA ANALYSIS Introduction Preparation of
Chapter 25. Paired Samples and Blocks. Copyright 2010 Pearson Education, Inc.
 Chapter 25 Paired Samples and Blocks Copyright 2010 Pearson Education, Inc. Paired Data Data are paired when the observations are collected in pairs or the observations in one group are naturally related
isc ove ring i Statistics sing SPSS
 isc ove ring i Statistics sing SPSS S E C O N D! E D I T I O N (and sex, drugs and rock V roll) A N D Y F I E L D Publications London o Thousand Oaks New Delhi CONTENTS Preface How To Use This Book Acknowledgements
1. Below is the output of a 2 (gender) x 3(music type) completely between subjects factorial ANOVA on stress ratings
 x 3(music type) completely between subjects factorial ANOVA on stress ratings") SPSS 3 Practice Interpretation questions A researcher is interested in the effects of music on stress levels, and how stress levels might be related to anxiety and life satisfaction. 1. Below is the output
SPSS 3 Practice Interpretation questions A researcher is interested in the effects of music on stress levels, and how stress levels might be related to anxiety and life satisfaction. 1. Below is the output
11/4/2010. represent the average scores for BOTH A1 & A2 at each level of B. The red lines. are graphing B Main Effects. Red line is the Average A1
 Factorial ANOVA Chapter 12 Research Designs Between Between (2 between subjects factors) Mixed Design (1 between, 1 within subjects factor) Within Within (2 within subjects factors) The purpose of this
Final Exam Practice Test
 Final Exam Practice Test The t distribution and z-score distributions are located in the back of your text book (the appendices) You will be provided with a new copy of each during your final exam True
Two-Way Independent Samples ANOVA with SPSS
 Two-Way Independent Samples ANOVA with SPSS Obtain the file ANOVA.SAV from my SPSS Data page. The data are those that appear in Table 17-3 of Howell s Fundamental statistics for the behavioral sciences
Research paper. Split-plot ANOVA. Split-plot design. Split-plot design. SPSS output: between effects. SPSS output: within effects
 Research paper Effects of alcohol and caffeine on driving ability Split-plot ANOVA conditions: No alcohol; no caffeine alcohol; no caffeine No alcohol; caffeine Alcohol; caffeine Driving in simulator Error
Statistical analysis DIANA SAPLACAN 2017 * SLIDES ADAPTED BASED ON LECTURE NOTES BY ALMA LEORA CULEN
 Statistical analysis DIANA SAPLACAN 2017 * SLIDES ADAPTED BASED ON LECTURE NOTES BY ALMA LEORA CULEN Vs. 2 Background 3 There are different types of research methods to study behaviour: Descriptive: observations,
Problem #1 Neurological signs and symptoms of ciguatera poisoning as the start of treatment and 2.5 hours after treatment with mannitol.
 Ho (null hypothesis) Ha (alternative hypothesis) Problem #1 Neurological signs and symptoms of ciguatera poisoning as the start of treatment and 2.5 hours after treatment with mannitol. Hypothesis: Ho:
VU Biostatistics and Experimental Design PLA.216
 VU Biostatistics and Experimental Design PLA.216 Julia Feichtinger Postdoctoral Researcher Institute of Computational Biotechnology Graz University of Technology Outline for Today About this course Background
Choosing a Significance Test. Student Resource Sheet
 Choosing a Significance Test Student Resource Sheet Choosing Your Test Choosing an appropriate type of significance test is a very important consideration in analyzing data. If an inappropriate test is
Introduction to SPSS: Defining Variables and Data Entry
 Introduction to SPSS: Defining Variables and Data Entry You will be on this page after SPSS is started Click Cancel Choose variable view by clicking this button Type the name of the variable here Lets
1. You want to find out what factors predict achievement in English. Develop a model that
 Questions and answers for Chapter 10 1. You want to find out what factors predict achievement in English. Develop a model that you think can explain this. As usual many alternative predictors are possible
Research Methods in Forest Sciences: Learning Diary. Yoko Lu December Research process
 Research Methods in Forest Sciences: Learning Diary Yoko Lu 285122 9 December 2016 1. Research process It is important to pursue and apply knowledge and understand the world under both natural and social
Chapter 12: Analysis of covariance, ANCOVA
 Chapter 12: Analysis of covariance, ANCOVA Smart Alex s Solutions Task 1 A few years back I was stalked. You d think they could have found someone a bit more interesting to stalk, but apparently times
Multiple Regression Using SPSS/PASW
 MultipleRegressionUsingSPSS/PASW The following sections have been adapted from Field (2009) Chapter 7. These sections have been edited down considerablyandisuggest(especiallyifyou reconfused)thatyoureadthischapterinitsentirety.youwillalsoneed
Readings Assumed knowledge
 3 N = 59 EDUCAT 59 TEACHG 59 CAMP US 59 SOCIAL Analysis of Variance 95% CI Lecture 9 Survey Research & Design in Psychology James Neill, 2012 Readings Assumed knowledge Howell (2010): Ch3 The Normal Distribution
Dan Byrd UC Office of the President
 Dan Byrd UC Office of the President 1. OLS regression assumes that residuals (observed value- predicted value) are normally distributed and that each observation is independent from others and that the
Examining differences between two sets of scores
 6 Examining differences between two sets of scores In this chapter you will learn about tests which tell us if there is a statistically significant difference between two sets of scores. In so doing you
Relationship between personality and depression among High School Students in Tehran-Iran
 Relationship between personality and depression among High School Students in Tehran-Iran Haleh Saboori Department of Psychology, Sirjan Branch, Islamic Azad University, Sirjan, Iran Abstract The present
ANCOVA with Regression Homogeneity
 ANCOVA with Regression Homogeneity The purpose of the study was to compare the effectiveness of two different treatments in two populations. Both treatments have been repeatedly shown to work better than
Introduction to statistics Dr Alvin Vista, ACER Bangkok, 14-18, Sept. 2015
 Analysing and Understanding Learning Assessment for Evidence-based Policy Making Introduction to statistics Dr Alvin Vista, ACER Bangkok, 14-18, Sept. 2015 Australian Council for Educational Research Structure
A Brief (very brief) Overview of Biostatistics. Jody Kreiman, PhD Bureau of Glottal Affairs
 Overview of Biostatistics. Jody Kreiman, PhD Bureau of Glottal Affairs") A Brief (very brief) Overview of Biostatistics Jody Kreiman, PhD Bureau of Glottal Affairs What We ll Cover Fundamentals of measurement Parametric versus nonparametric tests Descriptive versus inferential
A Brief (very brief) Overview of Biostatistics Jody Kreiman, PhD Bureau of Glottal Affairs What We ll Cover Fundamentals of measurement Parametric versus nonparametric tests Descriptive versus inferential
Designing Psychology Experiments: Data Analysis and Presentation
 Data Analysis and Presentation Review of Chapter 4: Designing Experiments Develop Hypothesis (or Hypotheses) from Theory Independent Variable(s) and Dependent Variable(s) Operational Definitions of each
The Effect Sizes r and d in Hypnosis Research
 Marty Sapp The Effect Sizes r and d in Hypnosis Research Marty Sapp, Ed.D. The effect sizes r and d and their confidence intervals can improve hypnosis research. This paper describes how to devise scientific
NORTH SOUTH UNIVERSITY TUTORIAL 2
 NORTH SOUTH UNIVERSITY TUTORIAL 2 AHMED HOSSAIN,PhD Data Management and Analysis AHMED HOSSAIN,PhD - Data Management and Analysis 1 Correlation Analysis INTRODUCTION In correlation analysis, we estimate
Simple Linear Regression
 Simple Linear Regression Assoc. Prof Dr Sarimah Abdullah Unit of Biostatistics & Research Methodology School of Medical Sciences, Health Campus Universiti Sains Malaysia Regression Regression analysis
LAB ASSIGNMENT 4 INFERENCES FOR NUMERICAL DATA. Comparison of Cancer Survival*
 LAB ASSIGNMENT 4 1 INFERENCES FOR NUMERICAL DATA In this lab assignment, you will analyze the data from a study to compare survival times of patients of both genders with different primary cancers. First,
Data Analysis. A cross-tabulation allows the researcher to see the relationships between the values of two different variables
 Data Analysis A cross-tabulation allows the researcher to see the relationships between the values of two different variables One variable is typically the dependent variable (such as attitude toward the
Biology 345: Biometry Fall 2005 SONOMA STATE UNIVERSITY Lab Exercise 5 Residuals and multiple regression Introduction
 Biology 345: Biometry Fall 2005 SONOMA STATE UNIVERSITY Lab Exercise 5 Residuals and multiple regression Introduction In this exercise, we will gain experience assessing scatterplots in regression and
Chapter 9: Answers. Tests of Between-Subjects Effects. Dependent Variable: Time Spent Stalking After Therapy (hours per week)
") Task 1 Chapter 9: Answers Stalking is a very disruptive and upsetting (for the person being stalked) experience in which someone (the stalker) constantly harasses or obsesses about another person. It can
Task 1 Chapter 9: Answers Stalking is a very disruptive and upsetting (for the person being stalked) experience in which someone (the stalker) constantly harasses or obsesses about another person. It can
Lunchtime Seminar. Risper Awuor, Ph.D. Department of Graduate Educational and Leadership. January 30, 2013
 Lunchtime Seminar Risper Awuor, Ph.D. Department of Graduate Educational and Leadership January 30, 2013 Scales of Measurement Nominal Ordinal Interval Ratio Scales of Measurement Nominal names assigned
(C) Jamalludin Ab Rahman
 Jamalludin Ab Rahman") SPSS Note The GLM Multivariate procedure is based on the General Linear Model procedure, in which factors and covariates are assumed to have a linear relationship to the dependent variable. Factors. Categorical
SPSS Note The GLM Multivariate procedure is based on the General Linear Model procedure, in which factors and covariates are assumed to have a linear relationship to the dependent variable. Factors. Categorical
Kidane Tesfu Habtemariam, MASTAT, Principle of Stat Data Analysis Project work
 1 1. INTRODUCTION Food label tells the extent of calories contained in the food package. The number tells you the amount of energy in the food. People pay attention to calories because if you eat more
Health Consciousness of Siena Students
 Health Consciousness of Siena Students Corey Austin, Siena College Kevin Flood, Siena College Allison O Keefe, Siena College Kim Reuter, Siena College EXECUTIVE SUMMARY We decided to research the health
From Biostatistics Using JMP: A Practical Guide. Full book available for purchase here. Chapter 1: Introduction... 1
 From Biostatistics Using JMP: A Practical Guide. Full book available for purchase here. Contents Dedication... iii Acknowledgments... xi About This Book... xiii About the Author... xvii Chapter 1: Introduction...
List of Figures. List of Tables. Preface to the Second Edition. Preface to the First Edition
 List of Figures List of Tables Preface to the Second Edition Preface to the First Edition xv xxv xxix xxxi 1 What Is R? 1 1.1 Introduction to R................................ 1 1.2 Downloading and Installing
Psychology Research Process
 Psychology Research Process Logical Processes Induction Observation/Association/Using Correlation Trying to assess, through observation of a large group/sample, what is associated with what? Examples: