a. b. c. d. e. f. g. h. i. j. k. l. m. n. o. p.
|
|
|
- Gabriella Norman
- 5 years ago
- Views:
Transcription
1 a. b. c. d. e. f. g. h. i. j. k. l IL-1β IL-1β IL-1β m. n. o. p h LPS h LPS 2 6h LPS h LPS Supplementary Figure 1. Reduced adhesion molecule expression after MAP4K4 silencing. a-d. HUVECs were treated with scrambled or MAP4K4 sirna and stimulated with 1 ng/ml TNF-α for 24h. RNA was extracted, and qpcr was performed for a. MAP4K4, b. ICAM-1, c. VCAM-1, d. SELE. The data represent the mean ± SEM as normalized to RPLP *; p<.5, **; p<.5, N=5-7). e-h. Primary MLECs were stimulated with 1 ng/ml TNF-α for 6h or left unstimulated, RNA was extracted, and qpcr was performed. e. Icam-1, f. Vcam-1, g. Sele, h. Selp. Data represent the mean ± SEM as ormalized to 36b4. (ANOVA *; p<.5, **; p<.1, N=7-9). i-l. HUVECs were treated with scrambled or MAP4K4 sirna and stimulated with 2 ng/ml IL-1β for 6h. RNA was extracted, and qpcr was performed for i. MAP4K4, j. ICAM-1, k. VCAM-1, l. SELE. The data represent the mean ± SEM as normalized to RPLP (N=4). m-p. HUVECs were treated with scrambled or MAP4K4 sirna and stimulated with 1 ug/ml LPS for 6h. RNA was extracted, and qpcr was performed for m. MAP4K4, n. ICAM-1, o. VCAM-1, p. SELE. The data represent the mean ± SEM as ormalized to RPLP (N=4-5).

. d. HUVECs were pre-treated with MG132 prior to TNF-α stimulation.")
2 kda a. b. c. kda d. e. kda Supplementary Figure 2. EC MAP4K4 does not promote TNFα-induced MAPK or IKK activation. a-e. HUVECs were treated with scrambled or MAP4K4 sirna and stimulated with 1 or 1 ng/ml TNF-α for the indicated times. a. Lysates were immunoblotted for MAP4K4, p-jnk, total JNK, p-p38 MAPK, total p38 MAPK, p-erk, total Erk and VE-Cadherin. The data are representative of 4-5 independent experiments. b. Lysates were immunoblotted for MAP4K4, total IκBα, phospho-p65, total p65, phospho-ikkβ, total IKKβ, and VE-Cadherin. The data are representative of 4-1 independent experiments. c. Densitometric analyses represent the mean ± SEM of IκBα expression at time as normalized to VE-Cadherin (**; p<.5, N=4-1). d. HUVECs were pre-treated with MG132 prior to TNF-α stimulation. Lysates were immunoblotted for MAP4K4, phospho- IκBα, total IκBα, and VE-Cadherin. Data are representative of 5 experiments. e. Densitometric analyses represent the mean ± SEM of phospho-iκbα expression as normalized to total IκBα (N=5).


 phospho-erk as normalized to total Erk (N=3). e.")
3 a. b. c. d. e. Supplementary Figure 3. MAP4K4 kinase inhibition does not affect MAPK signaling and ameliorates vascular permeability. a-b. HUVECs or c-d. Peritoneal macrophages derived from wild type mice were treated with DMSO or 3 nm PF and stimulated with 1 ng/ml TNF-α for the indicated times. a, c. Lysates were immunoblotted for MAP4K4, p-jnk, total JNK, p-p38 MAPK, total p38 MAPK, p-erk, and total Erk. The data are representative of at least 3 independent experiments. b, d. Densitometric analyses represent the mean ± SEM of (left) phospho-jnk expression as normalized to total JNK expression, (middle) phospho-p38 MAPK as normalized to p38 MAPK, and (right) phospho-erk as normalized to total Erk (N=3). e. HAECs were pre-treated with DMSO or PF as indicated, confluent cells were treated overnight with ng/ml TNF-α or left untreated, and FITC labeled dextran that migrated through the HAEC monolayer was measured. The data represent the mean fluorescence intensity ± SEM (ANOVA ****; p<.1, N=3-4).


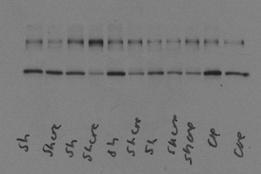
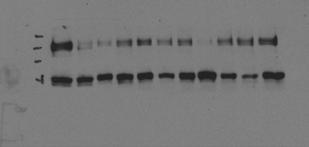
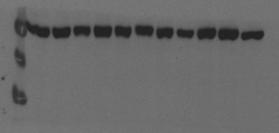
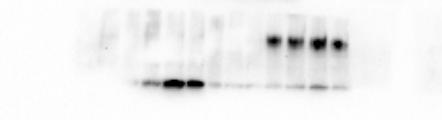
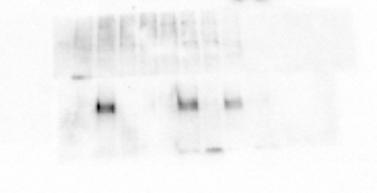
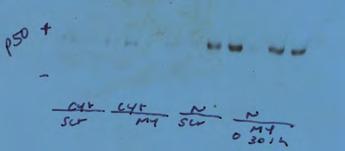
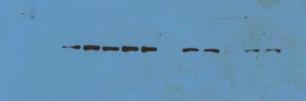

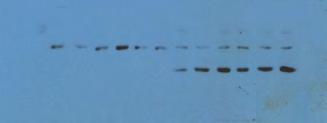
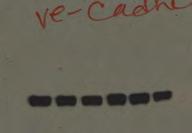
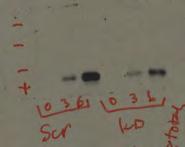
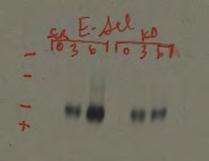
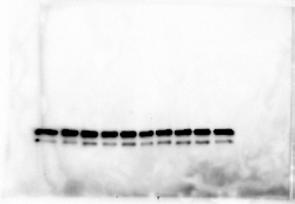
4 a. b. c. 32P MBP Vegfr2 d. e. ICAM-1 E-selectin VE-Cadherin Lamin β1 p-p65 VCAM-1 p65 p Supplementary Figure 4: Full gel scans for Figures 1-4. a. Gel scans for Fig. 1. b. Gel scans for Fig. 2. c. Gel scans for Fig. 3. d. Gel scans for Fig. 6g-h. e. Gel scans for Fig 6. i-j. Dashed boxes indicate lanes used if not entire gel.


5 a. b. c. MAP4K4 p-ikkβ pjnk IκBα MAP4K4 IκBα p-iκbα total JNK p-p65 VE-Cadherin p-p38 MAPK p38 MAPK IKKβ p65 p-erk VE-Cadherin ERK total VE-Cadherin Supplementary Figure 5: Full gel scans for Supplementary Figure 2. a. Gel scans for Supplementary Fig. 2a. b. Gel scans for Supplementary Fig. 2b-c. c. Gel scans for Supplementary Fig. 2d-e.


6 a. b. p-jnk p-jnk p-p38 MAPK p-p38 MAPK p-erk JNK JNK p38 MAPK p38 MAPK perk ERK ERK Supplementary Figure 6: Full gel scans for Supplementary Figure 3. a. Gel scans for Supplementary Fig. 3a-b. b. Gel scans for Supplementary Fig. 3c-d.
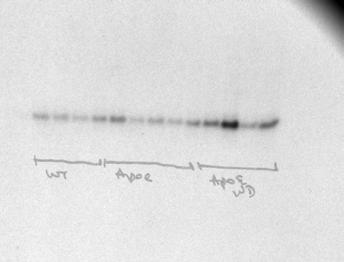
7 Supplementary Information Supplementary Table 1 Plasma glucose and lipid levels in MAP4K4 KD or PF treated mice Body weight (g) Glucose Total TG Total Cholesterol HDL Cholesterol LDL Cholesterol 16 weeks Western diet Control MAP4K4 KD 29. ± ± ± ± ± ± ±.9* ± ± ± ± ± 2.9 Apoe -/- prevention model Vehicle PF- (water) (1 mg/kg) 24.2 ± ± ± * ± 133. ± ± ± ± ± ± ± ± ± Ldlr -/- regression model Vehicle PF- (water) (1 mg/kg) 33.8 ± ± ± ** ± ± ± ± ± ** 1236 ± 61.2** ± ± 64.** The data represent the mean ± S.E.M. (*; p<.5, **; p<.5, N=6-12).
8 Supplementary Table 2 RT-PCR primer sequences Gene Forward Reverse MAP4K4 GGGGAACGCTTCAGAGTGAG GTGCGGTCAGATCAGCAGG ICAM-1 TCTGTGTCCCCCTCAAAAGTC GGGGTCTCTATGCCCAACAA VCAM-1 ATGCCTGGGAAGATGGTCG GACGGAGTCACCAATCTGAGC SELE GATGAGAGGTGCAGCAAGAAG CTCACACTTGAGTCCACTGAAG RPLP CAGATTGGCTACCCAACTGTT GGGAAGGTGTAATCCGTCTCC GAPDH ATGTTCGTCATGGGTGTGAA GGTGCTAAGCAGTTGGTGGT CATCTCCAGGGAAATCCTCAGG TTCTGTAGTCGTAAGTGGCGTCTG Icam-1 GTGATGCTCAGGTATCCATCCA CACAGTTCTCAAAGCACAGCG Vcam-1 AGTTGGGGATTCGGTTGTTCT CCCCTCATTCCTTACCACCC Sele ATGAAGCCAGTGCATACTGTC CGGTGAATGTTTCAGATTGGAGT Selp CATCTGGTTCAGTGCTTTGATCT ACCCGTGAGTTATTCCATGAGT F4/8 CCCCAGTGTCCTTACAGAGTG GTGCCCAGAGTGGATGTCT Cd68 CCATCCTTCACGATGACACCT GGCAGGGTTATGAGTGACAGTT Ccl2 TTAAAAACCTGGATCGGAACCA GCATTAGCTTCAGATTTACGGGT A Cxcl1 CTGGGATTCACCTCAAGAACAT CAGGGTCAAGGCAAGCCTC C Ccl3 TTCTCTGTACCATGACACTCTGC CGTGGAATCTTCCGGCTGTAG Ccl4 TTCCTGCTGTTTCTCTTACACCT CTGTCTGCCTCTTTTGGTCAG Ccl5 TCGAGTGACAAACACGACTGC GCTGCTTTGCCTACCTCTCC Ccl7 GCTGCTTTCAGCATCCAAGTG CCAGGGACACCGACTACTG Cxcl9 TCCTTTTGGGCATCATCTTCC TTTGTAGTGGATCGTGCCTCG Cxcl1 CCAAGTGCTGCCGTCATTTTC GGCTCGCAGGGATGATTTCAA 36b4 TCCAGGCTTTGGGCATCA CTTTATCAGCTGCACATCACTCAGA VCAM-1 (ChIP hum) TCAGCATTGTCCTTTATCTTTCC AG ACTATTAACCCCTTCAGTTGCTCTC SELE (ChIP hum) CAAGAGACAGAGTTTCTGACAT CAT Sequences are mouse unless specified. TTTATAGGAGGGATTGCTTCCTGT G
9 Supplementary Table 3 Human clinical data Normal patient data Gender Age % Stenosis Male 84 N/A Male/Female (pool of 4) N/A Male 44 N/A Atherosclerosis Patient data Gender Age % Stenosis Male Female Male 85 Male Male 46 Unknown
Intracellular MHC class II molecules promote TLR-triggered innate. immune responses by maintaining Btk activation
 Intracellular MHC class II molecules promote TLR-triggered innate immune responses by maintaining Btk activation Xingguang Liu, Zhenzhen Zhan, Dong Li, Li Xu, Feng Ma, Peng Zhang, Hangping Yao and Xuetao
Stewart et al. CD36 ligands promote sterile inflammation through assembly of a TLR 4 and 6 heterodimer
 NFκB (fold induction) Stewart et al. ligands promote sterile inflammation through assembly of a TLR 4 and 6 heterodimer a. mrna (fold induction) 5 4 3 2 1 LDL oxldl Gro1a MIP-2 RANTES mrna (fold induction)
Quantitative Real-Time PCR was performed as same as Materials and Methods.
 Supplemental Material Quantitative Real-Time PCR Quantitative Real-Time PCR was performed as same as Materials and Methods. Expression levels in the aorta were normalized to peptidylprolyl isomerase B
Plasma exposure levels from individual mice 4 hours post IP administration at the
 Supplemental Figure Legends Figure S1. Plasma exposure levels of MKC-3946 in mice. Plasma exposure levels from individual mice 4 hours post IP administration at the indicated dose mg/kg. Data represent
2.5. AMPK activity
 Supplement Fig. A 3 B phos-ampk 2.5 * Control AICAR AMPK AMPK activity (Absorbance at 45 nm) 2.5.5 Control AICAR Supplement Fig. Effects of AICAR on AMPK activation in macrophages. J774. macrophages were
Supplementary Materials for
 www.sciencesignaling.org/cgi/content/full/8/389/ra79/dc1 Supplementary Materials for HDL-bound sphingosine 1-phosphate acts as a biased agonist for the endothelial cell receptor S1P 1 to limit vascular
Supplementary Figure S I: Effects of D4F on body weight and serum lipids in apoe -/- mice.
 Supplementary Figures: Supplementary Figure S I: Effects of D4F on body weight and serum lipids in apoe -/- mice. Male apoe -/- mice were fed a high-fat diet for 8 weeks, and given PBS (model group) or
Supplementary Figure 1
 Supplementary Figure 1 A B mir-141, human cell lines mir-2c, human cell lines mir-141, hepatocytes mir-2c, hepatocytes Relative RNA.1.8.6.4.2 Relative RNA.3.2.1 Relative RNA 1.5 1..5 Relative RNA 2. 1.5
Supplemental Figure 1. Western blot analysis indicated that MIF was detected in the fractions of
 Supplemental Figure Legends Supplemental Figure 1. Western blot analysis indicated that was detected in the fractions of plasma membrane and cytosol but not in nuclear fraction isolated from Pkd1 null
Suppl Video: Tumor cells (green) and monocytes (white) are seeded on a confluent endothelial
 and monocytes (white) are seeded on a confluent endothelial") Supplementary Information Häuselmann et al. Monocyte induction of E-selectin-mediated endothelial activation releases VE-cadherin junctions to promote tumor cell extravasation in the metastasis cascade
Supplementary Information Häuselmann et al. Monocyte induction of E-selectin-mediated endothelial activation releases VE-cadherin junctions to promote tumor cell extravasation in the metastasis cascade
Supplementary Information File
 Supplementary Information File Supplementary Table 1. List of synthesized sirna sequences for target genes sirna Species Sequence Ctrl sirna mouse sense 5 -UUCUCCGAACGUGUCACGUTT-3 Antisense 5 -ACGUGACACGUUCGGAGAATT-3
NK cells promote neutrophil recruitment in the brain during sepsisinduced. neuroinflammation
 NK cells promote neutrophil recruitment in the brain during sepsisinduced neuroinflammation Hao He 1, Tingting Geng 1, Piyun Chen 1, Meixiang Wang 1, Jingxia Hu 1, Li Kang 1, Wengang Song 1, * & Hua Tang
Integrin CD11b negatively regulates TLR-triggered inflammatory responses by. activating Syk and promoting MyD88 and TRIF degradation via cbl-b
 Integrin CD11b negatively regulates TLR-triggered inflammatory responses by activating Syk and promoting MyD88 and TRIF degradation via cbl-b Chaofeng Han, Jing Jin, Sheng Xu, Haibo Liu, Nan Li, and Xuetao
fig. S1 Gene silencing of LC3B by sirna enhances IL-1β secretion. Peritoneal
 15 Scramble sirna LC3B sirna IL-1β (pg/ml) 1 5 LC3B (kda) - 18 (LC3B I) - 16 (LC3B II) β-actin - 42 ( _ ) LPS LPS ATP fig. S1 Gene silencing of LC3B by sirna enhances IL-1β secretion. Peritoneal macrophages
MicroRNAs Modulate the Noncanonical NF- B Pathway by Regulating IKK Expression During Macrophage Differentiation
 MicroRNAs Modulate the Noncanonical NF- B Pathway by Regulating IKK Expression During Macrophage Differentiation Tao Li 1 *, Michael J. Morgan 1 *, Swati Choksi 1, Yan Zhang 1, You-Sun Kim 2#, Zheng-gang
Supplementary Materials for
 www.sciencesignaling.org/cgi/content/full/4/199/ra75/dc1 Supplementary Materials for Signaling by the Matrix Proteoglycan Decorin Controls Inflammation and Cancer Through PDCD4 and MicroRNA-21 Rosetta
Supplementary Information
 Supplementary Information Figure S1. Int6 gene silencing efficiency. (A) Western Blot analysis of Int6 expression at different times after sirna transfection. Int6 expression is strongly silenced in Int6
Supplementary Table 1. The primers used for quantitative RT-PCR. Gene name Forward (5 > 3 ) Reverse (5 > 3 )
 Reverse (5 > 3 )") 770 771 Supplementary Table 1. The primers used for quantitative RT-PCR. Gene name Forward (5 > 3 ) Reverse (5 > 3 ) Human CXCL1 GCGCCCAAACCGAAGTCATA ATGGGGGATGCAGGATTGAG PF4 CCCCACTGCCCAACTGATAG TTCTTGTACAGCGGGGCTTG
770 771 Supplementary Table 1. The primers used for quantitative RT-PCR. Gene name Forward (5 > 3 ) Reverse (5 > 3 ) Human CXCL1 GCGCCCAAACCGAAGTCATA ATGGGGGATGCAGGATTGAG PF4 CCCCACTGCCCAACTGATAG TTCTTGTACAGCGGGGCTTG
Supplementary fig. 1. Crystals induce necroptosis does not involve caspases, TNF receptor or NLRP3. A. Mouse tubular epithelial cells were pretreated
 Supplementary fig. 1. Crystals induce necroptosis does not involve caspases, TNF receptor or NLRP3. A. Mouse tubular epithelial cells were pretreated with zvad-fmk (10µM) and exposed to calcium oxalate
 DOI: 10.1038/ncb2210 b. ICAM1 ng ml -1 P = 0.0001 Small RNA (15-30nts) ng ml -1 Cell Lysate Exosome HDL Plasma HDL Normal Human HDL mirnas R = 0.45 P < 0.0001 Normal Human Exosome mirnas Figure S1. Characterization
Supplementary Material
 Supplementary Material accompanying the manuscript Interleukin 37 is a fundamental inhibitor of innate immunity Marcel F Nold, Claudia A Nold-Petry, Jarod A Zepp, Brent E Palmer, Philip Bufler & Charles
Supplementary Information. Protectin DX alleviates insulin resistance by activating a myokine-liver glucoregulatory axis.
 Supplementary Information Protectin DX alleviates insulin resistance by activating a myokine-liver glucoregulatory axis. Phillip J. White, Philippe St-Pierre, Alexandre Charbonneau, Patricia Mitchell,
Supplementary Materials for
 www.sciencesignaling.org/cgi/content/full/2/1/ra81/dc1 Supplementary Materials for Delivery of MicroRNA-126 by Apoptotic Bodies Induces CXCL12- Dependent Vascular Protection Alma Zernecke,* Kiril Bidzhekov,
Nature Neuroscience: doi: /nn Supplementary Figure 1
 Supplementary Figure 1 EGFR inhibition activates signaling pathways (a-b) EGFR inhibition activates signaling pathways (a) U251EGFR cells were treated with erlotinib (1µM) for the indicated times followed
Supplementary Figure 1 ITGB1 and ITGA11 increase with evidence for heterodimers following HSC activation. (a) Time course of rat HSC activation
 Time course of rat HSC activation") Supplementary Figure 1 ITGB1 and ITGA11 increase with evidence for heterodimers following HSC activation. (a) Time course of rat HSC activation indicated by the detection of -SMA and COL1 (log scale).
Supplementary Figure 1 ITGB1 and ITGA11 increase with evidence for heterodimers following HSC activation. (a) Time course of rat HSC activation indicated by the detection of -SMA and COL1 (log scale).
Gallic acid prevents isoproterenol-induced cardiac hypertrophy and fibrosis through regulation of JNK2 signaling and Smad3 binding activity
 Gallic acid prevents isoproterenol-induced cardiac hypertrophy and fibrosis through regulation of JNK2 signaling and Smad3 binding activity Yuhee Ryu 1,+, Li Jin 1,2+, Hae Jin Kee 1,, Zhe Hao Piao 3, Jae
University of Bristol - Explore Bristol Research
 Teasdale, J. E., Hazell, G. G. J., Peachey, A. M. G., Sala-Newby, G. B., Hindmarch, C. C. T., McKay, T. R.,... White, S. J. (2017). Cigarette smoke extract profoundly suppresses TNF-mediated proinflammatory
Supplemental Information. Human Carboxylesterase 2 Reverses. Obesity-Induced Diacylglycerol Accumulation. and Glucose Intolerance
 Cell Reports, Volume 18 Supplemental Information Human Carboxylesterase 2 Reverses Obesity-Induced Diacylglycerol Accumulation and Glucose Intolerance Maxwell A. Ruby, Julie Massart, Devon M. Hunerdosse,
Supplementary Figure 1. Confocal immunofluorescence showing mitochondrial translocation of Drp1. Cardiomyocytes treated with H 2 O 2 were prestained
 Supplementary Figure 1. Confocal immunofluorescence showing mitochondrial translocation of Drp1. Cardiomyocytes treated with H 2 O 2 were prestained with MitoTracker (red), then were immunostained with
MANUSCRIPT TITLE: Protein kinase C δ signaling is required for dietary prebiotic-induced strengthening of intestinal epithelial barrier function
 MANUSCRIPT TITLE: Protein kinase C δ signaling is required for dietary prebiotic-induced strengthening of intestinal epithelial barrier function Authors: Richard Y. Wu 1,2, Majd Abdullah 1, Pekka Määttänen
Endocannabinoid-activated Nlrp3 inflammasome in infiltrating macrophages mediates β- cell loss in type 2 diabetes
 Endocannabinoid-activated Nlrp3 inflammasome in infiltrating macrophages mediates β- cell loss in type 2 diabetes T Jourdan, G Godlewski, R Cinar, A Bertola, G Szanda, J Liu, J Tam, T Han, B Mukhopadhyay,
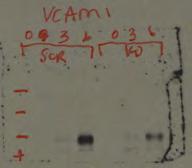
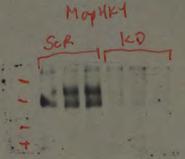
Supplementary figure 2. VCAM1 protein expression in static HCAECs exposed to CSE over 72 hours, with TNFα or TNFα + CSE positive controls.
 Supplementary data Cigarette smoke extract profoundly suppresses TNFα-mediated proinflammatory gene expression through upregulation of ATF3 in human coronary artery endothelial cells Jack E. Teasdale 1,
Supplementary Figure 1:
 Supplementary Figure 1: (A) Whole aortic cross-sections stained with Hematoxylin and Eosin (H&E), 7 days after porcine-pancreatic-elastase (PPE)-induced AAA compared to untreated, healthy control aortas
Supplementary Figure 1
 Supplementary Figure 1 Supplementary Figure 1 Schematic depiction of the tandem Fc GDF15. Supplementary Figure 2 Supplementary Figure 2 Gfral mrna levels in the brains of both wild-type and knockout Gfral
Supplementary Figure 1
 Supplementary Figure 1 Constitutive EGFR signaling does not activate canonical EGFR signals (a) U251EGFRInd cells with or without tetracycline exposure (24h, 1µg/ml) were treated with EGF for 15 minutes
p = formed with HCI-001 p = Relative # of blood vessels that formed with HCI-002 Control Bevacizumab + 17AAG Bevacizumab 17AAG
 A.. Relative # of ECs associated with HCI-001 1.4 1.2 1.0 0.8 0.6 0.4 0.2 0.0 ol b p < 0.001 Relative # of blood vessels that formed with HCI-001 1.4 1.2 1.0 0.8 0.6 0.4 0.2 0.0 l b p = 0.002 Control IHC:
Figure 1. Effects of FGF21 on adipose tissue. (A) Representative histological. findings of epididymal adipose tissue (B) mrna expression of
 Representative histological. findings of epididymal adipose tissue (B) mrna expression of") SUPPLEMENTAL MATERIAL EN-12-2276 Figure 1. Effects of FGF21 on adipose tissue. (A) Representative histological findings of epididymal adipose tissue (B) mrna expression of adipocytokines in adipose tissue.
SUPPLEMENTAL MATERIAL EN-12-2276 Figure 1. Effects of FGF21 on adipose tissue. (A) Representative histological findings of epididymal adipose tissue (B) mrna expression of adipocytokines in adipose tissue.
SUPPLEMENTARY FIGURES
 SUPPLEMENTARY FIGURES Figure S1. Effect of a HFD on the Acox gene expression in the livers of WT and IL-6 -/- mice. Expression of Acox in the livers of WT and IL-6 -/- mice fed STD or HFD determined through
Supplemental Figures:
 Supplemental Figures: Figure 1: Intracellular distribution of VWF by electron microscopy in human endothelial cells. a) Immunogold labeling of LC3 demonstrating an LC3-positive autophagosome (white arrow)
Supplemental Figure 1
 Supplemental Figure 1 1a 1c PD-1 MFI fold change 6 5 4 3 2 1 IL-1α IL-2 IL-4 IL-6 IL-1 IL-12 IL-13 IL-15 IL-17 IL-18 IL-21 IL-23 IFN-α Mut Human PD-1 promoter SBE-D 5 -GTCTG- -1.2kb SBE-P -CAGAC- -1.kb
Supplementary Figure 1 IMQ-Induced Mouse Model of Psoriasis. IMQ cream was
 Supplementary Figure 1 IMQ-Induced Mouse Model of Psoriasis. IMQ cream was painted on the shaved back skin of CBL/J and BALB/c mice for consecutive days. (a, b) Phenotypic presentation of mouse back skin
Supplementary Figure 1. Dynamic Response of WT and mir-21 -/- mice to caerulein. (a) Representative histological sections of mouse pancreas stained
 Representative histological sections of mouse pancreas stained") Supplementary Figure 1. Dynamic Response of WT and mir-21 -/- mice to caerulein. (a) Representative histological sections of mouse pancreas stained with hematoxylin from caerulein-treated WT and mir-21
Supplementary Figure 1. Dynamic Response of WT and mir-21 -/- mice to caerulein. (a) Representative histological sections of mouse pancreas stained with hematoxylin from caerulein-treated WT and mir-21
SUPPLEMENTARY INFORMATION
 Supplementary Figure 1. Behavioural effects of ketamine in non-stressed and stressed mice. Naive C57BL/6 adult male mice (n=10/group) were given a single dose of saline vehicle or ketamine (3.0 mg/kg,
Supplementary Figure 1 Role of Raf-1 in TLR2-Dectin-1-mediated cytokine expression
 Supplementary Figure 1 Supplementary Figure 1 Role of Raf-1 in TLR2-Dectin-1-mediated cytokine expression. Quantitative real-time PCR of indicated mrnas in DCs stimulated with TLR2-Dectin-1 agonist zymosan
Brain barriers control immune cell trafficking to the CNS. Britta Engelhardt Theodor Kocher Institute University of Bern - Switzerland
 Brain barriers control immune cell trafficking to the CNS Britta Engelhardt Theodor Kocher Institute University of Bern - Switzerland The brain barriers 2 The BBB establishes a physical and metabolic barrier
Protection against doxorubicin-induced myocardial dysfunction in mice by cardiac-specific expression of carboxyl terminus of hsp70-interacting protein
 Protection against doxorubicin-induced myocardial dysfunction in mice by cardiac-specific expression of carboxyl terminus of hsp70-interacting protein Lei Wang 1, Tian-Peng Zhang 1, Yuan Zhang 2, Hai-Lian
SUPPLEMENTARY INFORMATION
 DOI:.38/ncb3399 a b c d FSP DAPI 5mm mm 5mm 5mm e Correspond to melanoma in-situ Figure a DCT FSP- f MITF mm mm MlanaA melanoma in-situ DCT 5mm FSP- mm mm mm mm mm g melanoma in-situ MITF MlanaA mm mm
Supplementary Information Titles
 Journal: Nature Medicine Supplementary Information Titles Article Title: Corresponding Author: Authors: An inhibitor of the protein kinases /ε improves obesity- related metabolic dysfunctions Alan Saltiel
Supplementary Figures
 Supplementary Figures Supplementary Figure 1 DOT1L regulates the expression of epithelial and mesenchymal markers. (a) The expression levels and cellular localizations of EMT markers were confirmed by
Bezzi et al., Supplementary Figure 1 *** Nature Medicine: doi: /nm Pten pc-/- ;Zbtb7a pc-/- Pten pc-/- ;Pml pc-/- Pten pc-/- ;Trp53 pc-/-
 Gr-1 Gr-1 Gr-1 Bezzi et al., Supplementary Figure 1 a Gr1-CD11b 3 months Spleen T cells 3 months Spleen B cells 3 months Spleen Macrophages 3 months Spleen 15 4 8 6 c CD11b+/Gr1+ cells [%] 1 5 b T cells
Supplemental information
 Carcinoemryonic antigen-related cell adhesion molecule 6 (CEACAM6) promotes EGF receptor signaling of oral squamous cell carcinoma metastasis via the complex N-glycosylation y Chiang et al. Supplemental
Page 39 of 44. 8h LTA & AT h PepG & AT h LTA
 Page 39 of 44 Fig. S1 A: B: C: D: 8h LTA 8h LTA & AT7519 E: F: 8h PepG G: 8h PepG & AT7519 Fig. S1. AT7519 overrides the survival effects of lipoteichoic acid (LTA) and peptidoglycan (PepG). (A) Human
Supplemental Table 1. Primers used for RT-PCR analysis of inflammatory cytokines Gene Primer Sequence
 Supplemental Table 1. Primers used for RT-PCR analysis of inflammatory cytokines Gene Primer Sequence IL-1α Forward primer 5 -CAAGATGGCCAAAGTTCGTGAC-3' Reverse primer 5 -GTCTCATGAAGTGAGCCATAGC-3 IL-1β
Boucher et al NCOMMS B
 1 Supplementary Figure 1 (linked to Figure 1). mvegfr1 constitutively internalizes in endothelial cells. (a) Immunoblot of mflt1 from undifferentiated mouse embryonic stem (ES) cells with indicated genotypes;
Aspergillus fumigatus activates PAR-2 and skews toward a Th2 bias in airway epithelial cells.
 Aspergillus fumigatus activates PAR-2 and skews toward a Th2 bias in airway epithelial cells. Tetsuya Homma, Atsushi Kato, Bharat Bhushan, James E. Norton, Lydia A. Suh, Roderick G. Carter, Dave S. Gupta,
Supplemental Material:
 Supplemental Material: MATERIALS AND METHODS RNA interference Mouse CHOP sirna (ON-TARGETplus SMARTpool Cat# L-062068-00) and control sirna (ON-TARGETplus Control) were purchased from Dharmacon. Transfection
ANGPTL2 increases bone metastasis of breast cancer cells through. Tetsuro Masuda, Motoyoshi Endo, Yutaka Yamamoto, Haruki Odagiri, Tsuyoshi
 Masuda et al. Supplementary information for ANGPTL2 increases bone metastasis of breast cancer cells through enhancing CXCR4 signaling Tetsuro Masuda, Motoyoshi Endo, Yutaka Yamamoto, Haruki Odagiri, Tsuyoshi
Supplementary Figure 1. Expression of CUGBP1 in non-parenchymal liver cells treated with TGF-β
 Supplementary Figures Supplementary Figure 1. Expression of CUGBP1 in non-parenchymal liver cells treated with TGF-β and LPS. Non-parenchymal liver cells were isolated and treated with or without TGF-β
SUPPLEMENTARY INFORMATION
 Supplementary Table 1. Cell sphingolipids and S1P bound to endogenous TRAF2. Sphingolipid Cell pmol/mg TRAF2 immunoprecipitate pmol/mg Sphingomyelin 4200 ± 250 Not detected Monohexosylceramide 311 ± 18
Supplementary Table 2. Plasma lipid profiles in wild type and mutant female mice submitted to a HFD for 12 weeks wt ERα -/- AF-1 0 AF-2 0
 Supplementary Table 1. List of specific primers used for gene expression analysis. Genes Primer forward Primer reverse Hprt GCAGTACAGCCCCAAAATGG AACAAAGTCTGGCCTGTATCCA Srebp-1c GGAAGCTGTCGGGGTAGCGTC CATGTCTTCAAATGTGCAATCCAT
Supplementary Figure 1
 Supplementary Figure 1 YAP negatively regulates IFN- signaling. (a) Immunoblot analysis of Yap knockdown efficiency with sh-yap (#1 to #4 independent constructs) in Raw264.7 cells. (b) IFN- -Luc and PRDs
Supplementary Figure 1. PAQR3 knockdown inhibits SREBP-2 processing in CHO-7 cells CHO-7 cells were transfected with control sirna or a sirna
 Supplementary Figure 1. PAQR3 knockdown inhibits SREBP-2 processing in CHO-7 cells CHO-7 cells were transfected with control sirna or a sirna targeted for hamster PAQR3. At 24 h after the transfection,
Reduction of metastatic and angiogenic potency of malignant cancer by Eupatorium. fortunei via suppression of MMP-9 activity and VEGF production
 Supplementary Information Reduction of metastatic and angiogenic potency of malignant cancer by Eupatorium fortunei via suppression of MMP-9 activity and VEGF production Aeyung Kim, Minju Im, Nam-Hui Yim
S1a S1b S1c. S1d. S1f S1g S1h SUPPLEMENTARY FIGURE 1. - si sc Il17rd Il17ra bp. rig/s IL-17RD (ng) -100 IL-17RD
 -100 IL-17RD") SUPPLEMENTARY FIGURE 1 0 20 50 80 100 IL-17RD (ng) S1a S1b S1c IL-17RD β-actin kda S1d - si sc Il17rd Il17ra rig/s15-574 - 458-361 bp S1f S1g S1h S1i S1j Supplementary Figure 1. Knockdown of IL-17RD enhances
SUPPLEMENTARY FIGURE 1 0 20 50 80 100 IL-17RD (ng) S1a S1b S1c IL-17RD β-actin kda S1d - si sc Il17rd Il17ra rig/s15-574 - 458-361 bp S1f S1g S1h S1i S1j Supplementary Figure 1. Knockdown of IL-17RD enhances
ground and enzymatically digested or mechanically homogenized. The EVs or total vesicles were
 Supplementary Figure 1. Characterization of EVs from intestine. (a, b) Intestinal tissues were ground and enzymatically digested or mechanically homogenized. The EVs or total vesicles were isolated by
Supplemental Information
 Supplemental Information Tobacco-specific Carcinogen Induces DNA Methyltransferases 1 Accumulation through AKT/GSK3β/βTrCP/hnRNP-U in Mice and Lung Cancer patients Ruo-Kai Lin, 1 Yi-Shuan Hsieh, 2 Pinpin
NOD1 contributes to mouse host defense against Helicobacter pylori via induction of type I IFN and activation of the ISGF3 signaling pathway
 Research article NOD1 contributes to mouse host defense against Helicobacter pylori via induction of type I IFN and activation of the ISGF3 signaling pathway Tomohiro Watanabe, 1,2 Naoki Asano, 1 Stefan
Supplementary Figures for TSC1 controls macrophage polarization to prevent inflammatory disorder by Linnan Zhu et al
 Supplementary Figures for TSC1 controls macrophage polarization to prevent inflammatory disorder by Linnan Zhu et al Suppl. Fig. 1 Tissue DN C Proteins kd TSC1-17 TSC 1 loxp bp -48-285 ctin PEMs Neutrophils
Figures S1-S5, Figure Legends, Table S1 List of primers used in the study
 Insulin receptor alternative splicing is regulated by insulin signaling and modulates beta cell survival Pushkar Malakar,4, Lital Chartarifsky,4, Ayat Hija, Gil Leibowitz 3, Benjamin Glaser 3, Yuval Dor,
Supplementary table I. Real-time primers used in the study. The fold change was obtained by
 Supplementary table I. Real-time primers used in the study. The fold change was obtained by normalizing the gene expression number to those of HPRT, then comparing the samples to untreated or naive mice.
Nature Neuroscience: doi: /nn Supplementary Figure 1. PICALM expression in brain capillary endothelium in human brain and in mouse brain.
 Supplementary Figure 1 PICALM expression in brain capillary endothelium in human brain and in mouse brain. a, Double immunostaining for PICALM (red, left) and lectin positive endothelial profiles (blue,
SUPPLEMENTARY INFORMATION
 SUPPLEMENTARY INFORMATION doi:1.138/nature9814 a A SHARPIN FL B SHARPIN ΔNZF C SHARPIN T38L, F39V b His-SHARPIN FL -1xUb -2xUb -4xUb α-his c Linear 4xUb -SHARPIN FL -SHARPIN TF_LV -SHARPINΔNZF -SHARPIN
Supplementary Figure 1 Chemokine and chemokine receptor expression during muscle regeneration (a) Analysis of CR3CR1 mrna expression by real time-pcr
 Analysis of CR3CR1 mrna expression by real time-pcr") Supplementary Figure 1 Chemokine and chemokine receptor expression during muscle regeneration (a) Analysis of CR3CR1 mrna expression by real time-pcr at day 0, 1, 4, 10 and 21 post- muscle injury. (b)
Supplementary Figure 1 Chemokine and chemokine receptor expression during muscle regeneration (a) Analysis of CR3CR1 mrna expression by real time-pcr at day 0, 1, 4, 10 and 21 post- muscle injury. (b)
ZL ZDF ZDF + E2 *** Visceral (g) ZDF
 ZDF") Body Weight (g) 4 3 2 1 ** * ZL ZDF 6 8 1 12 14 16 Age (weeks) B * Sub-cutaneous (g) 16 12 8 4 ZL ZDF Visceral (g) 25 2 15 1 5 ZL ZDF Total fat pad weight (g) 4 3 2 1 ZDF ZL Supplemental Figure 1: Effect
Body Weight (g) 4 3 2 1 ** * ZL ZDF 6 8 1 12 14 16 Age (weeks) B * Sub-cutaneous (g) 16 12 8 4 ZL ZDF Visceral (g) 25 2 15 1 5 ZL ZDF Total fat pad weight (g) 4 3 2 1 ZDF ZL Supplemental Figure 1: Effect
Supplementary Information. Induction of human pancreatic beta cell replication by inhibitors of dual specificity tyrosine regulated kinase
 Journal: Nature Medicine Supplementary Information Induction of human pancreatic beta cell replication by inhibitors of dual specificity tyrosine regulated kinase 1,2 Peng Wang PhD, 1,2 Juan-Carlos Alvarez-Perez
Supplementary Figure S1. PTPN2 levels are not altered in proliferating CD8+ T cells. Lymph node (LN) CD8+ T cells from C57BL/6 mice were stained with
 CD8+ T cells from C57BL/6 mice were stained with") Supplementary Figure S1. PTPN2 levels are not altered in proliferating CD8+ T cells. Lymph node (LN) CD8+ T cells from C57BL/6 mice were stained with CFSE and stimulated with plate-bound α-cd3ε (10µg/ml)
Supplementary Figure S1. PTPN2 levels are not altered in proliferating CD8+ T cells. Lymph node (LN) CD8+ T cells from C57BL/6 mice were stained with CFSE and stimulated with plate-bound α-cd3ε (10µg/ml)
Dipeptidyl Peptidase-4 Inhibitor Increases Vascular Leakage in Retina through VE-cadherin. Phosphorylation
 Dipeptidyl Peptidase-4 Inhibitor Increases Vascular Leakage in Retina through VE-cadherin Phosphorylation Choon-Soo Lee, PhD, 1,2,4 * Yun Gi Kim, MD, 3 * Hyun-Jai Cho, MD, 1,2,3 Jonghanne Park, MD, 1,2,3
Supplementary Figure 1. DJ-1 modulates ROS concentration in mouse skeletal muscle.
 Supplementary Figure 1. DJ-1 modulates ROS concentration in mouse skeletal muscle. (a) mrna levels of Dj1 measured by quantitative RT-PCR in soleus, gastrocnemius (Gastroc.) and extensor digitorum longus
24 th November 2008 Glasgow eprints Service https://eprints.gla.ac.uk
 Ewart, M-A. and Kohlhaas, C.F. and Salt, I.P. (2008) Inhibition of tumor necrosis factor α stimulated monocyte adhesion to human aortic endothelial cells by AMP-activated protein kinase. Arteriosclerosis,
Targeting of the circadian clock via CK1δ/ε to improve glucose homeostasis in obesity
 Targeting of the circadian clock via CK1δ/ε to improve glucose homeostasis in obesity Peter S. Cunningham, Siobhán A. Ahern, Laura C. Smith, Carla S. da Silva Santos, Travis T. Wager and David A. Bechtold
HEK293FT cells were transiently transfected with reporters, N3-ICD construct and
 Supplementary Information Luciferase reporter assay HEK293FT cells were transiently transfected with reporters, N3-ICD construct and increased amounts of wild type or kinase inactive EGFR. Transfections
Supplementary Figure 1. Spatial distribution of LRP5 and β-catenin in intact cardiomyocytes. (a) and (b) Immunofluorescence staining of endogenous
 and (b) Immunofluorescence staining of endogenous") Supplementary Figure 1. Spatial distribution of LRP5 and β-catenin in intact cardiomyocytes. (a) and (b) Immunofluorescence staining of endogenous LRP5 in intact adult mouse ventricular myocytes (AMVMs)
Supplementary Figure 1. Spatial distribution of LRP5 and β-catenin in intact cardiomyocytes. (a) and (b) Immunofluorescence staining of endogenous LRP5 in intact adult mouse ventricular myocytes (AMVMs)
(A) Dose response curves of HMLE_shGFP (blue circle), HMLE_shEcad (red square),
 Dose response curves of HMLE_shGFP (blue circle), HMLE_shEcad (red square),") Supplementary Figures and Tables Figure S1. Validation of EMT-selective small molecules (A) Dose response curves of HMLE_shGFP (blue circle), HMLE_shEcad (red square), and HMLE_Twist (black diamond) cells
Supplementary Figures and Tables Figure S1. Validation of EMT-selective small molecules (A) Dose response curves of HMLE_shGFP (blue circle), HMLE_shEcad (red square), and HMLE_Twist (black diamond) cells
SUPPLEMENTARY MATERIAL
 SUPPLEMENTARY MATERIAL IL-1 signaling modulates activation of STAT transcription factors to antagonize retinoic acid signaling and control the T H 17 cell it reg cell balance Rajatava Basu 1,5, Sarah K.
Trim29 gene-targeting strategy. (a) Genotyping of wildtype mice (+/+), Trim29 heterozygous mice (+/ ) and homozygous mice ( / ).
 Genotyping of wildtype mice (+/+), Trim29 heterozygous mice (+/ ) and homozygous mice ( / ).") Supplementary Figure 1 Trim29 gene-targeting strategy. (a) Genotyping of wildtype mice (+/+), Trim29 heterozygous mice (+/ ) and homozygous mice ( / ). (b) Immunoblot analysis of TRIM29 in lung primary
Supplementary Figure 1 Trim29 gene-targeting strategy. (a) Genotyping of wildtype mice (+/+), Trim29 heterozygous mice (+/ ) and homozygous mice ( / ). (b) Immunoblot analysis of TRIM29 in lung primary
Department of Pharmaceutical Sciences, School of Pharmacy, Northeastern University, Boston, MA 02115, USA 2
 Pancreatic Cancer Cell Exosome-Mediated Macrophage Reprogramming and the Role of MicroRNAs 155 and 125b2 Transfection using Nanoparticle Delivery Systems Mei-Ju Su 1, Hibah Aldawsari 2, and Mansoor Amiji
Supplemental information
 Supplemental information PI(3)K p11δ controls the sucellular compartmentalization of TLR4 signaling and protects from endotoxic shock Ezra Aksoy, Salma Taoui, David Torres, Sandrine Delauve, Aderrahman
Mouse Glu-OC (undercarboxylated osteocalcin) and Gla-OC (carboxylated osteocalcin) levels were
 and Gla-OC (carboxylated osteocalcin) levels were") Supplemental Data Supplemental Materials and Methods Plasma measurements Mouse Glu-OC (undercarboxylated osteocalcin) and Gla-OC (carboxylated osteocalcin) levels were determined using ELISA kits according
Supplemental Data Supplemental Materials and Methods Plasma measurements Mouse Glu-OC (undercarboxylated osteocalcin) and Gla-OC (carboxylated osteocalcin) levels were determined using ELISA kits according
Supplemental Table 1. List of primers used for real time PCR.
 Supplemental Table 1. List of primers used for real time PCR. Primer Sequence Primer Sequence Mouse Pcsk9-F TTGCAGCAGCTGGGAACTT Mouse Scd1-F CATCATTCTCATGGTCCTGCT Mouse Pcsk9-R CCGACTGTGATGACCTCTGGA Mouse
GPR120 *** * * Liver BAT iwat ewat mwat Ileum Colon. UCP1 mrna ***
 a GPR120 GPR120 mrna/ppia mrna Arbitrary Units 150 100 50 Liver BAT iwat ewat mwat Ileum Colon b UCP1 mrna Fold induction 20 15 10 5 - camp camp SB202190 - - - H89 - - - - - GW7647 Supplementary Figure
(A) RT-PCR for components of the Shh/Gli pathway in normal fetus cell (MRC-5) and a
 RT-PCR for components of the Shh/Gli pathway in normal fetus cell (MRC-5) and a") Supplementary figure legends Supplementary Figure 1. Expression of Shh signaling components in a panel of gastric cancer. (A) RT-PCR for components of the Shh/Gli pathway in normal fetus cell (MRC-5) and
Supplementary figure legends Supplementary Figure 1. Expression of Shh signaling components in a panel of gastric cancer. (A) RT-PCR for components of the Shh/Gli pathway in normal fetus cell (MRC-5) and
Supplementary Data Table of Contents:
 Supplementary Data Table of Contents: - Supplementary Methods - Supplementary Figures S1(A-B) - Supplementary Figures S2 (A-B) - Supplementary Figures S3 - Supplementary Figures S4(A-B) - Supplementary
Supplementary Figure 1
 Supplementary Figure 1 6 HE-50 HE-116 E-1 HE-108 Supplementary Figure 1. Targeted drug response curves of endometrial cancer cells. Endometrial cancer cell lines were incubated with serial dilutions of
RAW264.7 cells stably expressing control shrna (Con) or GSK3b-specific shrna (sh-
 or GSK3b-specific shrna (sh-") 1 a b Supplementary Figure 1. Effects of GSK3b knockdown on poly I:C-induced cytokine production. RAW264.7 cells stably expressing control shrna (Con) or GSK3b-specific shrna (sh- GSK3b) were stimulated
1 a b Supplementary Figure 1. Effects of GSK3b knockdown on poly I:C-induced cytokine production. RAW264.7 cells stably expressing control shrna (Con) or GSK3b-specific shrna (sh- GSK3b) were stimulated
a Supplementary Figure 1 Celastrol Withaferin A Individual drugs
 Supplementary Figure 1 a 17 27 HSPA1A SLC7A11 HMOX1 GSTA1 DUSP4 GML CHAC1 CDKN1A GSTA4 CA6 BHLHE41 NR1D1 HSPB1 PTX3 HP NFKBIA VDR MVD HAS2 ANGPT1 WDR6 TGFB3 IDI1 VCAM1 H1F HMGCS1 CXCL5 STEAP4 NOS2 b Enrichment
Supplementary Figure 1: STAT3 suppresses Kras-induced lung tumorigenesis
 Supplementary Figure 1: STAT3 suppresses Kras-induced lung tumorigenesis (a) Immunohistochemical (IHC) analysis of tyrosine 705 phosphorylation status of STAT3 (P- STAT3) in tumors and stroma (all-time
SUPPLEMENTARY DATA. Supplementary Table 1. Primers used in qpcr
 Supplementary Table 1. Primers used in qpcr Gene forward primer (5'-3') reverse primer (5'-3') β-actin AGAGGGAAATCGTGCGTGAC CAATAGTGATGACCTGGCCGT Hif-p4h-2 CTGGGCAACTACAGGATAAAC GCGTCCCAGTCTTTATTTAGATA
Pharmacologic inhibition of histone demethylation as a therapy for pediatric brainstem glioma
 Supplementary information for: Pharmacologic inhibition of histone demethylation as a therapy for pediatric brainstem glioma Rintaro Hashizume 1, Noemi Andor 2, Yuichiro Ihara 2, Robin Lerner 2, Haiyun
Supplementary Figure 1. AdipoR1 silencing and overexpression controls. (a) Representative blots (upper and lower panels) showing the AdipoR1 protein
 Representative blots (upper and lower panels) showing the AdipoR1 protein") Supplementary Figure 1. AdipoR1 silencing and overexpression controls. (a) Representative blots (upper and lower panels) showing the AdipoR1 protein content relative to GAPDH in two independent experiments.
Supplementary Figure 1. AdipoR1 silencing and overexpression controls. (a) Representative blots (upper and lower panels) showing the AdipoR1 protein content relative to GAPDH in two independent experiments.
X P. Supplementary Figure 1. Nature Medicine: doi: /nm Nilotinib LSK LT-HSC. Cytoplasm. Cytoplasm. Nucleus. Nucleus
 a b c Supplementary Figure 1 c-kit-apc-eflu780 Lin-FITC Flt3-Linc-Kit-APC-eflu780 LSK Sca-1-PE-Cy7 d e f CD48-APC LT-HSC CD150-PerCP-cy5.5 g h i j Cytoplasm RCC1 X Exp 5 mir 126 SPRED1 SPRED1 RAN P SPRED1