Supplementary Figure 1.
|
|
|
- Patience Small
- 5 years ago
- Views:
Transcription

1 Supplementary Figure 1. Increased β cell mass and islet diameter in βtsc2 -/- mice up to 35 weeks A: Reconstruction of multiple anti-insulin immunofluorescence images showing differences in β cell mass between control and βtsc2 -/-, depending on age. B: Representative images of pancreatic islets isolated from 24 week old mice. C: Mean diameter of isolated islets in μm, represented as means per mice ± s.d. (n = 4), ***, P < D: Frequency distribution of islet diameter (24 weeks old mice), represented as mean per mice ± s.d. (n = 4).

2 Supplementary Figure 2. Accumulation of FoxO1 positive nuclei in Tsc2-shRNA MIN6 cells A: MIN6 cells growing in full medium with the presence or the absence of rapamycin 20 nm were subjected to western-blot. B: MIN6 cells were treated as in (A), and submitted to immunofluorescence with anti- FoxO1 antibody. Nuclei were visualized by DAPI staining and UV illumination. Representative confocal microscopy images are shown.
, densitometric quantification is shown, represented as")
3 Supplementary Figure 3. Accumulation of ubiquitin-protein aggregates in βtsc2 -/- islets A: Islet protein extracts were blotted with anti-ubiquitin antibody (P4D1), densitometric quantification is shown, represented as means ± s.d. (n = 2), *, P < B: Pancreatic sections were subjected to IHC with antiubiquitin FK2 antibody. Further incubation with anti-insulin antibodies was carried on to confirm β cell identity of positive stained regions, indicated with white arrows. C: Normal rabbit IgG was used as negative control for IHC.
.")
4 Supplementary Figure 4. Impaired autophagic response to glucose deprivation in βtsc2 -/- islets and tunicamycin treated Tsc2-shRNA MIN6 cells. A: MIN6 cells were subjected to tunicamycin 2 µg/ml stimulation during 20 h in the presence or absence of chloroquine (CQ, 10 µm). B: Isolated islets were stabilized overnight in RPMI 10% FBS and subsequently glucose starved during 20 h in the presence or absence of chloroquine 10 µm. Representative confocal microscopy images are shown. Quantification of LC3B positive puncta is shown, representing mean number per mice ± s.d (n = 3). C: Representative confocal microscopy image showing impaired LC3B puncta formation only in β cells of βtsc2 -/- islets D: Comparison of all experiments performed with LC3B puncta quantification, represented as number of punta/100 µm 2 or punta/cell. Statistically significant differences between control and βtsc2 -/- islets are indicated.scale bars represent 10 µm. *, P < 0.05, **, P < 0.01, ***, P <
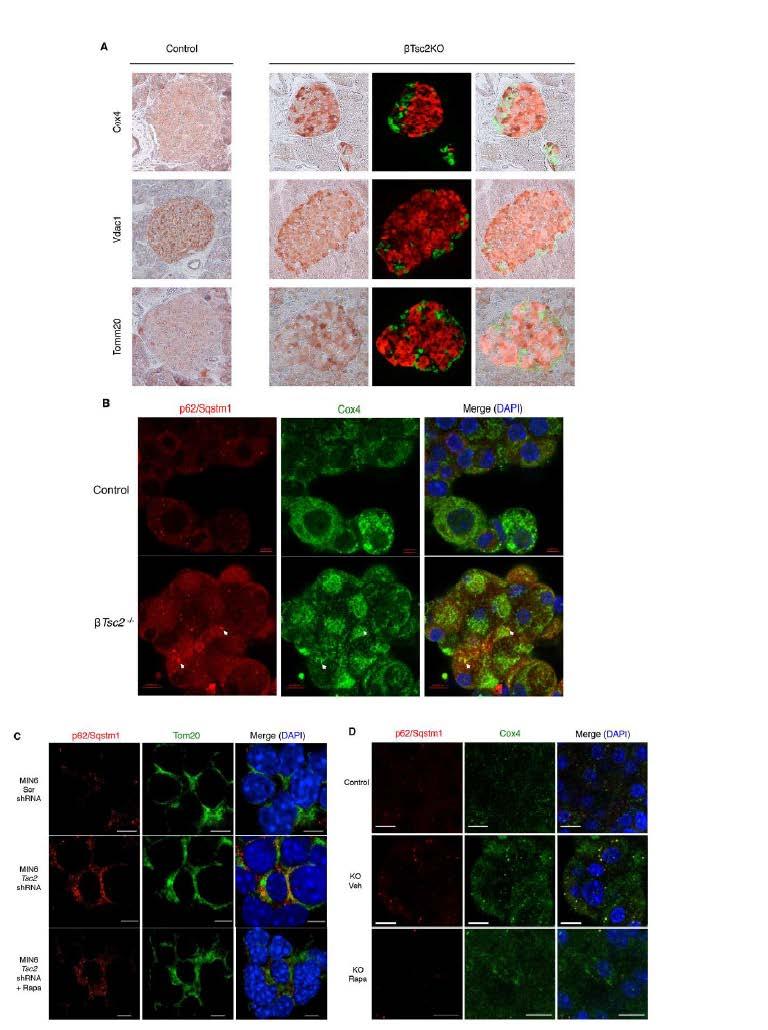
5 Supplementary Figure 5. Increased mitochondrial markers and accumulation of COX4/p62 positive structures in βtsc2 -/- islets A: Immunohistochemical analysis of pancreatic sections from 35 weeks old mice. Images show staining of mitochondrial proteins (COX4, TOM20, VDAC), increased in βtsc2 -/- islets. Further staining with anti-insulin (red) and anti-glucagon (green) was carried to assess identity of cells within the islet. B: Representative confocal microscopy immunofluorescence images of isolated islets (24-weeks old mice). Images show p62/sqstm1 (red) and COX4 (green) staining. Arrows indicate double positive structures. Nuclei were visualized by DAPI staining. C: Representative confocal microscope images from MIN6 cells stably expressing Tsc2 or scrambled shrna. 24 h rapamycin treatment was performed where indicated. D: Representative confocal microscopy immunofluorescence images of isolated islets (24-weeks old mice: Control, C; βtsc2 -/- vehicle treated, KO veh; βtsc2 -/- rapamycin treated, KO rapa). Images show p62/sqstm1 (red) and COX4 (green) Nuclei were visualized by DAPI staining (blue).
6

7 Supplementary Figure 6. Increased mitochondrial density and complexity in β cells of βtsc2 -/- mice Electron micrographs of pancreas embedded in epoxy resin from either 10-weeks or 35-weeks old control and βtsc2 -/- mice.

8 Supplementary Figure 7. Immunogold labeling A: Negative control (PBSG 1% BSA) B: Positive control (anti-insulin antibody) C: p62/sqstm labeling in 35-weeks old control mice. p62/sqstm seldom localizes in mitochondria, but often seen in autophagic vacuoles, or in cytoplasm. D: p62/sqstm labeling in 35-weeks old βtsc2 -/- mice. Boxed region is magnified in (E) p62/sqstm is frequently seen in mitochondria, particularly in membranes.
9 Supplementary Table 1. Antibodies. Akt Cell Signaling (#9272) P-Akt (Ser 474 ) Cell Signaling (#9271) ATF4 Santa Cruz (sc-200) β-actin (AC-74) Sigma-Aldrich (A5316) β-catenin Becton-Dickinson (610154) Bcl-2 Cell Signaling (#2876) BiP/Hspa5 (C50B12) Cell Signaling (#3177) Cleaved Caspase-3 Cell Signaling (#9661) Cebpb Santa Cruz (sc-150) CHOP/Ddit3 (B-3) Santa Cruz (sc-7351) Cox4 (3E11) Cell Signaling (#4850) Eif2a Cell Signaling (#9722) P-Eif2a (Ser 51 ) (119A11) Cell Signaling (#3597) P-Eif2ak3/PERK (Thr 981 ) Santa Cruz (sc-32577) FoxO1 (C29H4) Cell Signaling (#2880) P-FoxO1 (Thr 24 ) Cell Signaling (#9464) Glucagon Dako (A0565) Hsp60 Enzo Life Sci (SPA-807) Insulin Dako (A0564) LC3B Cell Signaling (#4108) Nitrotyrosine Merck-Millipore (06-284) p62/sqstm1 Progen (GP62) Pdx1 Merck-Millipore (07-696) S6 (5G10) Cell Signaling (#2217) P-S6 (Ser 235/236 ) Cell Signaling (#2211) Tom20 (F-10) Santa Cruz (sc-17764) Tom20 (FL-145) Santa Cruz (sc-11415) Tsc2 Cell Signaling (#3612) Ubiquitin (FK2) Enzo Life Sci (BML-PW0150) Ubiquitin (P4D1) Cell Signaling (#3936) VDAC Cell Signaling (#4866)
10 Supplementary Table 2. Oligonucleotides. Cloned into plko.1-neo 1.) For Tsc2 interference S: 5 -CCGGcccgatatgtgttctccaaCTCGAGttggagaacacatatcgggTTTTTG-3 AS: 5 -AATTCAAAAAcccgatatgtgttctccaaCTCGAGttggagaacacatatcggg-3 2.) Control (scrambled) S: 5 -CCGGcctaaggttaagtcgccctcgCTCGAGcgagggcgacttaaccttaggTTTTTG-3 AS: 5 -AATTCAAAAAcctaaggttaagtcgccctcgCTCGAGcgagggcgacttaaccttagg- 3 Nucleotides for the targeting region are displayed in lower case qpcr Cebpb Cyclophilin A Ddit3 Hspa5 S: 5 -ACCGGGTTTCGGGACTTGA-3 AS: 5 -GTTGCGTAGTCCCGTGTCCA-3 S: 5 - CAGACGCCACTGTCGCTTT-3 AS: 5 -TGTCTTTGGAACTTTGTCTGCAA-3 S: 5 -CCACCACACCTGAAAGCAGAA-3 AS: 5 -AGGTGAAAGGCAGGGACTCA-3 S: 5 -TGGAGTTCCCCAGATTGAAG-3 AS: 5 -CCTGACCCACCTTTTTCTCA-3 Genotyping Tsc2 loxp (ex. 3-4) S: 5 -GGTGTTGGAACTGAGCAGAT-3 AS: 5 -CAGCCTTGCCTGTATCTATG-3 Ins-Cre S: 5 - CCGCAGAACCTGAAGATGTTCGC -3 AS: 5 - CAGATTACGTATATCCTGGCAGCG -3
Supplementary Table 1. Characterization of HNSCC PDX models established at MSKCC
 Supplementary Table 1. Characterization of HNSCC PDX models established at MSKCC Supplementary Table 2. Drug content and loading efficiency estimated with F-NMR and UV- Vis Supplementary Table 3. Complete
Name Animal source Vendor Cat # Dilutions
 Supplementary data Table S1. Primary and Secondary antibody sources Devi et al, TXNIP in mitophagy A. Primary Antibodies Name Animal source Vendor Cat # Dilutions 1. TXNIP mouse MBL KO205-2 1:2000 (WB)
SUPPLEMENTARY DATA. Supplementary experimental procedures
 Supplementary experimental procedures Glucose tolerance, insulin secretion and insulin tolerance tests Glucose tolerance test (GTT) and glucose stimulated insulin secretion (GSIS) was measured in over-night
SUPPLEMENTARY INFORMATION. Supplementary Figures S1-S9. Supplementary Methods
 SUPPLEMENTARY INFORMATION SUMO1 modification of PTEN regulates tumorigenesis by controlling its association with the plasma membrane Jian Huang 1,2#, Jie Yan 1,2#, Jian Zhang 3#, Shiguo Zhu 1, Yanli Wang
Supplementary Figure 1. Validation of astrocytes. Primary astrocytes were
 Supplementary Figure 1. Validation of astrocytes. Primary astrocytes were separated from the glial cultures using a mild trypsinization protocol. Anti-glial fibrillary acidic protein (GFAP) immunofluorescent
Trehalose, sucrose and raffinose are novel activators of autophagy in human. keratinocytes through an mtor-independent pathway
 Title page Trehalose, sucrose and raffinose are novel activators of autophagy in human keratinocytes through an mtor-independent pathway Xu Chen 1*, Min Li 1*, Li Li 1, Song Xu 1, Dan Huang 1, Mei Ju 1,
A. Generation and characterization of Ras-expressing autophagycompetent
 Supplemental Material Supplemental Figure Legends Fig. S1 A. Generation and characterization of Ras-expressing autophagycompetent and -deficient cell lines. HA-tagged H-ras V12 was stably expressed in
marker. DAPI labels nuclei. Flies were 20 days old. Scale bar is 5 µm. Ctrl is
 Supplementary Figure 1. (a) Nos is detected in glial cells in both control and GFAP R79H transgenic flies (arrows), but not in deletion mutant Nos Δ15 animals. Repo is a glial cell marker. DAPI labels
Relative SOD1 activity. Relative SOD2 activity. Relative SOD activity (Infected:Mock) + CP + DDC
 + CP + DDC") Supplementary Figure 1. SOD1 activity is significantly increased relative to SOD1 levels. SOD1 and SOD2 activities in the infected mork13 cells are shown normalised to their corresponding levels and relative
Supplementary Figure 1. SOD1 activity is significantly increased relative to SOD1 levels. SOD1 and SOD2 activities in the infected mork13 cells are shown normalised to their corresponding levels and relative
(a) Significant biological processes (upper panel) and disease biomarkers (lower panel)
 Significant biological processes (upper panel) and disease biomarkers (lower panel)") Supplementary Figure 1. Functional enrichment analyses of secretomic proteins. (a) Significant biological processes (upper panel) and disease biomarkers (lower panel) 2 involved by hrab37-mediated secretory
Supplementary Figure 1. Functional enrichment analyses of secretomic proteins. (a) Significant biological processes (upper panel) and disease biomarkers (lower panel) 2 involved by hrab37-mediated secretory
Tumor suppressor Spred2 interaction with LC3 promotes autophagosome maturation and induces autophagy-dependent cell death
 www.impactjournals.com/oncotarget/ Oncotarget, Supplementary Materials 2016 Tumor suppressor Spred2 interaction with LC3 promotes autophagosome maturation and induces autophagy-dependent cell death Supplementary
Supplementary Figure 1
 Combination index (CI) Supplementary Figure 1 2. 1.5 1. Ishikawa AN3CA Nou-1 Hec-18.5...2.4.6.8 1. Fraction affected (Fa) Supplementary Figure 1. The synergistic effect of PARP inhibitor and PI3K inhibitor
PKCζ Promotes Breast Cancer Invasion by Regulating Expression of E-cadherin and Zonula Occludens-1 (ZO-1) via NFκB-p65
 via NFκB-p65") SUPPLEMENTARY INFORMATION TITLE: PKCζ Promotes Breast Cancer Invasion by Regulating Expression of E-cadherin and Zonula Occludens-1 (ZO-1) via NFκB-p65 RUNNING TITLE: PKCζ-NFκB Signaling in Breast Cancer
SUPPLEMENTARY INFORMATION TITLE: PKCζ Promotes Breast Cancer Invasion by Regulating Expression of E-cadherin and Zonula Occludens-1 (ZO-1) via NFκB-p65 RUNNING TITLE: PKCζ-NFκB Signaling in Breast Cancer
Supplemental Figures:
 Supplemental Figures: Figure 1: Intracellular distribution of VWF by electron microscopy in human endothelial cells. a) Immunogold labeling of LC3 demonstrating an LC3-positive autophagosome (white arrow)
F-actin VWF Vinculin. F-actin. Vinculin VWF
 a F-actin VWF Vinculin b F-actin VWF Vinculin Supplementary Fig. 1. WPBs in HUVECs are located along stress fibers and at focal adhesions. (a) Immunofluorescence images of f-actin (cyan), VWF (yellow),
Sestrin2 and BNIP3 (Bcl-2/adenovirus E1B 19kDa-interacting. protein3) regulate autophagy and mitophagy in renal tubular cells in. acute kidney injury
 regulate autophagy and mitophagy in renal tubular cells in. acute kidney injury") Sestrin2 and BNIP3 (Bcl-2/adenovirus E1B 19kDa-interacting protein3) regulate autophagy and mitophagy in renal tubular cells in acute kidney injury by Masayuki Ishihara 1, Madoka Urushido 2, Kazu Hamada
Sestrin2 and BNIP3 (Bcl-2/adenovirus E1B 19kDa-interacting protein3) regulate autophagy and mitophagy in renal tubular cells in acute kidney injury by Masayuki Ishihara 1, Madoka Urushido 2, Kazu Hamada
Supplementary Figure S1. Distinct compartmentalization of proinsulin in obese db/db mouse islet ß- cells.
 Supplementary Figure S1. Distinct compartmentalization of proinsulin in obese db/db mouse islet ß- cells. Pancreata from 16-weeks-old 6J +/+, 6J db/db, KS +/+ and KS db/db mice were harvested, fixed with
Loss of RhoA promotes skin tumor formation. Supplementary Figure 1. Loss of RhoA does not impair F-actin organization.
 Supplementary Figure Legends Supplementary Figure 1. Loss of RhoA does not impair F-actin organization. a. Representative IF images of F-actin staining of big and small control (left) and RhoA ko tumors
Supplementary Figure 1. Characterization of human carotid plaques. (a) Flash-frozen human plaques were separated into vulnerable (V) and stable (S),
 Flash-frozen human plaques were separated into vulnerable (V) and stable (S),") Supplementary Figure 1. Characterization of human carotid plaques. (a) Flash-frozen human plaques were separated into vulnerable (V) and stable (S), regions which were then quantified for mean fluorescence
Supplementary Figure 1. Characterization of human carotid plaques. (a) Flash-frozen human plaques were separated into vulnerable (V) and stable (S), regions which were then quantified for mean fluorescence
Programmed necrosis, not apoptosis, is a key mediator of cell loss and DAMP-mediated inflammation in dsrna-induced retinal degeneration
 Programmed necrosis, not apoptosis, is a key mediator of cell loss and DAMP-mediated inflammation in dsrna-induced retinal degeneration The Harvard community has made this article openly available. Please
Supporting Information
 Supporting Information Pang et al. 10.1073/pnas.1322009111 SI Materials and Methods ELISAs. These assays were performed as previously described (1). ELISA plates (MaxiSorp Nunc; Thermo Fisher Scientific)
Nature Structural & Molecular Biology: doi: /nsmb Supplementary Figure 1. Generation and validation of mtef4-knockout mice.
 Supplementary Figure 1 Generation and validation of mtef4-knockout mice. (a) Alignment of EF4 (E. coli) with mouse, yeast and human EF4. (b) Domain structures of mouse mtef4 compared to those of EF4 (E.
Supplementary Figure 1.
 Supplementary Figure 1. Visualization of endoplasmic reticulum-mitochondria interaction by in situ proximity ligation assay. A) Illustration of targeted proteins in mitochondria (M), endoplasmic reticulum
Supplemental Information
 Supplemental Information Tobacco-specific Carcinogen Induces DNA Methyltransferases 1 Accumulation through AKT/GSK3β/βTrCP/hnRNP-U in Mice and Lung Cancer patients Ruo-Kai Lin, 1 Yi-Shuan Hsieh, 2 Pinpin
Figure S1 (A) Comparison of body weight and blood glucose levels in male wild-type (WT) and Cre littermates. Mice were maintained on a normal chow
 Comparison of body weight and blood glucose levels in male wild-type (WT) and Cre littermates. Mice were maintained on a normal chow") Figure S1 (A) Comparison of body weight and blood glucose levels in male wild-type (WT) and Cre littermates. Mice were maintained on a normal chow diet (n = 7 per genotype). Body weight and fed blood glucose
Figure S1 (A) Comparison of body weight and blood glucose levels in male wild-type (WT) and Cre littermates. Mice were maintained on a normal chow diet (n = 7 per genotype). Body weight and fed blood glucose
Supplementary Figure 1.TRIM33 binds β-catenin in the nucleus. a & b, Co-IP of endogenous TRIM33 with β-catenin in HT-29 cells (a) and HEK 293T cells
 and HEK 293T cells") Supplementary Figure 1.TRIM33 binds β-catenin in the nucleus. a & b, Co-IP of endogenous TRIM33 with β-catenin in HT-29 cells (a) and HEK 293T cells (b). TRIM33 was immunoprecipitated, and the amount of
Supplementary Figure 1.TRIM33 binds β-catenin in the nucleus. a & b, Co-IP of endogenous TRIM33 with β-catenin in HT-29 cells (a) and HEK 293T cells (b). TRIM33 was immunoprecipitated, and the amount of
Appendix Table of Contents. 1. Appendix Figure legends S1-S13 and Appendix Table S1 and S2. 2. Appendix Figures S1-S13
 Appendix Table of Contents. Appendix Figure legends S-S3 and Appendix Table S and S. Appendix Figures S-S3 . Appendix Figure legends S-S3 and Appendix Table S and S Appendix Figure S. Western blot analysis
Endocannabinoid-activated Nlrp3 inflammasome in infiltrating macrophages mediates β- cell loss in type 2 diabetes
 Endocannabinoid-activated Nlrp3 inflammasome in infiltrating macrophages mediates β- cell loss in type 2 diabetes T Jourdan, G Godlewski, R Cinar, A Bertola, G Szanda, J Liu, J Tam, T Han, B Mukhopadhyay,
Supplementary Figure 1: Neuregulin 1 increases the growth of mammary organoids compared to EGF. (a) Mammary epithelial cells were freshly isolated,
 Mammary epithelial cells were freshly isolated,") 1 2 3 4 5 6 7 8 9 10 Supplementary Figure 1: Neuregulin 1 increases the growth of mammary organoids compared to EGF. (a) Mammary epithelial cells were freshly isolated, embedded in matrigel and exposed
1 2 3 4 5 6 7 8 9 10 Supplementary Figure 1: Neuregulin 1 increases the growth of mammary organoids compared to EGF. (a) Mammary epithelial cells were freshly isolated, embedded in matrigel and exposed
Supplemental Information. Autophagy in Oncogenic K-Ras. Promotes Basal Extrusion. of Epithelial Cells by Degrading S1P. Current Biology, Volume 24
 Current Biology, Volume 24 Supplemental Information Autophagy in Oncogenic K-Ras Promotes Basal Extrusion of Epithelial Cells by Degrading S1P Gloria Slattum, Yapeng Gu, Roger Sabbadini, and Jody Rosenblatt
P-Akt Thr308. T-Akt *** *** Anti-α3 IgG Ctrl
 P-Akt Thr38 P-Akt Thr38 Relative pakt (Thr38) expression (normalized to total Akt) Anti-α3 IgG Anti-α3 IgG V Fig. 1. 3 or 1 integrin blockade effects on Akt Thr38 phosphorylation. Western blotting analysis
McWilliams et al., http :// /cgi /content /full /jcb /DC1
 Supplemental material JCB McWilliams et al., http ://www.jcb.org /cgi /content /full /jcb.201603039 /DC1 THE JOURNAL OF CELL BIOLOGY Figure S1. In vitro characterization of mito-qc. (A and B) Analysis
SUPPLEMENTARY DATA. Supplementary Table 2. Antibodies used for Immunofluoresence. Supplementary Table 3. Real-time PCR primer sequences.
 Supplementary Table 2. Antibodies used for Immunofluoresence. Antibody Dilution Source Goat anti-pdx1 1:100 R&D Systems Rabbit anti-hnf6 1:100 Santa Cruz Biotechnology Mouse anti-nkx6.1 1:200 Developmental
Supplementary Table 1. Primer sequences for conventional RT-PCR on mouse islets
 Supplementary Table 1. Primer sequences for conventional RT-PCR on mouse islets Gene 5 Forward 3 5 Reverse 3.T. Product (bp) ( C) mnox1 GTTCTTGGGCTGCCTTGG GCTGGGGCGGCGG 60 300 mnoxa1 GCTTTGCCGCGTGC GGTTCGGGTCCTTTGTGC
SUPPLEMENTARY DATA. Supplementary Table 1. Primers used for PCR and qpcr Primer Name
 Supplementary Table. Primers used for PCR and qpcr Primer Name ccession Number Fwd Rev Type of PCR Cre NC_8 GGCGTCTTCCGC GTGCCCCTCGTTTG Standard PCR LoUcp CCGGGCTGTCTCCGCGG GGCTGTTCGCCCGGCC Standard PCR
Impact of Sox9 Dosage and Hes1-mediated Notch Signaling in Controlling the Plasticity of Adult Pancreatic Duct Cells in Mice
 Impact of Sox9 Dosage and Hes1-mediated Notch Signaling in Controlling the Plasticity of Adult Pancreatic Duct Cells in Mice Shinichi Hosokawa 1,3,Kenichiro Furuyama 1,3, Masashi Horiguchi 1,3,Yoshiki
Supplementary Figure 1: Hsp60 / IEC mice are embryonically lethal (A) Light microscopic pictures show mouse embryos at developmental stage E12.
 Light microscopic pictures show mouse embryos at developmental stage E12.") Supplementary Figure 1: Hsp60 / IEC mice are embryonically lethal (A) Light microscopic pictures show mouse embryos at developmental stage E12.5 and E13.5 prepared from uteri of dams and subsequently genotyped.
Supplementary Figure 1: Hsp60 / IEC mice are embryonically lethal (A) Light microscopic pictures show mouse embryos at developmental stage E12.5 and E13.5 prepared from uteri of dams and subsequently genotyped.
Supplementary figure legends
 Supplementary figure legends Supplementary Figure 1. Exposure of CRT occurs independently from the apoptosisassociated loss of the mitochondrial membrane potential (MMP). (A) HeLa cells treated with MTX
Supplementary Figure 1
 Supplementary Figure 1 Control Pancreatitis Supplementary Figure 2 A Panc Liver SI Spleen H 2 O B EZH2 fl/fl C EZH2 fl/fl 37bp EZH2 ERK2 D E 5 EZH2 fl/fl Fasting Glucose (mg/dl) 2 18 16 14 12 1 8 6 4 2
Supporting Information
 Supporting Information Fujishita et al. 10.1073/pnas.0800041105 SI Text Polyp Scoring. Intestinal polyps were counted as described (1). Briefly, the small and large intestines were excised, washed with
SUPPLEMENTARY FIGURES
 SUPPLEMENTARY FIGURES 1 Supplementary Figure 1, Adult hippocampal QNPs and TAPs uniformly express REST a-b) Confocal images of adult hippocampal mouse sections showing GFAP (green), Sox2 (red), and REST
SUPPLEMENTARY INFORMATION
 Supplementary Figures Supplementary Figure S1. Binding of full-length OGT and deletion mutants to PIP strips (Echelon Biosciences). Supplementary Figure S2. Binding of the OGT (919-1036) fragments with
Supplementary Figure 1. Blood glucose and insulin levels in mice during 4-day infusion.
 Supplementary Figure 1. Blood glucose and insulin levels in mice during 4-day infusion. (A-B) WT and HT mice infused with saline or glucose had overlapping achieved blood glucose and insulin levels, necessitating
Supplementary Figure 1
 VO (ml kg - min - ) VCO (ml kg - min - ) Respiratory exchange ratio Energy expenditure (cal kg - min - ) Locomotor activity (x count) Body temperature ( C) Relative mrna expression TA Sol EDL PT Heart
perk/erk STAT5B
 pakt/akt relative to saline (fold).5.5.5 control perk/erk relative to saline (fold).6.4..8.6.4. p=.6 control db/+ Hsp6 VDAC Hsp6/VDAC (relative to db/+) 8 6 4 db/+ C db/+ Hsp6 Hsp6/actin (relative to db/+)
hexahistidine tagged GRP78 devoid of the KDEL motif (GRP78-His) on SDS-PAGE. This
 on SDS-PAGE. This") SUPPLEMENTAL FIGURE LEGEND Fig. S1. Generation and characterization of. (A) Coomassie staining of soluble hexahistidine tagged GRP78 devoid of the KDEL motif (GRP78-His) on SDS-PAGE. This protein was expressed
SUPPLEMENTAL FIGURE LEGEND Fig. S1. Generation and characterization of. (A) Coomassie staining of soluble hexahistidine tagged GRP78 devoid of the KDEL motif (GRP78-His) on SDS-PAGE. This protein was expressed
(A) RT-PCR for components of the Shh/Gli pathway in normal fetus cell (MRC-5) and a
 RT-PCR for components of the Shh/Gli pathway in normal fetus cell (MRC-5) and a") Supplementary figure legends Supplementary Figure 1. Expression of Shh signaling components in a panel of gastric cancer. (A) RT-PCR for components of the Shh/Gli pathway in normal fetus cell (MRC-5) and
Supplementary figure legends Supplementary Figure 1. Expression of Shh signaling components in a panel of gastric cancer. (A) RT-PCR for components of the Shh/Gli pathway in normal fetus cell (MRC-5) and
Supplementary Materials for
 www.sciencesignaling.org/cgi/content/full/8/366/ra25/dc1 Supplementary Materials for Viral entry route determines how human plasmacytoid dendritic cells produce type I interferons Daniela Bruni, Maxime
SUPPLEMENTARY INFORMATION
 Figure S1 Induction of non-apoptotic death of SV40-transformed and primary DKO MEFs, and DKO thymocytes. (A-F) STS-induced non-apoptotic death of DKO MEF. (A, B) Reduced viability of DKO MEFs after exposure
JCB. Supplemental material. Gu et al.,
 Supplemental material Gu et al., http://www.jcb.org/cgi/content/full/jcb.201010075/dc1 T H E J O U R N A L O F C E L L B I O L O G Y Figure S1. S1P directly induces actin assembly. Actin assembly at the
Fang et al. NMuMG. PyVmT unstained Anti-CCR2-PE MDA-MB MCF MCF10A
 A NMuMG PyVmT 16.5+.5 47.+7.2 Fang et al. unstained Anti-CCR2-PE 4T1 Control 37.6+6.3 56.1+.65 MCF1A 16.1+3. MCF-7 3.1+5.4 MDA-M-231 42.1+5.5 unstained Secondary antibody only Anti-CCR2 SUPPLEMENTAL FIGURE
SUPPLEMENTARY INFORMATION
 SUPPLEMENTARY INFORMATION Supplementary Figure 1. The expression of ephrin-b2 H2BGFP persists in the post-hearingonset organ of Corti and is specifically restricted to supporting cells. Sox2 immunolabeling
Fig. S4. Current-voltage relations of iglurs. A-C: time courses of currents evoked by 100 ms pulses
 Fig. S1. Immunohistochemical detection of iglur2 protein in single islet cells. A: α cells identified using glucagon-specific antibody express the iglur2 subtype of AMPA receptor. 24 out of 26 identified
Supplementary Figure 1. EC-specific Deletion of Snail1 Does Not Affect EC Apoptosis. (a,b) Cryo-sections of WT (a) and Snail1 LOF (b) embryos at
 Cryo-sections of WT (a) and Snail1 LOF (b) embryos at") Supplementary Figure 1. EC-specific Deletion of Snail1 Does Not Affect EC Apoptosis. (a,b) Cryo-sections of WT (a) and Snail1 LOF (b) embryos at E10.5 were double-stained for TUNEL (red) and PECAM-1 (green).
Supplementary Figure 1. EC-specific Deletion of Snail1 Does Not Affect EC Apoptosis. (a,b) Cryo-sections of WT (a) and Snail1 LOF (b) embryos at E10.5 were double-stained for TUNEL (red) and PECAM-1 (green).
SUPPLEMENTARY INFORMATION
 DOI:.38/ncb2822 a MTC02 FAO cells EEA1 b +/+ MEFs /DAPI -/- MEFs /DAPI -/- MEFs //DAPI c HEK 293 cells WCE N M C P AKT TBC1D7 Lamin A/C EEA1 VDAC d HeLa cells WCE N M C P AKT Lamin A/C EEA1 VDAC Figure
(A) PCR primers (arrows) designed to distinguish wild type (P1+P2), targeted (P1+P2) and excised (P1+P3)14-
 PCR primers (arrows) designed to distinguish wild type (P1+P2), targeted (P1+P2) and excised (P1+P3)14-") 1 Supplemental Figure Legends Figure S1. Mammary tumors of ErbB2 KI mice with 14-3-3σ ablation have elevated ErbB2 transcript levels and cell proliferation (A) PCR primers (arrows) designed to distinguish
1 Supplemental Figure Legends Figure S1. Mammary tumors of ErbB2 KI mice with 14-3-3σ ablation have elevated ErbB2 transcript levels and cell proliferation (A) PCR primers (arrows) designed to distinguish
TFEB-mediated increase in peripheral lysosomes regulates. Store Operated Calcium Entry
 TFEB-mediated increase in peripheral lysosomes regulates Store Operated Calcium Entry Luigi Sbano, Massimo Bonora, Saverio Marchi, Federica Baldassari, Diego L. Medina, Andrea Ballabio, Carlotta Giorgi
SUPPLEMENTARY INFORMATION
 DOI:.38/ncb3399 a b c d FSP DAPI 5mm mm 5mm 5mm e Correspond to melanoma in-situ Figure a DCT FSP- f MITF mm mm MlanaA melanoma in-situ DCT 5mm FSP- mm mm mm mm mm g melanoma in-situ MITF MlanaA mm mm
LPS LPS P6 - + Supplementary Fig. 1.
 P6 LPS - - - + + + - LPS + + - - P6 + Supplementary Fig. 1. Pharmacological inhibition of the JAK/STAT blocks LPS-induced HMGB1 nuclear translocation. RAW 267.4 cells were stimulated with LPS in the absence
GFP-LC3 +/+ CLU -/- kda CLU GFP. Actin. GFP-LC3 +/+ CLU -/- kda CLU GFP. Actin
 Supplementary Fig. 1 a CQ treatment ScrB OGX11 MG132 I II AZD5363 I II b GFP / / GFP / / GFP / / GFP / / GFP GFP Actin Actin ctrl CQ GFP / / GFP / / GFP / / GFP / / GFP GFP Actin Actin rapamycin rapamycincq
Supplementary Figures
 Supplementary Figures Supplementary Figure 1 Characterization of stable expression of GlucB and sshbira in the CT26 cell line (a) Live cell imaging of stable CT26 cells expressing green fluorescent protein
Supplementary Materials
 Supplementary Materials Figure S1. MTT Cell viability assay. To measure the cytotoxic potential of the oxidative treatment, the MTT [3-(4,5-dimethylthiazol- 2-yl)-2,5-diphenyl tetrazolium bromide] assay
c Ischemia (30 min) Reperfusion (8 w) Supplementary Figure bp 300 bp Ischemia (30 min) Reperfusion (4 h) Dox 20 mg/kg i.p.
 Reperfusion (8 w) Supplementary Figure bp 300 bp Ischemia (30 min) Reperfusion (4 h) Dox 20 mg/kg i.p.") a Marker Ripk3 +/ 5 bp 3 bp b Ischemia (3 min) Reperfusion (4 h) d 2 mg/kg i.p. 1 w 5 w Sacrifice for IF size A subset for echocardiography and morphological analysis c Ischemia (3 min) Reperfusion (8
a Marker Ripk3 +/ 5 bp 3 bp b Ischemia (3 min) Reperfusion (4 h) d 2 mg/kg i.p. 1 w 5 w Sacrifice for IF size A subset for echocardiography and morphological analysis c Ischemia (3 min) Reperfusion (8
Leucine Deprivation Reveals a Targetable Liability
 Cancer Cell, 19 Supplemental Information Defective Regulation of Autophagy upon Leucine Deprivation Reveals a Targetable Liability of Human Melanoma Cells In Vitro and In Vivo Joon-Ho Sheen, Roberto Zoncu,
Supplementary Figure 1
 Supplementary Figure 1 AAV-GFP injection in the MEC of the mouse brain C57Bl/6 mice at 4 months of age were injected with AAV-GFP into the MEC and sacrificed at 7 days post injection (dpi). (a) Brains
Proteomic profiling of small-molecule inhibitors reveals dispensability of MTH1 for cancer cell survival
 Supplementary Information for Proteomic profiling of small-molecule inhibitors reveals dispensability of MTH1 for cancer cell survival Tatsuro Kawamura 1, Makoto Kawatani 1, Makoto Muroi, Yasumitsu Kondoh,
Supplementary Figure 1
 Supplementary Figure 1 a Percent of body weight! (%) 4! 3! 1! Epididymal fat Subcutaneous fat Liver SD Percent of body weight! (%) ** 3! 1! SD Percent of body weight! (%) 6! 4! SD ** b Blood glucose (mg/dl)!
Rescue of mutant rhodopsin traffic by metformin-induced AMPK activation accelerates photoreceptor degeneration Athanasiou et al
 Supplementary Material Rescue of mutant rhodopsin traffic by metformin-induced AMPK activation accelerates photoreceptor degeneration Athanasiou et al Supplementary Figure 1. AICAR improves P23H rod opsin
Supplementary Figure (OH) 22 nanoparticles did not affect cell viability and apoposis. MDA-MB-231, MCF-7, MCF-10A and BT549 cells were
 22 nanoparticles did not affect cell viability and apoposis. MDA-MB-231, MCF-7, MCF-10A and BT549 cells were") Supplementary Figure 1. Gd@C 82 (OH) 22 nanoparticles did not affect cell viability and apoposis. MDA-MB-231, MCF-7, MCF-10A and BT549 cells were treated with PBS, Gd@C 82 (OH) 22, C 60 (OH) 22 or GdCl
Supplementary Figure 1. Gd@C 82 (OH) 22 nanoparticles did not affect cell viability and apoposis. MDA-MB-231, MCF-7, MCF-10A and BT549 cells were treated with PBS, Gd@C 82 (OH) 22, C 60 (OH) 22 or GdCl
SUPPLEMENTARY FIGURES AND TABLE
 SUPPLEMENTARY FIGURES AND TABLE Supplementary Figure S1: Characterization of IRE1α mutants. A. U87-LUC cells were transduced with the lentiviral vector containing the GFP sequence (U87-LUC Tet-ON GFP).
Supplementary Table 1. The primers used for quantitative RT-PCR. Gene name Forward (5 > 3 ) Reverse (5 > 3 )
 Reverse (5 > 3 )") 770 771 Supplementary Table 1. The primers used for quantitative RT-PCR. Gene name Forward (5 > 3 ) Reverse (5 > 3 ) Human CXCL1 GCGCCCAAACCGAAGTCATA ATGGGGGATGCAGGATTGAG PF4 CCCCACTGCCCAACTGATAG TTCTTGTACAGCGGGGCTTG
770 771 Supplementary Table 1. The primers used for quantitative RT-PCR. Gene name Forward (5 > 3 ) Reverse (5 > 3 ) Human CXCL1 GCGCCCAAACCGAAGTCATA ATGGGGGATGCAGGATTGAG PF4 CCCCACTGCCCAACTGATAG TTCTTGTACAGCGGGGCTTG
Supplementary Table 1. Antibodies and dilutions used in the immunohistochemical study
 Supplementary Table 1. Antibodies and dilutions used in the immunohistochemical study Antigen Species Clone Source Dilution Insulin Guinea pig - Dako, Carpinteria, 1:200 Glucagon Rabbit - Dako, Carpinteria,
Figure S1. Effect of bafilomycin on EGF-induced Akt and Erk signaling. Effect of chloroquine on EGF-stimulated mtorc1, Akt and Erk
 EGF induced VATPase assembly and mtorc1 activation Supplemental Information Supplemental Figure Legends Figure S1. Effect of bafilomycin on EGFinduced Akt and Erk signaling. A. Hepatocytes were treated
Supplementary Figure 1: si-craf but not si-braf sensitizes tumor cells to radiation.
 Supplementary Figure 1: si-craf but not si-braf sensitizes tumor cells to radiation. (a) Embryonic fibroblasts isolated from wildtype (WT), BRAF -/-, or CRAF -/- mice were irradiated (6 Gy) and DNA damage
Mitosis. Single Nano Micro Milli Macro. Primary. PCNA expression
 a b c DAPI YFP CC3 DAPI YFP PCNA DAPI YFP ph3 DAPI YFP KI67 e 6 Mitosis f 1 PCNA expression %ph3 + /YFP + n= 63 87 61 3 13 8 n= 15 3 9 1 5 %PCNA+/YFP+ 8 6 Supplementary Figure 1. Proliferation/apoptosis
Diabetic pdx1-mutant zebrafish show conserved responses to nutrient overload and anti-glycemic treatment
 Supplementary Information Diabetic pdx1-mutant zebrafish show conserved responses to nutrient overload and anti-glycemic treatment Robin A. Kimmel, Stefan Dobler, Nicole Schmitner, Tanja Walsen, Julia
Supplementary Fig. 1. GPRC5A post-transcriptionally down-regulates EGFR expression. (a) Plot of the changes in steady state mrna levels versus
 Plot of the changes in steady state mrna levels versus") Supplementary Fig. 1. GPRC5A post-transcriptionally down-regulates EGFR expression. (a) Plot of the changes in steady state mrna levels versus changes in corresponding proteins between wild type and Gprc5a-/-
Supplementary Fig. 1. GPRC5A post-transcriptionally down-regulates EGFR expression. (a) Plot of the changes in steady state mrna levels versus changes in corresponding proteins between wild type and Gprc5a-/-
Supplementary Figure 1
 Supplementary Figure 1 The average sigmoid parametric curves of capillary dilation time courses and average time to 50% peak capillary diameter dilation computed from individual capillary responses averaged
p = formed with HCI-001 p = Relative # of blood vessels that formed with HCI-002 Control Bevacizumab + 17AAG Bevacizumab 17AAG
 A.. Relative # of ECs associated with HCI-001 1.4 1.2 1.0 0.8 0.6 0.4 0.2 0.0 ol b p < 0.001 Relative # of blood vessels that formed with HCI-001 1.4 1.2 1.0 0.8 0.6 0.4 0.2 0.0 l b p = 0.002 Control IHC:
Supplementary Figure 1. A. Bar graph representing the expression levels of the 19 indicated genes in the microarrays analyses comparing human lung
 Supplementary Figure 1. A. Bar graph representing the expression levels of the 19 indicated genes in the microarrays analyses comparing human lung immortalized broncho-epithelial cells (AALE cells) expressing
Supplementary Figure 1 Cell line TRIB2 status. Supplementary Figure 2 TRIB2 status has no impact on the cell cycle after PI3K inhibition. a. b.
 Supplementary Figure 1 Cell line TRIB2 status. TRIB2 protein expression to determine endogenous expression and to determine the effectiveness of each of our TRIB2 knockdown constructs. Supplementary Figure
Human recombinat MIF protein (hrmif), MW: Da. m/z. hrmif ( Da) + 4-IPP (282 Da) MWtot ~ Da. m/z.
, MW: Da. m/z. hrmif ( Da) + 4-IPP (282 Da) MWtot ~ Da. m/z.") Intensity % Intensity % A Human recombinat MIF protein (hrmif), MW: 12428.31 Da m/z hrmif (12428.31 Da) + 4-IPP (282 Da) MWtot ~ 12715.21 Da m/z B HTC/C3 DAPI phistone-h3 Merge HTC/C3 DAPI phistone-h3
Intensity % Intensity % A Human recombinat MIF protein (hrmif), MW: 12428.31 Da m/z hrmif (12428.31 Da) + 4-IPP (282 Da) MWtot ~ 12715.21 Da m/z B HTC/C3 DAPI phistone-h3 Merge HTC/C3 DAPI phistone-h3
Supplementary Information
 Supplementary Information GADD34-deficient mice develop obesity, nonalcoholic fatty liver disease, hepatic carcinoma and insulin resistance Naomi Nishio and Ken-ichi Isobe Department of Immunology, Nagoya
Nature Immunology: doi: /ni eee Supplementary Figure 1
 eee Supplementary Figure 1 Hyphae induce NET release, but yeast do not. (a) NET release by human peripheral neutrophils stimulated with a hgc1 yeast-locked C. albicans mutant (yeast) or pre-formed WT C.
Supplemental Information. Increased 4E-BP1 Expression Protects. against Diet-Induced Obesity and Insulin. Resistance in Male Mice
 Cell Reports, Volume 16 Supplemental Information Increased 4E-BP1 Expression Protects against Diet-Induced Obesity and Insulin Resistance in Male Mice Shih-Yin Tsai, Ariana A. Rodriguez, Somasish G. Dastidar,
SUPPLEMENTARY INFORMATION
 doi:10.1038/nature12652 Supplementary Figure 1. PRDM16 interacts with endogenous EHMT1 in brown adipocytes. Immunoprecipitation of PRDM16 complex by flag antibody (M2) followed by Western blot analysis
islets scored 1 week month months
 Supplementary Table 1. Sampling parameters for the morphometrical analyses Time (post- DT) Control mice (age-matched) α-cells mice pancreatic surface (mm 2 ) scored DT-treated mice islets scored mice pancreatic
Title: Smooth muscle cell-specific Tgfbr1 deficiency promotes aortic aneurysm formation by stimulating multiple signaling events
 Title: Smooth muscle cell-specific Tgfbr1 deficiency promotes aortic aneurysm formation by stimulating multiple signaling events Pu Yang 1, 3, radley M. Schmit 1, Chunhua Fu 1, Kenneth DeSart 1, S. Paul
AP VP DLP H&E. p-akt DLP
 A B AP VP DLP H&E AP AP VP DLP p-akt wild-type prostate PTEN-null prostate Supplementary Fig. 1. Targeted deletion of PTEN in prostate epithelium resulted in HG-PIN in all three lobes. (A) The anatomy
TRAF6 ubiquitinates TGFβ type I receptor to promote its cleavage and nuclear translocation in cancer
 Supplementary Information TRAF6 ubiquitinates TGFβ type I receptor to promote its cleavage and nuclear translocation in cancer Yabing Mu, Reshma Sundar, Noopur Thakur, Maria Ekman, Shyam Kumar Gudey, Mariya
Kaul 1. Kaul et al _Inventory of Supplemental Materials. Supplemental Figures and Figure Legends. Figure S1, related to Figure 1
 Kaul 1 Kaul et al _Inventory of Supplemental Materials Supplemental Figures and Figure Legends Figure S1, related to Figure 1 Figure S2, related to Figure 2 Figure S3, related to Figure 3 Figure S4, related
Dynamic Interaction of Stress Granule, DDX3X and IKK-α Mediates Multiple Functions in
 Dynamic Interaction of Stress Granule, and Mediates Multiple Functions in Hepatitis C Virus Infection Véronique Pène, Qisheng Li#, Catherine Sodroski, Ching-Sheng Hsu, T. Jake Liang# Liver Diseases Branch,
Supplementary Figure S1 Supplementary Figure S2
 Supplementary Figure S A) The blots shown in Figure B were qualified by using Gel-Pro analyzer software (Rockville, MD, USA). The ratio of LC3II/LC3I to actin was then calculated. The data are represented
Bone marrow-derived mesenchymal stem cells improve diabetes-induced cognitive impairment by
 Nakano et al. Supplementary information 1. Supplementary Figure 2. Methods 3. References Bone marrow-derived mesenchymal stem cells improve diabetes-induced cognitive impairment by exosome transfer into
a) Primary cultures derived from the pancreas of an 11-week-old Pdx1-Cre; K-MADM-p53
 Primary cultures derived from the pancreas of an 11-week-old Pdx1-Cre; K-MADM-p53") 1 2 3 4 5 6 7 8 9 10 Supplementary Figure 1. Induction of p53 LOH by MADM. a) Primary cultures derived from the pancreas of an 11-week-old Pdx1-Cre; K-MADM-p53 mouse revealed increased p53 KO/KO (green,
1 2 3 4 5 6 7 8 9 10 Supplementary Figure 1. Induction of p53 LOH by MADM. a) Primary cultures derived from the pancreas of an 11-week-old Pdx1-Cre; K-MADM-p53 mouse revealed increased p53 KO/KO (green,
NLRX1: 5 -GCTCCATGGCTTAGAGCATC-3 (forward) 5 -AACTCCTCCTCCGTCCTGAT-3 (reverse) β-actin
 5 -AACTCCTCCTCCGTCCTGAT-3 (reverse) β-actin") NLRX1 β-actin 1 2 3 4 5 6 1 2 3 4 5 6 NLRX1 (667 bp) β-actin (523 bp) Supplementary Figure 1: Expression of NLRX1 in human cell lines. 1: HeLa, 2: HEK293T, 3: MCF-7, 4:Ramos, 5:Jurkat, 6: THP1. The following
NLRX1 β-actin 1 2 3 4 5 6 1 2 3 4 5 6 NLRX1 (667 bp) β-actin (523 bp) Supplementary Figure 1: Expression of NLRX1 in human cell lines. 1: HeLa, 2: HEK293T, 3: MCF-7, 4:Ramos, 5:Jurkat, 6: THP1. The following
Supplementary Information. Detection and delineation of oral cancer with a PARP1 targeted optical imaging agent
 Supplementary Information Detection and delineation of oral cancer with a PARP1 targeted optical imaging agent Authors: Susanne Kossatz a, Christian Brand a, Stanley Gutiontov b, Jonathan T.C. Liu c, Nancy
SUPPLEMENTARY INFORMATION
 SUPPLEMENTARY INFORMATION Advances in pancreatic islet monolayer culture on glass surfaces enable superresolution microscopy and insights into beta cell ciliogenesis and proliferation Edward A. Phelps,
(a) Schematic diagram of the FS mutation of UVRAG in exon 8 containing the highly instable
 Schematic diagram of the FS mutation of UVRAG in exon 8 containing the highly instable") Supplementary Figure 1. Frameshift (FS) mutation in UVRAG. (a) Schematic diagram of the FS mutation of UVRAG in exon 8 containing the highly instable A 10 DNA repeat, generating a premature stop codon
Supplementary Figure 1. Frameshift (FS) mutation in UVRAG. (a) Schematic diagram of the FS mutation of UVRAG in exon 8 containing the highly instable A 10 DNA repeat, generating a premature stop codon
Supplemental figure 1. PDGFRα is expressed dominantly by stromal cells surrounding mammary ducts and alveoli. A) IHC staining of PDGFRα in
 IHC staining of PDGFRα in") Supplemental figure 1. PDGFRα is expressed dominantly by stromal cells surrounding mammary ducts and alveoli. A) IHC staining of PDGFRα in nulliparous (left panel) and InvD6 mouse mammary glands (right
Supplemental figure 1. PDGFRα is expressed dominantly by stromal cells surrounding mammary ducts and alveoli. A) IHC staining of PDGFRα in nulliparous (left panel) and InvD6 mouse mammary glands (right