Figure S1 (A) Comparison of body weight and blood glucose levels in male wild-type (WT) and Cre littermates. Mice were maintained on a normal chow
|
|
|
- Abraham Horton
- 5 years ago
- Views:
Transcription
1
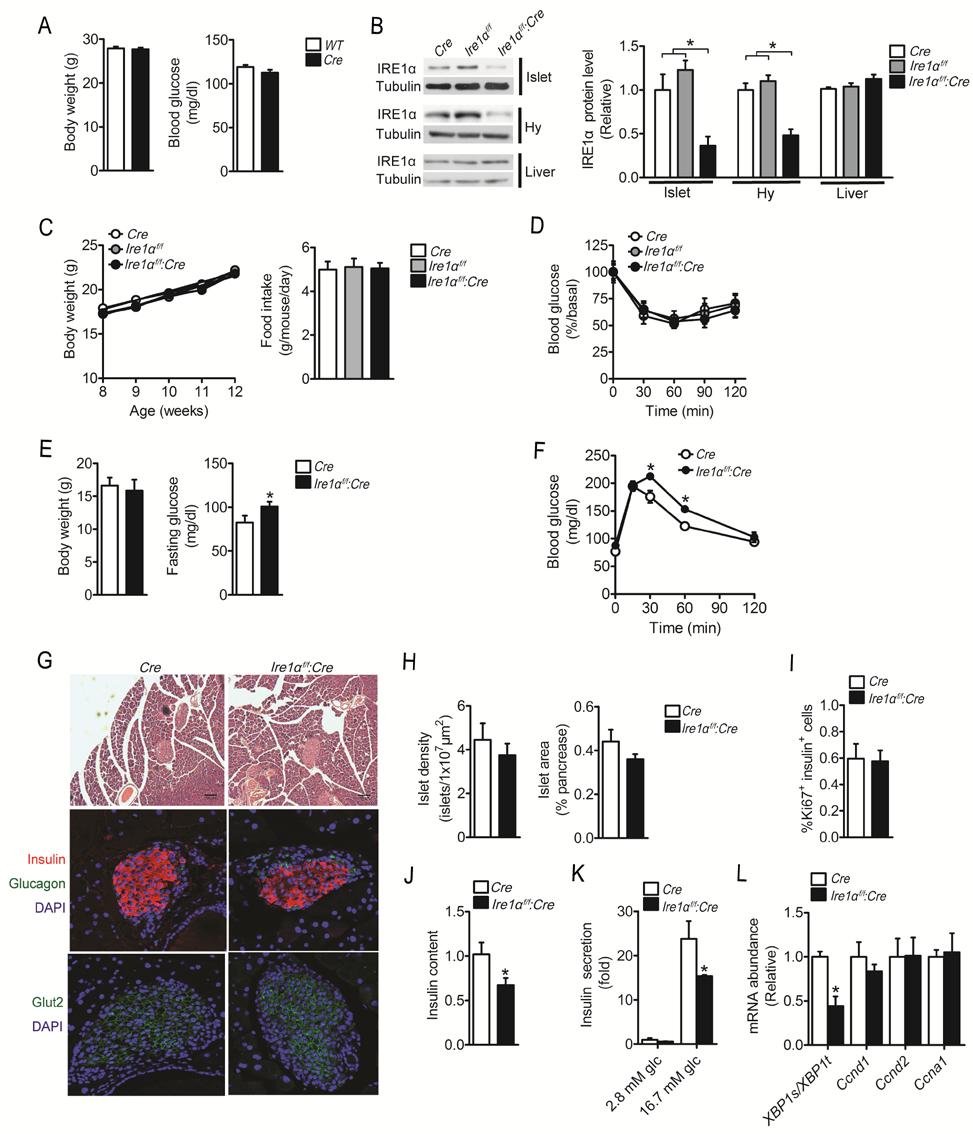
2 Figure S1 (A) Comparison of body weight and blood glucose levels in male wild-type (WT) and Cre littermates. Mice were maintained on a normal chow diet (n = 7 per genotype). Body weight and fed blood glucose levels were measured at 16 weeks of age. Results are presented as means ± SEM. (B-D) Abrogation of Ire1α in β-cells does not affect body weight, food intake or insulin s blood glucose-lowering ability in mice fed a normal chow diet. Male Ire1α f/f, Cre and Ire1α f/f :Cre mice were maintained on a normal chow diet (n = 5-6 per genotype). (B) RIP-Cre-mediated abrogation of Ire1α in pancreatic β-cells. Immunoblotting analysis of IRE1α protein
3 in pancreatic islets, hypothalamus (Hy) and liver of mice of the indicated genotype at 8 weeks of age. Shown are representative results, and tubulin was used as the loading control. Densitometric quantifications are presented as means ± SEM after normalization to the IRE1α protein level in Cre mice (n = 3 for each genotype). (C) Body weight of mice was monitored at the indicated ages, and daily food intake was measured at 10 weeks of age. (D) Insulin tolerance tests. Blood glucose was determined for mice at 11 weeks of age at the indicated time points after i.p. injection of 0.75 U/kg insulin. Data were normalized to the initial values before insulin injection. Results are presented as means ± SEM. (E-F) Ablation of Ire1α in β-cells disrupts glucose homeostasis in female mice. Female mice of the indicated genotype are maintained on a normal chow diet (n = 5-6 per genotype). (E) Body weight was determined at 7 weeks of age, and blood glucose levels were measured after a 6-hour fast at 9 weeks of age. Results are presented as means ± SEM. *P < 0.05 by unpaired two-tailed Student s t-test. (F) Glucose tolerance tests. Blood glucose was determined for mice at 10 weeks of age at the indicated time points after i.p. injection of 1 g/kg glucose. Results are presented as means ± SEM. *P < 0.05 by one-way ANOVA. (G-L) Deletion of Ire1α in β-cells decreases islet insulin content in NC-fed mice. Cre and Ire1α f/f :Cre mice were maintained on a normal chow (NC) diet. (G) Morphological analyses of islets of male mice at 10 weeks of age (n = 3-5 per genotype). Shown are representative images of hematoxylin and eosin staining of the pancreatic sections (scale bar: 100 μm), immunohistochemical staining of pancreatic sections using antibodies against insulin (red), glucagon (green) and Glut2 (green), with nuclei visualized by DAPI staining. (H) Islet density was determined and shown as the average number of islets per μm 2 of pancreas area (10 sections/mouse, n = 5 per genotype), and islet areas were measured as the percentage of total pancreas areas examined (10 sections/mouse, n = 5 per genotype). (I) β-cell proliferation was estimated by quantification of Ki67-positive β-cells in pancreas. Shown are percentage ratios of insulin and Ki67 double-positive cells to insulin-positive cells. Data are presented as means ± SEM (10 sections/mouse, n = 3 per genotype). (J-L) Primary islets were isolated from female mice of the indicated genotype at 10 weeks
4 of age (n = 3 per genotype). (J) Islet insulin content was determined and normalized to islet protein concentration. Data are presented as relative to the value of Cre islets. * P < 0.05 by unpaired two-tailed Student s t-test. (K) Fold stimulation of insulin secretion was measured in response to 16.7 mm glucose relative to the basal level at 2.8 mm glucose. After normalization to islet protein concentration, results are presented as relative to the value of Cre islets at 2.8 mm glucose. * P < 0.05 by two-way ANOVA. Data are shown as means ± SEM. (L) Primary islets were isolated from 3 individual mice at 11 weeks of age. Quantitative RT-PCR analyses of islet Xbp1 mrna splicing, shown as spliced (s) relative to total (t), and the mrna abundance of genes encoding cyclin D1, cyclin D2 and cyclin A1. 18S ribosomal RNA was used as the internal control. *P < 0.05 by unpaired two-tailed Student s t-test. Data in (H-L) are shown as means ± SEM. (M-O) HFD-fed obese mice exhibit increased ER stress and expression of cell cycle regulators in islets. Male C57BL/6J mice at 8 or 10 weeks of age were fed a low-fat diet (LFD, 10% fat) or high-fat diet (HFD, 60% fat) for 10 weeks (n = 5 per group). (M) Body weight was monitored weekly. **P < 0.01 by one-way ANOVA. Glucose tolerance tests were also performed. Blood glucose was determined at the indicated time points after i.p. injection of 1 g/kg glucose. *P < 0.05 by one-way ANOVA. (N) Primary islets were isolated and pooled from each individual mouse (n = 3 per group). Quantitative RT-PCR analyses of Xbp1 mrna splicing, shown as spliced (s) relative to total (t), and the mrna abundance of the indicated ER stress-related genes, as well as the mrna abundance of genes encoding the indicated cyclins and cyclin-dependent kinase (CDK) 4. 18S ribosomal RNA was used as the internal control. *P < 0.05, **P < 0.01, ***P < by unpaired two-tailed Student s t-test. (O) Immunoblotting analysis of islet BiP protein and eif2α phosphorylation with densitometric quantifications (n = 3 per group). Tubulin was used as the loading control. **P < 0.01 by unpaired two-tailed Student s t-test. Data are shown as means ± SEM. (P-R) Effects of Ire1α deletion in β-cells upon body weight, food intake, insulin sensitivity, total islet density and β-cell size of HFD-fed mice. (P and Q) Male mice of the indicated genotype at 12 weeks of age (n = 5-6 per genotype) were challenged with a high-fat diet (HFD). (P) Body weight was
5 determined after 8 weeks of HFD feeding, and daily food intake was determined after 4 weeks of HFD feeding. (Q) Insulin tolerance tests were performed through i.p. injection of 0.75 U/kg insulin in mice fed HFD for 9 weeks. Data were normalized to the initial values before insulin injection. Results are shown as means ± SEM. (R) Male Cre and Ire1α f/f :Cre mice at 12 weeks of age were fed HFD for 10 weeks (n = 4 per genotype). Total islet density was determined, presented as the average number of islets per μm 2 of pancreas area. *P < 0.05 by unpaired two-tailed Student s t-test. β-cell sizes were also determined from sections immunostained for Glut2. Data are shown as means ± SEM (10 sections/mouse, n = 3 mice). (S-V) XBP1s upregulates the expression of cyclin D1 and promotes β-cell proliferation. (S) INS-1 cells were infected for 48 hours with adenoviruses Ad-XBP1s or Ad-EGFP. The mrna abundance of the indicated genes was determined by quantitative RT-PCR using cyclophilin A as the internal control. (T) INS-1 cells were co-infected for 48 or 72 hours with adenoviruses expressing a scramble control shrna (Ad-shCON) or shrna directed against IRE1α (Ad-shIRE1α) with Ad-EGFP or Ad-XBP1s. IRE1α and XBP1s proteins were analyzed by immunoblotting, and the mrna abundance of the indicated genes was determined by quantitative RT-PCR with Cyclophilin A as the internal control. (U and V) INS-1 cells were infected for 48 hours with adenoviruses Ad-XBP1s or Ad-EGFP. (U) Protein expression levels of XBP1s, cyclin D1 and D2 were analyzed by immunoblotting. Tubulin was used as the loading control. (V) Quantification of Ki67-positive and BrdU-positive cells. Data are shown as means ± SEM (n = 3 independent experiments). *P < 0.05, **P < 0.01, ***P < by unpaired two-tailed Student s t-test. (W) Effects of adenoviral infections on the viability of INS-1 β-cells. INS-1 cells were infected with Ad-EGFP or Ad-XBP1s at an MOI of 20 for 48 hours or left uninfected. INS-1 cells were left uninfected, or infected with Ad-EGFP plus Ad-shNC, Ad-EGFP plus Ad-shIRE1α, or Ad-XBP1s plus Ad-shIRE1α at a total MOI of 40 for 72 hours. Each adenovirus was used at an MOI of 20. Cell viability was determined by the Cell Counting Kit-8, presented as the averaged percentage of viable cells after normalization to the uninfected control. Data are shown as means ± SEM (n = 3 independent experiments).
6 Table S1 Sequences of the oligonucleotide primers used for quantitative RT-PCR analysis. Rat Cyclophilin A (+) 5 -ATGGCAAATGCTGGACCAAA-3 Rat Cyclophilin A (-) 5 -CATGCCTTCTTTCACCTTCCC-3 Rat Erdj4 (+) 5 -ATAAAAGCCCTGATGCTGAAGC-3 Rat Erdj4 (-) 5 -GCCATTGGTAAAAGCACTGTGT-3 Rat Ccnd1 (+) 5 -GCACAACGCACTTTCTTTCC-3 Rat Ccnd1 (-) 5 -TCCAGAAGGGCTTCAATCTG-3 Rat Ccnd2 (+) 5 -CACCGACAACTCTGTGAAGC-3 Rat Ccnd2 (-) 5 -CCACTTCAGCTTACCCAACAC-3 Rat Ccna1 (+) 5 -GACAAACTCATCGACATCGGGCGGG-3 Rat Ccna1 (-) 5 -GACCCTGTACTTGGCTGTCAACTTC-3 Rat Cdk4 (+) 5 -GTCAGTGGTGCCGGAGAT-3 Rat Cdk4 (-) 5 -GGATTAAAGGTCAGCATTTCCA-3 Mus Ribosomal 18s (+) 5 - AGGGAGAGCGGGTAAGAGA-3 Mus Ribosomal 18s (-) 5 - GGACAGGACTAGGCGGAACA-3 Mus XBP1s (+) 5 -CTGAGTCCGAATCAGGTGCAG-3 Mus XBP1s (-) 5 -CCATGGGAAGATGTTCTGG-3 Mus XBP1t (+) 5 -TGGCCGGGTCTGCTGAGTCCG-3 Mus XBP1t (-) 5 -TCCATGGGAAGATGTTCTGG-3 Mus Erdj4 (+) 5 -TAAAAGCCCTGATGCTGAAGC-3 Mus Erdj4 (-) 5 -TCCGACTATTGGCATCCGA-3 Mus Bip (+) 5 -TCATCGGACGCACTTGGAA-3 Mus Bip (-) 5 -CAACCACCTTGAATGGCAAGA-3 Mus Chop (+) 5 -CTGGAAGCCTGGTATGAGGAT-3 Mus Chop (-) 5 -CAGGGTCAAGAGTAGTGAAGGT-3 Mus Ccnd1 (+) 5 -GCGTACCCTGACACCAATCTC-3 Mus Ccnd1 (-) 5 -CTCCTCTTCGCACTTCTGCTC-3 Mus Ccnd 2 (+) 5 -ATCCGGCGTTATGCTGCTCT-3 Mus Ccnd 2 (-) 5 -ATCCGGCGTTATGCTGCTCT-3 Mus Ccna1 (+) 5 -ACCTAAGGCGTCAAGGAGTGT-3 Mus Ccna1 (-) 5 -CAGCAACCAAGGAAGGAAGATA-3 Mus Cdk4 (+) 5 -GCACAGACATCCATCAGCCG-3 Mus Cdk4 (-) 5 -CGTGAGGTGGCCTTGTTAAGGA-3
7 Materials and Methods Creation of mice with deletion of IRE1α in β-cells Mice in which exon 2 of the Ire1α allele was flanked with loxp sites (denoted Ire1α f/f mice) were generated at Shanghai Research Center for Model Organisms as described [1]. Ire1α f/f mice were subsequently backcrossed for 6 generations into the genetic background of C57BL/6J mice (purchased from Shanghai Laboratory Animal Co. Ltd). To generate β-cell-specific IRE1α knockout mice (denoted Ire1α f/f :Cre mice), RIP-Cre transgenic mice (B6.Cg-Tg(Ins2-cre)25Mgn/J, denoted Cre mice; The Jackson Laboratory, Bar Harbor, ME), which express Cre recombinase under the control of the rat insulin promoter, was intercrossed with Ire1α f/f mice to produce Ire1α flox/+ :Cre mice. Ire1α flox/+ :Cre mice were then bred with Ire1α flox/+ mice to generate Ire1α f/f :Cre along with Ire1α f/f and Cre control mice. Genotyping was done as described [1]. Mice were maintained on a 12-hour light/dark cycle with free access to a regular chow diet (Shanghai Laboratory Animal Co. Ltd, China) and water at an accredited animal facility at Shanghai Institutes for Biological Sciences. For diet-induced obesity, male mice were fed a low-fat diet (LFD) or a high-fat diet (HFD) containing 10% or 60% kcal fat (Research Diets Inc., New Brunswick, NJ, USA). All experimental procedures and protocols were approved by the Institutional Animal Care and Use Committees at the Institute for Nutritional Sciences, Shanghai Institutes for Biological Sciences. Physiologic measurements The body weight of animals was monitored weekly. Food consumption was measured for individually caged mice at 7-8 weeks of age by weighing food daily before the dark cycle for one week. Fasting glucose was determined from tail vein blood for male mice after a 6-hour fast (9:00 15:00) using a glucometer (FreeStyle, Alameda, CA, USA). Serum insulin was measured using a rat/mouse insulin ELISA kit (Millipore, St. Charles, MO, USA) according to the manufacturer s instructions.
8 Glucose tolerance test (GTT) and insulin tolerance test (ITT) For GTT, male mice were fasted for overnight (16 hours) and then injected i.p. with D-glucose at 1g/kg of body weight. Blood glucose was measured from tail vein blood at the indicated time interval after the injection using a glucometer (FreeStyle, Alameda, CA, USA). For ITT, male mice were fasted for 6 hours and injected i.p. with 0.75 U/kg body weight of human insulin (Roche, Rotkreuz, Switzerland) before blood glucose measurement. Pancreatic islet isolation and insulin secretion/content measurement Mouse pancreatic islets were isolated using the Liberase (Roche, Rotkreuz, Switzerland) digestion method, and glucose-stimulated insulin secretion was determined as previously described in detail [2]. To determine the insulin content, primary islets were lysed in acid-ethanol buffer (0.18 M HCl in 70% ethanol) by mild sonication on ice. Insulin content was determined using the rat/mouse ELISA kit (Millipore, St. Charles, MO, USA). Histological analysis and immunofluorescence staining of pancreatic sections Pancreas was fixed in 4% paraformaldehyde, embedded in paraffin, and cut into consecutive 5-μm sections. Pancreatic sections were stained with hematoxylin and eosin at 200-μm intervals to avoid repeated measurements of the same islet. Images of the islets and the entire pancreas were acquired and analyzed using the Image J Software ( Islet mass was expressed as the percentage of the total pancreatic area that was surveyed. For immunostaining, fixed pancreatic sections were heated for 15 min in boiling 10 mm citrate buffer (PH=6.0) for antigen retrieval. Sections were subsequently probed with rabbit anti-glucagon (Cell Signaling Technology, Danvers, MA,USA), guinea pig anti-insulin (Dako, Produktionsvej, Denmark), rabbit anti-glut2 (Millipore, St. Charles, MO,USA) or mouse anti-ki67 (BD, Franklin Lakes, New Jersey, USA) antibody, followed by incubation with specific secondary antibodies conjugated to Alexa 488 or 594 (Invitrogen, Carlsbad, CA, USA). DAPI (Sigma, St. Louis, MO,
9 USA) was used to visualize the nucleus. Sections were analyzed by laser confocal microscopy (Olympus, Tokyo, Japan). Cell culture and adenovirus infections The rat insulinoma INS-1 cell line was kindly provided by Dr. Christopher B. Newgard (Duke University Medical Center) and maintained in RPMI 1640 as described [3]. INS-1 cells between passages were used, which possessed robust glucose-stimulated insulin secretion properties. Recombinant adenoviruses Ad-EGFP, Ad-shCON and Ad-shIRE1 that were used for infection of INS-1 cells were generated as previously described in detail [4, 5]. Ad-XBP1s was a generous gift from Dr. Ling Qi at Cornell University. INS-1 cells were infected with adenoviruses at an MOI of for the indicated periods of time, and adenoviral infections under these conditions did not show significant effects on cellular viability as analyzed using the Cell Counting Kit-8 (CCK-8, Dojindo, Kumamoto, Japan) (Fig. S1W). Isolated primary islets from Ire1α f/f :Cre mice were infected with the indicated adenoviruses at an MOI of 200 for 2 days. Cell proliferation analysis For Ki67 staining analysis, infected INS-1 cells were washed with PBS and then fixed with 4% paraformaldehyde for 30 minutes at room temperature. Following incubation in 0.2% Triton X-100 for 5 minutes, cells were blocked with 1xPBST containing 5% donkey serum for 1 hour. Cells were then incubated with Ki67 antibody for 1 hour, followed by staining with DAPI (Sigma, St.Louis, MO, USA) and Alexa 488-conjugated secondary antibody for 30 minutes. Pancreatic sections were incubated with Ki67 and guinea pig anti-insulin antibody, followed by incubation with secondary antibodies conjugated to Alexa 488 or Alexa 594. Cells or sections were analyzed by laser confocal microscopy (Olympus, Tokyo, Japan). For BrdU incorporation analysis, infected INS-1 cells were treated with BrdU (Sigma, St. Louis, MO, USA; final concentration 3 μg/ml) for 3 hours. After washing with PBS, cells were fixed with 4% paraformaldehyde for 30 minutes at room temperature.
10 Cells were then incubated in 2N HCl for 30 minutes and blocked with 1xPBST containing 5% donkey serum for 1 hour. After incubation with BrdU antibody (Dako, Produktionsvej, Denmark) for 1 hour, cells were stained with DAPI and Alexa-conjugated secondary antibody for 30 minutes before analysis by laser confocal microscopy (Olympus, Tokyo, Japan). Luciferase reporter assay The pgl3 plasmid containing the promoter of human Ccnd1 gene, which corresponds to the region of to +134 with respect to the putative transcription start site (denoted nucleotide +1), was purchased from Addgene (Cambridge, MA, USA). Deletion of the ACGT core from the Ccnd1 promoter was done by a PCR-based strategy. HEK293T cells were co-transfected with the desired plasmids. Luciferase activity was measured using Dual-luciferase Assay Kit (Promega, Madison, WI) according to the manufacturer s instructions. Renilla activity was used as an internal control for normalization. Antibodies and immunoblotting IRE1α, p-eif2α, eif2α, Cyclin D1 and D2 antibodies were purchased from Cell Signaling Technologies, BiP antibody from Enzo Life Sciences (New York, USA), XBP1s antibody from Biolegend (San Diego, CA, USA). Tubulin antibody was from Sigma (St. Louis, MO, USA). Protein extracts were prepared from isolated primary islets or livers of mice and INS-1 cells. Western immunoblotting was performed as described previously [4]. Quantitative real-time RT-PCR analysis Total RNA from mouse liver or islets was isolated using TRIzol reagent (Invitrogen, Carlsbad, CA, USA). First-strand cdna was synthesized with Moloney murine leukemia virus (M-MLV) reverse transcriptase and random hexamer primers (Invitrogen, Carlsbad, CA, USA). Real-time quantitative PCR was conducted using the SYBR Green PCR system, following the manufacturer s recommendations
11 (Applied Biosystems). 18S rrna or Cyclophilin A was used as an internal control for normalization. Primers used were as shown in Table S1. Statistical analysis Results are presented as means ± SEM. Statistical analysis of differences was conducted using the Student s t-test, one-way analysis of variance (ANOVA). P < 0.05 was considered significant. References 1 Shao M, Shan B, Liu Y, et al. Hepatic IRE1alpha regulates fasting-induced metabolic adaptive programs through the XBP1s-PPARalpha axis signalling. Nat Commun 2014; 5: Yang L, Zhao L, Gan Z, et al. Deficiency in RNA editing enzyme ADAR2 impairs regulated exocytosis. Faseb J 2010; 24: Yang L, Huang P, Li F, et al. c-jun amino-terminal kinase-1 mediates glucose-responsive upregulation of the RNA editing enzyme ADAR2 in pancreatic beta-cells. PLoS One 2012; 7:e Qiu YF, Mao T, Zhang YL, et al. A Crucial Role for RACK1 in the Regulation of Glucose-Stimulated IRE1 alpha Activation in Pancreatic beta Cells. Sci Signal 2010; 3:ra7. 5 Mao T, Shao M, Qiu Y, et al. PKA phosphorylation couples hepatic inositol-requiring enzyme 1alpha to glucagon signaling in glucose metabolism. Proc Natl Acad Sci U S A 2011; 108:
General Laboratory methods Plasma analysis: Gene Expression Analysis: Immunoblot analysis: Immunohistochemistry:
 General Laboratory methods Plasma analysis: Plasma insulin (Mercodia, Sweden), leptin (duoset, R&D Systems Europe, Abingdon, United Kingdom), IL-6, TNFα and adiponectin levels (Quantikine kits, R&D Systems
Metabolic ER stress and inflammation in white adipose tissue (WAT) of mice with dietary obesity.
 of mice with dietary obesity.") Supplementary Figure 1 Metabolic ER stress and inflammation in white adipose tissue (WAT) of mice with dietary obesity. Male C57BL/6J mice were fed a normal chow (NC, 10% fat) or a high-fat diet (HFD,
Supplementary Figure 1 Metabolic ER stress and inflammation in white adipose tissue (WAT) of mice with dietary obesity. Male C57BL/6J mice were fed a normal chow (NC, 10% fat) or a high-fat diet (HFD,
Supplementary Materials for
 www.sciencesignaling.org/cgi/content/full/3/106/ra7/dc1 Supplementary Materials for A Crucial Role for RACK1 in the Regulation of Glucose-Stimulated IRE1α Activation in Pancreatic β Cells Yifu Qiu, Ting
(A) PCR primers (arrows) designed to distinguish wild type (P1+P2), targeted (P1+P2) and excised (P1+P3)14-
 PCR primers (arrows) designed to distinguish wild type (P1+P2), targeted (P1+P2) and excised (P1+P3)14-") 1 Supplemental Figure Legends Figure S1. Mammary tumors of ErbB2 KI mice with 14-3-3σ ablation have elevated ErbB2 transcript levels and cell proliferation (A) PCR primers (arrows) designed to distinguish
1 Supplemental Figure Legends Figure S1. Mammary tumors of ErbB2 KI mice with 14-3-3σ ablation have elevated ErbB2 transcript levels and cell proliferation (A) PCR primers (arrows) designed to distinguish
p47 negatively regulates IKK activation by inducing the lysosomal degradation of polyubiquitinated NEMO
 Supplementary Information p47 negatively regulates IKK activation by inducing the lysosomal degradation of polyubiquitinated NEMO Yuri Shibata, Masaaki Oyama, Hiroko Kozuka-Hata, Xiao Han, Yuetsu Tanaka,
Supplementary Figure 1.
 Supplementary Figure 1. Increased β cell mass and islet diameter in βtsc2 -/- mice up to 35 weeks A: Reconstruction of multiple anti-insulin immunofluorescence images showing differences in β cell mass
Supplementary Figure 1. DJ-1 modulates ROS concentration in mouse skeletal muscle.
 Supplementary Figure 1. DJ-1 modulates ROS concentration in mouse skeletal muscle. (a) mrna levels of Dj1 measured by quantitative RT-PCR in soleus, gastrocnemius (Gastroc.) and extensor digitorum longus
Supporting Information
 Supporting Information Pang et al. 10.1073/pnas.1322009111 SI Materials and Methods ELISAs. These assays were performed as previously described (1). ELISA plates (MaxiSorp Nunc; Thermo Fisher Scientific)
Supplementary Figure 1
 Supplementary Figure 1 a Percent of body weight! (%) 4! 3! 1! Epididymal fat Subcutaneous fat Liver SD Percent of body weight! (%) ** 3! 1! SD Percent of body weight! (%) 6! 4! SD ** b Blood glucose (mg/dl)!
Supplementary Information. Induction of human pancreatic beta cell replication by inhibitors of dual specificity tyrosine regulated kinase
 Journal: Nature Medicine Supplementary Information Induction of human pancreatic beta cell replication by inhibitors of dual specificity tyrosine regulated kinase 1,2 Peng Wang PhD, 1,2 Juan-Carlos Alvarez-Perez
Supplemental Information. Increased 4E-BP1 Expression Protects. against Diet-Induced Obesity and Insulin. Resistance in Male Mice
 Cell Reports, Volume 16 Supplemental Information Increased 4E-BP1 Expression Protects against Diet-Induced Obesity and Insulin Resistance in Male Mice Shih-Yin Tsai, Ariana A. Rodriguez, Somasish G. Dastidar,
Supplemental Data. Short Article. ATF4-Mediated Induction of 4E-BP1. Contributes to Pancreatic β Cell Survival. under Endoplasmic Reticulum Stress
 Cell Metabolism, Volume 7 Supplemental Data Short Article ATF4-Mediated Induction of 4E-BP1 Contributes to Pancreatic β Cell Survival under Endoplasmic Reticulum Stress Suguru Yamaguchi, Hisamitsu Ishihara,
Supplementary Figure 1: Neuregulin 1 increases the growth of mammary organoids compared to EGF. (a) Mammary epithelial cells were freshly isolated,
 Mammary epithelial cells were freshly isolated,") 1 2 3 4 5 6 7 8 9 10 Supplementary Figure 1: Neuregulin 1 increases the growth of mammary organoids compared to EGF. (a) Mammary epithelial cells were freshly isolated, embedded in matrigel and exposed
1 2 3 4 5 6 7 8 9 10 Supplementary Figure 1: Neuregulin 1 increases the growth of mammary organoids compared to EGF. (a) Mammary epithelial cells were freshly isolated, embedded in matrigel and exposed
GPR120 *** * * Liver BAT iwat ewat mwat Ileum Colon. UCP1 mrna ***
 a GPR120 GPR120 mrna/ppia mrna Arbitrary Units 150 100 50 Liver BAT iwat ewat mwat Ileum Colon b UCP1 mrna Fold induction 20 15 10 5 - camp camp SB202190 - - - H89 - - - - - GW7647 Supplementary Figure
For pair feeding, mice were fed 2.7g of HFD containing tofogliflozin
 Materials and Methods Pair Feeding Experiment For pair feeding, mice were fed 2.7g of HFD containing tofogliflozin (0.005%), which is average daily food intake of mice fed control HFD ad libitum at week
Islet viability assay and Glucose Stimulated Insulin Secretion assay RT-PCR and Western Blot
 Islet viability assay and Glucose Stimulated Insulin Secretion assay Islet cell viability was determined by colorimetric (3-(4,5-dimethylthiazol-2-yl)-2,5- diphenyltetrazolium bromide assay using CellTiter
SUPPLEMENTARY INFORMATION
 SUPPLEMENTARY INFORMATION FOR Liver X Receptor α mediates hepatic triglyceride accumulation through upregulation of G0/G1 Switch Gene 2 (G0S2) expression I: SUPPLEMENTARY METHODS II: SUPPLEMENTARY FIGURES
Supplementary Information
 Supplementary Information Overexpression of Fto leads to increased food intake and results in obesity Chris Church, Lee Moir, Fiona McMurray, Christophe Girard, Gareth T Banks, Lydia Teboul, Sara Wells,
SUPPLEMENTARY INFORMATION
 Supplementary Figures Supplementary Figure S1. Binding of full-length OGT and deletion mutants to PIP strips (Echelon Biosciences). Supplementary Figure S2. Binding of the OGT (919-1036) fragments with
Pair-fed % inkt cells 0.5. EtOH 0.0
 MATERIALS AND METHODS Histopathological analysis Liver tissue was collected 9 h post-gavage, and the tissue samples were fixed in 1% formalin and paraffin-embedded following a standard procedure. The embedded
Expression of acid base transporters in the kidney collecting duct in Slc2a7 -/-
 Supplemental Material Results. Expression of acid base transporters in the kidney collecting duct in Slc2a7 -/- and Slc2a7 -/- mice. The expression of AE1 in the kidney was examined in Slc26a7 KO mice.
Supplemental methods. Total RNA was extracted from the stomach, liver, pancreas, pituitary, and
 Supplemental methods Real-time quantitative RT-PCR and Semi-quantitative PCR Total RNA was extracted from the stomach, liver, pancreas, pituitary, and hypothalamus as previously described (). Primers and
A 10.8 kb ghr fragment containing exons 4 and 5 was PCR amplified with Pfu Turbo. DNA polymerase (Stratagene) and cloned into pcr Blunt II-TOPO vector
 and cloned into pcr Blunt II-TOPO vector") Supplemental Method: Generation of a conditional GHR knockout mice. A 1.8 kb ghr fragment containing exons 4 and 5 was PCR amplified with Pfu Turbo DNA polymerase (Stratagene) and cloned into pcr Blunt
Supplemental Method: Generation of a conditional GHR knockout mice. A 1.8 kb ghr fragment containing exons 4 and 5 was PCR amplified with Pfu Turbo DNA polymerase (Stratagene) and cloned into pcr Blunt
SUPPLEMENTARY FIGURES AND TABLE
 SUPPLEMENTARY FIGURES AND TABLE Supplementary Figure S1: Characterization of IRE1α mutants. A. U87-LUC cells were transduced with the lentiviral vector containing the GFP sequence (U87-LUC Tet-ON GFP).
Supplementary Figure 1 CD4 + T cells from PKC-θ null mice are defective in NF-κB activation during T cell receptor signaling. CD4 + T cells were
 Supplementary Figure 1 CD4 + T cells from PKC-θ null mice are defective in NF-κB activation during T cell receptor signaling. CD4 + T cells were isolated from wild type (PKC-θ- WT) or PKC-θ null (PKC-θ-KO)
Supplementary Figure 1: Hsp60 / IEC mice are embryonically lethal (A) Light microscopic pictures show mouse embryos at developmental stage E12.
 Light microscopic pictures show mouse embryos at developmental stage E12.") Supplementary Figure 1: Hsp60 / IEC mice are embryonically lethal (A) Light microscopic pictures show mouse embryos at developmental stage E12.5 and E13.5 prepared from uteri of dams and subsequently genotyped.
Supplementary Figure 1: Hsp60 / IEC mice are embryonically lethal (A) Light microscopic pictures show mouse embryos at developmental stage E12.5 and E13.5 prepared from uteri of dams and subsequently genotyped.
SUPPLEMENTARY FIGURES
 SUPPLEMENTARY FIGURES 1 Supplementary Figure 1, Adult hippocampal QNPs and TAPs uniformly express REST a-b) Confocal images of adult hippocampal mouse sections showing GFAP (green), Sox2 (red), and REST
marker. DAPI labels nuclei. Flies were 20 days old. Scale bar is 5 µm. Ctrl is
 Supplementary Figure 1. (a) Nos is detected in glial cells in both control and GFAP R79H transgenic flies (arrows), but not in deletion mutant Nos Δ15 animals. Repo is a glial cell marker. DAPI labels
Supporting Information
 Supporting Information Fujishita et al. 10.1073/pnas.0800041105 SI Text Polyp Scoring. Intestinal polyps were counted as described (1). Briefly, the small and large intestines were excised, washed with
Over-expression of MKP-3 and knockdown of MKP-3 and FOXO1 in primary rat. day, cells were transduced with adenoviruses expressing GFP, MKP-3 or shgfp,
 SUPPLEMENTAL METHODS Over-expression of MKP-3 and knockdown of MKP-3 and FOXO1 in primary rat hepatocytes Primary rat hepatocytes were seeded as described in experimental procedures. The next day, cells
Online Appendix Material and Methods: Pancreatic RNA isolation and quantitative real-time (q)rt-pcr. Mice were fasted overnight and killed 1 hour (h)
rt-pcr. Mice were fasted overnight and killed 1 hour (h)") Online Appendix Material and Methods: Pancreatic RNA isolation and quantitative real-time (q)rt-pcr. Mice were fasted overnight and killed 1 hour (h) after feeding. A small slice (~5-1 mm 3 ) was taken
Online Appendix Material and Methods: Pancreatic RNA isolation and quantitative real-time (q)rt-pcr. Mice were fasted overnight and killed 1 hour (h) after feeding. A small slice (~5-1 mm 3 ) was taken
SUPPLEMENTARY DATA. Supplementary experimental procedures
 Supplementary experimental procedures Glucose tolerance, insulin secretion and insulin tolerance tests Glucose tolerance test (GTT) and glucose stimulated insulin secretion (GSIS) was measured in over-night
Impact of Sox9 Dosage and Hes1-mediated Notch Signaling in Controlling the Plasticity of Adult Pancreatic Duct Cells in Mice
 Impact of Sox9 Dosage and Hes1-mediated Notch Signaling in Controlling the Plasticity of Adult Pancreatic Duct Cells in Mice Shinichi Hosokawa 1,3,Kenichiro Furuyama 1,3, Masashi Horiguchi 1,3,Yoshiki
Cells and reagents. Synaptopodin knockdown (1) and dynamin knockdown (2)
 and dynamin knockdown (2)") Supplemental Methods Cells and reagents. Synaptopodin knockdown (1) and dynamin knockdown (2) podocytes were cultured as described previously. Staurosporine, angiotensin II and actinomycin D were all obtained
Supplemental Methods Cells and reagents. Synaptopodin knockdown (1) and dynamin knockdown (2) podocytes were cultured as described previously. Staurosporine, angiotensin II and actinomycin D were all obtained
(Stratagene, La Jolla, CA) (Supplemental Fig. 1A). A 5.4-kb EcoRI fragment
 (Supplemental Fig. 1A). A 5.4-kb EcoRI fragment") SUPPLEMENTAL INFORMATION Supplemental Methods Generation of RyR2-S2808D Mice Murine genomic RyR2 clones were isolated from a 129/SvEvTacfBR λ-phage library (Stratagene, La Jolla, CA) (Supplemental Fig.
SUPPLEMENTAL INFORMATION Supplemental Methods Generation of RyR2-S2808D Mice Murine genomic RyR2 clones were isolated from a 129/SvEvTacfBR λ-phage library (Stratagene, La Jolla, CA) (Supplemental Fig.
Supplementary Figure 1
 VO (ml kg - min - ) VCO (ml kg - min - ) Respiratory exchange ratio Energy expenditure (cal kg - min - ) Locomotor activity (x count) Body temperature ( C) Relative mrna expression TA Sol EDL PT Heart
Endocannabinoid-activated Nlrp3 inflammasome in infiltrating macrophages mediates β- cell loss in type 2 diabetes
 Endocannabinoid-activated Nlrp3 inflammasome in infiltrating macrophages mediates β- cell loss in type 2 diabetes T Jourdan, G Godlewski, R Cinar, A Bertola, G Szanda, J Liu, J Tam, T Han, B Mukhopadhyay,
Supplementary Figure 1.TRIM33 binds β-catenin in the nucleus. a & b, Co-IP of endogenous TRIM33 with β-catenin in HT-29 cells (a) and HEK 293T cells
 and HEK 293T cells") Supplementary Figure 1.TRIM33 binds β-catenin in the nucleus. a & b, Co-IP of endogenous TRIM33 with β-catenin in HT-29 cells (a) and HEK 293T cells (b). TRIM33 was immunoprecipitated, and the amount of
Supplementary Figure 1.TRIM33 binds β-catenin in the nucleus. a & b, Co-IP of endogenous TRIM33 with β-catenin in HT-29 cells (a) and HEK 293T cells (b). TRIM33 was immunoprecipitated, and the amount of
Supplementary Table 1. Primer sequences for conventional RT-PCR on mouse islets
 Supplementary Table 1. Primer sequences for conventional RT-PCR on mouse islets Gene 5 Forward 3 5 Reverse 3.T. Product (bp) ( C) mnox1 GTTCTTGGGCTGCCTTGG GCTGGGGCGGCGG 60 300 mnoxa1 GCTTTGCCGCGTGC GGTTCGGGTCCTTTGTGC
Defective Hepatic Autophagy in Obesity Promotes ER Stress and Causes Insulin Resistance
 Cell Metabolism, Volume 11 Supplemental Information Defective Hepatic Autophagy in Obesity Promotes ER Stress and Causes Insulin Resistance Ling Yang, Ping Li, Suneng Fu, Ediz S. Calay, and Gökhan S. Hotamisligil
The clathrin adaptor Numb regulates intestinal cholesterol. absorption through dynamic interaction with NPC1L1
 The clathrin adaptor Numb regulates intestinal cholesterol absorption through dynamic interaction with NPC1L1 Pei-Shan Li 1, Zhen-Yan Fu 1,2, Ying-Yu Zhang 1, Jin-Hui Zhang 1, Chen-Qi Xu 1, Yi-Tong Ma
Plasma exposure levels from individual mice 4 hours post IP administration at the
 Supplemental Figure Legends Figure S1. Plasma exposure levels of MKC-3946 in mice. Plasma exposure levels from individual mice 4 hours post IP administration at the indicated dose mg/kg. Data represent
Supporting Information
 Supporting Information Franco et al. 10.1073/pnas.1015557108 SI Materials and Methods Drug Administration. PD352901 was dissolved in 0.5% (wt/vol) hydroxyl-propyl-methylcellulose, 0.2% (vol/vol) Tween
Figure S1. Generation of inducible PTEN deficient mice and the BMMCs (A) B6.129 Pten loxp/loxp mice were mated with B6.
 B6.129 Pten loxp/loxp mice were mated with B6.") Figure S1. Generation of inducible PTEN deficient mice and the BMMCs (A) B6.129 Pten loxp/loxp mice were mated with B6.129-Gt(ROSA)26Sor tm1(cre/ert2)tyj /J mice. To induce deletion of the Pten locus,
Figure S1. Generation of inducible PTEN deficient mice and the BMMCs (A) B6.129 Pten loxp/loxp mice were mated with B6.129-Gt(ROSA)26Sor tm1(cre/ert2)tyj /J mice. To induce deletion of the Pten locus,
Supplementary Table 1. The primers used for quantitative RT-PCR. Gene name Forward (5 > 3 ) Reverse (5 > 3 )
 Reverse (5 > 3 )") 770 771 Supplementary Table 1. The primers used for quantitative RT-PCR. Gene name Forward (5 > 3 ) Reverse (5 > 3 ) Human CXCL1 GCGCCCAAACCGAAGTCATA ATGGGGGATGCAGGATTGAG PF4 CCCCACTGCCCAACTGATAG TTCTTGTACAGCGGGGCTTG
770 771 Supplementary Table 1. The primers used for quantitative RT-PCR. Gene name Forward (5 > 3 ) Reverse (5 > 3 ) Human CXCL1 GCGCCCAAACCGAAGTCATA ATGGGGGATGCAGGATTGAG PF4 CCCCACTGCCCAACTGATAG TTCTTGTACAGCGGGGCTTG
Abbreviations: P- paraffin-embedded section; C, cryosection; Bio-SA, biotin-streptavidin-conjugated fluorescein amplification.
 Supplementary Table 1. Sequence of primers for real time PCR. Gene Forward primer Reverse primer S25 5 -GTG GTC CAC ACT ACT CTC TGA GTT TC-3 5 - GAC TTT CCG GCA TCC TTC TTC-3 Mafa cds 5 -CTT CAG CAA GGA
ACC ELOVL MCAD. CPT1α 1.5 *** 0.5. Reverbα *** *** 0.5. Fasted. Refed
 Supplementary Figure A 8 SREBPc 6 5 FASN ELOVL6.5.5.5 ACC.5.5 CLOCK.5.5 CRY.5.5 PPARα.5.5 ACSL CPTα.5.5.5.5 MCAD.5.5 PEPCK.5.5 G6Pase 5.5.5.5 BMAL.5.5 Reverbα.5.5 Reverbβ.5.5 PER.5.5 PER B Fasted Refed
Male 30. Female. Body weight (g) Age (weeks) Age (weeks) Atg7 f/f Atg7 ΔCD11c
 Age (weeks) Age (weeks) Atg7 f/f Atg7 ΔCD11c") ody weight (g) ody weight (g) 34 3 Male 3 27 Female 26 24 22 18 7 9 11 13 15 17 19 21 23 21 18 15 7 9 11 13 15 17 19 21 23 Age (weeks) Age (weeks) Supplementary Figure 1. Lean phenotypes in mice regardless
ody weight (g) ody weight (g) 34 3 Male 3 27 Female 26 24 22 18 7 9 11 13 15 17 19 21 23 21 18 15 7 9 11 13 15 17 19 21 23 Age (weeks) Age (weeks) Supplementary Figure 1. Lean phenotypes in mice regardless
(A) RT-PCR for components of the Shh/Gli pathway in normal fetus cell (MRC-5) and a
 RT-PCR for components of the Shh/Gli pathway in normal fetus cell (MRC-5) and a") Supplementary figure legends Supplementary Figure 1. Expression of Shh signaling components in a panel of gastric cancer. (A) RT-PCR for components of the Shh/Gli pathway in normal fetus cell (MRC-5) and
Supplementary figure legends Supplementary Figure 1. Expression of Shh signaling components in a panel of gastric cancer. (A) RT-PCR for components of the Shh/Gli pathway in normal fetus cell (MRC-5) and
A549 and A549-fLuc cells were maintained in high glucose Dulbecco modified
 Cell culture and animal model A549 and A549-fLuc cells were maintained in high glucose Dulbecco modified Eagle medium supplemented with 10% fetal bovine serum at 37 C in humidified atmosphere containing
SUPPLEMENTARY INFORMATION
 DOI: 10.1038/ncb3461 In the format provided by the authors and unedited. Supplementary Figure 1 (associated to Figure 1). Cpeb4 gene-targeted mice develop liver steatosis. a, Immunoblot displaying CPEB4
Supplementary Table 1. Metabolic parameters in GFP and OGT-treated mice
 Supplementary Table 1. Metabolic parameters in GFP and OGT-treated mice Fasted Refed GFP OGT GFP OGT Liver G6P (mmol/g) 0.03±0.01 0.04±0.02 0.60±0.04 0.42±0.10 A TGs (mg/g of liver) 20.08±5.17 16.29±0.8
Online Data Supplement. Anti-aging Gene Klotho Enhances Glucose-induced Insulin Secretion by Upregulating Plasma Membrane Retention of TRPV2
 Online Data Supplement Anti-aging Gene Klotho Enhances Glucose-induced Insulin Secretion by Upregulating Plasma Membrane Retention of TRPV2 Yi Lin and Zhongjie Sun Department of physiology, college of
A Hepatocyte Growth Factor Receptor (Met) Insulin Receptor hybrid governs hepatic glucose metabolism SUPPLEMENTARY FIGURES, LEGENDS AND METHODS
 Insulin Receptor hybrid governs hepatic glucose metabolism SUPPLEMENTARY FIGURES, LEGENDS AND METHODS") A Hepatocyte Growth Factor Receptor (Met) Insulin Receptor hybrid governs hepatic glucose metabolism Arlee Fafalios, Jihong Ma, Xinping Tan, John Stoops, Jianhua Luo, Marie C. DeFrances and Reza Zarnegar
A Hepatocyte Growth Factor Receptor (Met) Insulin Receptor hybrid governs hepatic glucose metabolism Arlee Fafalios, Jihong Ma, Xinping Tan, John Stoops, Jianhua Luo, Marie C. DeFrances and Reza Zarnegar
The antiparasitic drug ivermectin is a novel FXR ligand that regulates metabolism
 Supplementary Information The antiparasitic drug ivermectin is a novel FXR ligand that regulates metabolism Address correspondence to Yong Li (yongli@xmu.edu.cn, Tel: 86-592-218151) GW464 CDCA Supplementary
Supplementary Figure 1 Role of Raf-1 in TLR2-Dectin-1-mediated cytokine expression
 Supplementary Figure 1 Supplementary Figure 1 Role of Raf-1 in TLR2-Dectin-1-mediated cytokine expression. Quantitative real-time PCR of indicated mrnas in DCs stimulated with TLR2-Dectin-1 agonist zymosan
Diabetic pdx1-mutant zebrafish show conserved responses to nutrient overload and anti-glycemic treatment
 Supplementary Information Diabetic pdx1-mutant zebrafish show conserved responses to nutrient overload and anti-glycemic treatment Robin A. Kimmel, Stefan Dobler, Nicole Schmitner, Tanja Walsen, Julia
Supplementary Materials for
 www.sciencesignaling.org/cgi/content/full/8/407/ra127/dc1 Supplementary Materials for Loss of FTO in adipose tissue decreases Angptl4 translation and alters triglyceride metabolism Chao-Yung Wang,* Shian-Sen
Division of Hypothalamic Research, Departments of Internal Medicine and
 1 5-HT 2C Rs Expressed by Pro-opiomelanocortin Neurons Regulate Insulin Sensitivity in Liver Yong Xu 1, 3*, Eric D. Berglund 1*, Jong-Woo Sohn 1, William L. Holland 2, Jen-Chieh Chuang 1, Makoto Fukuda
Supplemental Figure 1. Intracranial transduction of a modified ptomo lentiviral vector in the mouse
 Supplemental figure legends Supplemental Figure 1. Intracranial transduction of a modified ptomo lentiviral vector in the mouse hippocampus targets GFAP-positive but not NeuN-positive cells. (A) Stereotaxic
Soft Agar Assay. For each cell pool, 100,000 cells were resuspended in 0.35% (w/v)
") SUPPLEMENTARY MATERIAL AND METHODS Soft Agar Assay. For each cell pool, 100,000 cells were resuspended in 0.35% (w/v) top agar (LONZA, SeaKem LE Agarose cat.5004) and plated onto 0.5% (w/v) basal agar.
SUPPLEMENTARY MATERIAL AND METHODS Soft Agar Assay. For each cell pool, 100,000 cells were resuspended in 0.35% (w/v) top agar (LONZA, SeaKem LE Agarose cat.5004) and plated onto 0.5% (w/v) basal agar.
Supplementary Figure 1. Baf60c and baf180 are induced during cardiac regeneration in zebrafish. RNA in situ hybridization was performed on paraffin
 Supplementary Figure 1. Baf60c and baf180 are induced during cardiac regeneration in zebrafish. RNA in situ hybridization was performed on paraffin sections from sham-operated adult hearts (a and i) and
Supplemental Information. Tissue Myeloid Progenitors Differentiate. into Pericytes through TGF-b Signaling. in Developing Skin Vasculature
 Cell Reports, Volume 18 Supplemental Information Tissue Myeloid Progenitors Differentiate into Pericytes through TGF-b Signaling in Developing Skin Vasculature Tomoko Yamazaki, Ani Nalbandian, Yutaka Uchida,
hexahistidine tagged GRP78 devoid of the KDEL motif (GRP78-His) on SDS-PAGE. This
 on SDS-PAGE. This") SUPPLEMENTAL FIGURE LEGEND Fig. S1. Generation and characterization of. (A) Coomassie staining of soluble hexahistidine tagged GRP78 devoid of the KDEL motif (GRP78-His) on SDS-PAGE. This protein was expressed
SUPPLEMENTAL FIGURE LEGEND Fig. S1. Generation and characterization of. (A) Coomassie staining of soluble hexahistidine tagged GRP78 devoid of the KDEL motif (GRP78-His) on SDS-PAGE. This protein was expressed
Supplementary Figure S1. Distinct compartmentalization of proinsulin in obese db/db mouse islet ß- cells.
 Supplementary Figure S1. Distinct compartmentalization of proinsulin in obese db/db mouse islet ß- cells. Pancreata from 16-weeks-old 6J +/+, 6J db/db, KS +/+ and KS db/db mice were harvested, fixed with
SUPPLEMENTARY INFORMATION
 doi:10.1038/nature12652 Supplementary Figure 1. PRDM16 interacts with endogenous EHMT1 in brown adipocytes. Immunoprecipitation of PRDM16 complex by flag antibody (M2) followed by Western blot analysis
Supplemental Table 1. Primers used for real-time quantitative RT-PCR assay. Nucleotide sequence
 Supplemental Table 1. Primers used for real-time quantitative RT-PCR assay Name FoxO1 forward FoxO1 reverse GK forward GK reverse INS-1 forward INS-1 reverse INS-2 forward INS-2 reverse Glut2 forward Glut2
Loss of Pdk1-Foxo1 Signaling in Myeloid Cells Predisposes to Adipose Tissue Inflammation and Insulin Resistance
 ORIGINAL ARTICLE Loss of Pdk1-Foxo1 Signaling in Myeloid Cells Predisposes to Adipose Tissue Inflammation and Insulin Resistance Yoshinaga Kawano, 1 Jun Nakae, 1 Nobuyuki Watanabe, 2 Shiho Fujisaka, 3
Supplementary Figure 1.
 Supplementary Figure 1. Visualization of endoplasmic reticulum-mitochondria interaction by in situ proximity ligation assay. A) Illustration of targeted proteins in mitochondria (M), endoplasmic reticulum
Supplementary Figure S1. Venn diagram analysis of mrna microarray data and mirna target analysis. (a) Western blot analysis of T lymphoblasts (CLS)
 Western blot analysis of T lymphoblasts (CLS)") Supplementary Figure S1. Venn diagram analysis of mrna microarray data and mirna target analysis. (a) Western blot analysis of T lymphoblasts (CLS) and their exosomes (EXO) in resting (REST) and activated
Supplementary Figure S1. Venn diagram analysis of mrna microarray data and mirna target analysis. (a) Western blot analysis of T lymphoblasts (CLS) and their exosomes (EXO) in resting (REST) and activated
Requires Signaling though Akt2 Independent of the. Transcription Factors FoxA2, FoxO1, and SREBP1c
 Cell Metabolism, Volume 14 Supplemental Information Postprandial Hepatic Lipid Metabolism Requires Signaling though Akt2 Independent of the Transcription Factors FoxA2, FoxO1, and SREBP1c Min Wan, Karla
Cell isolation. Spleen and lymph nodes (axillary, inguinal) were removed from mice
 were removed from mice") Supplementary Methods: Cell isolation. Spleen and lymph nodes (axillary, inguinal) were removed from mice and gently meshed in DMEM containing 10% FBS to prepare for single cell suspensions. CD4 + CD25
Supplementary Methods: Cell isolation. Spleen and lymph nodes (axillary, inguinal) were removed from mice and gently meshed in DMEM containing 10% FBS to prepare for single cell suspensions. CD4 + CD25
SUPPLEMENTARY METHODS
 SUPPLEMENTARY METHODS Histological analysis. Colonic tissues were collected from 5 parts of the middle colon on day 7 after the start of DSS treatment, and then were cut into segments, fixed with 4% paraformaldehyde,
(a) Significant biological processes (upper panel) and disease biomarkers (lower panel)
 Significant biological processes (upper panel) and disease biomarkers (lower panel)") Supplementary Figure 1. Functional enrichment analyses of secretomic proteins. (a) Significant biological processes (upper panel) and disease biomarkers (lower panel) 2 involved by hrab37-mediated secretory
Supplementary Figure 1. Functional enrichment analyses of secretomic proteins. (a) Significant biological processes (upper panel) and disease biomarkers (lower panel) 2 involved by hrab37-mediated secretory
Protein extraction and western blot analysis Protein extraction was performed as
 ESM Methods Protein extraction and western blot analysis Protein extraction was performed as previously described [1]. 2 g protein was loaded on SDSPAGE and immunoblotted with antibodies to mouse AKT (1:1,
Supplemental Materials, Nishimura et al, Page1 of 22 1
 Supplemental Materials, Nishimura et al, Page of 5 Quantitative assessment of Pdx promoter activity in vivo using a secreted luciferase reporter system 6 7 8 9 Wataru Nishimura, Koki Eto, Atsushi Miki,
c Ischemia (30 min) Reperfusion (8 w) Supplementary Figure bp 300 bp Ischemia (30 min) Reperfusion (4 h) Dox 20 mg/kg i.p.
 Reperfusion (8 w) Supplementary Figure bp 300 bp Ischemia (30 min) Reperfusion (4 h) Dox 20 mg/kg i.p.") a Marker Ripk3 +/ 5 bp 3 bp b Ischemia (3 min) Reperfusion (4 h) d 2 mg/kg i.p. 1 w 5 w Sacrifice for IF size A subset for echocardiography and morphological analysis c Ischemia (3 min) Reperfusion (8
a Marker Ripk3 +/ 5 bp 3 bp b Ischemia (3 min) Reperfusion (4 h) d 2 mg/kg i.p. 1 w 5 w Sacrifice for IF size A subset for echocardiography and morphological analysis c Ischemia (3 min) Reperfusion (8
Supplementary Figure 1. SC35M polymerase activity in the presence of Bat or SC35M NP encoded from the phw2000 rescue plasmid.
 1 2 3 4 5 6 7 8 9 10 11 12 13 14 15 16 17 18 19 20 21 22 23 24 25 26 27 Supplementary Figure 1. SC35M polymerase activity in the presence of Bat or SC35M NP encoded from the phw2000 rescue plasmid. HEK293T
Supplementary Figure 1. Characterization of NMuMG-ErbB2 and NIC breast cancer cells expressing shrnas targeting LPP. NMuMG-ErbB2 cells (a) and NIC
 and NIC") Supplementary Figure 1. Characterization of NMuMG-ErbB2 and NIC breast cancer cells expressing shrnas targeting LPP. NMuMG-ErbB2 cells (a) and NIC cells (b) were engineered to stably express either a LucA-shRNA
Supplementary Figure 1. Characterization of NMuMG-ErbB2 and NIC breast cancer cells expressing shrnas targeting LPP. NMuMG-ErbB2 cells (a) and NIC cells (b) were engineered to stably express either a LucA-shRNA
SUPPLEMENTARY DATA. Supplementary Table 1. Primers used for PCR and qpcr Primer Name
 Supplementary Table. Primers used for PCR and qpcr Primer Name ccession Number Fwd Rev Type of PCR Cre NC_8 GGCGTCTTCCGC GTGCCCCTCGTTTG Standard PCR LoUcp CCGGGCTGTCTCCGCGG GGCTGTTCGCCCGGCC Standard PCR
control kda ATGL ATGLi HSL 82 GAPDH * ** *** WT/cTg WT/cTg ATGLi AKO/cTg AKO/cTg ATGLi WT/cTg WT/cTg ATGLi AKO/cTg AKO/cTg ATGLi iwat gwat ibat
 body weight (g) tissue weights (mg) ATGL protein expression (relative to GAPDH) HSL protein expression (relative to GAPDH) ### # # kda ATGL 55 HSL 82 GAPDH 37 2.5 2. 1.5 1..5 2. 1.5 1..5.. Supplementary
SUPPLEMENTARY INFORMATION. Supplementary Figures S1-S9. Supplementary Methods
 SUPPLEMENTARY INFORMATION SUMO1 modification of PTEN regulates tumorigenesis by controlling its association with the plasma membrane Jian Huang 1,2#, Jie Yan 1,2#, Jian Zhang 3#, Shiguo Zhu 1, Yanli Wang
Supplementary data Supplementary Figure 1 Supplementary Figure 2
 Supplementary data Supplementary Figure 1 SPHK1 sirna increases RANKL-induced osteoclastogenesis in RAW264.7 cell culture. (A) RAW264.7 cells were transfected with oligocassettes containing SPHK1 sirna
Supplementary Figure 1. Prevalence of U539C and G540A nucleotide and E172K amino acid substitutions among H9N2 viruses. Full-length H9N2 NS
 Supplementary Figure 1. Prevalence of U539C and G540A nucleotide and E172K amino acid substitutions among H9N2 viruses. Full-length H9N2 NS nucleotide sequences (a, b) or amino acid sequences (c) from
Epithelial interleukin-25 is a key mediator in Th2-high, corticosteroid-responsive
 Online Data Supplement: Epithelial interleukin-25 is a key mediator in Th2-high, corticosteroid-responsive asthma Dan Cheng, Zheng Xue, Lingling Yi, Huimin Shi, Kan Zhang, Xiaorong Huo, Luke R. Bonser,
Supplemental Information. Menin Deficiency Leads to Depressive-like. Behaviors in Mice by Modulating. Astrocyte-Mediated Neuroinflammation
 Neuron, Volume 100 Supplemental Information Menin Deficiency Leads to Depressive-like Behaviors in Mice by Modulating Astrocyte-Mediated Neuroinflammation Lige Leng, Kai Zhuang, Zeyue Liu, Changquan Huang,
Figure legends Supplemental Fig.1. Glucose-induced insulin secretion and insulin content of islets. Supplemental Fig. 2.
 Figure legends Supplemental Fig.. Glucose-induced insulin secretion and insulin content of islets. Insulin secretory responses to.,., and. mm glucose (A) (n = 7-), and the insulin content in the islets
RNA extraction, RT-PCR and real-time PCR. Total RNA were extracted using
 Supplementary Information Materials and Methods RNA extraction, RT-PCR and real-time PCR. Total RNA were extracted using Trizol reagent (Invitrogen,Carlsbad, CA) according to the manufacturer's instructions.
Supplemental Information. Otic Mesenchyme Cells Regulate. Spiral Ganglion Axon Fasciculation. through a Pou3f4/EphA4 Signaling Pathway
 Neuron, Volume 73 Supplemental Information Otic Mesenchyme Cells Regulate Spiral Ganglion Axon Fasciculation through a Pou3f4/EphA4 Signaling Pathway Thomas M. Coate, Steven Raft, Xiumei Zhao, Aimee K.
Supporting Information
 Supporting Information Soltani et al. 10.1073/pnas.1102715108 SI Experimental Procedures Evaluation of Mice and Drug Administration. IPGTT, insulin tolerance test, and glucagon tolerance test were performed
SUPPLEMENTARY INFORMATION
 SUPPLEMENTARY INFORMATION doi:10.1038/nature11464 Supplemental Figure S1. The expression of Vegfb is increased in obese and diabetic mice as compared to lean mice. a-b, Body weight and postprandial blood
SUPPLEMENTARY DATA. Supplementary Table 1. Primers used in qpcr
 Supplementary Table 1. Primers used in qpcr Gene forward primer (5'-3') reverse primer (5'-3') β-actin AGAGGGAAATCGTGCGTGAC CAATAGTGATGACCTGGCCGT Hif-p4h-2 CTGGGCAACTACAGGATAAAC GCGTCCCAGTCTTTATTTAGATA
Supplementary Figure 1. Confocal immunofluorescence showing mitochondrial translocation of Drp1. Cardiomyocytes treated with H 2 O 2 were prestained
 Supplementary Figure 1. Confocal immunofluorescence showing mitochondrial translocation of Drp1. Cardiomyocytes treated with H 2 O 2 were prestained with MitoTracker (red), then were immunostained with
Supplementary Fig. 1. Delivery of mirnas via Red Fluorescent Protein.
 prfp-vector RFP Exon1 Intron RFP Exon2 prfp-mir-124 mir-93/124 RFP Exon1 Intron RFP Exon2 Untransfected prfp-vector prfp-mir-93 prfp-mir-124 Supplementary Fig. 1. Delivery of mirnas via Red Fluorescent
ZL ZDF ZDF + E2 *** Visceral (g) ZDF
 ZDF") Body Weight (g) 4 3 2 1 ** * ZL ZDF 6 8 1 12 14 16 Age (weeks) B * Sub-cutaneous (g) 16 12 8 4 ZL ZDF Visceral (g) 25 2 15 1 5 ZL ZDF Total fat pad weight (g) 4 3 2 1 ZDF ZL Supplemental Figure 1: Effect
Body Weight (g) 4 3 2 1 ** * ZL ZDF 6 8 1 12 14 16 Age (weeks) B * Sub-cutaneous (g) 16 12 8 4 ZL ZDF Visceral (g) 25 2 15 1 5 ZL ZDF Total fat pad weight (g) 4 3 2 1 ZDF ZL Supplemental Figure 1: Effect
Figure S1. (A) Schematic diagram of dnrar transgene allele. (B) X-Gal staining of testis from
 Schematic diagram of dnrar transgene allele. (B) X-Gal staining of testis from") Figure S1. (A) Schematic diagram of dnrar transgene allele. (B) X-Gal staining of testis from germ cell mutants (dnrar flox/flox, Stra8-Cre +, RARElacZ) (A ), controls (dnrar flox/flox, RARElacZ) (B ),
Figure S1. (A) Schematic diagram of dnrar transgene allele. (B) X-Gal staining of testis from germ cell mutants (dnrar flox/flox, Stra8-Cre +, RARElacZ) (A ), controls (dnrar flox/flox, RARElacZ) (B ),
Role of the ventromedial hypothalamic Steroidogenic Factor 1/ Adrenal 4. glucose metabolism in mice.
 Role of the ventromedial hypothalamic Steroidogenic Factor 1/ Adrenal 4 Binding Protein neurons in the regulation of whole body energy and glucose metabolism in mice. Eulalia Coutinho Department of Physiological
AAV-TBGp-Cre treatment resulted in hepatocyte-specific GH receptor gene recombination
 AAV-TBGp-Cre treatment resulted in hepatocyte-specific GH receptor gene recombination Supplementary Figure 1. Generation of the adult-onset, liver-specific GH receptor knock-down (alivghrkd, Kd) mouse
EPIGENETIC RE-EXPRESSION OF HIF-2α SUPPRESSES SOFT TISSUE SARCOMA GROWTH
 EPIGENETIC RE-EXPRESSION OF HIF-2α SUPPRESSES SOFT TISSUE SARCOMA GROWTH Supplementary Figure 1. Supplementary Figure 1. Characterization of KP and KPH2 autochthonous UPS tumors. a) Genotyping of KPH2
Supplementary Figure 1. Blood glucose and insulin levels in mice during 4-day infusion.
 Supplementary Figure 1. Blood glucose and insulin levels in mice during 4-day infusion. (A-B) WT and HT mice infused with saline or glucose had overlapping achieved blood glucose and insulin levels, necessitating