Arizona Health Care Cost Containment System
|
|
|
- Julius Hodge
- 6 years ago
- Views:
Transcription

1 Arizona Health Care Cost Containment System DIABETES MANAGEMENT PERFORMANCE IMPROVEMENT PROJECT FINAL REPORT Prepared by the Division of Health Care Management October 2006 Anthony D. Rodgers Director, AHCCCS
2 For questions or comments about this report, contact: Rochelle Tigner Quality Improvement Manager, Clinical Quality Management Division of Health Care Management, AHCCCS (602)
3 Arizona Health Care Cost Containment System (AHCCCS) DIABETES MANAGEMENT PERFORMANCE IMPROVEMENT PROJECT Final Report INTRODUCTION The Burden of Diabetes... 1 What is Diabetes?... 1 The Importance of Glucose Control... 2 PROJECT METHODS Measurement Criteria. 3 Population... 3 Sample Frame... 3 Measurement Periods... 3 Data Sources... 4 Study Sample. 4 Data Collection... 4 Data Quality and Reliability... 4 Study Indicators... 4 National Benchmarks... 5 Performance Improvement Goals... 5 Intervention and Re-evaluation Process. 5 RESULTS AND ANALYSIS Included Cases... 6 Hb A1c Testing... 6 Hb A1c Levels... 6 Contractor Performance... 6 Data Validation Studies. 7 DISCUSSION Overall Results... 7 Contractor Interventions... 8 Conclusion... 9 REFERENCES 9 TABLES AND FIGURES 11 APPENDIX: METHODOLOGY AND TECHNICAL SPECIFICATIONS i
4 Arizona Health Care Cost Containment System (AHCCCS) DIABETES MANAGEMENT PERFORMANCE IMPROVEMENT PROJECT Final Report INTRODUCTION The Burden of Diabetes The federal Centers for Disease Control and Prevention (CDC) estimates that more than 20 million Americans age 20 years and older, or 9.6 percent of all people in this age group, have diabetes. About 1.5 million new cases of diabetes were diagnosed among people 20 years and older in An estimated 244,000 Arizona adults had a diagnosis of diabetes in 2002, the most recent year for which state-specific data are available. 2 Diabetes was the sixth leading cause of death in the United States in 2002, causing or contributing to at least 224,000 deaths. 3 In the United States, Hispanics, blacks, American Indians and Alaska natives are twice as likely to have diabetes than non- Hispanic whites. 1 National data also show higher rates of diabetes among people with low socioeconomic status or those covered by Medicaid, men and people age 60 and older. 1,4 The number of people in the United States with diagnosed diabetes has more than doubled in the last 15 years. 5 The prevalence of diabetes in Arizona also has increased during that time. 6 Contributing to this increase is the large number of baby boomers who are aging and living longer than previous generations. A sedentary lifestyle and a dramatic rise of obesity in the U.S. population also are increasing the incidence of diabetes. 7 Total U.S. expenditures related to diabetes were approximately $132 billion in 2002 About one out of every 10 health care dollars in the United States is spent on diabetes and its complications. Total U.S. expenditures related to diabetes were approximately $132 billion in 2002 $92 billion in direct medical costs and another $40 billion in indirect costs because of missed work days or other losses in productivity. 9 At least 4 million hospitalizations and more than 26 million outpatient visits annually in the U.S. are associated with diabetes. 8,10 What is Diabetes? Diabetes mellitus is a group of chronic diseases characterized by high levels of blood glucose, which occur when the body does not properly produce or use insulin. Insulin is a hormone that is needed to convert carbohydrates into glucose, a simple sugar that is a primary source of energy. Both genetics and lifestyle, such as obesity and lack of exercise, are associated with the disease. 3 1
5 There are several types of diabetes: 3 Type 1 diabetes accounts for 5 to 10 percent of all diagnosed cases, and occurs when the cells that produce insulin are destroyed. Type 1 diabetes usually begins in childhood or adolescence, and has been called juvenile-onset diabetes. Type 2 diabetes, which accounts for 90 to 95 percent of diagnosed cases, occurs as the body develops insulin resistance or the pancreas loses the ability to produce insulin. Type 2 is associated with both genetic and behavioral factors, including age, obesity, physical inactivity, family history and race or ethnicity. Normally seen in adults, type 2 diabetes is on the rise in children and young adults, particularly among American Indians, African Americans and Hispanic or Latino Americans. Gestational diabetes, which is diagnosed in about 4 percent of women during pregnancy, and may be manifested later as type 2 diabetes. Other types of diabetes result from specific genetic conditions, drugs, malnutrition, infections and other illnesses. These types account for 1 percent to 5 percent of diagnosed cases. Up to 70 percent of people with diabetes have mild to severe forms of nervous system damage With diabetes, sustained high blood sugars result in microvascular complications; that is, damage to the very fine blood vessels of the eyes, peripheral nerves and kidneys. Diabetic retinopathy (damage to the retina of the eye) causes 12,000 to 24,000 new cases of blindness each year. Up to 70 percent of people with diabetes have mild to severe forms of nervous system damage, including impaired sensation or pain in the feet or hands, slowed digestion of food, 2 carpal tunnel syndrome and other nerve problems. 3 Macrovascular complications include coronary and peripheral artery disease, which may lead to heart attack or stroke, and amputation. As with many diseases, other conditions (known as comorbid conditions) may be present with diabetes. The Importance of Glucose Control Despite its deadly effects, diabetes can be controlled. Many complications of the disease can be prevented or reduced with early detection, improved care and better education of patients in self-management techniques. 5,11 Control of hyperglycemia (increased blood sugar) is critical to reducing both the incidence and progression of complications associated with diabetes. Physicians utilize a glycosylated hemoglobin, or Hb A 1c, test to monitor patients blood glucose levels. This test indicates a person s average glucose level over a two- to three-month period by measuring the amount of glucose that has bonded with hemoglobin in the body s red blood cells. Studies in the United States and abroad have shown that improved glycemic control benefits people with either type 1 or type 2 diabetes. In general, for every percentage point decrease in Hb A 1c levels, the risk of developing microvascular complications is reduced by 35 to 40 percent. 3,12,13 This performance improvement project (PIP) was initiated in Its purpose was to increase the rate of Hb A 1c testing among adults with diabetes who were enrolled with the Arizona Health Care Cost Containment System (AHCCCS) and to reduce the proportion of those members whose blood glucose was poorly controlled.
6 PROJECT METHODS Measurement Criteria AHCCCS used Health Plan Employer Data and Information Set (HEDIS) specifications from the National Committee for Quality Assurance (NCQA) as a guideline for measurement of diabetes management. HEDIS methodology includes six indicators of comprehensive diabetes care. For purposes of this PIP, AHCCCS chose to focus on two critical indicators: Hb A 1c testing and Hb A 1c levels. It should be noted that, while the HEDIS indicators are based on clinical considerations, they are not the same as treatment guidelines. HEDIS measurement criteria differ from clinical standards, such as those set forth by the American Diabetes Association (ADA) and the American Association of Clinical Endocrinologists (AACE), for frequency of Hb A 1c testing and optimum laboratory values. However, HEDIS specifications provide a standardized method for valid and reliable measurements of these services, and results can be compared with data reported to NCQA by other health care organizations using this methodology. HEDIS methodology was used to establish baseline rates for each indicator, and to remeasure rates after interventions to improve utilization of services were implemented. Population The population included in each measurement consisted of members ages 18 to 75 who were diagnosed with type 1 or type 2 diabetes, as identified by HEDIS criteria. 3 Tribal and fee-for-service members were excluded from this study due to the inability to accurately collect complete data on these populations. Often these members seek medical care outside of the AHCCCS system using their Indian Health Service or Medicare benefits. Therefore, information on Hb A 1c testing is not available from AHCCCS encounter data. Sample Frame The sample frame consisted of members who: were ages 18 through 75 years as of September 30 of the measurement period, were continuously enrolled with one AHCCCS-contracted health plan (Contractor), with no more than one gap in enrollment, not exceeding 31 days, as of September 30, and had a diagnosis of type 1 or type 2 diabetes in the measurement period or the year prior to the measurement period. Members were identified as having type 1 or type 2 diabetes by either pharmacy or encounter data (records of claims paid for covered services). For example, a member was identified as having diabetes if he or she had one face-to-face encounter with a diagnosis of diabetes in an acute inpatient or emergency room setting during the measurement period or the previous year. Measurement Periods Multiple measurements were conducted to determine whether contracted health plans (Contractors) demonstrated improvement over their baseline rates and at least maintained that level of performance for an additional year. Contractors were allowed a year between the baseline and first remeasurement to implement interventions to improve Hb A1c testing and levels.
7 Measurements for this PIP were based on AHCCCS contract years, as follows: Baseline - October 1, 2000, through September 30, 2001 First Remeasurement - October 1, 2002, through September 30, 2003 Second Remeasurement - October 1, 2003, through September 30, 2004 AHCCCS conducted an additional measurement of performance by one Contractor that did not previously demonstrate sustained improvement, which included the contract year October 1, 2004, through September 30, Data Sources AHCCCS uses a statewide, automated managed care data system known as the Prepaid Medical Management Information System (PMMIS). AHCCCS enrollment and encounter data contained in PMMIS were used to select sample members for this study and to collect data on any Hb A 1c tests provided to sample members during the measurement period. These data were supplemented by data collected by Contractors from their claims systems and/or medical and laboratory records. Study Sample For each measurement, AHCCCS selected a sample stratified by program type (i.e., Acute-care health plans vs. long-term care plans) and individual Contractor. A statistical software program was used to select a representative, random sample, using a 95-percent confidence level and a confidence interval of +/-5 percent. Based on prior studies, an over sampling rate of 10 percent was utilized. Data Collection AHCCCS initially collected data on Hb A 1c testing from its encounter system (laboratory values for Hb A 1c levels were not available from encounter data). When AHCCCS did not find encounters for Hb 4 A 1c tests for sample members within the measurement period, it required Contractors to collect data for those members. Contractors collected additional data for tests performed, as well as Hb A 1c levels for all sample members tested during the measurement period. This information was entered by Contractor staff into a standardized electronic data collection tool, according to detailed instructions from AHCCCS. Data Quality and Reliability AHCCCS conducts studies to evaluate the accuracy of encounter data. Based on the most recent data validation study, more than 90 percent of all encounters in PMMIS are accurate when compared with the corresponding medical records. Contractors were required to submit information to validate any additional data collected (e.g., hard copies of the appropriate sections of medical records or electronic laboratory data) with their completed electronic data collection tools. Study Indicators Hb A 1c testing This indicator measured the percent of members who had one or more Hb A 1c tests during the measurement period. Hb A 1c level This indicator measured the percent of members whose most recent Hb A 1c tests during the measurement period showed blood-glucose levels greater than 9.5 percent (the level at which HEDIS criteria indicated poor control of blood glucose when this PIP was initiated; the HEDIS level for poor control has since been lowered). According to HEDIS criteria, if there was no documentation of a test performed during the measurement period or if a laboratory level for a test was not documented, the member was considered to have poor glucose control.
8 National Benchmarks AHCCCS utilized as benchmarks for these indicators the most recent national HEDIS averages for Medicaid health plans that were available at the time the baseline measurement was collected in The Medicaid mean (average) for annual Hb A 1c testing was 68.5 percent. The mean for poor control of blood-glucose for Medicaid plans was 54.9 percent. (The current Medicaid averages, based on calendar year 2004 data, are 76.0 percent for Hb A 1c testing and 48.6 percent for poor control.). Performance Improvement Goals Through this performance improvement project, all Contractors were expected to increase their rates of annual Hb A 1c testing and reduce the proportion of members with poorly controlled diabetes (those with Hb A 1c levels greater than 9.5 percent.). Improvement was determined according to whether Contractors narrowed the gap between their baseline rates and the benchmark, as follows: When a Contractor s baseline rate for either indicator was below the AHCCCS overall average for the baseline measurement, it must have improved its rate to meet or exceed the AHCCCS baseline average, and the change must have been statistically significant (p<.05). When the Contractor s baseline rate was above the AHCCCS overall average, but below the NCQA average at baseline, it must have met or exceeded the NCQA rate on the first remeasurement, and the change must have been statistically significant. When the Contractor achieved a rate for the first remeasurement that was at or above the NCQA benchmark. Contractors that demonstrated improvement from the baseline to first remeasurement or achieved the benchmark rate must have at least maintained that level of performance for the second remeasurement to meet the AHCCCS requirement of sustained improvement for PIPs. Contractors that achieved demonstrable and sustained improvement in the second remeasurement were considered to have completed this PIP. Any Contractor who did not show demonstrable and sustained improvement by the second remeasurement was required to continue the project until it met that standard. Intervention and Re-evaluation Process In addition to the baseline measurement and remeasurements of performance conducted by AHCCCS, the agency provided technical assistance to Contractors on barriers to Hb A 1c testing and strategies to improve care. This included researching and providing information on evidence-based practices to improve diabetes management, providing educational presentations at regular AHCCCS meetings with Contractors, and advising them of other educational opportunities and resources. Contractors began implementing interventions to improve their rates in CYE 2003, after the baseline measurement was collected and analyzed by AHCCCS. After the first remeasurement, Contractors reported to AHCCCS when specific interventions were implemented and an evaluation of their effectiveness. If a Contractor did not show improvement over its baseline rates, it was expected to revise or enhance existing strategies and/or add new interventions. 5
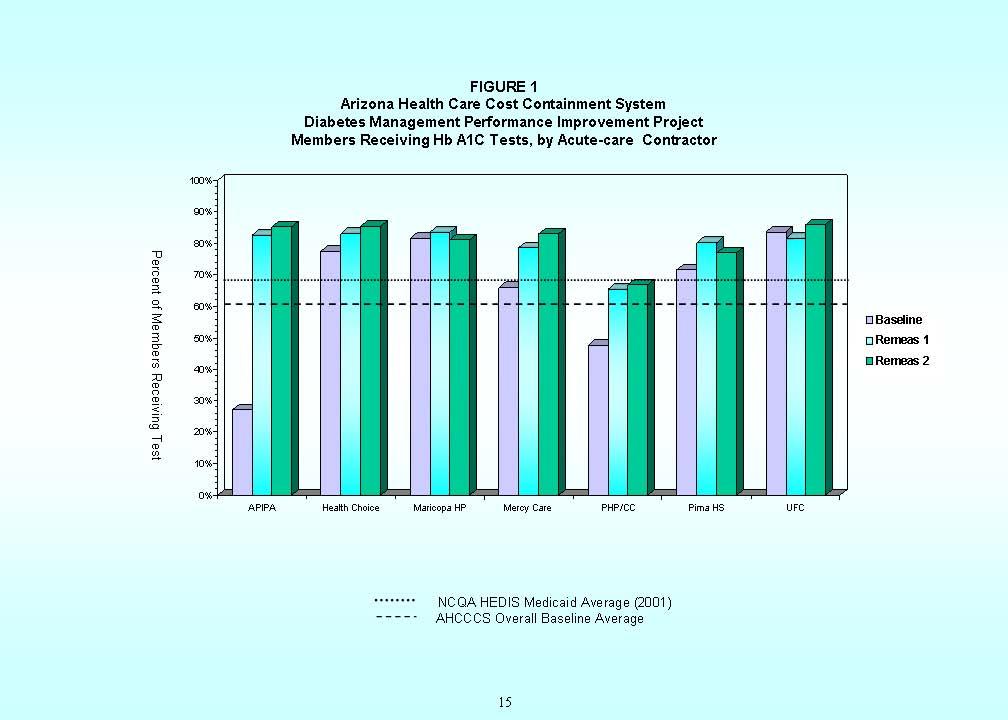
9 RESULTS AND ANALYSIS Included Cases The baseline measurement included 2,945 members with diabetes who were enrolled with Acute-care Contractors or Arizona Long Term Care System (ALTCS) Contractors. This total included members with two health plans that no longer contract with AHCCCS, CIGNA Community Choice and Family Health Plan of Northeastern Arizona. Data for these health plans were subsequently excluded from the PIP, leaving a baseline measurement that consisted of 2,673 sample members. The first and second remeasurements included 3,248 members and 3,360 members, respectively, who were enrolled with 15 Contractors. Hb A 1c Testing Overall, the proportion of members who had at least one Hb A 1c test during the measurement period increased from the baseline measurement to the first remeasurement (p<.001), as shown in Table 1. After exclusion of members from the two health plans, the overall proportion of members who received an Hb A 1c test during the baseline measurement period was 60.8 percent, compared with the overall rate for the first remeasurement of 76.3 percent. The overall rate further improved in the second remeasurement, with a rate of 79.5 percent (p<.001), as shown in Table 2. Hb A 1c Levels (Poor Control) Overall, 49.4 percent of members in the revised baseline measurement (after exclusion of the two health plans data) were considered to have poor control of blood-glucose levels. The first remeasurement showed a reduction in the rate of poorly controlled levels, to 37.4 percent (p<.001), as shown in Table 3. The overall rate of poor control further improved in the second remeasurement, with a rate of 30.9 percent (p<.001), as shown in Table AHCCCS Diabetes Care PIP, Overall Baseline and Remeasurement Rates Testing Baseline Remeas 1 Remeas 2 Poor Control* * Note: Lower rates for this indicator are better. Rates for both indicators also were analyzed by program type (Acute-care or ALTCS) and by individual Contractors (Tables 1 through 4). Contractor Performance From baseline to the first remeasurement, all but one Contractor, Evercare Select, showed statistically significant improvement and/or achieved the benchmark level of performance (the NCQA Medicaid average of 68.5 percent) for Hb A 1c testing. The number of plans exceeding the NCQA benchmark increased from five (33.3 percent) in the baseline measurement to 11 ( 73.3 percent) in the first remeasurement, as shown in Figures 1 and 2. 6
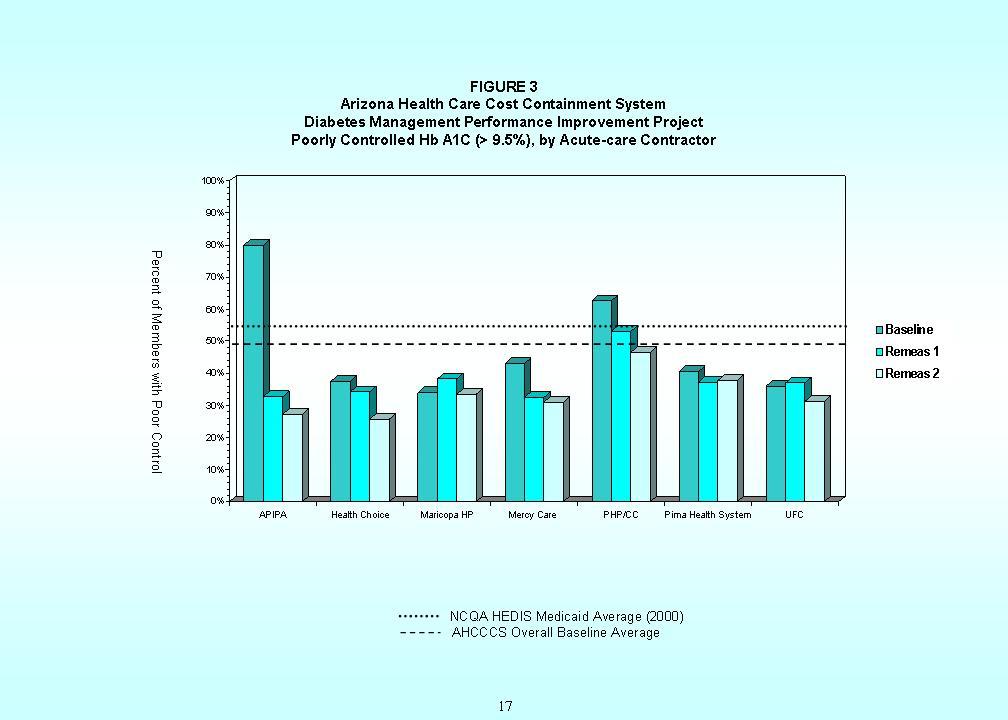
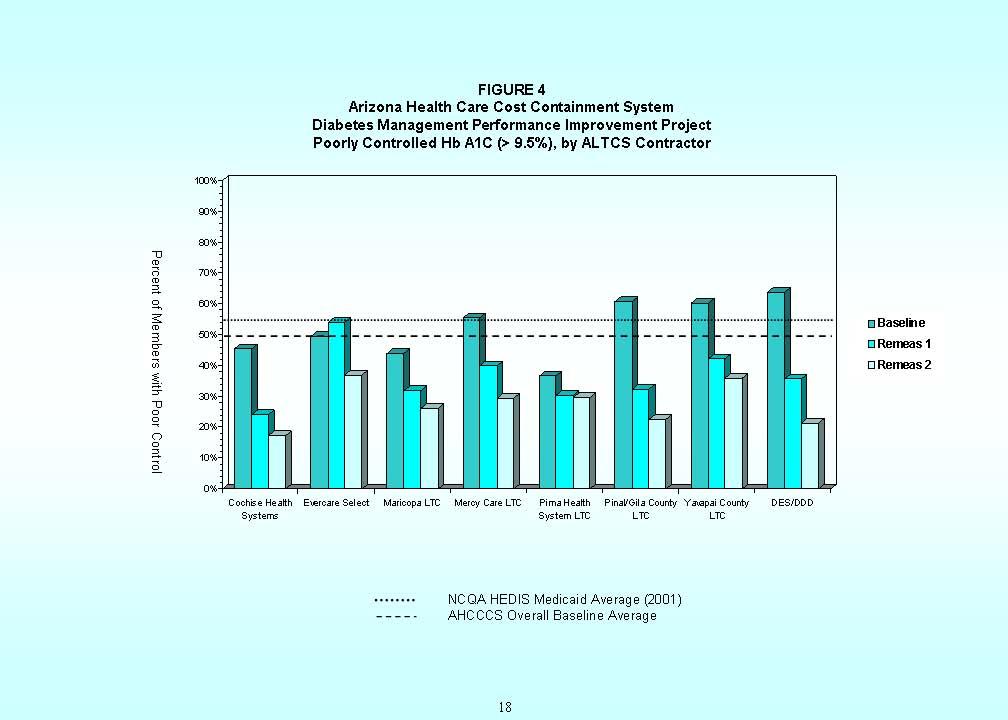
10 In the second remeasurement, all Contractors sustained (i.e., did not show a statistically significant decrease) or improved their levels of performance in Hb A 1c testing. Evercare Select, which showed no statistically significant change from the baseline to first remeasurement (p=.243), demonstrated a statistically significant increase in its rate between the first and second remeasurements (p=.046). For poor control of Hb A 1c levels, all Contractors showed statistically significant improvement and/or achieved the benchmark (i.e., under the NCQA Medicaid average of 54.9 percent) from the baseline to first remeasurement. The number of plans with rates better than the NCQA benchmark increased from nine (60.0 percent) in the baseline measurement to 15 (100.0%) in the first remeasurement, as shown in Figures 3 and 4. All Contractors maintained or further improved their levels of performance in the second remeasurement. In order to verify that Evercare Select had sustained or improved its level of HbA1c testing, another remeasurement was conducted for this Contractor only. As shown in Table 5A, Evercare Select further improved its level of Hb A 1c testing during the third remeasurement, to 77.2 percent from 66.9 percent in the second remeasurement (p<.001). The Contractor sustained its previous improvement in the indicator of poor control (Table 5B). Data Validation Studies AHCCCS validated data submitted by Contractors for the first remeasurement of this project. A double-blind validation study was performed by AHCCCS in May 2005, matching the medical record or laboratory data with data on the Contractor s electronic file. The results of this validation showed a Kappa agreement of 77.0 percent for Hb A 1c testing data and 84.0 percent for Hb A 1c levels, for a total agreement of 82.6 percent, as shown in Table 6. Data also were validated by individual Contractor, as shown in Table 7. One Contractor, Health Choice Arizona, did not provide adequate documentation to validate its data. Excluding data for this Contractor, the overall Kappa agreement was 88.8 percent for Hb A 1c testing and 91.7 percent for Hb A 1c levels, for a total agreement of 91.5 percent (Table 6). Because data for Health Choice Arizona could not be validated for the first remeasurement, AHCCCS conducted a validation study on data collected by this Contractor for the second remeasurement. As shown in Table 8, the total Kappa agreement for Health Choice was 97.9 percent. The Kappa agreement was 96.8 percent for Hb A 1c testing and 97.5 percent for Hb A 1c levels. DISCUSSION Overall Results This Performance Improvement Project resulted in improvements in both HbA1c testing and the proportion of members with poorly controlled blood glucose. With nearly 80 percent of sample members receiving at least one Hb A 1c test in the second remeasurement period, less than 7 one-third had Hb A 1c levels greater than 9.5 percent (including those members who did not have a test or documentation of the laboratory value). These improvements can be associated with interventions implemented by Contractors during the project period, as well as ongoing technical assistance provided by AHCCCS.
.")
11 The American Diabetes Association recommends that people with diabetes maintain an Hb A 1c level of less than 7.0 percent. 14 Among eight ALTCS Contractors, members enrolled with seven plans had median Hb A 1c levels of less than 7.0 percent in the second remeasurement (Table 4). The median level among all members at the end of the project was 7.0 percent. The American Diabetes Association recommends an HbA1c level of less than 7.0 percent Contractor Interventions After completing analysis of baseline data, AHCCCS identified barriers to Hb A1c testing and control, as well as successful strategies for increasing the rate of testing. This research and potential interventions were discussed in the report on the baseline measurement for this PIP, published by AHCCCS in In general, diabetes is difficult to treat because of the involvement of many body systems, requiring patients to adhere to daily and sometimes complex interventions to control the disease. Controlling blood glucose involves following a careful diet and exercise program, losing excess weight, and taking insulin and/or oral medication. Many people with diabetes face difficulty in altering their lifestyles to accommodate all these measures. Because diabetes is frequently an asymptomatic disease, patients may not adhere to treatment regimens or utilize preventive-care services such as regular blood-glucose testing. 12 Patients socioeconomic status also may pose a barrier to use of preventive-care services. Lower levels of education are associated with patients not adhering to recommendations for diabetes self management. This likely is related to a lack of understandable or relevant patient education materials. 13,14 Physicians also face barriers in ensuring that patients receive preventive-care services and have adequately controlled glucose levels. Common physician barriers include confusion caused by differing recommendations regarding testing and treatment, the need for frequent monitoring and medication adjustments to achieve treatment goals, and time limitations. 11,13 Contractors also evaluated their baseline data and developed or enhanced existing activities to improve Hb A 1c testing and levels. Based on this research and analysis, health plans implemented interventions that included: Distribution of clinical practice guidelines for diabetes care to primary care practitioners (PCPs) and other providers, such as nursing and assisted living facilities Providing clinical tools to PCP offices and nursing facilities, such as a diabetes flow sheet, which is placed in a member s medical chart as a reminder to perform Hb A 1c testing and other preventive-care services Utilizing disease management or case management staff to contact members with diabetes to ensure they have Hb A 1c tests 8
12 Implementing methods to better identify members with diabetes in order to facilitate tracking and follow up Monitoring Hb A 1c testing through chart reviews or claims reports, and providing feedback to PCPs whose diabetic members did not have tests Regularly informing health plan case managers, PCPs and other providers of the health plan s overall results under this PIP Regularly providing information to members with diabetes, to help ensure they receive appropriate tests as needed Use of diabetes educators and referral to diabetes education classes to help members better understand and participate in managing their disease Table 9 provides more information about Contractors specific interventions under this PIP. Conclusion Contractors have submitted final reports on this PIP to AHCCCS, chronicling their interventions and evaluating the success of this project as it relates to their members. All Contractors reported that effective interventions will be ongoing. One ALTCS Contractor, in its final report, stated that it has been literally bombarding members and providers with information about diabetes. (Contractor staff feel) that there is a direct correlation between our educational interventions and the steady, sustained improvement in both the Hb A 1c testing indicator and the poor Hb A 1c control indicator. It should be noted that the AHCCCS overall rates of Hb A 1c testing and poor control as of the second remeasurement (CYE 2004) are better than the current HEDIS means. The overall AHCCCS rate of 79.5 percent for Hb A 1c testing exceeds the HEDIS 2005 mean of 76.0 percent for Medicaid plans nationally. The overall AHCCCS rate of 30.9 percent for poor control places the Arizona Medicaid program in the top 10 percent of Medicaid plans nationally, and is equivalent to the mean for commercial health plans. AHCCCS Overall Rates vs. HEDIS Means AHCCCS Rate, 2004 Medicaid Mean, 2005 Commercial Mean, 2005 Measure Hb A 1c Testing % 86.5% Poor Control* % 30.7% * Note: Lower rates for this indicator are better. Finally, while this project measured whether members received a minimum of one Hb A 1c test annually according to HEDIS criteria, clinical practice guidelines recommend Hb A 1c testing at least twice a year for patients who have stable glycemic control and quarterly for patients who are not meeting glycemic goals. To further improve care and health outcomes for members with diabetes, Contractors should continue to focus on ensuring that members with diabetes receive Hb A 1c tests and other preventive-care services at the recommended intervals. REFERENCES 1 American Diabetes Association. Total prevalence of diabetes and pre-diabetes. Available at: Accessed July 27, Centers for Disease Control and Prevention. Diabetes surveillance system: State-specific estimates of diagnosed diabetes among adults. Centers for Disease Control and Prevention, National Center for Chronic Disease Prevention and Health Promotion. Available at: e/table15.htm. Accessed September 15,
13 3 Centers for Disease Control and Prevention. National diabetes fact sheet Atlanta, GA. U.S. Department of Health and Human Services, Centers for Disease Control and Prevention Available at: m. Accessed July 27, National Center for Health Statistics. Health, United States, Table 8: Age-adjusted percentages (with standard errors) of selected diseases and conditions among persons 18 years of age and over, by selected characteristics: United states, Centers for Disease Control and Prevention. Hyattsville, Maryland: Available at: Accessed September 20, Centers for Disease Control and Prevention. Diabetes: disabling, deadly, and on the rise. Centers for Disease Control and Prevention, National Center for Chronic Disease Prevention and Health Promotion. Available at: pdf. Accessed September 22, Centers for Disease Control and Prevention, National Center for Chronic Disease Prevention and Health Promotion. Behavioral Risk Factor Surveillance System Prevalence Data.. Available at: _c=2004&yr=2005&cat=db&state=az&bkey = &qkey=1363&qtype=C&grp=0&S UBMIT2=Compare. Accessed September 15, 2004, and September 22, National Diabetes Information Clearinghouse. Diabetes overview. National Institute of Diabetes and Digestive and Kidney Diseases. Available at: w/index.htm#who. Accessed August 30, American Diabetes Association. Economic costs of diabetes in the US in Diabetes Care. 2003;26: Available at: nt/full/26/3/917. Accessed March 19, Centers for Disease Control and Prevention. Indicators for chronic disease surveillance. MMWR. 2004; 53(RR-11):100. Available at: l/rr5311a1.htm Accessed September 22, Beers MH, Berkow R, eds. The Merck Manual of Diagnosis and Therapy. 17th ed. Whitehouse Station, NJ: Merck Research Laboratories; American Diabetes Association. Standards of medical care in diabetes Diabetes Care. 2006; 29:S4-S42. Available at: /29/suppl_1/s4. Accessed July 27, Centers for Disease Control and Prevention, National Center for Chronic Disease Prevention and Health Promotion. Preventing diabetes and its complications. Available at: heets/prevention/diabetes.htm. Accessed September 22, Osterweil N. Tight glucose control may provide long-term benefits in diabetics. Medscape Medical News, Available at: Accessed June 16, American Diabetes Association. News release: Call for a new commitment to diabetes care in America. June 11, Available at: Accessed July 27, 2006
14 TABLE 1 AHCCCS Diabetes Management Performance Improvement Project Members Receiving Hb A1c Tests, by Contractor First Remeasurement (CYE 2003) compared with Baseline Measurement (CYE 2001) Contractor Included Cases Number Receiving Hb A1c Test Percent Receiving Hb A1c Test Relative Change Significance Level APIPA % 204.9% p< % Health Choice Arizona % 7.2% p= % Maricopa Health Plan % 2.5% p= % Mercy Care Plan % 19.4% p< % Phoenix Health Plan/ Community Connection % 37.4% p< % Pima Health System % 12.2% p= % University Family Care % -2.6% p= % ACUTE Subtotal % 26.9% p< % Cochise Health Systems % 29.5% p= % Evercare Select % -11.8% p= % Maricopa LTC % 25.3% p< % Mercy Care LTC % 52.0% p= % Pima Health System LTC % 8.6% p= % Pinal/Gila County LTC % 86.5% p< % Yavapai County LTC % 43.0% p= % DES/DDD % 86.3% p< % ALTCS Subtotal % 24.1% p< % OVERALL % 25.5% p< % Notes: (1) Shaded rows reflect results of the baseline measurement (October 1, 2000, through September 30, 2001). (2) Significance levels in bold indicate statistically significant change 11
15 TABLE 2 AHCCCS Diabetes Management Performance Improvement Project Members Receiving Hb A1c Tests, by Contractor Second Remeasurement (CYE 2004) compared with First Remeasurement (CYE 2003) Contractor Included Cases Number Receiving Hb A1c Test Percent Receiving Hb A1c Test Relative Change Significance Level APIPA % 3.3% p= % Health Choice Arizona % 2.8% p= % Maricopa Health Plan % -2.9% p= % Mercy Care Plan % 5.3% p= % Plan/Community % 2.3% p= % Pima Health System % -4.2% p= % University Family Care % 5.4% p= % ACUTE Subtotal % 1.9% p= % Cochise Health Systems % 9.5% p= % Evercare Select % 21.1% p= % Maricopa LTC % 3.0% p= % Mercy Care LTC % 13.8% p= % Pima Health System LTC % -2.1% p= % Pinal/Gila County LTC % 19.6% p= % Yavapai County LTC % 13.9% p= % DES/DDD % 11.9% p= % ALTCS Subtotal % 9.3% p< % OVERALL % 4.3% p= % Notes: (1) Shaded rows reflect results of the first remeasurement (October 1, 2002, through September 30, (2) Significance levels in bold indicate statistically significant change 12
16 TABLE 3 AHCCCS Diabetes Management Performance Improvement Project Members with Poorly Controlled Hb A1c Levels, by Contractor First Remeasurement (CYE 2003) compared with Baseline Measurement (CYE 2001) Number with Hb A1c Level >9.5% Percent with Hb A1c Level >9.5% Relative Change in Levels >9.5% Contractor Included Cases Median Hb A1c Level Significance Level APIPA % 7.3 (6.3,8.9) -59.0% p= % 7.9 (6.7,9.8) Health Choice % 7.4 (6.3,9.1) -9.2% p= % 7.2 (6.3,9.1) Maricopa Health Plan % 7.9 (6.9,9.7) 12.4% p= % 7.2 (6,9) Mercy Care % 7.0(6.2,8.3) -24.3% p= % 7.2(6.3,8.4) Phoenix Health Plan/ Community Connection % 7.6 (6.4,9.7) -15.3% p= % 7.7 (6.6,9.3) Pima Health System % 7.5 (6.4,9.3) -8.2% p= % 7.2 (6.1,8.9) University Family Care % 7.3 (6.5,9.2) 2.9% p= % 7.9 (6.9,9.4) ACUTE Subtotal % 7.4 (6.4,9.2) -24.1% p= % 7.4 (6.3,9.1) Cochise Health Systems % 6.7 (5.7,7.6) -47.0% p= % 6.6 (5.6,7.7) Evercare Select % 6.7(6.2,7.8) 9.9% p= % 7.0(6,8.6) Maricopa LTC % 7.3 (6.2,8.6) -27.6% p= % 6.6(5.6,8) Mercy Care LTC % 6.8 (6.0,8.4) -28.0% p= % 6.9 (6.1,7.5) Pima Health System LTC % 6.9 (5.9,8.2) -17.2% p= % 6.7 (6,8.3) Pinal/Gila County LTC % 6.8 (6.0,7.9) -46.8% p= % 7.5 (6,8.6) Yavapai County LTC % 6.9 (6.0,8.4) -29.9% p= % 7.9 (6.7,9) DES/DDD % 6.5 (5.7,7.6) -44.0% p= % 6.3 (5.6,8) ALTCS Subtotal % 6.9 (6.0,8.2) -24.7% p< % 6.9 (6.0,8.2) OVERALL % 7.2(6.2,8.8) -24.4% p< % 7.2(6.2,8.8) Notes: (1) Shaded rows reflect results of the first remeasurement (October 1, 2002, through September 30, 2003). (2) Significance levels in bold indicate statistically significant change. (3) Lower rates for this indicator are better. (4) Numbers in parentheses in Median Level column represent interquartile ranges (25th and 75th percentile) when exhibited on a Bell curve. 13
17 TABLE 4 AHCCCS Diabetes Management Performance Improvement Project Members with Poorly Controlled Hb A1c Levels, by Contractor Second Remeasurement (CYE 2004) compared with First Remeasurement (CYE 2003) Number with Hb A1c Level >9.5% Percent with Hb A1c Level >9.5% Relative Change in Levels >9.5% Contractor Included Cases Median Hb A1c Level Significance Level APIPA % 7.1(6.25,8.4) -16.8% p= % 7.3 (6.3,8.9) Health Choice % 7.0(6.2,8.4) -24.9% p= % 7.4 (6.3,9.1) Maricopa Health Plan % 7.4(6.5,9.0) -12.3% p= % 7.9 (6.9,9.7) Mercy Care % 7.0(6.2,8.35) -4.9% p= % 7.0(6.2,8.3) Community Connection % 7.0(6.2,8.5) -12.4% p= % 7.6 (6.4,9.7) Pima Health System % 7.3(6.2,8.75) 1.6% p= % 7.5 (6.4,9.3) University Family Care % 7.5(6.4,9.0) -15.7% p= % 7.3 (6.5,9.2) ACUTE Subtotal % 7.1(6.3,8.6) -12.5% p= % 7.4 (6.4,9.2) Cochise Health Systems % 6.85 (6.1,8.08) -27.8% p= % 6.7 (5.7,7.6) Evercare Select % 6.5(6.0,7.5) -32.1% p= % 6.7(6.2,7.8) Maricopa LTC % 7.0 (6.2,8.2) -17.6% p= % 7.3 (6.2,8.6) Mercy Care LTC % 6.8 (6.0,8.3) -26.8% p= % 6.8 (6.0,8.4) Pima Health System LTC % 6.7 (5.9,7.8) -2.0% p= % 6.9 (5.9,8.2) Pinal/Gila County LTC % 6.9 (6.1,8.0) -30.6% p= % 6.8 (6.0,7.9) Yavapai County LTC % 6.9(6.2,7.6) -14.9% p= % 6.9 (6.0,8.4) DES/DDD % 6.3(5.8,7.3) -40.3% p= % 6.5 (5.7,7.6) ALTCS Subtotal % 6.8 (6.1,8.0) -24.5% p< % 6.9 (6.0,8.2) OVERALL % 7.0(6.2,8.3) -17.3% p< % 7.2(6.2,8.8) Notes: (1) Shaded rows reflect results of the first remeasurement (October 1, 2002, through September 30, 2003). (2) Significance levels in bold indicate statistically significant change. (3) Lower rates for this indicator are better. (4) Numbers in parentheses in Median Level column represent interquartile ranges (25th and 75th percentile) when exhibited on a Bell curve. 14
18
19
20
21
22 TABLE 5A AHCCCS Diabetes Management Performance Improvement Project Members Receiving Hb A1c Tests Third Remeasurement (CYE 2005) compared with Second Remeasurement (CYE 2004) Contractor Included Cases Number Receiving Hb A1c Test Percent Receiving Hb A1c Test Relative Change Significance Level Evercare Select % 26.8% p< % Number with Hb A1c Level >9.5% Percent with Hb A1c Level >9.5% Contractor Included Cases Relative Change in Levels >9.5% Significance Level Evercare Select % 20.8% p= % 6.5(6.0,7.5) Notes: TABLE 5B AHCCCS Diabetes Management Performance Improvement Project Members with Poorly Controlled Hb A1c Levels Third Remeasurement (CYE 2005) compared with Second Remeasurement (CYE 2004) (1) Shaded rows reflect results of the second remeasurement (October 1, 2003, through September 30, 2004). (2) Significance level in bold indicates statistically significant change. 19
23 TABLE 6 AHCCCS Diabetes Management Performance Improvement Project Data Validation Results, All Contractors First Remeasurement Period: October 1, 2002, through September 30, 2003 Original AHCCCS Critical Errors % Kappa Abstraction Results Difference Over Under Agreement Hb A1c Test % Poorly Controlled % Total % Excluding Health Choice Arizona Hb A1c Test % Poorly Controlled % Total % 20
24 Maricopa Health Plan Pima Health System APIPA PHP/Community Connection Mercy Care Plan University Family Care Health Choice Arizona Cochise LTC DES/DDD Pima LTC Maricopa LTC Yavapai LTC Evercare Select Pinal/Gila LTC Mercy Care LTC Table 7 AHCCCS Diabetes Management Performance Improvement Project DATA VALIDATION RESULTS, BY CONTRACTOR First Remeasurement Period: October 1, 2002, through September 30, 2003 Original AHCCCS Abstraction Results Difference Over Under Agreement Hb A1c Test % Poorly Controlled % Total % Hb A1c Test % Poorly Controlled % Total % Hb A1c Test % Poorly Controlled % Total % Hb A1c Test % Poorly Controlled % Total % Hb A1c Test % Poorly Controlled % Total % Hb A1c Test % Poorly Controlled % Total % Hb A1c Test % Poorly Controlled % Total % Hb A1c Test % Poorly Controlled % Total % Hb A1c Test % Poorly Controlled % Total % Hb A1c Test % Poorly Controlled % Total % Hb A1c Test % Poorly Controlled % Total % Hb A1c Test % Poorly Controlled % Total % Hb A1c Test % Poorly Controlled % Total % Hb A1c Test % Poorly Controlled % Total % Hb A1c Test % Poorly Controlled % Total % 21 Critical Errors % Kappa
25 TABLE 8 AHCCCS Diabetes Management Performance Improvement Project Data Validation Results, Health Choice Arizona Second Remeasurement Period: October 1, 2003, through September 30, 2004 Health Choice Arizona Original AHCCCS Critical Errors % Kappa Abstraction Results Difference Over Under Agreement Hb A1c Test % Poorly Controlled % Total % 22
26 Table 8 Contractor Interventions to Improve Performance in Diabetes Management The following table includes interventions that AHCCCS Contractors used to improve rates of Hb A1c testing and levels during this PIP. The Chronic Care Model, developed by Wagner, et al, was adapted for use in organizing these interventions. The model identifies essential elements of a health care system that encourage high-quality care, and help ensure increased use of or access to services. 1 Community Linkages Tie in outreach efforts with related activities/events; e.g., National Diabetes Awareness, community health fairs, etc.; may include partnering with another organization to provide free glucose testing Participate in the Arizona Diabetes Collaborative ( ) to enhance knowledge and identify additional resources for diabetes care Health System Share goals of the Diabetes PIP and specific health plan results with provider network to engage them as stakeholders Incorporate performance goals into provider contracts, including Primary Care Providers (PCPs), as well as LTC providers such as assisted living facilities and attendant care providers; may involve pay-forperformance rewards Self-Management Support Case management or disease management staff follow up with patients to provide education, referral to diabetes classes and/or assistance in obtaining services (e.g., transportation to appointment, obtain lab order from PCP and schedule blood draw) Use of diabetes educators and group classes to help members better understand and participate in managing their disease Delivery System Design Utilize in-home Hb A1c testing kits, administered by case managers or home health nurses, for some long-term care members Decision Support Identify members with diabetes through regular reports, such as claims or laboratory data, and new member health risk assessments Stratify members by risk (high, moderate, low) and prioritize for intervention based on level of risk (mail, telephone outreach, home health visit, etc.) Develop and send provider utilization profiles of services received by diabetic patients on a PCP s panel Clinical Information Systems Use administrative data (e.g., claims) to routinely monitor performance/ utilization of services overall and by provider Incorporate medical chart audits into the performance monitoring process, with feedback to providers and facilities 23
27 Community Linkages Health System Incorporate data reporting requirements into laboratory contracts to improve performance monitoring Self-Management Support Reinforce education/selfmanagement skills through newsletters, special mailings, disease management information on website, etc Delivery System Design Decision Support Develop/adopt practice guidelines and distribute to PCPs (physicians, PAs, NPs); reinforce through provider newsletters and other communications Clinical Information Systems Send letters or make phone calls to providers to advise them of their patients who have no or elevated Hb A1c results on record, or who have not refilled diabetic medications, so provider can engage patients Implement use of tools, such as a diabetes flow sheet placed in the chart, by physician offices or facilities (e.g., nursing facilities) to prompt performing tests Provide continuing education on diabetes care to providers and health plan case managers 1 Improving Chronic Illness Care. Overview of the Chronic Care Model. Available at: 24
28 Arizona Health Care Cost Containment System (AHCCCS) PERFORMANCE IMPROVEMENT PROJECT (PIP): Improving Hb A1c Testing and Levels among Members with Diabetes METHODOLOGY Background The United States Department of Health and Human Services estimates that almost 20 million Americans age 20 years and older have diabetes. 1,2 Direct and indirect costs associated with diabetes in the United States, including lost productivity, were estimated to be $132 billion in Diabetes is the leading cause of end-stage kidney disease, lower extremity amputations, and new cases of blindness among U.S. adults ages 20 to 74 years. 4 Other complications of diabetes include heart disease, stroke, high blood pressure, nervous system damage, and dental disease. People with diabetes are more susceptible to many other illnesses; for example, they are more likely to die from pneumonia or influenza than people who do not have diabetes. 1 Control of hyperglycemia (increased blood sugar) is critical to preventing or minimizing complications of diabetes. Sustained high blood sugars result in damage to the retina, peripheral nerves and kidneys. Thus, preventive-care practices, such as monitoring of blood-glucose levels, are effective in reducing both the incidence and progression of diabetes-specific complications. Physicians utilize a glycosylated (also called glycated) hemoglobin, or Hb A 1c, test to monitor patients blood glucose levels. This test provides an indication of a person s average glucose levels over a two- to three-month period by measuring the amount of glucose that has bonded with hemoglobin in the body s red blood cells. A normal Hb A 1c level for persons without diabetes is between 4 and 6 percent. 5 Purpose The purpose of this performance improvement project (PIP) is to increase the rate of Hb A 1c testing among adults with diabetes who are enrolled with the Arizona Health Care Cost Containment System (AHCCCS), in order to assist those members and their physicians with establishing and maintaining control of blood-glucose (glycemic) levels. It is expected that interventions related to this project will increase the number of AHCCCS Contractors that meet or exceed the NCQA benchmark for Medicaid managedcare plans. Measurement. Periods Baseline Measurement: October 1, 2000, through September 30, 2001 First Remeasurement: October 1, 2002, through September 30, 2003 Second Remeasurement: October 1, 2003, through September 30, 2004 i
29 Study Questions 1. What is the number and percent, overall and by Contractor, of members enrolled with AHCCCS who meet the sample frame criteria and who had at least one Hb A1c test? 2. What is the number and percent, overall and by Contractor, of members enrolled with AHCCCS who meet the sample frame criteria and who had Hb A1c levels greater than 9.5 percent? 3. Of those members who had at least one HB A1c test during the measurement period, what is the median level of the most recent test? Population This study will include AHCCCS members diagnosed with diabetes, as defined by HEDIS criteria. Members may be identified as diabetic during the measurement year or twelve months prior. Population Exclusions The following members will be excluded from this study: Members with steroid induced diabetes and gestational diabetes Members with a diagnosis of polycystic ovaries who do not have two face-to-face encounters with the diagnosis of diabetes in any setting during the measurement year or prior year Tribal and Fee for Service members will be excluded due to the inability to accurately collect complete data on these populations. Population Stratification The population will be stratified by: Program type (Acute-care, ALTCS* and DES/DDD*) Contractor * E/PD and VD populations for each Contractor will be combined before stratifying Sample Frame The sample frame will consist of members 18 through 75 years of age as of the end of the measurement period who were continuously enrolled during the measurement period, with no more than one gap in enrollment of up to 31 days, and diagnosed with type 1 or type 2 diabetes. Prior Period Coverage (PPC) will be considered a break in enrollment. A change of county service area with the same Contractor, without a gap in enrollment, will not be considered a break in enrollment. Sample Selection The sample frame will be identified through enrollment, claims and encounter records using the stated criteria. A statistical software program will be used to select a representative, random sample, using a 95-percent confidence level and a confidence interval of +/-5 percent. Based on prior studies, an over sampling rate of 10 percent will be utilized to allow for missing or incomplete records. ii
A COMPREHENSIVE REPORT ISSUED BY THE AMERICAN ASSOCIATION OF CLINICAL ENDOCRINOLOGISTS IN PARTNERSHIP WITH:
 A COMPREHENSIVE REPORT ISSUED BY THE AMERICAN ASSOCIATION OF CLINICAL ENDOCRINOLOGISTS IN PARTNERSHIP WITH: Amputee Coalition of America Mended Hearts National Federation of the Blind National Kidney Foundation
IMMUNIZATION COMPLETION RATES
 Biennial Report of IMMUNIZATION COMPLETION RATES BY 24 MONTHS OF AGE To the Governor, the President of the Senate and the Speaker of the House of Representatives March 2004 Anthony D. Rodgers Director
National Diabetes Fact Sheet, 2011
 National Diabetes Fact Sheet, 2011 FAST FACTS ON DIABETES Diabetes affects 25.8 million people 8.3% of the U.S. population DIAGNOSED 18.8 million people UNDIAGNOSED 7.0 million people All ages, 2010 Citation
National Diabetes Fact Sheet, 2007
 National Diabetes Fact Sheet, 2007 General Information What is diabetes? Diabetes is a group of diseases marked by high levels of blood glucose resulting from defects in insulin production, insulin action,
2012 Chronic Respiratory. Program Evaluation. Our mission is to improve the health and quality of life of our members
 2012 Chronic Respiratory Program Evaluation Our mission is to improve the health and quality of life of our members 2012 Chronic Respiratory Program Evaluation Program Title: Chronic Respiratory Program
Arizona Health Care Cost Containment System (AHCCCS) Oral Health Quality Improvement Project (QIP) 2003 Methodology
 Oral Health Quality Improvement Project (QIP) 2003 Methodology") Arizona Health Care Cost Containment System (AHCCCS) Oral Health Quality Improvement Project (QIP) 2003 Methodology Project Title: Annual Dental Visits Quality Improvement Project Background: Oral health
Arizona Health Care Cost Containment System (AHCCCS) Oral Health Quality Improvement Project (QIP) 2003 Methodology Project Title: Annual Dental Visits Quality Improvement Project Background: Oral health
Shaping our future: a call to action to tackle the diabetes epidemic and reduce its economic impact
 Shaping our future: a call to action to tackle the diabetes epidemic and reduce its economic impact Task Force for the National Conference on Diabetes: The Task Force is comprised of Taking Control of
2012 Diabetes. Program Evaluation. Our mission is to improve the health and quality of life of our members
 2012 Diabetes Program Evaluation Our mission is to improve the health and quality of life of our members Diabetes Program Evaluation Program Title: Diabetes Program Evaluation Period: January 1, 2012 December
Living Well with Diabetes
 Living Well with Diabetes What is diabetes? Diabetes Overview Diabetes is a disorder of the way the body uses food for growth and energy. Most of the food people eat is broken down into glucose, the form
2017 Diabetes. Program Evaluation. Our mission is to improve the health and quality of life of our members
 2017 Diabetes Program Evaluation Our mission is to improve the health and quality of life of our members Diabetes Program Evaluation Program Title: Diabetes Program Evaluation Period: January 1, 2017 December
= AUDIO. Managing Diabetes for Improved Cardiovascular Health. An Important Reminder. Mission of OFMQ 8/18/2015. Jimmi Norris MS, RN, CDE
 Managing Diabetes for Improved Cardiovascular Health Jimmi Norris MS, RN, CDE An Important Reminder For audio, you must use your phone: Step 1: Call (866) 906 0123. Step 2: Enter code 2071585#. Step 3:
Biennial Report of IMMUNIZATION COMPLETION RATES BY 24 MONTHS OF AGE to the Governor, the President of the Senate and the Speaker of the House
 Biennial Report of IMMUNIZATION COMPLETION RATES BY 24 MONTHS OF AGE to the Governor, the President of the Senate and the Speaker of the House Measurement Period Ending Sept. 30, 2005 Arizona Health Care
Table of Contents. Page 2 of 20
 Page 1 of 20 Table of Contents Table of Contents... 2 NMHCTOD Participants... 3 Introduction... 4 Methodology... 5 Types of Data Available... 5 Diabetes in New Mexico... 7 HEDIS Quality Indicators for
2015 Diabetes. Program Evaluation. Our mission is to improve the health and quality of life of our members
 2015 Diabetes Program Evaluation Our mission is to improve the health and quality of life of our members Diabetes Care Program Evaluation Program Title: Diabetes Care Program Evaluation Period: January
Senior Leaders and the Strategic Alignment of Community Benefit Programs: The Example of Diabetes
 Senior Leaders and the Strategic Alignment of Community Benefit Programs: The Example of Diabetes Posted: February 17, 2009 By Patsy Matheny, Community Benefit Consultant. Sugar Grove, Ohio Moving community
Montgomery Cares Clinical Performance Measures
 Montgomery Cares Clinical Performance Measures Fiscal Year 2012 December 13, 2012 1 Montgomery Cares Clinical Performance Measures, FY 2012 Table of Contents Executive Summary 2 Background. 3 Results Reporting
Diabetes Quality Improvement Initiative
 Diabetes Quality Improvement Initiative Community Care of North Carolina 2300 Rexwoods Drive, Ste. 100 Raleigh, NC 27607 (919) 745-2350 www.communitycarenc.org 2007 Background The Clinical Directors of
Pre Diabetes Screening in Primary Care
 University of San Diego Digital USD Doctor of Nursing Practice Final Manuscripts Theses and Dissertations Spring 5-21-2016 Pre Diabetes Screening in Primary Care Christine Rieger crieger@sandiego.edu Follow
A Summary Report: 2003
 D iabetes in Idaho A Summary Report: 2003 Idaho Department of Health and Welfare Division of Health Bureau of Community and Environmental Health This publication was supported by Grant No. U32/CCU022691-02
Am I at Risk for Type 2 Diabetes?
 NATIONAL DIABETES INFORMATION CLEARINGHOUSE Am I at Risk for Type 2 Diabetes? Taking Steps to Lower Your Risk of Getting Diabetes U.S. Department of Health and Human Services National Institutes of Health
This slide set provides an overview of the impact of type 1 and type 2 diabetes mellitus in the United States, focusing on epidemiology, costs both
 This slide set provides an overview of the impact of type 1 and type 2 diabetes mellitus in the United States, focusing on epidemiology, costs both direct and indirect and the projected burden of diabetes,
Division of Behavioral Health Services
 Division of Behavioral Health Services Annual Report on Substance Abuse Treatment Programs Fiscal Year 2012 Submitted Pursuant to A.R.S. 36-2023 December 31, 2012 Report Contents Program Names and Locations
2016 Community Service Plan & Community Health Improvement Plan
 2016 Community Service Plan & Community Health Improvement Plan A.O. Fox Memorial Hospital The Mary Imogene Bassett Hospital (dba: Bassett Medical Center) & Otsego County Health Department Service Area:
Virginia MSDA Na+onal Medicaid and CHIP Oral Health Symposium June 24 th 26 th, Dan Plain 6/28/12
 2012 MSDA Na+onal Medicaid and CHIP Oral Health Symposium June 24 th 26 th, 2012 Session 11 Managing Quality Programs: Traditional Programs versus Managed Care What s Happening in States Angela Littrell
Diabetes 101: A Brief Overview of Diabetes and the American Diabetes Association
 Diabetes 101: A Brief Overview of Diabetes and the American Diabetes Association What Happens When We Eat? After eating, most food is turned into glucose, the body s main source of energy. Normal Blood
Am I at Risk for Type 2 Diabetes?
 Am I at Risk for Type Diabetes? Taking Steps to Lower Your Risk of Getting Diabetes On this page: What is type diabetes? Can type diabetes be prevented? What are the signs and symptoms of type diabetes?
About the Highmark Foundation
 About the Highmark Foundation The Highmark Foundation, created in 2000 as an affiliate of Highmark Inc., is a charitable organization and a private foundation that supports initiatives and programs aimed
Coding spotlight: diabetes provider guide to coding the diagnosis and treatment of diabetes
 Medicaid Managed Care December 2018 provider guide to coding the diagnosis and treatment of diabetes Diabetes mellitus is a chronic disorder caused by either an absolute decrease in the amount of insulin
Provider Bulletin December 2018 Coding spotlight: diabetes provider guide to coding the diagnosis and treatment of diabetes
 Medi-Cal Managed Care L. A. Care Provider Bulletin December 2018 provider guide to coding the diagnosis and treatment of diabetes Diabetes mellitus is a chronic disorder caused by either an absolute decrease
Diabetes 101: A Brief Overview of Diabetes and the American Diabetes Association
 Diabetes 101: A Brief Overview of Diabetes and the American Diabetes Association What Happens When We Eat? After eating, most food is turned into glucose, the body s main source of energy. Normal Blood
Looking Toward State Health Assessment.
 CONNECTICUT DEPARTMENT OF PUBLIC HEALTH Policy, Planning and Analysis. Looking Toward 2000 - State Health Assessment. Table of Contents Glossary Maps Appendices Publications Public Health Code PP&A Main
Approximately one third of the 15.7 million Americans who are estimated to have diabetes
 Diabetes is a very serious illness and too many people are neglecting their condition. Approximately one third of the 15.7 million Americans who are estimated to have diabetes are unaware of their condition.
Mercy Diabetes Prevention Program
 Mercy Diabetes Prevention Program Know the risk. Make the change. Live your life. Ashton Caton, Community Wellness Program Manager May 11, 2018 The Statistics DIABETES 30.3 million Americans People who
DIABETES PREVENTION REPORT
 DIABETES PREVENTION REPORT 2019 TABLE OF CONTENTS ACKNOWLEDGMENT 3 EXECUTIVE SUMMARY 4 INTRODUCTION 6 Burden of Diabetes in Oklahoma 7 By Social Determinants of Health 8 Related Risk Factors and Co-morbidities
LOUISIANA MEDICAID PROGRAM ISSUED: 02/01/12 REPLACED: 02/01/94 CHAPTER 5: PROFESSIONAL SERVICES SECTION 5.1: COVERED SERVICES PAGE(S) 6
 6") Diabetes Education Management Training Diabetes self management training (DSMT) is a collaborative process through which recipients with diabetes gain knowledge and skills needed to modify behavior and
Diabetes Education Management Training Diabetes self management training (DSMT) is a collaborative process through which recipients with diabetes gain knowledge and skills needed to modify behavior and
An Overview of Diabetes
 An Overview of Diabetes What is Diabetes? Diabetes is a disease in which the body is unable to properly use and store glucose (a form of sugar). Glucose backs up in the bloodstream causing a person s blood
Objectives 10/11/2013. Diabetes- The Real Cost of Sugar. Diabetes 101: What is Diabetes. By Ruth Nekonchuk RD CDE LMNT
 Diabetes- The Real Cost of Sugar By Ruth Nekonchuk RD CDE LMNT Objectives To explain diabetes To explain the risks of diabetes To enumerate the cost of diabetes to our country To enumerate the cost of
2017 Chronic Respiratory. Program Evaluation. Our mission is to improve the health and quality of life of our members
 2017 Chronic Respiratory Program Evaluation Our mission is to improve the health and quality of life of our members 2017 Chronic Respiratory Program Evaluation Program Title: Chronic Respiratory Program
Guiding Principles. for Diabetes Care: For Health Care. Providers
 Guiding Principles N A T I O N A L for Diabetes Care: D I A B E T E S For Health Care E D U C A T I O N Providers P R O G R A M The National Diabetes Education Program (NDEP) has developed these Guiding
Dental Public Health Activity Descriptive Report
 Dental Public Health Activity Descriptive Report Practice Number: 04006 Submitted By: Office of Oral Health, Arizona Department of Health Services Submission Date: May 2002 Last Reviewed: September 2017
Why do we care? 20.8 million people. 70% of people with diabetes will die of cardiovascular disease. What is Diabetes?
 What is Diabetes? Diabetes 101 Ginny Burns RN MEd CDE Diabetes mellitus is a group of diseases characterized by high levels of blood glucose resulting from defects in insulin production, insulin action
Diabetes and Quality Measures.
 Diabetes and Quality Measures. Reducing Costs, Closing Gaps, and Improving Member Health Executive Summary According to the Centers for Disease Control, 29 million people in the U.S. have diabetes. Another
HIV Care & Treatment Program STATE OF OREGON
 HIV Care & Treatment Program Quality Management Program Report 2011 STATE OF OREGON Section I: Oregon HIV Care & Treatment Program... 3 1 Quality Management Plan... 3 Quality Statement... 3 Quality Infrastructure...
Common Diabetes-related Terms
 Common Diabetes-related Terms A1C An A1C test measures a person's average blood glucose level over two to three months. Hemoglobin is the part of a red blood cell that carries oxygen to the cells and sometimes
2015 Healthy Heart. Program Evaluation. Our mission is to improve the health and quality of life of our members
 2015 Healthy Heart Program Evaluation Our mission is to improve the health and quality of life of our members 2015 Healthy Heart Program Evaluation Program Title: Healthy Heart Program Evaluation Period:
Diabetes in Manitoba: Trends among Adults
 Diabetes Among Adults in Manitoba (1989-2013) Diabetes in Manitoba: Trends among Adults 1989-2013 1989-2013 Epidemiology & Surveillance Active Living, Population and Public Health Branch Manitoba Health,
An Overview of Medicare Covered Diabetes Supplies and Services
 News Flash - Understanding the Remittance Advice: A Guide for Medicare Providers, Physicians, Suppliers, and Billers serves as a resource on how to read and understand a Remittance Advice (RA). Inside
Diagnosis of Diabetes National Diabetes Information Clearinghouse
 Diagnosis of Diabetes National Diabetes Information Clearinghouse National Institute of Diabetes and Digestive and Kidney Diseases NATIONAL INSTITUTES OF HEALTH U.S. Department of Health and Human Services
Quality ID #1 (NQF 0059): Diabetes: Hemoglobin A1c (HbA1c) Poor Control (>9%) National Quality Strategy Domain: Effective Clinical Care
: Diabetes: Hemoglobin A1c (HbA1c) Poor Control (>9%) National Quality Strategy Domain: Effective Clinical Care") Quality ID #1 (NQF 0059): Diabetes: Hemoglobin A1c (HbA1c) Poor Control (>9%) National Quality Strategy Domain: Effective Clinical Care 2018 OPTIONS FOR INDIVIDUAL MEASURES: REGISTRY ONLY MEASURE TYPE:
Quality ID #1 (NQF 0059): Diabetes: Hemoglobin A1c (HbA1c) Poor Control (>9%) National Quality Strategy Domain: Effective Clinical Care 2018 OPTIONS FOR INDIVIDUAL MEASURES: REGISTRY ONLY MEASURE TYPE:
Diabetes Mellitus and the Associated Complications
 Understanding and the complications relating to the disease can assist the fitter to better serve patients. and the Associated Complications Released January, 2011 Total: 25.8 million people, or 8.3% of
QIP/HEDIS Measure Webinar Series
 QIP/HEDIS Measure Webinar Series September 26, 2017 Presenters: Partnership HealthPlan Quality Department Partnership HealthPlan of California To avoid echoes and feedback, we request that you use the
Baptist Health Nassau Community Health Needs Assessment Priorities Implementation Plans
 Baptist Health Nassau Community Health Needs Assessment Priorities Implementation Plans Health Disparities Heart Disease Stroke Hypertension Diabetes Adult Type II Preventive Health Care Smoking and Smokeless
Baptist Health Beaches Community Health Needs Assessment Priorities Implementation Plans
 Baptist Health Beaches Community Health Needs Assessment Priorities Implementation Plans Health Disparities Heart Disease Stroke Hypertension Diabetes Adult Type II Preventive Health Care Smoking and Smokeless
Collaborative Approach in Managing the High Risk Diabetic Patient in a Patient Centered Medical Home
 Collaborative Approach in Managing the High Risk Diabetic Patient in a Patient Centered Medical Home Background Safety net facility serving the community for more than 140 years Employ over 3500 health
Measure Owner Designation. AMA-PCPI is the measure owner. NCQA is the measure owner. QIP/CMS is the measure owner. AMA-NCQA is the measure owner
 2011 EHR Measure Specifications The specifications listed in this document have been updated to reflect clinical practice guidelines and applicable health informatics standards that are the most current
Page 0 of 20. Health Profiles. Diabetes Montgomery County, OH. Public Health - Dayton & Montgomery County Epidemiology Section
 Page 0 of 20 Health Profiles Diabetes Montgomery County, OH Public Health - Dayton & Montgomery County Epidemiology Section January 2014 Page 1 of 20 Prepared by: Epidemiology Section of Public Health
Diabetes. For Institute for Healthy Aging at Keiro. Take Time To Care
 Diabetes For Institute for Healthy Aging at Keiro 1 Take Time To Care About FDA The oldest consumer protection agency in the U.S. Ensures that regulated products are safe and effective. 2 2 What FDA Regulates
COMMUNITY HEALTH NEEDS ASSESSMENT IMPLEMENTATION STRATEGY
 2016 COMMUNITY HEALTH NEEDS ASSESSMENT IMPLEMENTATION STRATEGY Table of Contents Introduction... 2 Executive summary... 2 University Care System s mission, vision, and values... 2 Description of the health
Camden Citywide Diabetes Collaborative
 Camden Citywide Diabetes Collaborative The Camden Coalition of Healthcare Providers is an organization that seeks to improve the quality, capacity and accessibility of the health care system for vulnerable,
2017 Annual Report Healthcare Effectiveness Data and Information Set (HEDIS) Prepared by the Health Plan s Quality Management Department
 Prepared by the Health Plan s Quality Management Department") 2017 Annual Report Healthcare Effectiveness Data and Information Set (HEDIS) Prepared by the Health Plan s Quality Management Department Table of Contents Executive Summary 3 Introduction 5 Description
2017 Annual Report Healthcare Effectiveness Data and Information Set (HEDIS) Prepared by the Health Plan s Quality Management Department Table of Contents Executive Summary 3 Introduction 5 Description
Diabetes Care begins with Diabetes Prevention. Neha Sachdev, MD Janet Williams, MA
 Diabetes Care begins with Diabetes Prevention Neha Sachdev, MD Janet Williams, MA Objectives Describe the clinical practice burden and trends in type 2 diabetes Review evidence for diabetes prevention
Baptist Health Jacksonville Community Health Needs Assessment Implementation Plans. Health Disparities. Preventive Health Care.
 Baptist Health Jacksonville Community Health Needs Assessment Implementation Plans Health Disparities Infant Mortality Prostate Cancer Heart Disease and Stroke Hypertension Diabetes Behavioral Health Preventive
Mike Olbinski. Mike Olbinski. Michael Olbinski
 Mike Olbinski Mike Olbinski Michael Olbinski Table of Contents List of Figures and Tables... 3 Executive Summary... 4 Introduction... 5 Epidemiology in Arizona... 7 Reporting Sources and Changes in Laboratory
Taking Steps to Control and Prevent Diabetes Zaida Belendez, ND, RN
 Taking Steps to Control and Prevent Diabetes Zaida Belendez, ND, RN Diabetes is a common, serious, and costly disease condition of elevated blood glucose (high blood sugar) that causes significant illness
DIABETES EDUCATION FOR HEALTH CARE SERIES
 American Association of Diabetes Educators Provider is accredited as a provider of continuing nursing education by the American Nurses Credentialing Center's Commission on Accreditation. DIABETES EDUCATION
medicaid and the The Role of Medicaid for People with Diabetes
 on medicaid and the uninsured The Role of for People with Diabetes November 2012 Introduction Diabetes is one of the most prevalent chronic conditions and a leading cause of death in the United States.
Disclosure. I have no relevant financial relationships with commercial interests to disclose American Medical Association. All rights reserved.
 Disclosure I have no relevant financial relationships with commercial interests to disclose. 2 Objectives Describe the trends in type 2 diabetes and implications for clinical practice Review the evidence
Diabetes Care begins with Diabetes Prevention. Neha Sachdev, MD Janet Williams, MA
 Diabetes Care begins with Diabetes Prevention Neha Sachdev, MD Janet Williams, MA Objectives Describe the clinical practice burden and trends in type 2 diabetes Review evidence for diabetes prevention
2015 Chronic Respiratory. Program Evaluation. Our mission is to improve the health and quality of life of our members
 2015 Chronic Respiratory Program Evaluation Our mission is to improve the health and quality of life of our members 2015 Chronic Respiratory Program Evaluation Program Title: Chronic Respiratory Program
Clinical Practice Guidelines for Diabetes Management
 Clinical Practice Guidelines for Diabetes Management Diabetes is a disease in which blood glucose levels are above normal. Over the years, high blood glucose damages nerves and blood vessels, which can
Diabetes is a chronic disease
 N.C. Diabetes Education Recognition Program: ADA Recognition for a Combined Program at Local Health Departments and Community Health Centers in North Carolina Joanne Rinker, MS, RD, CDE, LDN, and Marti
Society for Public Health Education Promoting Healthy Aging Resolution
 0 0 0 Society for Public Health Education Promoting Healthy Aging Resolution Adopted SOPHE Board of Trustees //0 Whereas since the year 00 the number of people in America aged or older has increased -fold,
Michigan s Diabetes Crisis: Today and Future Trends. Dr. William Rowley Institute for Alternative Futures
 Michigan s Diabetes Crisis: Today and Future Trends Dr. William Rowley Institute for Alternative Futures 1 What s Happening to Our Children? During their lifetimes: 1/2 will become obese 1 in 3 males &
Community Health Profile: Minnesota, Wisconsin, & Michigan Tribal Communities 2006
 Community Health Profile: Minnesota, Wisconsin, & Michigan Tribal Communities 26 This report is produced by: The Great Lakes EpiCenter If you would like to reproduce any of the information contained in
Performance Improvement Projects Related to CDC s 6 18 Initiative: A Scan of External Quality Review Organization Reports
 Technical Assistance Tool June 2018 Performance Improvement Projects Related to CDC s 6 18 Initiative: A Scan of External Quality Review Organization Reports S tates implementing interventions under CDC
Endocrinology. Understanding Diabetes Mellitus
 Endocrinology Understanding Diabetes Mellitus The Diabetes, Endocrine & Metabolism Centre offers one-stop accessible care to patients and is staffed by experienced endocrinologists, diabetes nurse educators,
Diabetes Care Begins With Diabetes Prevention
 Diabetes Care Begins With Diabetes Prevention Noah Nesin, M.D., FAAFP June 28, 2018 12-1pm Webinar Logistics for Zoom Audio lines for non-presenters are currently muted Please use the Q & A function for
Insurance Providers Reduce Diabetes Risk Through CDC Program
 Insurance Providers Reduce Diabetes Risk Through CDC Program ISSUE BRIEF JULY 2018 KEY TAKEAWAYS 86 million Americans 1 in 3 adults have pre-diabetes. Studies show that losing 5 to 7 percent of body weight
Almost 1 in 10 adults have been diagnosed with diabetes. Alabama is ranked fifth in prevalence of diabetes in the United States and its territories.
 2008 FACT SHEET The Diabetes Branch addresses the impact of diabetes in Alabama by developing policies, recommendations, and programs about the disease and related issues. The program is funded through
ADDRESSING CHRONIC DISEASES
 ADDRESSING CHRONIC DISEASES Health-Management Strategies for Use with Behavioral Health Clients Mary Brunette, MD Delia Cimpean Hendrick, MD SCOPE AND SEQUENCE For more information about this program,
Southview Medical Center. Community Benefit Plan & Implementation Strategy
 201 4 Southview Medical Center Community Benefit Plan & Implementation Strategy TABLE OF CONTENTS INTRODUCTION... 2 Southview Medical Center Service Area... 2 Community Health Needs Assessment... 2 Data
Quality ID #117 (NQF 0055): Diabetes: Eye Exam National Quality Strategy Domain: Effective Clinical Care
: Diabetes: Eye Exam National Quality Strategy Domain: Effective Clinical Care") Quality ID #117 (NQF 0055): Diabetes: Eye Exam National Quality Strategy Domain: Effective Clinical Care 2018 OPTIONS F INDIVIDUAL MEASURES: REGISTRY ONLY MEASURE TYPE: Process DESCRIPTION: Percentage
Quality ID #117 (NQF 0055): Diabetes: Eye Exam National Quality Strategy Domain: Effective Clinical Care 2018 OPTIONS F INDIVIDUAL MEASURES: REGISTRY ONLY MEASURE TYPE: Process DESCRIPTION: Percentage
A newsletter for Molina Healthcare Provider Networks. Fall 2018
 A newsletter for Molina Healthcare Provider Networks Fall 2018 In this Issue 2018-2019 Flu Season....1 Molina Healthcare s Special Investigation Unit Partnering with You to Prevent Fraud, Waste and Abuse...2
Contractor Name: Novitas Solutions, Inc. Contractor Number: Contractor Type: MAC B. LCD ID Number: L34834 Status: A-Approved
 LCD for Blood Glucose Monitoring in a Skilled Nursing Facility (SNF) (L34834) Contractor Name: Novitas Solutions, Inc. Contractor Number: 12502 Contractor Type: MAC B LCD ID Number: L34834 Status: A-Approved
Diabetes - The Facts
 Diabetes - The Facts What is Diabetes? In people with diabetes, blood glucose levels are higher than normal because the body either does not produce enough insulin or cannot use insulin properly. The body
DIABETES. A growing problem
 DIABETES A growing problem Countries still grappling with infectious diseases such as tuberculosis, HIV/AIDS and malaria now face a double burden of disease Major social and economic change has brought
Overview of the NC Diabetes Prevention and Management Guide. Ronny Bell, Ph.D., MS, Chair Jan Nicollerat, MSN, RN, ACNS-BC, CDE, Vice Chair
 Overview of the NC Diabetes Prevention and Management Guide Ronny Bell, Ph.D., MS, Chair Jan Nicollerat, MSN, RN, ACNS-BC, CDE, Vice Chair 1,030,000 in North Carolina 2,500,000 in North Carolina Age-adjusted
In Pursuit of Health Equity. A panel discussion
 In Pursuit of Health Equity A panel discussion MNCM Annual Seminar 2017 There is variation in quality results by race, ethnicity, language and country of origin 2016 Health Equity of Care Report, page
Diabetes AN OVERVIEW. Diabetes is a disease in which the body is no longer
 AN OVERVIEW Diabetes As you prepare to leave our center, we want to be sure you have the knowledge and skills to monitor and manage your own health conditions. You are the most important person on your
2018 P4P Overview 0518.PR.P.PP.1 6/18
 2018 P4P Overview Agenda MHS Pay For Performance (P4P) Ambetter P4P Program Secure Web Reporting Question and Answer What You Will Learn 1. Measure Overviews & Specifications 2. Documentation Requirements
HEDIS/CAHPS 101 August 13, 2012 Minnesota Measurement and Reporting Workgroup
 HEDIS/CAHPS 101 Minnesota Measurement and Reporting Workgroup MNsure s Accessibility & Equal Opportunity (AEO) office can provide this information in accessible formats for individuals with disabilities.
Prevention & Treatment of Substance Abuse in Native American Communities
 Prevention & Treatment of Substance Abuse in Native American Communities Susan Gerard, Director June 16, 2005 Impact of Substance Abuse for Native American People Substance abuse is a major cause of death
DEPARTMENT OF HEALTH MEDICAID PAYMENTS FOR DIABETIC TESTING SUPPLIES. Report 2008-S-123 OFFICE OF THE NEW YORK STATE COMPTROLLER
 Thomas P. DiNapoli COMPTROLLER OFFICE OF THE NEW YORK STATE COMPTROLLER DIVISION OF STATE GOVERNMENT ACCOUNTABILITY Audit Objective... 2 Audit Results - Summary... 2 DEPARTMENT OF HEALTH Background...
Gerald Bernstein, MD, Director, Diabetes Management Program. Marina Krymskaya, RN, MSN, ANP, CDE FDI Assistant Director
 Gerald Bernstein, MD, Director, Diabetes Management Program Marina Krymskaya, RN, MSN, ANP, CDE FDI Assistant Director November, 2010 1 Epidemiology CDC: 1 of 3 born in 2000 will develop diabetes. 42.3%
Achieving Quality and Value in Chronic Care Management
 The Burden of Chronic Disease One of the greatest burdens on the US healthcare system is the rapidly growing rate of chronic disease. These statistics illustrate the scope of the problem: Nearly half of
He has attended diabetes education classes with Dorothy. He eats less, and the couple walks together every day.
 Gambler Family: Fighting Diabetes for All Generations Charles and Dorothy Gambler, a Northern Arapaho Wyoming couple in their seventies, know firsthand the devastating impact of diabetes on American Indians
Am I at Risk for Type 2 Diabetes? Taking Steps to Lower Your Risk of Getting Diabetes
 Nat i o N a l Diabetes inf o r m a t i o N Cle a r i N g h o u s e Am I at Risk for Type 2 Diabetes? Taking Steps to Lower Your Risk of Getting Diabetes U.S. Department of Health and Human Services NATIONAL
Patient Activation + Engagement: Implementing Diabetes Group Appointments
 Patient Activation + Engagement: Implementing Diabetes Group Appointments Janelle Howe, Director, Disease Management Aurora Galindo Simental, Health Educator June 20, 2013 Solutions-Oriented Approaches
The clinical and economic benefits of better treatment of adult Medicaid beneficiaries with diabetes
 The clinical and economic benefits of better treatment of adult Medicaid beneficiaries with diabetes September, 2017 White paper Life Sciences IHS Markit Introduction Diabetes is one of the most prevalent
Diabetes Management: Interventions Engaging Community Health Workers
 Diabetes Management: Interventions Engaging Community Health Workers Community Preventive Services Task Force Finding and Rationale Statement Ratified April 2017 Table of Contents Intervention Definition...