Relationship of Perceived Thirst to Measures of Hydration During and Following Exercise
|
|
|
- Oswin Gibson
- 6 years ago
- Views:
Transcription

1 University of Connecticut Doctoral Dissertations University of Connecticut Graduate School Relationship of Perceived Thirst to Measures of Hydration During and Following Exercise Lesley W. Vandermark University of Connecticut, Follow this and additional works at: Recommended Citation Vandermark, Lesley W., "Relationship of Perceived Thirst to Measures of Hydration During and Following Exercise" (2016). Doctoral Dissertations
2 Relationship of Perceived Thirst to Measures of Hydration During and Following Exercise Lesley Willis Vandermark, PhD University of Connecticut, 2016 The purposes of these investigations were to describe the relationship of thirst to hydration during exercise, and to determine the impact of fluid volume on thirst following exercise. Eleven males completed four treadmill exercise trials of up to 180 minutes in a warm environment (35 C, 30% RH), then a 1-hour seated recovery. Two trials began euhydrated, and two hypohydrated. Fluid was given in one trial during exercise to match sweat rate. During recovery, participants were grouped to receive either a Small (1% of body mass (BM)) or Large (4% of BM) fluid bolus. Immediately post-exercise (IPE), there was a relationship between Thirst and body mass loss (BML) (p<0.008) and BML% (p<0.009). Moderate-high thirst was significantly related to IPE plasma osmolality (POsm; R²=0.142, p=0.037). There was a significant relationship between low change in thirst and IPE POsm change (R²=0.317, p=0.010), Copeptin change (R²=0.212, p=0.041), and BML (R²=0.325, p=0,009) and BML% (R²=0.356, p=0.006). IPE thirst was correlated with IPE POsm (ρ=0.600, p<0.001), BML% (ρ=-0.644, p<0.001), and plasma volume change (ρ=-0.326, p=0.040). HyR trial fluid bolus in the Large group (2±1) resulted in lower Thirst than the Small group (7±2, p<0.001) after recovery. Large group only consumed fluid to replace 3.84±1.73% BML. There is a relationship between a low level of thirst and hydration before exercise, and a higher level of thirst and hydration after exercise. Fluid bolus decreased thirst to such a degree that body mass loss replacement was incomplete. Word Count: 238/250
3 Relationship of Perceived Thirst to Measures of Hydration During and Following Exercise Lesley Willis Vandermark B.S., California University of Pennsylvania, 2010 M.S., University of Connecticut, 2012 A Dissertation Submitted in Partial Fulfillment of the Requirements for the Degree of Doctor of Philosophy at the University of Connecticut 2016
4 Copyright by Lesley Willis Vandermark 2016
5 APPROVAL PAGE Doctor of Philosophy Dissertation Relationship of Perceived Thirst to Measures of Hydration During and Following Exercise Presented by Lesley Willis Vandermark, B.S., M.S. Major Advisor Douglas J. Casa Associate Advisor Lawrence E. Armstrong Associate Advisor Elaine C. Lee Associate Advisor Lindsay J. DiStefano University of Connecticut 2016 i
6 Acknowledgements Dr. Casa, I would be doing you an injustice if I tried to explain everything you ve done for me. I m eternally grateful for your belief and investment in me. You are a positive force personally and professionally like no other, and I can only hope to take a piece of that with me. Dr. Armstrong, working with you has been an amazing and rewarding experience. I have learned to be a careful and analytical thinker from you. Dr. Lee, it has been an honor to work with you on this project. I have learned so much from you. Thank you for pushing me, guiding me, and showing me the professional that I want to be. Dr. DiStefano, I m grateful to have had the opportunity to work with you, and learn from you. The way you balance your life and have such success is inspiring, and I hope I can achieve that in my future. Participants and researchers, thank you for your dedication to this project. It could not have happened without your support, and tireless effort. You are the reason it all happens, and the reason it works. My colleagues at UConn and in KSI, there are too many of you to name who have helped me along the way. I can t separate my professional successes from yours, and I m grateful every day for your comradery. I hope we can work together again, and if not that we can support each other from afar. And for goodness sake if I can do it, so can you, so keep at it. Will, we did this crazy project together and it could not have happened without your effort. Thank you for your patience, and the last amazing six years. My friends and family, near and far away, there are no words that can describe the feeling of being unyieldingly loved and supported. Dave, you inspire me every day, and I m excited for our future. I m so grateful to the Pryor family for reminding me that life is meant to be a beautiful balance. And, Meghan and Alex for showing me that success and happiness come in many forms. ii
7 Table of Contents I. Chapter 1: Review of the Literature...1 A. Hydration: Risks, Benefits, and Assessment Strategies during Exercise...1 B. Thirst as a Factor of Hydration...13 C. Factors Which Impact Thirst Perception and Drinking Behavior...19 D. Thirst as a Viable Indicator of Fluid Needs...31 E. References...31 II. Chapter 2: Relationship of Thirst to Hydration Status during Exercise...41 A. Abstract...42 B. Introduction...43 C. Methods...44 D. Results...51 E. Discussion...52 F. Conclusions...55 G. References...55 H. Tables and Figures...58 III. Chapter 3: Response of Thirst to Fluid Intake Following Exercise...65 A. Abstract...66 B. Introduction...67 C. Methods...69 D. Results...77 E. Discussion...84 iii
8 F. Conclusions...88 G. References...88 H. Tables and Figures...91 IV. Chapter 4: Conclusion and Future Directions V. Appendices A. Thirst B. Thirst Sensation Scale C. Diet Log D. Consent Form E. Medical History Questionnaire F. Copeptin Assay Description G. Thirst Sensation Scale data analysis iv
9 Chapter 1 REVIEW OF THE LITERATURE For decades a link between hydration and optimal physiological function has been examined in field and laboratory studies. Hydration has been linked to both performance and safety during exercise. Although the concept of hydrating is innate, drinking behavior is complex. Combinations of stressors such as sleep loss, dehydration, nutrition deficiency, and heat exposure are common in many scenarios, including the military and athletics. For example, a study of a military unit during an intense four-day field training exercise revealed that mood became more negative over the training period, and simple and complex cognition. 1 Additionally, stress hormone levels were elevated, indicating physiological as well as psychological degradation under these conditions. 1 These effects can lead to crucial errors which decrease overall performance and safety. 2 Hydration recommendations 3,4 exist from various medical and sport organizations, but without a true consensus. 5,6 A. Hydration: Risks, Benefits, and Assessment Strategies during Exercise Hydration as a state is controlled by homeostatic mechanisms that drive fluid loss and retention in connection with the central nervous and renal systems. 7,8 Figure 1.1, adapted from Cheuvront et al. (2013) describes different types of body water loss and the cascade of physiological responses that follow to conserve or acquire the water necessary to sustain body function. 8 Hydration as a process references total body water, which is not easily examined in non-laboratory settings. This process is of fluids lost and gained, and impacts physiological function and exercise performance. Hydration assessment provides information that, when interpreted appropriately, can improve health and exercise performance. 1

. 8 Body water regulation in response to dehydration.")
10 For clarity in the following text, definitions for hydration states and process are provided, from a former review of thermal physiology. 9 Euhydration is a steady state condition of normal body water, hypohydration is a steady-state of decreased body water, and hyperhydration is a steady state of increased body water. The process of dehydration is water loss leading to hypohydration, and rehydration is the process of adding water leading towards a state of euhydration. Figure 1.1. Adapted from Cheuvront, Kenefick, Charkoudian, and Sawka (2013). 8 Body water regulation in response to dehydration. Schematic includes the 2 major types of dehydration, their typical causes, and the estimated magnitude of dehydration required to stimulate a primary osmotic- or volume-dependent response for compensatory water conservation and acquisition. A change in TBW was equated with a change in body mass (1 L = 1 kg), whereby dehydration was expressed as a percentage of body mass. Plasma volume and TBW losses are depicted to scale as are their 1:10 and 1:5 ratios for hypertonic and isotonic hypovolemia, respectively. Dashed arrows represent negative feedback. Ang II, angiotensin II; AVP, arginine vasopressin; TBW, total body water. 2
11 Safety and Performance Considerations with Hydration during Exercise Hydration during exercise has both health and safety, and performance implications. Thermoregulation and cardiovascular function are of primary health and safety concern. Thermoregulation is affected by hydration during exercise. There is a relationship between hypohydration and change in temperature, that higher levels of hypohydration are associated with higher exercising body temperatures when compared to the same exercise in a euhydrated state. 10 For example, a systematic review described body temperature as having a positive relationship with increased levels of dehydration, where for every 1% loss of body mass, body temperature is 0.25 C higher. 10 Increased body temperature with hypohydration greater than 1-2% corresponds with a reduction in sweating attributed to the effects of blood hyperosmolality Reduced sweating stifles dissipation of body heat via evaporation of sweat from the skin, which contributes to rise in body temperature. Even a small increase in body temperature impacts health and safety by putting an athlete at higher risk of experiencing a heat illness. Although thermoregulation is very commonly associated with hydration, cardiovascular function and performance (e.g. cognition, neuromuscular control, and aerobic performance) are also impacted by dehydration. Cardiovascular function is affected by hydration during exercise. There is competition for blood flow between muscle and skin during exercise in a dehydrated state, with muscle typically losing out to the skin in favor of thermoregulation The competition is linked to a reduction in stroke volume and reduced blood volume, resulting in an overall reduction in cardiac output during intense aerobic exercise. 16,17 Heart rate has been shown to be increased during aerobic exercise while in a state of dehydration, in comparison to a state of euhydration. 16,18 A systematic review of heart rate and hydration state during aerobic exercise 3
12 uncovered a small elevation in exercising heart rate for every 1% body mass loss during aerobic exercise. 19 Changes in cardiac output are likely related to decreased blood volume with increased demand. In addition to safety considerations, performance considerations related to hydration status may be of significant importance. Athletic performance has been known to suffer in many ways related to dehydration. Cognition, development of fatigue, and neuromuscular control can be heavily impacted by significant dehydration. 1,20 23 It appears that dehydration increases cardiovascular strain, which in turn produces fatigue with or without hyperthermia. 14,24 However, mild dehydration of less than 2% body mass loss has little effect on fatigue, potentially owing to the relatively little increased cardiovascular strain experienced at such a low level. A study of basketball players revealed that total fatigue was not different between players after a simulated basketball game until approximately 3-4% body mass loss. 23 Fatigue may also be influenced by the environment, where a greater heat stress elevates the perception of fatigue; 8 or altered muscle metabolism, again however, it appears that decrements do not become noticeable until greater than 2% body mass loss is achieved. Hypohydration and hypothermia may have an impact on aerobic, but not anaerobic exercise In the endurance population, it appears that 2% body mass loss inhibits long distance (5,000 and 10,000 meter) running performance, but not shorter distance. 25,28 For example, distance runners performed a 12km race in the heat faster and with more even pacing in a hydrated state, compared to a hypohydrated state. 21 In a thermoneutral environment endurance exercise performance of 90 minutes did not decrease with dehydration less than 2%. 25 Hypohydration and dehydration have been considered to impact cognition and mood during exercise. However, a study of military subjects who were approximately 3% 4
13 hypohydrated based on body mass deficit did not show any cognitive or mood deficits, suggesting that at lower levels of water loss there would be no decrement. 29 This may be beneficial during exercise, if under mild conditions, negative emotions are not perceived and cause little or no distraction. However, this may lead to further dehydration as no indication of need to hydrate (i.e. thirst) is perceived. Negative emotions have also been noted when individuals with commonly high daily fluid consumption are fluid restricted, where their lowdrinking counterparts had improved emotions with additional fluid provision. 20 However, this conflicts with evidence by Cian et al. (2005) 30 describing both passive heat exposure and exercise-induced dehydration, in comparison to a control condition, related to cognition and mood. Cognition deteriorated with greater than 2% body mass loss evidenced by higher ratings of fatigue, increased reaction time, and decreased short term memory, regardless of passive or exercise-induced method. 30 This suggests that dehydration, not exercise, is the cause of the cognitive change. Cognitive benefit was not evidenced when body mass was acutely replaced to less than 1%, indicating that although a physiological change was induced, psychological change was not. 30 Mood was positive and amiable regardless of passive or exercise-induced method, or fluid ingestion. 30 Additionally, neuromuscular control has been shown to diminish under conditions of high body temperature, dehydration of >3%, and a combination of the two conditions. DiStefano et al. (2013) 22 demonstrated that jump landing mechanics, which are a widely accepted descriptor of lower extremity injury risk, are poorer under these conditions. 22 As another factor related to lower extremity injury, balance was negatively impacted by these factors as well. In a study of basketball players, very few drills were impaired at 2% body mass loss, which may be considered a tipping-point of sorts, where dehydration which progresses beyond this level 5
14 significantly impairs performance. 23 However, it may be reasonable to consider that less than 2% body mass loss does not impair skill performance. Over-consumption of fluid can also be detrimental to safety during exercise. Overconsumption of water is considered the primary cause of hyponatremia in healthy individuals during exercise, due to a dilution of plasma sodium. Exercise associated hyponatremia (EAH) is defined as a blood sodium concentration of less than 135 mmol/l. 4 Plasma sodium may be reduced by either overconsumption of a significant amount of electrolyte deficient fluid, excretion of a significant amount of electrolyte in body fluid, or a combination of these two factors by which electrolytes are lost and not replaced. This results in significant impairment, and ultimately death in extreme or unrecognized cases. EAH is most common in endurance exercise and military type events, 4 where fluid replacement guidelines may be inadequately assessed. Current general fluid replacement guidelines do not account for individual variation (e.g. sweating rate, exercise type, environment) are potentially harmful. 3,31 Lack of clear fluid consumption guidelines may lead to inappropriate fluid consumption of either too much or too little, and exertional hyponatremia in some cases. 4,32 Assessment of Hydration Total body water is commonly estimated as approximately 73% of fat free body mass. 7,8,33 35 Assessment of total body water assumes the individual is normal, health, chronically euhydrated, and resting in mild environmental conditions. 7 Total body water is variable and not applicable in exercise settings, so other practices are used to assess hydration. As depicted in Table 1.1 from Armstrong (2005) 33 these methods vary in field applicability, 6
15 accuracy, and other factors. The most commonly used hydration measures of field research use blood and urine, and body mass as indicators of hydration state or change during exercise. Table 1.1 From Armstrong et al. (2004). 33 Comparison of techniques of to assess hydration status. Blood and Urine Blood markers such as osmolality and plasma volume change have been used during exercise. Plasma osmolality refers to the concentration of solutes in plasma measured by either vapor pressure or freezing point depression methods. Normal plasma osmolality is considered to be approximately 287 mosm/kg among healthy, chronically well hydrated individuals. 33 But plasma osmolality lacks applicability as a long-term measure of whole body hydration state due 7
16 to the highly protected nature Plasma osmolality is protected by fluid retention (depicted in Figure 1.1) and stimulation of the renin-angiotensin-aldosterone system (RAAS). A small elevation (1-2%) in extracellular fluid osmolality stimulates. In a review of commonly used analytical urine measures, Armstrong (2005) 33 described the applicability and diagnostic accuracy of urine markers. Urine measures have a unique challenge, where a difference between longitudinal and spot samples has been reported. 39 Diagnostic accuracy of spot samples is questioned due to the lagging response of renal function with acute body water change. 40 Urine volume, collected over 24-hours, refers to the urine concentrating ability of the kidney based on body water needs. Typical values are considered to be approximately 1.4 L/24-hr. 33,41 Urine volume, and measures (i.e. osmolality, specific gravity) taken from 24-hour urine collection have greater applicability for long-term hydration state. 39 Normal euhydrated measures of urine osmolality are considered mosm/kg. This measure is commonly used in laboratory analysis where an osmometer is available. 41 Urine specific gravity and urine osmolality have a highly correlated relationship, but are less correlated with plasma osmolality. 42 Urine color has been used with reasonable accuracy as a more fieldexpedient measure of urine concentration, but lacks precision for laboratory assessment. 42,43 It refers to the color of urine as measured against a validated 8-point index to determine approximate percent dehydration, where 1 color increase is approximately equal to 1% loss. 42 Normal euhydrated measures of urine color are considered to be approximately 3-7 on the index. 41 Urine specific gravity is a measure that compares the density of urine to pure water, where a higher density is related to more solute, and thus a higher concentration of urine. 8
17 Normal euhydrated measures of spot-sample urine specific gravity are considered , with lower concentrations of 24-hour samples. 41 Body Mass Body mass change is one of the most acute measures of fluid loss, and is commonly used as a comparison to the previously described blood and urine markers. 44 Body mass change accounts for sweat and insensible fluid loss during exercise, and may be used to detect modest changes that would not meet the dehydration thresholds (e.g. changes in urine osmolality, hormone concentration). Assessment of body mass change requires few, and primarily portable tools, and does not require complex laboratory procedure. It measures fluid loss by change in body mass over time, and is commonly used in both laboratory and field research. Normal values can be established with a few consecutive days of baseline weighing. 41 However, longterm or chronic body mass change is not easily assessed in this method without careful experimental control, and assessment during an exercise bout is often inconvenient, as undressing is required. Thirst Commonly used hydration guidelines recommend mitigating fluid losses to less than 2% loss in body mass, however it is very common for athletes to function at 3-4% loss. Most recommendations consider that both fluid and electrolytes are important parts of an appropriate hydration plan, but how to consume those substances is left in question. A study of fluid replacement tactics reveal that drinking to thirst is very commonly used in endurance events. 45 To avoid both impactful dehydration and hyponatremia, appropriate estimation of fluid needs is absolutely necessary in populations with the potential fluid loss. Numerous sport and labor safety organizations provide recommendations to appropriately measure dehydration 9
18 before and after activity, to then replace fluid lost. However, the most common methods described are not feasible for application during activity, and give no insight into preventing impactful dehydration. Measures of urine color and specific gravity, as well as body mass change may be generally useful before and after exercise in field scenarios; however, they provide little indication of hydration status during activity. Sweat is the primary fluid lost during exercise, and thus sweat rate is often used to describe the total water lost over time during exercise. Understanding the approximate amount of water lost in a given time during exercise would allow the athlete or laborer to effectively replace fluids and stave off the negative impacts of dehydration. This method is relatively simple and cost effective, but comes with several assumptions. Sweat rate is dependent on both internal and external factors, many of which cannot be controlled. 46 It is impractical to test sweat rate under all conditions, and thus sweat rate is only applicable under the assumed set of conditions. While replacing fluid based on sweat rate may provide some useful general guideline to follow during activity, it may over- or under-estimate fluid needs. Moreover, fluid replacement guidelines for sweat rate based on gender and age provide even more room for error when replacing fluid. In order to make appropriate hydration decisions without stopping exercise, an accurate field-expedient and efficient measure must be available. Thirst has been elucidated as a possible answer to this problem, 47 as it has no associated cost and could be used with minimal disruption in activity. Thirst has been studied in many contexts, commonly during exercise, and may present a method to quickly assess hydration status, and subsequently hydrate appropriately. As thirst is driven by both physiological and psychological factors, assessment of thirst is challenging. However, a combination of methods and questions about perceptual factors 10
19 involved in thirst regulation (e.g. thirstiness, pleasantness to consume fluid, mouth feel and taste, gastrointestinal comfort, fatigue, perception of hydration status) are used in research (Figure 1.2). 48 Figure 1.2. Reproduced from Millard-Stafford et al. (2012). 48 Representations of instruments used to assess human thirst: 10-cm visual analogue scale (top) and 7-point categorical scale (bottom). Likert-type scales There is not a validated and reliable gold standard for measuring thirst, as it is difficult to validate. Thirst is a perception that is linked to a combination of intrinsic and extrinsic factors that have some imperfect relationship. This is not the case with all perceptual indices. Thermal sensation indices, such as a heat scale used commonly in thermoregulation research, 49 can be compare to body temperatures to validate thermal perception. However, there are several commonly used indices that have been correlated with factors surrounding thirst, such as plasma osmolality, or concomitantly assess related factors such as gastrointestinal and oropharyngeal factors. Likert-type or categorical type scales are commonly used to measure perceptions during exercise, and this extends to thirst. A simple 1-9 point anchored Likert-type scale (Appendix A) 11
20 has been used in several publications relating perception of thirst to static and dynamic hydration state, during and following exercise This is a simplified way of analyzing thirst, assuming that it follows a linear trend, and that the distance between points on the scale is relative but not equal. A series of Likert-type scales has been used to assess several aspects of thirst beyond simply asking the question how thirsty do you feel? This collection of 37 scales incorporates the understanding of thirst perception as having a relationship with other influencing factors such as gut fullness, mouth and throat dryness, and mouth taste. 56 In a study of exercise-induced progressive levels of dehydration, with subsequent ad libitum fluid replacement, the scales were used successfully to describe thirst related to plasma osmolality and body mass loss. 56 Visual Analogue Scales Visual analogue scales have been used to measure thirst. Measurement of change of thirst over time from baseline was performed in a study on hunger provocation following glucose administration. 57 In this case, participants would initially mark a 30-cm line, and would repeat this at time points following glucose administration. Assuming that individuals perceive thirst differently and that at baseline all participants were normally hydrated and not thirsty, differences in thirst were calculated to determine the relationship between thirst and hunger. While this method does account for individual variation, it would not be appropriate for situations where there is potential for beginning exercise in a hypohydrated state. Visual analogue scales can be used independently, or in groups of related questions. A study of thirst following high intensity intermittent exercise used two visual analogue scales of thirst and mouth dryness to characterize thirst following this type of exercise
21 A series of visual analogue scales on 10-cm lines addressing questions related to thirst were used to assess changes during water deprivation and rehydration. 59 Again, changes in rating were used to assess subjective ratings of thirst within each individual before and after a fluid bolus, and were positively correlated with changes in plasma osmolality. 59 Another series of five visual analogue scales about thirst and oropharyngeal comfort was used to describe thirst with combinations of hypohydration and water immersion in men. 36,60 Uncommonly, drinking behavior and preconceived notions on drinking are assessed in relation to fluid intake. In the first study to examine a difference, Armstrong et al. (2014) 55 described drinking to thirst vs. ad libitum fluid intake by evaluating cyclists perception of thirst and their own drinking behavior. 55 In this study, drinking to thirst (i.e. drinking only when perceiving a sensation of thirst) and ad libitum drinking provide similar fluid replacement results during exercise. B. Thirst as a Factor of Hydration Thirst is a bio-psychological variable, with roots in fluid regulatory hypothalamic stimulation, hormonal control, and is subjective to perceptual influences. There are several proposed mechanisms by which thirst is stimulated, including hypovolemia and cellular dehydration which both increase osmolality The sensation of thirst is not a solution to a less desirable state of hydration but does, in part, give rise to the behavior of drinking. 13
22 Physiological Control of Thirst Central Control of Thirst in the Hypothalamus The complex system of neural circuitry that responds to physiological changes in osmolality of plasma and cerebrospinal fluid, also receives sensory input from esophageal and gastrointestinal receptors to create a sensation which drives drinking behavior. Depicted in Figure 1.3, hypothalamic stimulation, specifically of osmoreceptors in the organum vasculosum of the lamina terminals (OVLT), subfornical organ (SFO), and median preoptic nucleus (MnPO) provides neuronal connection to the organs which produce arginine vasopressin (AVP). 64 Arginine Vasopressin has a critical role in fluid regulation and thirst. Farrell et al. (2011) 65 described increased cerebral blood flow during rehydration, supporting the theory that these hypothalamic organs may monitor change in hydration in real time. Further research on the influence of the vagus nerve, as well as impact of hormones on hypothalamic function and resulting change in thirst regulation, are ongoing and thus far inconclusive. 66,67 14
23 Figure 1.3. Reproduced from Stachenfeld, Schematic diagram of central regulation of body fluid regulation in response to acute changes in sodium and volume. AVP arginine vasopressin, LH lateral hypothalamus, LPO lateral preoptic nucleus, NM median preoptic nucleus, NTS nucleus of the solitary tract, OLT organum vasculosum of the laminal terminalis, PVN paraventricular nucleus, SFO subfornical organ, SON supraoptic nucleus. Hormonal Response Initiating and Perpetuating Thirst Cellular dehydration occurs when fluid shifts out of the cells, plasma osmolality being the typical precursor, which stimulates thirst. This is likely due to an increase in transmembrane osmotic pressure, creating more potential for water to cross from intracellular fluid (ICF) to intravascular extracellular fluid (ECF) space. When solutes become more concentrated in plasma, water shifts from the ICF to the ECF via osmosis readily. 68 Hypertonic saline infusion causes increased sodium entering the plasma causes large fluid shifts out of the ICF Stimulation of the OVLT, SFO, and MnPO in the hypothalamus cause AVP production to encourage fluid conservation and fluid intake. 61 Three primary pathways lead to thirst 74 (Figure 1.4); it is important to note that thirst is not the sole determinant of drinking behavior. Figure 1.4. Reproduced from Greenleaf, A model illustrating three major pathwaysosmoreceptors, hypovolemia, angiotensin II and associated factors for induction of fluid intake. 15
24 Arginine vasopressin is secreted after baroreceptor and osmoreceptor stimulation of the hypothalamus. Additionally, peripheral baroreceptors and the presence of angiotensin II may stimulate release of AVP. All of these systems combined create a complex of actions that lead to the production of AVP. The action of AVP in fluid regulation is two-fold: renal water reabsorption and systemic vasoconstriction. 31,56,75 The threshold for thirst and AVP release are tightly linked, and thus sweating during exercise can stimulate thirst. Fluid intake which reduces ratings of thirst is followed by a concurrent reduction in AVP. 63 This concept that thirst and AVP follow a similar pattern is evident as Robertson (1984) 75 described AVP, thirst, and plasma osmolality, depicted in Figure 1.5. Thirst increases as plasma osmolality increases, and appears to be stimulated at a relatively low plasma osmolality, 76 but relatively high concentration of AVP. Figure 1.5. Reproduced from Robertson, The relationship of plasma AVP ( ) and thirst (x) to plasma osmolality in a healthy volunteer during infusion of 5% saline. The plasma AVP level was determined by radioimmunoassay. Thirst intensity was estimated by means of a geometric rating scale. The regression functions were calculated by least-squares analysis of all data pairs above the x-intercept. 16
25 Normal concentration of plasma AVP is approximately 1 pg/ml. In this graph, AVP appears at a plasma osmolality of approximately 290 mosm/kg, and thirst is stimulated at an osmolality of approximately 294 mosm/kg. At that plasma osmolality, AVP concentration is approximately 11 pg/ml, showing that thirst has a delay in stimulation. Copeptin is a pre-pro-hormone synthesized in the hypothalamus, and stored following axonal transport in the posterior pituitary. During transport, it is cleaved into its major parts, vasopressin, neurophysin II, and copeptin. Although copeptin is inactive in the circulation, its concentrations during osmotic shifts in blood are very similar to those shifts observed with AVP, and are highly correlated as depicted in Figure Thus, although copeptin does not have a direct action to influence thirst, it can be used reasonably as a marker to describe the concentration of a more unstable hormone, AVP, which does influence thirst Figure 1.6. Reproduced from Balanescu et al. (2011). 77 Plasma AVP and copeptin concentrations measured during the individual water load-hypertonic saline tests are shown as scatter plot. r s denotes Spearman s rank correlation coefficients. 17
26 With 24 hour water deprivation, there is an upward shift in plasma osmolality, 59 plasma sodium, and hematocrit. With oral rehydration, plasma osmolality decreased in as little as 5 minutes after drinking, and decreased to below pre-deprivation values within 15 minutes. 59 During water deprivation, subjective ratings of thirst increased. Thirst then rapidly decreased after drinking, becoming significantly different from before drinking by 2.5 minutes, although at this time only a small amount of fluid was ingested. 59 Thirst eventually returned to predeprivation levels between 5-30 minutes after fluid consumption was initiated. 59 Plasma osmolality is kept within a tight range, between mosm/kg, and even small deviations within this range, as low as 2% increase corresponding to about 290 mosm/kg 63,81 can activate the RAAS. However, the perceived thirst appears to vary between individuals, 61 eluding to the influence of non-physiological drivers of thirst. Although other components of the RAAS may be active or potentially elevated with fluid deprivation, such as antiogensin II and renin, they do not stimulate thirst directly, but satisfy it indirectly through hormonal regulation of fluid retention. 59,63 Hypovolemia also plays a role in thirst stimulation. Depletion of the intravascular fluid causes decreased plasma volume, which commonly occurs with thermoregulatory sweating during exercise. 82 This decrease in plasma volume stimulates baroreceptors in the hypothalamus, and initiates the release of hormones to protect fluid loss and provide still appropriate circulation to perfuse necessary tissues. 62 In many cases hypovolemia leads to cellular dehydration by increasing the osmolality, which creates an environment to cause fluid shift between compartments. 83 During head-out water immersion thirst is suppressed when a person has significant ECF volume depletion. 36,60 External hydrostatic pressure pushes fluid from the ICF to the ECF, 18
27 causing cellular dehydration, but decreasing plasma osmolality into the normal range by increasing plasma volume. The increased external hydrostatic pressure decreases the inherent stimulation of baroreceptors, limiting the activation of the RAAS. With concurrent water immersion and hypohydration, perceived thirst decreases without fluid intake; however, without hypohydration, fluid shift is not as dramatic, and there is no effect on thirst. A review of studies describing the mechanisms which govern thirst aimed to further describe the complex actions of these hormones on thirst. Ratings of thirst are highly correlated with plasma osmolality during exercise in trained athletes, but not untrained athletes. 63 Factors such as metabolic disease, training status, and advancing age are shown to delay thirst due to altered handling of body water and altered AVP release. 63 C. Factors Which Impact Thirst Perception and Drinking Behavior Regulation of thirst is complex, including not only hormonal, but also physiological regulation. We can see that thirst during daily life and during exercise are somewhat separate phenomena. Indirectly, increased water consumption during daily life is associated with improved overall mood, lower ratings of thirst, and more positive emotion. 20 Additionally, decreased water consumption during daily life is associated with deteriorated mood and more negative emotion. 20 Importantly, these changes are directly related to typical water consumption habits, where those people who typically drink a lower amount of fluid do not experience significantly greater negative emotion in daily life. There must be the understanding that physiologically thirst may be generated based on hormonal and CNS responses of physiological states, but may not actually be perceived. Evidence on thirst as a method for adequate fluid replacement is mixed, 84 and sometimes 19

28 confused with drinking behavior. Drinking behavior is, at its essence, driven by thirst but influenced by many other factors. Depicted in Figure 1.7, both intrinsic and extrinsic factors have a profound effect on the perception of thirst. 31,56 Thirst should stimulate what is termed voluntary fluid intake, however often athletes do not take in enough fluid to prevent dehydration, which is theoretically the primary driver of thirst. Oropharyngeal, gastrointestinal, and postabsorptive factors can influence thirst over time, but we propose that identification and modification of these factors could improve voluntary fluid intake when thirst is present. Involuntary dehydration, or the process by which adults to not fully replace lost fluid during exercise, can potentially be prevented by washing out perceptual interference. Figure 1.7. Factors affecting drinking behavior. Environment The environment potentially influences perception of thirst both during exercise and at rest. A warm environment likely stimulates thirst based on fluid balance in response to sweating. Cold exposure may reduce thirst sensation 63,85 by a similar mechanism as water immersion, increased central blood volume. In cold environments however, rather than a fluid compartment 20
29 shift more plasma is driven centrally by peripheral vasoconstriction to preserve body heat at rest. The use of cooling modalities during or after exercise may provide a similar, but not as dramatic, effect as a cold environment, driving blood out of the periphery. 86 The increased volume mitigates the thirst response by up to 40%, effectively deceiving the baroreceptors to delay release of AVP. 85 As plasma volume will not be reflective of body water balance in this environment, thirst may not be as sensitive to changes in hydration status at rest in a cold environment. However, exercise in the cold at higher intensities may not see the same reduction in thirst, likely due to the greater heat production and less blood centralization. 87 Mitigation of thirst may be controlled to some extent by wearing appropriate clothing so as to maintain heat balance during exercise, or assessing thirst prior to application of cooling modalities. Although not related to the physical environment, the social and cultural environment may predispose one to suppress thirst. Consideration of religious rituals which control food and beverage consumption can profoundly affect hydration before, during, and after exercise. For example, observation of Ramadan during an athletic season can have profound impacts on daytime hydration and energy replacement, where no consumption may occur during daylight hours. However, because fluid consumption is allowed during darkness, athletes may use strategies to prevent cumulative hypohydration across the month. 88 This practice does not allow the sensation of thirst to dictate consumption of fluid, and thus need for fluid consumption via thirst cannot be assessed. Availability of fluid Availability of fluid is commonly associated with voluntary hydration, particularly in the labor and athletic settings. 89 If extra energy or time must be taken to locate or obtain fluid, it is theoretically more likely that an athlete or laborer will go without drinking until a greater level of 21
30 thirst is experienced. Availability may be considered in two respects: fluid proximity and container type. 61 Fluid proximity has been studied in endurance sports, specifically cycling where fluid is attached to the bike frame and readily available for consumption. Before, twice during, and immediately following a 164-km cycling event in a hot environment thirst, as well as other fieldexpedient hydration markers, was assessed. 2,54,55 It was found that body mass was relatively stable (approximately 2 kg lost) over the course of the race, and although thirst did increase slightly from approximately 2 to 4 on the 9-point scale, it would also be considered mild. Although the physical conditions are stressful, one major proposed factor influencing fluid consumption in this case was the availability of water. Cyclists keep bottles of water within reach on a bike frame, and thus have the unique ability to consume fluid without stopping activity. In a follow-up study, 53 total fluid intake and body mass were evaluated as predictors of thirst in a 164-km cycling event. However, thirst was unrelated to either measure, implying that what inspires an athlete to consume fluid is complex in nature, and that body mass change and body fluid balance are not the same. In cycling where fluid is readily available, athletes may be more likely to consume fluid based on factors unrelated to thirst. The same study 53 evaluated the relationship between duration of exercise and total fluid intake, amidst previous research proposing that endurance athletes are at greater risk of exertional hyponatremia due simply to the total fluid volume consumed during longer events. There was a positive relationship between duration and total fluid intake, but still with mild fluid loss (body mass change of -2.7±1.8%). This supports the notion that thirst may not be the only factor to drive an athlete to consume fluid during exercise. 22
31 Endurance running has been of particular concern in regards to drinking behavior during running. Fluid is not readily available during long distance running events. However, a study of heat acclimatized male runners performing treadmill running described that when fluid was readily available, only a mild level of dehydration was reached (< 1%). 90 Although carrying fluid has become more prevalent, there are inherent drawbacks to carrying enough fluid to prevent significant dehydration during long events. Additionally, container type may affect drinking behavior or beverage preference by making fluid either more or less accessible. 61 It was shown that during rest, subjects consumed more fluid from a wide-mouthed container, such as a cup, than from small-mouthed containers such as bottles and cans. This may be due to a faster flow-rate of fluid out of the container allowing more rapid fluid consumption, and less required effort to access the fluid. Although cups of fluid are not typically available at most team setting sporting events, they are very common at endurance running and cycling events. However, research describing long distance running continue to report high levels of dehydration seen in finishers. 45,91 93 Adding to this issue of availability is the concept of mobility and forethought about restroom usage. In elderly populations, thirst may be elevated however these individuals choose not to act upon thirst cues to prevent the need to use the restroom frequently. Mobility or issues with immediacy, such as incontinence, make people less likely to consume fluid according to thirst in order to prevent numerous trips to a restroom. 94 Palatability Palatability is generally thought to be a combination of several characteristics of a beverage which may have a varying level of pleasantness to the drinker. Consideration of factors that influence beverage palatability surely influence the choice to drink the beverage, regardless 23
32 of the presence of thirst. Sagawa described water immersion decreased thirst, and decreased palatability of fluid in terms of mouth feel and taste, feel of fullness, and fluid desirability, at a similar rate. 60 This suggests that these factors are closely tied to thirst, and that influence of fluid palatability is large. Ali et al. (2011) 95 describes no preference for carbohydrate-electrolyte solutions over water before, during, or after exercise, but thirst quenching ability and overall liking of all beverages increased with exercise. 95 However, thirst was not measured, and thus actual thirstaltering quality of the beverage cannot be elucidated. Also, typical beverage preference was not controlled in this study, and thus change in individual preference during exercise cannot be elucidated. Beverage palatability can be affected by flavor, mouth feel, temperature, and typical beverage preference. 62 Flavor and Content Beverage content has been shown to provide a more favorable drinking experience, and thus result in higher rate of intake and total intake, and a reduction in body mass loss from exercise. (Vandermark systematic review, unpublished). These beverages fall into several categories: flavored but without caloric content, carbohydrate containing, electrolyte containing, acidic, and combinations thereof. Flavored beverages typically contain carbohydrate with or without electrolyte, and sometimes protein in varying amounts. Sweetness and saltiness, as well as additional flavor may affect palatability of fluid, influencing fluid consumption. Any flavor beyond water may provide some stimulus to drink as it commonly is associated with sweetness or energy consumption, but particular flavor preference is likely individual. 96 For flavored beverages, more diluted beverages are preferred and result in less body mass loss over strongly 24
33 flavored beverages, and result in lower ratings of thirst and higher ratings of palatability during labor in the heat. 62,89 Electrolyte containing beverages have been shown to be similarly palatable as plain water, but appear to mitigate the effects of involuntary dehydration. 97 The inclusion of small doses of electrolyte in beverages during and after exercise has been found to increase both hydration during exercise as well as rehydration after. 98 In contrast, a study of children exercising in the heat found that they neither preferred a sports drink nor did they consume more of it than water, eluding to personal preference as a main confounder. 90 Electrolytes may provide a more palatable solution to lessen voluntary dehydration while still inspiring thirst. However the impact of specific individual components, such as electrolytes alone, is largely undescribed Beverages which contain electrolytes can have a large effect on voluntary fluid intake and may impact thirst also. Even when salt content is low, it drives fluid shift from ICF to ECF by forcing regulation of plasma osmolality. This might also suppress thirst with the increase in volume and maintenance of osmolality, but causes cellular dehydration. However, while this may be the case in a relatively well hydrated individual, during recovery periods or rest before exercise when hypohydrated, salt content can help drive thirst by increasing plasma osmolality; it may also provide the lasting benefit of fluid retention with fluid consumption. 107 Hypertonic beverages, such as pickle juice 108 and soup broth, 109 have been considered as potentially exaggerating thirst by the same mechanism. Although there appears to be no difference between these solutions, they may inspire more water consumption due to lesser palatability than water without a significant change in plasma osmolality. 108 Recommendations to rehydrate with these beverages should be taken with a grain of salt, however, as the lack of 25
34 change seen in plasma osmolality may be the due to cellular dehydration whereby the increased plasma sodium drives fluid out of the cell as a compensatory mechanism. Furthermore, these beverages had little effect on perceived thirst and are largely unpalatable during exercise. Access to pleasant tasting beverages, or at least not unpleasant tasting beverages, will increase voluntary fluid intake during exercise. Provision of more dilute, electrolyte containing beverage options if some flavor is preferred, 89 but also justifies the use of plain water to prevent significant voluntary dehydration during exercise in the heat. Temperature Fluid temperature is widely considered an influencing factor in fluid intake, where cooler fluids are preferable during exercise in warm environments. 61,110 Availability of cooler fluids results in approximately 50% greater volume consumption during exercise, regardless of beverage type. 62,110 Temperature preference during exercise is closer to 22 C than 6 C. 28,62,97 However, this preference may be impacted by environment and exercise intensity. Most studies in which beverage temperature is assessed in relation to volume of fluid consumption have been performed in warm environments, 110 creating an external link between a preference for cool beverages and warm environments. However, it appears that in cases where cool beverages are not available, ambient temperature fluid consumption may be similar enough to prevent significant body mass loss. 96 Interestingly, perceived fluid temperature is variable, likely due again to environmental influence, and thus a range of temperatures is likely acceptable. 111 The recommendation that fluid available during exercise should be cool, but not very cold, in order to make it most appealing. 26
35 Mouth Feel Relatively little information on fluid consumption and mouth feel or viscosity exists at this time, however beverages with a high viscosity or syrupy mouthfeel are typically less appealing during exercise leading into voluntary dehydration. 61 Fluid consumption following fluid deprivation was perceived to decrease thirst. In a study of males who underwent 24 hours of fluid deprivation, perception of mouth feel, mouth taste, and pleasantness to consume water were all rapidly decreased following the initiation of drinking water, and were sustained over time. 59 Questioning of reasons for rehydration following this deprivation period revealed that fluid consumption by participants was driven by the need to eliminate a tacky or dry mouth. 59 Additionally, participants recognized that only small amounts of fluid were required to suspend dry mouth feel. 59 Cold temperature, and a resultant very small amount of water, via sucking on ice chips following exercise induced dehydration has been shown to decrease thirst perception without a change in plasma osmolality or AVP. 112 Additionally, mouth dryness has been linked to increased fluid palatability, leading to increased fluid consumption. Thirst and mouth feel may play a role in both initiation and cessation of drinking. Studies of mouth dryness after exercise where saliva was collected via cotton and not allowed to enter the oral cavity describe fluid consumption after this period with an increased volume, frequency, and number of bouts than when saliva was not collected. 113 Although a similar level of dehydration was reached between saliva and non-saliva conditions, more drinking occurred when no saliva was present in the mouth both at rest and during exercise. 113,114 This indicates that even the relatively small stimulus of salivary wetting of the mouth can cause a decrease in thirst and fluid consumption. Indirectly mouth feel has been attributed to satiety after fluid consumption in studies of oral versus intravenous rehydration. 51,50,52,115 In a study where hydration status was controlled 27
36 via intravenous catheterized infusion of saline, thirst was also controlled via mouth rinsing. It appeared that the presence of a water mouth rinse during exercise reduced the perception of thirst, but did not completely abolish it. 70 This implies that the wet mouth feeling was enough to suppress thirst in the short-term, which falls in line with previous research. 63,116 This gives rise to the notion that incomplete fluid replacement may suppress thirst during exercise, but will not completely shut it out so that thirst may still be considered to indicate need for additional fluid consumption. Gastrointestinal Stomach distention has a profound effect on our willingness to consume fluid, and relates even to negative feelings such as nausea. Beverage type may affect stomach fullness; sugar and electrolyte containing drinks inspire higher levels of fullness than water, leading to decreased drive to consume additional fluid. 90,111 In a study of hypohydrated and euhydrated people exposed to fluid-restricted exercise, stomach fullness was much less in the hypohydrated group, which consequently took in more fluid during a rehydration period. 60 There is a tight, if not completely understood relationship between nausea and AVP, giving rise to an indirect relationship between thirst and nausea. 117 More discovery of how AVP and nausea interact can lead to better planning to appropriately assess thirst. In a study involving rehydration following a 24-hour fluid deprivation period, participants described that rehydration was limited by the feeling of stomach fullness. 59 It appeared through perception questionnaires that fullness increased rapidly with initiation of fluid consumption. 59 In a study involving fluid extraction after consumption, gastrointestinal fullness following fluid consumption was avoided by extracting the consumed fluid. Thirst was still decreased, indicating an independent role of gastrointestinal and oropharyngeal factors. 118 It is 28
37 unclear in the literature whether sensation of intake volume can be accurately detected by humans. Exercise Although fluid replacement during exercise is often discussed in relation to dehydration, there is a lack of evidence describing the impact of exercise itself on thirst, however theoretical models exist. Thirst is theoretically increased by exertion, due to the presence of causational factors previously described. With high intensity exercise, for example, there is a body water shift from the extracellular to intracellular space associated with a rise in blood osmolality, as well as AVP release. 119,120 Kenefick et al. (2004) 85 described exercise in a cold environment as modulating thirst perception in comparison to exercise in a temperate environment by causing vasoconstriction and a lack of central volume decrease, thus inhibiting AVP release (Figure 1.8). Figure 1.8. Compiled from Kenefick et al. (2004). 85 Perceived thirst, plasma AVP and plasma osmolality vs. time (min) during exercise in cold and temperature environments with hypo or euhydration. Data are presented as Mean±SE. # denotes significant difference of hypohydration conditions from euhydration conditions at respective time points; * denotes cold conditions significantly different from temperate conditions at respective time points. 29
38 Analysis of exercise type describes that thirst during exercise is increased with a range of intensities. 58,72,87,121 Fluid consumption and sensations of thirst during high intensity intermittent exercise were associated with a rapid increase in serum osmolality and AVP levels. While thirst sensations occurred at low exercise intensity in the same study, it was to a lesser degree in accordance with diminished change in serum osmolality and AVP. 121 Mears and Shirreffs (2014) 87 found that thirst during and following moderate intensity exercise in a cold environment was blunted in comparison to a hot environment. However, this speaks highly to the impact of external environment on intrinsic factors of thirst regulation rather than the effect of exercise. 87 Low intensity exercise in the heat is sufficient to elicit change in plasma osmolality, how thirst and fluid intake in this case had a greater relationship with pre-exercise hydration state than with markers which changed over time. This suggests that low-intensity exercise is not a large enough stimulus itself to dictate thirst response during exercise. Additionally, a change in beverage preference, and fluid palatability is seen during moderate intensity exercise. During exercise, three formulations of a carbohydrate electrolyte solution was given to participants before, during, and after exercise, and evaluated based on factors related to pleasantness (sweetness, saltiness, thirst quenching ability, and overall liking) on visual analogue scales. 122 Intensity of sweetness increased over exercise, and saltiness decreased. Overall liking and thirst quenching ability increased during exercise regardless of beverage type, likely due to presence of some level of thirst. 122 This indicates that beverage preference changes due to exercise, becoming greater for saltiness theoretically to inherently return body water back to the extracellular space. 30
39 D. Thirst as a Viable Indicator of Fluid Needs Thirst has not been proven to be a feasible measure of need for fluid consumption during exercise in the athletic population, more-so than other measures of hydration such as urine analysis and estimation of body water loss. One benefit of the utilization of thirst is the possibility for real time hydration assessment. Primary factors which influence thirst can be controlled with appropriate planning to allow the physiological drivers of thirst to function naturally. Finally, understanding that perception of thirst is individual to each person, and a measure of thirst should not be used as an absolute measure of body fluid, but rather as an indicator of change in hydration status. Lack of thirst does not indicate a hydrated state. 36,60,74,123 Additionally, presence of thirst does not indicate significant dehydration. 63,74,116 There is strong evidence for the presence of thirst indicating some level of body fluid loss. However, we understand that thirst has a delayed onset commonly understood to be about 2% dehydration, and thus the lack of thirst does not indicate euhydration. 75,124 Outside influence of beverage preference, exercise type and intensity, and physical environment may all confound human perception of thirst. 97,103,110 References 1. Lieberman HR, Bathalon GP, Falco CM, Kramer FM, Morgan CA, Niro P. Severe decrements in cognition function and mood induced by sleep loss, heat, dehydration, and undernutrition during simulated combat. Biol Psychiatry. 2005;57(4): doi: /j.biopsych Armstrong LE, Johnson EC, McKenzie AL, Ellis LA, Williamson KH. Endurance Cyclist Fluid Intake, Hydration Status, Thirst, and Thermal Sensations: Gender Differences. Int J Sport Nutr Exerc Metab. 2016;26(2): doi: /ijsnem Sawka MN, Burke LM, Eichner R, Maughan RJ, Montain SJ, Stachenfeld NS. American College of Sports Medicine position stand: exercise and fluid replacement. Med Sci Sports Exerc. 2007;39(2):
40 4. Hew-Butler T, Rosner MH, Fowkes-Godek S, et al. Statement of the 3rd International Exercise- Associated Hyponatremia Consensus Development Conference, Carlsbad, California, Br J Sports Med. July doi: /bjsports Beltrami FG, Hew-Butler T, Noakes TD. Drinking policies and exercise-associated hyponatraemia: is anyone still promoting overdrinking? Br J Sports Med. 2008;42(10): doi: /bjsm Cotter JD, Thornton SN, Lee JK, Laursen PB. Are we being drowned in hydration advice? Thirsty for more? Extreme Physiol Med. 2014;3:18. doi: / Perrier ET, Armstrong LE, Daudon M, et al. From state to process: defining hydration. Obes Facts. 2014;7 Suppl 2:6-12. doi: / Cheuvront SN, Kenefick RW, Charkoudian N, Sawka MN. Physiologic basis for understanding quantitative dehydration assessment. Am J Clin Nutr. 2013;97(3): doi: /ajcn Casa DJ. Exercise in the Heat. I. Fundamentals of Thermal Physiology, Performance Implications, and Dehydration. J Athl Train. 1999;34(3): Huggins RA, Martschinske JL, Applegate K, Armstrong LE, Casa DJ. Influence of Dehydration on Internal Body Temperature Changes During Exercise In The Heat: A Meta-Analysis. Med Sci Sports Exerc. 2012;44(5):S587: Sawka MN, Young AJ, Francesconi RP, Muza SR, Pandolf KB. Thermoregulatory and blood responses during exercise at graded hypohydration levels. J Appl Physiol Bethesda Md ;59(5): Montain SJ, Latzka WA, Sawka MN. Control of thermoregulatory sweating is altered by hydration level and exercise intensity. J Appl Physiol. 1995;79(5): Buono MJ, Wall AJ. Effect of hypohydration on core temperature during exercise in temperate and hot environments. Pflüg Arch Eur J Physiol. 2000;440(3): González-Alonso J, Calbet JA, Nielsen B. Muscle blood flow is reduced with dehydration during prolonged exercise in humans. J Physiol. 1998;513 ( Pt 3): González-Alonso J, Calbet JA, Nielsen B. Metabolic and thermodynamic responses to dehydration-induced reductions in muscle blood flow in exercising humans. J Physiol. 1999;520 Pt 2: Gonzalez-Alonso J, Teller C, Andersen SL, Jensen FB, Hyldig T, Nielsen B. Separate and combined influences of dehydration and hyperthermia on cardiovascular responses to exercise. Int J Sports Med. 1998;19(Suppl 2):S111-S Montain SJ, Sawka MN, Latzka WA, Valeri CR. Thermal and cardiovascular strain from hypohydration: influence of exercise intensity. Int J Sports Med. 1998;19:
41 18. González-Alonso J, Mora-Rodríguez R, Below PR, Coyle EF. Dehydration markedly impairs cardiovascular function in hyperthermic endurance athletes during exercise. J Appl Physiol Bethesda Md ;82(4): Adams WM, Ferraro EM, Huggins RA, Casa DJ. Influence of body mass loss on changes in heart rate during exercise in the heat: a systematic review. J Strength Cond Res Natl Strength Cond Assoc. 2014;28(8): doi: /jsc Pross N, Demazières A, Girard N, et al. Effects of changes in water intake on mood of high and low drinkers. PloS One. 2014;9(4):e doi: /journal.pone Stearns RL, Casa DJ, Lopez RM, et al. Influence of hydration status on pacing during trail running in the heat. J Strength Cond Res. 2009;23(9): Distefano LJ, Casa DJ, Vansumeren MM, et al. Hypohydration and hyperthermia impair neuromuscular control after exercise. Med Sci Sports Exerc. 2013;45(6): doi: /mss.0b013e b Baker LB, Dougherty KA, Chow M, Kenney WL. Progressive dehydration causes a progressive decline in basketball skill performance. Med Sci Sports Exerc. 2007;39(7): doi: /mss.0b013e b González-Alonso J, Teller C, Andersen SL, Jensen FB, Hyldig T, Nielsen B. Influence of body temperature on the development of fatigue during prolonged exercise in the heat. J Appl Physiol Bethesda Md ;86(3): Cheuvront SN, Carter R, Sawka MN. Fluid balance and endurance exercise performance. Curr Sports Med Rep. 2003;2(4): Cheuvront SN, Carter III R, Haymes EM, Sawka MN. No effect of moderate hypohydration or hyperthermia on anaerobic exercise performance. Med Sci Sports Exerc. 2006;38(6): Cheuvront SN, Kenefick RW, Montain SJ, Sawka MN. Mechanisms of aerobic performance impairment with heat stress and dehydration. J Appl Physiol. 2010;109: Armstrong LE, Costill DL, Fink WJ. Influence of diuretic-induced dehydration on competitive running performance. Med Sci Sports Exerc. 1985;17(4): Adam GE, Carter R, Cheuvront SN, et al. Hydration effects on cognitive performance during military tasks in temperate and cold environments. Physiol Behav. 2008;93(4-5): doi: /j.physbeh Cian C, Barraud PA, Melin B, Raphel C. Effects of fluid ingestion on cognitive function after heat stress or exercise-induced dehydration. Int J Psychophysiol Off J Int Organ Psychophysiol. 2001;42(3): Maughan RJ, Shirreffs SM. Development of hydration strategies to optimize performance for athletes in high-intensity sports and in sports with repeated intense efforts. Scand J Med Sci Sports. 2010;20 Suppl 2: doi: /j x. 33
42 32. Noakes TD, Sharwood K, Speedy D, et al. Three independent biological mechanisms cause exercise-associated hyponatremia: evidence from 2,135 weighed competitive athletic performances. Proc Natl Acad Sci U S A. 2005;102(51): doi: /pnas Armstrong LE. Hydration assessment techniques. Nutr Rev. 2005;63(6 Pt 2):S Cheuvront SN, Kenefick RW. Dehydration: physiology, assessment, and performance effects. Compr Physiol. 2014;4(1): doi: /cphy.c Wang Z, Deurenberg P, Wang W, Pietrobelli A, Baumgartner RN, Heymsfield SB. Hydration of fat-free body mass: review and critique of a classic body-composition constant. Am J Clin Nutr. 1999;69(5): Wada F, Sagawa S, Miki K, et al. Mechanism of thirst attenuation during head-out water immersion in men. Am J Physiol. 1995;268(3 Pt 2):R Stachenfeld NS. The interrelationship of research in the laboratory and the field to assess hydration status and determine mechanisms involved in water regulation during physical activity. Sports Med Auckl NZ. 2014;44 Suppl 1:S doi: /s Phillips PA, Rolls BJ, Ledingham JG, Morton JJ. Body fluid changes, thirst and drinking in man during free access to water. Physiol Behav. 1984;33(3): Cheuvront SN, Kenefick RW, Zambraski EJ. Spot Urine Concentrations Should Not be Used for Hydration Assessment: A Methodology Review. Int J Sport Nutr Exerc Metab. 2015;25(3): doi: /ijsnem Maughan RJ, Shirreffs SM. Development of individual hydration strategies for athletes. Int J Sport Nutr Exerc Metab. 2008;18(5): Armstrong LE, Pumerantz AC, Fiala KA, et al. Human hydration indices: acute and longitudinal reference values. Int J Sport Nutr Exerc Metab. 2010;20(2): Armstrong LE, Soto JA, Hacker FT, Casa DJ, Kavouras SA, Maresh CM. Urinary indices during dehydration, exercise, and rehydration. Int J Sport Nutr. 1998;8(4): Kavouras SA. Assessing hydration status. Curr Opin Clin Nutr Metab Care. 2002;5(5): Cheuvront SN, Ely BR, Kenefick RW, Sawka MN. Biological variation and diagnostic accuracy of dehydration assessment markers. Am J Clin Nutr. 2010;92(3): doi: /ajcn Hoffman MD, Stuempfle KJ. Hydration strategies, weight change and performance in a 161 km ultramarathon. Res Sports Med Print. 2014;22(3): doi: / Shibasaki M, Wilson TE, Crandall CG. Neural control and mechanisms of eccrine sweating during heat stress and exercise. J Appl Physiol Bethesda Md ;100(5): doi: /japplphysiol
43 47. Noakes TD. Is drinking to thirst optimum? Ann Nutr Metab. 2010;57 Suppl 2:9-17. doi: / Millard-Stafford M, Wendland DM, O Dea NK, Norman TL. Thirst and hydration status in everyday life. Nutr Rev. 2012;70 Suppl 2:S doi: /j x. 49. Young AJ, Sawka MN, Epstein Y, Decristofano B, Pandolf KB. Cooling different body surfaces during upper and lower body exercise. J Appl Physiol Bethesda Md ;63(3): Maresh CM, Herrera-Soto JA, Armstrong LE, et al. Perceptual responses in the heat after brief intravenous versus oral rehydration. Med Sci Sports Exerc. 2001;33(6): Casa DJ, Maresh CM, Armstrong LE, et al. Intravenous versus oral rehydration during a brief period: responses to subsequent exercise in the heat. Med Sci Sports Exerc. 2000;32(1): McDermott BP, Casa DJ, Lee EC, et al. The influence of rehydration mode after exercise dehydration on cardiovascular function. J Strength Cond Res Natl Strength Cond Assoc. 2013;27(8): doi: /jsc.0b013e318295d Armstrong LE, Johnson EC, McKenzie AL, Ellis LA, Williamson KH. Ultraendurance cycling in a hot environment: thirst, fluid consumption, and water balance. J Strength Cond Res. 2015;29(4): doi: /jsc Armstrong LE, Casa DJ, Emmanuel H, et al. Nutritional, physiological, and perceptual responses during a summer ultraendurance cycling event. J Strength Cond Res. 2012;26(2): Armstrong LE, Johnson EC, Kunces LJ, et al. Drinking to thirst versus drinking ad libitum during road cycling. J Athl Train. 2014;49(5): doi: / Engell DB, Maller O, Sawka MN, Francesconi RP, Drolet L, Young AJ. Thirst and fluid intake following graded hypohydration levels in humans. Physiol Behav. 1987;40(2): Thompson DA, Campbell RG. Hunger in humans induced by 2-deoxy-D-glucose: glucoprivic control of taste preference and food intake. Science. 1977;198(4321): Mears SA, Watson P, Shirreffs SM. Thirst responses following high intensity intermittent exercise when access to ad libitum water intake was permitted, not permitted or delayed. Physiol Behav. 2016;157: doi: /j.physbeh Rolls BJ, Wood RJ, Rolls ET, Lind H, Lind W, Ledingham JG. Thirst following water deprivation in humans. Am J Physiol. 1980;239(5):R Sagawa S, Miki K, Tajima F, et al. Effect of dehydration on thirst and drinking during immersion in men. J Appl Physiol Bethesda Md ;72(1): Passe DH. Physiological and Psychological Determinants of Fluid Intake. In: Sports Drinks: Basic Science and Practical Aspects. CRC Press, LLC; 2000: Rolls BJ. Palatability and Fluid Intake. In: Fluid Replacement and Heat Stress. Washington, DC: National Academies Press; 1994:
44 63. Arai SR, Butzlaff A, Stotts NA, Puntillo KA. Quench the thirst: lessons from clinical thirst trials. Biol Res Nurs. 2014;16(4): doi: / Hollis JH, McKinley MJ, D Souza M, Kampe J, Oldfield BJ. The trajectory of sensory pathways from the lamina terminalis to the insular and cingulate cortex: a neuroanatomical framework for the generation of thirst. Am J Physiol Regul Integr Comp Physiol. 2008;294(4):R doi: /ajpregu Farrell MJ, Bowala TK, Gavrilescu M, et al. Cortical activation and lamina terminalis functional connectivity during thirst and drinking in humans. Am J Physiol Regul Integr Comp Physiol. 2011;301(3):R doi: /ajpregu Rowland NE. The vagus nerve and thirst. Physiol Behav. 2004;82(1): doi: /j.physbeh Santollo J, Daniels D. Control of fluid intake by estrogens in the female rat: role of the hypothalamus. Front Syst Neurosci. 2015;9:25. doi: /fnsys McKinley MJ, Johnson AK. The Physiological Regulation of Thirst and Fluid Intake. Physiology. 2004;19:1-6. doi: /nips Stachenfeld NS. Sodium ingestion, thirst and drinking during endurance exercise. Sports Sci Exch. 2014;27(122): Cheung SS, McGarr GW, Mallette MM, et al. Separate and combined effects of dehydration and thirst sensation on exercise performance in the heat. Scand J Med Sci Sports. 2015;25 Suppl 1: doi: /sms Johnson AK, Thunhorst RL. The neuroendocrinology of thirst and salt appetite: visceral sensory signals and mechanisms of central integration. Front Neuroendocrinol. 1997;18(3): doi: /frne Maresh CM, Gabaree-Boulant CL, Armstrong LE, et al. Effect of hydration status on thirst, drinking, and related hormonal responses during low-intensity exercise in the heat. J Appl Physiol Bethesda Md ;97(1): doi: /japplphysiol Phillips PA, Rolls BJ, Ledingham JG, Forsling ML, Morton JJ. Osmotic thirst and vasopressin release in humans: a double-blind crossover study. Am J Physiol. 1985;248(6 Pt 2):R Greenleaf JE. Problem: thirst, drinking behavior, and involuntary dehydration. Med Sci Sports Exerc. 1992;24(6): Robertson GL. Abnormalities of thirst regulation. Kidney Int. 1984;25(2): Vokes T. Water homeostasis. Annu Rev Nutr. 1987;7: doi: /annurev.nu Balanescu S, Kopp P, Gaskill MB, Morgenthaler NG, Schindler C, Rutishauser J. Correlation of plasma copeptin and vasopressin concentrations in hypo-, iso-, and hyperosmolar States. J Clin Endocrinol Metab. 2011;96(4): doi: /jc
45 78. Morgenthaler NG, Struck J, Alonso C, Bergmann A. Assay for the measurement of copeptin, a stable peptide derived from the precursor of vasopressin. Clin Chem. 2006;52(1): doi: /clinchem Morgenthaler NG, Struck J, Jochberger S, Dünser MW. Copeptin: clinical use of a new biomarker. Trends Endocrinol Metab TEM. 2008;19(2): doi: /j.tem Bolignano D, Cabassi A, Fiaccadori E, et al. Copeptin (CTproAVP), a new tool for understanding the role of vasopressin in pathophysiology. Clin Chem Lab Med. 2014;52(10): doi: /cclm Shirreffs SM, Maughan RJ. Water turnover and regulation of fluid balance. In: Sports Drinks: Basic Science and Practical Aspects. CRC Press, LLC; 2000: Takamata A, Mack GW, Gillen CM, Jozsi AC, Nadel ER. Osmoregulatory modulation of thermal sweating in humans: reflex effects of drinking. Am J Physiol. 1995;268(2 Pt 2):R Andersson B, Rundgren M. Thirst and Its Disorders. Annu Rev Med. 1982;33(1): doi: /annurev.me Arnaoutis G, Kavouras SA, Kotsis YP, Tsekouras YE, Makrillos M, Bardis CN. Ad libitum fluid intake does not prevent dehydration in suboptimally hydrated young soccer players during a training session of a summer camp. Int J Sport Nutr Exerc Metab. 2013;23(3): Kenefick RW, Hazzard MP, Mahood NV, Castellani JW. Thirst sensations and AVP responses at rest and during exercise-cold exposure. Med Sci Sports Exerc. 2004;36(9): Cleary MA, Toy MG, Lopez RM. Thermoregulatory, cardiovascular, and perceptual responses to intermittent cooling during exercise in a hot, humid outdoor environment. J Strength Cond Res Natl Strength Cond Assoc. 2014;28(3): doi: /jsc.0b013e3182a20f Mears SA, Shirreffs SM. Voluntary water intake during and following moderate exercise in the cold. Int J Sport Nutr Exerc Metab. 2014;24(1): doi: /ijsnem Maughan RJ, Shirreffs SM. Hydration and performance during Ramadan. J Sports Sci. 2012;30 Suppl 1:S doi: / Horie S, Tsutsui T, Miyazaki S. Effect of dilution of sports drink on water balance and beverage preference of heat-exposed steel workers. J UOEH. 2003;25(1): Wilk B, Timmons BW, Bar-Or O. Voluntary fluid intake, hydration status, and aerobic performance of adolescent athletes in the heat. Appl Physiol Nutr Metab Physiol Appliquée Nutr Métabolisme. 2010;35(6): doi: /h Beis LY, Wright-Whyte M, Fudge B, Noakes T, Pitsiladis YP. Drinking behaviors of elite male runners during marathon competition. Clin J Sport Med Off J Can Acad Sport Med. 2012;22(3): doi: /jsm.0b013e31824a55d Dion T, Savoie FA, Asselin A, Gariepy C, Goulet EDB. Half-marathon running performance is not improved by a rate of fluid intake above that dictated by thirst sensation in trained distance runners. Eur J Appl Physiol. 2013;113(12): doi: /s
46 93. Winger JM, Hoffman MD, Hew-Butler TD, et al. The effect of physiology and hydration beliefs on race behavior and postrace sodium in 161-km ultramarathon finishers. Int J Sports Physiol Perform. 2013;8(5): Volkert D. Nutrition beyond 65--amount of usual drinking fluid and motivation to drink are interrelated in community-living, independent elderly people. Z Für Gerontol Geriatr. 37(6): doi: /s [doi]. 95. Ali A, Gardiner R, Foskett A, Gant N. Fluid balance, thermoregulation and sprint and passing skill peformance in female soccer players. Scandanavian J Med Sci Sports. 2011;21(3): Jung AP, Dale RB, Bishop PA. Ambient-temperature beverages are consumed at a rate similar to chilled water in heat-exposed workers. J Occup Environ Hyg. 2007;4(1): doi: / Clapp AJ, Bishop PA, Walker JL. Fluid replacement preferences in heat-exposed workers. Am Ind Hyg Assoc J. 1999;60(6): doi: / Clapp AJ, Bishop PA, Smith JF, Mansfield ER. Effects of carbohydrate-electrolyte content of beverages on voluntary hydration in a simulated industrial environment. AIHAJ J Sci Occup Environ Health Saf. 2000;61(5): Passe DH, Horn M, Murray R. The effects of beverage carbonation on sensory responses and voluntary fluid intake following exercise. Int J Sport Nutr. 1997;7(4): Passe DH, Horn M, Murray R. Impact of beverage acceptability on fluid intake during exercise. Appetite. 2000;35(3): doi: /appe Peacock OJ, Thompson D, Stokes KA. Voluntary drinking behaviour, fluid balance and psychological affect when ingesting water or a carbohydrate-electrolyte solution during exercise. Appetite. 2012;58(1): doi: /j.appet Peacock OJ, Thompson D, Stokes KA. Impact of a carbohydrate-electrolyte drink on ingestive behaviour, affect and self-selected intensity during recreational exercise after 24-h fluid restriction. Appetite. 2013;60(1):5-12. doi: /j.appet Hickey MS, Costill DL, Trappe SW. Drinking behavior and exercise-thermal stress: role of drink carbonation. Int J Sport Nutr. 1994;4(1): Kurdak SS, Shirreffs SM, Maughan RJ, et al. Hydration and sweating responses to hot-weather football competition. Scand J Med Sci Sports. 2010;20 Suppl 3: doi: /j x Suzuki K, Hashimoto H, Oh T, et al. The effects of sports drink osmolality on fluid intake and immunoendocrine responses to cycling in hot conditions. J Nutr Sci Vitaminol (Tokyo). 2013;59(3): Wilmore JH, Morton AR, Gilbey HJ, Wood RJ. Role of taste preference on fluid intake during and after 90 min of running at 60% of VO2max in the heat. Med Sci Sports Exerc. 1998;30(4):
47 107. Mora-Rodriguez R, Hamouti N. Salt and fluid loading: effects on blood volume and exercise performance. Med Sport Sci. 2012;59: doi: / Allen S, Miller KC, Albrecht J, Garden-Robinson J, Blodgett-Salafia E. Ad libitum fluid intake and plasma responses after pickle juice, hypertonic saline, or deionized water ingestion. J Athl Train. 2013;48(6): doi: / Johannsen NM, Sullivan ZM, Warnke NR, Smiley-Oyen AL, King DS, Sharp RL. Effect of preexercise soup ingestion on water intake and fluid balance during exercise in the heat. Int J Sport Nutr Exerc Metab. 2013;23(3): Burdon CA, Johnson NA, Chapman PG, O Connor HT. Influence of beverage temperature on palatability and fluid ingestion during endurance exercise: a systematic review. Int J Sport Nutr Exerc Metab. 2012;22(3): Sandick BL, Engell DB, Maller O. Perception of drinking water temperature and effects for humans after exercise. Physiol Behav. 1984;32(5): Salata RA, Verbalis JG, Robinson AG. Cold water stimulation of oropharyngeal receptors in man inhibits release of vasopressin. J Clin Endocrinol Metab. 1987;65(3): doi: /jcem Brunstrom JM. The role of mouth state in the termination of drinking behavior in humans. Physiol Behav. 2000;68(4): Brunstrom JM, Macrae AW. Effects of temperature and volume on measures of mouth dryness, thirst and stomach fullness in males and females. Appetite. 1997;29(1): doi: /appe Obika LFO, Okpere SO, Ozoene JO, Amabebe E. The role of oropharnygeal receptors in thirst perception after dehydration and rehydration. Niger J Physiol Sci Off Publ Physiol Soc Niger. 2014;29(1): Puntillo K, Arai SR, Cooper BA, Stotts NA, Nelson JE. A randomized clinical trial of an intervention to relieve thirst and dry mouth in intensive care unit patients. Intensive Care Med. 2014;40(9): doi: /s z Koch KL. A noxious trio: nausea, gastric dysrhythmias and vasopressin. Neurogastroenterol Motil Off J Eur Gastrointest Motil Soc. 1997;9(3): Figaro MK, Mack GW. Regulation of fluid intake in dehydrated humans: role of oropharyngeal stimulation. Am J Physiol. 1997;272(6 Pt 2):R Convertino VA, Keil LC, Bernauer EM, Greenleaf JE. Plasma volume, osmolality, vasopressin, and renin activity during graded exercise in man. J Appl Physiol. 1981;50(1): Nose H, Takamata A, Mack GW, et al. Water and electrolyte balance in the vascular space during graded exercise in humans. J Appl Physiol Bethesda Md ;70(6):
48 121. Mears SA, Shirreffs SM. The effects of high-intensity intermittent exercise compared with continuous exercise on voluntary water ingestion. Int J Sport Nutr Exerc Metab. 2013;23(5): Ali A, Duizer L, Foster K, Grigor J, Wei W. Changes in sensory perception of sports drinks when consumed pre, during and post exercise. Physiol Behav. 2011;102(5): doi: /j.physbeh Greenleaf JE, Brock PJ, Keil LC, Morse JT. Drinking and water balance during exercise and heat acclimation. J Appl Physiol. 1983;54(2): Robertson GL. Vasopressin in osmotic regulation in man. Annu Rev Med. 1974;25: doi: /annurev.me
49 Chapter 2 RELATIONSHIP OF THIRST TO HYDRATION STATE DURING EXERCISE 41
50 Relationship of Thirst to Hydration State during Exercise ABSTRACT Purpose: To determine the relationship of thirst to hydration markers during exercise. Methods: Ten healthy, recreationally active males (Mean±SD; age: 22±3 years; height: 179±6 cm; body mass: 73.5±10.6 kg; body fat: 11.7±3.8%; VO 2max: 54.08±5.26 ml kg -1 min-1 ) completed four exercise trials in a randomized, counterbalanced order. Participants started two trials in a euhydrated state (EuD, EuR), and twotrials in a hypohydrated state (HyD, HyR). Fluid was replaced to replace loss calculated from sweat in the EuR trial only. Fluid was not replaced in the EuD, HyD, and HyR trials. Exercise consisted of intermittent, moderate intensity aerobic treadmill exercise in cycles of walking, running, and rest. Thirst perception was measured using a Likert scale (Thirst) pre-exercise and immediately post-exercise (IPE). Nude body mass was assessed pre-exercise and IPE. A blood draw was performed pre-exercise and IPE. Results: There was a significant relationship between Thirst level < 4 and pre-exercise body mass change (R²=0.286, p=0.006) and percent change (R²=0.287, p=0.006). Immediately post-exercise, there was a significant relationship between Thirst and body mass change (p<0.008) and percent change (p<0.009), regardless of Thirst level. Thirst level 4 was significantly related to IPE plasma osmolality (R²=0.142, p=0.037). There was no significant relationship between Thirst and Copeptin pre-exercise (p>0.263) or IPE (p>0.272). There was a significant relationship between change in Thirst level < 4 and IPE plasma osmolality change (R²=0.317, p=0.010), Copeptin change (R²=0.212, p=0.041), and nude body mass change (R²=0.325, p=0,009) and percent change (R²=0.356, p=0.006). Conclusion: There appears to be a relationship between a low level of thirst and hydration before exercise, and a higher level of thirst and hydration after exercise. There is also a relationship between change in thirst and change in hydration state. Word count: 275/275 42
51 INTRODUCTION Greater than 2% body mass loss during exercise results in performance decrements related to cognition, 1,2 thermoregulation, 3 5 cardiovascular function, 6,7 and neuromuscular control and detailed skill performance 8,9 Athletes and clinicians should limit dehydration during exercise as a method of performance and safety enhancement. Fluid recommendations by the American College of Sports Medicine and National Athletic Trainers Association recommend fluid replacement based on individual factors which influence water loss during exercise. 10,11 These factors include sweat rate, exercise intensity, environment, and equipment or clothing worn during exercise. There are currently no reasonable methods for assessing hydration status in real-time during exercise, 12 and given the previously listed factors, determination of fluid needs during exercise can be difficult to determine. Thirst presents an interesting potential option to the hydration assessment problem, as thirst is a psychological sensation linked to changes in physiology, specifically related to hydration state. During rest, thirst perception has been extensively linked to blood osmolality, and release of hormone mediators of body fluid regulation, such as arginine vasopressin (AVP) or copeptin. 16 In classic studies of post-exercise recovery, thirst perception appears to be responsive to differing hydration states. 17,18 Access during exercise has mixed results, where free access during exercise may be adequate 19 or inadequate. 20,21 Thus, drinking to thirst is often a recommended drinking behavior during exercise. Studies of non-prescribed drinking in endurance exercise indicates that performance is not decreased by thirst-driven drinking in comparison to prescribed drinking, 22 even when body mass was not maintained within 2% loss. 23 However, this can be misleading, as often it is unclear if prescribed drinking is based on appropriate recommendations, or if drinking in non-prescribed scenarios is truly dictated by thirst in the absence of other external stimuli. Recent research on fluid intake following moderate intensity exercise described that ad libitum fluid intake during and following exercise was sufficient to keep body mass within 2% loss, in both warm and cold environments. 24 Additionally, delayed consumption of fluid did not change ratings of thirst, but 43
52 did sustain them for a longer period, and resulted in consumption of a similar amount of fluid as when water was immediately available following exercise. 19 Thirst during and following high intensity activity appears to be unrelated to changes in blood osmolality, 19 leaving the impression that other factors have influence on thirst perception during exercise. Therefore, the purpose of this study is to determine if the relationship of hydration differs between a low and moderate-high level of thirst during exercise. We hypothesize that a moderate-high level of thirst will have a relationship with post-exercise hydration state, and a change in thirst will have a relationship to change in hydration state following exercise. METHODS Participants Ten recreationally active males volunteered to participate in this study, which was approved by the Institutional Review Board at the University of Connecticut. Prior to obtaining written informed consent (Appendix D), participants were informed of study procedures and possible risks associated with participation in this study. Participants were included based on the following inclusion criteria: male, aged 18-35; reported being recreationally active defined as >30 minutes of exercise on 4-5 days per week; and VO2max assessed as >45 ml kg -1 min-1. Participants were excluded based on the following exclusion criteria: fever or current illness at the time of testing; history of cardiovascular, metabolic, or respiratory disease; current musculoskeletal injury that limits physical activity; or exertional heat illness in the past 3 years. Satisfaction of these criteria was determined from a medical history questionnaire (Appendix E). Experimental Design and Procedures This lab study followed a randomized, counterbalanced, crossover design. Study was conducted in the Human Performance Laboratory at the University of Connecticut, in an 44
53 environmental chamber (Model 200, Minus Eleven, Inc., Malden MA) set at an ambient temperature at 35.2±1.1 C and 31.4±6.3% relative humidity. Data collection occurred between February - May Each participant visited the laboratory for (Figure 2.1): 1 familiarization visit, 3 baseline body mass visits, and 4 exercise trials. Familiarization Visit Baseline and familiarization visits occurred prior to the first exercise trial to familiarize participants to study procedures, and collect normative data on participant characteristics. Participants were instructed to arrive euhydrated to the laboratory. Upon arrival to the laboratory, height was measured. Body fat was assessed via Lange skinfold calipers (Beta Technology, Santa Cruz, CA) using the 7-site method described by the American College of Sports Medicine. 25 Participants performed a maximal oxygen uptake (VO2max) test following a modified Bruce protocol 26 on a motorized treadmill (Commercial 2950, NordicTrack, Logan, UT) in a thermoneutral environment to establish appropriate aerobic intensity during the exercise trials and assess satisfaction of inclusion criterion. Exercise intensities were derived from the maximum velocity in the VO2max test. Following completion of the VO2max test and a brief rest period, sweat rate and electrolyte content was assessed to determine fluid replacement volumes during exercise. The sweat rate assessment was performed in the environmental chamber at approximately 35 C, approximately 30% relative humidity. Prior to entering the environmental chamber, nude body mass was measured (Defender 5000, Ohaus, Parsippany, NJ). Participants entered the environmental chamber and rested for 15 minutes. During this time, participants were familiarized with the Thirst scale (Appendix A) to be used throughout the study, as well as a diet log (Appendix C). 45
54 Participants performed an exercise protocol which was the same as one cycle of exercise completed during an exercise trial to obtain an accurate sweat rate. Exercise consisted of 8- minutes at 40% VO2max, 8 minutes at 60% VO2max, and 8-minutes at 40% VO2max on a motorized treadmill, followed by 6 minutes of rest. After exercise, participants exited the environmental chamber, wiped away any remaining sweat, and provided a final nude body mass. The difference between pre-test nude body mass and post-test nude body mass was used to calculate sweat rate for 30 minutes. Baseline Visits To gain insight into normative body mass, a 3-day baseline body mass occurred on three consecutive days following the familiarization visit. Prior to each baseline body mass session, participants were instructed to eat according with their normal diet, hydrate well, avoid alcohol, and record everything consumed on a diet log. The diet log was entered into a food processing program to determine macronutrients, electrolytes and moisture (Nutritionist Pro, version 5, Axxya Systems, LLC, Redmond, WA). They were also instructed to collect all urine in a provided urine jug for 24 hours, and provide a small urine sample in a clean urine cup prior to bedtime on the night prior to each visit. In the morning of each day of the 3-day period, participants arrived at the laboratory in a fasted state, returned the urine jug, bedtime urine cup, and diet log from the previous 24 hours. Urine was analyzed for urine specific gravity (Usg; TS400, Reichert Technologies, Buffalo, NY), osmolality (UOsm; Model 3320, Advanced Instruments freezing-point depression Osmometer, Norwood, MA), color, hr sample and bedtime sample. Twenty-four hour urine volume was measured by combining bedtime and 24- hour samples prior to weighing (Ranger 3000, Ohaus, Parsippany, NJ). Nude body mass was recorded. This process was repeated for each participant for three consecutive days. Three-day 46
55 baseline nude body mass was averaged, and used as a comparison to all nude body mass measures for exercise trials to describe change and percent change. These same urine collection and diet log completion procedures described here were completed the day prior to each exercise trial as well. Exercise Trials Each exercise trial was scheduled with no less than 5 days between exercise trials, and participants were asked to maintain normal diet and exercise routines throughout the study. A general timeline for the study, and basic description of trial procedures is depicted in Figure 2.1. Trial conditions were a crossover design, and randomized and counter balanced (Table 2.1). Participants inserted a rectal probe to monitor body temperature (4600 series, Measurement Specialties, Hampton, VA) and a heart rate strap to monitor heart rate (digital 2.4 Timex heart rate monitor, Timex Group USA, Middlebury, CT) to determine safety cut offs, as described later, for the duration of the exercise trial. Participants entered the environmental chamber (35.21±1.09 C, 31.39±6.32% relative humidity) and sat for a 15-minute equilibration period, after which exercise commenced. Exercise consisted of up to six, 30-minute cycles (24-minutes total of treadmill exercise: 16 minutes at 40% VO2max, 8 minutes at 60% VO2max at 2% incline, and 6 minutes of rest), equaling up to 3 hours of exercise performance. For the EuR trial, where participants minimized fluid loss, participants were given a volume of water to consume matching sweat rate per 30- minutes as assessed in the familiarization trial. For conditions needed as part of a larger study, three trials (EuD, HyR, HyD), participants progressively dehydrated by fluid restriction for the duration of exercise. 47
56 Exercise was terminated at one of the following criteria: rectal temperature reaching C, participant requested, altered or uneven gait, heart rate > age-predicted maximum heart rate (220-age) for 5 minutes, 3 hours of exercise completed, or 5% body mass loss. At the termination of exercise, perceptual, hydration, and blood measures were taken, and a 1-hour passively seated recovery period commenced. Hydration Assessment For 24 hours prior to each exercise trial, participants collected urine in a clean urine jug, and completed a diet log as described in baseline body mass visits. Urine was analyzed in the same fashion as described in the baseline visit section. For euhydrated trials (EuR and EuD), participants were asked to consume an additional 500 ml of water before and 500 ml of water after sleep the night before the exercise trials to ensure appropriate hydration status. For hypohydrated trials (HyR and HyD), participants underwent a 22-hour fluid restriction to attain a hypohydrated state, including instruction to avoid high fluid containing foods (such as soup, yogurt, or large amounts of raw fruits or vegetables) and all beverages. Participants were asked to avoid alcohol, have similar dietary intake between lab visits, with the exception of fluid and high fluid containing foods, and recorded intake on a diet log for 24 hours prior to the scheduled lab visit. Operational definitions for euhydrated and hypohydrated states can be found in Table 2.2. For euhydrated trials, if euhydration criteria were not met, participants were rescheduled and given further instruction on appropriate fluid consumption to establish a euhydrated state prior to the rescheduled trial. Body mass, urine analysis, and blood analysis were used to assess hydration throughout the study. 48
57 Nude body mass was assessed before exercise (PRE) and immediately following a onehour recovery period. To determine immediately post-exercise (IPE) nude body mass, minimally clothed body mass immediately following exercise was described in reference to urine excreted and mass of clothing. Change in nude body mass is described as the difference from average baseline nude body mass. Thirst Perception Thirst perception was collected using two indices. A measure of thirst (Thirst) was collected on a one-point anchored scale from 1-9, where 1 indicated not thirsty at all, and 9 indicated very, very thirsty PRE and IPE (Appendix A). 20,28,29 Blood Analysis During each exercise trial, a blood sample was drawn PRE after a 15 minute seated rest, and IPE. At each of these time points, the participant was seated and 7 ml blood was drawn from an antecubital vein using an aseptic technique by a researcher trained to perform blood draws. Plasma osmolality (POsm) and plasma volume change were analyzed immediately from a lithium heparin-treated tube, then the K2 EDTA-treated tube sample was prepared and stored for later analysis of copeptin. Both tubes were inverted 8-10 times immediately following the blood draw. Hematocrit (Hct), hemoglobin (Hb), and POsm were assessed immediately. Hematocrit and Hb were used to assess change in plasma volume over time using the equation from Dill and Costill (1974). 30 Hct was analyzed from lithium heparin-treated whole blood using nonheparinized microcapillary tubes, and centrifuged at room temperature and 10,000 rpm for 5 minutes. Hb was assessed using the HemoCue Hb 201+ (HemoCue America, Brea, CA). The lithium heparin-treated blood collection tube was centrifuged at room temperature and 5,000 rpm 49
58 for 15 minutes to attain plasma. Plasma osmolality was assessed using the freezing point depression method. Samples were analyzed in duplicate (or more in cases of > 3 mosm/kg difference in readings) and averaged to determine plasma osmolality. To prepare for copeptin analysis, 1.5 ml of whole blood collected in K2 EDTA-treated collection tubes and 78 µl of aprotinin (From Bovine Lung, approx.. 10,000 KIU/mL; Fisher Scientific, Fair Lawn, NJ, USA), at a concentration of 0.6TIU/ml of blood were added to a centrifuge tube, then gently rocked 4-5 times to ensure appropriate mixing. Blood was then centrifuged at 4 C and 1,600g for 15 minutes. Plasma was then aliquoted into microcentrifuge tubes and stored at -80 C for up to 3 months for later analysis. Frozen plasma samples containing K2 EDTA and aprotinin were transferred to the diagnostic laboratory. For measurement of copeptin, plasma was used in an extraction-free competitive enzyme immunoassay (EK , Phoenix Peptides, Burlingame, CA). All samples were analyzed in duplicate. Description of assay procedures and standard curve is found in Appendix F. The minimum detectable concentration was 0.12 ng/ml, with a linear range of ng/ml, and an upper limit of 100 ng/ml. Absorbance optical density was read at 450nm on a microplate reader (VersaMax, Molecular Devices, Sunnyvale, CA) using SoftMax Pro software (version 5.3, Molecular Devices, Sunnyvale, CA). The standard curve was used to interpolate concentration from absorbance (GraphPad, Prism, version 7 for Windows, 2016). Intra-assay CV% was calculated to be less than 8.7%, and the inter-assay CV% was calculated as 7.9%. Statistical Analysis Data were analyzed for the following exercise time points: PRE and IPE. Baseline variables to establish normative data were analyzed using a one-way repeated measures analysis 50
59 of variance (RM-ANOVA) to determine if differences between baseline days were present for hydration variables. Piecewise regression was performed to assess the relationship of hydration and thirst variables to adjust for non-linearity in the model. A breakpoint of thirst level 4 was used to partition the data into low and moderate-high segments. Estimates of slope were calculated for each segment. For all analyses, a priori alpha level was set at p 0.05 RESULTS Sample Characteristics Participant characteristics were as follows: Mean±SD: age: 22±3 years; height: 179±6 cm; body mass: 73.53±10.62 kg; body fat: 11.7±3.8%; VO2max: 54.08±5.26 ml kg -1 min-1. Sweat rate, as determined in the familiarization trial, was 0.90±0.87 L hr -1 during exercise. Sweat electrolytes as determined from whole body washdown were as follows: sodium (3.7±1.2 meq L -1 ), potassium (0.6±0.2 meq L -1 ), and chloride (2.6±1.6 meq L -1 ). There were no differences in nude body mass between baseline visits (F(2, 29)=0.000, p=1.000). Hydration status on baseline days derived from 24-hour urine variables was considered euhydrated on all three days based on the operational definitions in Table 2.2, and was not different between baseline visits (Table 2.3), therefore, baseline data were pooled for all following analyses. Baseline nutrition variables analyzed by one-way ANOVA (nutrition component by day) did not differ across the three day baseline period (p>0.05). Thirst and Hydration during Exercise Regressions of thirst and pre-exercise hydration state are presented with scatterplots in figure 2.2. Regressions of thirst and post-exercise hydration state are presented with scatterplots in figure 2.3. Regressions of change in thirst and post-exercise hydration state are presented with 51
60 scatterplots in figure 2.4. Several regressions described a negative y-intercept, and will be further investigated. Regressions of thirst and pre-exercise urine variables were performed, however no significant regression was revealed. DISCUSSION The purpose of the present study was to describe the relationship of thirst to measures of hydration during exercise. We hypothesized that thirst will have a relationship with hydration before and after exercise. To test this hypothesis, we used a crossover design with repeated measures of hydration and perceptual variables before, during, and following exercise. Major findings in the present study were: 1) There appears to be a relationship between a low level of thirst and hydration before exercise, 2) there is a relationship between a higher level of thirst and hydration after exercise, and 3) there is a relationship between change in thirst and change in hydration state. These findings are in contrast with previous research which described an extended period of exercise-induced dehydration the day prior to the experimental trial as having such large effects on hormonal and perceptual markers that the exercise responses were indistinguishable. 20 However, the present study used a passive hypohydration period, which resulted in both body mass and hematologic, but not urinary, differences pre-trial. The change in body mass achieved in the previous study (~3% body mass loss) 20 was not as large in magnitude, and thus may have exhibited blunted responses as compared to the present study (~5% body mass loss). With this, we cannot suggest that the change in thirst was related to change in hydration state unrelated to exercise. The impact of exercise on thirst has not been well described. In the present study, we attempted to characterize this response by limiting dehydration due to sweating in exercise by 52
61 replacing fluid loss. One exercise trial was constructed to provide no change in hydration state (EuR), which was successfully achieved. We found no change among any hydration measures or thirst perception in this trial. However, we recognize that the method by which we limited dehydration inherently impacts thirst by allowing oral fluid consumption and potentially inciting oropharyngeal responses. 31,32 Although thirst changes during rest with saline-induced osmotic shifts, 33 future research should examine infusion of fluid rather than oral consumption to determine the impact of exercise on thirst perception. The piecewise regression of thirst and hydration variables in the present study showed different slopes for low and moderate-high levels of thirst (e.g. PRE nude body mass % change: low thirst: y= x; moderate-high thirst: y= x). Previous literature has not attempted to distinguish a difference between a low and moderate-high level of thirst, and the relationship to hydration status. This describes that the perception of thirst is probably not linearly related to hydration at both a low and high level of thirst. Rather, as described in the present study, a moderate-high level of thirst was related to a higher plasma osmolality (R 2 =0.142) and percent body mass change (R 2 =0.378) after exercise. In the present study, a low level of change in thirst was related to a small change in hydration variables, but a moderate-high change in thirst was not related to a moderate-high level change in hydration variables. A low (< 4 points) change in thirst perception was related to percent body mass loss (R 2 =0.356), change in plasma osmolality (R 2 =0.317), and change in copeptin concentration (R 2 =0.212) after exercise. The interpretation of this relationship is unclear, but supports the concept that thirst may not have a linear relationship with hydration or change in hydration state during exercise. 53
62 Plasma volume change was not related to thirst at any time point. However, the significant relationship between plasma osmolality and a moderate-high level of thirst postexercise supports the theory that thirst is related to an osmotic shift. 17 In the present study a level of thirst 4 and greater had a significant relationship with post-exercise plasma osmolality (p=0.037). A plasma osmolality of 295 mosm/kg has been described as the threshold for thirst. 34 The results of the present study suggest that this threshold plasma osmolality may be related to a moderate-high level of thirst, but that some lower level of thirst may exist below that threshold. In the present study, a low level of thirst was present with a lower plasma osmolality, but did not have a significant relationship (p=0.091) after exercise. These results suggest that thirst of a moderate-high level (e.g. 4 on the 1-9 Likert scale) may be a better indicator of hydration state than thirst of a low level. Thirst perception has been described in reference to changes in plasma osmolality causing release of AVP. Copeptin has been used to describe AVP in previous literature, as it is more stable and easier to analyze than AVP However, a relationship between copeptin and thirst has not been described in previous literature. In the present study, copeptin was not related to thirst perception before exercise (p>0.263) or after exercise (p>0.272), but a change in thirst was related to a change in copeptin. The copeptin concentrations observed in the present study are far less than those observed following an ultramarathon, 16 but a lack of research in lower intensity exercise prevents further comparison. Future research should investigate the relationship between thirst and copeptin during exercise. 54
63 CONCLUSIONS Thirst perception has a relationship with hydration state before and after exercise. However, the relationship appears stronger at a low level of thirst before exercise, and a moderate-high level of thirst after exercise. Therefore, moderate-high level of thirst may indicate some level of dehydration following exercise. A low-level change in thirst was related to change in hydration state, but the meaning of this relationship is unclear. Also, copeptin did not have a significant relationship to thirst, further investigation of this preprohormone in relation to thirst and exercise should occur. REFERENCES 1. Cian C, Barraud PA, Melin B, Raphel C. Effects of fluid ingestion on cognitive function after heat stress or exercise-induced dehydration. Int J Psychophysiol Off J Int Organ Psychophysiol. 2001;42(3): Adam GE, Carter R, Cheuvront SN, et al. Hydration effects on cognitive performance during military tasks in temperate and cold environments. Physiol Behav. 2008;93(4-5): doi: /j.physbeh Sawka MN, Young AJ, Francesconi RP, Muza SR, Pandolf KB. Thermoregulatory and blood responses during exercise at graded hypohydration levels. J Appl Physiol Bethesda Md ;59(5): Montain SJ, Latzka WA, Sawka MN. Control of thermoregulatory sweating is altered by hydration level and exercise intensity. J Appl Physiol. 1995;79(5): Buono MJ, Wall AJ. Effect of hypohydration on core temperature during exercise in temperate and hot environments. Pflüg Arch Eur J Physiol. 2000;440(3): González-Alonso J, Mora-Rodríguez R, Below PR, Coyle EF. Dehydration markedly impairs cardiovascular function in hyperthermic endurance athletes during exercise. J Appl Physiol Bethesda Md ;82(4): González-Alonso J, Calbet JA, Nielsen B. Muscle blood flow is reduced with dehydration during prolonged exercise in humans. J Physiol. 1998;513 ( Pt 3):
64 8. Distefano LJ, Casa DJ, Vansumeren MM, et al. Hypohydration and hyperthermia impair neuromuscular control after exercise. Med Sci Sports Exerc. 2013;45(6): doi: /mss.0b013e b Baker LB, Dougherty KA, Chow M, Kenney WL. Progressive dehydration causes a progressive decline in basketball skill performance. Med Sci Sports Exerc. 2007;39(7): doi: /mss.0b013e b Sawka MN, Burke LM, Eichner R, Maughan RJ, Montain SJ, Stachenfeld NS. American College of Sports Medicine position stand: exercise and fluid replacement. Med Sci Sports Exerc. 2007;39(2): Casa DJ, Armstrong LE, Hillman SK, et al. National Athletic Trainers Association position statement: fluid replacement for athletes. J Athl Train. 2000;35(2): Armstrong LE. Assessing hydration status: the elusive gold standard. J Am Coll Nutr. 2007;26(5 Suppl):575S-584S. 13. Robertson GL. Abnormalities of thirst regulation. Kidney Int. 1984;25(2): Passe DH. Physiological and Psychological Determinants of Fluid Intake. In: Sports Drinks: Basic Science and Practical Aspects. CRC Press, LLC; 2000: Stachenfeld NS. Sodium ingestion, thirst and drinking during endurance exercise. Sports Sci Exch. 2014;27(122): Hew-Butler T, Hoffman MD, Stuempfle KJ, Rogers IR, Morgenthaler NG, Verbalis JG. Changes in copeptin and bioactive vasopressin in runners with and without hyponatremia. Clin J Sport Med Off J Can Acad Sport Med. 2011;21(3): doi: /jsm.0b013e31821a62c Engell DB, Maller O, Sawka MN, Francesconi RP, Drolet L, Young AJ. Thirst and fluid intake following graded hypohydration levels in humans. Physiol Behav. 1987;40(2): Greenleaf JE. Problem: thirst, drinking behavior, and involuntary dehydration. Med Sci Sports Exerc. 1992;24(6): Mears SA, Watson P, Shirreffs SM. Thirst responses following high intensity intermittent exercise when access to ad libitum water intake was permitted, not permitted or delayed. Physiol Behav. 2016;157: doi: /j.physbeh Maresh CM, Gabaree-Boulant CL, Armstrong LE, et al. Effect of hydration status on thirst, drinking, and related hormonal responses during low-intensity exercise in the heat. J Appl Physiol Bethesda Md ;97(1): doi: /japplphysiol Arnaoutis G, Kavouras SA, Kotsis YP, Tsekouras YE, Makrillos M, Bardis CN. Ad libitum fluid intake does not prevent dehydration in suboptimally hydrated young soccer 56
65 players during a training session of a summer camp. Int J Sport Nutr Exerc Metab. 2013;23(3): Dion T, Savoie FA, Asselin A, Gariepy C, Goulet EDB. Half-marathon running performance is not improved by a rate of fluid intake above that dictated by thirst sensation in trained distance runners. Eur J Appl Physiol. 2013;113(12): doi: /s Beis LY, Wright-Whyte M, Fudge B, Noakes T, Pitsiladis YP. Drinking behaviors of elite male runners during marathon competition. Clin J Sport Med Off J Can Acad Sport Med. 2012;22(3): doi: /jsm.0b013e31824a55d Mears SA, Shirreffs SM. Voluntary water intake during and following moderate exercise in the cold. Int J Sport Nutr Exerc Metab. 2014;24(1): doi: /ijsnem Pescatello LS, Arena R, Riebe D, Thompson PD. ACSM s Guidelines for Exercise Testing and Prescription. Ninth. Lippincott Williams & Wilkins; Balady GJ, Arena R, Sietsema K, et al. Clinician s Guide to cardiopulmonary exercise testing in adults: a scientific statement from the American Heart Association. Circulation. 2010;122(2): doi: /cir.0b013e3181e52e Armstrong LE, Maresh CM, Castellani JW, et al. Urinary indices of hydration status. Int J Sports Nutr. 1994;4: Riebe D, Maresh CM, Armstrong LE, et al. Effects of oral and intravenous rehydration on ratings of perceived exertion and thirst. Med Sci Sports Exerc. 1997;29(1): Maresh CM, Herrera-Soto JA, Armstrong LE, et al. Perceptual responses in the heat after brief intravenous versus oral rehydration. Med Sci Sports Exerc. 2001;33(6): Dill DB, Costill DL. Calculation of percentage changes in volumes of blood, plasma, and red cells in dehydration. J Appl Physiol. 1974;37(2): Figaro MK, Mack GW. Regulation of fluid intake in dehydrated humans: role of oropharyngeal stimulation. Am J Physiol. 1997;272(6 Pt 2):R Puntillo K, Arai SR, Cooper BA, Stotts NA, Nelson JE. A randomized clinical trial of an intervention to relieve thirst and dry mouth in intensive care unit patients. Intensive Care Med. 2014;40(9): doi: /s z. 33. Phillips PA, Rolls BJ, Ledingham JG, Forsling ML, Morton JJ. Osmotic thirst and vasopressin release in humans: a double-blind crossover study. Am J Physiol. 1985;248(6 Pt 2):R Vokes T. Water homeostasis. Annu Rev Nutr. 1987;7: doi: /annurev.nu
66 35. Balanescu S, Kopp P, Gaskill MB, Morgenthaler NG, Schindler C, Rutishauser J. Correlation of plasma copeptin and vasopressin concentrations in hypo-, iso-, and hyperosmolar States. J Clin Endocrinol Metab. 2011;96(4): doi: /jc Bolignano D, Cabassi A, Fiaccadori E, et al. Copeptin (CTproAVP), a new tool for understanding the role of vasopressin in pathophysiology. Clin Chem Lab Med. 2014;52(10): doi: /cclm Morgenthaler NG, Struck J, Jochberger S, Dünser MW. Copeptin: clinical use of a new biomarker. Trends Endocrinol Metab TEM. 2008;19(2): doi: /j.tem TABLES AND FIGURES Trial Acronym Pre-Exercise Hydration State Exercise Condition EuR Euhydrated Fluid intake = sweat rate EuD Euhydrated fluid intake HyR Hypohydrated fluid intake HyD Hypohydrated fluid intake Table 2.1. Description of trial hydration conditions. The trial description in this figure is used to denote each trial from here forward. Fluid intake during exercise was in accordance with sweat rate, and only occurred in the EuR trial. Euhydration Hypohydration 24-hr Usg Table 2.2. Operational definitions of pre-trial hydration states. 24-hr UOsm 500 mosm/kg > 500 mosm/kg Fluid consumption Consumed 1 L overnight Restricted for 22 hours % nude body mass loss 1% ~ 1% Note: % nude body mass loss is defined as difference of pre-exercise nude body mass from baseline average nude body mass. UOsm, urine osmolality; Usg, urine specific gravity. 58
67 Table 2.3. Urine hydration measures from the three-day baseline. Bedtime 24-hour UOsm (mosm/kg) Usg Color UOsm (mosm/kg) Usg Color Volume (L) Mean±SD 689± ± ±1 513± ± ±1 2.23± %CI 584, , , 5 435, , , , 2.61 p-value Note: Each measure was averaged to determine three-day value. Data are represented as bedtime and 24- hour samples. For 24-hour sample, bedtime sample was analyzed, then added to the 24-hour collection for analysis. UOsm, urine osmolality; Usg, urine specific gravity 59
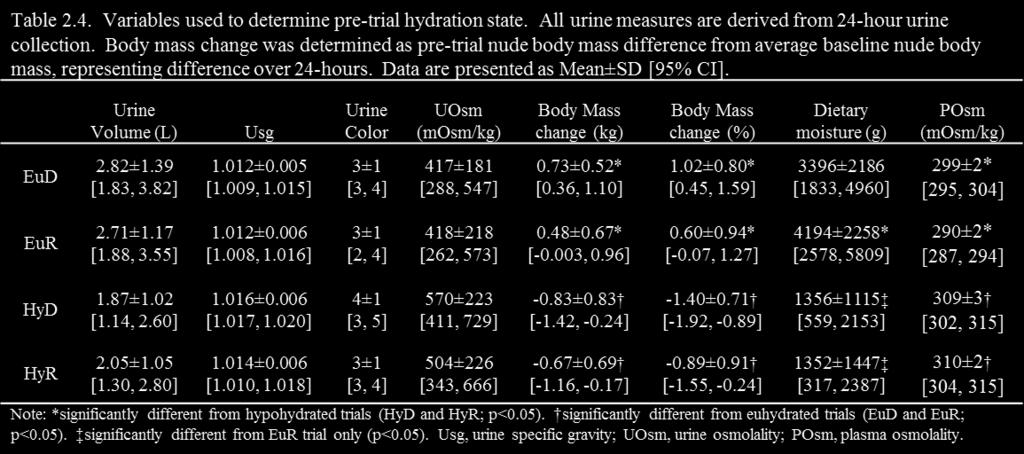
68 60
69 Figure 2.1. Timeline of laboratory testing and description of basic study procedures. Familiarization trials could have been separated from 3-day baseline visits for up to two weeks. Three-day baseline occurred over three consecutive days where measurements were taken in the morning at approximately the same time each day. Exercise trials were separated by approximately 7 days, but no less than 5 days. Exercise trial order refers to hydration state, presented in Table
 nude body mass change (kg), B)")

70 Figure 2.2. Scatterplots of pre-trial thirst and hydration variables: A) nude body mass change (kg), B) plasma osmolality (mosm/kg), C) nude body mass change (%), and D) plasma copeptin (ng/ml). The dotted line represents the point of separation between regressions with thirst level less than 4, and thirst level 4 and greater. The slope equation and ANOVA table is presented for each regression. 62
 nude body mass change (kg), B) plasma osmolality")

71 Figure 2.3. Scatterplots of IPE thirst and hydration variables: A) nude body mass change (kg), B) plasma osmolality (mosm/kg), C) plasma copeptin (ng/ml), D) nude body mass change (%), and E) plasma volume change (%). The dotted line represents the point of separation between regressions with thirst level less than 4, and thirst level 4 and greater. The slope equation and ANOVA table is presented for each regression. 63
 nude body mass change (kg), B) plasma osmolality (mosm/kg), C) plasma copeptin (ng/ml), D) nude body mass change (%), and E) plasma")
72 Figure 2.4. Scatterplots of change in thirst and IPE hydration variables: A) nude body mass change (kg), B) plasma osmolality (mosm/kg), C) plasma copeptin (ng/ml), D) nude body mass change (%), and E) plasma volume change (%). The dotted line represents the point of separation between regressions with thirst level less than 4, and thirst level 4 and greater. The slope equation and ANOVA table is presented for each regression. 64
73 Chapter 3 RESPONSE OF THIRST PERCEPTION TO DIFFERENT FLUID BOLUSES FOLLOWING EXERCISE 65
74 Response of Thirst Perception to Different Fluid Boluses Following Exercise Abstract: Thirst decreases in response to fluid consumption, however the impact of fluid volume on thirst is unknown. Purpose: To investigate the change in thirst perception impact of volume of fluid consumed following fluid intake after exercise. Methods: Eleven recreationally-active males (age: 22±3yr; height: 178±6cm; mass: 73.43±10.44kg; VO2max: 54.3±5.4 ml kg -1 min-1 ) completed four trials of 180 minutes of moderate-intensity exercise. For two trials, participants began euhydrated (EuR, EuD), and two were hypohydrated (HyR, HyD). During exercise fluid was replaced to match sweat rate (EuR only). Following exercise, a 60-minute recovery period commenced. In two trials (EuR, HyR), participants were split into groups which received fluid to match either Small (20%) or Large (80%) percent of body mass loss, but consumption was not required. Thirst perception was recorded every 10 minutes. Results: Participants began recovery with -0.2±0.9% (EuR) and 4.2±0.8% (HyR) body mass loss. Thirst remained low without change in the EuR trial. Thirst decreased following fluid consumption in both groups in the HyR trial, but was non-significant (p=0.209) and increased at 30 minutes in the Small group. Thirst in the Large group decreased over time (p<0.001), and remained low despite fluid consumption to replace only 2.66±0.69% of nude body mass (p 0.001), although they were given enough to replace 3.36±0.57%. Conclusions: Small fluid volumes will decrease thirst short-term, but a large volume will decrease thirst independent of amount of fluid loss replaced. Disparity between thirst perception and replaced fluid loss indicates potential for long-term hypohydration in the absence of a fluid replacement plan. Key words: rehydration, involuntary dehydration, hypohydration, copeptin Abstract Word Count: 250/250 66
75 INTRODUCTION Rehydration following an exercise bout is a commonly debated issue in for physically active individuals. Incomplete rehydration following activity is impactful in two ways: leading to short-term hypohydration for the start of a subsequent bout of exercise, or leading to chronic, long term hypohydration. In a free living population, daily fluid consumption can have a large disparity between physiological need and desire to consume fluid. It has been reported that a majority of the population drinks less than 1 L/day, 1 leading to chronic hypohydration and elevation of arginine vasopressin (AVP) and copeptin, which has recently been linked to chronic disease progression in the long term (Guelinckx, in press), and performance and safety decrement in the short term. 2 7 Several populations of physically active individuals are at risk of losing body mass due to thermoregulatory sweating during periods of activity. Heat-exposed workers reportedly consumed chilled and ambient temperature beverages at approximately the same rate ad libitum during exercise. However, these workers chose to only consume enough fluid to leave them at approximately 1% body mass loss throughout the day. This is corroborated by evidence of American football players and youth soccer players which described sustained and progressive fluid loss over days of exercise in American football players which was not addressed by ad libitum drinking. 8,9 This phenomenon has been termed involuntary dehydration. 10,11 Thirst is one of the most basic bio-psychological factors, and one of few which begins as a perception which leads to behavior, such as drinking. 12 The sensation of thirst leads a human to be more cognizant of factors related to drinking fluids. But, it is not known if thirst has the ability to adapt to real-time change in hydration status by adjusting expectations and the seeking out of fluids for consumption. 67
76 Oropharyngeal and gastrointestinal factors have been investigated in the literature, and are found to be influencers of thirst perception among other factors Rehydration via indirect (intravenous) and direct (oral consumption) has shown to provide some impact on thirst in comparison to control, but direct consumption has a clear difference in satiety of thirst. 2 Additionally, mouth wetting without fluid consumption provides significant impetus to decrease thirst. 16,18,19 Studies of rehydration procedure following dehydrating exercise have determined that a combined approach of rapid rehydration and oral consumption best provided an expedient return of cardiovascular function following exercise. 20 It was also determined that ad libitum drinking did not provide adequate stimulus to completely replace body mass loss, leaving participants still greater than 2% loss after 60 minutes of unimpaired access to fluids. 20 However, short-term thirst reduction may not be enough to mask the deleterious effects of dehydration during exercise. 21 While oral stimulation plays a role in immediate thirst reduction, change in plasma osmolality is necessary for sustained reduction in thirst perception. 13,18,19 This has a direct impact on AVP, and thus copeptin, production tied to osmotic change. 22,23 However, there is some delay where thirst is not perceived until a blood osmolality of approximately 294 mosm/kg is reached, indicating that the relationship is not perfect, likely due to the heavy influence of external factors. 22,24 Although investigation of thirst and fluid intake following exercise has been established, the adaptation of thirst perception to fluid volume is lacking in the current literature. Therefore, the purpose of this study was two-fold: to investigate the change in thirst perception following fluid intake after exercise, and to investigate a relationship between thirst perception and volume of fluid consumed. We hypothesized that thirst would have a reflexive decrease following fluid 68
77 consumption with a subsequent gradual increase over time, and volume of fluid consumed would have a large impact on thirst perception throughout the process. METHODS Participants Eleven recreationally active males volunteered to participate in this study, which was approved by the Institutional Review Board at the University of Connecticut. Prior to obtaining written consent (Appendix D), participants were informed of possible risks associated with participation in the study. Participants were included based on the following inclusion criteria: aged 18-35; recreationally active defined as >30 minutes of exercise 4-5 days per week; VO2max > 45 ml kg -1 min-1. Participants were excluded based on the following exclusion criteria: fever or current illness at the time of testing; history of cardiovascular, metabolic, or respiratory disease; current musculoskeletal injury that limits their physical activity; exertional heat illness in the past 3 years. A medical history questionnaire was used to determine satisfaction of these criteria (Appendix E). Experimental Design and Procedures This lab study followed a randomized, counterbalanced, semi-cross over design, which took place in the thermal physiology laboratory in an environmental chamber (Model 200, Minus Eleven, Inc., Malden MA) set at an a warm environment (35 C ambient temperature and 30% relative humidity) in the Human Performance Laboratory (HPL) at the University of Connecticut. Data collection took approximately 3 months, from February to May, Each participant visited the laboratory a total of eight times for three types of laboratory testing sessions described below: one familiarization trial, three baseline body mass trials, and four 69
78 exercise trials. Each exercise trial was separated by at least five days to allow for recovery prior to the next testing session. The study timeline is depicted in Figure 3.1. Familiarization Visit Prior to completing the exercise trials, participants completed familiarization tasks to become familiar with study procedures and collect information necessary for exercise trials. Participants were instructed to arrive euhydrated to the laboratory. Upon arrival to the laboratory, participant s height, and body fat was measured. Body fat was measured with Lange skinfold calipers (Beta Technology, Santa Cruz, CA) using the 7-site method described by the American College of Sports Medicine. 25 Participants performed a maximal oxygen uptake (VO2max) test following a modified Bruce protocol on a treadmill in a thermoneutral environment to establish appropriate aerobic intensity during the exercise trials and assess satisfaction of inclusion criterion. 26 Velocity at VO2max (vvo2max) was used to determine walking and running intensities in the exercise trials. Following completion of the VO2max test and a brief rest period, sweat rate and electrolyte content was assessed to determine fluid replacement volumes during exercise and sweat constituents. The sweat rate assessment was performed in the environmental chamber at ~35 C, ~30% relative humidity. Prior to entering the environmental chamber, participants showered without soap and changed into a set of clothes which had been washed without detergent. Nude body mass was then measured (Defender 5000, Ohaus, Parsippany, NJ). Participants entered the environmental chamber and were familiarized with the perceptual indices used throughout the study (Thirst and Thirst Sensation Scale; Appendices A and B, respectively) as well as a diet log (Appendix C) during a 15-minute equilibration period. Perceptual indices are described in detail in the exercise trials section. 70
79 Participants then performed an exercise protocol which was the same as one cycle of exercise completed during an exercise trial to obtain an accurate sweat rate (8 minutes at 40% VO2max, 8 minutes at 60% VO2max, 8 minutes at 40% VO2max, and 6 minutes of rest). The participants were instructed to wipe sweat with a towel washed without detergent to capture sweat and prevent dripping. After exercise, participants exited the environmental chamber and provided a final nude body mass to calculate sweat rate. Baseline Body Mass Following the familiarization visit, a 3-day baseline body mass was performed on three consecutive days to provide a measure of average body mass. Prior to each baseline body mass session, participants were instructed to eat and drink normally, hydrate well, avoid alcohol, and record everything consumed on a diet log. Diet logs were analyzed using a food processing program to determine kilocalories, macronutrients, sodium, potassium, and food moisture (Nutritionist Pro, version 5, Axxya Systems, LLC, Redmond, WA). Participants were also instructed to collect all urine in a provided urine jug for 24 hours. On the night prior to each visit, participants collected a small urine sample in a clean urine cup prior to bedtime. In the morning of each day of the 3-day period, participants arrived at the laboratory in a fasted state, returned the urine jug, bedtime urine cup, and diet log from the previous 24 hours. Nude body mass was recorded. Urine from the bedtime cup was analyzed for urine specific gravity (Usg; TS400, Reichert Technologies, Buffalo, NY), osmolality (UOsm; Model 3320, Advanced Instruments freezing-point depression Osmometer, Norwood, MA), color 27, then added to the 24-hour collection jug for the same analyses as well as total volume. 71
80 Exercise Trials Each exercise trial was scheduled with approximately seven days between exercise trials, and participants were asked to maintain normal diet and exercise routines for the duration of the study. Trial conditions were randomized and counter balanced between subjects. Recovery hydration group entry was randomized, but remained the same in both recovery trials. Abbreviations for trial conditions are included in Table 3.1, with the trial conditions, and will be used to refer to trials individually hereafter. Exercise During all exercise trials, participants wore undergarments, athletic shorts, shirt, and socks, and typical athletic shoes. Participants inserted a rectal probe to monitor body temperature (4600 series, Measurement Specialties, Hampton, VA) and a heart rate strap to monitor heart rate (digital 2.4 Timex heart rate monitor, Timex Group USA, Middlebury, CT) to determine safety cut offs, as described later, for the duration of the exercise trial. Participants entered the environmental chamber (35.2±0.6 C, 31.4±2.3% relative humidity) and sat for a 15- minute equilibration period. Following equilibration, baseline measures were recorded, then exercise commenced. Exercise consisted of 6, 30-minute cycles (8 minutes at 40% VO2max, 8 minutes at 60% VO2max and 8 minutes at 40% VO2max at 2% incline, and 6 minutes of rest.) For the EuR trial where participants minimized fluid loss, participants were given a volume of water to consume matching sweat rate every 30 minutes as assessed in the familiarization trial. For the trials where participants progressively dehydrated (EuD, HyD, HyR), fluid was restricted for the duration of exercise. Exercise was terminated at one of the following criteria: rectal temperature reaching C, participant requested, altered or uneven gait, heart rate > age-predicted maximum heart 72
81 rate (220-age) for 5 minutes, 3 hours of exercise completed, or 5% body mass loss. At the termination of exercise, recovery commenced. Recovery During the one-hour recovery portion of the trial, participants rested passively in a chair for 60 minutes in the environmental chamber. For trials with recovery fluid replacement (EuR, HyR), participants were randomly allocated to fluid groups to receive either a Large (80% of body mass loss) or Small (20% of body mass loss) bolus of water based on the difference between average baseline and post-exercise body mass. Participants were encouraged to consume the bolus of fluid, but were not required to do so. For trials without fluid replacement, participants were not permitted to consume any fluids. Hydration Assessment For 24 hours prior to each exercise trial, participants collected urine and completed a 24- hour diet log. Urine analysis was performed with the same procedures as described in the baseline visit section. For hypohydrated trials (HyD and HyR), participants underwent 22 hours of fluid restriction to attain hypohydration, including instruction to avoid high fluid containing foods (i.e. soup, yogurt, large amounts of raw fruits or vegetables) as well as all beverages. For euhydrated trials (EuD and EuR), participants were reminded to consume fluids the day before, consume 500 ml the night before and 500 ml the morning of the study visit to ensure proper hydration. Participants were asked to avoid alcohol, have similar dietary intake between lab visits, with the exception of fluid and high fluid containing foods, and recorded intake on a diet log. Criterion definitions for euhydration and hypohydration can be found in Table 3.2. For euhydrated trials, if euhydration criteria were not met, participants were rescheduled and given 73
82 further instruction on appropriate fluid consumption to establish euhydration prior to the rescheduled trial. Body mass, urine analysis, and blood analysis were used to assess hydration throughout the study. Body mass was assessed in two ways: minimally clothed and nude. Minimally clothed body mass was assessed every 30 minutes in the environmental chamber during breaks in exercise. Participants wiped away excess sweat and provided a body mass wearing only socks, shorts, and undergarments. Nude body mass was assessed before exercise, and immediately following the recovery period. To determine post-exercise nude body mass, minimally clothed body mass immediately following exercise was described in reference to urine excreted and mass of clothing. Change in nude body mass is described as the difference from average baseline nude body mass unless otherwise described. Thirst Perception Thirst perception was collected using the Thirst and Thirst Sensation Scale (TSS) indices. Thirst was collected before, and every 3 minutes during recovery (Appendix A). The thirst scale assessed perceived thirst on a one-point anchored likert-type scale from 1-9, where 1 indicated not thirsty at all, and 9 indicated very, very thirsty. 2,28,29 The TSS was collected before, and every 10 minutes during recovery (Appendix B). The TSS is modified from previous literature. 17,30 It is a series of six 100 mm visual analogue scales intended to assess thirst and related sensations along a continuum from not present to extremely present. Higher scores for each item indicated higher intensity of the sensation. Thirst sensation scale data is represented as a total score (TSSTotal) which is the sum of all six visual analogue scales. For purposes of direct comparison, Thirst scale data at minutes 0, 9, 21, 30, 39, 51, and 60 were used to compare to the 10-minute intervals of the TSSTotal. 74
83 Blood Analysis Before exercise, as well as before and after the recovery period, blood was drawn from an antecubital vein using an aseptic technique by a researcher trained to perform blood draws. The 7-ml blood sample at both time points was used to determine hydration from plasma volume change and plasma osmolality (POsm), as well as copeptin. Blood for POsm and plasma volume change was analyzed immediately from a lithium heparin-treated tube, and blood drawn into a K2 EDTA-treated tube was prepared for later analysis of copeptin. Both tubes were inverted 8-10 times immediately following the blood draw. Hematocrit (Hct), hemoglobin (Hb), and POsm were assessed immediately. Hematocrit and Hb were used to assess change in plasma volume over time using the equation from Dill and Costill (1974). Hematocrit was analyzed from lithium heparin-treated whole blood using nonheparinized microcapillary tubes, and centrifuged at room temperature and 10,000 rpm for 5 minutes. Hemoglobin was assessed using the HemoCue Hb 201+ (HemoCue America, Brea, CA). The lithium heparin-treated blood collection tube was centrifuged at room temperature and 5,000 rpm for 15 minutes. Plasma osmolality was assessed using the freezing point depression method (model 3320, Advanced Instruments, Norwood, MA). Samples were analyzed in duplicate (or more in cases of >3 mosm/kg difference in readings) and averaged to determine POsm. Fifteen-hundred microliters of K2 EDTA-treated whole blood and 78 µl of aprotinin (from bovine lung, approx. 10,000KIU/mL; Fisher Scientific, Fair Lawn, NJ, USA), at a concentration of 0.6TIU/ml of blood were added to a microcentrifuge tube, then gently rocked 4-5 times to ensure appropriate mixing. Blood was then centrifuged at 4 C and 4,000 rpm for 15 75
84 minutes. Plasma was then aliquoted into microcentrifuge tubes and stored at -80 C for up to 3 months for later analysis. Frozen plasma samples containing K2 EDTA and aprotinin were transferred to the diagnostic laboratory. For measurement of copeptin, plasma was used in an extraction-free competitive enzyme immunoassay (EK , Phoenix Peptides, Burlingame, CA). All samples were analyzed in duplicate. Description of assay procedures and standard curve is found in Appendix F. Absorbance optical density was read at 450nm on a microplate reader (VersaMax, Molecular Devices, Sunnyvale, CA) using SoftMax Pro software (version 5.3, Molecular Devices, Sunnyvale, CA). The curve was used to interpolate concentration from absorbance (GraphPad, Prism, version 7 for Windows, 2016). Intra-assay CV% was calculated to be less than 8.7%, and the inter-assay CV% was calculated as 7.9%. Statistical Analysis A three-way (group x trial x time) mixed (between-within-within) analysis of variance (ANOVA) was conducted to compare differences of time and trial by rehydration group on Thirst perception and hydration variables. Analysis of studentized residuals determined normality when no residual was greater than ± 3 standard deviations. Sphericity was assessed by Mauchly s test of sphericity (p>0.05). If sphericity was violated, Greenhouse-Geisser correction was applied. When a significant interaction was determined, analysis of simple two-way interactions of trial on each level of time for each group was determined. When simple main effects of the two-way interaction were present, simple simple main effects with Bonferroni adjustments were interpreted to determine significant simple simple comparisons. A two-way (group x trial) mixed ANOVA was conducted to compare difference of trial by group on Thirst perception and hydration variables. Analysis of studentized residuals 76
85 determined normality when no residual was greater than ± 3 standard deviations. Mauchley s test was used to determine if the assumption of sphericity was met. A Greenhouse-Geisser correction was applied when sphericity was violated (p>0.05). When a significant two-way interaction was determined, a one-way ANOVA was used to determine simple main effects. One-way ANOVA of group in the EuR and HyR trials was used for fluid replacement variables to determine if differences by group existed. For three-way mixed ANOVA analyses, a Bonferroni correction was applied to the alpha level adjusted for the number of independent analyses run in the simple two-way ANOVA. Mauchley s test was used to determine if the assumption of sphericity was met. A Greenhouse-Geisser correction was applied when sphericity was violated (p>0.05). Spearman rank-order correlations were used to analyze the relationship of ordinal thirst variables (Thirst and TSSTotal) to hydration and fluid variables during the recovery period. For all analyses, a priori alpha level was set at p Data are presented as Mean±SD, unless otherwise stated. RESULTS Participant Characteristics Characteristics for participants overall and in each fluid group are presented in Table 3.3. Analysis of participant characteristics revealed no statistically significant differences between fluid replacement groups on any characteristic except VO2max (p=0.021). Participants started the recovery period in similar hydration state within each trial, regardless of hydration group (Table 3.4). 77
86 Nude Body Mass Two way mixed ANOVA revealed no significant interaction of group and trial (F(3, 27)=1.379, p=0.270) for total nude body mass loss from average baseline to post-recovery. There was a significant main effect for total nude body mass loss, defined the percent difference between post-recovery nude body mass and baseline average body mass, by trial (F(3, 27)=63.024, p<0.001), where total nude body mass loss in the EuR trial was significantly less than all other trials (-0.11±0.84 kg, p<0.005), and total nude body mass loss in the HyD trial (-3.81±0.66 kg) was significantly greater than all other trials (p<0.001). There was not a significant main effect for total nude body mass loss by recovery group. Two-way mixed ANOVA revealed no significant interaction of group and trial (F(1.819, 16.37)=0.833, p=0.442) for total nude body mass percent loss from average baseline to postrecovery. There was a significant main effect for total nude body mass percent loss by trial (F(1.819, )=64.388, p<0.001) where total nude body mass loss in the EuR trial was significantly less than all other trials (-0.16±1.18%, p<0.001), and total nude body mass loss in the HyD trial was significantly greater than all other trials (-5.48±0.81%, p<0.009). There was also a significant main effect for total nude body mass loss by fluid group (F(1, 9)=5.855, p=0.039) where the Small fluid group had greater total nude body mass loss percent than the Large fluid group (p<0.039). Fluid Consumed Participants were given fluid to consume during the recovery period starting after the Pre time point of trials EuR and HyR. Amount of fluid consumed in the EuR trial (0.05±0.08 L) was less than in the HyR trial (1.49±1.12 L), independent of fluid group, and more fluid was 78
87 consumed in the Large fluid group independent of trial (p=0.001). Participants sometimes chose not to consume all fluid given after exercise, and thus the percent of fluid given that participants consumed was analyzed via two-way ANOVA group by trial (EuR and HyR only). There was not a statistically significant difference in group by trial analysis of percentage of fluid consumed (F(1, 9)=4.486, p=0.063), however, some difference did exist where incomplete fluid replacement only occurred in the HyR trial (Small: 99.6±0.9%; Large 85.1±15.1%). Fluid consumed as a percentage of nude body mass loss are presented in Figure 3.2. In the EuR trial, several participants had not lost body mass as a result of appropriate fluid replacement, and thus were not given fluid to consume in the recovery period. All participants consumed 100% of the fluid given in the EuR trial, regardless of fluid group. One-way ANOVAs of differences between groups for amount of fluid given, consumed, and percentages of each, did not reveal a significant interaction in the EuR trial (p>0.457). One-way ANOVA of fluid given in the HyR trial revealed that the Large fluid group was given significantly more fluid than the Small fluid group (p<0.001). Additionally, the Large fluid group consumed significantly more fluid than the small fluid group (p=0.001). In the HyR trial, the Small fluid group was given enough fluid to replace up to 0.77±0.19% of nude body mass, and 99.6±0.9% of that fluid was consumed, which was significantly less than the HyR trial (p 0.001). However, in the HyR trial the Large fluid group was given enough fluid to replace up to 3.36±0.57% of nude body mass, and only replaced fluid corresponding to 2.66±0.69% of nude body mass. Plasma Osmolality and Volume Change Three-way mixed ANOVA (2x4x2) revealed a significant of trial by time by group (F(3, 27)=8.120, p=0.001) for POsm from pre to post recovery. There was a statistically significant simple two-way interaction of trial by time for POsm in the Large fluid group (F(2.586, 79
88 12.929)=11.842, p=0.001), but not the Small fluid group (F(2.508, )=1.187, p=0.356). Analysis of POsm at the pre-recovery time point in the Large fluid group revealed significant simple simple main effects (F(3, 15)=30.334, p<0.001). At the pre-recovery time point, POsm in the EuR trials was significantly less than all others (p<0.015). Additionally, POSm in the EuD trial was significantly less than in the HyR (p=0.044), but not HyD (p=0.087) trials. Analysis of the postrecovery time point revealed statistically significant simple simple main effects (F(3, 15)=17.253, p<0.001). At the post-recovery time point, POsm in the EuR trial was significantly less than in the EuD (p=0.007) and HyD (p=0.004) trials, but not HyR (p=0.140) trial. POsm at the postrecovery time point in the EuD, HyD, and HyR trials were not different (p<0.068), and the HyR trial was not different from any other trial (p<0.068). Two-way mixed ANOVA revealed a statistically significant interaction of group and trial on POsm change from pre to post-recovery (F(3, 27)=8.098, p=0.001). In the HyR trial, change in POsm was significantly greater in the Large (-13±4 mosm/kg) than in the Small fluid group (0±6 mosm/kg, p=0.002), but not in any other trial. Two-way mixed ANOVA revealed a statistically significant interaction of group and trial on POsm percent change from pre to postrecovery (F(3, 27)=7.683, p=0.001). In the HyR trial, percent change in POsm was significantly greater in the Large (-4.0±1.1%) fluid group than in the Small fluid group (-0.02±1.9%, p=0.002), but not in any other trial. Two-way mixed ANOVA revealed no significant interaction of group and trial on plasma volume change from pre to post-recovery (F(3, 27)=0.406, p=0.750). There was no significant main effect of trial (p=0.705), or main effect of rehydration group (p=0.451). 80
89 Copeptin Three-way mixed ANOVA of copeptin revealed a significant interaction of group and trial (F(1.413, )=8.752, p=0.007). There was not a significant simple two-way interaction of time by trial in the Large fluid group (F(3, 15)=0.840, p=0.493), but there was a significant interaction in the Small fluid group (F(1.148, 4.592)=9.292, p=0.030). Analysis of copeptin in the Small fluid group at the pre-recovery time point did not reveal significant simple simple main effects (F(1.124, 4.495)=3.965, p=0.109). Analysis of copeptin in the Small fluid group at the postrecovery time point revealed statistically significant simple simple main effects (F(3, 12)=5.976, p=0.010), however no statistically significant simple simple comparisons existed. Hydration variables are described by trial in Table 3.5. Copeptin was correlated with POsm at the pre-recovery time point (ρ=0.373, p=0.013), as well as the post-recovery time point (ρ=0.408, p=0.006). However, copeptin was not correlated with the plasma volume percent change during exercise (ρ=0.155, p=0.314), nor with the plasma volume percent change during the recovery period (ρ=0.041, p=0.789). Thirst Perception Thirst and TSS data at 10-minute intervals are presented in Figure 3.3. Three-way mixed ANOVA (2x4x7) revealed a significant interaction of trial by time by group (F(3.457, )=8.478, p<0.001) for Thirst. There was a statistically significant simple two-way interaction between trial and time for Thirst in the Large replacement group (F(3.282, )=35.351, p<0.001), but not the Small replacement group (F(2.230, 6.689)=1.993, p=0.209). Analysis of Thirst on trials at the pre-recovery time point (0 minutes) in the Large group revealed a significant simple simple main effect (F(3, 15)=36.023, p<0.001). Thirst at 0 minutes in the EuR was significantly lower than all other trials (3±2, p<0.012), and EuD (8±1), HyD (8±1), and HyR were not different (9±1, 81
90 p>0.555). Thirst data was recorded every 3 minutes (Figure 3.4) during the recovery period, in order to potentially characterize a decrease and re-establishment of thirst perception following fluid ingestion. Analysis of trials at the 10 minute time point in the Large group revealed a significant simple simple main effect (F(3, 15)=23.231, p<0.001). Thirst at 10 minutes in the EuR (3±2) and HyR (5±2) trials were not different (p=1.000), nor was thirst at 10 minutes in the EuD (8±1) and HyD (9±1, p=1.000), however EuR and HyR were significantly lower than EuD and HyD (p<0.016). Analysis for simple simple main effects for the Large replacement group were performed for 20, 30, 40, 50, and 60 minutes and all remained significant (p<0.05). Additionally, pairwise analysis continued the same significant and non-significant relationships without exception at all time points. Data for TSSTotal are represented in Figure 3.3. Three-way mixed ANOVA (2x4x7) revealed a significant interaction of trial by time by group (F(3.426, )=3.263, p=0.34) for TSSTotal. There was a statistically significant simple two-way interaction between trial and time for TSSTotal in the Large replacement group (F(1.236, 4.945)=23.315, p=0.004), but not the Small replacement group (F(2.648, 7.945)=1.867, p=0.215). Analysis of TSSTotal at the pre-recovery time point in the Large group revealed a significant simple simple main effect (F(3, 15)= , p<0.001). At 0 minutes, TSSTotal in the EuR was significantly lower than all other trials (128±38, p<0.001); and EuD (393±12), HyD (425±34), and HyR were not different (409±26, p>0.262). Analysis of TSSTotal at the 10-minute time point in the Large group revealed a significant simple simple main effect (F(1.260, 6.298)=30.743, p=0.001). At the 10-minute time point, TSSTotal in the EuR trial (127±42) was less than EuD (393±14, p<0.001) and HyD (431±38, p=0.001). However, TSSTotal in the HyR trial was not different from any other trial (300±126, p>0.064). 82
91 Analysis of TSSTotal at the 20-minute time point in the Large group revealed a significant simple simple main effect (F(1.320, 6.599)=18.851, p=0.003). At the 20-minute time point, TSSTotal in the EuR trial (139±66) was less than EuD (391±11, p=0.002) and HyD (438±48, p=0.005) trials; and TSSTotal in the HyD was greater than HyR (270±144, p=0.048). Analysis of 30 minute time point in the Large group revealed a significant simple simple main effect (F(1.145, 4.581)=31.089, p=0.003). At the 30 minute time point, TSSTotal in the EuD trial (387±15) and HyD (437±49) were not different (p=1.000), nor were EuR (124±52) and HyR (202±126) different (p=1.000), however TSSTotal in the EuD and HyD trials was significantly higher than EuR and HyR (p<0.045) in the Large group. Analysis for simple simple main effects for the Large replacement group were performed for 40, 50, and 60 minutes and all remained significant (p<0.05). Additionally, pairwise analysis continued the same significant and nonsignificant relationships as at the 30 minute time point without exception. Thirst Perception and Hydration Spearman correlations of thirst perception and hydration variables are presented in Table 3.6. At the pre-recovery time point, thirst perception was significantly correlated with nude body mass change and plasma osmolality (p<0.01), but not to plasma volume change during exercise. Thirst perception was also correlated with copeptin concentration (p<0.05). At the post-recovery time point, thirst perception was significantly correlated with nude body mass change and plasma osmolality (p<0.01), but not with change in plasma osmolality or volume. Post-recovery copeptin was correlated with thirst perception (p<0.05). Additionally, the volume of fluid consumed during the recovery period was significantly correlated with thirst perception (p<0.05). Relationship of thirst perception to overall plasma volume change nude body mass change (%), and post-recovery plasma osmolality and copeptin are presented in Figure
92 DISCUSSION The purpose of this study was to investigate the change in thirst perception following fluid intake after exercise, and to investigate a relationship between thirst perception and volume of fluid consumed. The main findings of this study were that hydration status changed over the course of recovery in the two trials where fluid was consumed. Thirst perception was reduced or eliminated in the group which consumed the large bolus of fluid, but remained elevated in the group which consumed the small bolus of fluid. Also, although thirst perception was decreased, participants in the group which was given the large bolus of fluid did not consume the entire bolus, and replaced less fluid than would be required to return to a euhydrated state. To our knowledge, no study has assessed the impact of a prescribed fluid volume on thirst perception following a dehydrating bout of exercise. It is commonly accepted that consumption of fluid decreases thirst perception via a number of physiological and perceptual channels. Fluid volume touches on several of these specifically, where gastrointestinal and oropharyngeal sensory pathways are likely stimulated, as well as mouth feel and taste impacted. Classic research by Figaro and Mack (1997) suggested that the oropharyngeal region monitors fluid intake rate and volume, thus reducing thirst as fluid is consumed to innately prevent overconsumption. Fluid was either infused directly to the stomach, bypassing the mouth and esophagus, or consumed ad libitum. Thirst was not sated when fluid was directly infused, suggesting some role of mouth or esophagus sensory stimulation independent of changes in plasma osmolality. 13 The present study adds to this concept, as participants chose not to consume enough fluid to completely rehydrate, but saw a reflexive decrease in thirst perception over time with oral fluid consumption. Although there was a resultant decrease in plasma 84
93 osmolality which positively correlated with thirst perception, plasma volume changed during this fluid consumption period, but was not correlated with thirst perception. In the present study, consumption of a small amount of fluid did not result in a significant reduction in thirst. This would seem to refute the theory of mouth feel or taste as a large impacting factor of thirst perception during rest. A randomized control trial of thirst perception with or without a series of mouth wetting but not fluid consumption techniques described that thirst could be sated without fluid consumption for some period of time less than 30 minutes. 18 This is additive to the slight dip in thirst that was perceived in the present study, where following even a small amount of fluid consumption, thirst perception initially decreased, and subsequently began a steady increase within 30 minutes. This would appear to implicate some level of oropharyngeal stimulation by fluid consumption as responsible for decreased thirst perception without plasma osmolality change. Consumption of a large amount of fluid resulted in a large decrease in thirst in the present study. However, not all participants consumed all the fluid they were given, which in its entirety was not sufficient to completely replace body mass loss. This has the potential to lead to incomplete replacement of fluid prior to a subsequent bout of exercise. This has also been termed involuntary dehydration, 10,11 and is seen in both laboratory and field research settings. Classic research described that following intense aerobic exercise leading to graded hypohydration, ad libitum fluid replacement was incomplete. 11 However, the fluid given for replacement in this study was a carbohydrate-electrolyte solution, which may not have been preferred to water by all participants. We see in other literature that temperature 31 and fluid composition preference 32 may influence fluid intake. 85
94 More recent research describing rehydration modes as being important for fluid replacement following exercise found that ad libitum drinking of a flavored, non-caloric beverage did not provide adequate replacement of body mass lost during exercise. Similarly with the present study, a remaining deficit following an hour of recovery and fluid access occurred. Additionally, thirst perception was decreased to a level similar to intravenous and prescribed oral rehydration methods, 20 further supporting the results of the present study where thirst was decreased regardless of the amount of exercise-induced fluid loss. Additionally, thirst during a subsequent bout of exercise was decreased by oral fluid replacement, but not to as large a degree with intravenous fluid replacement in the first 15 minutes of exercise. 2 However, immediately following exercise, intravenous fluid replacement provided no difference in ratings of thirst from a control, no fluid consumption, condition. 2 Plasma osmolality in the present study was reduced over the 60-minute recovery period in the present study. In previous research, a strong link of thirst related to plasma osmolality change has been established. 22,24 In the present study, thirst was related to plasma osmolality over the course of an hour. However, previous literature of high intensity intermittent exercise describes thirst unrelated to blood osmolality, where reduced osmolality due to cessation of exercise did not serve to reduce sensation of thirst when fluid was withheld for a short period of time. 15 Additionally, thirst was decreased in response to fluid intake, independent of the timing of fluid intake, 15 which is supportive of the responses in the present study. In the present study, copeptin was related to plasma osmolality both before and after the recovery period. Production of copeptin in the present study has a relationship to thirst following exercise. However, emerging evidence suggests that copeptin may be a better predictor of longterm, sustained fluid loss and not short term fluid loss. 33 In the present study, this evidence may 86
95 be additive, but not supportive, of this concept where relatively short term dehydration (3 hours in the EuD trial) was included in the positive relationship of thirst perception to copeptin the same as in the longer term hypohydration (22-hours with 3 hours of exercise in the HyD and HyR trials). With reported sweat rates of greater than 2 L/hr, 34,35 complete replacement during exercise may be uncomfortable due to large gastrointestinal load coupled with exercise. Thus, the post-exercise recovery period is an optimal time to rehydrate prior to a subsequent exercise bout. The present study found that fluid was not entirely replaced during the first hour, likely due to decreased thirst perception. If inhibited thirst perception was sustained, this could lead to lack of complete rehydration prior to a subsequent exercise bout. This is a problem from both performance and safety perspectives. 36,37,2,5,4,38 Therefore, this reduced perception of thirst in the absence of complete rehydration is a realistic problem. There is the potential for an athlete who loses a significant amount of body mass and has only a short period of time before the next exercise bout, to not replace fluid loss. This is common in tournament play situations, where back to back games are not uncommon, as well as preseason practices which include double sessions. In the present study, we saw that after 60 minutes of access to fluids, the large fluid consumption group did not consume all fluids given, leaving a greater than 2% deficit in nude body mass. We may be able to attribute this lack of complete fluid consumption to an immediate reduction in thirst perception, and maintenance thereof. Similarly, a small fluid bolus had little impact on thirst for a short period of time, leaving participants hypohydrated and still perceiving thirst. Further research of timed fluid boluses over a series of short periods could lead to more fluid replacement, as thirst may be reestablished enough to elicit further drinking. 87
96 CONCLUSIONS Thirst decreases in response to fluid ingestion following exercise. However, thirst perception appears to decrease more readily than body mass loss is replaced, such that incomplete replacement occurs. This may predispose physically active individuals to risk of chronic dehydration if fluid replacement beyond thirst after exercise does not occur. Further research is needed on timing of fluid bolus to determine if an optimal fluid consumption strategy can be devised which is dictated by thirst, but replaces a larger amount of fluid loss. REFERENCES 1. Perrier E, Vergne S, Klein A, et al. Hydration biomarkers in free-living adults with different levels of habitual fluid consumption. Br J Nutr. 2013;109(9): doi: /s Maresh CM, Herrera-Soto JA, Armstrong LE, et al. Perceptual responses in the heat after brief intravenous versus oral rehydration. Med Sci Sports Exerc. 2001;33(6): Distefano LJ, Casa DJ, Vansumeren MM, et al. Hypohydration and hyperthermia impair neuromuscular control after exercise. Med Sci Sports Exerc. 2013;45(6): doi: /mss.0b013e b Adam GE, Carter R, Cheuvront SN, et al. Hydration effects on cognitive performance during military tasks in temperate and cold environments. Physiol Behav. 2008;93(4-5): doi: /j.physbeh Lieberman HR, Bathalon GP, Falco CM, Kramer FM, Morgan CA, Niro P. Severe decrements in cognition function and mood induced by sleep loss, heat, dehydration, and undernutrition during simulated combat. Biol Psychiatry. 2005;57(4): doi: /j.biopsych Ali A, Gardiner R, Foskett A, Gant N. Fluid balance, thermoregulation and sprint and passing skill peformance in female soccer players. Scandanavian J Med Sci Sports. 2011;21(3): Buono MJ, Wall AJ. Effect of hypohydration on core temperature during exercise in temperate and hot environments. Pflüg Arch Eur J Physiol. 2000;440(3): Arnaoutis G, Kavouras SA, Kotsis YP, Tsekouras YE, Makrillos M, Bardis CN. Ad libitum fluid intake does not prevent dehydration in suboptimally hydrated young soccer players during a training session of a summer camp. Int J Sport Nutr Exerc Metab. 2013;23(3): Godek SF, Godek JJ, Bartolozzi AR. Hydration status in college football players during consecutive days of twice-a-day preseason practices. Am J Sports Med. 2005;33(6): doi: /
97 10. Greenleaf JE. Problem: thirst, drinking behavior, and involuntary dehydration. Med Sci Sports Exerc. 1992;24(6): Engell DB, Maller O, Sawka MN, Francesconi RP, Drolet L, Young AJ. Thirst and fluid intake following graded hypohydration levels in humans. Physiol Behav. 1987;40(2): Aarts H, Dijksterhuis A, De Vries P. On the psychology of drinking: being thirsty and perceptually ready. Br J Psychol Lond Engl ;92(Pt 4): Figaro MK, Mack GW. Regulation of fluid intake in dehydrated humans: role of oropharyngeal stimulation. Am J Physiol. 1997;272(6 Pt 2):R Mears SA, Shirreffs SM. Voluntary water intake during and following moderate exercise in the cold. Int J Sport Nutr Exerc Metab. 2014;24(1): doi: /ijsnem Mears SA, Watson P, Shirreffs SM. Thirst responses following high intensity intermittent exercise when access to ad libitum water intake was permitted, not permitted or delayed. Physiol Behav. 2016;157: doi: /j.physbeh Obika LFO, Okpere SO, Ozoene JO, Amabebe E. The role of oropharnygeal receptors in thirst perception after dehydration and rehydration. Niger J Physiol Sci Off Publ Physiol Soc Niger. 2014;29(1): Rolls BJ, Wood RJ, Rolls ET, Lind H, Lind W, Ledingham JG. Thirst following water deprivation in humans. Am J Physiol. 1980;239(5):R Puntillo K, Arai SR, Cooper BA, Stotts NA, Nelson JE. A randomized clinical trial of an intervention to relieve thirst and dry mouth in intensive care unit patients. Intensive Care Med. 2014;40(9): doi: /s z. 19. Arai SR, Butzlaff A, Stotts NA, Puntillo KA. Quench the thirst: lessons from clinical thirst trials. Biol Res Nurs. 2014;16(4): doi: / McDermott BP, Casa DJ, Lee EC, et al. The influence of rehydration mode after exercise dehydration on cardiovascular function. J Strength Cond Res Natl Strength Cond Assoc. 2013;27(8): doi: /jsc.0b013e318295d Arnaoutis G, Kavouras SA, Christaki I, Sidossis LS. Water ingestion improves performance compared with mouth rinse in dehydrated subjects. Med Sci Sports Exerc. 2012;44(1): doi: /mss.0b013e Robertson GL. Vasopressin in osmotic regulation in man. Annu Rev Med. 1974;25: doi: /annurev.me Szinnai G, Morgenthaler NG, Berneis K, et al. Changes in plasma copeptin, the c-terminal portion of arginine vasopressin during water deprivation and excess in healthy subjects. J Clin Endocrinol Metab. 2007;92(10): doi: /jc Baylis PH, Robertson GL. Plasma vasopressin response to hypertonic saline infusion to assess posterior pituitary function. J R Soc Med. 1980;73(4): Pescatello LS, Arena R, Riebe D, Thompson PD. ACSM s Guidelines for Exercise Testing and Prescription. Ninth. Lippincott Williams & Wilkins; Balady GJ, Arena R, Sietsema K, et al. Clinician s Guide to cardiopulmonary exercise testing in adults: a scientific statement from the American Heart Association. Circulation. 2010;122(2): doi: /cir.0b013e3181e52e Armstrong LE, Maresh CM, Castellani JW, et al. Urinary indices of hydration status. Int J Sports Nutr. 1994;4: Riebe D, Maresh CM, Armstrong LE, et al. Effects of oral and intravenous rehydration on ratings of perceived exertion and thirst. Med Sci Sports Exerc. 1997;29(1):
98 29. Maresh CM, Gabaree-Boulant CL, Armstrong LE, et al. Effect of hydration status on thirst, drinking, and related hormonal responses during low-intensity exercise in the heat. J Appl Physiol Bethesda Md ;97(1): doi: /japplphysiol Sandick BL, Engell DB, Maller O. Perception of drinking water temperature and effects for humans after exercise. Physiol Behav. 1984;32(5): Burdon CA, Johnson NA, Chapman PG, O Connor HT. Influence of beverage temperature on palatability and fluid ingestion during endurance exercise: a systematic review. Int J Sport Nutr Exerc Metab. 2012;22(3): Wilmore JH, Morton AR, Gilbey HJ, Wood RJ. Role of taste preference on fluid intake during and after 90 min of running at 60% of VO2max in the heat. Med Sci Sports Exerc. 1998;30(4): Hew-Butler T, Hoffman MD, Stuempfle KJ, Rogers IR, Morgenthaler NG, Verbalis JG. Changes in copeptin and bioactive vasopressin in runners with and without hyponatremia. Clin J Sport Med Off J Can Acad Sport Med. 2011;21(3): doi: /jsm.0b013e31821a62c Godek SF, Bartolozzi AR, Godek JJ. Sweat rate and fluid turnover in American football players compared with runners in a hot and humid environment. Br J Sports Med. 2005;39(4): doi: /bjsm Godek SF, Bartolozzi AR, Peduzzi C, et al. Fluid consumption and sweating in National Football League and collegiate football players with different access to fluids during practice. J Athl Train. 2010;45(2): doi: / González-Alonso J, Mora-Rodríguez R, Below PR, Coyle EF. Dehydration markedly impairs cardiovascular function in hyperthermic endurance athletes during exercise. J Appl Physiol Bethesda Md ;82(4): Gonzalez-Alonso J, Teller C, Andersen SL, Jensen FB, Hyldig T, Nielsen B. Separate and combined influences of dehydration and hyperthermia on cardiovascular responses to exercise. Int J Sports Med. 1998;19(Suppl 2):S111-S DiStefano LJ, Karslo R, VanSumeren MM, et al. The effects of hydration in mild and hot environments on landing technique. In Review. TABLES AND FIGURES 90

99 Table 3.1. Trial hydration conditions. Fluid group: high, replace 80% loss; low, replace 20% loss. Table 3.2. Operational definition of pre-trial hydration states. Euhydration Hypohydration 24-hr Usg hr UOsm 500 mosm/kg > 500 mosm/kg Fluid consumption Consumed 1 L overnight Restricted for 22 hours % nude body mass loss 1% ~ 1% Note: % nude body mass loss is defined as difference from baseline average nude body mass. UOsmurine osmolality Table 3.3. Participant characteristics. 91
100 Overall Age (yr) 22±3 [20, 24] Height (cm) 178±6 [174, 183] Nude body mass (kg) 73.43±10.44 [66.42, 80.45] VO2max (ml kg -1 min -1 ) 54.3±5.4 [50.6, 58.0] Sweat rate (L/hr) 0.89±0.91 [0.28, 1.50] Body fat (%) 11.6±3.9 [8.9, 14.1] Large 23±3 [20, 27] 182±7 [174, 189] 78.82±10.40 [67.91, 89.73] 51.1±4.8 [46.1, 56.1] 1.27±0.37 [0.89, 1.66] 12.2±4.7 [7.2, 17.1] Fluid Group Small 20±2 [18, 23] 174±2 [172, 177] 66.97±6.47 [58.94, 75.00] 58.2±3.3* [54.0, 62.3] 0.42±1.19 [1.05, 1.90] 10.9±3.1 [7.0, 14.7] Note: Data are presented as Mean ± SD [95% CI]. Large: replace 80% of loss; Small: replace 20% of loss. *Significantly greater than the Large group (p<0.05). Table 3.4. Hydration state at the beginning of the recovery period. POsm (mosm/kg) Nude body mass loss (kg) Nude body mass loss (%) Plasma volume change (%) Copeptin (ng/ml) Small Large Small Large Small Large Small Large Small Large EuD 307±11 306±4-2.4± ± ± ± ± ± ± ±6.6 EuR 286±6 289±5 0.2± ± ± ± ± ± ± ±7.4 HyD 313±7 316±9-3.2± ± ± ± ± ± ± ±1.7 - HyR 315±10 315±7-2.8± ± ± ± ± ± ± ±3.5 Note: Data are presented as Mean±SD. Nude body mass loss represents loss during exercise from average baseline body mass. Plasma volume change represents plasma volume change during exercise. Plasma osmolality (POsm) and copeptin represent pre-recovery time point. No significant differences between groups for any variable. 92
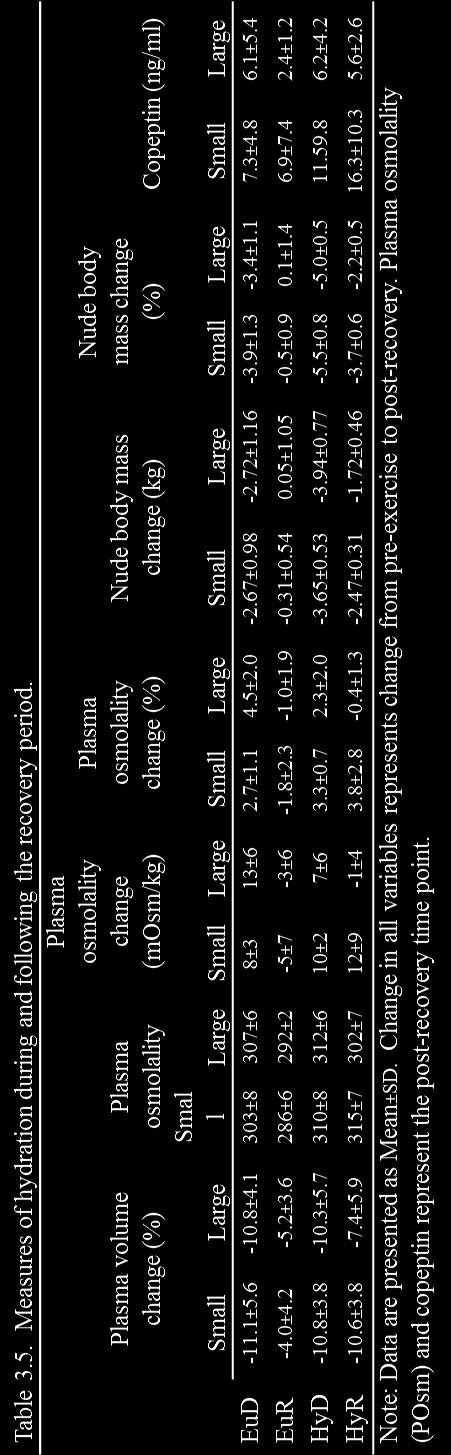
101 93
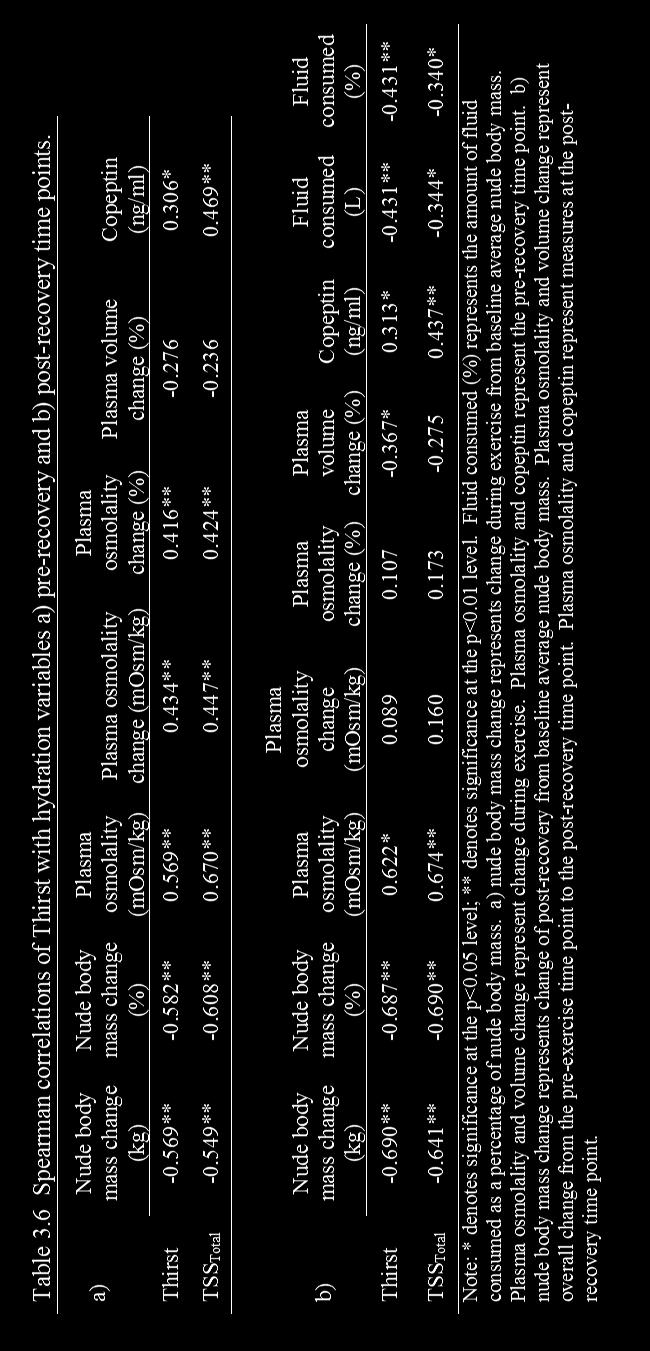
102 94

103 Figure 3.1. Timeline of laboratory testing, and basic description of study procedures for each type of visit. The familiarization trial was separated from the three-day baseline visits by up to two weeks. The three-day baseline visits occurred on three consecutive days prior to the first exercise trial. Each exercise trial was separated by approximately 7 days (no less than 5 days), and were performed in a randomized, counterbalanced order by trial type (Table 3.1.) 95
104 Figure 3.2. Fluid consumed as a percentage of nude body mass loss. Solid and striped bars represent fluid consumed during recovery in the EuR and HyR trials. Grey bars represent the additional fluid given, but not consumed. *denotes significant difference from Small group. 96
 indicate the Small rehydration group, dashed lines (graphs C and D) indicate the")
, EuR and HyR different than EuD and HyD (p<0.05), EuR significantly different than EuD and HyD (p<0.")
105 Figure 3.3. Thirst and TSS Total during recovery. Solid lines (graphs A and B) indicate the Small rehydration group, dashed lines (graphs C and D) indicate the Large rehydration group. *EuR significantly different than all other trials (p<0.05), EuR and HyR different than EuD and HyD (p<0.05), EuR significantly different than EuD and HyD (p<0.05), **HyD significantly different than HyR (p<0.05). Note: TSS Total, Thirst Sensation Scale total score. 97

 was given at the 0-minute time point, and")
106 Figure 3.4. Thirst recorded at short intervals during seated recovery. Data are presented as Mean±SD. Solid lines represent thirst ratings from the Small fluid group; dashed lines represent thirst ratings from the Large fluid group. Thirst was recorded every 3 minutes. In the EuR and HyR trials, a fluid bolus (according to fluid group) was given at the 0-minute time point, and participants were allowed to consume it at a self-dictated rate, and volume. 98
. a. plot of post-exercise plasma osmolality on IPE thirst, significantly correlated (p<0.001); b.")
; d.")
107 Figure 3.5. Scatter plots of thirst on hydration measures. Thirst represented in each graph is immediately postexercise (IPE). Correlation statistic derived from Spearman s rho (ρ). a. plot of post-exercise plasma osmolality on IPE thirst, significantly correlated (p<0.001); b. plot of percent nude body mass loss from baseline average body mass on IPE thirst, significantly correlated (p<0.001); c. plot of post-exercise copeptin on IPE thirst, not significantly correlated (p=0.094); d. plot of percent plasma volume change from pre to post exercise on IPE thirst, significantly correlated (p=0.040). 99
108 Chapter 4 SUMMARY AND FUTURE DIRECTIONS The purpose of these investigations was to determine the relationship of hydration markers to thirst perception during moderate-intensity exercise in a temperate environment and to determine the response of thirst to fluid intake at different volumes following exercise. The main findings suggest that thirst perception responds to hydration state change during and following exercise, however is not sensitive enough to determine exact fluid needs during or following exercise. During exercise, thirst increased with progressive dehydration, and was elevated similarly regardless of amount of body mass lost. Thirst was correlated with hydration measures over time due to a similar linear increase in thirst perception, plasma osmolality, and copeptin. However, thirst perception at the end of exercise was the same when any level of dehydration occurred, regardless of how much. Additionally, following exercise, any fluid consumption decreased thirst for a short period of time. When only a small volume of fluid was consumed, thirst then increased, but not to pre-fluid consumption levels. This indicates that a small amount of fluid impacted thirst, but not so much that thirst was stifled with continued hypohydration. When a large volume of fluid was consumed, thirst decreased and remained absent or nearly absent despite that subjects had not replaced all fluid lost during exercise. We conclude that thirst is insufficient to replace exercise-induced fluid losses. 100
109 Appendices 101
110 Appendix A. 102
111 Appendix B. 103
112 Appendix C. Dietary Food Record Please record your dietary intake so that we can accurately assess your daily intake. All foods and beverages consumed should be recorded for 24 hours. Be very specific. Make sure you include: the type of food/beverage the amount of each food/beverage the preparation method (i.e., fried, baked) the brand name of the food (if applicable) the time it was eaten if applicable, the restaurant you ate it at (i.e., Subway, Applebees, Red Robin) Record food/beverage consumption after each meal/snack instead of waiting until the end of the day. Indicate the time of your workout on this food record to identify pre, during, and post workout intake, as well as your habitual intake. If you prefer, save labels from packages of food you eat and return them with your food record forms (this will greatly assist and enhance our analysis of your true nutrient intake). Use nutrient descriptors (e.g., low-fat, low-carb, fat-free, light, reduced calorie, etc.). Be sure to include all ingredients. For example, a sandwich should include the types and amounts of bread, meat, cheese, vegetables, dressing, etc Include miscellaneous items such as condiments (ketchup, salad dressing, mayonnaise, jams, creams, sugar), and chewing gum. 104
113 Date: BAD Example Detailed food/beverage description: Time brand name, restaurant, method of Amount preparation, flavor, condiments, etc. 7:30 am Oatmeal 1 bowl Low fat milk 8 oz Calories (if known; from food label? Y/N) Omelette with ham and cheddar cheese Orange juice 3 eggs 12 oz 11:30am Turkey sandwich 1 Regular chips Tomato soup Dunkin Donuts Coffee 1 bag 1 ½ cups medium 2:00 pm Yogurt 1 container 6:20 pm Salad 1 large Chicken breast chunks Frozen mixed vegetables Red wine Large handful 1 cup 1 glass 9:05pm Popcorn 2 cups Ice cream water ¾ cup 1 bottle 105
114 Date: GOOD Example Time Detailed food/beverage description: brand name, restaurant, method of preparation, flavor, condiments, etc. Amount 7:30 am Regular oatmeal- Quick 1 minute Quaker oats made 1 cup oats with 2 cups water dry Hood LightBlock 1% lowfat milk, vitamins A, C, & 8 oz D (fortified) Omelette with 2 Tbsp Hillshire Farm diced ham and 3 whole eggs 2 oz Cabot 50% reduced fat sharp cheddar cheese (large) Tropicana Pure Premium orange juice with calcium 12 oz & vitamin D 11:30a m Turkey sandwich: Arnold 100% whole wheat bread Butterball extra thin sliced hroasted smoked turkey breast (deli meat) Kraft mayonnaise Iceberg lettuce Lays classic potato chips Campbell s Select soup-tomato Garden flavor 2 slices 7 slices 1 Tbsp 1 leaf 1 oz bag 1 ½ cups Dunkin Donuts Medium Coffee made with cream, 1 14 oz splenda packet 2:00 pm Dannon fruit on the bottom yogurt- strawberry 1-6 oz container Bear Naked Banana Nut flavored Granola ¼ cup 6:20 pm Salad: 2 cups romaine lettuce 1 large medium red tomato 3 slices cucumber 3 slices Pepperidge Farm Zesty Italian croutons, 8 Newman s Own Ranch dressing 2 Tbsp Tyson premium chunk chicken breast (canned 4 oz. chunks) Calories (if known; from food label? Y/N) 106
115 Subject #: Date: Time Detailed food/beverage description: brand name, restaurant, method of preparation, flavor, condiments, etc. Amount Calories (from food label? Y/N) Comments: 107

116 Appendix D. 108
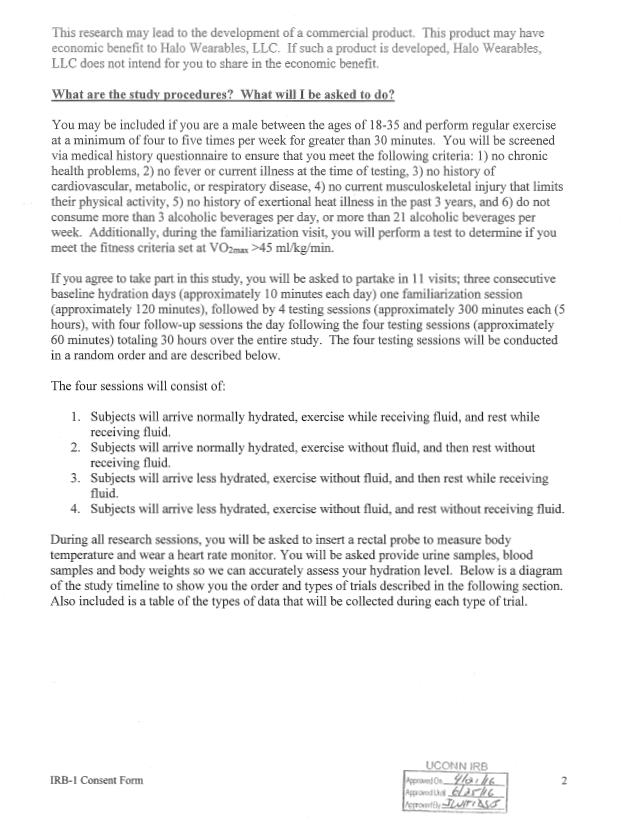
117 109
118 110
119 111
120 112
121 113
122 114
123 115
124 116
125 117
126 118

127 Appendix E. 119
Monday, 17 April 2017 BODY FLUID HOMEOSTASIS
 Monday, 17 April 2017 BODY FLUID HOMEOSTASIS Phenomenon: shipwrecked sailor on raft in ocean ("water, water everywhere but not a drop to drink") Why are the sailors thirsty? (What stimulated thirst?) Why
Chapter Nine. Temperature Regulation, Thirst, and Hunger
 Chapter Nine Temperature Regulation, Thirst, and Hunger Regulating Systems Homeostasis: Physiological equilibrium Epic FAIL with weight? Obesity rates 1980-2000 Motivation: Activating and directing behavior
Temperature, Regulation, Thirst, and Hunger
 PSYB64 Lecture 6 Temperature, Regulation, Thirst, and Hunger 1. Homeostasis 2. Temperature 3. Thirst 4. Hunger 5. Obesity & Hunger Disorders HOMEOSTASIS Homeostasis: Physiological equilibrium Motivation:
WOMEN ARE NOT SMALL MEN: SEX DIFFERENCES AND PERFORMANCE. Stacy T Sims, PhD
 WOMEN ARE NOT SMALL MEN: SEX DIFFERENCES AND PERFORMANCE Stacy T Sims, PhD OUTLINE Overview The Science: design and general assumptions The Menstrual Cycle: Fluid Balance Thermoregulation Metabolism: Fuel
H Y D R AT I O N Y O U A R E W H AT Y O U D R I N K
 E M P O W E R I N G I R I S H S P O RT H Y D R AT I O N Y O U A R E W H AT Y O U D R I N K 42 S P O RT F O R L I F E H Y D R AT I O N Y O U A R E W H AT Y O U D R I N K "There is no life without water"
Body fluids. Lecture 13:
 Lecture 13: Body fluids Body fluids are distributed in compartments: A. Intracellular compartment: inside the cells of the body (two thirds) B. Extracellular compartment: (one third) it is divided into
FLASH CARDS. Kalat s Book Chapter 10 Alphabetical
 FLASH CARDS www.biologicalpsych.com Kalat s Book Chapter 10 Alphabetical AgRP AgRP Agouti-related peptide; synthesized in hypothalamus. Acts as an appetite stimulator. Also decreases metabolism. aldosterone
Chapter 12. Ingestive Behavior
 Chapter 12 Ingestive Behavior Drinking a. fluid compartments b. osmometric thirst c. volumetric thirst Eating a. energy sources b. starting a meal c. stopping a meal d. eating disordersd Drinking a. fluid
Chapter 26 Fluid, Electrolyte, and Acid- Base Balance
 Chapter 26 Fluid, Electrolyte, and Acid- Base Balance 1 Body Water Content Infants: 73% or more water (low body fat, low bone mass) Adult males: ~60% water Adult females: ~50% water (higher fat content,
Professional Diploma in Sports Nutrition
 Professional Diploma in Sports Nutrition Module 1 Lesson 4: Hydration for Optimal Athletic Performance EQF Level 5 Professional Diploma Body Water & Electrolytes Largest component in body Approx. 45-70%
Fluids, Electrolytes and Hydration. Diana Heiman, MD Associate Professor, Family Medicine Residency Director East Tennessee State University
 Fluids, Electrolytes and Hydration Diana Heiman, MD Associate Professor, Family Medicine Residency Director East Tennessee State University Objectives Discuss optimum hydration and effects of dehydration
SODIUM INGESTION, THIRST AND DRINKING DURING ENDURANCE EXERCISE
 SSE #122 Sports Science Exchange (2014) Vol. 27, No. 122, 1-5 SODIUM INGESTION, THIRST AND DRINKING DURING ENDURANCE EXERCISE Nina S. Stachenfeld The John B. Pierce Laboratory Department of Obstetrics,
Exercise increases water loss
 Exercise increases water loss During normal breathing, water is added to inspired air to protect delicate respiratory cells from drying out. Increased breathing during exercise increase this loss Heat
Gatorade Heat Safety Package
 Gatorade Heat Safety Package 1. The Four Downs of Heat Safety 2. Tips to Hydrate and Fuel for the Football Season 3. Preventing Heat-Related Illnesses The 4 Downs of Heat Safety Know the plays of heat
Ingestive Behavior: Feeding & Weight Regulation. Hypovolemic vs. Osmotic Thirst
 Ingestive Behavior: Feeding & Weight Regulation 1 Hypovolemic Thirst Receptors, CNS, Responses Salt Appetite Digestive components Glucose Homeostasis: Insulin & Glucagon Diabetes Mellitus 1 & 2 CNS Hypothalamic
Chapter 12. Temperature Regulation
 Chapter 12 Temperature Regulation Temperature Regulation Body core temperature regulation Critical for: Cellular structures Metabolic pathways Too high Protein structure of cells destroyed Too low Slowed
HYDRATION IN THE PEDIATRIC ATHLETE DANIEL HARRINGTON, DO FAMILY MEDICINE CHIEF RESIDENT UNIVERSITY HOSPITALS ST. JOHN MEDICAL CENTER
 HYDRATION IN THE PEDIATRIC ATHLETE DANIEL HARRINGTON, DO FAMILY MEDICINE CHIEF RESIDENT UNIVERSITY HOSPITALS ST. JOHN MEDICAL CENTER GOALS FOR TODAY UNDERSTAND THE VARIABLES THAT MAKE HYDRATION RECOMMENDATIONS
Pathophysiology: Regulation of Water Intake and Excretion, Ghent 03/2013. Outline: Regulation of water intake and excretion
 Pathophysiology: Regulation of Water Intake and Excretion, Ghent 03/2013 Daniel G. Bichet, M.D. Université de Montréal Groupe des Protéines Membranaires; Service de néphrologie, Hôpital du Sacré- Cœur
INTRODUCTION: DEFINITION OF HEAT ILLNESS:
 Coastal Carolina University Athletic Training Department Policy and Procedure Manual Exertional Heat Illness Management Fluid Replacement/Rehydration Protocol Revised/Reviewed 3/2013 INTRODUCTION: The
Causes. 95 F An air temperature of 95 Fahrenheit is high risk regardless of the humidity. 85 F + 60% humidity
 HOT WEATHER SAFETY TIPS An important step in avoiding heat illness is adjusting practice or game length and intensity to the environmental conditions. Temperature and humidity combine to create conditions
FUEL YOUR COMPETITIVE SPIRIT NUTRITION AND HYDRATION GUIDELINES FOR SERIOUS ATHLETICS
 FUEL YOUR COMPETITIVE SPIRIT NUTRITION AND HYDRATION GUIDELINES FOR SERIOUS ATHLETICS ELEVATE YOUR ENERGY Carbohydrates Are King Just like automobiles, our bodies require energy to perform. Carbohydrates
Worksheet No. FA-1705A Page 1 of 7
 Worksheet No. FA-1705A Page 1 of 7 WORKSHEET for Evidence-Based Review of Science for First Aid Worksheet author(s) Susan W. Yeargin, PhD, ATC Date Submitted for review: Initial: 11/30/09 Clinical question.
Hector L Torres. USAT Coach Lv 2 USAC Coach Lv 2 USAS Coach USATF Coach MS Sports and Science. Monday, February 11, 13
 Hector L Torres USAT Coach Lv 2 USAC Coach Lv 2 USAS Coach USATF Coach MS Sports and Science Goals Understand the basic components of nutrition Understand the requirements of an athletes nutrition during
Effects of Hydration on Mental and Cognitive Processes in Children and Adults
 Effects of Hydration on Mental and Cognitive Processes in Children and Adults Matthew S. Ganio, Ph.D. Assistant Professor of Exercise Science Director, Human Performance Laboratory Department of Health,
Fluids and electrolytes
 Body Water Content Fluids and electrolytes Infants have low body fat, low bone mass, and are 73% or more water Total water content declines throughout life Healthy males are about 60% water; healthy females
CHAPTER 10: Diet and nutrition & effect on physical activity and performance Practice questions - text book pages
 QUESTIONS AND ANSWERS CHAPTER 10: Diet and nutrition & effect on physical activity and performance Practice questions - text book pages 144-145 1) Complex carbohydrates do not include: a. lipids. b. triglycerides.
BIPN100 F15 Human Physiology (Kristan) Lecture 18: Endocrine control of renal function. p. 1
 Lecture 18: Endocrine control of renal function. p. 1") BIPN100 F15 Human Physiology (Kristan) Lecture 18: Endocrine control of renal function. p. 1 Terms you should understand by the end of this section: diuresis, antidiuresis, osmoreceptors, atrial stretch
BIPN100 F15 Human Physiology (Kristan) Lecture 18: Endocrine control of renal function. p. 1 Terms you should understand by the end of this section: diuresis, antidiuresis, osmoreceptors, atrial stretch
FUEL YOUR COMPETITIVE SPIRIT NUTRITION & HYDRATION GUIDELINES FOR SERIOUS ATHLETES
 FUEL YOUR COMPETITIVE SPIRIT NUTRITION & HYDRATION GUIDELINES FOR SERIOUS ATHLETES E N H A N C E Y O U R H Y D R A T I O N Adequate hydration is imperative when you re physically active. Otherwise, you
The Urinary System 15PART B. PowerPoint Lecture Slide Presentation by Patty Bostwick-Taylor, Florence-Darlington Technical College
 PowerPoint Lecture Slide Presentation by Patty Bostwick-Taylor, Florence-Darlington Technical College The Urinary System 15PART B Ureters Slender tubes attaching the kidney to the bladder Continuous with
Fahed alkarmi. Bahaa najjar. Muhammad khatatbeh
 13 Fahed alkarmi Bahaa najjar Muhammad khatatbeh We have said before that we have a certain amount of water in our bodies, this amount is distributed as follows: 1- Two thirds (2/3) of that water is inside
Fluid and electrolyte balance, imbalance
 Fluid and electrolyte balance, imbalance Body fluid The fluids are distributed throughout the body in various compartments. Body fluid is composed primarily of water Water is the solvent in which all solutes
Food and Fluid Intake After Exercise
 Chapter 4 Food and Fluid Intake After Exercise When athletes finish a training session, nutrition is rarely the first thing on their minds. The intensity of the exercise often decreases appetite, so while
SPORTS MED Qu3 DP3 What role do preventative actions play in enhancing the wellbeing of the athlete?
 SPORTS MED Qu3 DP3 What role do preventative actions play in enhancing the wellbeing of the athlete? Welcome to the third critical question in Sports Medicine - Question 3 - Dot Point 3 Critical question
Regulation of Body Fluids: Na + and Water Linda Costanzo, Ph.D.
 Regulation of Body Fluids: Na + and Water Linda Costanzo, Ph.D. OBJECTIVES: After studying this lecture, the student should understand: 1. Why body sodium content determines ECF volume and the relationships
BIOL 2402 Fluid/Electrolyte Regulation
 Dr. Chris Doumen Collin County Community College BIOL 2402 Fluid/Electrolyte Regulation 1 Body Water Content On average, we are 50-60 % water For a 70 kg male = 40 liters water This water is divided into
Body Water Content Infants have low body fat, low bone mass, and are 73% or more water Total water content declines throughout life Healthy males are
 Fluid, Electrolyte, and Acid-Base Balance Body Water Content Infants have low body fat, low bone mass, and are 73% or more water Total water content declines throughout life Healthy males are about 60%
2012 Heat Safety Kit
 2012 Heat Safety Kit PREVENTING HEAT-RELATED ILLNESSES HEAT ILLNESS AND EMERGENCIES Heat-related illnesses have many factors but can be caused when an individual is subjected to extreme temperatures and
Blood Pressure Fox Chapter 14 part 2
 Vert Phys PCB3743 Blood Pressure Fox Chapter 14 part 2 T. Houpt, Ph.D. 1 Cardiac Output and Blood Pressure How to Measure Blood Pressure Contribution of vascular resistance to blood pressure Cardiovascular
Isotonic, Hypertonic, Hypotonic or Water
 24 Isotonic, Hypertonic, Hypotonic or Water Which sports drink is the best for athletes? Fluid Facts for Winners Why is fluid intake so important for runners? Fluid is a vital part of any athlete s diet
NUTRITION TIPS FROM COACH TONI
 NUTRITION TIPS FROM COACH TONI An Ironman 70.3 event is a serious challenge for every level of athleticism; even the professional athletes. The nutrition can be the main factor of a good or bad experience
Staying Hydrated in the Summer Heat. An Optimum Life Health Talk
 Staying Hydrated in the Summer Heat An Optimum Life Health Talk As Summer Temperatures Rise Stay Hydrated! The Importance of Water Other than oxygen, water is the most needed nutrient for life A person
Indiana Soccer Hot Weather Recommendations. In all cases, age group and competitive level must be taken into consideration.
 Indiana Soccer Hot Weather Recommendations In all cases, age group and competitive level must be taken into consideration. I. HEAT INDEX Heat Index can be described as what it feels like outside. By definition,
Renal physiology D.HAMMOUDI.MD
 Renal physiology D.HAMMOUDI.MD Functions Regulating blood ionic composition Regulating blood ph Regulating blood volume Regulating blood pressure Produce calcitrol and erythropoietin Regulating blood glucose
HYDRA10 & HYDRA+: hydration and rehydration
 HYDRA10 & HYDRA+: hydration and rehydration Introduction Fluid loss through sweating invariably leads to some degree of dehydration and this is a usual consequence of any type of exercise, whether short
Chapter 19 The Urinary System Fluid and Electrolyte Balance
 Chapter 19 The Urinary System Fluid and Electrolyte Balance Chapter Outline The Concept of Balance Water Balance Sodium Balance Potassium Balance Calcium Balance Interactions between Fluid and Electrolyte
THE IMPACT OF HYDRATION ON ATHLETIC PERFORMANCE
 THE IMPACT OF HYDRATION ON ATHLETIC PERFORMANCE RESEARCH FROM THE ACE SCIENTIFIC ADVISORY PANEL W. LARRY KENNEY, PH.D., FACSM Maintaining optimal hydration is essential during exercise, as both dehydration
Fluid, electrolyte, and acid-base balance
 Fluid, electrolyte, and acid-base balance Chapter 50 Ra'eda Almashaqba 1 Fluid, electrolyte, and acid-base balance About 46% to 60%of the average adult's weight is water, which is vital to health and normal
HEAT PRODUCTION HEAT DISSIPATION
 Heat Illness Shaylon Rettig, MD, MBA HEAT PRODUCTION Heat is a byproduct of the metabolic process Muscle contributes the largest amount of heat produced at rest Muscle work increases heat production Fever
Nutrition. Physiology. Israel. Physiology: Nutrition: Ayelet Weinstein, R.D. Itzik Weinstein, Ph.D.
 Fluid Balance Nutrition Physiology Ayelet Weinstein, R.D. Sports Medicine Center The Wingate Institute Israel Itzik Weinstein, Ph.D. Ohalo Academic College Tel-Hai Academic College Physiology: Fluid Balance,
Hydration Knowledge and Personal Assessment in Collegiate Male Soccer Athletes
 University of Connecticut DigitalCommons@UConn Honors Scholar Theses Honors Scholar Program Spring 5-1-2016 Hydration Knowledge and Personal Assessment in Collegiate Male Soccer Athletes Abigail T. Colburn
Extracellular fluid (ECF) compartment volume control
 compartment volume control") Water Balance Made Easier Joon K. Choi, DO. Extracellular fluid (ECF) compartment volume control Humans regulate ECF volume mainly by regulating body sodium content. Several major systems work together
Water Balance Made Easier Joon K. Choi, DO. Extracellular fluid (ECF) compartment volume control Humans regulate ECF volume mainly by regulating body sodium content. Several major systems work together
Fal Fal P h y s i o l o g y 6 1 1, S a n F r a n c i s c o S t a t e U n i v e r s i t y
 Fall 12 OSMOTIC REGULATION OF THE RENAL SYSTEM: Effects of fasting and ingestion of water, coke, or Gatorade on urine flow rate and specific gravity Dorette Franks The purpose of the physiology experiment
Body Water ANS 215 Physiology and Anatomy of Domesticated Animals
 Body Water ANS 215 Physiology and Anatomy of Domesticated Animals I. Body Water A. Water is the most abundant constituent comprising 60% of total body weight. 1. Solvent for many chemicals of the body
SCIENTIFIC DOSSIER ON: Hydration and Outcome in Older Patients admitted to hospital ( The HOOP prospective cohort study)
") SCIENTIFIC DOSSIER ON: Hydration and Outcome in Older Patients admitted to hospital ( The HOOP prospective cohort study) INDEX 1. Citation Hydration and outcome in older patients admitted to hospital (The
SCIENTIFIC DOSSIER ON: Hydration and Outcome in Older Patients admitted to hospital ( The HOOP prospective cohort study) INDEX 1. Citation Hydration and outcome in older patients admitted to hospital (The
Sports Science News: Preventing Exertional Heat Illness: A Consensus Statement
 Page 1 of 7 Print Article Sports Science News: Preventing Exertional Heat Illness: A Consensus Statement Douglas Casa, Ph.D., ATC, FACSM 01/20/2004 Last February, 20 sports medicine and exercise science
CHAPTER 27 LECTURE OUTLINE
 CHAPTER 27 LECTURE OUTLINE I. INTRODUCTION A. Body fluid refers to body water and its dissolved substances. B. Regulatory mechanisms insure homeostasis of body fluids since their malfunction may seriously
The effect of sodium and carbohydrate in a rehydration food on subsequent exercise performance
 Graduate Theses and Dissertations Graduate College 2008 The effect of sodium and carbohydrate in a rehydration food on subsequent exercise performance Huimin Yan Iowa State University Follow this and additional
BIOL 221 Chapter 26 Fluids & Electrolytes. 35 slides
 BIOL 221 Chapter 26 Fluids & Electrolytes 35 slides 1 Body Water Content Total Body Water is the percentage of a person s weight that is water. TBW can easily vary due to: gender males have higher TBW
Body Water Content Total Body Water is the percentage of a person s weight that is water. TBW can easily vary due to: gender
 BIOL 221 Chapter 26 Fluids & Electrolytes 35 slides 1 Body Water Content Total Body Water is the percentage of a person s weight that is water. TBW can easily vary due to: gender males have higher TBW
Blood pressure control Contin. Reflex Mechanisms. Dr. Hiwa Shafiq
 Blood pressure control Contin. Reflex Mechanisms Dr. Hiwa Shafiq 17-12-2018 A. Baroreceptor reflexes Baroreceptors (stretch receptors) located in the walls of several large systemic arteries( specially
For more information about how to cite these materials visit
 Author(s): Michael Heung, M.D., 2009 License: Unless otherwise noted, this material is made available under the terms of the Creative Commons Attribution Noncommercial Share Alike 3.0 License: http://creativecommons.org/licenses/by-nc-sa/3.0/
PRESYSTEMIC INFLUENCES ON THIRST, SALT APPETITE, AND VASOPRESSIN SECRETION IN THE HYPOVOLEMIC RAT. Carrie Alane Smith
 PRESYSTEMIC INFLUENCES ON THIRST, SALT APPETITE, AND VASOPRESSIN SECRETION IN THE HYPOVOLEMIC RAT by Carrie Alane Smith Bachelor of Science, University of Pittsburgh, 2002 Master of Science, University
Exercise associated muscle cramps & Delayed Onset Muscle Soreness
 Exercise associated muscle cramps & Delayed Onset Muscle Soreness Dr Rob Collins Sports Physician www.ilovesport.co.za Exercise Associated Muscle Cramps Definition Painful, spasmodic, involuntary contractions
Water (Dysnatremia) & Sodium (Dysvolemia) Disorders Ahmad Raed Tarakji, MD, MSPH, PGCertMedEd, FRCPC, FACP, FASN, FNKF, FISQua
 & Sodium (Dysvolemia) Disorders Ahmad Raed Tarakji, MD, MSPH, PGCertMedEd, FRCPC, FACP, FASN, FNKF, FISQua") Water (Dysnatremia) & Sodium (Dysvolemia) Disorders Ahmad Raed Tarakji, MD, MSPH, PGCertMedEd, FRCPC, FACP, FASN, FNKF, FISQua Assistant Professor Nephrology Unit, Department of Medicine College of Medicine,
Water (Dysnatremia) & Sodium (Dysvolemia) Disorders Ahmad Raed Tarakji, MD, MSPH, PGCertMedEd, FRCPC, FACP, FASN, FNKF, FISQua Assistant Professor Nephrology Unit, Department of Medicine College of Medicine,
CONCUSSION/HEAD INJURY AND HEAT ILLNESS GUIDELINES
 CONCUSSION/HEAD INJURY AND HEAT ILLNESS GUIDELINES WHAT IS A CONCUSSION? A concussion is a type of traumatic brain injury caused by a bump, blow, or jolt to the head, or by a blow to the body with the
CHAIN OF COMMAND: THE FOLLOWING CHAIN OF COMMAND WILL OCCUR:
 LEWISVILLE ISD COLD WEATHER POLICY Cold exposure can be uncomfortable, impair performance and even become life threatening. Conditions created by cold exposure include frostbite and hypothermia. Wind chill
2. Heat-Related Illness
 2. Heat-Related Illness Only fit and heat-acclimatized athletes can participate safely. TEMPERATURE ( F) 100 95 90 85 80 75 70 65 Heat sensitive and unacclimatized athletes may suffer. Little danger of
Νευροφυσιολογία και Αισθήσεις
 Biomedical Imaging & Applied Optics University of Cyprus Νευροφυσιολογία και Αισθήσεις Διάλεξη 16 Κίνητρα Συμπεριφοράς ή Υποκίνηση (Motivation) Introduction Types of behavior Unconscious reflexes Voluntary
TRAINING MANUAL FOLLOW O U R LEAD SONO HALF MARATHON RACE PREPARATION
 TRAINING MANUAL FOLLOW O U R LEAD SONO HALF MARATHON RACE PREPARATION E Q U I N O X TRAINING TIPS PACE TRAINING The three types of running workouts you will do throughout each week are base-pace runs,
DOWNLOAD OR READ : SYNDROME OF INAPPROPRIATE SECRETION OF ANTIDIURETIC HORMONE IN MALIGNANCY PDF EBOOK EPUB MOBI
 DOWNLOAD OR READ : SYNDROME OF INAPPROPRIATE SECRETION OF ANTIDIURETIC HORMONE IN MALIGNANCY PDF EBOOK EPUB MOBI Page 1 Page 2 syndrome of inappropriate secretion of antidiuretic hormone in malignancy
Glomerular Capillary Blood Pressure
 Glomerular Capillary Blood Pressure Fluid pressure exerted by blood within glomerular capillaries Depends on Contraction of the heart Resistance to blood flow offered by afferent and efferent arterioles
Renal-Related Questions
 Renal-Related Questions 1) List the major segments of the nephron and for each segment describe in a single sentence what happens to sodium there. (10 points). 2) a) Describe the handling by the nephron
Exercise Nutrition and Body Composition. Read Chapters 18 & 23
 Exercise Nutrition and Body Composition Read Chapters 18 & 23 Nutrients Six major nutrients three are fuels Carbohydrates Primary function Simple versus complex carbohydrates The glycemic index Glycemic
TRAINING FOR ENDURANCE RUNNING EVENTS. Dr. Joe I. Vigil
 TRAINING FOR ENDURANCE RUNNING EVENTS Dr. Joe I. Vigil You must believe and adhere to the principle of UNENDING IMPROVEMENT and the setting and achieving of even higher goals. The Biologic Law of Training
The Right Fluids and Foods
 The Right Fluids and Foods Handout 6-1 In addition to getting enough fluid, getting the right type of fluid is important. A rule of thumb is to try to drink 4 to 8 ounces (i.e., 1/2 to 1 cup) of cool water
Faculty version with model answers
 Faculty version with model answers Urinary Dilution & Concentration Bruce M. Koeppen, M.D., Ph.D. University of Connecticut Health Center 1. Increased urine output (polyuria) can result in a number of
Regulation of fluid and electrolytes balance
 Regulation of fluid and electrolytes balance Three Compartment Fluid Compartments Intracellular = Cytoplasmic (inside cells) Extracellular compartment is subdivided into Interstitial = Intercellular +
Athletes and coaches are well aware of the importance of training to improve their performance, a little less they know what the nutritional aspect
 Athletes and coaches are well aware of the importance of training to improve their performance, a little less they know what the nutritional aspect can be a fundamental part of the preparation of an athlete.
9/20/2010. Exercise Science: Theory: Hydration KEY POINTS. 1. Water is weird stuff. That s why it s so important.
 Exercise Science: Theory: Hydration Bob Murray, PhD, FACSM Founder & Principal, Sports Science Insights, LLC www.sportsscienceinsights.com bob@sportsscienceinsights.com 7 5 3 6 2 Boise State University
How do sports drinks work? It all started 42 years ago at Louisiana State University, when Bengal
 How do sports drinks work? It all started 42 years ago at Louisiana State University, when Bengal Punch was introduced as the first sports drink, followed seven years later by Gatorade. There s a great
Osmotic Regulation and the Urinary System. Chapter 50
 Osmotic Regulation and the Urinary System Chapter 50 Challenge Questions Indicate the areas of the nephron that the following hormones target, and describe when and how the hormones elicit their actions.
Giles Warrington and Dessie Dolan Fuelling Our Development: The Reality Behind Hydration and Nutrition
 Giles Warrington and Dessie Dolan Fuelling Our Development: The Reality Behind Hydration and Nutrition Determinants of Athletic Performance: 1. Genetics 2. Environment Training: Technical/Tactical/Physical/Mental
Fluid, Electrolyte, and Acid-Base Balance. Maintaining Water and Electrolyte Balance of Blood
 514 Essentials of Human Anatomy and Physiology Intracellular fluid volume = 25 L, 40% body weight Total body water volume = 40 L, 60% body weight Extracellular fluid (ECF) volume =15 L, 20% body weight
Chapter 15 Fluid and Acid-Base Balance
 Chapter 15 Fluid and Acid-Base Balance by Dr. Jay M. Templin Brooks/Cole - Thomson Learning Fluid Balance Water constitutes ~60% of body weight. All cells and tissues are surrounded by an aqueous environment.
U.S. Soccer Federation Services Page 1 of 5 Hydration and Heat Illness Guidelines
 U.S. Soccer Federation Services Page 1 of 5 Hydration and Heat Illness Guidelines Water: The Athlete s Most Important Nutrient Sources: ICSN, International Center for Sports Nutrition USOC, United States
8. URINE CONCENTRATION
 8. URINE CONCENTRATION The final concentration of the urine is very dependent on the amount of liquid ingested, the losses through respiration, faeces and skin, including sweating. When the intake far
Regulation of Body Temperature. Ass. Prof. Dr. ADEL AMRAN DEPARTMENT OF PHYSIOLOGY
 Regulation of Body Temperature Ass. Prof. Dr. ADEL AMRAN DEPARTMENT OF PHYSIOLOGY objectives heat gain heat loss discuss the mechanisms by which the body gains or loses heat in a variety of healthy or
Chapter 27: WATER, ELECTROLYTES, AND ACID-BASE BALANCE
 Chapter 27: WATER, ELECTROLYTES, AND ACID-BASE BALANCE I. RELATED TOPICS Integumentary system Cerebrospinal fluid Aqueous humor Digestive juices Feces Capillary dynamics Lymph circulation Edema Osmosis
1. 09/07/16 Ch 1: Intro to Human A & P 1
 Table of Contents # Date Title Page # 1. 09/07/16 Ch 1: Intro to Human A & P 1 2. 09/19/16 Ch 18: Water, Electrolyte, and Acid-Base Balance 5 i 1 09/19/16 Chapter 18: Water, Electrolyte, and Acid-Base
Gatorology: The science of hydration, electrolytes and sweat.
 Gatorology: The science of hydration, electrolytes and sweat. Jeff Zachwieja, Ph.D. Principal Scientist Gatorade Sports Science Institute Barrington, IL www.gssiweb.com What benefits should a sports drink
A day at the sauna. Boardworks Ltd How does the body react to change?
 1 of 40 2 of 40 A day at the sauna 3 of 40 How does the body react to change? Saving energy? 4 of 40 Sayid has decided to save energy by staying in bed all day. How much of his energy do you think this
ROWING PARTICIPATION IN HOT WEATHER POLICY
 ROWING QUEENSLAND INC ROWING PARTICIPATION IN HOT WEATHER POLICY ROWING QUEENSLAND INC REGATTA CANCELLATION POLICY Regardless of the population of rowing participants, rowing regattas may be postponed
BIPN100 F15 Human Physiology (Kristan) Problem Set #8 Solutions p. 1
 Problem Set #8 Solutions p. 1") BIPN100 F15 Human Physiology (Kristan) Problem Set #8 Solutions p. 1 1. a. Proximal tubule. b. Proximal tubule. c. Glomerular endothelial fenestrae, filtration slits between podocytes of Bowman's capsule.
BIPN100 F15 Human Physiology (Kristan) Problem Set #8 Solutions p. 1 1. a. Proximal tubule. b. Proximal tubule. c. Glomerular endothelial fenestrae, filtration slits between podocytes of Bowman's capsule.
Dehydration and Oral Rehydration Solutions
 Health Professional Training Guide Up to 75% less sugar and 4x more electrolytes vs. the leading sports drinks Wide range of innovate formats and great tasting flavors Lasts for 30 days in the refrigerator
Sleep and Performance: An Integrated Perspective
 Sleep and Performance: An Integrated Perspective Sleep Medical Considerations GETTING THE ATHLETE READY Nutrition Exercise and Conditioning Mental Preparation One Third of your Life Sleep: Using one third
Hyponatremia. Mis-named talk? Basic Pathophysiology
 Hyponatremia Great Lakes Hospital Medicine Symposium by Brian Wolfe, MD Assistant Professor of Internal Medicine University of Colorado Denver Mis-named talk? Why do we care about Hyponatremia? concentration
Carbohydrate Needs. Nutrition for Exercise. Your physical performance is greatly influenced. In this chapter you will learn about:
 11 Nutrition for Exercise In this chapter you will learn about: Dietary practices for enhancing endurance and strength performance. Your physical performance is greatly influenced by regular conditioning
Applications of Freezing Point Osmometry
 Applications of Freezing Point Osmometry Table of Contents Chapter 1 Introduction and Basic Principles 1 Chapter 2 Biological Applications 3 2.1 Range of, and reason for, abnormal serum values 5 2.2 Osmolality