Adipocyte Dynamics and Reversible Metabolic Syndrome in Mice with an Inducible Adipocyte- Specific Deletion of the Insulin Receptor
|
|
|
- Christine Jennings
- 6 years ago
- Views:
Transcription

1 Article Adipocyte Dynamics and Reversible Metabolic Syndrome in Mice with an Inducible Adipocyte- Specific Deletion of the Insulin Receptor Graphical Abstract Authors Masaji Sakaguchi, Shiho Fujisaka, Weikang Cai,..., Jiang Hu, Rohit N. Kulkarni, C. Ronald Kahn Correspondence In Brief Sakaguchi et al. show that insulin signaling is necessary for maintenance of white and brown adipocytes mice in adult mice. Adipose tissue loss is reversed by a marked increase in both white and brown preadipocyte proliferation, indicating the presence of an adipostatic sensor. Adipocyte regeneration is leptin independent. Highlights d Mature adipose tissue depends on insulin signaling for maintenance and survival d d d Acute loss of insulin signaling in fat results in a reversible metabolic syndrome Fat loss stimulates preadipocyte proliferation and regeneration of white/brown fat Inducible lipodystrophy stimulates rapid proliferation of pancreatic b cells Sakaguchi et al., 217, Cell Metabolism 25, February 7, 217 ª 216 Elsevier Inc.
2 Cell Metabolism Article Adipocyte Dynamics and Reversible Metabolic Syndrome in Mice with an Inducible Adipocyte- Specific Deletion of the Insulin Receptor Masaji Sakaguchi, 1 Shiho Fujisaka, 1 Weikang Cai, 1 Jonathon N. Winnay, 1 Masahiro Konishi, 1 Brian T. O Neill, 1,3 Mengyao Li, 1 Rubén García-Martín, 1 Hirokazu Takahashi, 1 Jiang Hu, 2 Rohit N. Kulkarni, 2 and C. Ronald Kahn 1,4, 1 Section of Integrative Physiology and Metabolism 2 Section of Islet Cell & Regenerative Biology Joslin Diabetes Center and Department of Medicine, Harvard Medical School, Boston, MA 2215, USA 3 Division of Endocrinology and Metabolism, Fraternal Order of Eagles Diabetes Research Center, University of Iowa Carver College of Medicine, Iowa City, IA 52242, USA 4 Lead Contact Correspondence: c.ronald.kahn@joslin.harvard.edu SUMMARY Insulin and IGF1 signaling are important for adipose tissue development and function; however, their role in mature adipocytes is unclear. Mice with a tamoxifen-inducible knockout of insulin and/or IGF1 receptors (IR/IGF1R) demonstrate a rapid loss of white and brown fat due to increased lipolysis and adipocyte apoptosis. This results in insulin resistance, glucose intolerance, hepatosteatosis, islet hyperplasia with hyperinsulinemia, and cold intolerance. This phenotype, however, resolves over 1 3 days due to a proliferation of preadipocytes and rapid regeneration of both brown and white adipocytes as identified by mtmg lineage tracing. This cycle can be repeated with a second round of receptor inactivation. Leptin administration prior to tamoxifen treatment blocks development of the metabolic syndrome without affecting adipocyte loss or regeneration. Thus, IR is critical in adipocyte maintenance, and this loss of adipose tissue stimulates regeneration of brown/white fat and reversal of metabolic syndrome associated with fat loss. INTRODUCTION Metabolic health depends on the maintenance of normal mass and function of adipose tissue. Accumulation of excess body fat, i.e., obesity, or pathological loss of adipose tissue, i.e., lipodystrophy, is associated with insulin resistance, glucose intolerance, fatty liver, and hyperlipidemia (Haslam and James, 25; Rosen and Spiegelman, 26; Mori et al., 214; Weiss et al., 24). These pathologies are the result of increased circulating free fatty acids (FFAs), changes in circulating adipokines, development of adipose tissue inflammation with increases in circulating cytokines, accumulation of fat in other tissues, and induction of stress kinases and ER stress in tissues throughout the body (Hotamisligil, 26). There are two major types of adipose tissue, which have different morphologies, differentiate from different progenitors, and serve unique functions (Seale et al., 28; Shinoda et al., 215; Tseng et al., 21; Xue et al., 215). White adipocytes are involved in energy storage and contain a large single-lipid droplet made up of triglycerides that can be released as fatty acids during fasting (Poher et al., 215). Brown adipocytes are involved in energy expenditure and thermogenesis. They contain multilocular lipid droplets and are rich in mitochondria expressing uncoupling protein-1 (UCP1) (Enerb ack et al., 1997). In adult animals, maintenance of normal white and brown adipose tissue (WAT and BAT) mass is the result of a balance of lipogenesis and lipolysis (Bouchard et al., 1993), and turnover of adipocytes is very slow (estimated at 1% per year in humans (Arner et al., 21). These new adipocytes are generated from specific precursors in each tissue (Rodeheffer et al., 28; Macotela et al., 212; Tang et al., 28). Increased generation of white adipocytes has been shown in obese humans (Arner et al., 211; Spalding et al., 28), in mice on a high-fat diet (Jeffery et al., 215; Macotela et al., 212; Vishvanath et al., 216; Wang et al., 213) and in response to an induction of apoptosis in adipose tissue following activation of the caspase system (Pajvani et al., 25). To what extent brown adipose tissue can regenerate or turnover is unknown. Insulin and insulin growth factor (IGF)-1 acting through their respective receptors are essential for the development and function of BAT and WAT (Bl uher et al., 22; Boucher et al., 212). Insulin is a major regulator of glucose uptake and lipid metabolism in mature adipocytes, and both insulin and IGF1 play important roles in the stimulation of adipocyte differentiation and preadipocyte survival (Boucher et al., 21). In previous studies, we and others have demonstrated the role of insulin/ IGF1-signaling in adipose tissues in vivo by the creation of mice with a stable inactivation of the insulin receptor (IR) and IGF1 receptor (IGF1R) genes in adipocytes using a transgene containing the Cre-recombinase driven by the ap2-promoter (Bl uheretal., 22; Boucheretal., 212). These studies revealed that a lifelong lack of insulin receptors severely impairs the development of both brown and white fat. However, these models, by their developmental nature, do not provide information regarding 448 Cell Metabolism 25, , February 7, 217 ª 216 Elsevier Inc.

3 A F G B H C I J K L D E M N Figure 1. Physiology of Mice with Acute Disruption of IR and/or IGF1R in Fat All data are from male mice 7 8 weeks of age on normal chow diet. Day is the day of the last tamoxifen dose. (A) Tissue weights of SC-WAT, PG-WAT, and BAT in control (n = 13), Ai-IGFRKO (IGF1R / ) (n = 6), Ai-IRKO (IR / ) (n = 13), and (IGF1R / IR / ) (n = 12) day 3 after treatment with tamoxifen. (B) Representative pictures of adipose tissue of control and at day 3. Scale bars, 1 cm. (C) H&E-stained sections of adipose tissue at day 3. Scale bars, 5 mm. (D) Blood glucose levels of control (n = 13) and (n = 14) under fed and fasted conditions at day 2. (E) Serum insulin and HOMA-IR levels of control (n = 13) and (n = 14) under fasting conditions at day 2. (legend continued on next page) Cell Metabolism 25, , February 7,
4 the involvement of insulin and IGF1 in regulation of mature adipocyte function or turnover. To address this fundamental question, we have now created mice with an inducible knockout of the IR and/or IGF1R in adipocytes (here designated Ai-IRKO, Ai-IGFRKO, and ) using a tamoxifen-inducible adiponectin-creer T2 to drive recombination (Sassmann et al., 21). We show that adult mice with a conditional knockout of IR or IR/IGF1R rapidly develop severe lipodystrophy, hepatosteatosis and systemic insulin resistance with marked hyperglycemia, hyperinsulinemia, b cell proliferation, decreased energy expenditure, and cold intolerance, demonstrating the critical role of IR in the maintenance of both BAT and WAT in the adult. This syndrome, however, is transient as adipose tissues rapidly regenerate due to a marked increase in proliferation of preadipocytes and differentiation of new cohorts of brown and white adipocytes. These data indicate the presence of an adipostatic sensor, which can increase adipose proliferation and differentiation in response to a loss of adipose tissue secondary to a loss of insulin signaling. While leptin replacement can block development of metabolic syndrome during the lipodystrophic phase, it does not affect the ability of adipocytes to regenerate. RESULTS Role of Insulin and IGF1 Receptors in Mature Adipocytes To investigate the roles of insulin and IGF1 in adipocytes in adulthood, we established mouse models in which IR and/or IGF1R were deleted specifically in adipose tissues in an inducible manner by crossing mice with floxed insulin and/or IGF1 receptor alleles (Boucher et al., 212) with mice carrying a tamoxifen-inducible Cre ER T2 transgene under control of the adiponectin promoter (AdipoqCreER T2 ) (Sassmann et al., 21). This transgene is 97% 99% effective in inducing gene recombination. mice, i.e., mice carrying floxed alleles, but not the Cre-transgene, were also given tamoxifen, since some studies have suggested that tamoxifen treatment can induce metabolic abnormalities (Hesselbarth et al., 215). However, under the conditions used here, the control mice showed no adverse effects of tamoxifen. When 8-week-old mice carrying floxed IR and IGF1R and the AdipoqCreER T2 transgene were treated with tamoxifen, the resultant mice exhibited a rapid, major loss of adipose tissue, with 59% 77% reductions in interscapular BAT and subcutaneous (SC), perigonadal (PG), and retroperitoneal (Ret) WAT depots as early as 3 days after the last tamoxifen injection (Figures 1A, 1B, S1A, and S1B). Knockout of IR alone (Ai-IRKO) produced a similar decrease in SC and PG-WAT mass, but a somewhat lesser reduction of BAT, whereas loss of IGF1R alone (Ai-IGFRKO) produced only a modest reduction of PG-WAT and no significant effect on SC-WAT or BAT (Figures 1A and S1A). Histologically, fat at day 3 revealed extensive losses of adipocytes in all depots and a relative increase in stromovascular cells in SC- and PG-WAT, without evidence of inflammation (Figure 1C). Similar but somewhat lesser effects were observed in Ai-IRKO, whereas in Ai-IGFRKO there was no loss of fat, and adipose tissue histology was normal (Figure S1C). Coincident with the loss of adipose tissue, within 3 days after treatment, developed a severe metabolic syndrome with average fasting blood glucoses of 235 mg/dl and fed glucoses >46 mg/dl (Figure 1D). This was associated with a 6.8-fold increase in serum insulin levels and a 12.4-fold increase in insulin resistance as measured by homeostasis model assessment of insulin resistance (HOMA-IR) (Figure 1E). Ai-IRKO also showed hyperglycemia, hyperinsulinemia, and insulin resistance, whereas Ai-IGFRKO and control mice treated with tamoxifen showed no changes in glucose or insulin levels (Figures S1D, S1E, and 1D). The lipodystrophy in Ai-IRKO and was also associated with severe glucose intolerance on oral GTT and marked resistance to exogenous insulin during an insulin tolerance test (ITT) (Figures 1F and 1G). Gene expression analysis of SC-WAT taken 3 days after tamoxifen administration showed marked reductions in adiponectin, leptin, FAS, ATGL, HSL, Glut4, PPARg, AP2, and CEBPa mrnas in (Figure 1H). There was also a 5-fold increase in UCP-1 mrna in SC-WAT, indicating some browning of SC- WAT (Figures 1H). BAT of, on the other hand, showed a reduction of UCP1 mrna, as well as reductions of AP2, Adrb3, ElpvI3, Cidea, PRDM16, Tfam, and PGC1a mrna when compared to control (Figure 1I). Consistent with these changes in mrna and the decrease in fat mass, serum levels of adiponectin and leptin were decreased by 73% and 93% in (Figure 1J). This loss of adipose mass was associated with a significant increase of basal lipolysis in as measured using explants of SC and PG-WAT, with no significant change of maximal isoprenaline-stimulated lipolysis (Figures 1K and S1H). In addition, both white and brown fat pads from mice showed increased apoptosis by both TUNEL and cleaved caspase-3 staining by day 3 after tamoxifen treatment (Figures 1L and S1I S1K). Interestingly, however, at this time point, Ai- DKO showed minimum evidence of inflammation in either adipose tissue depot and non-significant increases in serum levels of tumor necrosis factor a (TNF-a) and interleukin-6 (IL-6) (Figures S1L and S1M). Due to the rapid loss of BAT, showed a significant decrease of oxygen consumption rate (VO 2 )(Figure S1N). (F) Oral glucose tolerance test (OGTT) on day 2 for control (n = 13) and (n = 12). (G) ITT on day 2 (n = 1/genotype). (H) mrna expression measured by real-time qpcr in SC-WAT from control (n = 7) and (n = 6) at day 3. (I) mrna abundance measured by real-time qpcr in BAT from control (n = 7) and (n = 6) at day 3. (J) Serum adiponectin and leptin concentrations at day 2 (n = 5/genotype). (K) Lipolysis assessed by FFA release from SC-WAT of control (n = 5) and (n = 7) at day 1.5. Samples were incubated ex vivo for 2 hr at 37 C in the presence or absence of 1 mm isoprenaline, and FFA released into the medium was quantified. (L) SC-WAT sections from control and were stained for TUNEL and DAPI at day 3 (left) and quantitated (n = 6/genotype) (right). (M) Representative pictures of liver in control and at day 3. Scale bar, 1 cm. (N) Liver tissue sections stained with H&E in control and at day 3. Scale bars, 1 mm. Statistical significance is shown as p < 5, p < 1, and p < Cell Metabolism 25, , February 7, 217
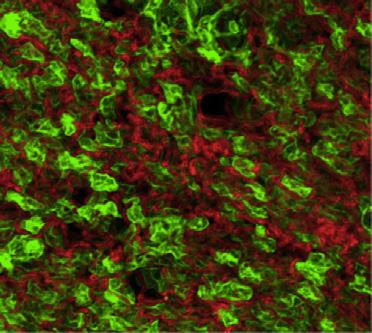
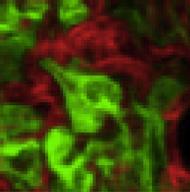
5 also developed acute hepatomegaly with a >5% increase in liver weight (Figures 1M and S1O). This was associated with a 5-fold increase of triglyceride (TG) content in the liver and histologically evidence of hepatosteatosis (Figures 1N and S1P). Interestingly, in contrast to other models of lipodystrophy, serum TG, FFA, and beta-hydroxybutyrate remained normal range at all points tested (Figures S1Q S1S). Ai-IRKO and Rapidly Recover from the Insulin- Resistant Lipodystrophic State Despite the marked insulin resistance and metabolic abnormalities (at day 3), by day 9 after tamoxifen blood glucose levels in had decreased from peak values by 5%, and they returned to normal by day 3 (Figure 2A). Glucose intolerance also returned to normal by day 3 (Figures 2B, S2A, and S2B), as did the HOMA-IR and the impaired ITTs (Figures 2C, 2D, and S2A S2D). Ai-IRKO mice recovered similarly (Figures 2A 2D and S2A S2D). All features of hepatosteatosis in Ai-IRKO and returned toward normal (Figures 2E, 2F, and S2E), as did expression of hepatic lipogenic and gluconeogenic genes, which were increased in Ai-IRKO and early in the time course (Figure S2F). Induction and Reversal of Pancreatic b Cell Proliferation in Lipodystrophic Mice Both acute and chronic insulin resistance, including the insulin resistance of lipodystrophy, have been associated with hyperinsulinemia and increased pancreatic b cell mass (Michael et al., 2). While insulin levels remained low in Ai-IGFRKO and control tamoxifen-treated mice, both and Ai-IRKO displayed a rapid development of hyperinsulinemia by day 3, which returned almost to control levels by day 3 (Figure 3A). and Ai-IRKO showed parallel changes in islet mass and b cell proliferation as identified by Ki67 staining. Indeed, there was an 11-fold increase of Ki67-positive b cells at day 3 (from.51% ±.1% to 5.76% ±.95%) (Figures 3B, 3C, S3A, and S3B) and a 2.2-fold increase in b cell mass compared to control (2.46 ±.41 mg versus 1.1 ±.12 mg, p < 1) (Figure 3D). By day 3, b cell replication measured by Ki67 had returned to normal levels (.62% ±.16%), and b cell mass had begun to decrease to a level not statistically greater than control (Figures 3B 3D and S3A). Similar results were observed in Ai-IRKO mice (Figure S3A). In expression of the putative b cell growth factor, ANGPTL8/betatrophin (Yi et al., 213) transiently increased in liver but decreased in adipose tissue, while expression of SerpinB1, another peptide shown to have b cell growth factor activity (El Ouaamari et al., 216), was significantly increased in both SC-WAT and BAT but not in liver. Recovery of WAT in Ai-IRKO and To determine whether adipose tissue contributes to the recovery of Ai-IRKO and mice from the insulin resistant state, we analyzed WAT at days 9 and 3 after tamoxifen (Figure 4A). In Ai- IRKO and, the weights of PG-WAT, which were reduced to 35.1% and 27.7% of control at day 9, increased to 95.5% and 89.4% of control levels by day 3. Similar effects were observed in SC-WAT (Figure 4A). Also by day 3, the WAT of Ai-IRKO and showed normal morphology, although there was 3% increase in mean cell diameter (Figures 4B, S4A, and S4B). To determine whether preadipocyte proliferation in Ai-IRKO and contributed to recovery of fat mass, we performed fluorescence-activated cell sorting (FACS) analysis of the stromovascular fractions (SVFs) from SC-WAT of control and KO mice on day 3 after tamoxifen treatment using the preadipocyte markers (Lin Sca1 + CD34 + ). This revealed a marked increase in the percentage of preadipocytes from 5.4% ±.98% to 34.4% ± 2.2% (p < 1) in and similar changes in Ai-IRKO, indicating that preadipocyte proliferation contributes, at least part, to the rapid recovery of adipose mass in these mice (Figures 4C and S4C). To further define the source of adipocyte regeneration, lineage tracing was performed by crossing Ai-IRKO and mice, as well as mice carrying the adiponectin-creer T2 transgene, with mice carrying the mtmg reporter. This reporter consists of tandemly aligned cdnas for membrane-targeted tomato-fluorescent protein (mtfp) and membrane-targeted green-fluorescent protein (mgfp) separated by a lox-stop-lox sequence driven by the ubiquitously expressed ROSA promoter (Muzumdar et al., 27) (Figure S4D). In the control adiponectincreer T2 :mtmg mice prior to tamoxifen treatment, the entire fat pad showed red fluorescence reflecting the ubiquitous expression of this transgene (Figure 4D, left). Within 3 days after tamoxifen, more than 95% of the adipocytes exhibited greenfluorescent staining, demonstrating the efficacy of tamoxifeninduced gene rearrangement (Figures 4D, S4E, and S4F). Like controls, Ai-IRKO-mTmG and -mtmg showed only red fluorescence in adipose tissues without tamoxifen treatment, confirming no leakage of Cre expression in these mice (Figure S4G). At day 3 after tamoxifen, control-mtmg mice carrying the Adipoq-Cre-ER T2 transgene continued to display green-labeled adipocytes in both SC- and PG-WAT, indicating that in mice on normal chow there was little adipocyte turnover in these depots over this 3-day period (Jeffery et al., 215). By contrast, at day 3, Ai-IRKO-mTmG showed only a few residual green-labeled adipocytes (all without significant lipid droplets) scattered in SC- and PG-WAT pads, whereas >9% of the lipid-containing adipocytes exhibiting red fluorescence, indicating that they were derived from preadipocytes not expressing adiponectin at the time of tamoxifen treatment. Similar findings were made in -mtmg with almost complete replacement of green adipocytes with red adipocytes in SC- and PG-WAT (Figures 4D and S4G). qpcr showed that the levels of FAS, ATGL, HSL, PPARg, AP2, adiponectin, and leptin mrna, which were low at day 9, had returned to normal at day 3 (Figure S4H). To determine the browning capacity of these WAT cells, were given the b3-adrenergic receptor agonist (CL-316,243; 1 mg/kg) or vehicle for 7 days intraperitoneally beginning 6 weeks after tamoxifen treatment. The regenerated SC-WAT and PG-WAT in male and female showed significantly lower stimulation of UCP1 expression in these tissues compared with controls (Figures 4E and S4I), indicating that the regenerated WAT had some decrease in the ability to undergo browning/beiging compared to controls. Regeneration of BAT in Mice Regeneration of BAT in occurred at a slower rate compared to WAT (Figure 5A). At day 9, the weight of BAT was Cell Metabolism 25, , February 7,
 Ai-IRKO (IR -/- ) (IGF1R -/- /IR -/-")
 5 4 3 2 1 FindIGKO Ai-IGFRKO FindIRKO Ai-IRKO FindIGIRKO")

 F Liver (g) 12 1 8 6 4 2 2. 1.5 1.")


 Fed glucose levels in control (n = 17), Ai-IGFRKO (n = 12),")
 HOMA-IR levels at days 3, 3, 13, and 3 of the experiment.")
 ITT at days 2 and 3.")

6 A Blood glucose (mg/dl) Tamoxifen: (1 mg/kg) IP 5 times ## # ### ### ### Ai-IGFRKO(IGF1R -/- ) Ai-IRKO (IR -/- ) (IGF1R -/- /IR -/- ) Days after treatment of tamoxifen ## B GTT AUC (mg/dl/min) FindIGKO Ai-IGFRKO FindIRKO Ai-IRKO FindIGIRKO Day 2 2 Day 3 3 C Tamoxifen: (1 mg/kg) IP 5 times HOMA-IR Day 3 Liver Day 3 Liver Ai-IGFRKO Ai-IRKO Days after treatment of tamoxifen E Ai-IGKO Ai-IRKO D ITT Blood glucose decrease AUC (%/ of ) F Liver (g) Day 2 2 Day 3 3 Day 9 Day 3 Figure 2. Recovery from Insulin Resistance and Glucose Intolerance in Mice after Tamoxifen Treatment Tamoxifen was administered five times over 6 days as indicated by arrows. The day of final injection was considered experimental day. (A) Fed glucose levels in control (n = 17), Ai-IGFRKO (n = 12), Ai-IRKO (n = 12), and (n = 14) before and after tamoxifen treatment. (B) HOMA-IR levels at days 3, 3, 13, and 3 of the experiment. (C) Comparison of GTT at days 2 and 3 after tamoxifen treatment. (D) ITT at days 2 and 3. (E) Liver tissue sections stained with oil red O for control, Ai-IRKO, Ai-IGFRKO, and at days 3 and 3. Scale bars, 1 mm. (F) Liver weights in control (gray, n = 6) and (red, n = 6) at days 9 and 3. Statistical significance is indicated as p < 5, p < 1, p < 1, and, not significant. 452 Cell Metabolism 25, , February 7, 217
 Day3 3 Day3 3 Day3 3 Day3 3 Day3 3 Day9 9 Day3 3 Day9 9 ANGPTL8 SerpinB1 /Betatrophin E 2.5 2. 1.5 1..5 F Adipose mrna (fold change) 2.")
 Fasting serum insulin measured at days 3, 3, 13, and 3 of the")
 Quantification of Ki67 + insulin + cells in control (n = 4 7) and (n = 4 6) pancreas sections at days 3 and 3.")
 mrna abundance measured by real-time qpcr in liver from control (n = 7) and (n = 6) at days 3 and 9.")
7 A Insulin (ng/ml) Days after treatment of tamoxifen Ai-IGFRKO Ai-IRKO B Day 3 Day 3 Ins Ki67 DAPI C % Ki67 + / -cells D -cell mass (mg) Liver mrna (fold change) Day3 3 Day3 3 Day3 3 Day3 3 Day3 3 Day9 9 Day3 3 Day9 9 ANGPTL8 SerpinB1 /Betatrophin E F Adipose mrna (fold change) Day 3 Day 9 Day 3 Day 9 Day 3 Day 9 Day 3 Day 9 Day 3 Day 9 Day 3 Day 9 SC PG BAT SC PG BAT ANGPTL8/Betatrophin SerpinB1 Figure 3. Effect of the Insulin Resistance of Acquired Lipodystrophy on b Cell Replication, Mass, and Function (A) Fasting serum insulin measured at days 3, 3, 13, and 3 of the experiment. (B) Pancreatic sections were immunostained for insulin and Ki67 in control and at days 3 and 3 after tamoxifen treatment. Scale bars, 1 mm. (C) Quantification of Ki67 + insulin + cells in control (n = 4 7) and (n = 4 6) pancreas sections at days 3 and 3. (D) Quantitation of b cell mass at days 3 and 3 (see Supplemental Experimental Procedures). (E) mrna abundance measured by real-time qpcr in liver from control (n = 7) and (n = 6) at days 3 and 9. (F) Expression levels of mrna measured by real-time PCR in SC, PG, and BAT from control and at days 3 and 9 (n = 5 7 per group). Statistical significance is as in Figure 2. Cell Metabolism 25, , February 7,
 reduced to 18% of controls, and this increased to only 37.")
.")
, and in controls this fraction")
.")

 SC and PG-WAT sections with H&E in control and at day 3. Scale bars, 5 mm. (C) FACS profiles of sorted subcutaneous adipose SVF at day 3 from control (n = 11), Ai-IRKO (n = 9), and (n = 6).")

8 A SC PG C Sca1 Tissue weight (g) Day Day Ai-IRKO CD Ai-IRKO E SC PG 2.3 UCP1 (Relative of ) CL-316, Lin - Sca1 + CD34 + (%) reduced to 18% of controls, and this increased to only 37.3% of controls by day 3, but did return to control levels by day 18. Histologically, during this recovery period, the BAT contained both multilocular fat cells, typical of BAT, and large unilocular fat cells, resembling WAT (Figure 5B). Lineage tracing demonstrated that generation of both the multilocular and unilocular BAT involved differentiation of new fat cells (Figure 5C). Thus, before treatment with tamoxifen, all BAT cells were red, but at day 3 after tamoxifen, more than 95% of control-mtmg brown adipocytes were green (Figure S5A), and in controls this fraction remained constant for 12 days, indicating effective gene recombination in BAT and little turnover of brown adipocytes in controls over this time period (Figures S5B and S5C). BAT in mice mostly converted to green by day 3 after tamoxifen, but, by day 3, the majority of both the unilocular and multilocular fat cells exhibited red fluorescence (Figures 5C and S5B). This replacement by new cells became even more prominent at days 6, 9, and 12 (Figure S5B), indicating nearly complete regeneration of brown adipocytes in. As in WAT, during B 454 Cell Metabolism 25, , February 7, 217 SC PG D SC PG Before Day 3 mtmg Ai-IRKO mtmg mtmg mtmg Figure 4. Regeneration of WAT in Ai-IRKO and (A) Recovery of tissue weights of SC and PG-WAT in Ai-IRKO (n = 6 7) and (n = 6) at days 9 3 after tamoxifen treatment compared to control (n = 6). (B) SC and PG-WAT sections with H&E in control and at day 3. Scale bars, 5 mm. (C) FACS profiles of sorted subcutaneous adipose SVF at day 3 from control (n = 11), Ai-IRKO (n = 9), and (n = 6). The live cells of the lineagenegative (Lin ) population, i.e., lacking of CD31, CD45, and Ter119 expression, were considered preadipocyte on the basis of positive Sca1 and CD34 expression. Representative data are indicated as the FACS profiles, and the averages are shown in the right graph. (D) mtmg labeling of mature SC and PG adipocytes in control, Ai-IRKO, and before and on day 3 after tamoxifen treatment. Scale bars, 1 mm. (E) qpcr of Ucp1 gene expression in SC (left) and PG-WAT (right) from control and male mice treated with CL-316,243 (1 mg/kg) or vehicle for 7 days (n = 5 7 per group). Results are expressed as fold change over the control SC (vehicle) group. Statistical significance is as in Figure 2. the early phase of recovery, there was an 4-fold increase in the percentage of preadipocytes of BAT in as assessed by FACS analysis (3.17% ±.36% versus 13.4% ± 3.46%) (Figure 5D). By day 18, expression of FAS, ATGL, Glut4, UCP1, AP2, Cidea, and Adrb3 returned to normal BAT levels, with low levels of the beige fat markers Tmem26 and Shox2 (Figure S5D) and low levels of leptin mrna (Figure 5E), i.e., reflecting the molecular signature of classical brown adipocyte markers. Most of the multilocular and unilocular cells were positive for UCP-1 protein (Figure 5F). By contrast, the regenerated SC- and PG-WAT showed a homogeneous population with no UCP1 + adipocytes (Figure S5E). Both thoracic and abdominal perivascular adipose tissue also regenerated during the recovery from lipodystrophy. UCP1 staining indicated that the regenerated thoracic perivascular adipose tissue more closely resembled brown fat, whereas the regenerated abdominal perivascular fat resembled subcutaneous and perigonadal WAT (Figures S5F and S5G). Sensitivity to cold exposure paralleled these changes in BAT (Figure 5G). At day 9, when BAT mass and UCP1 expression were low, were highly sensitive to cold exposure (8 C) with a decrease in body temperature to 2 C with 3 hr. By day 9, however, had recovered near normal temperature homeostasis, indicating significant function of the regenerated BAT (Figure 5G). Thermal imaging also demonstrated low body temperature over the interscapular region at day 9, which returned to normal by day 9, consistent with the presence of functional BAT (Figure 5H). This recovery potential was also confirmed by examining whole animal oxygen consumption


 2 mrna")
 Lin- Sca1+CD34+")


")


 H&E staining of")

 mtmg lineage")


 Percentage of")
9 BAT (g) Day 3 Day Day 9 B.12 A Day 3 Day 18 Day99 Day Day3 Day18 C Day 3 F Day 3 mtmg E G Day 9 Day 3 H Day FAS Glut4 UCP1 AP2 Cidea Adrb3Leptin Day 9 4 Day 18 Body temp. ( ) 2 mrna expression (Relative of ) Lin- Sca1+CD34+ (%) D UCP1 mtmg Before 4 Day FindIGIRKO 1 min Day 9 Figure 5. Brown Adipocyte Regeneration in (A) Recovery of tissue weights of BAT in (n = 5 6) male mice at days 9, 3, and 18 after tamoxifen treatment compared to control (n = 6 8). (B) H&E staining of BAT sections on days 9, 3, and 18. Scale bars, 5 mm. (C) mtmg lineage tracing of brown adipocytes in BAT of control and also carrying a Rosa- mtmg transgene as in Figure S3C before and on days 3 and 3 after tamoxifen treatment. Scale bars, 5 mm. (D) Percentage of Sca1+/CD34+ preadipocytes cells in brown adipose (Lin ) SVF at day 3 in control (n = 1) and (n = 6). (E) Relative mrna levels in (n = 5 6) and control (n = 6 7) on days 9, 3, and 18 after tamoxifen treatment. (legend continued on next page) Cell Metabolism 25, , February 7,
10 rate (VO 2 ) in metabolic cages which were initially decreased (Figure S1M) and returned to normal levels in 6 weeks after tamoxifen treatment (Figure S5H). At this time, both control and DKO mice also showed a significant increase in oxygen consumption after stimulation with b3-adrenergic receptor agonist CL-316,243 (Figure S5H). Regeneration Potential of White and Brown Adipocytes Is Preserved after Repeated Episodes of Lipodystrophy To examine the potential of continuing adipocyte regeneration, mice which had recovered from the initial round of conditional gene inactivation were re-treated with tamoxifen at day 3. Following the second round of tamoxifen, both Ai-IRKO and again rapidly developed lipodystrophy with insulin resistance, marked hyperglycemia, and hepatosteatosis similar to that observed after the first round of tamoxifen treatment (Figures 6A, 6B, and S6A S6D). These mice again recovered by day 55 to day 65, i.e., 15 2 days after the second round of tamoxifen (Figures 6A, 6B, and S6A S6D). This second insulin resistance was associated with a second round of increased pancreatic b cell proliferation and increased islet mass at day 41 (i.e., 6 days after the second treatment). Again b cell replication reverted toward normal by day 65 (3 days after the second round of tamoxifen), although at this time total islet mass remained increased (6.34 ±.48 mg versus 1.8 ±.24 mg, p < 1) (Figures 6C 6E). This recovery was accompanied by a second round of regeneration of WAT and BAT. Thus, 3 days after the second round of tamoxifen treatment (day 65), the WAT adipose depots showed relatively normal morphology, although the average diameter of the adipocytes was again increased. Again, BAT consisted of a mixture of multilocular and unilocular adipocytes. Expression of UCP-1 and ability to maintain body temperature when exposed to cold improved by day 65, but were still below normal; however, this further normalized by day 155 (12 days after the second tamoxifen treatment) (Figures 6F 6J and S6D S6G). Leptin mrna levels in BAT, which had increased acutely following knockout of the IR/IGF1R, returned to normal by day 155. Leptin Blocks Hyperglycemia and Hepatic Steatosis in without Affecting Adipocyte Regeneration Like other lipodystrophy models, showed the decrease of circulating leptin levels with rapid loss of both WAT and BAT (Figure 1J). Since leptin has been shown to improve hyperglycemia and metabolic syndrome in some animal models and humans with lipodystrophy (Coppari and Bjørbæk, 212; Wang et al., 21), we examined the effect of continuous leptin administration on development of the acute lipodystrophy and insulin resistance in (Figure S7A). Leptin almost completely prevented the development of fed and fasted hyperglycemia and hyperinsulinemia compared with controls (Figures 7A, 7B, and S7B). This was associated with a marked reduction in the severity of insulin resistance as calculated from the HOMO-IR (Figure S7C). Leptin also caused 25% reduction in food intake (Figure S7D) and prevented the hepatomegaly and fatty liver (Figures 7C and S7E). However, leptin did not prevent fat loss or affect the mass of WAT and BAT (Figure 7D). Interestingly, even with long-term (4 weeks) leptin treatment, which inhibited the entire cycle of hyperglycemia and hyperinsulinemia (Figure S7F), both white and brown adipocytes regeneration occurred resulting in replacement of cells by new red-labeled fat cells as monitored with mtmg lineage tracing (Figure 7E). These new adipocytes in receiving leptin exhibited normal perilipin staining (Figures 7F and S7G); however, total WAT and BAT mass was reduced in these leptin-treated mice compared with that of saline-treated controls reflecting the decreased food intake (Figures 7G and S7D). The lack of leptin effect on adipocyte turnover in vivo was confirmed by in vitro studies that demonstrated that leptin treatment at concentrations up to 2 nm had minimal effect on the proliferation or differentiation of primary brown or white preadipocytes (Figures S7H S7L). DISCUSSION Insulin and IGF1 receptors are present on preadipocytes and adipocytes, and play important roles in proliferation, differentiation, and metabolic function of these cells (Boucher et al., 21; Tseng et al., 22). In this study, using an inducible Cre to knock out the IR and/or IGF1R, we show that loss of IR (with or without loss of IGFR1R) in mature adipocytes results in a rapid loss of adipose tissue mass. This appears to be due to a rapid development of unrestrained lipolysis and a more gradual development of an apoptotic process as demonstrated by both increased TUNEL and cleaved caspase-3 staining. This results in development of an acute state of systemic insulin resistance with hyperglycemia, hyperinsulinemia, islet hyperplasia, hepatosteatosis, and cold intolerance (summarized in Figure S7M). Interestingly, this occurs without any evidence of inflammation in the adipose tissue and without any measurable increase in serum TG and FFA typically observed in chronic states of lipodystrophy both in mice and humans (Ficarella et al., 215; Mori et al., 214; Patni and Garg, 215), suggesting that any released FFA and TG are rapidly taken up by other tissues such as liver. Although some reports have suggested that tamoxifen itself may induce insulin resistance (Hesselbarth et al., 215), under the conditions of our study there was no evidence of any metabolic change in control mice, all of which received tamoxifen. In this form of acute insulin resistance, there is also a rapid induction of b cell proliferation. Pancreatic b cells normally replicate at an extremely low rate in adult mice (Teta et al., 27), but this can be increased in response to pathophysiological stresses such as gestation (Parsons et al., 1992), hyperglycemia (Alonso et al., 27), and insulin resistance (Kulkarni et al., 24). Several previous studies have shown that b cell hyperplasia in insulin resistant states is due to an increase in one or more circulating islet growth factors (Flier et al., 21; Saxena et al., 21). (F) UCP1 expression in BAT assessed by anti-ucp1 immunostaining in control and at day 18. (G) Rectal temperature in control and at days 9 and 9 during a 3 hr exposure to an 8 C environment (n = 5 per group). (H) Thermal images using a FLIR T3 Infrared Camera showing surface temperature over interscapular BAT after 2 hr at 8 C between control and on days 9 and 9. Statistical significance is as in Figure Cell Metabolism 25, , February 7, 217

 A Day 4 Day 65 Ai-IRKO Ins Ki67 DAPI E F 8. 2. 1.")


 Fed blood")
, Ai-IRKO (n = 6), and (n = 5).")
.")
 Pancreatic sections from control and were stained for")

 and (n = 7) pancreas at days 41 and 65 after tamoxifen")
11 B Ai-IRKO FindIRKO FindIGIRKO Day after tamoxifen 55 Day Day 41 C 2nd Tamoxifen Fed blood glucose (mg/dl) 1st Tamoxifen Insulin (ng/ml) A Day 4 Day 65 Ai-IRKO Ins Ki67 DAPI E F Day G Day 65 -cell mass (mg) 2. Day 41 Day 65 Day 41 Day 65 Day 155 Day 65 Day 41 I Body temp. ( ) Day 41 Day 65 Day 155 Day 41 2nd Tamoxifen Day Day Day 65 J J Day 3 H 1.2 Day Day 155 % Ki67+/ -cells 4. UCP1 (Relative of ) D 2 UCP1 DAPI Figure 6. Regeneration Potential of WAT and BAT after Two Rounds of Tamoxifen Treatment, with the Second Round Given Five Times over 6 days between Days 3 and 35 (A) Fed blood glucose levels after first and second rounds of tamoxifen in control (n = 9), Ai-IRKO (n = 6), and (n = 5). (B) Serum insulin was measured in Ai-IRKO and at days 4 and 65 compared with control (n = 5 7 per group). p < 5; p < 1. (C) Pancreatic sections from control and were stained for insulin and Ki67 at days 41 and 65 after tamoxifen treatment. Scale bars, 1 mm. (D) Quantitation of Ki67+insulin+ cells in control (n = 5 7) and (n = 7) pancreas at days 41 and 65 after tamoxifen treatment. (E) Quantitation of b cell mass in control (n = 4 7) and (n = 4 7) pancreases at days 41 and 65. (legend continued on next page) Cell Metabolism 25, , February 7,
12 Potential growth factors include insulin (Kulkarni et al., 1999), placental lactogen (Parsons et al., 1992), prolactin (Brelje et al., 1994), and ANGPTL8/betatrophin (Yi et al., 213) and serpinb1 (El Ouaamari et al., 216), as well as hyperglycemia itself (Leahy et al., 1986). Our data demonstrate transient increases in expression of ANGPTL8/betatrophin in liver and serpinb1 in adipose tissue following induction of gene recombination; to what extent these contribute to the increase in b cell proliferation remains to be determined. While both Ai-IRKO and mice show a rapid onset of the metabolic syndrome associated with lipodystrophy, both also show a surprisingly rapid recovery, beginning within 1 days after tamoxifen treatment. By day 3, there is an almost complete normalization of glucose and insulin levels, reduction of hepatosteatosis, and reversal of cold intolerance. This recovery is associated with a regeneration of both white and brown adipose tissue. The regenerated WAT displayed normal histology and gene expression, although its ability to undergo beiging when stimulated with the b3-adrenergic agonists was decreased. BAT, on the other hand, recovered to near normal tissue weight and UCP1 expression, although the regenerated BAT, especially early in recovery, showed altered morphology, containing cells with both multilocular and unilocular fat droplets, resembling human BAT rather than typical interscapular murine BAT. Both the multilocular and unilocular cells stained positively for UCP-1 indicating that they were brown or beige adipocytes. A second round of deletion of IR/IGF1R in the regenerated adipose tissue induced by a second round of tamoxifen treatment produced an almost identical metabolic and histological response, confirming the plasticity of adipose tissue and the cellular and molecular changes in regeneration of brown and white adipocytes. Both FACS analysis and mtmg-lineage tracing show that the recovery of WAT and BAT in mice is due to increased proliferation of preadipocytes and increased differentiation of these cells into adipocytes. Thus, in control mice only about 5% 7% of cells in the SVF labeled with markers of preadipocytes, and mtmg showed almost no turnover of adipocytes in either WAT or BAT over 3 days, consistent with the other studies showing a low turnover rate of adipocytes in mice on a normal diet (Jeffery et al., 215; Wang et al., 213). Turnover of human adipocytes in adults is also slow, estimated at 1% per year (Arner et al., 21; Spalding et al., 28). By contrast, within 3 days after induction of gene recombination, and Ai-IRKO have a remarkable 5- to 1-fold increase in the percentage of preadipocytes, followed by a rapid differentiation and regeneration of fat tissues, with almost 1% of the lipid-storing cells being derived from cells that did not express adiponectin at the time of the initial tamoxifen treatment. A similar regeneration of WAT has been observed when WAT is ablated by activation of caspase 8 (Pajvani et al., 25). However, in the latter there is marked adipose tissue inflammation, which is not observed in the or Ai-IRKO mice. In the and Ai-IRKO mice, recovery of the subcutaneous and visceral WAT preceded recovery of BAT, and this coincided with the recovery from the dysmetabolic state. The marked proliferation of white preadipocytes and associated adipogenesis is much greater that observed in response to high-fat diet (Jeffery et al., 215; Macotela et al., 212), demonstrating a strong homeostatic mechanism to restore white fat mass after loss due to IR gene inactivation. An important finding of the current study is that a similar homeostatic mechanism also occurs in BAT with a large increase in preadipocytes and a new round of differentiation indicating the plasticity of this adipose depot as well. Whether this homeostatic mechanism is the result of secretion of an adipotrophic factor or loss of an adipostatic factor remains to be determined (Figure S7M), but the results clearly demonstrate a potent checkpoint in adipose biology, which attempts to restore both white and brown adipose mass to normal levels. In mice, regeneration of brown, UCP1-expressing adipocytes occurs almost exclusively in the interscapular region, the site of classical brown fat (Gesta et al., 27). Whether these are derived from a Myf-5-positive lineage like classical brown adipocytes (Harms and Seale, 213) remains to be determined, but the regenerated interscapular BAT shows a heterogeneous cell population with both multilocular and unilocular cells, similar to human cervical BAT (Cypess et al., 213). The regenerated WAT, on the other hand shows a homogeneous population of unilocular cells without any apparent beige-like adipocytes and a low level of UCP-1 compared with BAT. Gene expression analysis of the recovered interscapular BAT shows the molecular signature of classical brown adipocyte markers, with no increase in the beige fat markers, Tmem26 and Shox2 (Jespersen et al., 213; Sharp et al., 212; Wu et al., 212). Whether the heterogeneity of the brown adipocytes during recovery represents some alteration in the maturation of brown adipocytes in this rapid turnover state or represents a developmental difference is unclear, but it is clear that, after recovery, the new BAT is functional for normal thermogenesis. Leptin is produced by adipose tissue and regulates food intake and systemic metabolism by acting primarily on leptin receptors of the central nervous system (Coppari and Bjørbæk, 212). Remarkably, leptin administration almost completely suppressed the development of hepatosteatosis, hyperglycemia, hyperinsulinemia, and hyperphagia in. Leptin, however, did not cause any change in the loss or regeneration of white and brown adipocytes occurring in mouse, indicating that adipose tissue regeneration is regulated by factor(s) other than hyperinsulinemia, hyperglycemia, leptin, and food intake. In summary, mature adipocytes are highly dependent on insulin signaling for maintenance, as well as function. Loss of insulin signaling results in acute lipodystrophy with loss of virtually all existing mature adipocytes and severe systemic insulin resistance with its associated metabolic features. Our data show (F) H&E sections of SC-WAT from control and mice at days 41 and 65. Scale bars, 5 mm. (G) Relative UCP1 mrna levels in (n = 4 6) and controls (n = 4 1) at days 41, 65, and 155. (H) H&E sections of BAT from control and at days 41, 65, and 155. Scale bars, 5 mm. (I) UCP1 expression in BAT by anti-ucp1 immunostaining in control and at days 3, 41, 65, and 155. Scale bars, 5 mm. (J) Rectal temperature in male control and taken every 3 min for 3 hr during exposure to an 8 C environment (n = 5 per group) at days 44, 65, and 125. Comparison of rectal temperature drop after 3 hr of 4 C challenge in control and (right). Statistical significance is as in Figure Cell Metabolism 25, , February 7, 217
 Blood glucose (mg/dl) Ai-IRKO 5 Saline 1st Tamoxifen A - + - + - + Td-tomato GFP DAPI G F Day 3 SC Day 9 BAT Day 3 BAT H Saline Day 9 SC.")
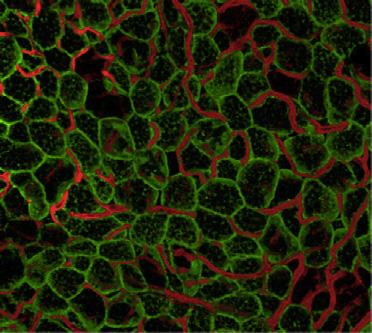
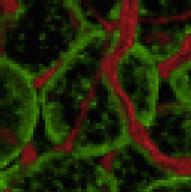
13 B C 6. 6 Saline Leptin Leptin Ai-IRKO Leptin Days D E.1 Saline Leptin Leptin Leptin SC.2.15 Saline mtmg 8 BAT (g) SC (g).25 mtmg Bat.3 Leptin Ai-IRKO Insulin (ng/ml) Blood glucose (mg/dl) Ai-IRKO 5 Saline 1st Tamoxifen A Td-tomato GFP DAPI G F Day 3 SC Day 9 BAT Day 3 BAT H Saline Day 9 SC.5 SC (g).4 Leptin.3 Perilipin DAPI Leptin BAT (g) Figure 7. Leptin Inhibits the Hyperglycemia and Hepatic Steatosis but Not the Regeneration of White and Brown Adipocytes in (A) Effect of leptin treatment on hyperglycemia induced by gene recombination in Ai-IRKO and compared to controls (n = 5 7 per group). Leptin (1 mg/day) was administered using Alzet 12 minipumps between day 3 and day 9 surrounding tamoxifen treatment. (B) Fasted serum insulin concentrations at day 3 after tamoxifen treatment with or without leptin (n = 5 7 per group). (C) Liver sections stained with oil red O for control, Ai-IRKO, and with saline or leptin at day 3. Scale bars, 1 mm. (D) Weights of SC and BAT fat at day 9 in Ai-IRKO (saline: n = 6, leptin: n = 5), (saline: n = 7, leptin: n = 6), and control (saline: n = 9, leptin: n = 7). (E) Immunofluorescence staining for GFP (green), Td-tomato (red) and DAPI (blue) in SC-WAT and BAT from control mtmg and mtmg, as indicated, at day 3. Scale bars, 5 mm. (F) Perilipin (green) staining of SC and BAT in (with saline or leptin) at days 9 and 3. Scale bars, 5 mm. (G) Tissue weights of SC and BAT at day 3 in (saline: n = 9, leptin: n = 5) and control (saline: n = 9, leptin: n = 5). Statistical significance is as in Figure 2. Cell Metabolism 25, , February 7,
14 that adult adipose tissues also possess a strong homeostatic mechanism, such that following loss of insulin signaling, there is a rapid proliferation of preadipocytes and regeneration of new brown and white adipocytes restoring metabolic homeostasis and reversing the metabolic syndrome associated with the lipodystrophy, including both the b cell proliferation and cold intolerance (summarized in Figure S7M). Targeting this homeostatic mechanism could provide a novel point for the treatment of diseases with either fat excess or fat loss by slowing the expansion of white adipose mass while increasing functional brown adipose tissue. EXPERIMENTAL PROCEDURES Mice Mice were housed at 2 C 22 C on a 12-hr light/dark cycle in the animal facility at the Joslin Diabetes Center. All animal studies were approved by the Institutional Animal Care and Use Committee (IACUC) and were in accordance with NIH guidelines. Additional information about animal studies is described in Supplemental Experimental Procedures. Metabolic Studies Oral glucose tolerance tests (2 g dextrose/kg body weight [bw]) were performed in unrestrained conscious mice fasted for 6 hr. Insulin tolerance tests (1 U/kg bw, Human R, Lilly) were performed after a 6-hr fast. Glucose levels were measured in tail vein blood using Infinity glucose monitors (US Diagnostics). Whole-body energy expenditure was measured at ambient temperature (22 C) using a Comprehensive Lab Animal Monitoring System. To examine response to adrenergic stimulation, mice were injected intraperitoneally with a b3-adrenergic receptor-specific agonist CL-316,243 1 mg/kg (Cannon and Nedergaard, 211). Insulin, leptin, adiponectin, TGm and FFA were measured by ELISA (Crystal Chem). Ex Vivo Lipolysis Assay in Adipose Tissues Lipolysis was assessed as described before (García-Martín et al., 215). Briefly, subcutaneous and perigonadal fat depots were surgically removed from 8-week-old control and 1.5 days after the last dose of tamoxifen and washed with cold PBS. A piece of 25 mg was further cut into five or six pieces and incubated for 2 hr at 37 C in 2 ml of DMEM containing 2% fatty acid-free BSA (Sigma-Aldrich) and in the presence or absence of 1 mm isoprenaline (Sigma-Aldrich). Fatty acids released to the medium were quantified using a free fatty acid fluorometric assay kit (Cayman Chemical) and normalized to the weight of each fat pad. Histopathology and Immunohistochemistry Tissueswere fixedin 1% formalin, subjected to paraffin-embeddedsectioning, and stained with H&E or immunostained with anti-ucp1 (Sigma) and antiperilipin A (Abcam) antibodies. TUNEL (Promega) and cleaved caspase-3 (Cell Signaling Technology) immunostaining were performed per manufacturer s instructions. Additional information is described in Supplemental Experimental Procedures. Sorting of Adipocyte Precursor Cells SVF was obtained from subcutaneous WAT or interscapular BAT by treatment with 2 mg/ml collagenase (Sigma) for 45 min at 37 C. The isolated SVF was resuspended in cold Hank s balanced salt solution (HBSS) with 2% fetal bovine serum (FBS). Cells were incubated with Ter119-PE-Cy7 (BD Pharmingen), CD31-PE-Cy7 (BioLegend), CD45-PE-Cy7 (BioLegend), CD34-APC (ebioscience), and Sca-1-BV421 (BioLegend) antibodies for 3 min in HBSS containing 2% FBS on ice and then washed and resuspended in solution with propidium iodide (Sigma-Aldrich). Cells were analyzed on a BD FACSAria cell sorter after selection by forward scatter (FSC) and side scatter (SSC), followed by exclusion of dead cells with propidium iodide staining, and analyzed for cell-surface markers using FlowJo software (Tree Star). The data are shown as the percentage of Sca1 + and CD34 + and lineage-negative (Lin ) cells, as well as the number of total preadipocytes per depot. Lineage Tracing System of Adipocytes Rosa-mTmG (Jax no. 7676) were purchased from Jackson Laboratories and bred to Adiponectin-Cre ER T2, Ai-IRKO, and. The adipose depots were fixed in 1% formalin. Whole-mount 3D (z stack) imaging was performed using a two-photon microscope (Zeiss 71) optimized for td-tomato and egfp expression. Tissue Triglyceride Quantification Liver samples (1 mg) were homogenized in 1 ml Folch solution (2:1 v/v chloroform/methanol) and centrifuged at 15, rpm for 15 min. The supernatants were collected, and TG content determined using Infinity Triglycerides Reagent kit (Thermo Scientific). Body Temperature and Cold Exposure Body temperatures of mice were measured using a RET-3 rectal probe (Physitemp) as described in Supplemental Experimental Procedures. qrt-pcr Total RNA was extracted from tissues with an RNeasy minikit (QIAGEN), and complementary DNA (cdna) was synthesized with a high-capacity cdna reverse-transcription kit (Applied Biosystems). Additional information is described in Supplemental Experimental Procedures. Administration of Leptin by Micro-osmotic Pump Implantation Eight-week-old mice were given a dose of 1 mg/day of recombinant mouse leptin (Sigma) dissolved in sterile saline and administered via Alzet mini-osmotic pumps (DURECT) designed for either 2 or 4 weeks infusion. Pumps were implanted subcutaneously on day 3 before the final dose of tamoxifen treatment. Saline filled pumps were implanted in the control groups. b Cell Histology and Proliferation b cell counting was performed manually in a blinded manner by a single observer. Ki67 + b cells, i.e., insulin + cells showing nuclear DAPI staining, were assessed by immunofluorescence microscopy. Insulin + cells showing co-localized nuclear staining for DAPI and Ki67 were counted as proliferating b cells. The double-positive cells (Ins + /Ki67 + ) were confirmed in randomly selected cells in all experiments by confocal microscopy. Additional information is described in Supplemental Experimental Procedures. Statistics All data are presented as mean ± SEM and analyzed by Student s t test or ANOVA followed by post hoc comparisons as appropriate. N indicates the number of animals per group or number of independent experiments. Results were considered significant if p < 5. SUPPLEMENTAL INFORMATION Supplemental Information includes Supplemental Experimental Procedures, seven figures, and one table and can be found with this article online at AUTHOR CONTRIBUTIO M.S. designed and performed the experiments, analyzed data, and wrote the paper. S.F., W.C., J.N.W., M.K., B.T.O., M.L., R.G.-M., and H.T. helped to perform the experiments. J.H. performed analyses of b cell mass and proliferation. R.N.K. supervised the islet work and edited the manuscript. C.R.K. designed the experiments, wrote the paper, and supervised the project. ACKNOWLEDGMENTS We thank T. Roderick Bronson and C. Penniman for assistance and the Animal Physiology Core at the Joslin Diabetes Center for performing and interpreting the comprehensive lab animal monitoring system and dual-energy X-ray absorptiometry analysis. This work was supported by NIH grants 46 Cell Metabolism 25, , February 7, 217
Supplemental Information Supplementary Table 1. Tph1+/+ Tph1 / Analyte Supplementary Table 2. Tissue Vehicle LP value
 Supplemental Information Supplementary Table. Urinary and adipose tissue catecholamines in Tph +/+ and Tph / mice fed a high fat diet for weeks. Tph +/+ Tph / Analyte ewat ibat ewat ibat Urine (ng/ml)
SUPPLEMENTARY INFORMATION
 doi: 1.138/nature7221 Brown fat selective genes 12 1 Control Q-RT-PCR (% of Control) 8 6 4 2 Ntrk3 Cox7a1 Cox8b Cox5b ATPase b2 ATPase f1a1 Sirt3 ERRα Elovl3/Cig3 PPARα Zic1 Supplementary Figure S1. stimulates
SUPPLEMENTARY INFORMATION. Supplemental Figure 1. Body weight and blood glucose parameters of chow-diet (CD)
") SUPPLEMENTARY INFORMATION LEGENDS Supplemental Figure. Body weight and blood glucose parameters of chow-diet (CD) fed and high-fat diet (HFD) fed mice. (A) Body weight was measured at the beginning of
SUPPLEMENTARY INFORMATION LEGENDS Supplemental Figure. Body weight and blood glucose parameters of chow-diet (CD) fed and high-fat diet (HFD) fed mice. (A) Body weight was measured at the beginning of
GPR120 *** * * Liver BAT iwat ewat mwat Ileum Colon. UCP1 mrna ***
 a GPR120 GPR120 mrna/ppia mrna Arbitrary Units 150 100 50 Liver BAT iwat ewat mwat Ileum Colon b UCP1 mrna Fold induction 20 15 10 5 - camp camp SB202190 - - - H89 - - - - - GW7647 Supplementary Figure
Supplementary Figure 1. DNA methylation of the adiponectin promoter R1, Pparg2, and Tnfa promoter in adipocytes is not affected by obesity.
 Supplementary Figure 1. DNA methylation of the adiponectin promoter R1, Pparg2, and Tnfa promoter in adipocytes is not affected by obesity. (a) Relative amounts of adiponectin, Ppar 2, C/ebp, and Tnf mrna
Supplementary Figure 1. DJ-1 modulates ROS concentration in mouse skeletal muscle.
 Supplementary Figure 1. DJ-1 modulates ROS concentration in mouse skeletal muscle. (a) mrna levels of Dj1 measured by quantitative RT-PCR in soleus, gastrocnemius (Gastroc.) and extensor digitorum longus
A synergistic anti-obesity effect by a combination of capsinoids and cold temperature through the promotion of beige adipocyte biogenesis
 A synergistic anti-obesity effect by a combination of capsinoids and cold temperature through the promotion of beige adipocyte biogenesis Kana Ohyama, 1,2 Yoshihito Nogusa, 1 Kosaku Shinoda, 2 Katsuya
SUPPLEMENTARY INFORMATION
 doi:10.1038/nature12652 Supplementary Figure 1. PRDM16 interacts with endogenous EHMT1 in brown adipocytes. Immunoprecipitation of PRDM16 complex by flag antibody (M2) followed by Western blot analysis
Males- Western Diet WT KO Age (wks) Females- Western Diet WT KO Age (wks)
 Females- Western Diet WT KO Age (wks)") Relative Arv1 mrna Adrenal 33.48 +/- 6.2 Skeletal Muscle 22.4 +/- 4.93 Liver 6.41 +/- 1.48 Heart 5.1 +/- 2.3 Brain 4.98 +/- 2.11 Ovary 4.68 +/- 2.21 Kidney 3.98 +/-.39 Lung 2.15 +/-.6 Inguinal Subcutaneous
Relative Arv1 mrna Adrenal 33.48 +/- 6.2 Skeletal Muscle 22.4 +/- 4.93 Liver 6.41 +/- 1.48 Heart 5.1 +/- 2.3 Brain 4.98 +/- 2.11 Ovary 4.68 +/- 2.21 Kidney 3.98 +/-.39 Lung 2.15 +/-.6 Inguinal Subcutaneous
BEIGE AND BROWN FAT: BASIC BIOLOGY AND NOVEL THERAPEUTICS Dr. Carl Ascoli
 BEIGE AND BROWN FAT: BASIC BIOLOGY AND NOVEL THERAPEUTICS Dr. Carl Ascoli Symposium Co-Chairs: Bruce M. Spiegelman (Harvard/Dana Farber) and Sven Enerbäck (U.Gothenburg) April 17-23, 2015 Snowbird Resort,
Supplemental Table 1. Plasma NEFA and liver triglyceride levels in ap2-hif1ako and ap2-hif2ako mice under control and high fat diets.
 Supplemental Table 1. Plasma NEFA and liver triglyceride levels in Hif1aKO and Hif2aKO mice under control and high fat diets. Hif1a (n=6) Hif1aK O (n=6) Hif2a Hif2aK O Hif1a (n=5) Hif1aKO (n=5) Hif2a Hif2aK
control kda ATGL ATGLi HSL 82 GAPDH * ** *** WT/cTg WT/cTg ATGLi AKO/cTg AKO/cTg ATGLi WT/cTg WT/cTg ATGLi AKO/cTg AKO/cTg ATGLi iwat gwat ibat
 body weight (g) tissue weights (mg) ATGL protein expression (relative to GAPDH) HSL protein expression (relative to GAPDH) ### # # kda ATGL 55 HSL 82 GAPDH 37 2.5 2. 1.5 1..5 2. 1.5 1..5.. Supplementary
Interplay between FGF21 and insulin action in the liver regulates metabolism
 Research article Interplay between FGF21 and insulin action in the liver regulates metabolism Brice Emanuelli, 1 Sara G. Vienberg, 1 Graham Smyth, 1 Christine Cheng, 2 Kristin I. Stanford, 1 Manimozhiyan
In The Name Of God. In The Name Of. EMRI Modeling Group
 In The Name Of God In The Name Of God EMRI Modeling Group Cells work together in functionally related groups called tissues Types of tissues: Epithelial lining and covering Connective support Muscle movement
SUPPLEMENTARY INFORMATION
 -. -. SUPPLEMENTARY INFORMATION DOI: 1.1/ncb86 a WAT-1 WAT- BAT-1 BAT- sk-muscle-1 sk-muscle- mir-133b mir-133a mir-6 mir-378 mir-1 mir-85 mir-378 mir-6a mir-18 mir-133a mir- mir- mir-341 mir-196a mir-17
1.5 ASK1KO fed. fasted 16 hrs w/o water. Fed. 4th. 4th WT ASK1KO N=29, 11(WT), ,5(ASK1KO) ASK1KO ASK1KO **** Time [h]
![1.5 ASK1KO fed. fasted 16 hrs w/o water. Fed. 4th. 4th WT ASK1KO N=29, 11(WT), ,5(ASK1KO) ASK1KO ASK1KO **** Time [h]](/thumbs/87/97258189.jpg "1.5 ASK1KO fed. fasted 16 hrs w/o water. Fed. 4th. 4th WT ASK1KO N=29, 11(WT), ,5(ASK1KO) ASK1KO ASK1KO **** Time [h]") 7: 13: 19: 1: 7: 151117 a 151117 4th 4th b c RQ.95 KO.9.85.8.75.7 light dark light dark.65 7: 19: 7: 19: 7: Means ± SEM, N=6 RQ 1..9.8.7.6.6 KO CL (-) CL (+) ibat weight ratio (/body weight) [%].5.4.3.2.1
7: 13: 19: 1: 7: 151117 a 151117 4th 4th b c RQ.95 KO.9.85.8.75.7 light dark light dark.65 7: 19: 7: 19: 7: Means ± SEM, N=6 RQ 1..9.8.7.6.6 KO CL (-) CL (+) ibat weight ratio (/body weight) [%].5.4.3.2.1
Supplementary Materials for
 www.sciencetranslationalmedicine.org/cgi/content/full/5/213/213ra164/dc1 Supplementary Materials for HIV-1 Vpr Induces Adipose Dysfunction in Vivo Through Reciprocal Effects on PPAR/GR Co-Regulation Neeti
Central insulin action regulates peripheral glucose and fat metabolism in mice
 Research article Central insulin action regulates peripheral glucose and fat metabolism in mice Linda Koch, 1 F. Thomas Wunderlich, 1 Jost Seibler, 2 A. Christine Könner, 1 Brigitte Hampel, 1 Sigrid Irlenbusch,
Reviewer #1 (Remarks to the Author)
") Reviewer #1 (Remarks to the Author) The authors provide an interesting data set concerning the effects of an ATGL inhibitor on energy balance and indices of insulin action in mice fed a high fat diet.
Reviewer #1 (Remarks to the Author) The authors provide an interesting data set concerning the effects of an ATGL inhibitor on energy balance and indices of insulin action in mice fed a high fat diet.
ab Adipogenesis Assay Kit (Cell-Based)
") ab133102 Adipogenesis Assay Kit (Cell-Based) Instructions for Use For the study of induction and inhibition of adipogenesis in adherent cells. This product is for research use only and is not intended
ab133102 Adipogenesis Assay Kit (Cell-Based) Instructions for Use For the study of induction and inhibition of adipogenesis in adherent cells. This product is for research use only and is not intended
Supplementary Figure 1: Hsp60 / IEC mice are embryonically lethal (A) Light microscopic pictures show mouse embryos at developmental stage E12.
 Light microscopic pictures show mouse embryos at developmental stage E12.") Supplementary Figure 1: Hsp60 / IEC mice are embryonically lethal (A) Light microscopic pictures show mouse embryos at developmental stage E12.5 and E13.5 prepared from uteri of dams and subsequently genotyped.
Supplementary Figure 1: Hsp60 / IEC mice are embryonically lethal (A) Light microscopic pictures show mouse embryos at developmental stage E12.5 and E13.5 prepared from uteri of dams and subsequently genotyped.
SUPPLEMENTARY INFORMATION
 SUPPLEMENTARY INFORMATION FOR Liver X Receptor α mediates hepatic triglyceride accumulation through upregulation of G0/G1 Switch Gene 2 (G0S2) expression I: SUPPLEMENTARY METHODS II: SUPPLEMENTARY FIGURES
Differential Roles of Insulin and IGF-1 Receptors in Adipose Tissue. Development and Function
 Page 1 of 46 Differential Roles of Insulin and IGF-1 Receptors in Adipose Tissue Development and Function Jeremie Boucher 1,2,#, Samir Softic 1,3,#, Abdelfattah El Ouaamari 3, Megan T. Krumpoch 1, Andre
Supplementary Information
 Supplementary Information GADD34-deficient mice develop obesity, nonalcoholic fatty liver disease, hepatic carcinoma and insulin resistance Naomi Nishio and Ken-ichi Isobe Department of Immunology, Nagoya
SUPPLEMENTARY INFORMATION
 DOI: 10.1038/ncb2211 a! mir-143! b! mir-103/107! let-7a! mir-144! mir-122a! mir-126-3p! mir-194! mir-27a! mir-30c! Figure S1 Northern blot analysis of mir-143 expression dependent on feeding conditions.
Supplementary Materials for
 www.sciencesignaling.org/cgi/content/full/8/407/ra127/dc1 Supplementary Materials for Loss of FTO in adipose tissue decreases Angptl4 translation and alters triglyceride metabolism Chao-Yung Wang,* Shian-Sen
Effects of growth hormone secretagogue receptor agonist and antagonist in nonobese type 2 diabetic MKR mice
 Effects of growth hormone secretagogue receptor agonist and antagonist in nonobese type 2 diabetic MKR mice Rasha Mosa (MBCHC, M.D, PhD candidate) School of Biomedical Sciences University of Queensland
General Laboratory methods Plasma analysis: Gene Expression Analysis: Immunoblot analysis: Immunohistochemistry:
 General Laboratory methods Plasma analysis: Plasma insulin (Mercodia, Sweden), leptin (duoset, R&D Systems Europe, Abingdon, United Kingdom), IL-6, TNFα and adiponectin levels (Quantikine kits, R&D Systems
SUPPLEMENTARY DATA. Nature Medicine: doi: /nm.4171
 SUPPLEMENTARY DATA Supplementary Figure 1 a b c PF %Change - -4-6 Body weight Lean mass Body fat Tissue weight (g).4.3.2.1. PF GC iwat awat BAT PF d e f g week 2 week 3 NEFA (mmol/l) 1..5. PF phsl (Ser565)
Metabolic Solutions Development Company, Kalamazoo, USA.
 New Insulin Sensitizers Produce Differentiation of Brown-like Adipose Cells from a Subcutaneous Fat Depot and Increase Secretion of Adiponectin in vitro William G. McDonald, Serena L. Cole, Danielle D.
Supplemental Information. Increased 4E-BP1 Expression Protects. against Diet-Induced Obesity and Insulin. Resistance in Male Mice
 Cell Reports, Volume 16 Supplemental Information Increased 4E-BP1 Expression Protects against Diet-Induced Obesity and Insulin Resistance in Male Mice Shih-Yin Tsai, Ariana A. Rodriguez, Somasish G. Dastidar,
A microrna-34a/fgf21 Regulatory Axis and Browning of White Fat
 A microrna-34a/fgf21 Regulatory Axis and Browning of White Fat Jongsook Kim Kemper, Ph.D Department of Molecular and Integrative Physiology, University of Illinois at Urbana-Champaign, USA 213 International
Supplementary Information. Glycogen shortage during fasting triggers liver-brain-adipose. neurocircuitry to facilitate fat utilization
 Supplementary Information Glycogen shortage during fasting triggers liver-brain-adipose neurocircuitry to facilitate fat utilization Supplementary Figure S1. Liver-Brain-Adipose neurocircuitry Starvation
Supplementary Figure 1
 Supplementary Figure 1 a Percent of body weight! (%) 4! 3! 1! Epididymal fat Subcutaneous fat Liver SD Percent of body weight! (%) ** 3! 1! SD Percent of body weight! (%) 6! 4! SD ** b Blood glucose (mg/dl)!
Defective Hepatic Autophagy in Obesity Promotes ER Stress and Causes Insulin Resistance
 Cell Metabolism, Volume 11 Supplemental Information Defective Hepatic Autophagy in Obesity Promotes ER Stress and Causes Insulin Resistance Ling Yang, Ping Li, Suneng Fu, Ediz S. Calay, and Gökhan S. Hotamisligil
Mouse Glu-OC (undercarboxylated osteocalcin) and Gla-OC (carboxylated osteocalcin) levels were
 and Gla-OC (carboxylated osteocalcin) levels were") Supplemental Data Supplemental Materials and Methods Plasma measurements Mouse Glu-OC (undercarboxylated osteocalcin) and Gla-OC (carboxylated osteocalcin) levels were determined using ELISA kits according
Supplemental Data Supplemental Materials and Methods Plasma measurements Mouse Glu-OC (undercarboxylated osteocalcin) and Gla-OC (carboxylated osteocalcin) levels were determined using ELISA kits according
Independent Stem Cell Lineages Regulate Adipose Organogenesis and Adipose Homeostasis
 Article Independent Stem Cell Lineages Regulate Adipose Organogenesis and Adipose Homeostasis Graphical Abstract Authors Yuwei Jiang, Daniel C. Berry, Wei Tang, Jonathan M. Graff Correspondence jon.graff@utsouthwestern.edu
Directing Visceral White Adipocyte Precursors to a Thermogenic Adipocyte Fate Improves Insulin Sensitivity in Obese Mice
 1 2 3 4 5 6 7 8 9 1 11 12 13 14 15 16 17 18 19 2 21 Directing Visceral White Adipocyte Precursors to a Thermogenic Adipocyte Fate Improves Insulin Sensitivity in Obese Mice Chelsea Hepler, Mengle Shao,
SUPPLEMENTARY DATA. Supplementary Table 1. Primers used in qpcr
 Supplementary Table 1. Primers used in qpcr Gene forward primer (5'-3') reverse primer (5'-3') β-actin AGAGGGAAATCGTGCGTGAC CAATAGTGATGACCTGGCCGT Hif-p4h-2 CTGGGCAACTACAGGATAAAC GCGTCCCAGTCTTTATTTAGATA
Supplemental Figure 1. Intracranial transduction of a modified ptomo lentiviral vector in the mouse
 Supplemental figure legends Supplemental Figure 1. Intracranial transduction of a modified ptomo lentiviral vector in the mouse hippocampus targets GFAP-positive but not NeuN-positive cells. (A) Stereotaxic
SUPPLEMENTARY INFORMATION
 SUPPLEMENTARY INFORMATION doi:10.1038/nature11464 Supplemental Figure S1. The expression of Vegfb is increased in obese and diabetic mice as compared to lean mice. a-b, Body weight and postprandial blood
AAV-TBGp-Cre treatment resulted in hepatocyte-specific GH receptor gene recombination
 AAV-TBGp-Cre treatment resulted in hepatocyte-specific GH receptor gene recombination Supplementary Figure 1. Generation of the adult-onset, liver-specific GH receptor knock-down (alivghrkd, Kd) mouse
Supporting Information
 Supporting Information Charalambous et al. 10.1073/pnas.1406119111 SI Experimental Procedures Serum and Tissue Biochemistry. Enzymatic assay kits were used for determination of plasma FFAs (Roche), TAGs
ΦΛΕΓΜΟΝΗ ΚΑΙ ΔΙΑΒΗΤΗΣ
 ΦΛΕΓΜΟΝΗ ΚΑΙ ΔΙΑΒΗΤΗΣ ΘΩΜΑΣ ΠΑΠΑΔΟΠΟΥΛΟΣ, MD, PHD ΕΠΕΜΒΑΤΙΚΟΣ ΚΑΡΔΙΟΛΟΓΟΣ ΙΑΤΡΙΚΟ ΔΙΑΒΑΛΚΑΝΙΚΟ ΚΕΝΤΡΟ Inflammation as a cause of disease has entered the popular imagination. Diet ( macronutrients )
Postn MCM Smad2 fl/fl Postn MCM Smad3 fl/fl Postn MCM Smad2/3 fl/fl. Postn MCM. Tgfbr1/2 fl/fl TAC
 A Smad2 fl/fl Smad3 fl/fl Smad2/3 fl/fl Tgfbr1/2 fl/fl 1. mm B Tcf21 MCM Tcf21 MCM Smad3 fl/fl Tcf21 MCM Smad2/3 fl/fl Tcf21 MCM Tgfbr1/2 fl/fl αmhc MCM C 1. mm 1. mm D Smad2 fl/fl Smad3 fl/fl Smad2/3
Endocannabinoid-activated Nlrp3 inflammasome in infiltrating macrophages mediates β- cell loss in type 2 diabetes
 Endocannabinoid-activated Nlrp3 inflammasome in infiltrating macrophages mediates β- cell loss in type 2 diabetes T Jourdan, G Godlewski, R Cinar, A Bertola, G Szanda, J Liu, J Tam, T Han, B Mukhopadhyay,
Metabolic ER stress and inflammation in white adipose tissue (WAT) of mice with dietary obesity.
 of mice with dietary obesity.") Supplementary Figure 1 Metabolic ER stress and inflammation in white adipose tissue (WAT) of mice with dietary obesity. Male C57BL/6J mice were fed a normal chow (NC, 10% fat) or a high-fat diet (HFD,
Supplementary Figure 1 Metabolic ER stress and inflammation in white adipose tissue (WAT) of mice with dietary obesity. Male C57BL/6J mice were fed a normal chow (NC, 10% fat) or a high-fat diet (HFD,
Supplementary Figure S1. Effect of Glucose on Energy Balance in WT and KHK A/C KO
 Supplementary Figure S1. Effect of Glucose on Energy Balance in WT and KHK A/C KO Mice. WT mice and KHK-A/C KO mice were provided drinking water containing 10% glucose or tap water with normal chow ad
Metabolic Syndrome. DOPE amines COGS 163
 Metabolic Syndrome DOPE amines COGS 163 Overview - M etabolic Syndrome - General definition and criteria - Importance of diagnosis - Glucose Homeostasis - Type 2 Diabetes Mellitus - Insulin Resistance
18s AAACGGCTACCACATCCAAG CCTCCAATGGATCCTCGTTA. 36b4 GTTCTTGCCCATCAGCACC AGATGCAGCAGATCCGCAT. Acc1 AGCAGATCCGCAGCTTG ACCTCTGCTCGCTGAGTGC
 Supplementary Table 1. Quantitative PCR primer sequences Gene symbol Sequences (5 to 3 ) Forward Reverse 18s AAACGGCTACCACATCCAAG CCTCCAATGGATCCTCGTTA 36b4 GTTCTTGCCCATCAGCACC AGATGCAGCAGATCCGCAT Acc1
HIV VPR alters fat metabolism. Dorothy E Lewis PhD/Ashok Balasubramanyam MD
 HIV VPR alters fat metabolism Dorothy E Lewis PhD/Ashok Balasubramanyam MD Old Dogma for HIV associated lipodystrophy Differentiation Block (PI) Lipoatrophy Apoptosis (NRTI) Stem cell Preadipocyte Adipocyte
Supplementary Figure 1
 VO (ml kg - min - ) VCO (ml kg - min - ) Respiratory exchange ratio Energy expenditure (cal kg - min - ) Locomotor activity (x count) Body temperature ( C) Relative mrna expression TA Sol EDL PT Heart
Impaired Thermogenesis and Adipose Tissue Development in Mice with Fat-Specific Disruption of Insulin and IGF-1 Signalling
 Impaired Thermogenesis and Adipose Tissue Development in Mice with Fat-Specific Disruption of Insulin and IGF-1 Signalling The Harvard community has made this article openly available. Please share how
IL METABOLISMO EPATICO DEI CARBOIDRATI IN FISIOLOGIA E PATOLOGIA
 UNIGASTRO Il fegato come centrale metabolica e i fattori di danno oltre ai virus epatitici IL METABOLISMO EPATICO DEI CARBOIDRATI IN FISIOLOGIA E PATOLOGIA Dr Elisabetta Bugianesi Divisione di Gastro-Epatologia
Supplemental Information. Tissue Myeloid Progenitors Differentiate. into Pericytes through TGF-b Signaling. in Developing Skin Vasculature
 Cell Reports, Volume 18 Supplemental Information Tissue Myeloid Progenitors Differentiate into Pericytes through TGF-b Signaling in Developing Skin Vasculature Tomoko Yamazaki, Ani Nalbandian, Yutaka Uchida,
Regulation of adipose tissue remodeling by peripheral serotonin
 Regulation of adipose tissue remodeling by peripheral serotonin Sangkyu Park Catholic Kwandong University College of Medicine Department of Biochemistry Serotonin (5-HT) is a signaling molecule Hemostasis
Pathogenesis of Diabetes Mellitus
 Pathogenesis of Diabetes Mellitus Young-Bum Kim, Ph.D. Associate Professor of Medicine Harvard Medical School Definition of Diabetes Mellitus a group of metabolic diseases characterized by hyperglycemia
Targeting of the circadian clock via CK1δ/ε to improve glucose homeostasis in obesity
 Targeting of the circadian clock via CK1δ/ε to improve glucose homeostasis in obesity Peter S. Cunningham, Siobhán A. Ahern, Laura C. Smith, Carla S. da Silva Santos, Travis T. Wager and David A. Bechtold
SUPPLEMENTARY INFORMATION
 Supplementary Figures Supplementary Figure S1. Binding of full-length OGT and deletion mutants to PIP strips (Echelon Biosciences). Supplementary Figure S2. Binding of the OGT (919-1036) fragments with
Supplemental Experimental Procedures
 Cell Stem Cell, Volume 2 Supplemental Data A Temporal Switch from Notch to Wnt Signaling in Muscle Stem Cells Is Necessary for Normal Adult Myogenesis Andrew S. Brack, Irina M. Conboy, Michael J. Conboy,
Identification and characterization of a supraclavicular brown adipose tissue in mice
 Identification and characterization of a supraclavicular brown adipose tissue in mice Qianxing Mo,, Kristin I. Stanford, Miao-Hsueh Chen JCI Insight. 2017;2(11):e93166.. Research Article Development Endocrinology
ZL ZDF ZDF + E2 *** Visceral (g) ZDF
 ZDF") Body Weight (g) 4 3 2 1 ** * ZL ZDF 6 8 1 12 14 16 Age (weeks) B * Sub-cutaneous (g) 16 12 8 4 ZL ZDF Visceral (g) 25 2 15 1 5 ZL ZDF Total fat pad weight (g) 4 3 2 1 ZDF ZL Supplemental Figure 1: Effect
Body Weight (g) 4 3 2 1 ** * ZL ZDF 6 8 1 12 14 16 Age (weeks) B * Sub-cutaneous (g) 16 12 8 4 ZL ZDF Visceral (g) 25 2 15 1 5 ZL ZDF Total fat pad weight (g) 4 3 2 1 ZDF ZL Supplemental Figure 1: Effect
Supplementary Information. Induction of human pancreatic beta cell replication by inhibitors of dual specificity tyrosine regulated kinase
 Journal: Nature Medicine Supplementary Information Induction of human pancreatic beta cell replication by inhibitors of dual specificity tyrosine regulated kinase 1,2 Peng Wang PhD, 1,2 Juan-Carlos Alvarez-Perez
Mfn2 deletion in brown adipose tissue protects from insulin resistance and impairs thermogenesis
 Article Mfn2 deletion in brown adipose tissue protects from insulin resistance and impairs thermogenesis Kiana Mahdaviani 1,2, Ilan Y Benador 1,2, Shi Su 1, Raffi A Gharakhanian 1, Linsey Stiles 1,2, Kyle
review Improved methodologies for the study of adipose biology: insights gained and opportunities ahead
 Improved methodologies for the study of adipose biology: insights gained and opportunities ahead review Qiong A. Wang,* Philipp E. Scherer,*, and Rana K. Gupta 1, * Department of Internal Medicine, Touchstone
Metabolic Disease drug discovery at Evotec
 Metabolic Disease drug discovery at Evotec Evotec, Metabolic Disease Drug Discovery, 2016 Evotec, an ideal partner in metabolic disease drug discovery The different ways to work with us On your specific
Supplemental Materials and Methods
 Supplemental Materials and Methods SVF Isolation Mice were sacrificed and fat tissue was dissected from the inguinal (subcutaneous), perigonadal (visceral), and mesenteric depots. Tissue was minced and
Control 7 d cold 7 d CL
 Control 7 d cold 7 d ibat iwat gwat Supplementary Figure 1. Histology of adipose tissues after cold or 3-adrenergic receptor stimulation. C57BL/6J wild-type mice were housed at 4 C or injected daily with
Up-Regulation of Mitochondrial Activity and Acquirement of Brown Adipose Tissue-Like Property in the White Adipose Tissue of Fsp27 Deficient Mice
 Up-Regulation of Mitochondrial Activity and Acquirement of Brown Adipose Tissue-Like Property in the White Adipose Tissue of Fsp27 Deficient Mice Shen Yon Toh 1,2,3., Jingyi Gong 2., Guoli Du 2., John
Oestrogen signalling in white adipose progenitor cells inhibits differentiation into brown adipose and smooth muscle cells
 Received Feb 4 Accepted 8 Sep 4 Published Oct 4 DOI:.8/ncomms696 Oestrogen signalling in white adipose progenitor cells inhibits differentiation into brown adipose and smooth muscle cells Kfir Lapid,,
SUPPLEMENTARY METHODS
 SUPPLEMENTARY METHODS Histological analysis. Colonic tissues were collected from 5 parts of the middle colon on day 7 after the start of DSS treatment, and then were cut into segments, fixed with 4% paraformaldehyde,
SUPPLEMENTARY INFORMATION
 DOI: 10.1038/ncb3461 In the format provided by the authors and unedited. Supplementary Figure 1 (associated to Figure 1). Cpeb4 gene-targeted mice develop liver steatosis. a, Immunoblot displaying CPEB4
Supplementary Figure 1
 Supplementary Figure 1 how HFD how HFD Epi WT p p Hypothalamus p p Inguinal WT T Liver Lean mouse adipocytes p p p p p p Obese mouse adipocytes Kidney Muscle Spleen Heart p p p p p p p p Extracellular
Supplementary Figure S1
 Supplementry Figure S Tissue weights (g).... Liver Hert Brin Pncres Len mss (g) 8 6 -% +% 8 6 Len mss Len mss (g) (% ody weight) Len mss (% ody weight) c Tiilis nterior weight (g).6...... Qudriceps weight
Supplementary Figure 1. mtor LysM and Rictor LysM mice have normal cellularity and percentages of hematopoe>c cells. a. Cell numbers of lung, liver,
 a. b. c. Supplementary Figure 1. mtor LysM and Rictor LysM mice have normal cellularity and percentages of hematopoe>c cells. a. Cell numbers of lung, liver, and spleen. b. Cell numbers of bone marrow
Inhibition of DYRK1A stimulates human beta-cell proliferation
 Inhibition of DYRK1A stimulates human beta-cell proliferation Ercument Dirice 1,, Deepika Walpita 2,, Amedeo Vetere 2, Bennett C. Meier 2,5, Sevim Kahraman 1, Jiang Hu 1, Vlado Dančík 2, Sean M. Burns
NASH Bench to Bedside
 NASH Bench to Bedside October 2006 Anna Mae Diehl, M.D. Gastroenterology Division Duke University NonAlcoholic Fatty Liver Disease Common ~1/4-1/3 1/3 US adults Outcome highly variable Course indolent
Leptin deficiency suppresses progression of atherosclerosis in apoe-deficient mice
 Leptin deficiency suppresses progression of atherosclerosis in apoe-deficient mice Atherosclerosis, 2007 Chiba T, Shinozaki S, Nakazawa T, et al. Present by Sudaporn Pummoung Apolipoprotein E (apoe( apoe)
Role of the ventromedial hypothalamic Steroidogenic Factor 1/ Adrenal 4. glucose metabolism in mice.
 Role of the ventromedial hypothalamic Steroidogenic Factor 1/ Adrenal 4 Binding Protein neurons in the regulation of whole body energy and glucose metabolism in mice. Eulalia Coutinho Department of Physiological
Supplementary Figure 1. Blood glucose and insulin levels in mice during 4-day infusion.
 Supplementary Figure 1. Blood glucose and insulin levels in mice during 4-day infusion. (A-B) WT and HT mice infused with saline or glucose had overlapping achieved blood glucose and insulin levels, necessitating
For pair feeding, mice were fed 2.7g of HFD containing tofogliflozin
 Materials and Methods Pair Feeding Experiment For pair feeding, mice were fed 2.7g of HFD containing tofogliflozin (0.005%), which is average daily food intake of mice fed control HFD ad libitum at week
Central injection of fibroblast growth factor 1 induces sustained remission of diabetic hyperglycemia in rodents
 Central injection of fibroblast growth factor 1 induces sustained remission of diabetic hyperglycemia in rodents Jarrad M Scarlett 1,,1, Jennifer M Rojas 1,1, Miles E Matsen 1, Karl J Kaiyala 3, Darko
(A) PCR primers (arrows) designed to distinguish wild type (P1+P2), targeted (P1+P2) and excised (P1+P3)14-
 PCR primers (arrows) designed to distinguish wild type (P1+P2), targeted (P1+P2) and excised (P1+P3)14-") 1 Supplemental Figure Legends Figure S1. Mammary tumors of ErbB2 KI mice with 14-3-3σ ablation have elevated ErbB2 transcript levels and cell proliferation (A) PCR primers (arrows) designed to distinguish
1 Supplemental Figure Legends Figure S1. Mammary tumors of ErbB2 KI mice with 14-3-3σ ablation have elevated ErbB2 transcript levels and cell proliferation (A) PCR primers (arrows) designed to distinguish
Supplementary Figure S I: Effects of D4F on body weight and serum lipids in apoe -/- mice.
 Supplementary Figures: Supplementary Figure S I: Effects of D4F on body weight and serum lipids in apoe -/- mice. Male apoe -/- mice were fed a high-fat diet for 8 weeks, and given PBS (model group) or
Supplementary Information
 Supplementary Information Akt regulates hepatic metabolism by suppressing a Foxo1 dependent global inhibition of adaptation to nutrient intake Mingjian Lu 1, Min Wan 1, Karla F. Leavens 1, Qingwei Chu
TFEB-mediated increase in peripheral lysosomes regulates. Store Operated Calcium Entry
 TFEB-mediated increase in peripheral lysosomes regulates Store Operated Calcium Entry Luigi Sbano, Massimo Bonora, Saverio Marchi, Federica Baldassari, Diego L. Medina, Andrea Ballabio, Carlotta Giorgi
1,8 1,6 1,4 1,2 1. EE/g lean mass 0,8 0,6 0,4 0,2. Ambulatory locomotor activity. (beam brakes/48h) V MCH MCHpf 0,86 0,85 0,84 0,83 0,82 0,81 0,8
 V MCH MCHpf 0,86 0,85 0,84 0,83 0,82 0,81 0,8") Supplementary figure 1 vehicle A -pf Energy expenditure (kcal/kg/48h) 25 2 15 1 5 V pf EE/g lean mass 1,8 1,6 1,4 1,2 1,8,6,4,2 Total locomotor activity (beam brakes/48h) C D E 7 6 5 4 3 2 1 V pf Ambulatory
Supplementary figure 1 vehicle A -pf Energy expenditure (kcal/kg/48h) 25 2 15 1 5 V pf EE/g lean mass 1,8 1,6 1,4 1,2 1,8,6,4,2 Total locomotor activity (beam brakes/48h) C D E 7 6 5 4 3 2 1 V pf Ambulatory
Nature Immunology: doi: /ni Supplementary Figure 1. Huwe1 has high expression in HSCs and is necessary for quiescence.
 Supplementary Figure 1 Huwe1 has high expression in HSCs and is necessary for quiescence. (a) Heat map visualizing expression of genes with a known function in ubiquitin-mediated proteolysis (KEGG: Ubiquitin
Supplemental Figure 1. Western blot analysis indicated that MIF was detected in the fractions of
 Supplemental Figure Legends Supplemental Figure 1. Western blot analysis indicated that was detected in the fractions of plasma membrane and cytosol but not in nuclear fraction isolated from Pkd1 null
Supplemental Information. Intermittent Fasting Promotes. White Adipose Browning and Decreases Obesity. by Shaping the Gut Microbiota
 Cell Metabolism, Volume 26 Supplemental Information Intermittent Fasting Promotes White Adipose Browning and Decreases Obesity by Shaping the Gut Microbiota Guolin Li, Cen Xie, Siyu Lu, Robert G. Nichols,
FSP27 contributes to efficient energy storage in murine white adipocytes by promoting the formation of unilocular lipid droplets
 Research article Related Commentary, page 2693 FSP27 contributes to efficient energy storage in murine white adipocytes by promoting the formation of unilocular lipid droplets Naonobu Nishino, 1 Yoshikazu
Journal of Cell Science Accepted manuscript
 2013. Published by The Company of Biologists Ltd. Heterogeneous lineage origin underlies phenotypic and molecular differences of white and beige adipocytes Weiyi Liu 1, Tizhong Shan 1, Xin Yang 1, Sandra
Supplementary Table 2. Plasma lipid profiles in wild type and mutant female mice submitted to a HFD for 12 weeks wt ERα -/- AF-1 0 AF-2 0
 Supplementary Table 1. List of specific primers used for gene expression analysis. Genes Primer forward Primer reverse Hprt GCAGTACAGCCCCAAAATGG AACAAAGTCTGGCCTGTATCCA Srebp-1c GGAAGCTGTCGGGGTAGCGTC CATGTCTTCAAATGTGCAATCCAT
Supplemental figure 1. PDGFRα is expressed dominantly by stromal cells surrounding mammary ducts and alveoli. A) IHC staining of PDGFRα in
 IHC staining of PDGFRα in") Supplemental figure 1. PDGFRα is expressed dominantly by stromal cells surrounding mammary ducts and alveoli. A) IHC staining of PDGFRα in nulliparous (left panel) and InvD6 mouse mammary glands (right
Supplemental figure 1. PDGFRα is expressed dominantly by stromal cells surrounding mammary ducts and alveoli. A) IHC staining of PDGFRα in nulliparous (left panel) and InvD6 mouse mammary glands (right
SUPPLEMENTARY INFORMATION
 1. Supplementary Figures and Legends Supplementary Fig. 1. S1P-mediated transcriptional regulation of integrins expressed in OP/monocytoid cells. Real-time quantitative PCR analyses of mrna for two integrins,
Figure S1. Body composition, energy homeostasis and substrate utilization in LRH-1 hep+/+ (white bars) and LRH-1 hep-/- (black bars) mice.
 and LRH-1 hep-/- (black bars) mice.") Figure S1. Body composition, energy homeostasis and substrate utilization in LRH-1 hep+/+ (white bars) and LRH-1 hep-/- (black bars) mice. (A) Lean and fat masses, determined by EchoMRI. (B) Food and water
Figure S1. Body composition, energy homeostasis and substrate utilization in LRH-1 hep+/+ (white bars) and LRH-1 hep-/- (black bars) mice. (A) Lean and fat masses, determined by EchoMRI. (B) Food and water
Adipose Tissue as an Endocrine Organ. Abdel Moniem Ibrahim, MD Professor of Physiology Cairo University
 Adipose Tissue as an Endocrine Organ Abdel Moniem Ibrahim, MD Professor of Physiology Cairo University Functions of Adipose Tissue Adipose tissue expresses and secretes a variety of bioactive peptides,
Inflammasome-mediated caspase-1 activity Gatekeeper of inflammation in the adipose tissue. Rinke Stienstra
 Inflammasome-mediated caspase-1 activity Gatekeeper of inflammation in the adipose tissue Rinke Stienstra Obesity promotes the development of insulin resistance and type 2 diabetes County-level Estimates
Cited4 is a sex-biased mediator of the antidiabetic glitazone response in adipocyte progenitors
 Cited4 is a sex-biased mediator of the antidiabetic glitazone response in adipocyte progenitors Irem Bayindir-Buchhalter, Gretchen Wolff, Sarah Lerch, Tjeerd Sijmonsma, Maximilian Schuster, Jan Gronych,
SUPPLEMENTARY INFORMATION
 DOI:.38/ncb3399 a b c d FSP DAPI 5mm mm 5mm 5mm e Correspond to melanoma in-situ Figure a DCT FSP- f MITF mm mm MlanaA melanoma in-situ DCT 5mm FSP- mm mm mm mm mm g melanoma in-situ MITF MlanaA mm mm