Supplementary Table 1. The primers used for quantitative RT-PCR. Gene name Forward (5 > 3 ) Reverse (5 > 3 )
|
|
|
- Hugo Lynch
- 6 years ago
- Views:
Transcription
1 Supplementary Table 1. The primers used for quantitative RT-PCR. Gene name Forward (5 > 3 ) Reverse (5 > 3 ) Human CXCL1 GCGCCCAAACCGAAGTCATA ATGGGGGATGCAGGATTGAG PF4 CCCCACTGCCCAACTGATAG TTCTTGTACAGCGGGGCTTG CXCL10 TGCCATTCTGATTTGCTGCC TGCAGGTACAGCGTACAGTT GAPDH CCAGAACATCATCCCTGCCT CCTGCTTCACCACCTTCTTG Rat Cxcl1 GCCACACTCAAGAATGGTCG TGGGGACACCCTTTAGCATC Pf4 CTGCTTCTTCTGGGTCTGCT CCATTCTTCAGCGTGGCTAT Cxcl10 TGCAAGTCTATCCTGTCCGC TCTTTGGCTCACCGCTTTCA Gapdh ATGACTCTACCCACGGCAAG CTGGAAGATGGTGATGGGTT 772 1
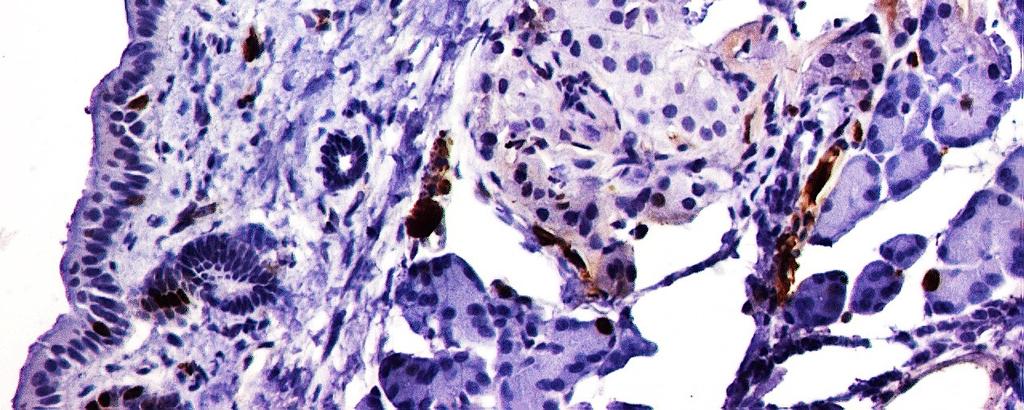
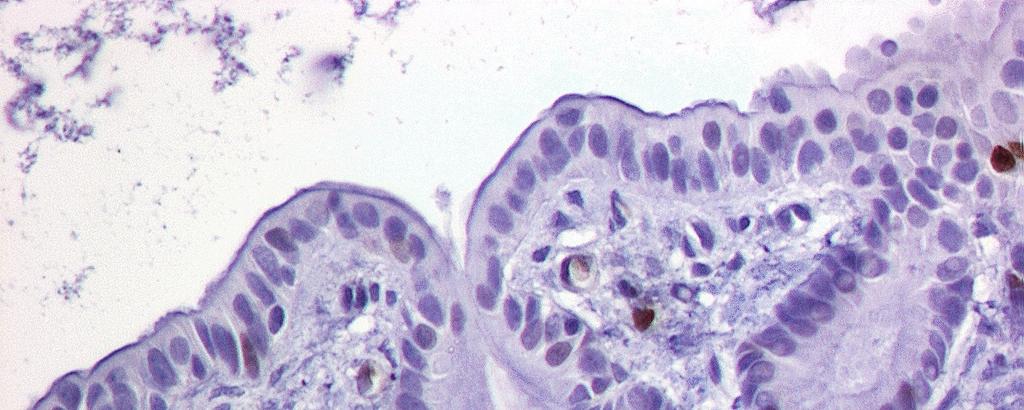
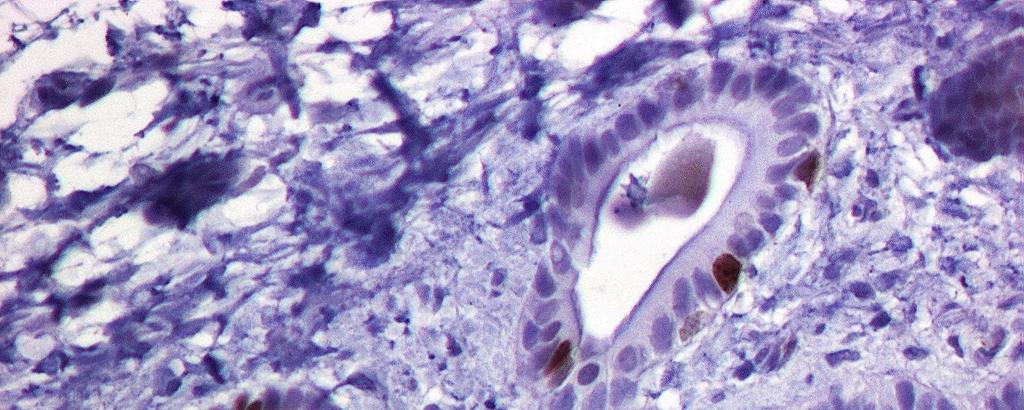
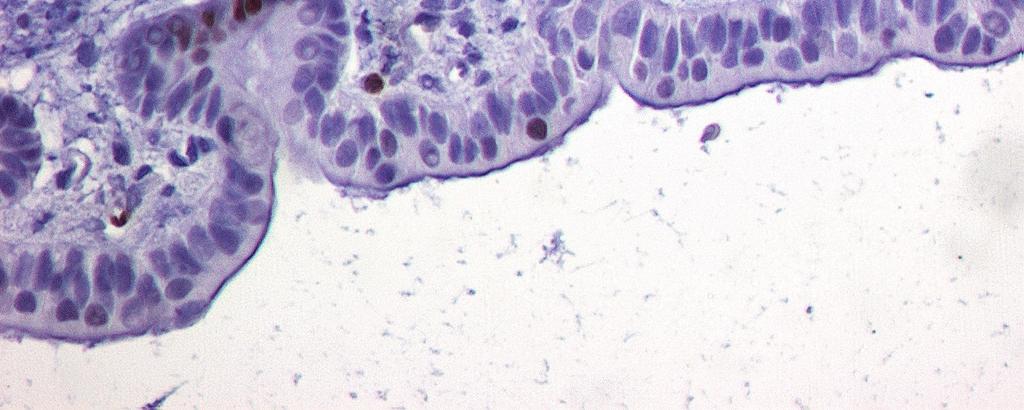
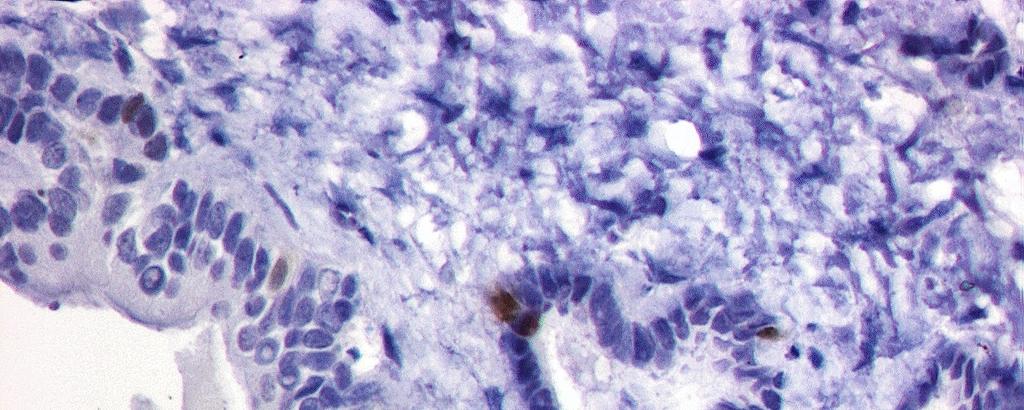
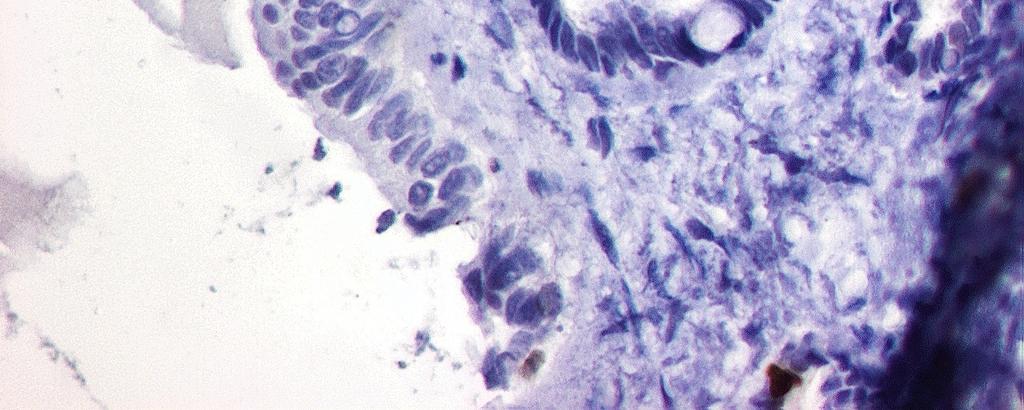
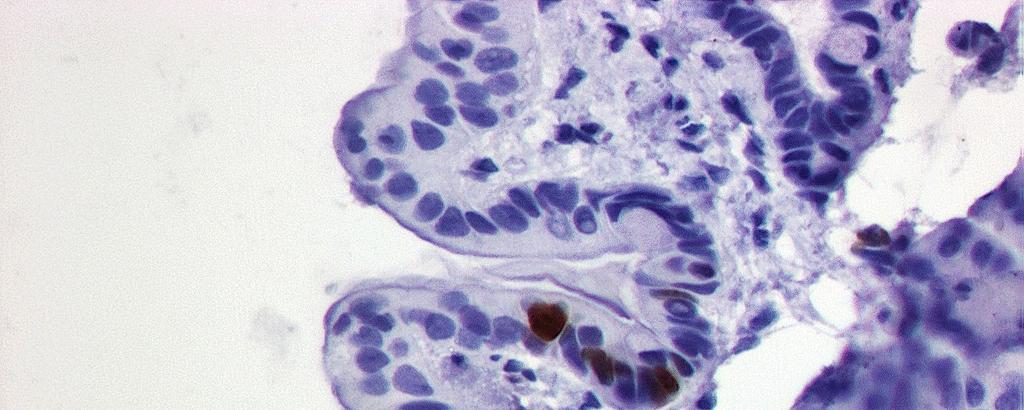
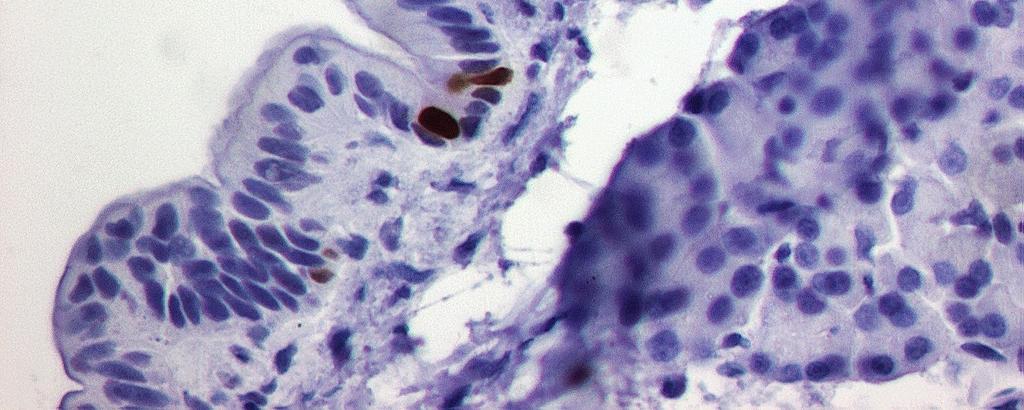
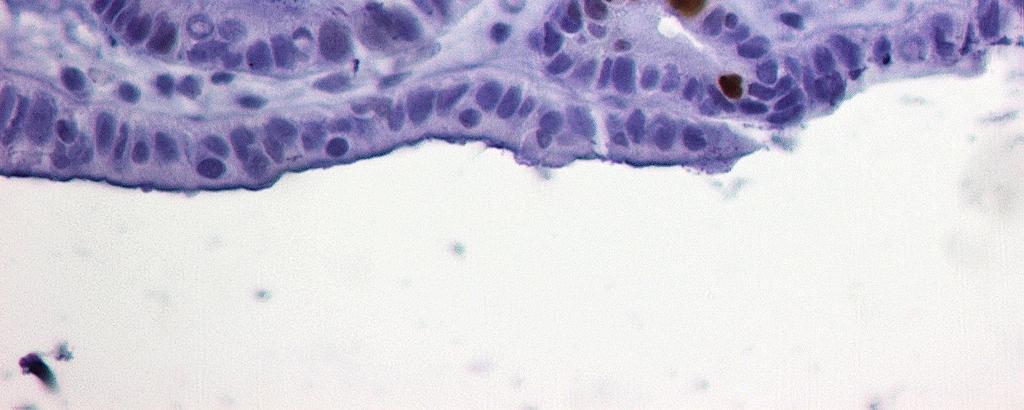
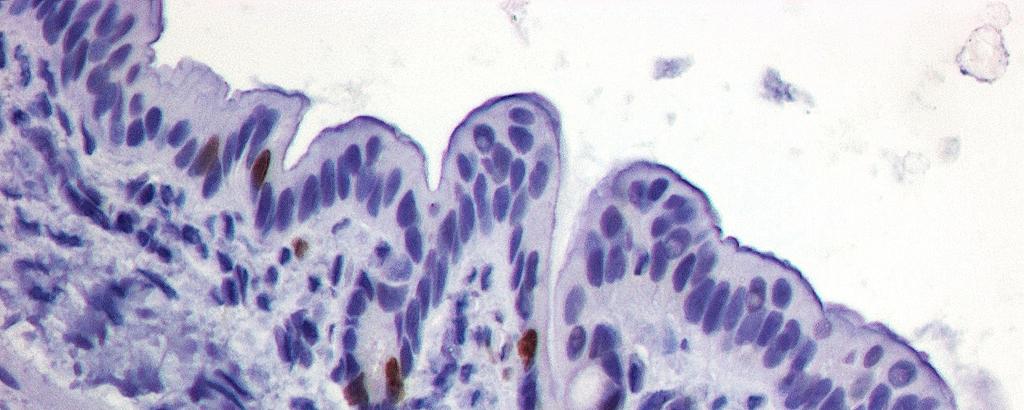
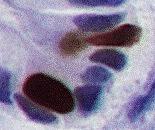
2 SUPPLEMENTARY FIGURES Supplementary Figure 1. A-D. Examples of pancreatic intraepithelial neoplasia (PanIN) lesions identified in non-diabetic (ND) individuals (A: donor 6034, low grade PanIN; B: donor 6097, low grade PanIN; C: donor 6097, low grade PanIN, D: donor 6102, low grade PanIN; all images acquired with a 20x lens (200x magnification)) stained for Alcian Blue to detect mucin deposition, insulin (pink) and Ki67 (brown) to mark replicating cells. Scale bar = 50 µm


3 A B C D Supplementary Figure 1 Nondiabetic case examples of PanIns 3
4 Supplementary Figure 2. Plasma glucose (A), food intake (B), body weight (C) and pancreatic weight/body weight*100 (D) in human IAPP transgenic (HIP) and wild type (WT) rats at age 12 weeks treated or not with Exendin-4 (Ex), metformin (Metf) or combination of the two. WT n=5, WT+Ex n=6, WT+Metf n=6, WT+EX+Metf n=6, HIP n=6, HIP+Ex n=6, HIP+Metf n=6, HIP+Ex+Metf n=6. Data represent mean ± SEM, one-way ANOVA Post Hoc Dunnett s test; *p<0.05, **p<0.01, ***p<
5 Supp Figure 2 A C B D 5
6 Supplementary Figure hour chronic glucose infusion (GINF). Plasma glucose (A) and Plasma insulin (B) (R n=5, C n=3)
7 Supp Figure 3 A Plasma glucose (mg/dl) R Plasma glucose C Plasma glucose Time (hours) B Plasma insulin (pmol/l) GINF Ctrl Time (hours) 7
8 Supplementary Figure 4. (A) Fold increase in mrna expression of Cxcl1, Pf4 and Cxcl10 (n=2) in human IAPP transgenic (HIP) rat islets over wild type (WT) assessed by Microarray. (B) mrna levels of chemokines measured by quantitative RT-PCR. Gapdh was used as a housekeeping gene. Quantification was made relative to the average of mrna in WT. Data represent mean ± SEM; n=3 rats per group; two tailed Student s t test, * p<
9 Supp Figure 4 A B 9
10 Supplementary Figure 5. Chemokine expression in human islets. CXCL1 (A), PF4 (B) and CXCL10 (C) mrna expression in human islets from 3 type 2 diabetes mellitus (T2DM) subjects (black squares) and 8 non-diabetic (ND) donors (white circles) measured by RT-qPCR; GAPDH was used as a housekeeping gene. Quantification was made relative to a randomly chosen ND

11 Supp Figure 5 A B C 11
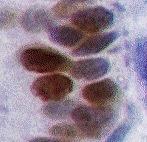
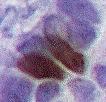
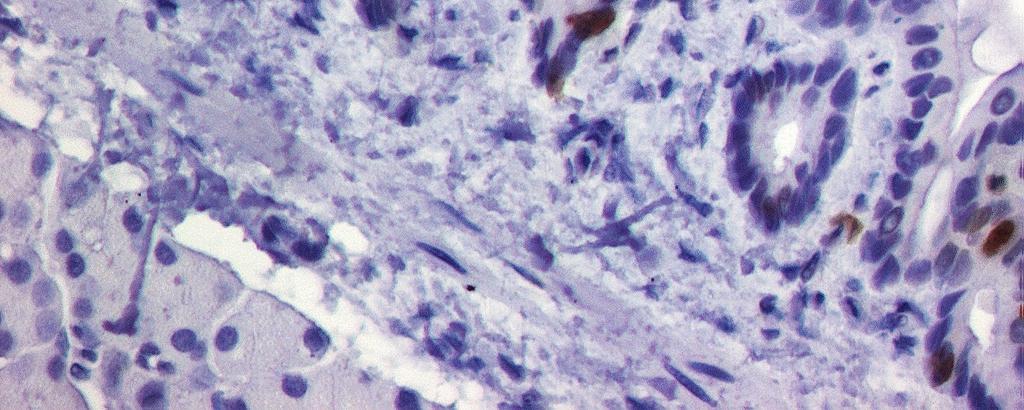
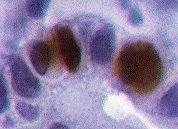
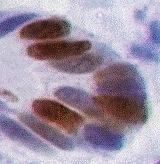
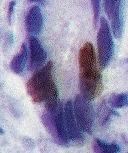
12 Supplementary Figure 6. An example of an islet (circled in broken red line) adjacent to a ductal compartment with a high frequency of replication in the pancreatic duct gland (PDG) compartment (yellow arrows) in a human IAPP transgenic (HIP) rat. Insets show higher power examples of replication in PDGs. Sections are stained for Ki67 with a hematoxylin counterstain. Insets show higher power views of PDGs, showing Ki67 positive nuclei. Scale bar = 50µm


13 Supp Figure 6 13
14 Supplementary Figure 7. Western Blot analysis showing a time-dependent phosphorylation of the pro-proliferative MAP kinases ERK1/2 in human pancreatic duct epithelial (HPDE) cells incubated with CXCL1 (A) and in the presence or absence of the anti-cxcl1 neutralizing mouse monoclonal antibody (clone MM0208-9A18, ab89318, Abcam, Cambridge, MA) (B). CXCL1 and CXCL1 mixture with antibody was pre-incubated for 1 h at T rm before addition to cells
 0 5 15 30 60")
15 Supplemental Figure 7 A CXCL-1 perk1/2 44 KDa 42 KDa GAPDH 37 KDa Time (min) B CXCL1 perk1/2 GAPDH 44 KDa 42 KDa 37 KDa CXCL1+Ab perk1/2 GAPDH 44 KDa 42 KDa 37 KDa Time (min)
16 Supplementary Figure 8. Representative examples of replication in the pancreatic duct gland (PDG) compartment in wild type (WT) rat (A) and WT rat treated with exendin-4 (B), metformin (C) and exendin-4+metformin (D). Sections are stained for Ki67 and counterstained with hematoxylin. Insets show higher power views of Ki67 positive nuclei in PDGs indicated by broken square in the lower power image. Scale bar = 50µm


17 WT A WT+Ex WT+Metf C B WT+Ex+Metf D Supplementary Fig 8 per reviewer 17
18 Supplementary Figure 9. Representative examples of replication in the pancreatic duct gland (PDG) compartment in human IAPP transgenic (HIP) rat (A) and HIP rat treated with exendin (B), metformin (C) and exendin-4+metformin (D). Sections are stained for Ki67 with a hematoxylin counterstain. Insets show higher power views of Ki67 positive nuclei in PDGs indicated by broken square in the lower power image of PDGs. Scale bar = 50µm. 18


19 HIP A HIP+Ex B HIP+Metf C HIP+Ex+Metf D Supplementary Fig 9 per reviewer 19
Islet inflammation and ductal proliferation may be linked to increased pancreatitis risk in type 2 diabetes
 Islet inflammation and ductal proliferation may be linked to increased pancreatitis risk in type 2 diabetes Belinda Schludi,, Peter C. Butler, Alexandra E. Butler JCI Insight. 2017;2(13):e92282.. Research
Supplementary Figures
 Supplementary Figures Supplementary Figure 1 Characterization of stable expression of GlucB and sshbira in the CT26 cell line (a) Live cell imaging of stable CT26 cells expressing green fluorescent protein
GPR120 *** * * Liver BAT iwat ewat mwat Ileum Colon. UCP1 mrna ***
 a GPR120 GPR120 mrna/ppia mrna Arbitrary Units 150 100 50 Liver BAT iwat ewat mwat Ileum Colon b UCP1 mrna Fold induction 20 15 10 5 - camp camp SB202190 - - - H89 - - - - - GW7647 Supplementary Figure
Supplementary Figure 1
 Supplementary Figure 1 a Percent of body weight! (%) 4! 3! 1! Epididymal fat Subcutaneous fat Liver SD Percent of body weight! (%) ** 3! 1! SD Percent of body weight! (%) 6! 4! SD ** b Blood glucose (mg/dl)!
Inhibition of DYRK1A stimulates human beta-cell proliferation
 Inhibition of DYRK1A stimulates human beta-cell proliferation Ercument Dirice 1,, Deepika Walpita 2,, Amedeo Vetere 2, Bennett C. Meier 2,5, Sevim Kahraman 1, Jiang Hu 1, Vlado Dančík 2, Sean M. Burns
Supplementary Figure 1: Neuregulin 1 increases the growth of mammary organoids compared to EGF. (a) Mammary epithelial cells were freshly isolated,
 Mammary epithelial cells were freshly isolated,") 1 2 3 4 5 6 7 8 9 10 Supplementary Figure 1: Neuregulin 1 increases the growth of mammary organoids compared to EGF. (a) Mammary epithelial cells were freshly isolated, embedded in matrigel and exposed
1 2 3 4 5 6 7 8 9 10 Supplementary Figure 1: Neuregulin 1 increases the growth of mammary organoids compared to EGF. (a) Mammary epithelial cells were freshly isolated, embedded in matrigel and exposed
hemodynamic stress. A. Echocardiographic quantification of cardiac dimensions and function in
 SUPPLEMENTAL FIGURE LEGENDS Supplemental Figure 1. Fbn1 C1039G/+ hearts display normal cardiac function in the absence of hemodynamic stress. A. Echocardiographic quantification of cardiac dimensions and
SUPPLEMENTARY INFORMATION
 DOI:.38/ncb3399 a b c d FSP DAPI 5mm mm 5mm 5mm e Correspond to melanoma in-situ Figure a DCT FSP- f MITF mm mm MlanaA melanoma in-situ DCT 5mm FSP- mm mm mm mm mm g melanoma in-situ MITF MlanaA mm mm
islets scored 1 week month months
 Supplementary Table 1. Sampling parameters for the morphometrical analyses Time (post- DT) Control mice (age-matched) α-cells mice pancreatic surface (mm 2 ) scored DT-treated mice islets scored mice pancreatic
Supplementary Figures
 Supplementary Figures Supplementary Figure 1. Confirmation of Dnmt1 conditional knockout out mice. a, Representative images of sorted stem (Lin - CD49f high CD24 + ), luminal (Lin - CD49f low CD24 + )
Supplementary Information. Induction of human pancreatic beta cell replication by inhibitors of dual specificity tyrosine regulated kinase
 Journal: Nature Medicine Supplementary Information Induction of human pancreatic beta cell replication by inhibitors of dual specificity tyrosine regulated kinase 1,2 Peng Wang PhD, 1,2 Juan-Carlos Alvarez-Perez
marker. DAPI labels nuclei. Flies were 20 days old. Scale bar is 5 µm. Ctrl is
 Supplementary Figure 1. (a) Nos is detected in glial cells in both control and GFAP R79H transgenic flies (arrows), but not in deletion mutant Nos Δ15 animals. Repo is a glial cell marker. DAPI labels
Figure S1. (A) Schematic diagram of dnrar transgene allele. (B) X-Gal staining of testis from
 Schematic diagram of dnrar transgene allele. (B) X-Gal staining of testis from") Figure S1. (A) Schematic diagram of dnrar transgene allele. (B) X-Gal staining of testis from germ cell mutants (dnrar flox/flox, Stra8-Cre +, RARElacZ) (A ), controls (dnrar flox/flox, RARElacZ) (B ),
Figure S1. (A) Schematic diagram of dnrar transgene allele. (B) X-Gal staining of testis from germ cell mutants (dnrar flox/flox, Stra8-Cre +, RARElacZ) (A ), controls (dnrar flox/flox, RARElacZ) (B ),
Supplementary Figure 1: si-craf but not si-braf sensitizes tumor cells to radiation.
 Supplementary Figure 1: si-craf but not si-braf sensitizes tumor cells to radiation. (a) Embryonic fibroblasts isolated from wildtype (WT), BRAF -/-, or CRAF -/- mice were irradiated (6 Gy) and DNA damage
Supplementary Figure 1
 Supplementary Figure 1 Supplementary Figure 1 Schematic depiction of the tandem Fc GDF15. Supplementary Figure 2 Supplementary Figure 2 Gfral mrna levels in the brains of both wild-type and knockout Gfral
Ghrelin Facilitates GLUT2-, SGLT1- and SGLT2-mediated Intestinal. Glucose Transport in Goldfish (Carassius auratus)
") Ghrelin Facilitates GLUT2-, SGLT1- and SGLT2-mediated Intestinal Glucose Transport in Goldfish (Carassius auratus) Ayelén Melisa Blanco 1,2, Juan Ignacio Bertucci 2,3, Naresh Ramesh 2, María Jesús Delgado
Ghrelin Facilitates GLUT2-, SGLT1- and SGLT2-mediated Intestinal Glucose Transport in Goldfish (Carassius auratus) Ayelén Melisa Blanco 1,2, Juan Ignacio Bertucci 2,3, Naresh Ramesh 2, María Jesús Delgado
Supplemental figure 1. PDGFRα is expressed dominantly by stromal cells surrounding mammary ducts and alveoli. A) IHC staining of PDGFRα in
 IHC staining of PDGFRα in") Supplemental figure 1. PDGFRα is expressed dominantly by stromal cells surrounding mammary ducts and alveoli. A) IHC staining of PDGFRα in nulliparous (left panel) and InvD6 mouse mammary glands (right
Supplemental figure 1. PDGFRα is expressed dominantly by stromal cells surrounding mammary ducts and alveoli. A) IHC staining of PDGFRα in nulliparous (left panel) and InvD6 mouse mammary glands (right
SUPPLEMENTARY INFORMATION
 Supplementary Figure 1. Behavioural effects of ketamine in non-stressed and stressed mice. Naive C57BL/6 adult male mice (n=10/group) were given a single dose of saline vehicle or ketamine (3.0 mg/kg,
SUPPLEMENTARY INFORMATION
 DOI: 10.1038/ncb2607 Figure S1 Elf5 loss promotes EMT in mammary epithelium while Elf5 overexpression inhibits TGFβ induced EMT. (a, c) Different confocal slices through the Z stack image. (b, d) 3D rendering
Supplemental Figure 1. Western blot analysis indicated that MIF was detected in the fractions of
 Supplemental Figure Legends Supplemental Figure 1. Western blot analysis indicated that was detected in the fractions of plasma membrane and cytosol but not in nuclear fraction isolated from Pkd1 null
T H E J O U R N A L O F C E L L B I O L O G Y
 T H E J O U R N A L O F C E L L B I O L O G Y Supplemental material Amelio et al., http://www.jcb.org/cgi/content/full/jcb.201203134/dc1 Figure S1. mir-24 regulates proliferation and by itself induces
Supplemental Figure 1. (A) Western blot for the expression of RIPK1 in HK-2 cells treated with or without LPS (1 µg/ml) for indicated times.
 Western blot for the expression of RIPK1 in HK-2 cells treated with or without LPS (1 µg/ml) for indicated times.") Supplemental Figure 1. (A) Western blot for the expression of RIPK1 in HK-2 cells treated with or without LPS (1 µg/ml) for indicated times. Western blots shown are representative results from 3 independent
Supplemental Figure 1. (A) Western blot for the expression of RIPK1 in HK-2 cells treated with or without LPS (1 µg/ml) for indicated times. Western blots shown are representative results from 3 independent
Nature Structural & Molecular Biology: doi: /nsmb Supplementary Figure 1. Generation and validation of mtef4-knockout mice.
 Supplementary Figure 1 Generation and validation of mtef4-knockout mice. (a) Alignment of EF4 (E. coli) with mouse, yeast and human EF4. (b) Domain structures of mouse mtef4 compared to those of EF4 (E.
Supplementary Figure 1. Western blot of hippocampal lysates from WT and Adcy1 KO mice demonstrates the specificity of the ADCY1 antibody.
 ADCY1 13 kda β-actin 45 kda Supplementary Figure 1. Western blot of hippocampal lysates from and mice demonstrates the specificity of the ADCY1 antibody. a DHPG perk1/2 ERK1/2 Relative level min 1.6 *
Supplementary Figure 1 IMQ-Induced Mouse Model of Psoriasis. IMQ cream was
 Supplementary Figure 1 IMQ-Induced Mouse Model of Psoriasis. IMQ cream was painted on the shaved back skin of CBL/J and BALB/c mice for consecutive days. (a, b) Phenotypic presentation of mouse back skin
Supplementary Information
 Supplementary Information TABLE S1. SUBJECT CHARACTERISTICS* Normal Control Subjects Subjects with Asthma p Value Number 23 48 Age (years) 35±10 35±10 0.75 Sex, M:F (% F) 9:12 (57) 17:26 (60) 0.76 FEV1
A Normal Exencephaly Craniora- Spina bifida Microcephaly chischisis. Midbrain Forebrain/ Forebrain/ Hindbrain Spinal cord Hindbrain Hindbrain
 A Normal Exencephaly Craniora- Spina bifida Microcephaly chischisis NTD Number of embryos % among NTD Embryos Exencephaly 52 74.3% Craniorachischisis 6 8.6% Spina bifida 5 7.1% Microcephaly 7 1% B Normal
Supplementary Figure 1. IDH1 and IDH2 mutation site sequences on WHO grade III
 Supplementary Materials: Supplementary Figure 1. IDH1 and IDH2 mutation site sequences on WHO grade III patient samples. Genomic DNA samples extracted from punch biopsies from either FFPE or frozen tumor
(a) Significant biological processes (upper panel) and disease biomarkers (lower panel)
 Significant biological processes (upper panel) and disease biomarkers (lower panel)") Supplementary Figure 1. Functional enrichment analyses of secretomic proteins. (a) Significant biological processes (upper panel) and disease biomarkers (lower panel) 2 involved by hrab37-mediated secretory
Supplementary Figure 1. Functional enrichment analyses of secretomic proteins. (a) Significant biological processes (upper panel) and disease biomarkers (lower panel) 2 involved by hrab37-mediated secretory
SUPPLEMENTARY LEGENDS...
 TABLE OF CONTENTS SUPPLEMENTARY LEGENDS... 2 11 MOVIE S1... 2 FIGURE S1 LEGEND... 3 FIGURE S2 LEGEND... 4 FIGURE S3 LEGEND... 5 FIGURE S4 LEGEND... 6 FIGURE S5 LEGEND... 7 FIGURE S6 LEGEND... 8 FIGURE
AP VP DLP H&E. p-akt DLP
 A B AP VP DLP H&E AP AP VP DLP p-akt wild-type prostate PTEN-null prostate Supplementary Fig. 1. Targeted deletion of PTEN in prostate epithelium resulted in HG-PIN in all three lobes. (A) The anatomy
a. b. c. d. e. f. g. h. i. j. k. l. m. n. o. p.
 a. b. c. d. e. f. g. h. i. j. k. l. 2.5 2 1.5 1.5 IL-1β 12 8 6 4 2 IL-1β 9 8 7 6 4 3 3 2.9 IL-1β m. n. o. p. 1.8 1.6 1.4 1.2 1.8.6.4.2 6h LPS 2 15 1 5 6h LPS 2 6h LPS 6 4 3 6h LPS Supplementary Figure
Figure S1. Sorting nexin 9 (SNX9) specifically binds psmad3 and not psmad 1/5/8. Lysates from AKR-2B cells untreated (-) or stimulated (+) for 45 min
 specifically binds psmad3 and not psmad 1/5/8. Lysates from AKR-2B cells untreated (-) or stimulated (+) for 45 min") Figure S1. Sorting nexin 9 (SNX9) specifically binds psmad3 and not psmad 1/5/8. Lysates from AKR2B cells untreated () or stimulated () for 45 min with 5 ng/ml TGFβ or 10 ng/ml BMP4 were incubated with
Figure S1. Sorting nexin 9 (SNX9) specifically binds psmad3 and not psmad 1/5/8. Lysates from AKR2B cells untreated () or stimulated () for 45 min with 5 ng/ml TGFβ or 10 ng/ml BMP4 were incubated with
SUPPLEMENTARY INFORMATION
 DOI: 10.1038/ncb3021 Supplementary figure 1 Characterisation of TIMPless fibroblasts. a) Relative gene expression of TIMPs1-4 by real time quantitative PCR (RT-qPCR) in WT or ΔTimp fibroblasts (mean ±
Figures S1-S5, Figure Legends, Table S1 List of primers used in the study
 Insulin receptor alternative splicing is regulated by insulin signaling and modulates beta cell survival Pushkar Malakar,4, Lital Chartarifsky,4, Ayat Hija, Gil Leibowitz 3, Benjamin Glaser 3, Yuval Dor,
Supplemental Information. Increased 4E-BP1 Expression Protects. against Diet-Induced Obesity and Insulin. Resistance in Male Mice
 Cell Reports, Volume 16 Supplemental Information Increased 4E-BP1 Expression Protects against Diet-Induced Obesity and Insulin Resistance in Male Mice Shih-Yin Tsai, Ariana A. Rodriguez, Somasish G. Dastidar,
Pathologic Stage. Lymph node Stage
 ASC ASC a c Patient ID BMI Age Gleason score Non-obese PBMC 1 22.1 81 6 (3+3) PBMC 2 21.9 6 6 (3+3) PBMC 3 22 84 8 (4+4) PBMC 4 24.6 68 7 (3+4) PBMC 24. 6 (3+3) PBMC 6 24.7 73 7 (3+4) PBMC 7 23. 67 7 (3+4)
Supplementary Figure 1 ITGB1 and ITGA11 increase with evidence for heterodimers following HSC activation. (a) Time course of rat HSC activation
 Time course of rat HSC activation") Supplementary Figure 1 ITGB1 and ITGA11 increase with evidence for heterodimers following HSC activation. (a) Time course of rat HSC activation indicated by the detection of -SMA and COL1 (log scale).
Supplementary Figure 1 ITGB1 and ITGA11 increase with evidence for heterodimers following HSC activation. (a) Time course of rat HSC activation indicated by the detection of -SMA and COL1 (log scale).
SUPPLEMENTARY INFORMATION
 doi:10.1038/nature12652 Supplementary Figure 1. PRDM16 interacts with endogenous EHMT1 in brown adipocytes. Immunoprecipitation of PRDM16 complex by flag antibody (M2) followed by Western blot analysis
Supplementary Fig. S1. Schematic diagram of minigenome segments.
 open reading frame 1565 (segment 5) 47 (-) 3 5 (+) 76 101 125 149 173 197 221 246 287 open reading frame 890 (segment 8) 60 (-) 3 5 (+) 172 Supplementary Fig. S1. Schematic diagram of minigenome segments.
Supplementary Figure 1. Deletion of Smad3 prevents B16F10 melanoma invasion and metastasis in a mouse s.c. tumor model.
 A B16F1 s.c. Lung LN Distant lymph nodes Colon B B16F1 s.c. Supplementary Figure 1. Deletion of Smad3 prevents B16F1 melanoma invasion and metastasis in a mouse s.c. tumor model. Highly invasive growth
Supplementary Figure 1: Hsp60 / IEC mice are embryonically lethal (A) Light microscopic pictures show mouse embryos at developmental stage E12.
 Light microscopic pictures show mouse embryos at developmental stage E12.") Supplementary Figure 1: Hsp60 / IEC mice are embryonically lethal (A) Light microscopic pictures show mouse embryos at developmental stage E12.5 and E13.5 prepared from uteri of dams and subsequently genotyped.
Supplementary Figure 1: Hsp60 / IEC mice are embryonically lethal (A) Light microscopic pictures show mouse embryos at developmental stage E12.5 and E13.5 prepared from uteri of dams and subsequently genotyped.
Supplemental Tables and Figures. The metalloproteinase-proteoglycans ADAMTS7 and ADAMTS12 provide an innate,
 Supplemental Tables and Figures The metalloproteinase-proteoglycans ADAMTS7 and ADAMTS12 provide an innate, tendon-specific protective mechanism against heterotopic ossification Timothy Mead et al Supplemental
ANGPTL2 increases bone metastasis of breast cancer cells through. Tetsuro Masuda, Motoyoshi Endo, Yutaka Yamamoto, Haruki Odagiri, Tsuyoshi
 Masuda et al. Supplementary information for ANGPTL2 increases bone metastasis of breast cancer cells through enhancing CXCR4 signaling Tetsuro Masuda, Motoyoshi Endo, Yutaka Yamamoto, Haruki Odagiri, Tsuyoshi
Bezzi et al., Supplementary Figure 1 *** Nature Medicine: doi: /nm Pten pc-/- ;Zbtb7a pc-/- Pten pc-/- ;Pml pc-/- Pten pc-/- ;Trp53 pc-/-
 Gr-1 Gr-1 Gr-1 Bezzi et al., Supplementary Figure 1 a Gr1-CD11b 3 months Spleen T cells 3 months Spleen B cells 3 months Spleen Macrophages 3 months Spleen 15 4 8 6 c CD11b+/Gr1+ cells [%] 1 5 b T cells
Supplementary Figure 1 Chemokine and chemokine receptor expression during muscle regeneration (a) Analysis of CR3CR1 mrna expression by real time-pcr
 Analysis of CR3CR1 mrna expression by real time-pcr") Supplementary Figure 1 Chemokine and chemokine receptor expression during muscle regeneration (a) Analysis of CR3CR1 mrna expression by real time-pcr at day 0, 1, 4, 10 and 21 post- muscle injury. (b)
Supplementary Figure 1 Chemokine and chemokine receptor expression during muscle regeneration (a) Analysis of CR3CR1 mrna expression by real time-pcr at day 0, 1, 4, 10 and 21 post- muscle injury. (b)
Supplementary Information Titles Journal: Nature Medicine
 Supplementary Information Titles Journal: Nature Medicine Article Title: Corresponding Author: Supplementary Item & Number Supplementary Fig.1 Fig.2 Fig.3 Fig.4 Fig.5 Fig.6 Fig.7 Fig.8 Fig.9 Fig. Fig.11
Diabetic pdx1-mutant zebrafish show conserved responses to nutrient overload and anti-glycemic treatment
 Supplementary Information Diabetic pdx1-mutant zebrafish show conserved responses to nutrient overload and anti-glycemic treatment Robin A. Kimmel, Stefan Dobler, Nicole Schmitner, Tanja Walsen, Julia
Supplementary Figure 1. EC-specific Deletion of Snail1 Does Not Affect EC Apoptosis. (a,b) Cryo-sections of WT (a) and Snail1 LOF (b) embryos at
 Cryo-sections of WT (a) and Snail1 LOF (b) embryos at") Supplementary Figure 1. EC-specific Deletion of Snail1 Does Not Affect EC Apoptosis. (a,b) Cryo-sections of WT (a) and Snail1 LOF (b) embryos at E10.5 were double-stained for TUNEL (red) and PECAM-1 (green).
Supplementary Figure 1. EC-specific Deletion of Snail1 Does Not Affect EC Apoptosis. (a,b) Cryo-sections of WT (a) and Snail1 LOF (b) embryos at E10.5 were double-stained for TUNEL (red) and PECAM-1 (green).
Preclinical evaluation of pain in endometriosis
 receptor antagonism reduces peripheral and central hyperalgesia in a preclinical mouse model of endometriosis Erin Greaves, Andrew W Horne, Helen Jerina, arta ikolajczak, Lisa Hilferty, Rory itchell, Sue
Supplemental Figure 1. (A) The localization of Cre DNA recombinase in the testis of Cyp19a1-Cre mice was detected by immunohistchemical analyses
 The localization of Cre DNA recombinase in the testis of Cyp19a1-Cre mice was detected by immunohistchemical analyses") Supplemental Figure 1. (A) The localization of Cre DNA recombinase in the testis of Cyp19a1-Cre mice was detected by immunohistchemical analyses using an anti-cre antibody; testes at 1 week (left panel),
Supplemental Figure 1. (A) The localization of Cre DNA recombinase in the testis of Cyp19a1-Cre mice was detected by immunohistchemical analyses using an anti-cre antibody; testes at 1 week (left panel),
Genotype analysis by Southern blots of nine independent recombinated ES cell clones by
 Supplemental Figure 1 Selected ES cell clones show a correctly recombined conditional Ngn3 allele Genotype analysis by Southern blots of nine independent recombinated ES cell clones by hybridization with
Supplementary Figure 1. Nature Neuroscience: doi: /nn.4547
 Supplementary Figure 1 Characterization of the Microfetti mouse model. (a) Gating strategy for 8-color flow analysis of peripheral Ly-6C + monocytes from Microfetti mice 5-7 days after TAM treatment. Living
Supplementary Figure 1. DNA methylation of the adiponectin promoter R1, Pparg2, and Tnfa promoter in adipocytes is not affected by obesity.
 Supplementary Figure 1. DNA methylation of the adiponectin promoter R1, Pparg2, and Tnfa promoter in adipocytes is not affected by obesity. (a) Relative amounts of adiponectin, Ppar 2, C/ebp, and Tnf mrna
SUPPLEMENTARY INFORMATION
 DOI: 10.1038/ncb3200 Supplementary Figure 1 Expression analysis of stomach markers in gutlike structure. (a) Differentiation scheme of gut-like structure formation from embryonic stem cells. (b) RT-PCR
CHAPTER 5 RESULTS Previous study: cell culture and organotypical slices
 45 CHAPTER 5 RESULTS 5.1. Previous study: cell culture and organotypical slices Initial experiments have been conducted to ensure that the tet-on system works. A neuronal cell culture from mice expressing
Nature Genetics: doi: /ng Supplementary Figure 1. Parameters and consequences of mononuclear cardiomyocyte frequency.
 Supplementary Figure 1 Parameters and consequences of mononuclear cardiomyocyte frequency. (a) Correlation of the frequency of mononuclear cardiomyocytes to the frequency of cardiomyocytes with three or
Supplementary Figure 1: Expression of NFAT proteins in Nfat2-deleted B cells (a+b) Protein expression of NFAT2 (a) and NFAT1 (b) in isolated splenic
 Protein expression of NFAT2 (a) and NFAT1 (b) in isolated splenic") Supplementary Figure 1: Expression of NFAT proteins in Nfat2-deleted B cells (a+b) Protein expression of NFAT2 (a) and NFAT1 (b) in isolated splenic B cells from WT Nfat2 +/+, TCL1 Nfat2 +/+ and TCL1 Nfat2
Supplementary Figure 1: Expression of NFAT proteins in Nfat2-deleted B cells (a+b) Protein expression of NFAT2 (a) and NFAT1 (b) in isolated splenic B cells from WT Nfat2 +/+, TCL1 Nfat2 +/+ and TCL1 Nfat2
activation with anti-cd3/cd28 beads and 3d following transduction. Supplemental Figure 2 shows
 Supplemental Data Supplemental Figure 1 compares CXCR4 expression in untreated CD8 + T cells, following activation with anti-cd3/cd28 beads and 3d following transduction. Supplemental Figure 2 shows the
SUPPLEMENTARY FIGURES AND TABLE
 SUPPLEMENTARY FIGURES AND TABLE Supplementary Figure S1: Characterization of IRE1α mutants. A. U87-LUC cells were transduced with the lentiviral vector containing the GFP sequence (U87-LUC Tet-ON GFP).
TEB. Id4 p63 DAPI Merge. Id4 CK8 DAPI Merge
 a Duct TEB b Id4 p63 DAPI Merge Id4 CK8 DAPI Merge c d e Supplementary Figure 1. Identification of Id4-positive MECs and characterization of the Comma-D model. (a) IHC analysis of ID4 expression in the
Supplementary fig. 1. Crystals induce necroptosis does not involve caspases, TNF receptor or NLRP3. A. Mouse tubular epithelial cells were pretreated
 Supplementary fig. 1. Crystals induce necroptosis does not involve caspases, TNF receptor or NLRP3. A. Mouse tubular epithelial cells were pretreated with zvad-fmk (10µM) and exposed to calcium oxalate
SUPPLEMENTARY INFORMATION
 1. Supplementary Figures and Legends Supplementary Fig. 1. S1P-mediated transcriptional regulation of integrins expressed in OP/monocytoid cells. Real-time quantitative PCR analyses of mrna for two integrins,
SUPPLEMENTARY FIGURE LEGENDS
 SUPPLEMENTARY FIGURE LEGENDS Supplementary Figure 1. Hippocampal sections from new-born Pten+/+ and PtenFV/FV pups were stained with haematoxylin and eosin (H&E) and were imaged at (a) low and (b) high
Supplementary Figure 1
 Supplementary Figure 1 A B mir-141, human cell lines mir-2c, human cell lines mir-141, hepatocytes mir-2c, hepatocytes Relative RNA.1.8.6.4.2 Relative RNA.3.2.1 Relative RNA 1.5 1..5 Relative RNA 2. 1.5
Nature Neuroscience: doi: /nn Supplementary Figure 1
 Supplementary Figure 1 Subcellular segregation of VGluT2-IR and TH-IR within the same VGluT2-TH axon (wild type rats). (a-e) Serial sections of a dual VGluT2-TH labeled axon. This axon (blue outline) has
Nature Medicine: doi: /nm.4324
 1 2 3 4 5 6 7 8 9 10 11 12 13 14 15 16 17 18 19 20 21 22 23 24 25 Supplementary Figure 1. Kinetics of SnCs development in surgically-induced OA and effect of GCV-induced SnC clearance on OA disease progression
Supplemental Figure S1. RANK expression on human lung cancer cells.
 Supplemental Figure S1. RANK expression on human lung cancer cells. (A) Incidence and H-Scores of RANK expression determined from IHC in the indicated primary lung cancer subgroups. The overall expression
Nature Immunology: doi: /ni eee Supplementary Figure 1
 eee Supplementary Figure 1 Hyphae induce NET release, but yeast do not. (a) NET release by human peripheral neutrophils stimulated with a hgc1 yeast-locked C. albicans mutant (yeast) or pre-formed WT C.
stability and tumor suppression
 Supplementary information The stress kinase MKK7 couples oncogenic stress to p53 stability and tumor suppression Daniel Schramek 1, Athanassios Kotsinas 2, Arabella Meixner 1, Teiji Wada 1, Ulrich Elling
SUPPLEMENTARY FIGURE LEGENDS. atypical adenomatous hyperplasias (AAH); Grade II: adenomas; Grade III: adenocarcinomas;
; Grade II: adenomas; Grade III: adenocarcinomas;") SUPPLEMENTARY FIGURE LEGENDS Supplementary Figure S1: Tumor grades in Ras G12D ; p53 / lung tumors. Representative histology (H&E) of K-Ras G12D ; p53 / lung tumors 13 weeks after tumor initiation. Grade
SUPPLEMENTARY FIGURE LEGENDS Supplementary Figure S1: Tumor grades in Ras G12D ; p53 / lung tumors. Representative histology (H&E) of K-Ras G12D ; p53 / lung tumors 13 weeks after tumor initiation. Grade
Supplementary Figure 1. AdipoR1 silencing and overexpression controls. (a) Representative blots (upper and lower panels) showing the AdipoR1 protein
 Representative blots (upper and lower panels) showing the AdipoR1 protein") Supplementary Figure 1. AdipoR1 silencing and overexpression controls. (a) Representative blots (upper and lower panels) showing the AdipoR1 protein content relative to GAPDH in two independent experiments.
Supplementary Figure 1. AdipoR1 silencing and overexpression controls. (a) Representative blots (upper and lower panels) showing the AdipoR1 protein content relative to GAPDH in two independent experiments.
(A) PCR primers (arrows) designed to distinguish wild type (P1+P2), targeted (P1+P2) and excised (P1+P3)14-
 PCR primers (arrows) designed to distinguish wild type (P1+P2), targeted (P1+P2) and excised (P1+P3)14-") 1 Supplemental Figure Legends Figure S1. Mammary tumors of ErbB2 KI mice with 14-3-3σ ablation have elevated ErbB2 transcript levels and cell proliferation (A) PCR primers (arrows) designed to distinguish
1 Supplemental Figure Legends Figure S1. Mammary tumors of ErbB2 KI mice with 14-3-3σ ablation have elevated ErbB2 transcript levels and cell proliferation (A) PCR primers (arrows) designed to distinguish
SUPPLEMENTARY DATA. Supplementary Table 1. Characteristics of Subjects.
 Supplementary Table 1. Characteristics of Subjects. a includes one patient who had an aqueous sample taken from the same eye twice b includes one patients who had an aqueous sample taken from the same
Supplementary Figure 1
 Supplementary Figure 1 Control Pancreatitis Supplementary Figure 2 A Panc Liver SI Spleen H 2 O B EZH2 fl/fl C EZH2 fl/fl 37bp EZH2 ERK2 D E 5 EZH2 fl/fl Fasting Glucose (mg/dl) 2 18 16 14 12 1 8 6 4 2
Central injection of fibroblast growth factor 1 induces sustained remission of diabetic hyperglycemia in rodents
 Central injection of fibroblast growth factor 1 induces sustained remission of diabetic hyperglycemia in rodents Jarrad M Scarlett 1,,1, Jennifer M Rojas 1,1, Miles E Matsen 1, Karl J Kaiyala 3, Darko
Santulli G. et al. A microrna-based strategy to suppress restenosis while preserving endothelial function
 ONLINE DATA SUPPLEMENTS Santulli G. et al. A microrna-based strategy to suppress restenosis while preserving endothelial function Supplementary Figures Figure S1 Effect of Ad-p27-126TS on the expression
Supplementary Table 2. Plasma lipid profiles in wild type and mutant female mice submitted to a HFD for 12 weeks wt ERα -/- AF-1 0 AF-2 0
 Supplementary Table 1. List of specific primers used for gene expression analysis. Genes Primer forward Primer reverse Hprt GCAGTACAGCCCCAAAATGG AACAAAGTCTGGCCTGTATCCA Srebp-1c GGAAGCTGTCGGGGTAGCGTC CATGTCTTCAAATGTGCAATCCAT
Supplementary Figure 1: TSLP receptor skin expression in dcssc. A: Healthy control (HC) skin with TSLP receptor expression in brown (10x
 skin with TSLP receptor expression in brown (10x") Supplementary Figure 1: TSLP receptor skin expression in dcssc. A: Healthy control (HC) skin with TSLP receptor expression in brown (10x magnification). B: Second HC skin stained for TSLP receptor in brown
Supplementary Figure 1: TSLP receptor skin expression in dcssc. A: Healthy control (HC) skin with TSLP receptor expression in brown (10x magnification). B: Second HC skin stained for TSLP receptor in brown
SUPPLEMENTARY DATA. Supplementary Table 1. Primers used in qpcr
 Supplementary Table 1. Primers used in qpcr Gene forward primer (5'-3') reverse primer (5'-3') β-actin AGAGGGAAATCGTGCGTGAC CAATAGTGATGACCTGGCCGT Hif-p4h-2 CTGGGCAACTACAGGATAAAC GCGTCCCAGTCTTTATTTAGATA
Supplementary Figure 1: Digitoxin induces apoptosis in primary human melanoma cells but not in normal melanocytes, which express lower levels of the
 Supplementary Figure 1: Digitoxin induces apoptosis in primary human melanoma cells but not in normal melanocytes, which express lower levels of the cardiac glycoside target, ATP1A1. (a) The percentage
T H E J O U R N A L O F C E L L B I O L O G Y
 Supplemental material Díaz et al., http://www.jcb.org/cgi/content/full/jcb.201209151/dc1 T H E J O U R N A L O F C E L L B I O L O G Y Figure S1. Hypoxia induces invadopodia formation in different epithelial
Supplementary Figure 1 IL-27 IL
 Tim-3 Supplementary Figure 1 Tc0 49.5 0.6 Tc1 63.5 0.84 Un 49.8 0.16 35.5 0.16 10 4 61.2 5.53 10 3 64.5 5.66 10 2 10 1 10 0 31 2.22 10 0 10 1 10 2 10 3 10 4 IL-10 28.2 1.69 IL-27 Supplementary Figure 1.
GFP/Iba1/GFAP. Brain. Liver. Kidney. Lung. Hoechst/Iba1/TLR9!
 Supplementary information a +KA Relative expression d! Tlr9 5!! 5! NSC Neuron Astrocyte Microglia! 5! Tlr7!!!! NSC Neuron Astrocyte! GFP/Sβ/! Iba/Hoechst Microglia e Hoechst/Iba/TLR9! GFP/Iba/GFAP f Brain
Phosphoinositides Regulate Ciliary Protein Trafficking to Modulate Hedgehog Signaling
 Developmental Cell Supplemental Information Phosphoinositides Regulate Ciliary Protein Trafficking to Modulate Hedgehog Signaling Francesc R. Garcia-Gonzalo, Siew Cheng Phua, Elle C. Roberson, Galo Garcia
Supplementary Information
 Supplementary Information Supplementary s Supplementary 1 All three types of foods suppress subsequent feeding in both sexes when the same food is used in the pre-feeding test feeding. (a) Adjusted pre-feeding
SUPPLEMENTARY FIG. S5. ROS regulated the signaling responses of A. gambiae 4a3B cells to human insulin. (A) 4a3B cells were stimulated with 6000
 4a3B cells were stimulated with 6000") Supplementary Data SUPPLEMENTARY FIG. S1. Exogenous H 2 O 2 induced rapid activation of ERK in Anopheles stephensi cells. ASE cells were treated with PBS or with 500 mmh 2 O 2 for 5, 30, 60, and 180 min.
Supplementary Data SUPPLEMENTARY FIG. S1. Exogenous H 2 O 2 induced rapid activation of ERK in Anopheles stephensi cells. ASE cells were treated with PBS or with 500 mmh 2 O 2 for 5, 30, 60, and 180 min.
General Laboratory methods Plasma analysis: Gene Expression Analysis: Immunoblot analysis: Immunohistochemistry:
 General Laboratory methods Plasma analysis: Plasma insulin (Mercodia, Sweden), leptin (duoset, R&D Systems Europe, Abingdon, United Kingdom), IL-6, TNFα and adiponectin levels (Quantikine kits, R&D Systems
SUPPLEMENTARY INFORMATION
 DOI: 10.1038/ncb2638 Figure S1 Morphological characteristics of fetal testes and ovaries from 6.5-20 developmental weeks. Representative images of Hematoxylin and Eosin staining of testes and ovaries over
fl/+ KRas;Atg5 fl/+ KRas;Atg5 fl/fl KRas;Atg5 fl/fl KRas;Atg5 Supplementary Figure 1. Gene set enrichment analyses. (a) (b)
 (b)") KRas;At KRas;At KRas;At KRas;At a b Supplementary Figure 1. Gene set enrichment analyses. (a) GO gene sets (MSigDB v3. c5) enriched in KRas;Atg5 fl/+ as compared to KRas;Atg5 fl/fl tumors using gene set
KRas;At KRas;At KRas;At KRas;At a b Supplementary Figure 1. Gene set enrichment analyses. (a) GO gene sets (MSigDB v3. c5) enriched in KRas;Atg5 fl/+ as compared to KRas;Atg5 fl/fl tumors using gene set
doi: /nature10632
 SUPPLEMENTARY INFORMATION doi:10.1038/nature10632 Supplementary Figure 1 Lyn mediates neutrophil wound responses as a redox sensor. a, A schematic model. Wounded epithelial cells release H 2 O 2 by an
SHREE ET AL, SUPPLEMENTAL MATERIALS. (A) Workflow for tumor cell line derivation and orthotopic implantation.
 Workflow for tumor cell line derivation and orthotopic implantation.") SHREE ET AL, SUPPLEMENTAL MATERIALS SUPPLEMENTAL FIGURE AND TABLE LEGENDS Supplemental Figure 1. Derivation and characterization of TS1-TGL and TS2-TGL PyMT cell lines and development of an orthotopic
SHREE ET AL, SUPPLEMENTAL MATERIALS SUPPLEMENTAL FIGURE AND TABLE LEGENDS Supplemental Figure 1. Derivation and characterization of TS1-TGL and TS2-TGL PyMT cell lines and development of an orthotopic
a) Primary cultures derived from the pancreas of an 11-week-old Pdx1-Cre; K-MADM-p53
 Primary cultures derived from the pancreas of an 11-week-old Pdx1-Cre; K-MADM-p53") 1 2 3 4 5 6 7 8 9 10 Supplementary Figure 1. Induction of p53 LOH by MADM. a) Primary cultures derived from the pancreas of an 11-week-old Pdx1-Cre; K-MADM-p53 mouse revealed increased p53 KO/KO (green,
1 2 3 4 5 6 7 8 9 10 Supplementary Figure 1. Induction of p53 LOH by MADM. a) Primary cultures derived from the pancreas of an 11-week-old Pdx1-Cre; K-MADM-p53 mouse revealed increased p53 KO/KO (green,
Endocannabinoid-activated Nlrp3 inflammasome in infiltrating macrophages mediates β- cell loss in type 2 diabetes
 Endocannabinoid-activated Nlrp3 inflammasome in infiltrating macrophages mediates β- cell loss in type 2 diabetes T Jourdan, G Godlewski, R Cinar, A Bertola, G Szanda, J Liu, J Tam, T Han, B Mukhopadhyay,
Supplementary Figure 1. Expression of CUGBP1 in non-parenchymal liver cells treated with TGF-β
 Supplementary Figures Supplementary Figure 1. Expression of CUGBP1 in non-parenchymal liver cells treated with TGF-β and LPS. Non-parenchymal liver cells were isolated and treated with or without TGF-β
SUPPLEMENTAL INFORMATIONS
 1 SUPPLEMENTAL INFORMATIONS Figure S1 Cumulative ZIKV production by testis explants over a 9 day-culture period. Viral titer values presented in Figure 1B (viral release over a 3 day-culture period measured
Title: Smooth muscle cell-specific Tgfbr1 deficiency promotes aortic aneurysm formation by stimulating multiple signaling events
 Title: Smooth muscle cell-specific Tgfbr1 deficiency promotes aortic aneurysm formation by stimulating multiple signaling events Pu Yang 1, 3, radley M. Schmit 1, Chunhua Fu 1, Kenneth DeSart 1, S. Paul
Supplementary Figure S1. Effect of Glucose on Energy Balance in WT and KHK A/C KO
 Supplementary Figure S1. Effect of Glucose on Energy Balance in WT and KHK A/C KO Mice. WT mice and KHK-A/C KO mice were provided drinking water containing 10% glucose or tap water with normal chow ad
Supplementary Figure 1
 Combination index (CI) Supplementary Figure 1 2. 1.5 1. Ishikawa AN3CA Nou-1 Hec-18.5...2.4.6.8 1. Fraction affected (Fa) Supplementary Figure 1. The synergistic effect of PARP inhibitor and PI3K inhibitor
control kda ATGL ATGLi HSL 82 GAPDH * ** *** WT/cTg WT/cTg ATGLi AKO/cTg AKO/cTg ATGLi WT/cTg WT/cTg ATGLi AKO/cTg AKO/cTg ATGLi iwat gwat ibat
 body weight (g) tissue weights (mg) ATGL protein expression (relative to GAPDH) HSL protein expression (relative to GAPDH) ### # # kda ATGL 55 HSL 82 GAPDH 37 2.5 2. 1.5 1..5 2. 1.5 1..5.. Supplementary