Knowledge Discovery and Data Mining. Testing. Performance Measures. Notes. Lecture 15 - ROC, AUC & Lift. Tom Kelsey. Notes
|
|
|
- Curtis Phillips
- 6 years ago
- Views:
Transcription
1 Knowledge Discovery and Data Mining Lecture 15 - ROC, AUC & Lift Tom Kelsey School of Computer Science University of St Andrews twk@st-andrews.ac.uk Tom Kelsey ID AUC 13 March Testing A useful tool for investigating model performance is the confusion matrix: y = 0 y = 1 ŷ = 0 a b ŷ = 1 c d Contains quantities for the correct prediction of class 0, correct prediction of class 1, and the two ways you may have made incorrect predictions. Tom Kelsey ID AUC 13 March Performance Measures a + d Accuracy a + b + c + d d Precision b + d d Recall (TP) Sensitivity c + d a True negative Specificity a + b b False positive a + b c False negative c + d Tom Kelsey ID AUC 13 March
2 Receiver-Operator Characteristics ROC curves For continuous data with variable cutoff points for the classification Obese Y/N based on BMI, age, etc. Cancerous based on percent of abnormal tissue in a slide Given a tree, some test data and a confusion matrix, it s easy to generate a point on a ROC chart x-axis is FP rate, y-axis is TP rate This point depends on a probability threshold for the classification Varying this threshold will change the confusion matrix, giving more points on the chart Use this to tune the model w.r.t FP and TP rates Tom Kelsey ID AUC 13 March Example Goldstein and Mushlin (J. Gen. Intern. Med ) Tom Kelsey ID AUC 13 March Example Tom Kelsey ID AUC 13 March

3 Example Tom Kelsey ID AUC 13 March Example Tom Kelsey ID AUC 13 March Effect of Thresholding How the balance between TP, TN, FP and FN changes: Tom Kelsey ID AUC 13 March
4 Area Under Curve The area measures discrimination the ability of the test to classify correctly Useful for comparing ROC curves standard academic banding: = excellent = good 0.86 for the example = fair = poor = fail Computed by trapezoidal estimates (or the curve can be smoothed, then integrated) Tom Kelsey ID AUC 13 March Kelsey et al. Tom Kelsey ID AUC 13 March Kelsey et al. Tom Kelsey ID AUC 13 March


5 Tom Kelsey ID AUC 13 March Tom Kelsey ID AUC 13 March Tom Kelsey ID AUC 13 March
6 Tom Kelsey ID AUC 13 March Tom Kelsey ID AUC 13 March Tom Kelsey ID AUC 13 March
7 The Case For S. Ma & J. Huang Regularized ROC method for disease classification and biomarker selection with microarray data Bioinf. (2005) 21 (24) An important application of microarrays is to discover genomic biomarkers, among tens of thousands of genes assayed, for disease classification. Thus there is a need for developing statistical methods that can efficiently use such high-throughput genomic data, select biomarkers with discriminant power and construct classification rules. The ROC technique has been widely used in disease classification with low-dimensional biomarkers because (1) it does not assume a parametric form of the class probability as required for example in the logistic regression method; (2) it accommodates case-control designs and (3) it allows treating false positives and false negatives differently. However, due to computational difficulties, the ROC-based classification has not been used with microarray data. Tom Kelsey ID AUC 13 March The Case Against J.M. Lobo et al. AUC: a misleading measure of the performance of predictive distribution models Global Ecol. and Biogeog. 17(2); 2008 The... AUC, is currently considered to be the standard method to assess the accuracy of predictive distribution models. It avoids the supposed subjectivity in the threshold selection process, when continuous probability derived scores are converted to a binary presence-absence variable, by summarizing overall model performance over all possible thresholds... We do not recommend using AUC for five reasons: (1) it ignores the predicted probability values and the goodness-of-fit of the model; (2) it summarises the test performance over regions of the ROC space in which one would rarely operate; (3) it weights omission and commission errors equally; (4) it does not give information about the spatial distribution of model errors; and, most importantly, (5) the total extent to which models are carried out highly influences the rate of well-predicted absences and the AUC scores. Tom Kelsey ID AUC 13 March Lift Measures the degree to which the predictions of a classification model are better than random predictions. In simple terms lift is the ratio of the correct positive classifications made by the model to the actual positive classifications in the test data For example, if 40% of patients have been diagnosed (the positive classification) in the past, and the model accurately predicts 75% of them, the lift would be = Tom Kelsey ID AUC 13 March
 + FP(t) P + N y = TP(t) The AUC of a lift chart is no smaller than the AUC of the ROC curve for the same model As before, we can compare lift charts for competing")
8 Lift Lift charts for a model can be obtained in a similar manner to ROC charts. For threshold value t x = TP(t) + FP(t) P + N y = TP(t) The AUC of a lift chart is no smaller than the AUC of the ROC curve for the same model As before, we can compare lift charts for competing models, and investigate optimal threshold values Tom Kelsey ID AUC 13 March Lift Example Suppose there is have a mailing list of former students, and we want to get money by mailing an elaborate brochure. We have demographic information that we can relate to the response rate. Also, from similar mail-out campaigns, we estimated the baseline response rate at 8%. Sending to everyone would result in a net loss. We build a model based on the data collected. We can select the 10% most likely to respond. If among these the response rate is 16% percent then the lift value due to using the predictive model is 16% / 8% = 2. Analogous lift values can be computed for each percentile of the population. From this we work out the best trade-off between expense and anticipated response. Tom Kelsey ID AUC 13 March General chart structure You can think of this as a customer database ordered by predicted probability - as we move from left-to-right we are penetrating deeper in to the database from high ˆp observations to low ˆp observations: Tom Kelsey ID AUC 13 March
9 Lift Closely associated with the Pareto Principle 80% of profit comes from 20% of customers. A good model and a lift chart help identify those customers. Tom Kelsey ID AUC 13 March Why use these plots? The utility of these charts is hopefully clear: if we had a limited budget we can see what kind of level of response this would buy by targeting the (modelled) most likely responders we can see how much value our model has brought to the problem (compared to a random sample of customers) - in direct monetary terms if costs are included perhaps we can do a smaller campaign, as the returns diminish beyond some percentage of customers targeted we can see where a level of customer targeting becomes unprofitable if the costs are known. Tom Kelsey ID AUC 13 March Summary Medics and management use ROC, AUC & Lift whenever possible Easy to compute Easy to understand Simple 2D graphical expression of how Model A compares to Model B Plus useful threshold cutoff information Plus important cost-benefit information You are expected to be able to produce ROC curves. You are not expected to be able to produce lift charts, but be able to explain their design and use. Tom Kelsey ID AUC 13 March
Various performance measures in Binary classification An Overview of ROC study
 Various performance measures in Binary classification An Overview of ROC study Suresh Babu. Nellore Department of Statistics, S.V. University, Tirupati, India E-mail: sureshbabu.nellore@gmail.com Abstract
Predictive Models for Healthcare Analytics
 Predictive Models for Healthcare Analytics A Case on Retrospective Clinical Study Mengling Mornin Feng mfeng@mit.edu mornin@gmail.com 1 Learning Objectives After the lecture, students should be able to:
Week 2 Video 3. Diagnostic Metrics
 Week 2 Video 3 Diagnostic Metrics Different Methods, Different Measures Today we ll continue our focus on classifiers Later this week we ll discuss regressors And other methods will get worked in later
When Overlapping Unexpectedly Alters the Class Imbalance Effects
 When Overlapping Unexpectedly Alters the Class Imbalance Effects V. García 1,2, R.A. Mollineda 2,J.S.Sánchez 2,R.Alejo 1,2, and J.M. Sotoca 2 1 Lab. Reconocimiento de Patrones, Instituto Tecnológico de
INTRODUCTION TO MACHINE LEARNING. Decision tree learning
 INTRODUCTION TO MACHINE LEARNING Decision tree learning Task of classification Automatically assign class to observations with features Observation: vector of features, with a class Automatically assign
BMI 541/699 Lecture 16
 BMI 541/699 Lecture 16 Where we are: 1. Introduction and Experimental Design 2. Exploratory Data Analysis 3. Probability 4. T-based methods for continous variables 5. Proportions & contingency tables -
METHODS FOR DETECTING CERVICAL CANCER
 Chapter III METHODS FOR DETECTING CERVICAL CANCER 3.1 INTRODUCTION The successful detection of cervical cancer in a variety of tissues has been reported by many researchers and baseline figures for the
Biomarker adaptive designs in clinical trials
 Review Article Biomarker adaptive designs in clinical trials James J. Chen 1, Tzu-Pin Lu 1,2, Dung-Tsa Chen 3, Sue-Jane Wang 4 1 Division of Bioinformatics and Biostatistics, National Center for Toxicological
Sensitivity, Specificity, and Relatives
 Sensitivity, Specificity, and Relatives Brani Vidakovic ISyE 6421/ BMED 6700 Vidakovic, B. Se Sp and Relatives January 17, 2017 1 / 26 Overview Today: Vidakovic, B. Se Sp and Relatives January 17, 2017
COMP90049 Knowledge Technologies
 COMP90049 Knowledge Technologies Introduction Classification (Lecture Set4) 2017 Rao Kotagiri School of Computing and Information Systems The Melbourne School of Engineering Some of slides are derived
Review. Imagine the following table being obtained as a random. Decision Test Diseased Not Diseased Positive TP FP Negative FN TN
 Outline 1. Review sensitivity and specificity 2. Define an ROC curve 3. Define AUC 4. Non-parametric tests for whether or not the test is informative 5. Introduce the binormal ROC model 6. Discuss non-parametric
Statistics, Probability and Diagnostic Medicine
 Statistics, Probability and Diagnostic Medicine Jennifer Le-Rademacher, PhD Sponsored by the Clinical and Translational Science Institute (CTSI) and the Department of Population Health / Division of Biostatistics
Feature selection methods for early predictive biomarker discovery using untargeted metabolomic data
 Feature selection methods for early predictive biomarker discovery using untargeted metabolomic data Dhouha Grissa, Mélanie Pétéra, Marion Brandolini, Amedeo Napoli, Blandine Comte and Estelle Pujos-Guillot
Assessment of performance and decision curve analysis
 Assessment of performance and decision curve analysis Ewout Steyerberg, Andrew Vickers Dept of Public Health, Erasmus MC, Rotterdam, the Netherlands Dept of Epidemiology and Biostatistics, Memorial Sloan-Kettering
VU Biostatistics and Experimental Design PLA.216
 VU Biostatistics and Experimental Design PLA.216 Julia Feichtinger Postdoctoral Researcher Institute of Computational Biotechnology Graz University of Technology Outline for Today About this course Background
ROC (Receiver Operating Characteristic) Curve Analysis
 Curve Analysis") ROC (Receiver Operating Characteristic) Curve Analysis Julie Xu 17 th November 2017 Agenda Introduction Definition Accuracy Application Conclusion Reference 2017 All Rights Reserved Confidential for INC
ROC (Receiver Operating Characteristic) Curve Analysis Julie Xu 17 th November 2017 Agenda Introduction Definition Accuracy Application Conclusion Reference 2017 All Rights Reserved Confidential for INC
Derivative-Free Optimization for Hyper-Parameter Tuning in Machine Learning Problems
 Derivative-Free Optimization for Hyper-Parameter Tuning in Machine Learning Problems Hiva Ghanbari Jointed work with Prof. Katya Scheinberg Industrial and Systems Engineering Department Lehigh University
Behavioral Data Mining. Lecture 4 Measurement
 Behavioral Data Mining Lecture 4 Measurement Outline Hypothesis testing Parametric statistical tests Non-parametric tests Precision-Recall plots ROC plots Hardware update Icluster machines are ready for
Gene Selection for Tumor Classification Using Microarray Gene Expression Data
 Gene Selection for Tumor Classification Using Microarray Gene Expression Data K. Yendrapalli, R. Basnet, S. Mukkamala, A. H. Sung Department of Computer Science New Mexico Institute of Mining and Technology
Comparing Complete and Partial Classification for Identifying Latently Dissatisfied Customers
 Comparing Complete and Partial Classification for Identifying Latently Dissatisfied Customers Tom Brijs, Gilbert Swinnen, Koen Vanhoof, and Geert Wets Limburg University Centre, Universitaire Campus, gebouw
Zheng Yao Sr. Statistical Programmer
 ROC CURVE ANALYSIS USING SAS Zheng Yao Sr. Statistical Programmer Outline Background Examples: Accuracy assessment Compare ROC curves Cut-off point selection Summary 2 Outline Background Examples: Accuracy
PERFORMANCE MEASURES
 PERFORMANCE MEASURES Of predictive systems DATA TYPES Binary Data point Value A FALSE B TRUE C TRUE D FALSE E FALSE F TRUE G FALSE Real Value Data Point Value a 32.3 b.2 b 2. d. e 33 f.65 g 72.8 ACCURACY
Systematic Reviews and meta-analyses of Diagnostic Test Accuracy. Mariska Leeflang
 Systematic Reviews and meta-analyses of Diagnostic Test Accuracy Mariska Leeflang m.m.leeflang@amc.uva.nl This presentation 1. Introduction: accuracy? 2. QUADAS-2 exercise 3. Meta-analysis of diagnostic
Evaluation of diagnostic tests
 Evaluation of diagnostic tests Biostatistics and informatics Miklós Kellermayer Overlapping distributions Assumption: A classifier value (e.g., diagnostic parameter, a measurable quantity, e.g., serum
Introduction. We can make a prediction about Y i based on X i by setting a threshold value T, and predicting Y i = 1 when X i > T.
 Diagnostic Tests 1 Introduction Suppose we have a quantitative measurement X i on experimental or observed units i = 1,..., n, and a characteristic Y i = 0 or Y i = 1 (e.g. case/control status). The measurement
An Introduction to ROC curves. Mark Whitehorn. Mark Whitehorn
 An Introduction to ROC curves Mark Whitehorn Mark Whitehorn It s all about me Prof. Mark Whitehorn Emeritus Professor of Analytics Computing University of Dundee Consultant Writer (author) m.a.f.whitehorn@dundee.ac.uk
Receiver operating characteristic
 Receiver operating characteristic From Wikipedia, the free encyclopedia In signal detection theory, a receiver operating characteristic (ROC), or simply ROC curve, is a graphical plot of the sensitivity,
Screening (Diagnostic Tests) Shaker Salarilak
 Shaker Salarilak") Screening (Diagnostic Tests) Shaker Salarilak Outline Screening basics Evaluation of screening programs Where we are? Definition of screening? Whether it is always beneficial? Types of bias in screening?
Screening (Diagnostic Tests) Shaker Salarilak Outline Screening basics Evaluation of screening programs Where we are? Definition of screening? Whether it is always beneficial? Types of bias in screening?
1 Introduction. st0020. The Stata Journal (2002) 2, Number 3, pp
 2, Number 3, pp") The Stata Journal (22) 2, Number 3, pp. 28 289 Comparative assessment of three common algorithms for estimating the variance of the area under the nonparametric receiver operating characteristic curve
The Stata Journal (22) 2, Number 3, pp. 28 289 Comparative assessment of three common algorithms for estimating the variance of the area under the nonparametric receiver operating characteristic curve
White Paper Estimating Complex Phenotype Prevalence Using Predictive Models
 White Paper 23-12 Estimating Complex Phenotype Prevalence Using Predictive Models Authors: Nicholas A. Furlotte Aaron Kleinman Robin Smith David Hinds Created: September 25 th, 2015 September 25th, 2015
Diagnostic screening. Department of Statistics, University of South Carolina. Stat 506: Introduction to Experimental Design
 Diagnostic screening Department of Statistics, University of South Carolina Stat 506: Introduction to Experimental Design 1 / 27 Ties together several things we ve discussed already... The consideration
Predictive performance and discrimination in unbalanced classification
 MASTER Predictive performance and discrimination in unbalanced classification van der Zon, S.B. Award date: 2016 Link to publication Disclaimer This document contains a student thesis (bachelor's or master's),
Analysis of Diabetic Dataset and Developing Prediction Model by using Hive and R
 Indian Journal of Science and Technology, Vol 9(47), DOI: 10.17485/ijst/2016/v9i47/106496, December 2016 ISSN (Print) : 0974-6846 ISSN (Online) : 0974-5645 Analysis of Diabetic Dataset and Developing Prediction
Performance Evaluation of Machine Learning Algorithms in the Classification of Parkinson Disease Using Voice Attributes
 Performance Evaluation of Machine Learning Algorithms in the Classification of Parkinson Disease Using Voice Attributes J. Sujatha Research Scholar, Vels University, Assistant Professor, Post Graduate
Critical reading of diagnostic imaging studies. Lecture Goals. Constantine Gatsonis, PhD. Brown University
 Critical reading of diagnostic imaging studies Constantine Gatsonis Center for Statistical Sciences Brown University Annual Meeting Lecture Goals 1. Review diagnostic imaging evaluation goals and endpoints.
SYSTEMATIC REVIEWS OF TEST ACCURACY STUDIES
 Biomarker & Test Evaluation Program SYSTEMATIC REVIEWS OF TEST ACCURACY STUDIES Patrick MM Bossuyt Structure 1. Clinical Scenarios 2. Test Accuracy Studies 3. Systematic Reviews 4. Meta-Analysis 5.
An Improved Algorithm To Predict Recurrence Of Breast Cancer
 An Improved Algorithm To Predict Recurrence Of Breast Cancer Umang Agrawal 1, Ass. Prof. Ishan K Rajani 2 1 M.E Computer Engineer, Silver Oak College of Engineering & Technology, Gujarat, India. 2 Assistant
Introduction to diagnostic accuracy meta-analysis. Yemisi Takwoingi October 2015
 Introduction to diagnostic accuracy meta-analysis Yemisi Takwoingi October 2015 Learning objectives To appreciate the concept underlying DTA meta-analytic approaches To know the Moses-Littenberg SROC method
Classification with microarray data
 Classification with microarray data Aron Charles Eklund eklund@cbs.dtu.dk DNA Microarray Analysis - #27612 January 8, 2010 The rest of today Now: What is classification, and why do we do it? How to develop
Introduction to screening tests. Tim Hanson Department of Statistics University of South Carolina April, 2011
 Introduction to screening tests Tim Hanson Department of Statistics University of South Carolina April, 2011 1 Overview: 1. Estimating test accuracy: dichotomous tests. 2. Estimating test accuracy: continuous
Introduction to ROC analysis
 Introduction to ROC analysis Andriy I. Bandos Department of Biostatistics University of Pittsburgh Acknowledgements Many thanks to Sam Wieand, Nancy Obuchowski, Brenda Kurland, and Todd Alonzo for previous
An Empirical Assessment of Bivariate Methods for Meta-analysis of Test Accuracy
 Number XX An Empirical Assessment of Bivariate Methods for Meta-analysis of Test Accuracy Prepared for: Agency for Healthcare Research and Quality U.S. Department of Health and Human Services 54 Gaither
Characterization of a novel detector using ROC. Elizabeth McKenzie Boehnke Cedars-Sinai Medical Center UCLA Medical Center AAPM Annual Meeting 2017
 Characterization of a novel detector using ROC Elizabeth McKenzie Boehnke Cedars-Sinai Medical Center UCLA Medical Center AAPM Annual Meeting 2017 New Ideas Investigation Clinical Practice 2 Investigating
Example - Birdkeeping and Lung Cancer - Interpretation. Lecture 20 - Sensitivity, Specificity, and Decisions. What do the numbers not mean...
 Odds Ratios Example - Birdkeeping and Lung Cancer - Interpretation Lecture 20 - Sensitivity, Specificity, and Decisions Sta102 / BME102 Colin Rundel April 16, 2014 Estimate Std. Error z value Pr(> z )
Predicting Breast Cancer Survivability Rates
 Predicting Breast Cancer Survivability Rates For data collected from Saudi Arabia Registries Ghofran Othoum 1 and Wadee Al-Halabi 2 1 Computer Science, Effat University, Jeddah, Saudi Arabia 2 Computer
Comparing Multifunctionality and Association Information when Classifying Oncogenes and Tumor Suppressor Genes
 000 001 002 003 004 005 006 007 008 009 010 011 012 013 014 015 016 017 018 019 020 021 022 023 024 025 026 027 028 029 030 031 032 033 034 035 036 037 038 039 040 041 042 043 044 045 046 047 048 049 050
ROC Curve. Brawijaya Professional Statistical Analysis BPSA MALANG Jl. Kertoasri 66 Malang (0341)
") ROC Curve Brawijaya Professional Statistical Analysis BPSA MALANG Jl. Kertoasri 66 Malang (0341) 580342 ROC Curve The ROC Curve procedure provides a useful way to evaluate the performance of classification
ROC Curve Brawijaya Professional Statistical Analysis BPSA MALANG Jl. Kertoasri 66 Malang (0341) 580342 ROC Curve The ROC Curve procedure provides a useful way to evaluate the performance of classification
Machine learning II. Juhan Ernits ITI8600
 Machine learning II Juhan Ernits ITI8600 Hand written digit recognition 64 Example 2: Face recogition Classification, regression or unsupervised? How many classes? Example 2: Face recognition Classification,
Weight Adjustment Methods using Multilevel Propensity Models and Random Forests
 Weight Adjustment Methods using Multilevel Propensity Models and Random Forests Ronaldo Iachan 1, Maria Prosviryakova 1, Kurt Peters 2, Lauren Restivo 1 1 ICF International, 530 Gaither Road Suite 500,
Meta-analysis of diagnostic research. Karen R Steingart, MD, MPH Chennai, 15 December Overview
 Meta-analysis of diagnostic research Karen R Steingart, MD, MPH karenst@uw.edu Chennai, 15 December 2010 Overview Describe key steps in a systematic review/ meta-analysis of diagnostic test accuracy studies
Meta-analysis of diagnostic test accuracy studies with multiple & missing thresholds
 Meta-analysis of diagnostic test accuracy studies with multiple & missing thresholds Richard D. Riley School of Health and Population Sciences, & School of Mathematics, University of Birmingham Collaborators:
Diagnostic Test. H. Risanto Siswosudarmo Department of Obstetrics and Gynecology Faculty of Medicine, UGM Jogjakarta. RS Sardjito
 ب س م الل ه الر ح م ن الر ح يم RS Sardjito Diagnostic Test Gold standard New (test Disease No Disease Column Total Posi*ve a b a+b Nega*ve c d c+d Row Total a+c b+d N H. Risanto Siswosudarmo Department
Machine Learning! Robert Stengel! Robotics and Intelligent Systems MAE 345,! Princeton University, 2017
 Machine Learning! Robert Stengel! Robotics and Intelligent Systems MAE 345,! Princeton University, 2017 A.K.A. Artificial Intelligence Unsupervised learning! Cluster analysis Patterns, Clumps, and Joining
It s hard to predict!
 Statistical Methods for Prediction Steven Goodman, MD, PhD With thanks to: Ciprian M. Crainiceanu Associate Professor Department of Biostatistics JHSPH 1 It s hard to predict! People with no future: Marilyn
Personalized Colorectal Cancer Survivability Prediction with Machine Learning Methods*
 Personalized Colorectal Cancer Survivability Prediction with Machine Learning Methods* 1 st Samuel Li Princeton University Princeton, NJ seli@princeton.edu 2 nd Talayeh Razzaghi New Mexico State University
S4. Summary of the GALNS assay validation. Intra-assay variation (within-run precision)
") S4. Summary of the GALNS assay validation (i.) Intra-assay variation (within-run precision) Intra-assay variation was determined by measuring standard blood samples (low activity standard; medium activity
S4. Summary of the GALNS assay validation (i.) Intra-assay variation (within-run precision) Intra-assay variation was determined by measuring standard blood samples (low activity standard; medium activity
Module Overview. What is a Marker? Part 1 Overview
 SISCR Module 7 Part I: Introduction Basic Concepts for Binary Classification Tools and Continuous Biomarkers Kathleen Kerr, Ph.D. Associate Professor Department of Biostatistics University of Washington
Selection and Combination of Markers for Prediction
 Selection and Combination of Markers for Prediction NACC Data and Methods Meeting September, 2010 Baojiang Chen, PhD Sarah Monsell, MS Xiao-Hua Andrew Zhou, PhD Overview 1. Research motivation 2. Describe
Chapter 10. Screening for Disease
 Chapter 10 Screening for Disease 1 Terminology Reliability agreement of ratings/diagnoses, reproducibility Inter-rater reliability agreement between two independent raters Intra-rater reliability agreement
SISCR Module 7 Part I: Introduction Basic Concepts for Binary Biomarkers (Classifiers) and Continuous Biomarkers
 and Continuous Biomarkers") SISCR Module 7 Part I: Introduction Basic Concepts for Binary Biomarkers (Classifiers) and Continuous Biomarkers Kathleen Kerr, Ph.D. Associate Professor Department of Biostatistics University of Washington
SISCR Module 7 Part I: Introduction Basic Concepts for Binary Biomarkers (Classifiers) and Continuous Biomarkers Kathleen Kerr, Ph.D. Associate Professor Department of Biostatistics University of Washington
Net Reclassification Risk: a graph to clarify the potential prognostic utility of new markers
 Net Reclassification Risk: a graph to clarify the potential prognostic utility of new markers Ewout Steyerberg Professor of Medical Decision Making Dept of Public Health, Erasmus MC Birmingham July, 2013
Validation of QFracture. Analysis prepared for NICE 2011
 Validation of QFracture compared with FRAX Analysis prepared for NICE 2011 Authors: Julia Hippisley-Cox & Carol Coupland Email: Julia.hippisley-cox@nottingham.ac.uk Julia Hipisley-Cox, University of Nottingham,
Predicting the Effect of Diabetes on Kidney using Classification in Tanagra
 Available Online at www.ijcsmc.com International Journal of Computer Science and Mobile Computing A Monthly Journal of Computer Science and Information Technology IJCSMC, Vol. 3, Issue. 4, April 2014,
A scored AUC Metric for Classifier Evaluation and Selection
 A scored AUC Metric for Classifier Evaluation and Selection Shaomin Wu SHAOMIN.WU@READING.AC.UK School of Construction Management and Engineering, The University of Reading, Reading RG6 6AW, UK Peter Flach
Defining and Measuring Recent infection
 Defining and Measuring Recent infection Application to Incidence Estimation Alex Welte Alex Welte (SACEMA) Recent Infection November 2013 1 / 29 Introduction What is Recent Infection? Introduction of a
Individualized Treatment Effects Using a Non-parametric Bayesian Approach
 Individualized Treatment Effects Using a Non-parametric Bayesian Approach Ravi Varadhan Nicholas C. Henderson Division of Biostatistics & Bioinformatics Department of Oncology Johns Hopkins University
4. Model evaluation & selection
 Foundations of Machine Learning CentraleSupélec Fall 2017 4. Model evaluation & selection Chloé-Agathe Azencot Centre for Computational Biology, Mines ParisTech chloe-agathe.azencott@mines-paristech.fr
Predicting New Customer Retention for Online Dieting & Fitness Programs
 Predicting New Customer Retention for Online Dieting & Fitness Programs December 11, 2007 BUDT733 DC01 Team Four Amy Brunner Harin Sandhoo Lilah Pomerance Paola Nasser Srinath Bala Executive Summary GymAmerica.com
Sensitivity, specicity, ROC
 Sensitivity, specicity, ROC Thomas Alexander Gerds Department of Biostatistics, University of Copenhagen 1 / 53 Epilog: disease prevalence The prevalence is the proportion of cases in the population today.
The recommended method for diagnosing sleep
 reviews Measuring Agreement Between Diagnostic Devices* W. Ward Flemons, MD; and Michael R. Littner, MD, FCCP There is growing interest in using portable monitoring for investigating patients with suspected
Data Mining and Knowledge Discovery: Practice Notes
 Data Mining and Knowledge Discovery: Practice Notes Petra Kralj Novak Petra.Kralj.Novak@ijs.si 2013/01/08 1 Keywords Data Attribute, example, attribute-value data, target variable, class, discretization
Comparing Two ROC Curves Independent Groups Design
 Chapter 548 Comparing Two ROC Curves Independent Groups Design Introduction This procedure is used to compare two ROC curves generated from data from two independent groups. In addition to producing a
Performance Analysis of Different Classification Methods in Data Mining for Diabetes Dataset Using WEKA Tool
 Performance Analysis of Different Classification Methods in Data Mining for Diabetes Dataset Using WEKA Tool Sujata Joshi Assistant Professor, Dept. of CSE Nitte Meenakshi Institute of Technology Bangalore,
Diagnosis of Breast Cancer Using Ensemble of Data Mining Classification Methods
 International Journal of Bioinformatics and Biomedical Engineering Vol. 1, No. 3, 2015, pp. 318-322 http://www.aiscience.org/journal/ijbbe ISSN: 2381-7399 (Print); ISSN: 2381-7402 (Online) Diagnosis of
Part [1.0] Introduction to Development and Evaluation of Dynamic Predictions
![Part [1.0] Introduction to Development and Evaluation of Dynamic Predictions](/thumbs/85/92089097.jpg "Part [1.0] Introduction to Development and Evaluation of Dynamic Predictions") Part [1.0] Introduction to Development and Evaluation of Dynamic Predictions A Bansal & PJ Heagerty Department of Biostatistics University of Washington 1 Biomarkers The Instructor(s) Patrick Heagerty
Part [1.0] Introduction to Development and Evaluation of Dynamic Predictions A Bansal & PJ Heagerty Department of Biostatistics University of Washington 1 Biomarkers The Instructor(s) Patrick Heagerty
Modifying ROC Curves to Incorporate Predicted Probabilities
 Modifying ROC Curves to Incorporate Predicted Probabilities C. Ferri, P. Flach 2, J. Hernández-Orallo, A. Senad Departament de Sistemes Informàtics i Computació Universitat Politècnica de València Spain
! Mainly going to ignore issues of correlation among tests
 2x2 and Stratum Specific Likelihood Ratio Approaches to Interpreting Diagnostic Tests. How Different Are They? Henry Glick and Seema Sonnad University of Pennsylvania Society for Medical Decision Making
The Potential of Genes and Other Markers to Inform about Risk
 Research Article The Potential of Genes and Other Markers to Inform about Risk Cancer Epidemiology, Biomarkers & Prevention Margaret S. Pepe 1,2, Jessie W. Gu 1,2, and Daryl E. Morris 1,2 Abstract Background:
Shedding Light on the Role of Sample Sizes and Splitting Proportions in Out-of-Sample Tests: A Monte Carlo Cross-Validation Approach
 Shedding Light on the Role of Sample Sizes and Splitting Proportions in Out-of-Sample Tests: A Monte Carlo Cross-Validation Approach Christian Janze, Goethe University Frankfurt, Germany, janze@wiwi.uni-frankfurt.de
A Practical Approach for Implementing the Probability of Liquefaction in Performance Based Design
 Missouri University of Science and Technology Scholars' Mine International Conferences on Recent Advances in Geotechnical Earthquake Engineering and Soil Dynamics 2010 - Fifth International Conference
Analysis of Classification Algorithms towards Breast Tissue Data Set
 Analysis of Classification Algorithms towards Breast Tissue Data Set I. Ravi Assistant Professor, Department of Computer Science, K.R. College of Arts and Science, Kovilpatti, Tamilnadu, India Abstract
Diagnostic Test of Fat Location Indices and BMI for Detecting Markers of Metabolic Syndrome in Children
 Diagnostic Test of Fat Location Indices and BMI for Detecting Markers of Metabolic Syndrome in Children Adegboye ARA; Andersen LB; Froberg K; Heitmann BL Postdoctoral researcher, Copenhagen, Denmark Research
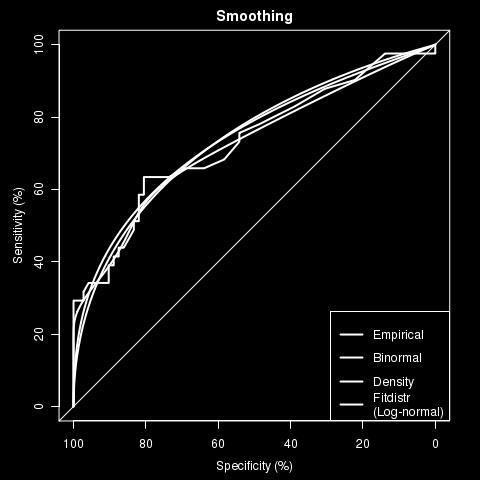
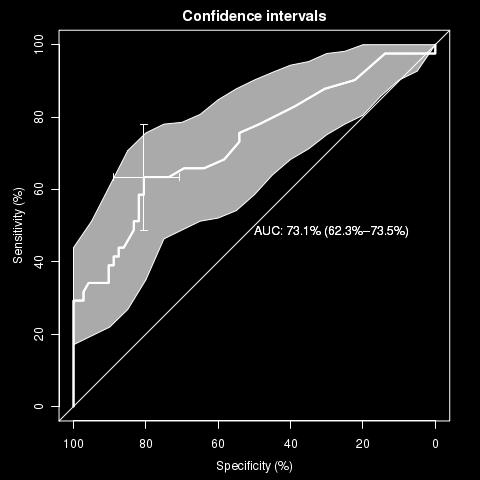
ROC Curves. I wrote, from SAS, the relevant data to a plain text file which I imported to SPSS. The ROC analysis was conducted this way:
 ROC Curves We developed a method to make diagnoses of anxiety using criteria provided by Phillip. Would it also be possible to make such diagnoses based on a much more simple scheme, a simple cutoff point
Systematic reviews of prognostic studies 3 meta-analytical approaches in systematic reviews of prognostic studies
 Systematic reviews of prognostic studies 3 meta-analytical approaches in systematic reviews of prognostic studies Thomas PA Debray, Karel GM Moons for the Cochrane Prognosis Review Methods Group Conflict
An Improved Patient-Specific Mortality Risk Prediction in ICU in a Random Forest Classification Framework
 An Improved Patient-Specific Mortality Risk Prediction in ICU in a Random Forest Classification Framework Soumya GHOSE, Jhimli MITRA 1, Sankalp KHANNA 1 and Jason DOWLING 1 1. The Australian e-health and
PREDICTION OF BREAST CANCER USING STACKING ENSEMBLE APPROACH
 PREDICTION OF BREAST CANCER USING STACKING ENSEMBLE APPROACH 1 VALLURI RISHIKA, M.TECH COMPUTER SCENCE AND SYSTEMS ENGINEERING, ANDHRA UNIVERSITY 2 A. MARY SOWJANYA, Assistant Professor COMPUTER SCENCE
Cochrane Handbook for Systematic Reviews of Diagnostic Test Accuracy
 Cochrane Handbook for Systematic Reviews of Diagnostic Test Accuracy Chapter 10 Analysing and Presenting Results Petra Macaskill, Constantine Gatsonis, Jonathan Deeks, Roger Harbord, Yemisi Takwoingi.
Efficacy of the Extended Principal Orthogonal Decomposition Method on DNA Microarray Data in Cancer Detection
 202 4th International onference on Bioinformatics and Biomedical Technology IPBEE vol.29 (202) (202) IASIT Press, Singapore Efficacy of the Extended Principal Orthogonal Decomposition on DA Microarray
Normal Distribution. Many variables are nearly normal, but none are exactly normal Not perfect, but still useful for a variety of problems.
 Review Probability: likelihood of an event Each possible outcome can be assigned a probability If we plotted the probabilities they would follow some type a distribution Modeling the distribution is important
Chapter 7: Descriptive Statistics
 Chapter Overview Chapter 7 provides an introduction to basic strategies for describing groups statistically. Statistical concepts around normal distributions are discussed. The statistical procedures of
7/17/2013. Evaluation of Diagnostic Tests July 22, 2013 Introduction to Clinical Research: A Two week Intensive Course
 Evaluation of Diagnostic Tests July 22, 2013 Introduction to Clinical Research: A Two week Intensive Course David W. Dowdy, MD, PhD Department of Epidemiology Johns Hopkins Bloomberg School of Public Health
Exemplar for Internal Assessment Resource Mathematics and Statistics Level 1 Resource title: Carbon Credits
 Exemplar for internal assessment resource Mathematics and Statistics 1.1B for Achievement Standard 91026! Exemplar for Internal Assessment Resource Mathematics and Statistics Level 1 Resource title: Carbon
Predicting Patient Satisfaction With Ensemble Methods
 Predicting Patient Satisfaction With Ensemble Methods by Elisa Rosales A Capstone Project Report Submitted to the Faculty of WORCESTER POLYTECHNIC INSTITUTE in partial fulfillment of the requirements for
MACHINE LEARNING BASED APPROACHES FOR PREDICTION OF PARKINSON S DISEASE
 Abstract MACHINE LEARNING BASED APPROACHES FOR PREDICTION OF PARKINSON S DISEASE Arvind Kumar Tiwari GGS College of Modern Technology, SAS Nagar, Punjab, India The prediction of Parkinson s disease is
Biostatistics II
 Biostatistics II 514-5509 Course Description: Modern multivariable statistical analysis based on the concept of generalized linear models. Includes linear, logistic, and Poisson regression, survival analysis,
A PRACTICAL APPROACH FOR IMPLEMENTING THE PROBABILITY OF LIQUEFACTION IN PERFORMANCE BASED DESIGN
 A PRACTICAL APPROACH FOR IMPLEMENTING THE PROBABILITY OF LIQUEFACTION IN PERFORMANCE BASED DESIGN Thomas Oommen, Ph.D. Candidate, Department of Civil and Environmental Engineering, Tufts University, 113
Title:Prediction of poor outcomes six months following total knee arthroplasty in patients awaiting surgery
 Author's response to reviews Title:Prediction of poor outcomes six months following total knee arthroplasty in patients awaiting surgery Authors: Eugen Lungu (eugen.lungu@umontreal.ca) François Desmeules
Computer Models for Medical Diagnosis and Prognostication
 Computer Models for Medical Diagnosis and Prognostication Lucila Ohno-Machado, MD, PhD Division of Biomedical Informatics Clinical pattern recognition and predictive models Evaluation of binary classifiers
Estimation of Area under the ROC Curve Using Exponential and Weibull Distributions
 XI Biennial Conference of the International Biometric Society (Indian Region) on Computational Statistics and Bio-Sciences, March 8-9, 22 43 Estimation of Area under the ROC Curve Using Exponential and