GABA from reactive astrocytes impairs memory in mouse models of Alzheimer disease
|
|
|
- Cleopatra Willis
- 6 years ago
- Views:
Transcription
1 SUPPLEMENTARY INFORMATION from reactive astrocytes impairs memory in mouse models of Alzheimer disease Seonmi Jo *, Oleg Yarishkin *, Yu Jin Hwang, Ye Eun Chun, Mijeong Park, Dong Ho Woo, Jin Young Bae, Taekeun Kim, Jaekwang Lee, Heejung Chun, Hyun Jung Park, Da Yong Lee, Jinpyo Hong, Hye Yun Kim, Soo-Jin Oh, Seung Ju Park, Hyo Lee, Bo-Eun Yoon, YoungSoo Kim, Yong Jeong, Insop Shim, Yong Chul Bae, Jeiwon Cho, Neil W. Kowall, Hoon Ryu, Eunmi Hwang, Daesoo Kim and C. Justin Lee Nature Medicine doi:1.138/nm.3639


 c")


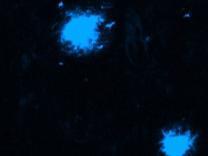
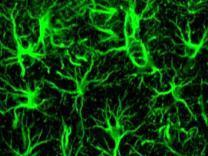
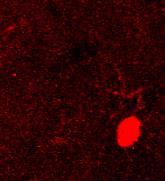
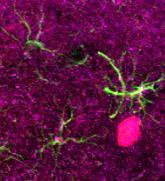
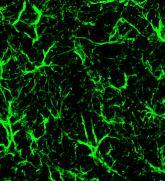
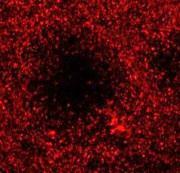
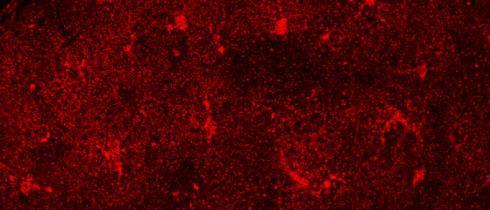
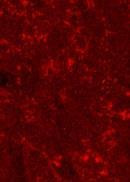
2 Kainic acid Control Number of plaques a Plaque 2 months 4 months 6 months b 2 SFig months 11 months 23 months 5 All mm WT Age (month) c Plaque / / Iba1 / DAPI Plaque Iba1 Merge + DAPI d Plaque Iba1 Merge + DAPI 2 mm 5 mm e DG CA1 CA3 CA3 PI DAPI 5 mm 1 mm Nature Medicine doi:1.138/nm.3639
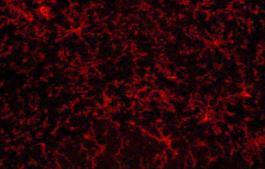
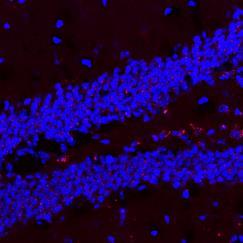
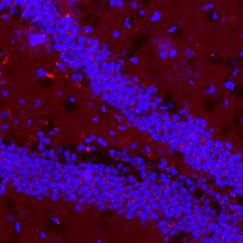
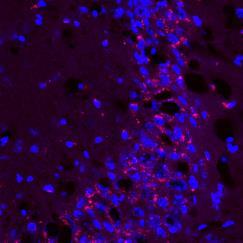
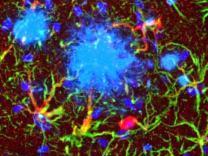
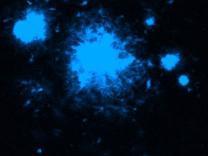
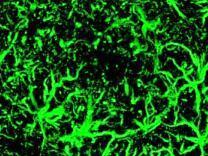
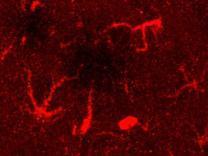
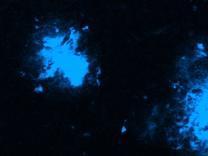
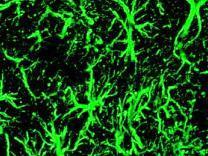
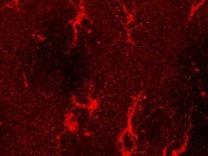
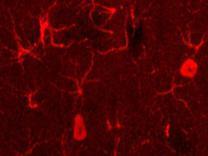
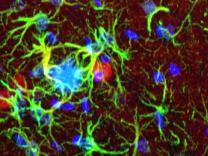
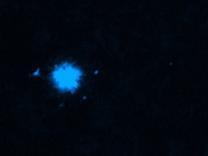
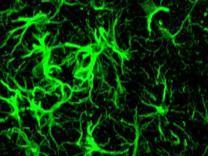
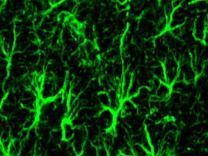
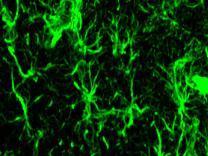
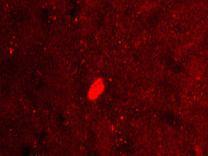
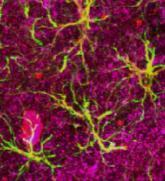
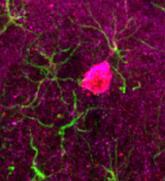
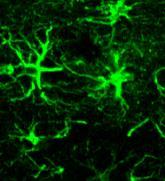
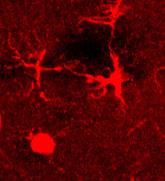
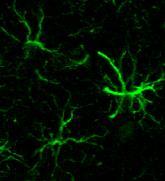
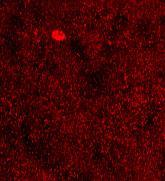
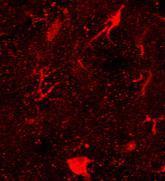
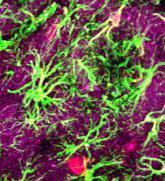
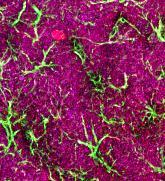
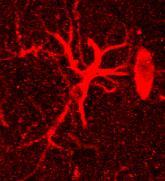
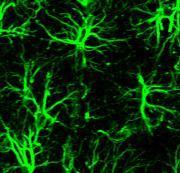
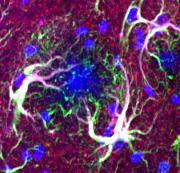
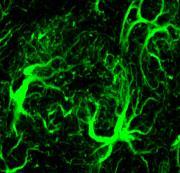
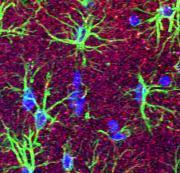
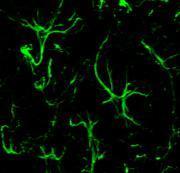
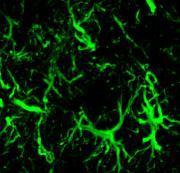
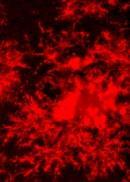
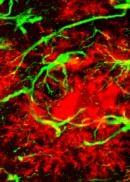
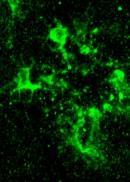
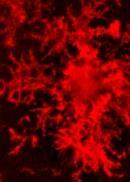
3 Supplementary Figure 1. Amyloid plaques, reactive astrocytes, and a lack of neuronal death. (a) Thioflavin-S staining of amyloid plaques in the hippocampus. mice start to develop amyloid plaques at the age of 4 months and develop more with aging. (b) Average number of plaques as a function of age (a). The number sigmoidally increases with age while wild-type mice show no plaque at any ages tested. WT: wild-type. 6 slices were analyzed for each group. Data are means SEM (error bars). (c) Confocal images show numerous reactive astrocytes and activated microglia clustered around amyloid plaques in mice at 9 months of age. : glial fibrillary acidic protein, Iba1: ionized calcium binding adaptor molecule-1. DAPI: 4', 6-diamidino-2- phenylindole. (d) High-magnification images of the molecular layer of DG from white box in (c). (e) Confocal images of propidium iodide (PI) and DAPI staining show no apparent cell death in the hippocampus of both wild-type and mice (11 12 months of age). For positive control, wild-type mice were injected with kainic acid (25 mg kg -1, i.p.) 48 h before PI injection. CA: Ammon s horn of hippocampus (Cornu Ammonis), DG: dentate gyrus. Nature Medicine doi:1.138/nm.3639


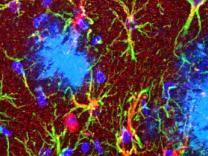
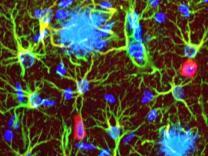


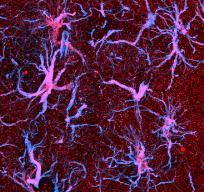
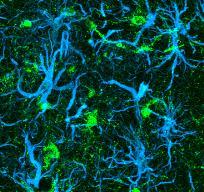
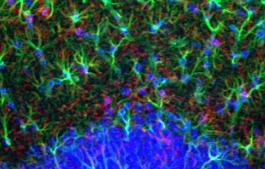
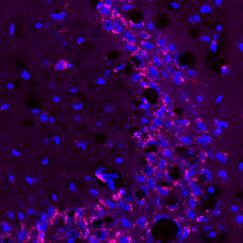
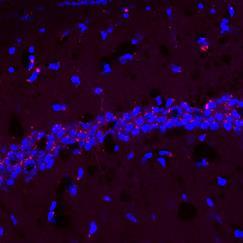
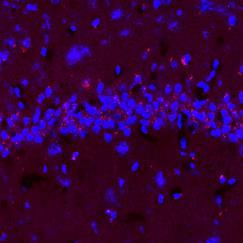
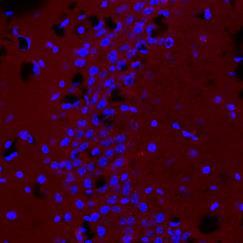
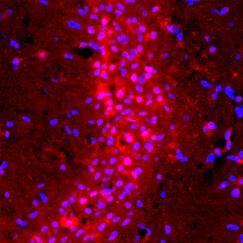
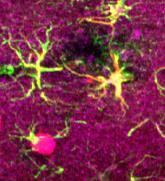
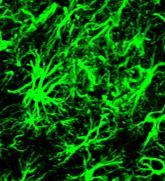
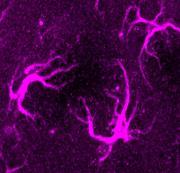
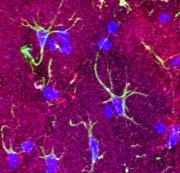
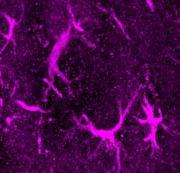
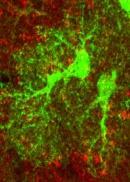
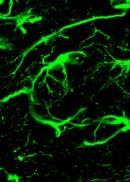
4 / Iba1 / GFAP / Plaque / / / DAPI a b SFig 2 2 months 23 months 2 months 4 months 6 months 8 months 11 months 23 months Plaque Plaque Merge + DAPI Merge + DAPI 2 mm 2 mm c d 5XFAD Iba1 MoDG GrDG Merge Iba1 2 mm 3 mm Supplementary Figure 2. in the reactive astrocytes of and 5XFAD mice. (a) Representative confocal images of thioflavin-s staining, and immunostaining in the molecular layer of DG. mice didn t show amyloid plaques Nature Medicine doi:1.138/nm.3639
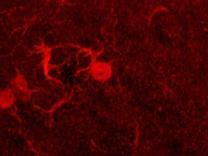
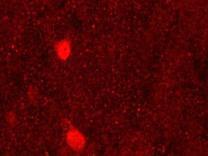
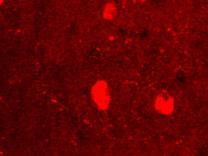
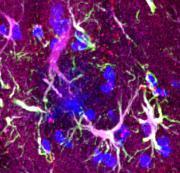
5 and -containing reactive astrocytes even at the age of 23 months. -negative and -positive staining indicates ergic interneurons. (b) Representative confocal images of mice at various ages. mice start to develop amyloid plaques at the age of 4 months. Although the exact level of and varies among amyloid plaques, -positive reactive astrocytes are consistently observed at all ages with amyloid plaques. (c) Representative confocal images of, Iba1, and immunostaining in the molecular layer of DG. (12 months of age) show that is not colocalized with Iba1 but co-localized with. (d) Representative confocal images of 14-month-old 5XFAD mice. is accumulated in reactive astrocytes of 5XFAD mice. Nature Medicine doi:1.138/nm.3639


6 Intensity of Gat3 in + pixels (AU) Intensity of Gat1 in + pixels (AU) Intensity of Gad67 in + pixels (AU) Intensity of Gad65 in + pixels (AU) Intensity of Maoa in + pixels (AU) Intensity of Abat in + pixels (AU) a / Gad67 / Gad67 Merge b / Gad65 / Gad65 Merge 1 mm 1 mm c / Maoa / d / Abat / Maoa Merge Abat Merge 1 mm 1 mm e f g h Gad67 in astrocytes Gad65 in astrocytes Maoa in astrocytes Abat in astrocytes i / Gat1 / / DAPI Gat1 Merge + DAPI 6 Gat1 in astrocytes mm 1 8 WT j / Gat3 / / DAPI Gat3 Merge + DAPI 6 Gat3 in astrocytes mm 1 9 WT Nature Medicine doi:1.138/nm.3639
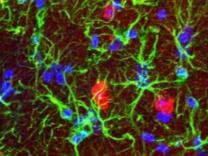
7 Supplementary Figure 3. Gad67, Gad65, Maoa, Abat, Gat1, and Gat3 expression in reactive astrocytes. (a d) Expression of Gad67 (a), Gad65 (b), Maoa (c), and Abat (d) in the molecular layer of DG was tested by immunostaining. Each enzyme is minimally expressed in astrocytes and not changed in -containing reactive astrocytes near the amyloid plaque (9 months of age). (e h) Quantification of confocal images. Mean intensity of Gad67 (e), Gad65 (f), Maoa (g), and Abat (h) was measured in -positive pixels. P >.5 (t-test). (i j) Expression of Gat1 (i) and Gat3 (j) in the molecular layer of DG was tested by immunostaining. Mean intensity of Gat1 (i) or Gat3 (j) was measured in -positive pixels. Expression of both transporters is not changed in -containing reactive astrocytes near the amyloid plaque (9 months of age). P >.5 (t-test). Gad: glutamate decarboxylase. Maoa: monoamine oxidase A, Abat: transaminase, Gat: transporter, WT: wild-type. AU: arbitrary unit. Number on each bar refers to the number of cells analyzed. Data are means ± SEM (error bars). Nature Medicine doi:1.138/nm.3639

 / Maob / Maob")


 GFP")


8 Maob activity (mol g -1 hr -1 ) Maoa activity (mol g -1 hr -1 ) / Maob / Maob / Intensity of putrescine in + pixels (AU) Pearson s correlation Iba1 (-GFP) GFP a / Putrescine / / DAPI Putrescine Merge + DAPI b Putrescine SFig 4 Merge MoDG -GFP Putrescine Merge 2 mm GrDG Putrescine Merge 5 mm Iba1 Putrescine Merge e c SAT Putrescine ** 1 1 WT Mono-acetyl putrescine MAOB d N-acetyl-γaminobutyrate N-acetyl-γaminobutyraldehyde 6 6 -GFP WT ALDH2 6 Iba1 Unknown Acetyl-CoA Coenzyme A, H + O 2, H 2 O H 2 O 2, NH 4 + NAD +, H 2 O 2H +, NADH H 2 O Acetate f g Maob Maob Merge Merge 5 mm 1 mm h i.8 *** j.3 Maob Maoa Water Selegiline Water Sele Water Sele Nature Medicine doi:1.138/nm.3639
9 Supplementary Figure 4. Putrescine, Maob expression, and Maob enzyme activity. (a) Presence of putrescine, a precursor, was detected by immunostaining. Representative confocal images show global existence of putrescine in the DG molecular layer including -positive areas. Putrescine is increased in mice, and most intense staining is observed around amyloid plaques (arrowheads) and near the containing reactive astrocytes. In both genotypes, putrescine is absent in neurons which are clustered at the granule cell layer (1 months of age). (b) Confocal images show that intense staining of putrescine is well colocalized with Iba1- positive microglia in mice (1 months of age). (c) Quantification of confocal images. Mean intensity of putrescine was measured in positive pixels. ** P <.1 (t-test). (d) Pearson s correlation coefficients show that putrescine is colocalized with Iba1 better than or -GFP. (e) Putrescine degradation III pathway for production. MAOB mediates the second reaction step. SAT1: putrescine acetyltransferase, ALDH2: mitochondrial aldehyde dehydrogenase. (f g) Confocal images representing labeling with two commercially available antibodies, which are directed against different epitopes, show increased expression of Maob in containing reactive astrocytes of mice (1 months of age). Antibodies were purchased from Santa Cruz Inc.(f) and Sigma Inc.(g). (h) Colorimetric enzymatic activity assay of Maob. Maob activity in the hippocampus is selectively inhibited by drinking water administration of selegiline (5 1 mg kg -1 day -1 for 3 days) in wild-type mice (13 months of age). (i) Maob activity after selegiline administration. Sele: selegiline. *** P <.1 (t-test). (j) Maoa activity after selegiline administration. n.s. P >.5 (t-test). AU: arbitrary unit. Number on each bar refers to the number of hippocampi analyzed. Data are means ± SEM (error bars). Nature Medicine doi:1.138/nm.3639
 i + control + selegiline + control + selegiline 6 8 ** 6 4 2 9 9 1 1 Cont Sele Cont Sele 5 Selegiline 1.5 12 12 1.5 1.6 1.2.8.4 3 Water.")
10 Amplitude (pa) pa 5 ms b-actin.2 + TTX + TTX 2 * , 4, 6, sepsc interevent interval (ms) * Stimulus intensity (ma) + TTX + TTX , 4, 6, mepsc interevent interval (ms) i + control + selegiline + control + selegiline 6 8 ** Cont Sele Cont Sele 5 Selegiline Water.8 3 Sele Ab oligomer normalized to b-actin Water Tetramer Trimer Dimer Monomer 8 Control Selegiline happ mepsc peak amplitude (pa) h 12.6 eepsc amplitude (pa) Stim sepsc peak amplitude (pa).8 PP Age (month) 1. Patch j 11 Cumulative probability 5 pa 5 ms Control Selegiline f Cumulative probability + TTX 3 e + TTX +.2 mepsc g.4 ** 6 Ab monomer normalized to b-actin d.6 Frequency (Hz) 5 pa 5 ms.8 Cumulative probability 1. Amplitude (pa) Cumulative probability SFig 5 c Frequency (Hz) b sepsc eepsc amplitude (pa) a Water Sele Supplementary Figure 5. Spontaneous EPSCs (sepsc), miniature EPSCs (mepsc), input-output relationship, and Ab species in DG of wild-type and mice. (a c) sepscs recorded from granule cells of DG in wild-type and mice (N = 2 for each group; both sexes at months of age). (a) Representative traces of sepscs. (b) Cumulative probability of sepsc peak amplitude. Inset bar graph: Average amplitude of sepscs. **P <.1 (t-test). (c) Cumulative probability of sepsc interevent interval. Inset bar graph: Average frequency of sepscs. * P <.5 (t-test). Nature Medicine doi:1.138/nm.3639
11 (d f) mepscs recorded from granule cells of DG in wild-type and mice (N = 2 for each group; both sexes at months of age). (d) Representative traces of mepscs. (e) Cumulative probability of mepsc peak amplitude. Inset bar graph: Average amplitude of mepscs. * P <.5 (t-test). (f) Cumulative probability of mepsc interevent interval. Inset bar graph: Average frequency of mepscs. P >.5 (t-test). (g i) Input-output relationship of granule cells of DG in wild-type and mice with or without pretreatment of selegiline (1 mm) (N = 2 for each group; both sexes at months of age). (g) Schematic diagram for the input-output relationship experiments and representative traces of eepscs evoked by stimuli of 3 ma intensity. (h) Relationships between stimulus intensity and eepsc amplitude. ** P <.1 for genotype, P >.5 for drug (Two-way repeated measures ANOVA). *** P <.1 for + selegiline at 5 ms (One-way ANOVA and bonferroni test). (i) Mean amplitudes of eepscs evoked by stimuli of 3 ma intensity. ** P <.1 for genotype, P >.5 for drug (Two-way ANOVA). (j) Effect of selegiline on the level of Ab oligomer and monomer in mice. Western blots of Ab in DG using 6E1 antibody (N = 3 for each group; male at months of age) revealed that the level of Ab monomer and oligomer are not significantly altered by oral administration of selegiline for 1 week. P >.5 (t-test). EPSC: excitatory post-synaptic current. Number on each bar refers to the number of cells (b, c, e, f, i) and mice (j) analyzed. N refers to the number of animals studied. Data are means (c, f, h, i, j) or medians (b, e) ± SEM (error bars). Nature Medicine doi:1.138/nm.3639

 + BIC, CGP (n = 15) 2 4 6 8 1, Stimulus intensity (ma) ES 5 2 4 6 8 1,")
 Selegiline (n = 3) 2 4 6 8 1, Stimulus intensity (ma) Supplementary Figure 6.")
 Selegiline has no apparent effect on spike probability in wild-type littermates (N = 2 for")
 Example traces of evoked EPSP and action potential in wild-type mice at 3 ma stimulation,")
.")
 at 3 ma stimulation, before and after bath application of receptor")
12 Spike probability Spike probability Spike probability a b SFig 6 5 mv 5 mv 5 ms 5 ms Before + BIC, CGP Before + BIC, CGP c + water d + selegiline Probability max Before (n = 12) + BIC, CGP (n = 12).2 Before (n = 15) + BIC, CGP (n = 15) , Stimulus intensity (ma) ES , Stimulus intensity (ma) e f mv.6 5 ms.4 Control Selegiline.2 Control (n = 5) Selegiline (n = 3) , Stimulus intensity (ma) Supplementary Figure 6. Effect of selegiline on spike probability of dentate granule cells in wild-type and mice. (a d) Selegiline has no apparent effect on spike probability in wild-type littermates (N = 2 for WT + water; N = 3 for WT + selegiline; both sexes at months of age). (a) Example traces of evoked EPSP and action potential in wild-type mice at 3 ma stimulation, before and after bath application of receptor antagonists (BIC: 1 mm bicuculline. CGP: 5 mm CGP55845). (b) Example traces in selegiline-administrated wild-type mice (5 1 mg kg -1 day -1, oral administration for 7 days) at 3 ma stimulation, before and after bath application of receptor antagonists. (c) Summary graph of spike probability in wild-type mice versus stimulus intensity. (d) Summary graph of spike probability in selegiline-administered wild-type mice versus stimulus intensity. Nature Medicine doi:1.138/nm.3639
13 (e f) Incubation of slices with selegiline (1 mm, 2 h) has a similar effect with its oral administration in mice (13 months of age). (e) Example traces in mice at 3 ma stimulation, incubation of slices with or without selegiline. (f) Summary graph of spike probability in mice versus stimulus intensity. EPSP: excitatory post-synaptic potential, Probability max : maximum probability, ES 5 : 5% effective stimulus. n refers to the number of cells analyzed. N refers to the number of animals studied. Data are means ± SEM (error bars). Nature Medicine doi:1.138/nm.3639
14 Time spent in quadrants (%) Target crossing number Swim speed (cm s -1 ) Time spent in quadrants (%) Target crossing number Swim speed (cm s -1 ) Escape latency (s) Swim speed (cm s -1 ) a Day 1 Handling Day 15 Day 23 Day 29 b SFig 7 Spatial cues Hidden platform Releasing points c 6 5 Acquisition d 3 Acquisition water + selegiline + water + selegiline Training day * *** * 1 + water + selegiline + water + selegiline Training day e f 1 st probe test + water + selegiline 6 1 st probe test 3 1 st probe test + water + selegiline 4 g Target Right Left Opposite Water Sele Water Sele Water Sele Water Sele h i 2 nd probe test + water + selegiline 6 2 nd probe test 3 2 nd probe test + water + selegiline 4 j Target Right Left Opposite Water Sele Water Sele Water Sele Water Sele Supplementary Figure 7. Morris water maze experiment for testing learning and memory in wild-type and mice treated or non-treated with selegiline. (a b) Experimental protocol for Morris water maze test for wild-type and mice with or without oral administration of selegiline (both sexes at 1 12 months of age). After selegiline administration (1 mg kg -1 day -1 for 14 days), mice were released in a Morris water maze with a hidden platform and spatial cues. Acquisition is tested by 4 trials day -1 for 14 days. Probe test was done on the 23 th and 29 th day in the absence of the platform. (c) Escape latency during acquisition test. Nature Medicine doi:1.138/nm.3639
15 (d) Swimming speed during acquisition test. (e) Time spent in each quadrant during 1 st probe test. (f) Target crossing number during 1 st probe test. (g) Swimming speed during 1 st probe test. (h) Time spent in each quadrant during 2 nd probe test. (i) Target crossing number during 2 nd probe test. (j) Swimming speed during 2 nd probe test. For escape latency, two-way repeated measures ANOVA followed by Bonferroni s post hoc analysis revealed significant effects for the genotype [F(1,88) = , P =.], no drug effect, and significant interaction effect between genotype and drug [F(1,88) = 9.411, P =.3]. ** P <.1, *** P <.1, P >.5. Difference in swim speeds and probe test results among groups are not significant. Number on each bar refers to the number of mice (e j) analyzed. Data are means ± SEM (error bars). Nature Medicine doi:1.138/nm.3639
 Impairment in spike probability and synaptic plasticity Learning and memory")
 have more putrescine (b).")
 which is redistributed away from microdomains.")

16 a (a) Ab plaque Pre SFig 8 release A R Cl (b) Putrescine B R (c) MAOB (d) Synapse (e) BEST1 (f) R Reactive astrocyte Post b from reactive astrocytes Decrease in presynaptic release (PP-DG synapse) Impairment in spike probability and synaptic plasticity Learning and memory impairment Supplementary Figure 8. Model diagram of memory impairment in AD. In AD, astrocytes near Ab plaques (a) have more putrescine (b). Putrescine is degraded by MAOB (c) to produce the inhibitory neurotransmitter (d). is then abnormally released via BEST1 (e) which is redistributed away from microdomains. Then the released binds to extrasynaptic A and B receptors (f) and strongly inhibits presynaptic release and spike probability. Consequently, granule cells of the dentate gyrus receive less glutamatergic inputs at perforant path synapses and show reduced synaptic plasticity. This finally leads to memory impairment in Alzheimer disease. Pre: presynaptic terminal, Post: postsynapse, NMDAR: N-methyl-D-aspartate receptor, AMPAR: -amino-3-hydroxy-5-methyl-4-isoxazole propionate receptor. Nature Medicine doi:1.138/nm.3639
 a SFig 9 b Contralateral Stab wound injury Contralateral")


 and")
 (b) Representative confocal images for")
 Mean intensity of. * P <.5.")
 Mean intensity of interneuronal. P >.5. AU: arbitrary unit.")
17 Intensity of neuronal (AU) Intensity of In + pixels (AU) Intensity of (AU) a SFig 9 b Contralateral Stab wound injury Contralateral Stab wound injury CA1 Py c 4 3 * SR 2 d 1 3, 2, 6 5 Cont Injury *** NeuN 1, 6 5 Cont Injury e 15 Merge Cont Injury 3 mm Supplementary Figure 9. in the reactive astrocytes which is induced by stab wound injury in the CA1 of hippocampus. (a) Target site for stab wound injury. Stab wounds were stereotaxically introduced into the hippocampus (blue arrow). CA1 region adjacent to the injured site (red box) and contralateral non-injured site was observed (N = 3 for each group; males at 1 weeks of age) (b) Representative confocal images for stab wound injury and the contralateral site. (c) Mean intensity of. * P <.5. (d) Mean intensity of in -positive area. *** P <.1. (e) Mean intensity of interneuronal. P >.5. AU: arbitrary unit. Number on each bar refers to the number of slices (c, d) or cells (e) analyzed. N refers to the number of animals studied. Data are means ± SEM (error bars). Nature Medicine doi:1.138/nm.3639
18 Supplementary Table 1. 5% effective stimulus (ES 5 ), maximum spike probability (Probability max ), resting membrane potential (RMP), and input resistance (R input ) of granule cells (n refers to the number of granule cells recorded). Genotype Oral administration Bath application n ES 5 (ma) ± SEM Probability max ± SEM Water ± ±.8 Selegiline ± ±.7 Water ± ±.98 Selegiline ± ±.18 Water before ± ±.11 +BIC,CGP ± ±. Selegiline before ± ±.7 +BIC,CGP ± ±. Water before ± ±.112 Genotype +BIC,CGP ± ±. Selegiline before ± ±.27 Oral administration +BIC,CGP ±.8 1. ±. Bath application RMP (mv) ± SEM R Input (MW) ± SEM Water ± ± Selegiline ± ± Water ± ± Selegiline ± ± Nature Medicine doi:1.138/nm.3639
19 Supplementary Table 2. Detailed information for statistical analysis of behavioral test results. Behavior tests Passive avoidance test Morris water maze test Result from statistical analysis Two-way repeated measures ANOVA (at the.5 level) Genotype effect: F(1,42) = 18.63, P =. Drug effect: F(1,42) = , P =.1 Genotype Drug interaction: not significant One-way repeated measures ANOVA F(3,42) = 14.6, P =. Scheffe's post hoc analysis: WT + water vs. + water, P =. WT + selegiline vs. + water, P =. +water vs. + selegiline, P =.23 One-way ANOVA with Scheffe's post hoc analysis (for each day) Day 1 : WT + water vs. WT + selegiline, P =.4 WT + selegiline vs. + water, P =.42 WT + selegiline vs. + selegiline, P =.43 Day 2 : WT + water vs. + water, P =. WT + selegiline vs. + water, P =. + water vs. + selegiline, P =.13 Two-way repeated measures ANOVA Genotype effect: F(1,88) = , P =. Drug effect: not significant Genotype Drug interaction: F(1,88) = 9.411, P =.3 One-way repeated measures ANOVA F(3, 88) = , P =. Scheffe's post hoc analysis: WT + water vs. + water, P =. WT + water vs. + selegiline, P =.34 WT + selegiline vs. + water, P =. + water vs. + selegiline, P =.12 One-way ANOVA with Scheffe's post hoc analysis (for each day) Day 1 6: not significant Day 7: WT + water vs. + water, P =.48 Day 8: WT + water vs. + water, P =.33 Day 9: WT + water vs. + water, P =.15 Day 1: WT + water vs. + water, P =.13 Day 11: WT + water vs. + water, P =.42 Day 12: WT + water vs. + water, P =.4 Day 13: WT + water vs. + water, P =.4 Day 14: not significant Nature Medicine doi:1.138/nm.3639
20 Supplementary Table 3. Human tissue information for control subjects and subjects with Alzheimer disease. Case Age Sex Braak stage Cause of death Control 1 87 F I Unknown Control 2 88 M I Adenocarcinoma Control 3 86 M II Unknown Control 4 87 F II Unknown Control 5 67 M I Sudden accidental death Control 6 82 M I Colon cancer Control 7 61 M I Unknown Control 8 11 F I Myocardial infarction Control 9 89 M III Renal failure Control 1 68 M I Congestive heart failure Control F I Unknown AD 1 82 M V AD AD 2 79 F VI AD AD 3 7 M VI AD AD 4 59 M VI AD AD 5 8 F V AD AD 6 92 M V AD AD 7 9 F V AD AD 8 1 M V AD AD 9 75 M V AD AD 1 83 M VI AD AD F VI AD Nature Medicine doi:1.138/nm.3639
SUPPLEMENTARY INFORMATION
 Supplementary Figure 1. Normal AMPAR-mediated fepsp input-output curve in CA3-Psen cdko mice. Input-output curves, which are plotted initial slopes of the evoked fepsp as function of the amplitude of the
SUPPLEMENTARY INFORMATION
 SUPPLEMENTARY INFORMATION doi:10.1038/nature11306 Supplementary Figures Supplementary Figure 1. Basic characterization of GFP+ RGLs in the dentate gyrus of adult nestin-gfp mice. a, Sample confocal images
SUPPLEMENTARY INFORMATION
 Supplementary Figure 1. Behavioural effects of ketamine in non-stressed and stressed mice. Naive C57BL/6 adult male mice (n=10/group) were given a single dose of saline vehicle or ketamine (3.0 mg/kg,
Supplementary Figure 1. SybII and Ceb are sorted to distinct vesicle populations in astrocytes. Nature Neuroscience: doi: /nn.
 Supplementary Figure 1 SybII and Ceb are sorted to distinct vesicle populations in astrocytes. (a) Exemplary images for cultured astrocytes co-immunolabeled with SybII and Ceb antibodies. SybII accumulates
1.0. FSL NMDAR-fEPSP 0.8. amplitude (mv) Intensity (µa) 2.0 SD FSL Time (ms)
 Intensity (µa) 2.0 SD FSL Time (ms)") a 2.5 1. AMPAR-fEPSP slope (mv/ms) 2. 1. NMDAR-fEPSP amplitude (mv).8.6.4.5.2. 2 4 6 8. 1 2 3 4 5 Intensity (µa) Intensity (µa) b 2. PPF Ratio (fepsp2/fepsp1) 1..5. 5 1 2 5 Time (ms) Supplementary Figure
a 2.5 1. AMPAR-fEPSP slope (mv/ms) 2. 1. NMDAR-fEPSP amplitude (mv).8.6.4.5.2. 2 4 6 8. 1 2 3 4 5 Intensity (µa) Intensity (µa) b 2. PPF Ratio (fepsp2/fepsp1) 1..5. 5 1 2 5 Time (ms) Supplementary Figure
Supplementary Table I Blood pressure and heart rate measurements pre- and post-stroke
 SUPPLEMENTARY INFORMATION doi:10.1038/nature09511 Supplementary Table I Blood pressure and heart rate measurements pre- and post-stroke Pre Post 7-days Systolic Diastolic BPM Systolic Diastolic BPM Systolic
File name: Supplementary Information Description: Supplementary Figures, Supplementary Table and Supplementary References
 File name: Supplementary Information Description: Supplementary Figures, Supplementary Table and Supplementary References File name: Supplementary Data 1 Description: Summary datasheets showing the spatial
Supplementary Figure 1. Microglia do not show signs of classical immune activation following MD a-b. Images showing immunoreactivity for MHCII (a)
") 1 Supplementary Figure 1. Microglia do not show signs of classical immune activation following MD a-b. Images showing immunoreactivity for MHCII (a) and CD45 (b) in fixed sections of binocular visual cortex
1 Supplementary Figure 1. Microglia do not show signs of classical immune activation following MD a-b. Images showing immunoreactivity for MHCII (a) and CD45 (b) in fixed sections of binocular visual cortex
Nature Neuroscience: doi: /nn Supplementary Figure 1. Diverse anorexigenic signals induce c-fos expression in CEl PKC-δ + neurons
 Supplementary Figure 1 Diverse anorexigenic signals induce c-fos expression in CEl PKC-δ + neurons a-c. Quantification of CEl c-fos expression in mice intraperitoneal injected with anorexigenic drugs (a),
Supplementary Figure 1
 Supplementary Figure 1 AAV-GFP injection in the MEC of the mouse brain C57Bl/6 mice at 4 months of age were injected with AAV-GFP into the MEC and sacrificed at 7 days post injection (dpi). (a) Brains
Supporting Information
 ATP from synaptic terminals and astrocytes regulates NMDA receptors and synaptic plasticity through PSD- 95 multi- protein complex U.Lalo, O.Palygin, A.Verkhratsky, S.G.N. Grant and Y. Pankratov Supporting
Ube3a is required for experience-dependent maturation of the neocortex
 Ube3a is required for experience-dependent maturation of the neocortex Koji Yashiro, Thorfinn T. Riday, Kathryn H. Condon, Adam C. Roberts, Danilo R. Bernardo, Rohit Prakash, Richard J. Weinberg, Michael
SUPPLEMENTARY FIGURES
 SUPPLEMENTARY FIGURES 1 Supplementary Figure 1, Adult hippocampal QNPs and TAPs uniformly express REST a-b) Confocal images of adult hippocampal mouse sections showing GFAP (green), Sox2 (red), and REST
SUPPLEMENTARY INFORMATION
 doi: 10.1038/nature05772 SUPPLEMENTARY INFORMATION Supplemental figure 1. Enrichment facilitates learning. a. Images showing a home cage and a cage used for environmental enrichment (EE). For EE up to
Supplementary Information. Staged decline of neuronal function in vivo in an animal model of Alzheimer s Disease. Supplementary Figures S1-10
 Supplementary Information Staged decline of neuronal function in vivo in an animal model of Alzheimer s Disease Christine Grienberger 1 *, Nathalie L. Rochefort 1 *, Helmuth Adelsberger 1, Horst A. Henning
Lack of GPR88 enhances medium spiny neuron activity and alters. motor- and cue- dependent behaviors
 Lack of GPR88 enhances medium spiny neuron activity and alters motor- and cue- dependent behaviors Albert Quintana, Elisenda Sanz, Wengang Wang, Granville P. Storey, Ali D. Güler Matthew J. Wanat, Bryan
Supplementary Figure 1
 Supplementary Figure 1 Arcuate ChIEF-tdTomato neurons expressed TH These micrographs show that TH-Cre-ChIEF-tdTomato (magenta), expressed by AAV in a TH-Cre mouse, were immunostained with TH (green) in
Social deficits in Shank3-deficient mouse models of autism are rescued by histone deacetylase (HDAC) inhibition
 inhibition") SUPPLEMENTARY INFORMATION Articles https://doi.org/10.1038/s41593-018-0110-8 In the format provided by the authors and unedited. Social deficits in Shank3-deficient mouse models of autism are rescued by
SUPPLEMENTARY INFORMATION Articles https://doi.org/10.1038/s41593-018-0110-8 In the format provided by the authors and unedited. Social deficits in Shank3-deficient mouse models of autism are rescued by
Zhu et al, page 1. Supplementary Figures
 Zhu et al, page 1 Supplementary Figures Supplementary Figure 1: Visual behavior and avoidance behavioral response in EPM trials. (a) Measures of visual behavior that performed the light avoidance behavior
Supplementary Figure 1 Information on transgenic mouse models and their recording and optogenetic equipment. (a) 108 (b-c) (d) (e) (f) (g)
 108 (b-c) (d) (e) (f) (g)") Supplementary Figure 1 Information on transgenic mouse models and their recording and optogenetic equipment. (a) In four mice, cre-dependent expression of the hyperpolarizing opsin Arch in pyramidal cells
Supplementary Figure 1 Information on transgenic mouse models and their recording and optogenetic equipment. (a) In four mice, cre-dependent expression of the hyperpolarizing opsin Arch in pyramidal cells
SUPPLEMENTARY INFORMATION. Supplementary Figure 1
 SUPPLEMENTARY INFORMATION Supplementary Figure 1 The supralinear events evoked in CA3 pyramidal cells fulfill the criteria for NMDA spikes, exhibiting a threshold, sensitivity to NMDAR blockade, and all-or-none
Nature Neuroscience: doi: /nn Supplementary Figure 1. Trial structure for go/no-go behavior
 Supplementary Figure 1 Trial structure for go/no-go behavior a, Overall timeline of experiments. Day 1: A1 mapping, injection of AAV1-SYN-GCAMP6s, cranial window and headpost implantation. Water restriction
Suppl. Information Supplementary Figure 1. Strategy/latency analysis of individual mice during maze learning. a,
 Goal-oriented searching mediated by ventral hippocampus early in trial-and-error learning Ruediger, S, Spirig, D., Donato, F., Caroni, P. Suppl. Information Supplementary Figure 1. Strategy/latency analysis
Short- and long-lasting consequences of in vivo nicotine treatment
 Short- and long-lasting consequences of in vivo nicotine treatment on hippocampal excitability Rachel E. Penton, Michael W. Quick, Robin A. J. Lester Supplementary Figure 1. Histogram showing the maximal
Bone marrow-derived mesenchymal stem cells improve diabetes-induced cognitive impairment by
 Nakano et al. Supplementary information 1. Supplementary Figure 2. Methods 3. References Bone marrow-derived mesenchymal stem cells improve diabetes-induced cognitive impairment by exosome transfer into
Supplemental Information. Menin Deficiency Leads to Depressive-like. Behaviors in Mice by Modulating. Astrocyte-Mediated Neuroinflammation
 Neuron, Volume 100 Supplemental Information Menin Deficiency Leads to Depressive-like Behaviors in Mice by Modulating Astrocyte-Mediated Neuroinflammation Lige Leng, Kai Zhuang, Zeyue Liu, Changquan Huang,
A genetically targeted optical sensor to monitor calcium signals in astrocyte processes
 A genetically targeted optical sensor to monitor calcium signals in astrocyte processes 1 Eiji Shigetomi, 1 Sebastian Kracun, 2 Michael V. Sofroniew & 1,2 *Baljit S. Khakh Ψ 1 Departments of Physiology
Supplementary Figure 1. mir124 does not change neuron morphology and synaptic
 Supplementary Figure 1. mir124 does not change neuron morphology and synaptic density. Hippocampal neurons were transfected with mir124 (containing DsRed) or DsRed as a control. 2 d after transfection,
Nature Neuroscience: doi: /nn Supplementary Figure 1
 Supplementary Figure 1 Bidirectional optogenetic modulation of the tonic activity of CEA PKCδ + neurons in vitro. a, Top, Cell-attached voltage recording illustrating the blue light-induced increase in
Nature Neuroscience: doi: /nn.2275
 Supplementary Figure S1. The presence of MeCP2 in enriched primary glial cultures from rat or mouse brains is not neuronal. Western blot analysis of protein extracts from (a) rat glial and neuronal cultures.
Supplementary figure 1: LII/III GIN-cells show morphological characteristics of MC
 1 2 1 3 Supplementary figure 1: LII/III GIN-cells show morphological characteristics of MC 4 5 6 7 (a) Reconstructions of LII/III GIN-cells with somato-dendritic compartments in orange and axonal arborizations
Dep. Control Time (min)
") aa Control Dep. RP 1s 1 mv 2s 1 mv b % potentiation of IPSP 2 15 1 5 Dep. * 1 2 3 4 Time (min) Supplementary Figure 1. Rebound potentiation of IPSPs in PCs. a, IPSPs recorded with a K + gluconate pipette
aa Control Dep. RP 1s 1 mv 2s 1 mv b % potentiation of IPSP 2 15 1 5 Dep. * 1 2 3 4 Time (min) Supplementary Figure 1. Rebound potentiation of IPSPs in PCs. a, IPSPs recorded with a K + gluconate pipette
Supplementary Figure 1
 8w Pia II/III IV V VI PV EYFP EYFP PV EYFP PV d PV EYFP Supplementary Figure a Spike probability x - PV-Cre d Spike probability x - RS RS b e Spike probability Spike probability.6......8..... FS FS c f
Supplementary Information
 Supplementary Information D-Serine regulates cerebellar LTD and motor coordination through the 2 glutamate receptor Wataru Kakegawa, Yurika Miyoshi, Kenji Hamase, Shinji Matsuda, Keiko Matsuda, Kazuhisa
Supplementary Information
 Supplementary Information Title Degeneration and impaired regeneration of gray matter oligodendrocytes in amyotrophic lateral sclerosis Authors Shin H. Kang, Ying Li, Masahiro Fukaya, Ileana Lorenzini,
Supplementary Materials
 Supplementary Materials Fig. S1. Weights of full-dose treatment groups comparing 1 st, 2 nd, and 3 rd generation gene replacement therapy. Mice were treated at p1 with 4x10 11 GC of the three different
Supplementary Figure 1. Nature Neuroscience: doi: /nn.4547
 Supplementary Figure 1 Characterization of the Microfetti mouse model. (a) Gating strategy for 8-color flow analysis of peripheral Ly-6C + monocytes from Microfetti mice 5-7 days after TAM treatment. Living
Synaptic plasticityhippocampus. Neur 8790 Topics in Neuroscience: Neuroplasticity. Outline. Synaptic plasticity hypothesis
 Synaptic plasticityhippocampus Neur 8790 Topics in Neuroscience: Neuroplasticity Outline Synaptic plasticity hypothesis Long term potentiation in the hippocampus How it s measured What it looks like Mechanisms
Astrocyte signaling controls spike timing-dependent depression at neocortical synapses
 Supplementary Information Astrocyte signaling controls spike timing-dependent depression at neocortical synapses Rogier Min and Thomas Nevian Department of Physiology, University of Berne, Bern, Switzerland
Part 11: Mechanisms of Learning
 Neurophysiology and Information: Theory of Brain Function Christopher Fiorillo BiS 527, Spring 2012 042 350 4326, fiorillo@kaist.ac.kr Part 11: Mechanisms of Learning Reading: Bear, Connors, and Paradiso,
Supplementary Figure 1. ACE robotic platform. A. Overview of the rig setup showing major hardware components of ACE (Automatic single Cell
 2 Supplementary Figure 1. ACE robotic platform. A. Overview of the rig setup showing major hardware components of ACE (Automatic single Cell Experimenter) including the MultiClamp 700B, Digidata 1440A,
Cellular Neurobiology / BIPN 140
 SECOND MIDTERM EXAMINATION Fall, 2015 GENERAL INSTRUCTIONS 1. Please write your name on ALL 6 pages. 2. Please answer each question IN THE SPACE ALLOTTED. 1) /10 pts 2) /10 pts 3) /15 pts 4) /15 pts 5)
Supplementary Figure 1) GABAergic enhancement by leptin hyperpolarizes POMC neurons A) Representative recording samples showing the membrane
 GABAergic enhancement by leptin hyperpolarizes POMC neurons A) Representative recording samples showing the membrane") Supplementary Figure 1) GABAergic enhancement by leptin hyperpolarizes POMC neurons A) Representative recording samples showing the membrane potential recorded from POMC neurons following treatment with
Supplementary Figure 1) GABAergic enhancement by leptin hyperpolarizes POMC neurons A) Representative recording samples showing the membrane potential recorded from POMC neurons following treatment with
How Nicotinic Signaling Shapes Neural Networks
 How Nicotinic Signaling Shapes Neural Networks Darwin K. Berg Division of Biological Sciences University of California, San Diego Nicotinic Cholinergic Signaling Uses the transmitter ACh to activate cation-selective
Hypothalamic TLR2 triggers sickness behavior via a microglia-neuronal axis
 Hypothalamic TLR triggers sickness behavior via a microglia-neuronal axis Sungho Jin, *, Jae Geun Kim,, *, Jeong Woo Park, Marco Koch,, Tamas L. Horvath and Byung Ju Lee Department of Biological Sciences,
SUPPLEMENTARY INFORMATION
 doi:1.138/nature1139 a d Whisker angle (deg) Whisking repeatability Control Muscimol.4.3.2.1 -.1 8 4-4 1 2 3 4 Performance (d') Pole 8 4-4 1 2 3 4 5 Time (s) b Mean protraction angle (deg) e Hit rate (p
Nature Neuroscience: doi: /nn Supplementary Figure 1. Large-scale calcium imaging in vivo.
 Supplementary Figure 1 Large-scale calcium imaging in vivo. (a) Schematic illustration of the in vivo camera imaging set-up for large-scale calcium imaging. (b) High-magnification two-photon image from
Nature Neuroscience: doi: /nn Supplementary Figure 1
 Supplementary Figure 1 Atlas representations of the midcingulate (MCC) region targeted in this study compared against the anterior cingulate (ACC) region commonly reported. Coronal sections are shown on
Tuning properties of individual circuit components and stimulus-specificity of experience-driven changes.
 Supplementary Figure 1 Tuning properties of individual circuit components and stimulus-specificity of experience-driven changes. (a) Left, circuit schematic with the imaged component (L2/3 excitatory neurons)
Serotonergic Control of the Developing Cerebellum M. Oostland
 Serotonergic Control of the Developing Cerebellum M. Oostland Summary Brain development is a precise and crucial process, dependent on many factors. The neurotransmitter serotonin is one of the factors
Unique functional properties of somatostatin-expressing GABAergic neurons in mouse barrel cortex
 Supplementary Information Unique functional properties of somatostatin-expressing GABAergic neurons in mouse barrel cortex Luc Gentet, Yves Kremer, Hiroki Taniguchi, Josh Huang, Jochen Staiger and Carl
Memory Systems II How Stored: Engram and LTP. Reading: BCP Chapter 25
 Memory Systems II How Stored: Engram and LTP Reading: BCP Chapter 25 Memory Systems Learning is the acquisition of new knowledge or skills. Memory is the retention of learned information. Many different
Supplementary Figure 1
 Supplementary Figure 1 The average sigmoid parametric curves of capillary dilation time courses and average time to 50% peak capillary diameter dilation computed from individual capillary responses averaged
Supplementary Information
 1 Supplementary Information A role for primary cilia in glutamatergic synaptic integration of adult-orn neurons Natsuko Kumamoto 1,4,5, Yan Gu 1,4, Jia Wang 1,4, Stephen Janoschka 1,2, Ken-Ichi Takemaru
Bidirectional NMDA receptor plasticity controls CA3 output and heterosynaptic metaplasticity
 Bidirectional NMDA receptor plasticity controls CA output and heterosynaptic metaplasticity David L. Hunt, Nagore Puente, Pedro Grandes, Pablo E. Castillo a NMDAR EPSC (pa) - - -8-6 -4 - st 5 nd 5 b NMDAR
Genesis of cerebellar interneurons and the prevention of neural DNA damage require XRCC1.
 Genesis of cerebellar interneurons and the prevention of neural DNA damage require XRCC1. Youngsoo Lee, Sachin Katyal, Yang Li, Sherif F. El-Khamisy, Helen R. Russell, Keith W. Caldecott and Peter J. McKinnon.
Supporting Online Material for
 www.sciencemag.org/cgi/content/full/312/5779/1533/dc1 Supporting Online Material for Long-Term Potentiation of Neuron-Glia Synapses Mediated by Ca 2+ - Permeable AMPA Receptors Woo-Ping Ge, Xiu-Juan Yang,
Supplementary Fig. 1
 PDK1-dependent quenching of TACE shedding activity in prion and Alzheimer s diseases Mathéa Pietri, Caroline Dakowski, Samia Hannaoui, Aurélie Alleaume-Butaux, Julia Hernandez-Rapp, Audrey Ragagnin, Sophie
Supplementary Materials for VAMP4 directs synaptic vesicles to a pool that selectively maintains asynchronous neurotransmission
 Supplementary Materials for VAMP4 directs synaptic vesicles to a pool that selectively maintains asynchronous neurotransmission Jesica Raingo, Mikhail Khvotchev, Pei Liu, Frederic Darios, Ying C. Li, Denise
Neuroscience 201A (2016) - Problems in Synaptic Physiology
 - Problems in Synaptic Physiology") Question 1: The record below in A shows an EPSC recorded from a cerebellar granule cell following stimulation (at the gap in the record) of a mossy fiber input. These responses are, then, evoked by stimulation.
Question 1: The record below in A shows an EPSC recorded from a cerebellar granule cell following stimulation (at the gap in the record) of a mossy fiber input. These responses are, then, evoked by stimulation.
Synaptic plasticity and hippocampal memory
 Synaptic plasticity and hippocampal memory Tobias Bast School of Psychology, University of Nottingham tobias.bast@nottingham.ac.uk Synaptic plasticity as the neurophysiological substrate of learning Hebb
Nature Neuroscience: doi: /nn Supplementary Figure 1
 Supplementary Figure 1 Subcellular segregation of VGluT2-IR and TH-IR within the same VGluT2-TH axon (wild type rats). (a-e) Serial sections of a dual VGluT2-TH labeled axon. This axon (blue outline) has
Persistent improvement in synaptic and cognitive functions in an Alzheimer mouse model after rolipram treatment
 Persistent improvement in synaptic and cognitive functions in an Alzheimer mouse model after rolipram treatment Bing Gong,, Michael Shelanski, Ottavio Arancio J Clin Invest. 2004;114(11):1624-1634. https://doi.org/10.1172/jci22831.
Supplementary Figure 1. Basic properties of compound EPSPs at
 Supplementary Figure 1. Basic properties of compound EPSPs at hippocampal CA3 CA3 cell synapses. (a) EPSPs were evoked by extracellular stimulation of the recurrent collaterals and pharmacologically isolated
N-methyl-D-aspartate Receptor Mediates X-irradiation-induced Drebrin Decrease in Hippocampus
 2018;68:111~115 Original N-methyl-D-aspartate Receptor Mediates X-irradiation-induced Drebrin Decrease in Hippocampus Shuchuan Miao 1, Noriko Koganezawa 1, Kenji Hanamura 1, Anggraeini Puspitasari 1,2
Mechanisms for acute stress-induced enhancement of glutamatergic transmission and working memory
 (2011) 16, 156 170 & 2011 Macmillan Publishers Limited All rights reserved 1359-4184/11 www.nature.com/mp ORIGINAL ARTICLE Mechanisms for acute stress-induced enhancement of glutamatergic transmission
Nature Neuroscience: doi: /nn Supplementary Figure 1. PICALM expression in brain capillary endothelium in human brain and in mouse brain.
 Supplementary Figure 1 PICALM expression in brain capillary endothelium in human brain and in mouse brain. a, Double immunostaining for PICALM (red, left) and lectin positive endothelial profiles (blue,
(a) Significant biological processes (upper panel) and disease biomarkers (lower panel)
 Significant biological processes (upper panel) and disease biomarkers (lower panel)") Supplementary Figure 1. Functional enrichment analyses of secretomic proteins. (a) Significant biological processes (upper panel) and disease biomarkers (lower panel) 2 involved by hrab37-mediated secretory
Supplementary Figure 1. Functional enrichment analyses of secretomic proteins. (a) Significant biological processes (upper panel) and disease biomarkers (lower panel) 2 involved by hrab37-mediated secretory
Nature Neuroscience: doi: /nn Supplementary Figure 1
 Supplementary Figure 1 Drd1a-Cre driven ChR2 expression in the SCN. (a) Low-magnification image of a representative Drd1a-ChR2 coronal brain section (n = 2) showing endogenous tdtomato fluorescence (magenta).
Synaptotagmin-7-Mediated Asynchronous Release Boosts High-Fidelity Synchronous Transmission at a Central Synapse
 Article Synaptotagmin-7-Mediated Asynchronous Release Boosts High-Fidelity Synchronous Transmission at a Central Synapse Highlights d Syt7 KO does not alter fast release or short-term plasticity of calyx
SUPPLEMENTARY FIG. S2. Representative counting fields used in quantification of the in vitro neural differentiation of pattern of dnscs.
 Supplementary Data SUPPLEMENTARY FIG. S1. Representative counting fields used in quantification of the in vitro neural differentiation of pattern of anpcs. A panel of lineage-specific markers were used
The Timing of Differentiation of Adult Hippocampal Neurons Is Crucial for Spatial Memory
 The Timing of Differentiation of Adult Hippocampal Neurons Is Crucial for Spatial Memory PLoS BIOLOGY Stefano Farioli-Vecchioli 1[, Daniele Saraulli 2,3[, Marco Costanzi 2,3[, Simone Pacioni 4[, Irene
Supplementary Fig. 1: TBR2+ cells in different brain regions.
 Hip SVZ OB Cere Hypo Supplementary Fig. 1: TBR2 + cells in different brain regions. Three weeks after the last tamoxifen injection, TBR2 immunostaining images reveal a large reduction of TBR2 + cells in
Title: Plasticity of intrinsic excitability in mature granule cells of the dentate gyrus
 Title: Plasticity of intrinsic excitability in mature granule cells of the dentate gyrus Authors: Jeffrey Lopez-Rojas a1, Martin Heine b1 and Michael R. Kreutz ac1 a Research Group Neuroplasticity, b Research
Sample Lab Report 1 from 1. Measuring and Manipulating Passive Membrane Properties
 Sample Lab Report 1 from http://www.bio365l.net 1 Abstract Measuring and Manipulating Passive Membrane Properties Biological membranes exhibit the properties of capacitance and resistance, which allow
SUPPLEMENTARY INFORMATION
 doi: 10.1038/nature06994 A phosphatase cascade by which rewarding stimuli control nucleosomal response A. Stipanovich*, E. Valjent*, M. Matamales*, A. Nishi, J.H. Ahn, M. Maroteaux, J. Bertran-Gonzalez,
marker. DAPI labels nuclei. Flies were 20 days old. Scale bar is 5 µm. Ctrl is
 Supplementary Figure 1. (a) Nos is detected in glial cells in both control and GFAP R79H transgenic flies (arrows), but not in deletion mutant Nos Δ15 animals. Repo is a glial cell marker. DAPI labels
Nature Medicine: doi: /nm.3922
 Title: Glucocorticoid-induced tumor necrosis factor receptor-related protein co-stimulation facilitates tumor regression by inducing IL-9-producing helper T cells Authors: Il-Kyu Kim, Byung-Seok Kim, Choong-Hyun
Supplementary Figure 1
 Supplementary Figure 1 Supplementary Figure 1. Short latency of the fepsp evoked in CA3 by electrical stimulation of perforant path inputs (a) Single and superimposed representative perforant pathway-ca3
Nature Neuroscience: doi: /nn Supplementary Figure 1. MADM labeling of thalamic clones.
 Supplementary Figure 1 MADM labeling of thalamic clones. (a) Confocal images of an E12 Nestin-CreERT2;Ai9-tdTomato brain treated with TM at E10 and stained for BLBP (green), a radial glial progenitor-specific
Nature Biotechnology: doi: /nbt Supplementary Figure 1. Diagram of BBB and brain chips.
 Supplementary Figure 1 Diagram of BBB and brain chips. (a) Schematic of the BBB Chip demonstrates the 3 parts of the chip, Top PDMS channel, membrane and Bottom PDMS channel; (b) Image of 2 BBB Chips,
Structural basis for the role of inhibition in facilitating adult brain plasticity
 Structural basis for the role of inhibition in facilitating adult brain plasticity Jerry L. Chen, Walter C. Lin, Jae Won Cha, Peter T. So, Yoshiyuki Kubota & Elly Nedivi SUPPLEMENTARY FIGURES 1-6 a b M
How Synapses Integrate Information and Change
 How Synapses Integrate Information and Change Rachel Stewart class of 2016 https://nba.uth.tmc.edu/neuroscience/s1/chapter06.html https://nba.uth.tmc.edu/neuroscience/s1/chapter07.html Chris Cohan, Ph.D.
Supplemental Figure 1. Intracranial transduction of a modified ptomo lentiviral vector in the mouse
 Supplemental figure legends Supplemental Figure 1. Intracranial transduction of a modified ptomo lentiviral vector in the mouse hippocampus targets GFAP-positive but not NeuN-positive cells. (A) Stereotaxic
GFP/Iba1/GFAP. Brain. Liver. Kidney. Lung. Hoechst/Iba1/TLR9!
 Supplementary information a +KA Relative expression d! Tlr9 5!! 5! NSC Neuron Astrocyte Microglia! 5! Tlr7!!!! NSC Neuron Astrocyte! GFP/Sβ/! Iba/Hoechst Microglia e Hoechst/Iba/TLR9! GFP/Iba/GFAP f Brain
Wenqin Hu, Cuiping Tian, Tun Li, Mingpo Yang, Han Hou & Yousheng Shu
 Distinct contributions of Na v 1.6 and Na v 1.2 in action potential initiation and backpropagation Wenqin Hu, Cuiping Tian, Tun Li, Mingpo Yang, Han Hou & Yousheng Shu Supplementary figure and legend Supplementary
NEURONS COMMUNICATE WITH OTHER CELLS AT SYNAPSES 34.3
 NEURONS COMMUNICATE WITH OTHER CELLS AT SYNAPSES 34.3 NEURONS COMMUNICATE WITH OTHER CELLS AT SYNAPSES Neurons communicate with other neurons or target cells at synapses. Chemical synapse: a very narrow
Disrupting GluA2-GAPDH Interaction Affects Axon and Dendrite Development
 Disrupting GluA2-GAPDH Interaction Affects Axon and Dendrite Development 1 Frankie Hang Fung Lee, 1 Ping Su, 1 Yu Feng Xie, 1 Kyle Ethan Wang, 2 Qi Wan and 1,3 Fang Liu 1 Campbell Research Institute, Centre
Schwarz et al. Activity-Dependent Ubiquitination of GluA1 Mediates a Distinct AMPAR Endocytosis
 Schwarz et al Activity-Dependent Ubiquitination of GluA1 Mediates a Distinct AMPAR Endocytosis and Sorting Pathway Supplemental Data Supplemental Fie 1: AMPARs undergo activity-mediated ubiquitination
What is Anatomy and Physiology?
 Introduction BI 212 BI 213 BI 211 Ecosystems Organs / organ systems Cells Organelles Communities Tissues Molecules Populations Organisms Campbell et al. Figure 1.4 Introduction What is Anatomy and Physiology?
How Synapses Integrate Information and Change
 How Synapses Integrate Information and Change Rachel Stewart class of 2016 http://neuroscience.uth.tmc.edu/s1/chapter06.html http://neuroscience.uth.tmc.edu/s1/chapter07.html Chris Cohan, Ph.D. Dept. of
1) Drop off in the Bi 150 box outside Baxter 331 or to the head TA (jcolas).
 Drop off in the Bi 150 box outside Baxter 331 or to the head TA (jcolas).") Bi/CNS/NB 150 Problem Set 3 Due: Tuesday, Oct. 27, at 4:30 pm Instructions: 1) Drop off in the Bi 150 box outside Baxter 331 or e-mail to the head TA (jcolas). 2) Submit with this cover page. 3) Use a
Bi/CNS/NB 150 Problem Set 3 Due: Tuesday, Oct. 27, at 4:30 pm Instructions: 1) Drop off in the Bi 150 box outside Baxter 331 or e-mail to the head TA (jcolas). 2) Submit with this cover page. 3) Use a
Changes in Extracellular Ionic Composition q
 Changes in Extracellular Ionic Composition q JL Stringer, Baylor College of Medicine, Houston, TX, United States Ó 2017 Elsevier Inc. All rights reserved. Introduction 1 Background 1 Methods 2 Recent Results
Supplementary Figure 1
 Supplementary Figure 1 Localization of virus injections. (a) Schematic showing the approximate center of AAV-DIO-ChR2-YFP injection sites in the NAc of Dyn-cre mice (n=8 mice, 16 injections; caudate/putamen,
Presynaptic mechanisms underlying cannabinoid inhibition of excitatory synaptic transmission in rat striatal neurons
 11488 Journal of Physiology (2001), 532.3, pp.731 748 731 Presynaptic mechanisms underlying cannabinoid inhibition of excitatory synaptic transmission in rat striatal neurons Chiung-Chun Huang, Shiow-Win
BIPN 140 Problem Set 6
 BIPN 140 Problem Set 6 1) The hippocampus is a cortical structure in the medial portion of the temporal lobe (medial temporal lobe in primates. a) What is the main function of the hippocampus? The hippocampus
SUPPLEMENTARY INFORMATION
 DOI: 10.1038/ncb2566 Figure S1 CDKL5 protein expression pattern and localization in mouse brain. (a) Multiple-tissue western blot from a postnatal day (P) 21 mouse probed with an antibody against CDKL5.
Combined Rho-kinase inhibition and immunogenic cell death triggers and propagates immunity against cancer
 Supplementary Information Combined Rho-kinase inhibition and immunogenic cell death triggers and propagates immunity against cancer Gi-Hoon Nam, Eun-Jung Lee, Yoon Kyoung Kim, Yeonsun Hong, Yoonjeong Choi,
Chapter 2: Cellular Mechanisms and Cognition
 Chapter 2: Cellular Mechanisms and Cognition MULTIPLE CHOICE 1. Two principles about neurons were defined by Ramón y Cajal. The principle of connectional specificity states that, whereas the principle