EFFECTS OF WEIGHT LOSS ON VISCERAL ADIPOSITY AND METABOLIC ADAPTATIONS IN DIABETIC VERSUS NON- DIABETIC WOMEN
|
|
|
- Ariel Cox
- 6 years ago
- Views:
Transcription

1 University of Kentucky UKnowledge University of Kentucky Doctoral Dissertations Graduate School 2005 EFFECTS OF WEIGHT LOSS ON VISCERAL ADIPOSITY AND METABOLIC ADAPTATIONS IN DIABETIC VERSUS NON- DIABETIC WOMEN Elizabeth C. Konz University of Kentucky Click here to let us know how access to this document benefits you. Recommended Citation Konz, Elizabeth C., "EFFECTS OF WEIGHT LOSS ON VISCERAL ADIPOSITY AND METABOLIC ADAPTATIONS IN DIABETIC VERSUS NON-DIABETIC WOMEN" (2005). University of Kentucky Doctoral Dissertations This Dissertation is brought to you for free and open access by the Graduate School at UKnowledge. It has been accepted for inclusion in University of Kentucky Doctoral Dissertations by an authorized administrator of UKnowledge. For more information, please contact
2 ABSTRACT OF DISSERTATION Elizabeth C. Konz The Graduate School University of Kentucky 2005
3 EFFECTS OF WEIGHT LOSS ON VISCERAL ADIPOSITY AND METABOLIC ADAPTATIONS IN DIABETIC VERSUS NON-DIABETIC WOMEN ABSTRACT OF DISSERTATION A dissertation submitted in partial fulfillment of the requirements for the degree of Doctor of Philosophy in the Graduate School at the University of Kentucky By Elizabeth C. Konz, MS, RD Lexington, Kentucky Director: Dr. James W. Anderson, Professor of Medicine and Clinical Nutrition Lexington, Kentucky 2005 Copyright Elizabeth C. Konz 2005
4 ABSTRACT OF DISSERTATION EFFECTS OF WEIGHT LOSS ON VISCERAL ADIPOSITY AND METABOLIC ADAPTATIONS IN DIABETIC VERSUS NON-DIABETIC WOMEN Obesity increases the risk for the development of cardiovascular disease, type 2 diabetes and other co-morbid conditions. Type 2 diabetes also is often associated with excessive visceral abdominal fat. Weight loss in obese individuals decreases the risk for developing the co-morbid conditions. Individuals with type 2 diabetes often have a greater difficulty in controlling these complications compared to individuals without type 2 diabetes. The purpose of this study was to evaluate adherence to a medically-supervised low-energy diet (LED) weight loss program and changes in body composition and metabolic parameters after weight loss in women with and without type 2 diabetes. Subjects consisted of Caucasian women, between the ages of 40 to 65 years, with BMIs between 30 and 45 kg/m 2. There was no significant difference in BMI between the groups at study initiation (38.1 kg/m 2, diabetics (DM) and 36.0 kg/m 2, non-diabetics (NDM), p=0.2314). All subjects participated in the HMR Program for 16 weeks. Twenty-nine subjects completed the weight loss phase (18 diabetics, 11 non-diabetics) and were evaluated for change in weight, body composition, and blood parameters. Data were analyzed by repeated-measures ANCOVA and student s t-tests using SAS version DM and NDM lost 11.7% and 16% of body weight, respectively (p=0.6474). Results indicate DM has more total lean tissue (p=0.004), more total body fat (p=0.04), more total abdominal tissue (p=0.001), more visceral adipose tissue (p=0.001) and lost less percent body fat (p=0.04) than NDM after 16 weeks of weight loss. After weight loss there was no significant difference in leptin, ghrelin or adiponectin levels. DM had greater insulin (p=0.05), HOMA-IR (p<0.0001), glucose (p<0.0001), HbA1c (p<0.0001), resistin (p=0.04) and PAI-1 (p=0.02). There were no differences after weight loss in lipid levels, blood pressure, diet compliance or exercise. The data show that medically-supervised LEDs are safe and effective for treating obesity in individuals with type 2 diabetes. Cardiovascular risk factors improved in both NDM and DM subjects with weight loss. The findings also suggest that insulin and metabolically dysfunctional lean tissue may play a critical role in the complex axes affecting changes in body composition and inflammation in individuals with type 2 diabetes. KEY WORDS: Type 2 Diabetes, Obesity, Weight Loss, Body Composition, Low-Energy Diet (LED) Elizabeth C. Konz July 5, 2005
5 EFFECTS OF WEIGHT LOSS ON VISCERAL ADIPOSITY AND METABOLIC ADAPTATIONS IN DIABETIC VERSUS NON-DIABETIC WOMEN By Elizabeth C. Konz James W. Anderson Director of Dissertation Reto Asmis Director of Graduate Studies July 5, 2005
6 RULES FOR THE USE OF DISSERTATIONS Unpublished dissertations submitted for the Doctor s degree and deposited in the University of Kentucky Library are as a rule open for inspection, but are to be used only with due regard to the rights of the authors. Bibliographical references may be noted, but quotations or summaries of parts may be published only with the permission of the author, and with the usual scholarly acknowledgements. Extensive copying or publication of the dissertation in whole or in part also requires the consent of the Dean of the Graduate School of the University of Kentucky. A library that borrows the dissertations for use by its patrons is expected to secure the signature of each user: Name Date
7 DISSERTATION Elizabeth C. Konz The Graduate School University of Kentucky 2005
8 EFFECTS OF WEIGHT LOSS ON VISCERAL ADIPOSITY AND METABOLIC ADAPTATIONS IN DIABETIC VERSUS NON-DIABETIC WOMEN DISSERTATION A dissertation submitted in partial fulfillment of the requirements for the degree of Doctor of Philosophy in the Graduate School at the University of Kentucky By Elizabeth C. Konz Lexington, Kentucky Director: Dr. James W. Anderson, Professor of Medicine and Clinical Nutrition Lexington, Kentucky 2005 Copyright Elizabeth C. Konz 2005
9 DEDICATION This dissertation is dedicated to my family, Marsha Konz Jennifer Konz-Alt and Fredric and Susan Konz
10 ACKNOWLEDGMENTS So many individuals have helped me during my graduate studies in so many different ways, and I would like to thank all of them for their patience, encouragement and support. First, I must thank my Dissertation Chair and mentor, Dr. James W. Anderson, for his guidance through my graduate work. He has provided me with several unique opportunities to enhance my intellect and my research skills. Next I would like to thank my Dissertation Committee consisting of Dr. Geza Bruckner, Dr. Linda Chen, Dr. Thomas Garrity, and Dr. Raymond Reynolds. These individuals have given me continued support over the many years at the University of Kentucky and I could have never finished without them. I would also like to thank the Director of the Graduate Center for Nutritional Sciences, Dr. Lisa Cassis, and the Director of Graduate Studies, Dr. Reto Asmis. I also wish to express my appreciation to all the people who have supported my research endeavors at the University of Kentucky. First, I would like to thank Dr. Linda Chen for her outstanding work at the University of Kentucky and her commitment and dedication towards students. She has provided me encouragement and strength which I needed for this process. Next, I would like to acknowledge Dr. Raymond Reynolds for his help in mentoring and providing medical support for the patients in my study. His expertise and wit have made my research experience positive and fun. I would also like to acknowledge, Dr. Nancy Kukulinsky, Dr. Thomas Getchell and the rest of the administration and staff of the General Clinical Research Center. These individuals provided me with necessary financial support and resources to conduct my research and also invaluable educational experiences. iii
11 Dr. Linda Gotthelf and Dr. Larry Stiffler and the rest of the HMR team for their financial and research support. And a special thanks to all of the wonderful women who participated in my study (who remain anonymous for reasoning of confidentiality purposes). I could have never completed my research without their extremely hard work and determination. It was a pleasure to get to know every one of my research subjects and I pray for their continued success. Most importantly, however, I must thank my family and friends for their instrumental assistance in this process. I would like to thank my mom, Marsha Konz for the encouragement and emotional support that she has provided to me in this process. I must thank my dad, Fredric Konz, and his wife, Susan Konz, for their patience and financial support which allowed me to complete my goals and to make a better life for myself. Finally, I have to thank my sister, Jennifer Konz-Alt, for being my best friend and providing a listening ear when I needed it. iv
12 TABLE OF CONTENTS ACKNOWLEDGMENTS...iii LIST OF TABLES...viii LIST OF FIGURES... ix CHAPTER ONE... 1 Introduction... 1 Statement of the Problem... 1 Objectives and Hypothesis... 1 CHAPTER TWO... 3 Background and Review of Literature... 3 Obesity... 3 Type 2 Diabetes Mellitus... 4 Coronary Heart Disease, Dyslipidemia, and Type 2 Diabetes... 5 A. Coronary Heart Disease (CHD)... 5 B. Dyslipidemia Total Cholesterol Triglycerides LDL-Cholesterol HDL-Cholesterol... 7 C. Type 2 Diabetes and Dyslipidemia... 8 Abdominal Obesity and Body Composition... 9 Adipose and Stomach Hormones A. Leptin B. Ghrelin Insulin Resistance Inflammatory and Thrombotic Cytokines A. Tumor necrosis factor-alpha (TNF-α), Interleukin-6 (IL-6), C-reactive protein (CRP), Plasminogen activating inhibitor-1 (PAI-1) B. Adiponectin C. Resistin Weight Loss A. Very-Low-Energy Diets (VLED) and Low-Energy Diets (LED) B. Type 2 Diabetes Mellitus and Weight Loss CHAPTER THREE Experimental Design and Methods Overview Study Participants Participation of Women and Members of Minority Groups Participation of Children Recruiting Potential Subjects Weight Loss Protocol Weight Loss Safety Study Procedures v
13 Body Composition Analysis A. Dual-Energy X-Ray Absorptiometry (DEXA) B. Air Displacement Plethysmography (BOD POD ) C. Computer Tomography (CT) Body Weight, Waist Circumference and Blood Pressure Physical Exams and Blood Analysis Statistical Analysis CHAPTER FOUR Results Participant Characteristics Weight Loss Body Mass Index (BMI) Body Composition Measurements A. Dual-Energy X-Ray Absorptiometry (DEXA) Percent Body Fat-Total Percent Body Fat-Trunk Total Fat Trunk Fat Total Lean Tissue Trunk Lean Tissue Total Trunk Tissue B. Air Displacement Plethysmography (BOD POD ) Percent Body Fat Total Fat Total Lean C. Computer Tomography (CT) Total Abdominal Fat Visceral Adipose Tissue Subcutaneous Adipose Tissue D. Waist Circumference Blood Parameters A. Insulin / HOMA-IR B. Glucose and HbA1c C. Leptin D. Ghrelin E. Adiponectin F. Resistin G. Interleukin-6 (IL-6) H. Tumor Necrosis Factor-α (TNF-α) I. Plasminogen Activating Inhibitor-1 (PAI-1) J. C-Reactive Protein (CRP) K. Follicle-Stimulating Hormone (FSH) L. Lipids Total Cholesterol Low-Density Lipoprotein Cholesterol (LDL-Cholesterol) High-Density Lipoprotein Cholesterol (HDL-Cholesterol) vi
14 4. Triglycerides Blood Pressure Dietary Compliance CHAPTER FIVE Discussion Weight Loss Body Composition Measurements Baseline Comparison of Body Composition Body Composition Changes with Weight Loss Percent and Total Body Fat Abdominal Adipose Tissue Effects of Weight Loss in Ghrelin Values Effects of Weight Loss in Leptin Levels Effects of Weight Loss in Inflammatory Cytokines Effects of Weight Loss in Thrombotic Cytokines Effects of Weight Loss in Adiponectin Values Effects of Weight Loss in Lipid Levels and Blood Pressure Follicle-Stimulating Hormone Analysis Study Limitations CHAPTER SIX Overall Summary and Conclusion APPENDIX A APPENDIX B APPENDIX C APPENDIX D APPENDIX E APPENDIX F REFERENCES VITAE vii
15 LIST OF TABLES Table 2.1 Classification of Body Mass Index (BMI) to Assess Obesity Table 2.2 Deaths and Percentage of Total Deaths for the 10 Leading Causes of Death: United States, Table 2.3 ATP III Clinical Identification of the Metabolic Syndrome Table 3.1 Nutrient Compositions of the HMR Dietary Supplements Based on the Consumption of 5 Packets per Day Table 3.2 Outline of the Procedures and Measurements Taken Throughout the Clinical Trial Table 4.1 Baseline Characteristics of Subjects Who Completed the Study Table 4.2 Baseline Values and Absolute and Percentage Change from Week 0 at 16 Weeks for Body Composition Measurements of Study Completers Table 4.3 Baseline Values and Changes from Week 0 at 16 Weeks for Fasting Glucose and Insulin Resistance Measurements of Study Completers Table 4.4 Baseline Values and Absolute and Percentage Change from Week 0 at 16 Weeks for Fasting Cytokines and FSH of Study Completers Table 4.5 Baseline Values and Changes from Week 0 at 16 Weeks for Fasting Lipid Values and Blood Pressure viii
16 LIST OF FIGURES Figure 2.1 Pathogenesis of Health Problems Associated with Obesity Figure 2.2 Serum Ghrelin (a) and Leptin (b) Levels in Lean and Obese Individuals With and Without Type 2 Diabetes Figure 2.3 Changes in Leptin Response to Weight Loss Figure 2.4 Changes in Ghrelin Response to Weight Loss Figure 2.5 Schematic Summary of Hormone and Adipokines on the Hypothalamus Figure 3.1 Requirements of The Triple Imperative TM which the HMR Program Considers the Skills Necessary to Control the Greatest Degree of Variability in an Individual s Weight Management Efforts Figure 4.1 Average and Individual Weight Losses in Non-Diabetic and Diabetic Subjects Who Completed the HMR Weight Loss Program Figure 4.2 Percent Weight Loss of Non-Diabetic and Diabetic Subjects Who Completed the HMR Weight Loss Program Figure 4.3 Percent Body Fat Determined by DEXA of Study Completers Figure 4.4 Percent Trunk Fat Determined by DEXA for Study Completers Figure 4.5 Total Body Fat in kg Determined by DEXA of Study Completers Figure 4.6 Trunk Fat in kg Determined by DEXA for Study Completers Figure 4.7 Total Lean Tissue in kg Determined by DEXA of Study Figure 4.8 Completers Trunk Lean Tissue in kg Determined by DEXA of Study Completers Figure 4.9 Total Trunk Tissue Determined by DEXA of Study Completers Figure 4.10 Percent Body Fat Determined by Air Displacement Plethysmography (BOD POD ) of Study Completers Figure 4.11 Total Fat in kg Determined by BOD POD of Study Completers Figure 4.12 Total Lean Tissue Determined by BOD POD of Study Completers Figure 4.13 Total Abdominal Adipose Tissue Determined by Computer Tomography of Study Completers Figure 4.14 Total Subcutaneous and Visceral Adipose Tissue in Study Completers Figure 4.15 Subcutaneous, Visceral and Total Abdominal Fat Loss Determined by Computer Tomography of Study Completers Figure 4.16 Waist Circumference of Study Completers Figure 4.17 Percent Reduction in Waist Circumference and Total Change in Centimeters of Study Completers Figure 4.18 Insulin Levels at Week 0, Week 8 and Week 16 of Study Completers Figure 4.19 HOMA-IR Results at Week 0, Week 8 and Week 16 of Study Completers Figure 4.20 Glucose Levels at Week 0, Week 8 and Week 16 of Study Completers Figure 4.21 HbA1c Values at Week 0, Week 8 and Week 16 of Study Completers ix
17 Figure 4.22 Leptin Levels at Week 0, Week 8 and Week 16 of Study Completers Figure 4.23 Ghrelin Levels at Week 0, Week 8 and Week 16 of Study Completers Figure 4.24 Adiponectin Levels at Week 0, Week 8 and Week 16 of Study Completers Figure 4.25 Resistin Levels at Week 0, Week 8 and Week 16 of Study Completers Figure 4.26 Total Plasminogen Activating Inhibitor-1 (PAI-1) Levels at Week 0, Week 8 and Week 16 of Study Completers Figure 4.27 Total Cholesterol Levels at Week 0, Week 8 and Week 16 of Study Completers Figure 4.28 LDL-cholesterol Levels at Week 0, Week 8 and Week 16 of Study Completers Figure 4.29 HDL-cholesterol at Week 0, Week 8 and Week 16 of Study Completers Figure 4.30 Triglyceride Levels at Week 0, Week 8 and Week 16 of Study Completers Figure 4.31 Meal Replacement Use for Diabetic and Non-Diabetic Subjects. The Average at Week 16 of Study Completers Figure 4.32 Average Weekly Physical Activity for Diabetic and Non-Diabetic Subjects at Week 0, Week 8, and Week 16 as Reported and Recorded into the Patient at a Glance Data Sheets of Study Completers x
18 CHAPTER ONE Introduction Statement of the Problem Obesity plays a pivotal role in the development of type 2 diabetes with approximately 75 percent of individuals with type 2 diabetes mellitus being obese (1-3). With the increasing prevalence of obesity it is not surprising that in the 1990 s the prevalence of type 2 diabetes increased by one-third (4;5). According to the Centers for Disease Control, 97% of adults with diabetes have one or more lipid abnormalities (6). Individuals with type 2 diabetes often have a collective group of cardiovascular risk factors referred to as the metabolic syndrome. These risk factors include insulin resistance, hypertension, elevated triglycerides, low HDL-cholesterol, endothelial dysfunction, a prothrombotic state, and abdominal and visceral obesity (7). Complications of diabetes include blindness, kidney disease, heart disease, stroke, peripheral vascular disease and neuropathy (8). Using data from the Nurses Health Study (9), it was estimated that as much as 80% of the incidence of type 2 diabetes could be attributed to the combined effect of inactivity and overweight / obesity (8). Objectives and Hypotheses Primary Objectives: To determine changes in body composition and hormonal levels in obese individuals with type 2 diabetes compared to matched obese individuals without type 2 diabetes after the completion of a structured low-energy diet weight loss program. The hypotheses are as follows: 1. Obese individuals with type 2 diabetes will lose less body weight than obese individuals without type 2 diabetes. 1
19 2. Obese individual with type 2 diabetes will lose a greater proportion of abdominal fat as visceral adipose tissue compared to obese individuals without type 2 diabetes. 3. Plasma ghrelin levels in response to weight loss will not increase as much in individuals with type 2 diabetes as compared with individuals without type 2 diabetes. 4. Plasma leptin levels in response to weight loss will not decrease as much in individuals with type 2 diabetes as compared with individuals without type 2 diabetes. Secondary Objectives: To determine changes in hormonal, metabolic and lipid levels in obese individuals with type 2 diabetes compared to obese individuals without type 2 diabetes after the completion of a structured low-energy diet weight loss program. The hypotheses are as follows: 1. Obese individuals with type 2 diabetes will have a greater decrease in insulin, interleukin-6 (IL-6), tumor necrosis factor-alpha (TNF-α) and C-reactive protein (CRP) compared to obese individuals without type 2 diabetes. 2. Obese individuals with type 2 diabetes will have a greater decrease in serum triglyceride, plasma activator inhibitor-1 (PAI-) and serum C-reactive (CRP) compared to obese individuals without type 2 diabetes. 3. Obese individuals with type 2 diabetes will have a greater increase in plasma adiponectin compared to obese individuals without type 2 diabetes. 4. Obese individuals with type 2 diabetes will have a reduction in plasma resistin compared to obese individuals without type 2 diabetes. 2
20 CHAPTER TWO Background and Review of Literature Obesity Obesity is increasing in epidemic proportions in the United States and around the world and has become a major global health concern (10;11). Almost two-thirds of adults in the United States are overweight or obese (10). Table 2.1 outlines the body mass index (BMI) criteria for assessing obesity where BMI is an individual s body weight in kilograms divided by their height in meters squared (kg/m 2 ). Obesity and adipose tissue are associated with several co-morbid conditions. Figure 2.1 outlines environmental and genetic contributions to health problems associated with obesity. Specifically, obesity plays a pivotal role in the development of type 2 diabetes with approximately 75 percent of individuals with type 2 diabetes mellitus being obese (1-3). With the increasing prevalence of obesity it is not surprising that in the 1990 s the prevalence of type 2 diabetes increased by one-third (4;5). More than 18 million Americans have diabetes which accounts for 6.3% of the United States population (12). In 2002, diabetes was the sixth leading cause of death listed on U.S. death certificates (13). Table 2.2 lists the top ten leading causes of death in the United States in According to the Centers for Disease Control, 97% of adults with diabetes have one or more lipid abnormalities (6). Individuals with type 2 diabetes often have a collective group of cardiovascular risk factors referred to as the metabolic syndrome. These risk factors include insulin resistance, hypertension, 3
21 elevated triglycerides, low HDL-cholesterol, endothelial dysfunction, a prothrombotic state, and abdominal and visceral obesity (7). As shown in Table 2.2 co-morbid conditions associated with type 2 diabetes are also some of the leading causes of death in the United States. These include the number one leading cause of death, diseases of the heart and the third leading cause of death, cerebrovascular diseases. Type 2 Diabetes Mellitus Type 2 diabetes, is characterized by a combination of insulin resistance which is compounded by deficient insulin secretion (14;15). The most common form of type 2 diabetes is a heterogeneous disorder with genetic and environmental factors contributing to a dual defect involving β-cell dysfunction and insulin resistance (16). In muscle and fat cells, insulin enhances the recruitment of glucose transport proteins (GLUT-4) to the cell surface, thereby increasing glucose uptake into the cell in the postprandial state (16). The impairment in glucose transport that is characteristic of the insulin resistance of obesity and type 2 diabetes can worsen as a result of hyperglycemia (16). Hyperglycemia down regulates the synthesis of GLUT-4 proteins and inhibits the intrinsic activity of these proteins (16). Hyperglycemia also inhibits insulin gene expression and insulin secretion, particularly by impairing glucose-stimulated insulin secretion (16). Regardless of the pathoetiology of type 2 diabetes, any elevation in glycemic levels will secondarily result in increased insulin resistance and decreased insulin secretion (17). 4
22 Coronary Heart Disease, Dyslipidemia, and Type 2 Diabetes A. Coronary Heart Disease (CHD) Coronary heart disease (CHD) is the leading cause of death in the United States (18). Observational studies have shown that overweight, obesity and excess abdominal fat are directly related to cardiovascular risk factors and are associated with increased morbidity and mortality (19-24). Obesity itself may possibly be the greatest risk for the development of CHD (25) and is probably a more significant risk factor for individuals with type 2 diabetes (26;27). Type 2 diabetes is also an independent risk factor for CHD in both men and women (7). The Framingham Study found that individuals with diabetes had a two- to three-fold increase risk of CHD compared with individuals without diabetes (28). Other risk factors leading to the development of CHD include an elevated total cholesterol, low-density lipoprotein (LDL)-cholesterol, triglycerides, blood pressure, fibrinogen and insulin (29), and low levels of high-density lipoprotein (HDL)-cholesterol (22). Coronary heart disease is responsible for approximately 80% of deaths in persons with diabetes (27). A study conducted by Gu et al. (30) using data from the National Health and Nutrition Examination Study (NHANES) looked at the change in mortality from CHD over the last 30 years. The age-adjusted mortality rates from heart disease decreased 36.4% and 13.1% for men without diabetes and men with diabetes, respectively. Women without diabetes also displayed a 27% decrease in mortality from CHD; however, women with type 2 diabetes had a 23% increase in age-adjusted heart disease mortality. Other studies have found that diabetic women in the US have a 3-fold risk of developing CHD (31). This indicates that diabetes 5
23 appears to be one of the greatest risk factors for CHD, especially in women (28;30;32). B. Dyslipidemia 1. Total Cholesterol Individuals are considered to have high total cholesterol with levels >200 mg/dl and are especially at risk when levels are >240 mg/dl (33). Manson et al.. (34) has determined that for every 1% increase in total cholesterol, an individuals risk for the development of CHD increases by approximately 2 to 3 %. In a similar finding, Stamler et al. (35) stated that for every 1 mg/dl increase in total cholesterol that CHD risk increased by 2%. Men and women with a BMI >25 kg/m 2 are associated with having higher levels of total serum cholesterol (36;37). In women, the incidence of hypercholesterolemia also increases with increasing BMI (38). Several large longitudinal studies provide evidence that overweight, obesity and weight gain are associated with increased cholesterol levels (39-41). In addition to higher body weight and BMI, the pattern of fat distribution appears to affect cholesterol levels independently of total body weight. Total cholesterol levels are usually higher in persons with predominant abdominal obesity, defined as a waist-to-hip circumference ratio of >0.8 for women and >1.0 for men (42). 2. Triglycerides Triglyceride levels have been shown to have a strong association with BMI in both cross-sectional and longitudinal studies for both men and women (36;37). Triglyceride levels > 150 mg/dl are considered to be high and puts an individual at increased risk for developing CHD (3). One study separated adults into three age 6
24 groups (20 to 44 years, 45 to 59 years, and 60 to 74 years) and found that individuals with a BMI > 30 kg/m 2 is associated with increasing triglyceride levels compared with individuals with a BMI < 21 kg/m 2. The difference in triglycerides between the higher and lower BMI groups, ranged from 61 to 65 mg/dl in women (36) and 62 to 118 mg/dl in men (37). 3. LDL-Cholesterol A serum LDL-cholesterol concentration of > 160 mg/dl is considered to be high and an independent risk factor for CHD (3). This lipoprotein is the predominant atherogenic lipoprotein and is therefore the primary target of cholesterol-lowering therapy by diet, physical activity and drug therapy. Law et al. (43) concluded that for either a 1% increase or 1 mg/dl increase of LDL-cholesterol that an individuals risk for CHD increased by 1%. Cross-sectional data suggest a 10-unit difference in BMI, from 20 kg/m 2 to 30 kg/m 2, is associated with LDL-cholesterol levels that are higher by 10 to 20 mg/dl (36;37). According to extensive epidemiological data, a 10 mg/dl rise in LDL-cholesterol corresponds to approximately a 10 percent increase in CHD risk over a period of 5 to 10 years (43). 4. HDL-Cholesterol Serum HDL-cholesterol levels are considered to be good cholesterol and are negatively associated with risk for developing coronary heart disease. HDLcholesterol is believed to be able to pull cholesterol out of the cells and transport peripheral cholesterol back to the liver for catabolism. This is often referred to as reverse cholesterol transport. Recommended levels for men are HDL-cholesterol levels of > 45 mg/dl and for women > 55 mg/dl, but the protective level for HDL is > 7
25 60 mg/dl (3). Cross-sectional studies have reported that HDL-cholesterol levels are lower in men and women with higher BMI (44;45). A low HDL-cholesterol level leads to a higher LDL:HDL ratio that enhances the risk of CHD. Longitudinal studies have found that changes in BMI are associated with changes in HDL-cholesterol. A BMI change of 1 unit is associated with an HDL-cholesterol change of 1.1 mg/dl for young adult men and an HDL-cholesterol change of 0.69 mg/dl for young adult women (46). Frick et al. (47) concluded that for every 1% decrease in HDLcholesterol an individual s risk of CHD increased by 3.1%. Stamler et al. (35) reached similar findings in that there is a 2% to 3% increase in the risk of developing CHD for every 1 mg/dl decrease in HDL-cholesterol. C. Type 2 Diabetes and Dyslipidemia According to the Centers for Disease Control, 97% of adults with diabetes have one or more lipid abnormalities (6). Table 2.3 lists the ATP III clinical identification requirements for an individual to be diagnosed with the metabolic syndrome (48). The presence of the metabolic syndrome is equal to a risk for vascular disease with that of a high-risk LDL-cholesterol concentration of 150 to 220 mg/dl (49). Individuals with the metabolic syndrome often have elevations in C- reactive protein and plasminogen activator inhibitor-1 (PAI-1) indicating proinflammatory and prothrombotic states (48). Individuals with type 2 diabetes usually do not have LDL-cholesterol levels different from those in non-diabetic patients. However, the LDL-cholesterol particles in individuals with diabetes are usually small, dense, and oxidized LDL-cholesterol and of particular interest in the risk for CHD. Clinical studies have shown that these 8
26 lipoprotein particles are particularly atherogenic and tend to be present in greater proportion in hypertriglyceridemic patients with insulin resistance associated with abdominal obesity (50-53). Triglyceride levels are often increased and HDLcholesterol decreased in individuals with type 2 diabetes as well, which may be the best predictor of vascular disease in these subjects (54). Longitudinal epidemiological studies have shown that the risk for cardiovascular disease mortality in type 2 diabetic subjects is at least twice that of persons without diabetes and that this relative risk is generally higher in women than in men (28;55). Abdominal Obesity and Body Composition Abdominal obesity is a distinct and independent risk factor for the development of type 2 diabetes (1;29;56-58). Abdominal obesity, particularly visceral adipose tissue, increases both metabolic disorders and the cardiovascular risks of dyslipidemia, hypertension, and cardiovascular disease (19;20;59-62). Visceral fat accumulation is influenced by factors such as age, menopause, stress, smoking, alcohol consumption, socioeconomic status and genetic factors (63;64). Specifically, accumulation of visceral adipose tissue at the L4-L5 level, characterized by waist circumferences of above 110 cm 2 for women and approximately 125 cm 2 is associated with distinct elevations in the risk factors for cardiovascular disease and type 2 diabetes (65;66). Other studies have shown that type 2 diabetes is associated with more accumulation of visceral abdominal fat compared with obese non-diabetic subjects with similar body weight (67;68). 9
27 Several studies have reported that weight loss induces a greater proportion of fat losses as visceral fat compared to subcutaneous fat. Yip et al. (69) reported that non-diabetic women lost kg, with a 28.3% reduction in total abdominal adipose tissue, a 31% reduction in visceral adipose tissue and a 26.0% reduction in subcutaneous adipose tissue. Zamboni et al. (70) reported that obese women with a weight loss of 6.6 kg visceral fat by decreased 40% while subcutaneous fat was reduced 23%. Limited research is available in individuals with type 2 diabetes; however, Takami et al. (71) found similar results in individuals with type 2 diabetes. These individuals with a minimal weight loss of 2-3 kg lost 25.8% of their abdominal fat as visceral adipose tissue and 17.2% as subcutaneous abdominal tissue. Others also showed that obese subjects with an initial abundance of visceral fat do not lose more weight but lose more visceral fat than subjects with less visceral fat (63). One may speculate that since individuals with type 2 diabetes have a greater proportion of their abdominal tissue as visceral fat that these individuals should lose more weight as visceral adipose tissue then obese individuals of the same body weight with less visceral adipose tissue. Due to the increase in health risks related to obesity and particularly obesity with type 2 diabetes, it is important that these individuals lose the excess body fat to decrease the associated metabolic abnormalities accompanying type 2 diabetes mellitus. These metabolic disturbances decrease with weight loss (72); however, obese individuals with type 2 diabetes often have greater difficulty losing weight than obese individuals without type 2 diabetes (73-75). This phenomenon is not fully understood. Several contributing factors could be responsible for the difficulties for 10
28 individuals with type 2 diabetes. One potential contributing factor in losing weight could be that often individuals with type 2 diabetes have followed demanding diet regimens for many years and have diet fatigue making it difficult for these individuals to follow a rigorous energy-deficient diet. Also, diabetic individuals are often on medications to control the metabolic abnormalities and consequently these same medications may promote weight gain. Oral anti-diabetes agents sulfonylureas, meglitinides, and thiazolidinediones and insulin tend to be associated with weight gain (76). The one exception to this is the use of metformin. Metabolic abnormalities present with type 2 diabetes and visceral adiposity, such as hyperglycemia and hyperinsulinemia, make it more difficult to lose weight and maintain weight lost. This may also include abnormalities in non-glucose regulatory hormones affecting energy balance. Another possible factor for this could be the way in which the body regulates energy balance through the central nervous system (CNS). The CNS plays a fundamental role in the regulation of body weight and energy balance by: 1. affecting feeding behavior and physical activity; 2. affecting the autonomic nervous system controlling various aspects of metabolism, and 3. affecting the neuroendocrine system by controlling the secretion of hormones (77). The hormones of the neuroendocrine system used in the body weight regulation and energy balance are quite complex and the cascade of events causing certain individuals to be in a state of either positive or negative energy balance are still not fully understood. Some of the hormones involved in this complex system include leptin, ghrelin, insulin, neuropeptide Y, and growth hormone. Overall, a disruption in 11
29 this complex neuroendocrine pathway will affect the mechanisms by which body weight and energy balance are regulated. Adipose and Stomach Hormones A. Leptin The hormone leptin, a product of the ob gene, is named leptin from the Greek word leptos meaning thin (78). The most important variable that determines circulating leptin concentrations is body fat mass (79). Leptin is produced predominantly in subcutaneous adipose tissue compared with visceral adipose tissue (80). Its role is to increase energy expenditure and inhibit food intake by decreasing the release of neuropeptide Y from the hypothalamus (81). If leptin levels are low during a period of positive energy balance an individual is prone to obesity (82). However, leptin levels have been found to be significantly greater in obese than nonobese subjects (78;80;83). Recent data have indicated that this is likely the result of desensitization for the leptin signal, now referred to as leptin resistance (78;84). Leptin production occurs after increases in insulin in response to feeding and a decrease in leptin concentrations follows decreases in insulin during fasting (85;86). Leptin levels decrease by approximately 20 to 40% when individuals lose approximately 10% of their body weight (87-89). In individuals with type 2 diabetes, leptin levels do not drop as dramatically. Williams et al. (90) found that with an approximate 7.4% weight loss leptin levels decreased 20% in individuals with type 2 diabetes. These researchers also noted that leptin levels increased after sulfonylureas were reinitiated. Because leptin has been found to inhibit food intake and increase 12
30 energy expenditure, the administration of leptin is thought to be a potential pharmacotherapy for obesity. However, since leptin is produced by adipose tissue, leptin levels are often high in obese individuals and does not suppress food intake (87). Pharmacologic trials of the administration of leptin into obese individuals to reduce food intake subsequently were not able to reduce body weight, most likely due to some biological change that occurs over time to the excess of leptin in the body(91). Another possible explanation is leptin s interactions with other neuroendocrine hormones that affect body weight regulation. B. Ghrelin The hormone ghrelin, which is thought to play an important role in this complex energy balance system, is an endogenous ligand for the growth-hormone secretagogue receptor (GHS-R) (92). Ghrelin was named for its ability to provoke growth hormone secretion (the suffix ghre means grow) (93). Ghrelin has profound orexigenic, adipogenic, and somatotropic properties, increasing food intake and body weight. Ghrelin has been found to be produced primarily in the stomach and then secreted into the blood stream (94). Within the stomach, ghrelin is produced by enteroendocrine cells in the oxyntic mucosa (93-98). The orexigenic actions of intracerebroventricular ghrelin appear to be meditated through hypothalamic neuropeptide Y (NPY) and agouti-related protein circuits (99). States of positive energy balance are associated with a decrease in ghrelin levels. Tschöp et al. (100) found that circulating ghrelin levels are decreased in individuals with obesity. Other studies have found that these levels are also decreased during acute overfeeding (100-13
31 102). On the contrary, an increase in circulating ghrelin levels have been observed in fasting patients and in chronic under-nutrition such as with individuals with anorexia nervosa (96;103). Pre-meal rise of circulating ghrelin levels suggest it has a role as a hunger signal triggering meal initiation and this signal could be mediated by GHS-R subtypes (104). Tschöp et al. (100) also observed that ambient ghrelin levels in lean Pima Indians was significantly lower than obese Caucasians and that obese Pima Indians had even lower fasting plasma ghrelin levels. Pima Indians were used in this study due to their high rate of obesity and type 2 diabetes. Fasting ghrelin levels were also found to be negatively correlated with fasting plasma levels of insulin and leptin. In response to weight loss, Cummings et al. (105) found plasma ghrelin levels to increase approximately 24 percent. Several mechanisms for the interaction between leptin and ghrelin have been postulated in the complex neuroendocrine system of energy balance. One suggested mechanism is the activation of neuropeptide Y (106). NPY stimulates food intake and promotes the net deposition of adipose mass (107). Leptin acts to inhibit NPY, while ghrelin activates NPY in the hypothalamus. The antagonistic action is suggested by comparison of levels with obese and lean states. Leptin levels are higher in obese individuals compared with non-obese individuals, whereas ghrelin levels are lower in obese compared to lean individuals. The levels of leptin and ghrelin in obese verses lean adults are demonstrated in Figures 2.2a and 2.2b, respectively. The evidence is inconclusive related to alterations of leptin levels in type 2 diabetes (90; ). After weight loss leptin levels dramatically decline. This is 14
32 mostly likely do to the changes in abdominal adipose tissue. However, we speculate that individuals with type 2 diabetes would exhibit less of a decline in serum leptin concentrations compared with obese subjects since diabetic individuals should lose a greater proportion of their body fat as visceral fat compared with that of subcutaneous adipose tissue, where leptin is predominantly produced. Figure 2.3 shows leptin levels in individuals with and without type 2 diabetes before and after weight loss. We predict that subjects in this study will follow the same pattern resulting in a smaller decrease in leptin levels in women with type 2 diabetes than obese women without type 2 diabetes. Limited information is available on changes in ghrelin level for individuals with type 2 diabetes with or without weight loss. Boden et al. (112) found that diabetic subjects on a low-carbohydrate diet lost 1.65 kg in 14 days and that insulin and leptin levels were statistically significantly lower at the end of the lowcarbohydrate diet than before the diet, while ghrelin levels increased marginally. Figure 2.4 illustrates currently available data and our hypothesized response for fasting ghrelin levels after weight loss in obese type 2 diabetic women. Because Tschöp et al. (100) also found that Pima Indians had lower ghrelin levels than Caucasians, we hypothesized that obese women with type 2 diabetes will have lower fasting ghrelin levels than that of obese women without type 2 diabetes. As stated earlier, Cummings et al. (105) found that ghrelin levels increased after weight loss. Therefore, it is hypothesized that ghrelin levels will rise less dramatically in individuals with type 2 diabetes than individuals without type 2 diabetes. 15
33 Insulin Resistance Besides the variations in the neuroendocrine hormones, other important metabolic variations exist as a consequence of obesity and type 2 diabetes. Many of these are associated with the excessive accumulation of abdominal adipose tissue. An increase in serum insulin levels is the most obvious in individuals with type 2 diabetes. Insulin is an anti-lipolytic hormone which stimulates glucose uptake and triglyceride biosynthesis. Insulin levels have been found to decrease in obese diabetic and non-diabetic individuals during weight loss ( ) reflecting an increase in insulin sensitivity. Insulin sensitivity has a critical role in diabetes and is inversely related to degree of obesity. Methods to test insulin sensitivity are often time-consuming and very expensive. The hyperinsulinemic insulin clamp, the gold standard for measuring insulin sensitivity, requires four hours of subject time and involves several intravenous lines, two infusions and about 40 blood glucose and insulin measurements (117). A simplified technique the homeostasis model assessment (HOMA-IR) has been found to be correlated with the hyperinsulinemic-euglycemic clamp technique (118;119). The HOMA-IR method for the determination of insulinsensitivity derives an estimate of insulin sensitivity from the mathematical modeling of fasting plasma glucose and insulin concentrations (120). 16
34 Inflammatory and Thrombotic Cytokines A. Tumor necrosis factor-alpha (TNF-α), Interleukin-6 (IL-6), C-reactive protein (CRP), Plasminogen activating inhibitor-1 (PAI-1) Adipose tissue is an important organ which produces cytokines that are involved in inflammatory and thrombotic pathways. Examples of such cytokines include tumor necrosis factor- alpha (TNF-α), interleukin-6 (IL-6), C-reactive protein (CRP), and plasminogen activating inhibitor-1 (PAI-1) (121). It has been proposed that these adipokines may be an important factor linking central obesity to other risk components of the metabolic syndrome (122). Subcutaneous adipose tissue produces the cytokines TNF-α (123) and IL-6 (124). TNF-α, a pro-inflammatory cytokine, is associated with insulin resistance and is correlated with the amount of body fat accumulation (125). Obese individuals express 2.5-fold more TNF-α mrna in subcutaneous fat tissue than lean controls, with a significant correlation between TNF-α mrna and BMI (126;127). Dandona et al. (128) found a strong positive correlation between TNF-α mrna expression in fat tissue and the level of insulin. The TNF-α system is complex and is often associated with increased energy expenditure and weight loss (129;130); however, data on the circulating levels of TNF-α in obese and individuals with type 2 diabetes are conflicting (129;130). IL-6 is believed to increase the level of CRP seen in obesity ( ). IL-6 and CRP are increased in obesity (134) and are acute phase reactants associated with inflammation and an increased risk for cardiovascular disease (135) and may also play a role in insulin resistance (136). 17
35 Bastard et al. (136) found that weight loss in obese non-diabetic individuals slightly, but significantly decreased IL-6 levels from 2.78 pg/ml to 2.32 pg/ml (p =0.05) after a weight loss of approximately 5-6 kg. A similar nonsignificant decline in CRP levels was also observed. Before weight loss, CRP levels were mg/l while after weight loss levels decreased to mg/l (p = 0.14). An increase in insulin levels, as seen in type 2 diabetes, have also been found to amplify the production of proinflammatory cytokines (137). Other metabolic alterations exist in individuals with type 2 diabetes increasing cardiovascular disease risk. Increased levels of PAI-1 have been associated with obesity (138) insulin resistance and type 2 diabetes (139). The Insulin Resistance Atherosclerosis Study (IRAS) (140) found that plasma CRP and PAI-1 levels were higher in insulin-resistant subjects who later developed type 2 diabetes than in subjects who did not. Circulating PAI-1 levels are also elevated in patients with cardiovascular disease and may affect the progression of this disease (141). Individuals with type 2 diabetes often have abnormally high serum triglyceride levels and plasminogen activator inhibitor-1 (PAI-1) (142;143). In plasma, PAI-1 promotes clot formation, which plays a key role in the pathogenesis of myocardial infarction, stroke, and other cardiovascular events ( ). Excessive serum insulin associated with type 2 diabetes and visceral adipose tissue, inhibits the mobilization of nonesterified fatty acids by decreasing the rate of lipolysis and consequently increasing the rate of resynthesis of triglycerides from nonesterified fatty acids that are formed from lipolysis (148). The presence of visceral adiposity, insulin resistance and type 2 diabetes also increases the levels of PAI-1 (149;150). Metabolic products 18
36 such as triglycerides, free fatty acids, glucose, insulin, and TNF-α can stimulate PAI- 1 release from fat and other tissues ( ). Both visceral and subcutaneous adipose tissue express PAI-1 (138); however, PAI-1 is primarily secreted by visceral adipose tissue (160). PAI-1 increases thrombosis and decreases the breakdown of blood clotting leading to greater adhesion of platelets to the endothelial wall (150). Weight loss decreases both triglyceride and PAI-1 levels in obese and type 2 diabetic individuals (161;162). B. Adiponectin Adiponectin a recently discovered 244-amino acid, adipose-specific protein (163) is found in high concentrations in peripheral circulation (164). Adiponectin is primarily released by subcutaneous adipose tissue compared with visceral adipose tissue (165). Adiponectin secretion is stimulated by insulin (78) and it has been shown that serum levels of adiponectin correlate with systemic insulin sensitivity (166). It is believed that reduced levels of adiponectin may play a role in the pathogenesis of obesity and type 2 diabetes (166); however, a physiological role has not been fully established. Decreased adiponectin concentrations are associated with insulin resistance and hyperinsulinemia (78). In contrast to leptin, adiponectin levels are significantly reduced not only in obese subjects (122;167;168), but also in patients with some of the disease states associated with obesity, such as type 2 diabetes (168;169) and coronary heart disease (170). In addition, high adiponectin concentrations are associated with a reduced risk of type 2 diabetes (171). Adiponectin levels are 19
37 inversely associated with central or overall adiposity, as well as hyperlipidemia and insulin resistance independently of BMI (172;173). Data are inconsistent in the literature as to adiponectin and its correlations between various metabolic markers. Yamamoto et al. (172) found that plasma adiponectin was negatively correlated with BMI, systolic and diastolic blood pressure, fasting plasma glucose, insulin, insulin resistance, total cholesterol, LDLcholesterol, triglycerides and uric acid and positively correlated with HDLcholesterol in normal-weight subjects. Cnop et al. (174) found similar results. These researchers found plasma adiponectin concentration was negatively correlated with BMI, percentage of body fat, fasting insulin concentration, and plasma triglycerides but positively with HDL (174). Shetty et al. (175), found a positive correlation of adiponectin with HDL and a negative correlation adiponectin with triglycerides, CRP, and PAI.. However, there was no association between adiponectin with total cholesterol, LDL-cholesterol and TNF-α. Consistent with Shetty and colleagues, other data indicate that adiponectin has been associated with markers of inflammation, such as CRP and TNF-α (176;177). Overall, this adipocyte-derived cytokine may exert anti-inflammatory, anti-fibrotic and anti-atherogenic effects and may be beneficial in the treatment of insulin resistance, diabetes, vascular complications and atherosclerosis (178). Research findings vary related to weight reduction and adiponectin change in non-diabetic and diabetic patients (179). Valsamakis et al. (180) found a 27% increase in serum adiponectin (p= 0.04) with a 5.4% weight loss in Caucasian nondiabetic women. In contrast, Wolfe et al. (181) concluded that after a weight loss of 20
38 kg weight loss adiponectin concentrations decreased significantly by 16.2% (p=0.04). Finally, Monzillo et al. (182) found that adiponectin levels increased significantly in subjects with type 2 diabetes (p=0.01), but not in individuals with impaired glucose tolerance or normal glucose tolerance. C. Resistin Resistin is a member of the newly discovered cysteine-rich secretory protein family referred to as RELM or FIZZ. Resistin is more highly expressed in both abdominal visceral and subcutaneous adipose tissue compared with adipose tissue from other areas of the body (183). Several small studies have reported that circulating resistin levels are increased in human obesity ( ) and diabetes ( ). A study in rats conducted by Shuldiner (193) demonstrated that obesity induced by diet as well as in genetic models of obesity and insulin resistance is associated with increased resistin levels (193). Resistin has also been found to increase blood glucose and insulin concentrations in mice (193). Furthermore, resistin gene expression is markedly down-regulated by treatment with the antidiabetic drugs thiazolidinediones, which improve target-tissue sensitivity to insulin. A possible role for resistin in the inflammatory processes is suggested (78). Steppan et al. (194) have proposed that resistin is increased in type 2 diabetes and suggested that it is a potential link between obesity and insulin resistance. However, the role of resistin in obesity and insulin resistance in humans is controversial. Youn et al. (190) found that there is more serum resistin protein in obese than lean individuals; however resistin concentrations were elevated in patients with type 2 diabetes but were not associated with insulin resistance or obesity. These 21
39 researchers also found that BMI is a significant predictor of insulin resistance, but resistin adjusted for BMI was not. On the contrary, Silha et al. (195) demonstrated a significant correlation between resistin levels and HOMA-IR in obese subjects independent of BMI. Overall, there is controversy about whether if resistin plays a role in insulin resistance or is just associated with obesity. The effect of weight loss on resistin levels has also shown conflicting results and the majority of the studies have been conducted in non-diabetic subjects only. Valsamakis et al. (180) found a 16.8% decrease in serum resistin (p=0.02) with a 5.4% weight loss in Caucasian non-diabetic women. Similarly, Azuma et al. (185) found that in non-diabetic individuals who lost 1 kg or more of fat mass, resistin levels decreased significantly ( %, p<.0.01). In contrast Wolfe et al. (181) did not find a significant change in resistin in healthy, normal weight women after weight loss. And finally, Monzillo et al. (182) found that in insulin-resistant individuals there was no significant change in resistin levels after a weight loss of kg. Figure 2.5 provides a schematic summary of the adiposity and stomach signals on their positive or negative effects on weight and cardiovascular risk. Weight Loss A. Very-Low-Energy Diets (VLED) and Low-Energy Diets (LED) Very-low energy diets (VLED) and low-energy diets (LED) are medicallysupervised diet programs. VLEDs provide 500 to 800 kcal/day, whereas low-energy diets (LED) provide 800 to 1200 kcal/day. The active phase of these programs commonly lasts from 12 to 16 weeks. During this time, VLEDs promote a weight loss of approximately 14 to 23 kg and 9 to 13 kg with LEDs. In three of the four 22
40 studies comparing VLEDs to hypocaloric-balanced diets, VLEDs resulted in 4 to 12 kg greater weight loss than the reduced-energy diets consisting of 1,000 to 1,800 kcal/day at the end of the active weight loss phase ( ). These comprehensive, medically-supervised diets have been found safe and appropriate for the treatment of obesity in individuals with type 2 diabetes (199), however, due to increased expense of the VLED, LED are commonly used in clinical practice (200). Often individuals who follow conventional weight reducing diet techniques lose minimal amounts of body weight. For example, Markovic et al. (161) found a kg weight loss with a caloric restriction of 1,000 kcal/day. Metz et al. (201) found that women lost kg following a 10-week prepared meal plan and individuals following a 10-week self-selected mixed-food plan lost kg. Faith et al. (202) summarized weight loss treatment by behavior therapy and conventional reducing diet techniques. They reported more positive results from the 5 studies they summarized and concluded that individuals lost 8.5 kg during a 21.3 week treatment. Individuals with type 2 diabetes have a more difficult time losing weight with the conventional and behavioral approaches to weight loss compared to non-diabetics. McCarron et al. (203) found that with a prepared meal plan (Campbell s Center for Nutrition and Wellness meal program [CCNW]) women with type 2 diabetes lost kg and individuals who consumed a self-selected diet based on exchange lists lost kg of body weight. In a continuation of the study, Pi-Sunyer et al. (73) compared the CCNW and self-selected diet programs in individuals with type 2 diabetes and found that weight losses were kg and kg, 23
41 respectively. Wing et al. (204) found similar results in individuals with type 2 diabetes. During a 16-week energy restricted diet, subjects lost kg of body weight. In one study type 2 diabetic women were able to lose as much weight as nondiabetic subjects (6.8 kg); however, the type 2 diabetic subjects were not able to maintain the weight loss as well as the non-diabetic women (75). B. Type 2 Diabetes Mellitus and Weight Loss Treatment goals for individuals with type 2 diabetes are to promote weight loss and to improve glycemic control, thus the initial treatment choice for individuals who are overweight or obese with type 2 diabetes is weight loss. Weight loss improves insulin sensitivity due to increased non-oxidative glucose disposal (205). Consequently, type 2 diabetic individuals display improved glycemic control and reduce insulin resistance with weight loss (206;207). Weight loss in these individuals will also lower blood pressure and improve their serum lipid concentrations (208). Several researchers have shown that VLED treatment may be beneficial in obese type 2 diabetics, both from weight and glycemic control points of view (113;199;209;210). Previous studies have shown that during VLED treatment, reduction in blood glucose levels occurs rapidly with the first 7 to 14 days (199;210). Capstick et al. (211) found that after a 12 week VLED program with type 2 diabetics that blood glucose levels fell rapidly at the onset of the VLED. The median fasting and postprandial blood glucose levels fell by 25% and 20% respectively after 2 days of treatment. There was a significant decrease in weight, waist circumference, HbA1c, systolic blood pressure, fasting plasma insulin, and total cholesterol and triglyceride levels. All subjects discontinued using insulin and the use of oral diabetic 24
42 agents decrease dramatically. Moreover, reduction in waist circumference following a VLED treatment is also important. As recent data suggest, a high waist circumference increases the risk of cardiovascular disease (212). In a quantitative analysis of individuals with type 2 diabetes and the use of LED therapy, Anderson et al. (213) found that a greater weight loss was associated with a significant increase in HDL-cholesterol values (+3.9, 95% CI, 0.1 to 7.8) while lesser weight loss was associated with a significant decrease in HDL-cholesterol values (-5.9, 95% CI, -9.4 to -2.3). This is consistent with our previous analysis conducted in individuals without type 2 diabetes (25). Greenfield et al. (214) reported that a 10-day total fast with weight loss of 5.1% of initial body weight decreased fasting plasma glucose values in type 2 diabetic subjects by 64% (from 17.2 mmol/l to 6.1 mmol/l). Anderson et al. (213) quantified 10 studies of subjects treated with a VLED for 4 to 6 weeks. Subjects lost 9.6% of initial body weight and after 2 weeks of VLED treatment, fasting plasma glucose decreased by approximately 50% of their fasting plasma glucose. This decrease in plasma glucose remained throughout the VLED treatment. Anderson et al. (213) also quantified the fasting plasma glucose response in type 2 diabetes during LED weight loss programs. The results indicated that fasting plasma glucose values decrease approximately 30% with a weight loss of 10 kg. However, consistent with previous studies (113;209), they concluded that greater weight loss was associated with greater improvements in plasma glucose values. Anderson and Konz (25) estimated that for every 1 kg of weight loss in individuals with type 2 diabetes you can expect approximately a 0.2 mm (3.6 mg/dl) decrease in fasting glucose concentrations. 25
43 The importance of alleviating these co-morbid risk factors associated with type 2 diabetes has stimulated the research presented here to evaluate the effects of a low-energy diet (LED) weight loss program on the health risk factors associated with type 2 diabetes. 26
44 Table 2.1 Classification of Body Mass Index (BMI) to Assess Obesity. WHO Classification Popular Description BMI (kg/m 2 ) Risk of Co-Morbidities Underweight Thin < 18.5 Low (but risk of other problems increased) Healthy Weight Normal Average Overweight > 25.0 Pre-obese Overweight Increased Obese Class I Mild Obesity Moderate Obese Class II Moderate Obesity Severe Obese Class III Severe Obesity > 40.0 Very severe 27
45 Table 2.2 Deaths and Percentage of Total Deaths for the 10 Leading Causes of Death: United States, Taken from the National Vital Statistics Report (13). Rank Cause of Death # of Deaths Percentage of Total Deaths All causes 2,443, Diseases of heart 696, Malignant neoplasms 557, Cerebrovascular diseases 162, Chronic lower respiratory diseases 124, Accidents (unintentional injuries 106, Diabetes Mellitus 73, Influenza and pneumonia 65, Alzheimer's disease 58, Nephritis, nephrotic syndrome and nephrosis 40, Septicemia 33,
46 Table 2.3 ATP III Clinical Identification of the Metabolic Syndrome (48). Risk Factor Abdominal obesity, given as waist circumference Men Women Triglycerides HDL cholesterol Men Women Blood pressure Fasting glucose Defining Level >102 cm (>40 inches) >88 cm (>35 inches) >150 mg/dl <40 mg/dl <50 mg/dl >130 / >85 mmhg >110 mg/dl 29
47 Figure 2.1 Pathogenesis of Health Problems Associated with Obesity. Adapted from Bray (215). Environment Genes Activity Food Intake Excess fat stores Diseases due to fat cell size Diseases due to fat mass Diabetes NAFLD CVD Stigma Sleep Apnea Gall Bladder Disease Cancer Osteoarthritis 30
48 Figure 2.2 Serum Ghrelin (a) and Leptin (b) Levels in Lean and Obese Individuals With and Without Type 2 Diabetes. (a) Ghrelin fmol/ml Lean Obese Caucasians Pima Indians *Data from Tschöp et al. (100) (b) Leptin ng/ml Nondiabetics Diabetics 5 0 Lean Obese *Data from Misra et al. (216) *Leptin values are expressed as square root transformations 31
49 Figure 2.3 Changes in Leptin Response to Weight Loss. ng/ml Nondiabetics Diabetics 0 Before Weight Loss After Weight Loss * Data for Non-diabetic individuals (Cummings et al.) (105) * Data for Diabetic individuals (Williams et al.) (90) 32
50 Figure 2.4 Changes in Ghrelin Response to Weight Loss. 200 fmol/ml Weight Loss Predicted 50 Before Weight Loss After Weight Loss * Data for weight loss taken from Cummings et al. (105) * Predicted is the hypothesized response before and after weight loss in obese individuals with type 2 diabetes. 33
51 Figure 2.5 Schematic Summary of Hormone and Adipokines on the Hypothalamus. Hypothalamus + Insulin Leptin Ghrelin Adiposity Signals Stomach Adiponectin Resistin _ + Insulin Resistance 34
52 CHAPTER THREE Experimental Design and Methods Overview Obese, Caucasian women with and without type 2 diabetes participated in the study. Subjects were between the ages of 40 and 65 years with a BMI between 30 and 45 kg/m 2. Subjects without type 2 diabetes mellitus were matched with women with type 2 diabetes for age and BMI. Subjects participated in a 16-week medicallysupervised low-energy diet (LED) weight loss program after a 2 to 4-week run-in period to determine body composition, current metabolic parameters, and to regulate diabetic medications. Study Participants Caucasian women with a BMI between 30 and 45 kg/m 2, between the ages of 40 and 65 years were recruited to participate in the study. Subjects were not currently dieting or taking weight loss medications. The health of each subject was stable without severe coronary artery disease, cerebrovascular disease or recent myocardial infarction. A. Inclusion Criteria Women ages 40 to 65 years; Caucasian; and BMI 30 to 45 kg/m 2. B. Exclusion Criteria Pregnancy, lactation or plans to become pregnant in the next 6 months; 35
53 TSH >6 µu/ml; Severe coronary artery disease, cerebrovascular disease or recent myocardial infarction or any other serious medical condition; Recent history of alcohol abuse with current intake of > 2 drinks per day; Use of weight reducing agents, such as phentermine, sibutramine, orlistat, bupropion, or an herbal weight loss product within the last eight weeks; Psychosis or other major psychiatric problems including severe depression; Chronic corticosteroid therapy; Chronic use of non-steroidal anti-inflammatory drugs (NSAIDs) or COX inhibitors which include the following: Advil, Aleve, Naprosyn, Celebrex, Voltaren, Lodine, Indocin, Orudis, Oruvail, Daypro, Relafen, Clinoril, Tolectin, Vioxx, or Bextra ; Currently taking thiazolidinedione medications (Rosiglitizone, Pioglitazone); Uncontrolled hypertension with: o systolic blood pressure >140 mmhg; or o diastolic blood pressure >90 mmhg Those who, in the opinion of the principal investigator, have a risk of noncompliance with study procedures. C. Exclusion criteria specific for subjects with type 2 diabetes HbA1c < 6.0% or >10%. D. Exclusion criteria specific for subjects without type 2 diabetes A combination of 2 or more of the following: o Triglyceride >150 mg/dl 36
54 o HDL <50 mg/dl o High blood pressure (systolic blood pressure >130 mmhg, diastolic blood pressure >85 mmhg); or o Fasting blood glucose levels >110 mg/dl (6.1 mmol/l). Participation of Women and Members of Minority Groups Caucasian women were selected for study because approximately 80 percent of participants in our community who attend the Health Management Resources weight-loss program are Caucasian women. Body composition for various ethnic groups is also different. Weinsier et al. (217) found despite similar weight losses, Caucasian women lost a greater percentage of abdominal fat as intraabdominal fat and less subcutaneous abdominal fat compared with black women; therefore to reduce heterogeneity in this pilot study only Caucasian subjects were recruited. Participation of Children Children did not partake in this study because they do not meet the entry criteria of the study. Also, the body composition of prepubertal individuals is different from adults and thus the changes would not be comparable. Recruiting Potential Subjects Participants were recruited by newspaper advertisements in Lexington Kentucky and surrounding communities. Announcements were posted in the Medical Center of the University of Kentucky. In addition, physicians at University of Kentucky Medical Center were asked to inform obese patients of the study for their possible recruitment. Potential research candidates were screened by phone to determine the individual s age, gender, and general health status. Subjects were then 37
55 asked to attend an Orientation at HMR and if the subject was still interested a screening visit was scheduled. Weight Loss Protocol Research subjects participated in the Health Management Resources (HMR ) weight loss program. HMR is a commercial medically-supervised low-energy diet (LED) program consisting of dietary supplements and entrees providing complete nutrition. Table 3.1 lists the macronutrient composition of the HMR 800 supplements for the LED consisting of 800 kcal/day if five shakes are consumed. Individuals attending HMR are categorized into risk groups depending on initial BMI, age, medical history and presence of other co-morbid conditions associated with obesity such as hypertension, coronary heart disease, and diabetes. In this research study, subjects met the requirements of the medically-supervised risk group and were prescribed the minimum 800 kcal/day LED. Subjects consumed only HMR products during the sixteen-week weight-loss phase allowing for control over dietary intake. Individuals participated in either the HMR program which consists of a minimum of 3 HMR 800 shakes and 2 entrees or consumed a minimum of five shakes per day. During the LED program, two HMR vitamins were prescribed each day. Patients had the option to supplement with other HMR weight loss products as well such as Benefit Bar or HMR Chicken soup. The HMR program (218) insists that individuals attend weekly classes and make midweek phone calls to aid in the individual's accountability for their weight loss. Individuals must also keep daily records of the number of meal replacements consumed, caloric intake, and daily physical activity. This information is collected 38
56 by the health educator and recorded into a form referred to as Patient at a Glance. Other information collected in the Patient at a Glance form is if the individual meet the requirements of The Triple Imperative TM. Figure 3.1 explains the requirements for an individual to meet The Triple Imperative TM. The Triple Imperative TM includes the skills that control the highest degree of variability in an individual s weight loss efforts. Finally, the number of days the individual meets their daily requirements of meal replacements, physical activity and not consuming food products not on the diet are recorded on the Patient at a Glance form. This is referred to as the number of days in the box. The most common side effects of a LED program include dizziness, low energy, bowel changes, muscle cramps and cold intolerance (218). Weight Loss Safety The use of a LED in this population has been determined to be safe. For example, a woman 5'2" would not be at risk for the following reasons: 1. If this woman had a BMI of 30 kg/m 2 her body weight would be approximately 164 lbs or 74.5 kg. At an optimal BMI of 22 kg/m 2 her ideal body weight would be 122 lbs. 2. Using the recommended equations for women between the ages of 31 to 60 by the World Health Organization (WHO)(219) for estimating basal metabolic rate (BMR): BMR = ( X 74.5 kg ) X 240 kcal/day = 1461 kcal/day 3. For the given body weight, the amount of energy burned walking one mile can be calculated by: Body weight (lbs) X 2/3 = kcal/mile 164 X 2/3 = 109 kcal/mile This would result in approximately 765 kcal energy expenditure per week. 39
57 4. The total daily energy needs would equal 2226 kcal. When you subtract the kcal provided by the dietary supplements, the individual is in a caloric deficit of 1326 kcal. This caloric restriction would approximate a 2.5 lb per week weight loss. With an anticipated 2.5 lb. per week weight loss the individual would be expected to lose 40 lbs or approximately 15% of their initial body weight. This would result in an anticipated end body weight of 124 lbs and thus the individual would not be at risk during this study. Study Procedures Table 3.2 outlines procedures completed at each visit throughout the trial. Visits are described according to week of the study. Week -3 is the screening visit and is considered Baseline. Week -1 is the first visit at the General Clinical Research Center to obtain Baseline body composition and blood measurements. This visit is sometime prior to the initiation of the weight loss diet. Week 0 is the initiation of the weight loss diet. Weeks 1 through 16 are the weeks the subjects are active in the weight loss program. Body Composition Analysis Body composition analysis was conducted at the University of Kentucky General Clinical Research Center (GCRC) and the Diagnostic Radiology Department at the University of Kentucky Medical Center. Total and regional body composition was measured with dual-energy x-ray absorptiometry (DEXA), air displacement plethysmography (BOD POD ) and computer tomography (CT) scans. As shown in Table 2, body composition analysis was conducted at weeks -1, 8, and 16 for DEXA and BOD POD and at weeks -1 and 16 for CT. 40
58 A. Dual-Energy X-Ray Absorptiometry (DEXA) The procedure for the DEXA scan was that as Kamel et al. (220) who used a standard whole body DEXA examination, which included total body and three regional measurements of trunk (chest, abdomen and pelvis), arms and legs to analyze body composition according to the three-compartment model (fat mass, lean mass and bone mineral content). The standard soft tissue analysis was performed using the software provided by the manufacturer. The GE Lunar Prodigy TM (Madison, WI) was used to conduct the scans. Total body fat was estimated for each subject in kilograms. Subjects were informed not to wear any metal for the scan. The scan takes approximately 12 minutes. B. Air Displacement Plethysmography (BOD POD ) The procedure to determine total body volume and percent body fat using the BOD POD requires subjects will sit quietly in a specifically designed chamber (Life Measurement Instruments, Concord, CA) using an air displacement technique. The BOD POD chamber has a clear plastic window at the level of the subjects face so that they may view the room outside of the chamber and receive directions by hand gestures from the technician. The first two air displacement measurements consist of the subject sitting quietly for approximately one minute. The third measurement their thoracic lung volume measurements are determined using a spirometer technique. This technique requires the subject to breath normally into a plastic tube for 2 inhalations and one exhalation followed by 3 puffs. The total measurement times took approximately 5-10 minutes. 41
59 C. Computer Tomography (CT) The visceral and subcutaneous abdominal fat masses were determined by abdominal CT scans by the department of Diagnostic Radiology at the University of Kentucky Medical Center using a Siemens Somatom Plus 4 and a Plus 10 (Munich, Germany). Computer tomography procedures were followed as performed by Akazawa et al. (221), for the determination of the separation of abdominal fat tissues. The CT scan was performed at the L4-L5 lumbar with the subject resting in the supine position. The total area of the cross-sectional fat region (i.e., including both subcutaneous and visceral fat) at the umbilical level were traced inside the skin to calculate the total number of pixels showing CT values between -50 and -150 HU. The visceral fat area was traced manually along the inside of the abdominal wall and the number of pixels showing the same range of CT values will be calculated for this region. The reading of the abdominal scans was conducted by a radiology resident at the University of Kentucky Medical Center. Body Weight, Waist Circumference and Blood Pressure Body weight was measured on an electronic scale to the nearest 0.1 pound. Waist circumference was be determined by obtaining the minimum circumference (minimum circumference between the lower-rib margin and the iliac crest, mid-waist) and the maximum hip circumference while standing with their heels together. This was conducted by the same person at the screening visit and the final visit at the GCRC. Blood pressure, measured using a sphygmomanometer, was obtained at the screening visit and at each visit to the GCRC. At the weight loss clinic, a registered 42
60 nurse measured body weight and blood pressures of each subject prior to each weekly behavioral HMR class. Physical Exams and Blood Analysis Physical examinations including a health history and an electrocardiogram (ECG) were conducted at the screening visit at the Metabolic Research Group (MRG) and at the final visit at the GCRC. Limited physical examinations were performed at weeks 4, 8, and 12. The physical exams performed at HMR were conducted by both attending physicians and medical residents. Fasting blood samples were taken at the GCRC at weeks -1, 8, and 16 and analyzed at the laboratory for a complete metabolic panel, a lipid profile, a complete blood count with differential and platelets (CBC), and measurements of ghrelin, leptin, insulin, interleukin-6 (IL-6), tumor necrosis factor- alpha (TNF-α), plasminogen activator inhibitor-1 (PAI-1), C-reactive protein (CRP), adiponectin, resistin, HbA1c, and follicle-stimulating hormone (FSH). At weeks 4 and 12 standard safety blood tests consisting of a complete metabolic profile, lipid profile and CBC were taken at HMR. At week -3, the screening visit blood tests consisting of a complete metabolic profile, lipid profile, and CBC were taken along with TSH to check for thyroid defects. Screening and safety laboratory measurements were conducted by Quest Diagnostics and LabCorp. Leptin, adiponectin, resistin, IL-6, TNF-α, CRP and FSH values were determined by the General Clinical Research Center Core Laboratory. Leptin, adiponectin, high sensitivity IL-6 and high sensitivity TNF-α were analyzed with Elisa assays from R & D Systems (Minneapolis, MN) and resistin, CRP and FSH were analyzed using Elisa techniques from ALPCO Diagnostics (Windham, 43
61 NH). Total ghrelin and total plasminogen activating inhibitor-1 were analyzed by LINCO Diagnostic Services, Inc. (St. Charles, MO). Total ghrelin was analyzed with RIA in pg/ml. Total PAI-1 was analyzed by Human Adipokine Lincoplex in pg/ml. Insulin, complete metabolic panel and lipid profiles were analyzed by the University of Kentucky Clinical Laboratory. Statistical Analysis The contrast of interest used to determine effect size was the differences in the amount of body weight that obese women with type 2 diabetes compared to obese women without type 2 diabetes lose after a weight-reducing LED. This contrast is likely to also give meaningful trends in ghrelin and body composition. Data are not available to provide adequate means and standard deviations to determine these contrasts. However, the present research will be able to provide a solid basis for further research and hypothesis development in these areas. Power analysis was conducted using a two-sample t-test to determine the number of subjects required for the study. After review of the literature regarding changes in body weight in obese women with type 2 diabetes and obese women without type 2 diabetes, means of 9.2 kg and 12.3 kg change in body weight were used to determine power with a standard deviation of 3.8. The test was 1-sided and utilized a power of 0.8 and an alpha of.05. The power analysis revealed that with a beta of.80, 20 subjects would be needed in each group to find significance. We choose 25 subjects to participate in each group to allow for less than a 20 percent attrition rate. 44
62 Analysis of baseline scores of the dependent variables was analyzed using a one-way ANOVA to determine if obese individuals with type 2 diabetes and obese individuals without type 2 diabetes mellitus are comparable. The original statistical analysis of the primary outcome variables body weight, decreased leptin response and increased ghrelin response were to be analyzed by repeated-measures analysis using the PROC MIXED model of SAS version The variable of initial body weight and several of the other outcome measurements such as subcutaneous and visceral adipose tissue were determined to be significantly different at baseline. Thus, the PROC MIXED model was not an appropriate analysis for this study. Instead we modified the mixed model to include baseline as a covariate and thus used analysis of covariance (ANCOVA) to determined changes in the outcomes. The ANCOVA analysis is a combined regression analysis with an analysis of variance and thus takes differences in baseline values into account. All primary and secondary outcome variables were analyzed by ANCOVA analysis. Two-sample student s t-test assuming unequal variances were also used to determine if there were absolute differences in the outcome variables for each time point since the sample sizes for each group were not the same. Pearson s correlation was used to determine relationships between variables at week
63 Table 3.1 Nutrient Compositions of the HMR Dietary Supplements Based on the Consumption of 5 Packets per Day. Nutrient HMR 800 Calories, kcal 800 Protein, g 80 Carbohydrate, g 97 Fat, g 10 Fiber, g 2 to 5 Cholesterol, g 65 Sodium, mg
64 Table 3.2 Clinical Trial. Outline of the Procedures and Measurements Taken Throughout the Week Body Weight, Waist Circumference and Blood Pressure X X X X X X X X X X X X X X X X X X X Physical Exam X X a X a X a X Blood Tests X b X c X d X d X c X d X c Body Composition X X e X a Limited medical visits will be conducted at week 4, 8, and 12. b Includes dietary history, screening and safety blood tests consisting of a complete metabolic profile, lipid profile, CBC with differentiation and platelets, HbA1c and FSH. c Includes a complete metabolic panel, lipid profile, CBC with differentiation and platelets, ghrelin, leptin, insulin, HOMA-IR, adiponectin, resistin, IL-6, TNF-α, tpai-1, CRP, HbA1c, and FSH. d Includes screening and safety blood tests consisting of a complete metabolic profile, lipid profile, and CBC with differentiation and platelets. At week 4 and 12 this will be taken at the HMR facility. e Includes only DXA and BOD POD at week 8, DEXA and CT scans will both be conducted at weeks -1 and
65 Figure 3.1 Requirements of The Triple Imperative TM which the HMR Program Considers the Skills Necessary to Control the Greatest Degree of Variability in an Individual s Weight Management Efforts. The Triple Imperative TM 1. Minimum of 2,000 calories of physical activity (PA) per week. 2. Minimum of 35 servings of vegetables and fruits per week (for Healthy Solutions and Maintenance only, not considered for this study) 3. Use of meal replacements - Weight loss: minimum of 35 meal replacements per week - Maintenance: minimum of 14 meal replacements per week 48
66 CHAPTER FOUR Results Participant Characteristics Forty-two subjects were screened for the study. Of these 42 subjects, 8 subjects failed the screening criteria and 32 subjects were randomized into the study. One individual chose not to participate in the study prior to randomization. Three individuals discontinued from the study, one due to family issues and the others were not committed to the weight loss diet. Twenty-nine subjects have completed the study. The attrition rate for this study was 9.4%. Table 4.1 presents characteristics of the study participants who completed the study. Eleven Caucasian non-diabetic females without the metabolic syndrome between the ages of 40 to 57 years and 18 Caucasian diabetic females between the ages of 41 to 64 years were recruited for the study. The mean Body Mass Index (BMI) was kg/m 2 and 38.0 kg/m 2, for non-diabetic and diabetic subjects, respectively. The mean Body Mass Index (BMI) for completers was kg/m 2 and kg/m 2 for non-diabetic and diabetic women, respectively. Study participants were matched for age and BMI. Weight Loss In a completer s analysis, non-diabetic subjects lost 15.4 kg of body weight resulting in a 16.0% decrease. Diabetic subjects lost 12.2 kg of body weight resulting in an 11.7% decrease. The average and the range of weight lost in kg are demonstrated in Figure 4.1 for completers. Figure 4.2 shows the percent reduction in body weight at weeks 0, 4, 8, 12, and 16. Analysis with two-sample t-test found 49
67 diabetic subjects weighed significantly more than non-diabetic subjects prior to weight loss, kg and 96.4 kg (p=0.04), respectively. After initial weight was adjusted using ANCOVA, there was no significant difference in the total body weight in kg at baseline (p=0.5694), week 16 (p=0.6474) or percent weight loss (p=0.2621) after 16 weeks of weight loss between the two groups. Using the intention-to-treat (ITT) or last-observation-carried-forward (LOCF) analyses, there was no significant difference in baseline weight between non-diabetic and diabetic subject, 96.4 kg and kg, respectively (p=0.1087). However, using the ITT analysis weight losses were significantly different between non-diabetic and diabetic subjects. Non-diabetic subjects lost significantly more weight (-16.0%) than diabetic subjects (-10.9%, p=0.0029). Body Mass Index (BMI) Body mass index (BMI) was one of the parameters used to match the nondiabetic and diabetic subjects. In completer s there was no significant difference in BMI values between non-diabetic and diabetic subjects before weight loss, 36.1 kg/m 2 and 38.1 kg/m 2, respectively(p=0.2314). Baseline BMI values for ITT subjects were not significantly different, 36.1 kg/m2 and 38.0 kg/m2, for non-diabetic and diabetic subjects, respectively (p=0.2329). After 16-weeks of weight loss both groups were still considered to be obese. The non-diabetic completer subjects had reduced their BMI to 30.1 kg/m 2 which was a 16.7% reduction; while diabetic completer subjects reduced their BMI to 33.0 kg/m 2 which was a 13.3% reduction. There was no significant difference in BMI between the groups at week 16 50
68 (p=0.0720). ANCOVA analysis found no significance difference between the groups at week 0 (p=0.2216) or at week 16 (p=0.0608). In non-diabetic subjects, BMI was positively correlated with leptin (p=0.0018), insulin (p=0.0466), and HOMA-IR (p=0.0362). In diabetic subjects, BMI was positively correlated with leptin (p=0.0018) and there was trend that BMI was positively correlated with insulin (p=0.0654), HOMA-IR (p=0.0950), and CRP (p=0.0697). In diabetic subjects, BMI was positively correlated with percent body fat (p=0.0176), subcutaneous adipose tissue (p=0.0114), visceral adipose tissue (p=0.003), and total fat (p<0.0001). In non-diabetic subjects, BMI was positively correlated with percent body fat (p=0.0079), subcutaneous adipose tissue (p<0.0001), and total fat (p<0.0001) and was approaching a significant positive correlation with visceral adipose tissue (p=0.0604). BMI was approaching a significant positive correlation with lean tissue in non-diabetic (p=0.0612), but not in diabetic subjects (p=0.3523). Body Composition Measurements A. Dual-Energy X-Ray Absorptiometry (DEXA) Dual-energy x-ray absorptiometry (DEXA) was used to measure total percent body fat; percent body fat in the trunk; total fat; total fat in the trunk; total lean tissue; and total lean tissue in the trunk. Values of all body composition baseline values and changes throughout the study are shown in Table Percent Body Fat-Total Total percent body fat determined by DEXA found that non-diabetic subjects had significantly greater percent body fat compared to diabetic subjects, 49.9% and 51
69 45.9% (p=0.0036), respectively. Figure 4.3 illustrates the percent body fat determined by DEXA at week 0, week 8 and week 16. There was a significant difference in the change of percent body fat between non-diabetic and diabetic subjects. Non-diabetic subjects decreased by 7.4, while diabetic subjects percent body fat decreased by 4.2 (p=0.043). This is apparent since there is no significant difference in total percent body fat between non-diabetic and diabetic subjects at week 16, 42.6% and 42.1% (p=0.8416), respectively. Adjusting for baseline percent body fat levels, ANCOVA analysis found no significant difference between groups after 16 weeks of weight loss. In diabetic subjects percent body fat was positively correlated with subcutaneous adipose tissue (p=0.0035) and total fat (p=0.0001) and negatively correlated with lean tissue (p=0.0185). There was no correlation between percent body fat and visceral adipose tissue (p=0.1363) in diabetic subjects. Percent body fat was also found to be positively correlated with leptin (p=0.0011) in diabetic subjects, but no significant correlation was found between percent body fat and resistin (p=0.7121), ghrelin (p=0.6273), or HOMA-IR (p=0.4128). In non-diabetic subjects percent body fat was positively correlated with subcutaneous adipose tissue (p=0.0282), visceral adipose tissue (p=0.0350) and total fat (p=0.0151), but was not correlated with lean tissue (p=0.3568). Percent body fat was found to be positively correlated with leptin (p=0.0455), but not correlated with resistin (p=0.9718) in nondiabetic subjects. A trend that percent body fat was negatively correlated with ghrelin (p=0.0995) and HOMA-IR (p=0.0673) was observed in the non-diabetic subjects. 52
70 Percent body fat was not found to be correlated with CRP, IL-6, TNF-α, or adiponectin in either diabetic or non-diabetic subjects. 2. Percent Body Fat-Trunk Percent body fat in the trunk of non-diabetic and diabetic subjects was significantly different at baseline, 51.2% and 47.3% (p=0.0135), respectively. Nondiabetic subjects significantly decreased their percent body fat in the trunk compared to diabetic subjects, -8.0% and 4.1% (p=0.0495), respectively. As found with total percent body fat, there was no significant difference in the percent body fat found in the trunk between non-diabetic and diabetic subjects at week 16, 43.2% and 43.2% (p=0.9765), respectively. This is consistent with the ANCOVA analysis that found no significant difference between the groups at week 16 (p=0.4258). Figure 4.4 shows the percent trunk fat determined by DEXA of study completers at week 0, week 8 and week Total Fat The DEXA measurements found no significant difference in total fat at baseline between non-diabetics and diabetic subjects, 47.4 kg and 47.3 kg (p=0.9693), respectively. Figure 4.5 illustrates total body fat in kg determined by DEXA at week 0, week 8 and week 16. There was also no significant difference found at week 16 for non-diabetics and diabetic subjects, 33.6 kg and 37.8 kg (p=0.1816), respectively. However, percent change in total fat was found to be significant after 16 weeks of weight loss. Non-diabetic subjects decreased their total fat by 29.3% while diabetic subjects decreased their total fat by 20.6% (p=0.0295). These results are consistent with the ANCOVA analysis. After adjusting for baseline fat levels at 16 weeks there 53
71 was a significant difference in total fat content between non-diabetic and diabetic subjects (p=0.0338). Total fat was positively correlated with lean tissue in nondiabetic subjects (p=0.05), but not in diabetic subjects (p=0.9333). 4. Trunk Fat The amount of fat in the trunk determined by DEXA measurements found that there was no significant difference at baseline between non-diabetic and diabetic subjects, 24.7 kg and 25.8 kg (p=0.4977), respectively. At week 16 a significant difference was found in the amount of trunk fat between the groups. Non-diabetic subjects had 16.7 kg of trunk fat and diabetic subjects had 20.6 kg of trunk fat (p=0.0353). The percent change in trunk fat was found to be significantly difference between the groups. Non-diabetic subjects decreased trunk fat by 32.1% and diabetic subjects decreased trunk fat by 20.8% (p=0.0495). ANCOVA analysis found that at week 16 the amount of trunk fat between the groups was approaching significance (p=0.0584). Figure 4.6 shows the amount of trunk fat at week 0, week 8 and week 16 in individuals who completed the study. 5. Total Lean Tissue The total amount of lean tissue in the body was measured by DEXA. Figure 4.7 illustrates total lean tissue in kg determined by DEXA at week 0, week 8 and week 16. At baseline non-diabetic subject had significantly lower total lean tissue than diabetic subjects, 44.6 kg and 53.2 kg (p=0.0018), respectively. This finding was also true at week 16. Non-diabetic subjects had 42.1 kg of lean tissue and diabetic subjects had 49.3 kg (p=0.0036). The percent change in total lean tissue however was not significant after 16 weeks of weight loss (p=0.5430). After 54
72 adjusting for baseline measurement, ANCOVA analysis found no significant difference between the groups at week 16 (p=0.8661). 6. Trunk Lean Tissue The amount of lean tissue found in the trunk was significantly lower in nondiabetic than diabetic subjects, 22.6 kg and 28.5 kg (p=0.0013), respectively. A significant difference in amount of lean tissue in the trunk was also found at week 16. Non-diabetics had 20.9 kg of lean tissue in the trunk while diabetics had 25.7 kg (p=0.0005). The percent change in lean tissue in the trunk was found not to be significantly difference between non-diabetic and diabetic subjects after 16 weeks of weight loss, -7.1% and -7.8% (p=0.8548), respectively. After adjusting for baseline values, ANCOVA found that there was no significant difference between the groups at baseline (p=0.1876) or at week 16 (p=0.1141). Figure 4.8 shows the amount of lean tissue in the trunk at week 0, week 8 and week 16 for individuals who completed the study. 7. Total Trunk Tissue The total amount of trunk tissue at baseline was significantly lower in nondiabetic than diabetic subjects, 47.3 kg and 56.8 kg (p=0.024), respectively. A significant difference in the amount of total trunk tissue was also found at week 16. Non-diabetic subjects had 37.7 kg of tissue in the trunk while diabetic subjects had 46.2 kg (p=0.001). Figure 4.9 shows the total trunk tissue at week 0, week 8 and week 16. The percent change in total trunk tissue was not found was significantly different after 16 weeks of weight loss, -20.2% and -16.7% (p=0.36), respectively. After adjusting for baseline values, ANCOVA analysis found that there was not 55
73 significant difference between the groups at baseline (p=0.1145). However, after adjusting for baseline values, non-diabetic subjects were found to have significantly less trunk tissue than diabetic subjects (p=0.0123). B. Air Displacement Plethysmography (BOD POD ) 1. Percent Body Fat There was no significant difference between non-diabetic and diabetic subjects in total percent body fat as determined by air displacement plethysmography using the BOD POD prior to weight loss (52.7% and 49.6%, respectively p=0.0924). Figure 4.10 shows percent body fat determined by air displacement plethysmography at week 0, week 8 and week 16. After 16 weeks of weight loss non-diabetic subjects decreased their percent body fat to 40.2% and diabetic subjects decreased percent body fat to 43.9% (p=0.1308). However, using ANCOVA procedures and adjusting for initial percent body fat diabetic subjects lost significantly less percent body fat than non-diabetic subjects (p=0.0091). 2. Total Fat The BOD POD measurements found no significant difference in total fat at baseline between non-diabetics and diabetic subjects, 49.7 kg and 50.1 kg (p=0.9093), respectively. Figure 4.11 illustrates total body fat in kg determined by BOD POD at week 0, week 8 and week 16. There was significant difference found at week 16 for non-diabetics and diabetic subjects, 32.1 kg and 39.2 kg (p=0.0433), respectively. Percent change in total fat was also found to be significantly different after 16 weeks of weight loss. Non-diabetic subjects decreased their total fat by 35.9% while diabetic subjects decreased their total fat by 21.8% (p=0.0042). These results are 56
74 consistent with the ANCOVA analysis. After adjusting for baseline fat levels at 16 weeks there was a significant difference in total fat content between non-diabetic and diabetic subjects (p=0.0074). 3. Total Lean The total amount of lean tissue in the body was measured by BOD POD. Figure 4.12 illustrates total lean tissue in kg determined by BOD POD at week 0, week 8 and week 16. At baseline non-diabetic subject had significantly lower total lean tissue than diabetic subjects, 46.1 kg and 52.1 kg (p=0.0148), respectively. This finding was not true at week 16. Non-diabetic subjects had 46.8 kg of lean tissue and diabetic subjects had 49.7 kg (p=0.2433). The percent change in total lean tissue however was significant after 16 weeks of weight loss (p=0.0273). Non-diabetic subjects increased lean tissue mass by 1.9%; while diabetic lean tissue mass decreased by 4.8%. After adjusting for baseline measurement, ANCOVA analysis was approaching a significant difference between the groups at week 16 (p=0.0532). C. Computer Tomography (CT) 1. Total Abdominal Fat The total amount of abdominal adipose tissue in cm 2 at week 0 and week 16 determined by computer tomography is illustrated in Figure At baseline, there was no significant difference in the amount of total abdominal adipose tissue between non-diabetic and diabetic subjects at baseline, cm 2 and cm 2 (p=0.7833), respectively. Non-diabetic subjects lost 15.4 kg of body weight with a 30.0% reduction in total abdominal tissue (p=0.1595), while diabetic subjects lost 12.2 kg of body weight with a 23.5% reduction in total adipose tissue (p=0.1595), as shown in 57
75 Table 4.2. After 16 weeks of weight loss there was no significant difference in the amount of total abdominal fat in non-diabetic and diabetic subjects, cm 2 and cm 2 (p=0.3603), respectively. ANCOVA analysis adjusting for baseline found not significant difference between the groups after 16 weeks of weight loss (p=0.2131). Figure 4.15 reveals the change in subcutaneous, visceral and total abdominal fat loss by abdominal computer tomography. 2. Visceral Adipose Tissue The amount of visceral adipose tissue in cm 2 at week 0 and week 16 for nondiabetic and diabetic subjects is shown in Figure At baseline diabetic subjects had significantly greater amounts of visceral adiposity compared with non-diabetic subjects prior to weight loss, cm 2 and cm 2 (p=0.0009), respectively. This was also true after 16 weeks of weight loss. Diabetic subjects had cm 2 of visceral adipose tissue while non-diabetics subjects had 79.4 cm 2 of visceral adipose tissue (p=0.0036). There was no significant difference in the percentage reduction in visceral adipose tissue between non-diabetic and diabetic subjects, 33.3% and 34.3% (p=0.8749), respectively. The ANCOVA analysis also indicated that after adjusting for baseline values, the amount of visceral adipose tissue was not significantly different at week 16 between non-diabetic and diabetic subjects, cm and cm (p=0.7457), respectively. Visceral adipose tissue was not correlated with insulin, HOMA-IR, resistin or ghrelin in either diabetic or non-diabetic subjects, but was positively correlated with leptin in both diabetic (p=0.0325) and non-diabetic (p=0.0046) subjects. 58
76 3. Subcutaneous Adipose Tissue The amount of subcutaneous adipose tissue in cm 2 at week 0 and week 16 for non-diabetic and diabetic subjects is shown in Figure Unlike the visceral adipose tissue stores, subcutaneous tissue stores were not significantly different prior to the study. Non-diabetics had cm 2 subcutaneous adipose tissue and diabetic subjects cm 2 (p=0.0879). After 16 weeks of weight loss, non-diabetic subjects lost a significantly greater percentage of subcutaneous adipose tissue than diabetic subjects, 29.0% and 18.2% (p=0.0333), respectively. There was no significant difference in the amount of subcutaneous adipose tissue at week 16 between the nondiabetic and diabetic groups, cm 2 and cm 2 (p=0.8769), respectively. However, when the 16 week subcutaneous adipose tissue stores were adjusted for baseline, diabetic subjects had significantly greater subcutaneous adipose stores than non-diabetic subjects. The adjusted values for non-diabetic subjects were cm 2 and cm 2 for diabetic subjects (p=0.0394). Subcutaneous adipose tissue was positively correlated with insulin (p=0.0423) and HOMA-IR (p=0.0379) in non-diabetic subjects, but not in diabetic subjects. In non-diabetic subjects, subcutaneous adipose tissue was found to be positively correlated with leptin (p=0.0005) and in diabetic subjects a positive correlation was approaching significance (p=0.0675). Subcutaneous adipose tissue was positively correlated with CRP (p=0.0154) in diabetic subjects but no correlation was observed in the non-diabetic subjects (p=0.9820). Subcutaneous adipose tissue was not found to be correlated to adiponection in diabetic subjects (p=0.2385) but a negative correlation was observed in the non-diabetic subjects (p=0.0309). 59
77 Before weight loss non-diabetic subjects visceral to subcutaneous fat ratio (V/S) was 0.20, while diabetics had a significantly higher ratio of 0.43 (p=0.0005). The rat%io of both groups decreased with weight loss; however, diabetic subjects had a significantly greater ratio of visceral to subcutaneous adipose tissue. The ratios were 0.19 and 0.33 for non-diabetics and diabetics respectively (p=0.003). There was no significant difference in either non-diabetic (p=0.6446) or diabetic (p=0.1350) subjects in the change of the V/S ratio after weight loss. D. Waist Circumference Waist circumference measurements were not significantly different prior to weight loss between non-diabetic and diabetic subjects (110.5 cm, cm, p=0.1648). Figure 4.14 displays the absolute waist circumference in centimeters for diabetic and non-diabetic individuals at week 0 and week 16. Figure 4.15 shows that total change in centimeters and percent change in waist circumference for diabetic and non-diabetic subjects. After 16-weeks of weight loss non-diabetics decreased waist circumference by 16.4%, while diabetic subjects decreased waist circumference by 7.8% (p=0.0103). The non-diabetic subjects waist circumference at week 16 was 91.3 cm and the diabetic subjects waist circumference was cm and was found to be a significant difference (p=0.0004). After the ANCOVA analysis and adjusting for baseline values, non-diabetic subjects significantly had smaller waist circumferences than diabetic subjects ( and , p=0.0012), respectively. 60
78 Blood Parameters A. Insulin / HOMA-IR As expected, individuals with type 2 diabetes had significantly different serum insulin and HOMA-IR results than individuals without type 2 diabetes. Figure 4.18 and Figure 4.19 displays insulin and HOMA-IR results for week 0, week 8 and week 16, respectively. Prior to weight loss diabetic insulin levels were 21.0 µu/ml while non-diabetic individuals insulin levels were 14.4 µu/ml (p=0.0447). After 16 weeks of weight loss, insulin levels decreased by 30.1% and 28.7% in non-diabetic and diabetic subjects respectively. The ANCOVA calculation found that after adjusting for baseline insulin, there was no difference between diabetic and non-diabetics with weight loss (p=0.2637). HOMA-IR levels were also significantly different at baseline, 5.3 and 7.9 (p<0.0001), for non-diabetics and diabetics respectively. HOMA-IR increased by 1.8% in non-diabetic subjects and decreased by 10.2% in diabetic subjects (p=0.0007). ANCOVA analysis revealed no significant different HOMA-IR after 16 weeks of weight loss (p=0.1764). Baseline insulin and HOMA- IR values and changes are shown in Table 4.3. In diabetic subjects, insulin was negatively correlated with resistin (p=0.0309) and approaching a negative correlation with ghrelin (p=0.0843). Insulin was not associated with body composition measurements in the diabetic subjects but was positively correlated with subcutaneous adipose tissue (p=0.0423) and total fat (p=0.0436) in non-diabetic subjects. A trend for a positively correlation between insulin and percent body fat was also observed. Insulin was not correlated with CRP, IL-6, TNF-α or adiponectin in either diabetic or non-diabetic subjects. The only 61
79 correlation observed with insulin in the non-diabetic subjects was HOMA-IR (p<0.001). B. Glucose and HbA1c Serum glucose and HbA1c levels were significantly higher before and after weight loss in diabetic versus non-diabetic subjects. Figure 4.20 and Figure 4.21 illustrates glucose and HbA1c levels, respectively, at week 0, week 8 and week 16. At baseline non-diabetic subjects glucose levels were 98.8 mg/dl and diabetic glucose levels were mg/dl (p<0.0001). After 16 weeks of weight loss, glucose levels were still significantly lower in non-diabetic subjects than diabetic subjects, 92.9 mg/dl and mg/dl (p<0.0001), respectively. However, after adjusting for baseline glucose levels, ANCOVA analysis found no significant difference in glucose levels at week 16 (p=0.1941). HbA1c measurements are reflected in the glucose levels as well. HbA1c measurements were also significantly higher before and after weight loss in diabetic versus non-diabetic subjects. At baseline non-diabetic subjects HbA1c was 5.2% and diabetic subjects had HbA1c levels of 8.1% (p<0.0001). After 16 weeks of weight loss, non-diabetic subjects HbA1c remained unchanged at 5.3% and diabetic subjects decreased HbA1c levels to 6.5%. This difference was still found to be significant using t-tests (p<0.0001). However, similar to glucose levels, after adjusting for baseline HbA1c levels, ANCOVA analysis found no significant difference in HbA1c levels at week 16 (p=0.7051). Baseline glucose and HbA1c values and changes are shown in Table
80 C. Leptin At baseline, although not significant, non-diabetic subjects had greater plasma leptin levels than diabetic subjects, pg/ml and pg/ml (p=0.142), respectively. Plasma leptin levels decreased by 66.9% in non-diabetic patients and 46.1% in diabetic subjects (p=0.018). There was no significant difference in leptin levels between the groups at week 0, week 8 or week 16; however, the ANCOVA analysis when adjusting week 8 and week 16 for baseline leptin levels became significant at week 16. Non-diabetic subjects leptin levels were pg/ml and for diabetic subjects pg/ml (p=0.0105). Figure 4.22 illustrates the change in leptin levels in both non-diabetic and diabetic subjects at week 0, week 8 and week 16. Baseline leptin values and changes are shown in Table 4.4. Leptin was not correlated to HOMA-IR in non-diabetic (p=0.4624) subjects but was approaching a significant correlation in diabetic subjects (p=0.0872). In nondiabetic subjects leptin was negatively correlated with adiponectin (p=0.0425), but no correlation was observed in diabetic subjects (p=0.3219). Leptin was also correlated positively to weight in both diabetic (p=0.0110) and non-diabetic subjects (p=0.0139). No other correlations with leptin were observed. D. Ghrelin Plasma ghrelin levels increased by 22.5% and 26.1%, in non-diabetic and diabetic subjects respectively. At week 0, diabetic subjects had significantly lower ghrelin levels than the non-diabetic subjects, pg/ml and pg/ml (p=0.0425), respectively. However, after adjusting for baseline ghrelin levels 63
81 ANCOVA determined that after 16 weeks of weight loss there was no significant difference between the groups (p=0.8305). Figure 4.23 depicts the ghrelin levels at week 0, week 8, and week 16 for diabetic and non-diabetic subjects. Baseline ghrelin values and changes are shown in Table 4.4. Ghrelin was positively correlated with adiponectin in diabetic subjects (p=0.0125), but no correlation was observed in the non-diabetic subjects (p=0.1711). Ghrelin was not found to be correlated with any of the other outcome measurements. E. Adiponectin Plasma adiponectin levels were significantly lower in diabetic subjects than non-diabetic subjects, ng/ml and ng/ml (p=0.0326), respectively at baseline. During the study, adiponectin levels decreased in non-diabetic subjects by 17.2% and increased by 15.3% in diabetic subjects (p=0.005). The adiponectin levels at week 16 were ng/ml for non-diabetic subjects and ng/ml (p=0.1013). ANCOVA analysis agreed with the description statistics that after adjusting for baseline there was no significant difference between to two groups after 16 weeks of weight loss (p=0.4197). Figure 4.24 illustrates the change in adiponectin levels in both non-diabetic and diabetic subjects at week 0, week 8 and week 16. Baseline adiponectin values and changes are shown in Table 4.4. Adiponectin was positively correlated with ghrelin in the diabetic subjects (p=0.0125) and negatively correlated with leptin in the non-diabetic subjects (p= ). No other correlations were observed with adiponectin levels in either diabetic or non-diabetic subjects. 64
82 F. Resistin Plasma resistin levels were significantly different at the beginning of the study between non-diabetic and diabetic subjects, 4.6 ng/ml and 5.7 ng/ml (p=0.0358), respectively. The levels of resistin did not change after weight loss. Resistin levels of the non-diabetic subjects was 4.7 ng/ml and for diabetic subjects 6.1 ng/ml. Descriptive statistics state that these levels were still significantly different at week 16 (p=0.039). The percent change was -0.2% and 10.0% for non-diabetic and diabetic subjects respectively (p=0.2605). After adjusting for baseline levels, ANCOVA analysis revealed that at week 16 there was not a significant difference between the two groups (p=0.127). Figure 4.25 shows the change in resistin levels in both non-diabetic and diabetic subjects at week 0, week 8 and week 16. Baseline resistin values and changes are shown in Table 4.4. Resistin was negatively correlated to insulin (p=0.0309) and HOMA-IR (p=0.0038) in diabetic subjects but no correlation was observed in non-diabetic subjects. No other correlations were observed with resistin in either diabetic or nondiabetic subjects. G. Interleukin-6 (IL-6) At baseline, high sensitivity IL-6 levels were approaching significance with non-diabetic having higher IL-6 levels than diabetic subjects, 4.0 pg/ml and 2.3 pg/ml (p=0.057), respectively. IL-6 levels decreased in both non-diabetic and diabetic subjects, -1.0 and -0.3 pg/ml (p=0.2520), respectively. The percent change for nondiabetic subjects was 0.3%, while for diabetic subjects IL-6 levels decreased by 4.5% (p=0.4258). ANCOVA analysis found no significant difference in IL-6 level between 65
83 non-diabetic and diabetic at week 16 after adjusting for baseline measurements, 3.0 pg/ml and 2.0 pg/ml (p=0.0961), respectively. Baseline IL-6 values and changes are shown in Table 4.4. IL-6 was not found to be correlated to any of the outcome measurements in either diabetic or non-diabetic subjects. H. Tumor Necrosis Factor-α (TNF-α) There was no significant difference in TNF-α levels prior to weight loss, 1.2 pg/ml and 1.3 pg/ml (p=0.286) for non-diabetic and diabetic subjects respectively. Overall, there was no change in serum high sensitivity TNF-α levels in either nondiabetic or diabetic subjects (0.3 and 0.0 respectively p=0.1560). At week 16 no significant difference in absolute TNF-α levels. The percent change for non-diabetics was 25.1% and 10.1% for diabetics (p=0.2556). ANCOVA analysis further verified this non-significance in TNF-α levels between the groups after weight loss (p=0.3795). Baseline TNF-α values and changes are shown in Table 4.4. TNF-α was approaching a significant correlation with CRP in diabetic subjects (p=0.0915), but not in the non-diabetic subjects (p=0.5691). There were no other correlations observed between TNF-α and any of the other outcome measurements. I. Plasminogen Activating Inhibitor-1 (PAI-1) Figure 4.26 shows PAI-1 levels for week 0, week 8 and week 16. There was no significant difference between non-diabetic and diabetic subjects on baseline plasma total plasminogen activating inhibitor-1 (PAI-1), pg/ml and pg/ml (p=0.1132), respectively. At week 16 a significant difference was seen between the two groups, pg/ml and pg/ml (p=0.0105), for non-diabetic 66
84 and diabetic subjects respectively. However, no significant decrease was observed with the percent decreases in PAI-1 levels. There was a 26.2% decrease in nondiabetic subjects and a 25.4% decrease in the diabetic subjects (p=0.4819). ANCOVA analysis found a close significance between the two groups at week 16 after adjusting for baseline values (p=0.057). Baseline PAI-1 values and changes are shown in Table 4.4. PAI-1 levels were positively correlated with percent body (p=0.0073) and negatively correlated with lean tissue (p=0.0681) in diabetic subjects. PAI-1 was approaching a significant negative correlation with lean tissue in the non-diabetics (p=0.0893), but no correlation was observed with percent body fat (p=0.6397). In diabetic subjects a negative correlation between PAI-1 and ghrelin was approaching significance (p=0.0673). This was not observed in the non-diabetic subjects (p=0.9366). J. C-Reactive Protein (CRP) There were no significant difference in serum high sensitivity CRP levels at baseline, ng/ml and ng/ml (p=0.3419), for non-diabetic and diabetics respectively. There was no significant difference in the level of CRP at week 16, ng/ml and ng/ml (p=0.3622), respectively for non-diabetics and diabetic subjects. Percent reduction in CRP levels decreased by 33.1% and 21.2% in non-diabetic and diabetic subjects non-significantly (p=0.4637). ANCOVA analysis for adjusting baseline confirms there was no significant difference between the two groups (p=0.7404). Baseline CRP values and changes are shown in Table
85 CRP was positively correlated to subcutaneous adipose tissue in diabetic subjects (p=0.0154), but not in non-diabetic subjects (p=0.9820). CRP was approaching a significant positive correlation to BMI in diabetic subjects (p=0.0697), but not in non-diabetic subjects (p=0.7675). No other correlations with CRP were observed in either the diabetic or non-diabetic subjects. K. Follicle-Stimulating Hormone (FSH) Serum follicle stimulating hormone (FSH) levels were not significantly different in non-diabetic and diabetic subjects at the beginning of the study (42.9mIU/ml, 26.4 miu/ml, p=0.0596). Both groups increased FSH levels during the study. FSH levels increased by 19.5% in non-diabetic subjects and 32.5% in diabetic subjects (p=0.2231). FSH levels at week 16 were also not found to be significantly different between non-diabetic and diabetic subjects, 50.4 miu/ml and 31.5 miu/ml (p=0.0573), respectively. ANCOVA analysis verified this non-significant finding at week 16 (p=0.6825). Baseline FSH values and changes are shown in Table 4.3. L. Lipids 1. Total Cholesterol Figure 4.27 exhibits total cholesterol levels for diabetic and non-diabetic individuals at week 0, week 8 and week 16. There was no significant difference in total cholesterol levels in non-diabetic and diabetic subjects before or after the weight loss phase. Total cholesterol levels decreased in both non-diabetic and diabetic subjects. Total cholesterol in non-diabetic subjects decreased by 41.2 mg/dl, resulting in a -17.9%. Although there was no significant difference in total cholesterol (p=0.3011) or percent change (p=0.1581) in total cholesterol levels between groups 68
86 before or after weight loss, diabetic subjects saw only a 14.4 mg/dl decrease, resulting in a -7.4%. ANCOVA analysis confirmed the t-test and found no significant difference between total cholesterol levels at week 16 (p=0.2223). Baseline cholesterol values and changes are shown in Table Low-Density Lipoprotein Cholesterol (LDL-Cholesterol) LDL-cholesterol levels at week 0, week 8 and week 16 for diabetic and nondiabetic individuals are illustrated in Figure There was no significant difference in LDL-cholesterol levels at baseline between non-diabetic and diabetic subjects, 128 mg/dl and mg/dl (p=0.5099), respectively. Non-diabetic subjects LDLcholesterol levels decreased by 13.6%, while diabetic subjects had a 6.9% increase (p=0.0925). ANCOVA analysis adjusting for baseline LDL-cholesterol levels found no significant difference between groups at week 16. Baseline LDL-cholesterol values and changes are shown in Table High-Density Lipoprotein Cholesterol (HDL-Cholesterol) HDL-cholesterol levels at week 0, week 8 and week 16 are shown in Figure Non-diabetic subjects had significantly higher HDL-cholesterol levels than diabetic subjects at baseline, 52.1 mg/dl and 37.8 mg/dl (p=0.0009), respectively. At week 16, there was no significant difference in HDL-cholesterol levels between the groups (p=0.135). After weight loss, percent change in HDL-cholesterol levels was significantly different between non-diabetic and diabetic subjects. High-density lipoprotein cholesterol levels decreased by 16.2% in non-diabetics and increased by 0.9% in diabetic subjects (p=0.0001). Adjusting for baseline HDL-cholesterol levels, 69
87 ANCOVA analysis found no significant difference between the groups at week 16 (p=0.217). Baseline HDL-cholesterol values and changes are shown in Table Triglycerides Triglyceride levels at week 0, week 8 and week 16 are shown in Figure 4.30 for diabetic and non-diabetic subjects. At baseline diabetic subjects had significantly higher triglyceride levels than non-diabetic subjects, mg/dl and mg/dl (p=0.0012), respectively. At week 16 non-diabetic subjects triglyceride levels were still significantly lower than diabetic subjects, mg/dl and mg/dl (p=0.0359), respectively. There was no significant difference in the percent decrease in triglyceride levels after weight loss between non-diabetic subjects and diabetic subjects, -13.1% and -34.5% (p=0.0734), respectively. As stated previously, diabetic subjects had significantly greater triglyceride levels prior to weight and after adjusting for baseline, ANCOVA analysis found no significant difference between the groups at week 16 (p=0.8693). Baseline triglyceride values and changes are shown in Table 4.5. Blood Pressure Systolic blood pressure levels were not significantly different in non-diabetic and diabetic subjects at baseline, mmhg and mmhg (p=0.1224), respectively. After 16 weeks of weight loss systolic blood pressure was not significantly different between non-diabetic and diabetic subjects, mmhg and mmhg (p=0.4043), respectively. Diastolic blood pressure levels were also not significantly different in non-diabetic and diabetic subjects at baseline, 73.5 mmhg and 77.8 mmhg (p=0.1505), respectively. Week 16 diastolic blood 70
88 pressures were not significantly different between non-diabetic and diabetic subjects, 73.8 mmhg and 75.2 mmhg (p=0.6811), respectively. Baseline systolic and diastolic blood pressure levels and their changes are shown in Table 4.5. Dietary Compliance Dietary compliance was accessed by self-reported meal replacement use and physical activity expenditure which was recorded by HMR personnel in the Patient at a Glance form. According to the Patient at a Glance form, both diabetic and nondiabetic subjects complied with the HMR program. Figure 4.31 shows the average number of meal replacements, entrees, bars and total meal replacements consumed for diabetic and non-diabetic subjects at week 16. There was no significant difference in the number of meal replacements consumed. Figure 4.32 illustrates the average weekly number of kcal expended by physical activity at week 0, week 8 and week 16 by diabetic and non-diabetic subjects. There was no significant difference in the amount of physical activity reported between the groups. There also was no significant difference in weekly attendance, mid-week phone call, number of days in the box, and in meeting the Triple Imperative TM. 71
89 Table 4.1 (Mean + SD) Baseline Characteristics of Subjects who Completed the Study. Variable Non-Diabetic Diabetic Number enrolled Age (years) Weight (kg) Body mass index (kg/m 2 )
90 Table 4.2 Baseline Values and Absolute and Percentage Change from Week 0 at 16 Weeks for Body Composition Measurements of Study Completers. Data were analyzed by unadjusted student s t-tests and are expressed as mean (SE). Statistical probability of p<0.05 was considered to be significant. *Significantly different between non-diabetic and diabetic subjects. Variable DXA % Total Body Fat DXA % Trunk Fat DXA Total Fat (kg) DXA Trunk Fat (kg) DXA Total Lean (kg) DXA Trunk Lean (kg) DXA Trunk Tissue (kg) BOD POD (% Body Fat) BOD POD Total Fat (kg) BOD POD Total Lean (kg) CT Total Abdominal Fat (sq cm 2 ) CT Visceral Fat (sq cm 2 ) CT Subcutaneous Fat (sq cm 2 ) Waist Circumference (cm) Non-Diabetic (n=11) Diabetic (n=18) Week 0 Change % Change Week 0 Change % Change * -4.2* N/A (0.8) (1.0) (1.0) (1.1) N/A * -4.1* N/A (1.0) (1.6) (1.1) (1.6) N/A * -20.6* (2.3) (1.2) (2.4) (1.7) (1.3) (2.9) * -20.8* (1.4) (1.1) (3.9) (0.8) (1.0) (3.8) * (1.6) (0.8) (1.6) (1.9) (1.2) (1.9) * (0.9) (0.5) (2.2) (1.3) (1.2) (3.2) * (2.8) (1.2) (2.1) (2.8) (2.7) (3.1) * N/A (1.4) (1.4) (1.0) (1.1) N/A * -21.8* (2.5) (1.5) (3.0) (1.7) (1.6) (3.3) * -2.4* -4.8* (1.7) (1.1) (2.5) (1.6) (1.6) (1.2) (34.5) (20.8) (3.7) (30.0) (20.3) (2.5) * -75.9* (11.5) (5.4) (4.6) (17.7) (11.4) (4.0) * -18.2* (32.2) (21.5) (4.0) (28.3) (11.0) (1.9) * (5.0) (4.0) (2.7) (2.7) (2.4) (1.1) 73
91 Table 4.3 Baseline Values and Changes from Week 0 at 16 Weeks for Fasting Glucose and Insulin Resistance Measurements of Study Completers. Data were analyzed by unadjusted student s t-tests and are expressed as mean (SE). Statistical probability of p<0.05 was considered to be significant. *Significantly different between non-diabetic and diabetic subjects. Variable Non-Diabetic (n=11) Diabetic (n=18) Insulin (mu/ml) HOMA-IR Glucose (mg/dl) HbA1c Week 0 Change % Change Week 0 Change % Change * (2.8) (3.0) (11.8) (2.4) (2.1) (7.2) * -0.9* -10.2* (0.1) (0.1) (1.9) (0.4) (0.3) (2.5) * -50.6* -22.0* (3.0) (1.9) (1.7) (15.6) (12.5) (4.5) * -1.6* N/A (0.2) (0.1) (0.4) (0.4) N/A 74
92 Table 4.4 Baseline Values and Absolute and Percentage Change from Week 0 at 16 Weeks for Fasting Cytokines and FSH of Study Completers. Data were analyzed by unadjusted student s t-tests and are expressed as mean (SE). Statistical probability of p<0.05 was considered to be significant. *Significantly different between nondiabetic and diabetic subjects. Variable Leptin (pg/ml) Ghrelin (pg/ml) Adiponectin (ng/ml Resistin (ng/ml) IL-6 (pg/ml) TNFα (pg/ml) PAI-1 (pg/ml) CRP (ng/ml) FSH (mlu/ml) Non-Diabetic (n=11) Diabetic (n=18) Week 0 Change % Change Week 0 Change % Change * -46.1* (7328.7) (5463.6) (5.9) (4988.8) (3479.4) (5.7) * (90.0) (108.9) (13.7) (57.0) (40.5) (5.2) * 996.8* 15.3* (1894.0) (968.3) (9.6) (640.9) (410.5) (4.8) * (0.3) 0.1 (0.2) (5.0) (0.5) (0.4) (7.2) (1.0) (1.0) (22.7) (0.3) (0.3) (10.8) (0.1) 0.3 (0.2) (17.8) (0.1) (0.1) (13.7) (1646.9) (1338.8) (12.4) (1171.6) (1341.9) (10.6) (1653.9) (758.6) (8.2) (1073.5) (675.2) (9.4) (8.3) 7.5 (3.5) (9.6) (5.7) 5.1 (1.9) (13.8) 75
93 Table 4.5 Baseline Values and Changes from Week 0 at 16 Weeks for Fasting Lipid Values and Blood Pressure of Study Completers. Data were analyzed by unadjusted student s t-tests and are expressed as mean (SE). Statistical probability of p<0.05 was considered to be significant. *Significantly different between nondiabetic and diabetic subjects. Variable Cholesterol (mg/dl) LDL-Cholesterol (mg/dl) HDL-Cholesterol (mg/dl) Triglycerides (mg/dl) Systolic Blood Pressure (mmhg) Diastolic Blood Pressure (mmhg) Non-Diabetic (n=11) Diabetic (n=18) Week 0 Change % Change Week 0 Change % Change (12.5) (12.0) (5.5) (3.1) (2.8) (4.0) (10.2) (9.8) (8.4) (2.9) (3.2) (3.0) * -0.1* 0.9* (2.5) (2.2) (3.8) (2.5) (1.0) (2.9) * -82.5* (20.0) (16.0) (9.4) (20.1) (16.7) (6.1) (2.7) (2.4) 0.7 (2.8) (3.0) (3.9) (3.3) (1.2) (2.1) (2.8) (2.0) (3.2) (4.2) 76
94 Figure 4.1 Average and Individual Weight Losses in Non-Diabetic and Diabetic Subjects Who Completed the HMR Weight Loss Program. Weight kg Diabetic Non-Diabetic 5 0 Average 77
95 Figure 4.2 Percent Weight Loss of Non-Diabetic and Diabetic Subjects Who Completed the HMR Weight Loss Program. 0-5 Weeks Weight Loss (%) DM NonDM -25 Unadjusted analysis conducted by student s t-test found to be significantly different between diabetic and non-diabetic subjects. Adjusted analysis conducted by ANCOVA for week 16 found to be significantly different between diabetic and non-diabetic subjects. Statistically probability of p<0.05 was considered to be significant. 78
96 Figure 4.3 Percent Body Fat Determined by DEXA of Study Completers % Body Fat Diabetic Non-Diabetic 10 0 Week 0 Week 8 Week 16 Unadjusted analysis conducted by student s t-test found to be significantly different between diabetic and non-diabetic subjects. Adjusted analysis conducted by ANCOVA for week 16 found to be significantly different between diabetic and non-diabetic subjects. Statistical probability of p<0.05 was considered to be significant. 79
97 Figure 4.4 Percent Trunk Fat Determined by DEXA for Study Completers % Trunk Fat DM NonDM 10 0 Week 0 Week 8 Week 16 Unadjusted analysis conducted by student s t-test found to be significantly different between diabetic and non-diabetic subjects. Adjusted analysis conducted by ANCOVA for week 16 found to be significantly different between diabetic and non-diabetic subjects. Statistical probability of p<0.05 was considered to be significant. 80
98 Figure 4.5 Total Body Fat in kg Determined by DEXA of Study Completers kg Diabetic Non-Diabetic 10 0 Week 0 Week 8 Week 16 Unadjusted analysis conducted by student s t-test found to be significantly different between diabetic and non-diabetic subjects. Adjusted analysis conducted by ANCOVA for week 16 found to be significantly different between diabetic and non-diabetic subjects. Statistical probability of p<0.05 was considered to be significant. 81
99 Figure 4.6 Trunk Fat in kg Determined by DEXA for Study Completers kg DM NonDM 5 0 Week 0 Week 8 Week 16 Unadjusted analysis conducted by student s t-test found to be significantly different between diabetic and non-diabetic subjects. Adjusted analysis conducted by ANCOVA for week 16 found to be significantly different between diabetic and non-diabetic subjects. Statistical probability of p<0.05 was considered to be significant. 82
100 Figure 4.7 Total Lean Tissue in kg Determined by DEXA of Study Completers kg Diabetic Non-Diabetic 0 Week 0 Week 8 Week 16 Unadjusted analysis conducted by student s t-test found to be significantly a different between diabetic and non-diabetic b subjects. Adjusted analysis conducted by ANCOVA for week 16 found to be significantly different between diabetic and non-diabetic subjects. a Statistical probability of p<0.05 was considered to be significant. 83
101 Figure 4.8 Trunk Lean Tissue in kg Determined by DEXA of Study Completers kg DM NonDM 0 Week 0 Week 8 Week 16 Unadjusted analysis conducted by student s t-test found to be significantly different between diabetic and non-diabetic subjects. Adjusted analysis conducted by ANCOVA for week 16 found to be significantly different between diabetic and non-diabetic subjects. Statistical probability of p<0.05 considered to be significant. 84
102 Figure 4.9 Total Trunk Tissue Determined by DEXA of Study Completers kg Diabetic Non-Diabetic 0 Week 0 Week 8 Week 16 Unadjusted analysis conducted by student s t-test found to be significantly different between diabetic and non-diabetic subjects. Adjusted analysis conducted by ANCOVA for week 16 found to be significantly different between diabetic and non-diabetic subjects. Statistical probability of p<0.05 was considered to be significant. 85
103 Figure 4.10 Percent Body Fat Determined by Air Displacement Plethysmography (BOD POD ) of Study Completers % Body Fat Diabetic Non-Diabetic 10 0 Week 0 Week 8 Week 12 Unadjusted analysis conducted by student s t-test found to be significantly different between diabetic and non-diabetic subjects. Adjusted analysis conducted by ANCOVA for week 16 found to be significantly different between diabetic and non-diabetic subjects. Statistical probability of p<0.05 was considered to be significant. 86
104 Figure 4.11 Total Fat in kg Determined by BOD POD of Study Completers kg DM NonDM 10 0 Week 0 Week 8 Week 16 Unadjusted analysis conducted by student s t-test found to be significantly different between diabetic and non-diabetic subjects. Adjusted analysis conducted by ANCOVA for week16 found to be significantly different between diabetic and non-diabetic subjects. Statistical probability of p<0.05 was considered to be significant. 87
105 Figure 4.12 Total Lean Tissue Determined by BOD POD of Study Completers kg DM NonDM 10 0 Week 0 Week 8 Week 16 Unadjusted analysis conducted by student s t-test found to be significantly different between diabetic and non-diabetic subjects. Adjusted analysis conducted by ANCOVA for week 16 found to be significantly different between diabetic and non-diabetic subjects. Statistical probability of p<0.05 was considered to be significant. 88
106 Figure 4.13 Total Abdominal Adipose Tissue Determined by Computer Tomography of Study Completers cm Diabetic Non-Diabetic Week 0 Week 16 Unadjusted analysis conducted by student s t-test found to be significantly different between diabetic and non-diabetic subjects. Adjusted analysis conducted by ANCOVA for week 16 found to be significantly different between diabetic and non-diabetic subjects. Statistical probability of p<0.05 was considered to be significant. 89
107 Figure 4.14 Total Subcutaneous and Visceral Adipose Tissue in Study Completers cm Diabetic Non-Diabetic Week 0 Week 16 Week 0 Week 16 Subcutaneous Adipose Visceral Adipose Unadjusted analysis conducted by student s t-test found to be significantly different between diabetic and non-diabetic subjects. Adjusted analysis conducted by ANCOVA for week 16 found to be significantly different between diabetic and non-diabetic subjects. Statistical probability of p<0.05 was considered to be significant. 90
108 Figure 4.15 Subcutaneous, Visceral and Total Abdominal Fat Loss Determined by Computer Tomography of Study Completers cm Diabetic Non-Diabetic 50 0 Subcutaneous Loss Visceral Loss Total Loss Unadjusted analysis conducted by student s t-test found to be significantly different between diabetic and non-diabetic subjects. Adjusted analysis conducted by ANCOVA for week 16 found to be significantly different between diabetic and non-diabetic subjects. Statistical probability of p<0.05 was considered to be significant. 91
109 Figure 4.16 Waist Circumference of Study Completers cm Diabetic Non-Diabetic 0 Week 0 Week 16 Unadjusted analysis conducted by student s t-test found to be significantly different between diabetic and non-diabetic subjects. Adjusted analysis conducted by ANCOVA for week 16 found to be significantly different between diabetic and non-diabetic subjects. Statistical probability of p<0.05 was considered to be significant. 92
110 Figure 4.17 Percent Reduction in Waist Circumference and Total Change in Centimeters of Study Completers. 0 Total Change % Change Diabetic Non-Diabetic -25 Unadjusted analysis conducted by student s t-test found to be significantly different between diabetic and non-diabetic subjects. Adjusted analysis conducted by ANCOVA for week 16 found to be significantly different between diabetic and non-diabetic subjects. Statistical probability of p<0.05 was considered to be significant. 93
111 Figure 4.18 (Mean + SE) Insulin Levels at Week 0, Week 8 and Week 16 of Study Completers. uu/ml Diabetic Non-Diabetic 0 Week 0 Week 8 Week 16 Unadjusted analysis conducted by student s t-test found to be significantly different between diabetic and non-diabetic subjects. Adjusted analysis conducted by ANCOVA for week 16 found to be significantly different between diabetic and non-diabetic subjects. Statistical probability of p<0.05 was considered to be significant. 94
112 Figure 4.19 HOMA-IR Results at Week 0, Week 8 and Week 16 of Study Completers. (Mean + SE) Week 0 Week 8 Week 16 Diabetic Non-Diabetic Unadjusted analysis conducted by student s t-test found to be significantly different between diabetic and non-diabetic subjects. Adjusted analysis conducted by ANCOVA for week 16 found to be significantly different between diabetic and non-diabetic subjects. Statistical probability of p<0.05 was considered to be significant. 95
113 Figure 4.20 (Mean + SE) Glucose Levels at Week 0, Week 8 and Week 16 of Study Completers mg/dl Diabetic Non-Diabetic 50 0 Week 0 Week 8 Week 16 Unadjusted analysis conducted by student s t-test found to be significantly different between diabetic and non-diabetic subjects. Adjusted analysis conducted by ANCOVA for week 16 found to be significantly different between diabetic and non-diabetic subjects. Statistical probability of p<0.05 was considered to be significant. 96
114 Figure 4.21 (Mean + SE) HbA1c Values at Week 0, Week 8 and Week 16 of Study Completers % 5 4 Diabetic Non-Diabetic Week 0 Week 8 Week 16 Unadjusted analysis conducted by student s t-test found to be significantly different between diabetic and non-diabetic subjects. Adjusted analysis conducted by ANCOVA for week 16 found to be significantly different between diabetic and non-diabetic subjects. Statistical probability of p<0.05 was considered to be significant. 97
115 Figure 4.22 (Mean+ SE) Leptin Levels at Week 0, Week 8 and Week 16 of Study Completers. pg/ml Week DM NonDM Unadjusted analysis conducted by student s t-test found to be significantly different between diabetic and non-diabetic subjects. Adjusted analysis conducted by ANCOVA for week 16 found to be significantly different between diabetic and non-diabetic subjects. Statistical probability of p<0.05 was considered to be significant. 98
116 Figure 4.23 (Mean + SE) Ghrelin Levels at Week 0, Week 8 and Week 16 of Study Completers pg/ml DM NonDM Week Unadjusted analysis conducted by student s t-test found to be significantly different between diabetic and non-diabetic subjects. Adjusted analysis conducted by ANCOVA for week 16 found to be significantly different between diabetic and non-diabetic subjects. Statistical probability of p<0.05 was considered to be significant. 99
117 Figure 4.24 Adiponectin Levels at Week 0, Week 8 and Week 16 of Study Completers. (Mean + SE) ng/ml Week DM NDM Unadjusted analysis conducted by student s t-test found to be significantly different between diabetic and non-diabetic subjects. Adjusted analysis conducted by ANCOVA for week 16 found to be significantly different between diabetic and non-diabetic subjects. Statistical probability of p<0.05 was considered to be significant. 100
118 Figure 4.25 (Mean + SE) Resistin Levels at Week 0, Week 8 and Week 16 of Study Completers. ng/ml Week DM NonDM Unadjusted analysis conducted by student s t-test found to be significantly different between diabetic and non-diabetic subjects. Adjusted analysis conducted by ANCOVA for week 16 found to be significantly different between diabetic and non-diabetic subjects. Statistical probability of p<0.05 was considered to be significant. 101
119 Figure 4.26 Total Plasminogen Activating Inhibitor-1 (PAI-1) Levels at Week 0, Week 8 and Week 16 of Study Completers. (Mean + SE) pg/ml Diabetic Non-Diabetic Week 0 Week 8 Week 16 Unadjusted analysis conducted by student s t-test found to be significantly different between diabetic and non-diabetic subjects. Adjusted analysis conducted by ANCOVA for week 16 found to be significantly different between diabetic and non-diabetic subjects. Statistical probability of p<0.05 was considered to be significant. 102
120 Figure 4.27 Total Cholesterol Levels at Week 0, Week 8 and Week 16 of Study Completers. (Mean + SE) mg/dl Diabetic Non-Diabetic 50 0 Week 0 Week 8 Week 16 Unadjusted analysis conducted by student s t-test found to be significantly different between diabetic and non-diabetic subjects. Adjusted analysis conducted by ANCOVA for week 16 found to be significantly different between diabetic and non-diabetic subjects. Statistical probability of p<0.05 was considered to be significant. 103
121 Figure 4.28 LDL-cholesterol Levels at Week 0, Week 8 and Week 16 of Study Completers. (Mean + SE) mg/dl Diabetic Non-Diabetic Week 0 Week 8 Week 16 Unadjusted analysis conducted by student s t-test found to be significantly different between diabetic and non-diabetic subjects. Adjusted analysis conducted by ANCOVA for week 16 found to be significantly different between diabetic and non-diabetic subjects. Statistical probability of p<0.05 was considered to be significant. 104
122 Figure 4.29 HDL-cholesterol at Week 0, Week 8 and Week 16 of Study Completers. (Mean + SE) mg/dl Diabetic Non-Diabetic 0 Week 0 Week 8 Week 16 Unadjusted analysis conducted by student s t-test found to be significantly different between diabetic and non-diabetic subjects. Adjusted analysis conducted by ANCOVA for week 16 found to be significantly different between diabetic and non-diabetic subjects. Statistical probability of p<0.05 was considered to be significant. 105
123 Figure 4.30 Triglyceride Levels at Week 0, Week 8 and Week 16 of Study Completers. (Mean + SE) mg/dl Diabetic Non-Diabetic Week 0 Week 8 Week 16 Unadjusted analysis conducted by student s t-test found to be significantly different between diabetic and non-diabetic subjects. Adjusted analysis conducted by ANCOVA for week 16 found to be significantly different between diabetic and non-diabetic subjects. Statistical probability of p<0.05 was considered to be significant. 106
124 Figure 4.31 Meal Replacement Use for Diabetic and Non-Diabetic Subjects. The Average at Week 16 of Study Completers. (Mean + SE) Number Shakes Entrees Bars Total Meal Replacements Diabetic Non-Diabetic Unadjusted analysis conducted by student s t-test found to be significantly different between diabetic and non-diabetic subjects. Adjusted analysis conducted by ANCOVA for week 16 found to be significantly different between diabetic and non-diabetic subjects. Statistical probability of p<0.05 was considered to be significant. 107
125 Figure 4.32 Average Weekly Physical Activity for Diabetic and Non-Diabetic Subjects at Week 0, Week 8, and Week 16 as Reported and Recorded into the Patient at a Glance Data Sheets of Study Completers. (Mean + SE) kcal Diabetic Non-diabetic 0 Week 0 Week 8 Week 16 Unadjusted analysis conducted by student s t-test found to be significantly different between diabetic and non-diabetic subjects. Adjusted analysis conducted by ANCOVA for week 16 found to be significantly different between diabetic and non-diabetic subjects. Statistical probability of p<0.05 was considered to be significant. 108
126 CHAPTER FIVE Discussion The overall goal of the present study was to assess differences after weight loss in body composition and other metabolic parameters in women with type 2 diabetes compared to women without type 2 diabetes. Individuals with type 2 diabetes are at increased risk of morbidity and mortality and thus the importance of eliminating these co-morbid conditions associated with obesity and type 2 diabetes are of utmost importance in improving overall health and quality of life. This study attempted to decipher why women with type 2 diabetes often have a more difficult time losing weight, the differences between diabetic and non-diabetic individuals in body composition changes, specifically changes in abdominal visceral and subcutaneous adipose changes, changes in proinflammatory and prothrombotic markers and, finally, in improvements of lipid levels. Weight Loss The primary hypothesis that obese individuals with type 2 diabetes would lose less body weight than obese women without type 2 diabetes was not fully supported by analyses of women who completed the study. As stated previously, individuals with type 2 diabetes have a more difficult time losing weight with the conventional and behavioral approaches to weight loss compared with non-diabetic individuals (73;203;204). We found that women with type 2 diabetes, after adjusting for initial body weight, lost less weight, but not significantly so compared to women without type 2 diabetes in a medically-supervised weight loss program. Non-diabetic subjects 109
127 lost 15.4 kg of body weight and diabetic subjects lost 12.2 kg of body weight. The BMI changes were consistent with body weight changes. There was no significant difference in BMI units in diabetic or non-diabetic subjects before or after the weight loss phase indicating that diabetic subjects lost similar amount of weight to the nondiabetic subjects. The intention-to-treat (ITT) or last-observation-carried-forward (LOCF) analyses indicated that diabetic subjects were not able to lose as much percentage body weight as the non-diabetic subjects. All of the non-diabetic subjects completed the 16-week weight loss program, while 3 of the diabetic subjects terminated the program early. The fact that all individuals who ended the program early were diabetic subjects could explain why previous researcher (73;203;204) have concluded that individuals with type 2 diabetes often have a greater difficulty losing weight than non-diabetic subjects. The results of this study demonstrate that for women who complete a structured, medically-supervised low-energy diet (LED) weight loss program, there is no significant difference in success of weight loss. We also concluded that medically-supervised LED weight loss programs are a safe and effective method of weight loss for women with type 2 diabetes. In the present study, women with type 2 diabetes who completed the study consumed the same amount of shakes, entrees, bars and total meal replacements as non-diabetics. Individuals with type 2 diabetes have an increased risk for cardiovascular disease (222), peripheral vascular disease (222) and peripheral neuropathy (222), often increasing the difficulty to initiate and maintain physical activity. The ability of 110
128 individuals with type 2 diabetes to perform the required physical activity in this medically-supervised LED may help explain the success in weight loss observed in these individuals. As seen in the results of physical activity, non-diabetic and diabetic women both consistently attended weekly classes and made their mid-week phone calls. At 16 weeks both groups had an average of 6.6 days that were in the box and the majority of individuals were able to following the Triple Imperative TM requirements. Osteoarthritis is also common in obese individuals with and without type 2 diabetes, often making physical activity more painful. In this study 4 women with type 2 diabetes had arthritis and another 5 reported back, leg and joint pain. One subject with type 2 diabetes had Charcot s or neuropathic joint disease, which is a progressive destructive arthritis associated with loss of pain sensation, proprioception, or both (223). This woman had 2 toes amputated and was still able to do most of the required physical activity. One woman without type 2 diabetes reported having arthritis and 2 subjects without type 2 diabetes reported back, leg and joint pain. Despite the higher incidence of arthritis and joint pain in the subjects with type 2 diabetes, there was no difference in the amount of physical activity conducted. At week 8 and week 16, both non-diabetic and diabetic women were doing more than the minimum 2000 kcal required by the HMR program. Anderson et al. (224) found that VLED and LED were safe and effective methods of weight loss for individuals with diabetes. In a study of 40 subjects with type 2 diabetes, subjects lost an average of 15.7 kg with a decrease in insulin use, anti-diabetes and hypertensive medications with no serious side effects. Reynolds et al. (225) also found that medically-supervised VLED and LED were safe and 111
129 effective methods of weight loss for individuals with diabetes. In a retrospective review of consecutive patients enrolled in these programs, it was found that there was no difference in the amount of weight loss in non-diabetic and diabetic subjects who completed 12 weeks of the weight loss program (225). These results are consistent with the findings of the present study. Other researchers have also found VLEDs to be safe and effective for individuals with type 2 diabetes ( ). Body Composition Measurements Various procedures for body composition analysis cannot be compared directly due to different underlying principles. DEXA uses a 3-compartment body composition model consisting of bone mineral content, fat and lean tissue, while BOD POD is based on a 2-compartment model based on body density (231). Comparison between these body composition techniques generally yield high correlations for percent body fat but may differ in the absolute values obtained (231). Weyers et al. (231) studied body composition changes after weight loss using DEXA and BOD POD measurements. These researchers found that there was no significant differences in changes in percent body fat, fat mass and fat-free mass in response to weight loss between the methods. However, Hendel et al. (232) explained the differences in percent body fat between DEXA and BOD POD could be due to incomplete scanning of the entire body using DEXA which would account for errors in the DEXA estimates of percent body fat. In the present study DEXA scanning of the obese subjects was incomplete. The DEXA scan was originally made for non-obese women to measure bone mineral density and was not designed for larger individuals. Many of the women in the present study did not completely fit on 112
130 the table. The majority of the scans had one or both of the arms slightly missing from the scan/ body composition calculations. The CT technique and results also differ from DEXA and BOD POD. This procedure produces radiographic images of the abdomen which allows for differentiation between subcutaneous and visceral adipose tissue accumulation. The CT results are not expressed as a percentage or mass (e.g., kg), but in area (cm 2 ). Although the results of these procedures cannot be directly compared, trends in their findings can be useful to validate the changes in body composition. It must be noted that in the present study, though the methods of body composition can not be directly compared, the results of the data were very consistent between the body composition measurements. This has provided strength in the study design and provided further confirmation of the results. Baseline Comparison of Body Composition The hypothesis that obese individuals with type 2 diabetes will lose a greater proportion of abdominal fat as visceral abdominal fat compared to obese individuals without type 2 diabetes was examined. Several body composition measurements were conducted to examine changes in the amount and type of adipose tissue following weight loss in the study subjects. Dual-energy x-ray absorptiometry (DEXA) was used to measure total percent body fat; percent body fat in the trunk; total fat; total fat in the trunk; total lean tissue; and total tissue in the trunk. Airdisplacement plethysmography (BOD POD ) was used to measure percent body fat, and abdominal computer tomography (CT) was used to measure total abdominal adipose tissue and subcutaneous and visceral abdominal adipose tissue. 113
131 Diabetic individuals have more lean tissue and less fat than non-diabetic individuals. Diabetic individuals also have less abdominal subcutaneous adipose tissue than non-diabetic individuals. However, diabetic individuals have significantly more visceral adipose tissue than non-diabetic individuals. Diabetic subjects have significantly more total lean tissue (p=0.002) than non-diabetic subjects. Adjusting for differences in body weight, diabetic subjects have a non-significantly higher percentage of lean body tissue with DEXA and BOD POD measurements. Results from our measurements are consistent with those from the literature. It is unclear why diabetic subjects have relatively more lean tissue than nondiabetic subjects. This could somehow be related to the insulin resistant state and impaired metabolism of glucose and fatty acids by skeletal muscle in type 2 diabetes( ). One possible explanation for dysregulation of local lipolytic activity and development of insulin resistance in skeletal muscle may be due to an inverse relationship between intramuscular triglyceride content and insulin resistance (236). Kelley et al. (237) found that mitochondria tended to be smaller and have a reduced activity of complex 1 of the electron transport chain in individuals with type 2 diabetes. The researchers concluded that this impaired functional capacity of mitochondria may be a major determinant in the pathogenesis of skeletal muscle insulin resistance in type 2 diabetic individuals. Mitochondrial dysfunction in skeletal muscle in individuals with type 2 diabetes has been reported by other researchers as well ( ).Glucose toxicity alters protein function through glycosylation of tissue proteins and may decrease enzyme and other vital protein functions (241;242). In the present study, the greater amount of lean tissues in the 114
132 women with type 2 diabetes could contribute to the variations in adipose tissue concentrations and insulin resistance compared with the women without type 2 diabetes. The fat mass of diabetic subjects is relatively lower than that for non-diabetic subjects. Diabetic subjects have a non-significant lower percentage of body fat than non-diabetic subjects by DEXA and BOD POD. In addition, diabetic subjects have less truncal fat and less subcutaneous fat by CT than non-diabetic subjects. Our results are similar to those reported by Halvatsiotis (243). Halvatsiotis et al. (243) compared baseline body composition measurements of individuals with type 2 diabetes to weight-matched controls. Although not significant, DEXA measurements of lean mass (FFM) in kg found that diabetic subjects had slightly greater total lean tissue than the non-diabetic subjects. Total fat mass was found to be significantly greater in non-diabetic subjects then the diabetic subjects. There was no significant difference in the amount of total abdominal adipose tissue determined by CT and diabetic subjects had significantly greater visceral adipose tissue at baseline than the non-diabetic subjects. The results of these baseline findings are consistent in the study population of the present study. In contrast, Markovic et al. (161) assessed early and late changes in lipid levels induced by energy restriction versus fat loss in obese individuals with and without type 2 diabetes. Percent of total abdominal fat determined by DEXA and waist circumference was not found to be different prior to weight loss. 115
133 Body Composition Changes with Weight Loss With weight loss, diabetic subjects lose slightly more lean tissue than nondiabetic subjects by DEXA and BOD POD. These changes are consistent after adjusting for baseline difference in body weight. Diabetic subjects also lose less total and truncal fat as measured by DEXA, BOD POD and CT than non-diabetic subjects. While diabetic subjects lose equivalent amounts of visceral adipose tissue, as a percentage of weight loss on initial values, the absolute loss of visceral adipose tissue is greater in diabetic than non-diabetic subjects is unclear. DEXA measurements found diabetic subjects had significantly more total lean tissue than non-diabetic subjects after 16 weeks of weight loss (p=0.004). The percentage change in total lean tissue was not significantly different after 16 weeks of weight loss. This was also found after adjusting for baseline measurements, ANCOVA analysis found no significant difference between the groups at week 16. Unlike the DEXA results, analysis of total lean tissue after 16 weeks of weight loss with BOD POD found no significant difference in the amount of total lean tissue in non-diabetic and diabetic subjects. The percent change in total lean tissue however found diabetics subjects lost significantly more lean tissue than non-diabetic (p=0.027). ANCOVA analysis, adjusting for baseline values was approaching significance at week 16 with diabetic subjects having more lean tissue than nondiabetic subjects. The differences between the DEXA and BOD POD are most likely due to incomplete scanning of the subjects in the DEXA analysis. The overall results indicate that diabetic subjects had more total lean tissue than non-diabetic subjects after weight loss. 116
134 Percent and Total Body Fat Total percent body fat was measured by DEXA and BOD POD. The DEXA analysis indicated that after 16 weeks of weight loss diabetic subjects lost significantly less percent body fat than non-diabetic subjects (p=0.043). However, after adjusting for baseline values there was no significant difference in absolute percent body fat between non-diabetic and diabetic subjects after 16 weeks of weight loss. BOD POD analysis found no significant difference in the amount of percent body fat lost between non-diabetic and diabetic subjects. However, after adjusting for baseline values, ANCOVA analysis found that diabetic subjects lost significantly less percent body fat than non-diabetic subjects (p=0.009). Differences between DEXA and BOD POD results have already been discussed. The overall conclusion is diabetic subjects lost less percent body fat than non-diabetic subjects, but not after adjusting for baseline values. Diabetic and non-diabetic subjects had the same amount of percent body fat after weight loss. DEXA measurements of total fat indicated no significant difference in total body fat at week 16 between non-diabetic and diabetic subjects. Non-diabetics significantly decreased their percentage change in total body fat compared to diabetic subjects after 16 weeks of weight loss (p=0.029). After adjusting for baseline values diabetic subjects had significantly greater total fat than non-diabetic subjects (p=0.007). BOD POD measurements of total fat found diabetic subjects had more total body fat at week 16 than non-diabetic subjects (p=0.043). Non-diabetic subjects significantly decreased their percentage change in total fat compared to diabetic subjects (p=0.004). After adjusting for baseline values diabetic subjects had 117
135 significantly more total fat than non-diabetic subjects after 16 weeks of weight loss (p=0.007). Overall, results indicate that diabetic subjects had more total body fat than non-diabetic subjects and diabetic subjects did not decrease their total body fat as much as non-diabetic subjects after 16 weeks of weight loss. Our observations in percentage body fat and total fat are similar to Funkhouser et al. (244). In a study conducted by Funkhouser et al. (244) these researchers found that in 19 healthy obese women, a 13.1 kg weight loss resulted in a -5.9 percent of body fat analyzed by DEXA. These results are consistent with the non-diabetic subjects studied in the present study. Blaak et al. (245) studied 27 women and 8 men with type 2 diabetes and compared body composition changes after a VLED. The researchers found that with a 12.0 kg weight loss, percentage of body fat determined by underwater weighing decreased by This is consistent with the findings of Funkhouser et al. (244) and the present findings in the nondiabetic subjects. Underwater weighing is based on a 2-compartment model as is the BOD POD. Comparing the present results of diabetic subjects using the BOD POD analysis to Funkhouser and et al. (244) findings, the diabetic subjects in the present study lost more percentage body fat per kg of weight loss. Abdominal Adipose Tissue Abdominal fat was determined by DEXA and CT measurements after 16 weeks of weight loss. DEXA measurements found that at week 16 diabetic subjects had significantly more trunk fat than non-diabetic subjects (p=0.035). The percentage change in trunk fat was significantly lower in diabetic than non-diabetic subjects (p=0.05). Diabetic subjects had significantly more lean tissue in the trunk than non- 118
136 diabetic subjects after 16 weeks of weight loss (0.0005). The percentage change in lean tissue in the trunk was not found to be significantly different between nondiabetic and diabetic subjects. The amount of total trunk tissue determined by DEXA found that diabetic subjects had significantly more than non-diabetic subjects (p=0.001). The percentage change in trunk tissue was not found to be different in diabetic than non-diabetic subjects. After adjusting for baseline values diabetic subjects had significantly more total trunk tissue than non-diabetic subjects (p=0.12). Analysis of total abdominal adipose tissue by CT was found not to be significantly different between diabetic and non-diabetic subjects after 16 weeks of weight loss. After adjusting for baseline there was no difference in the amount of total abdominal tissue between diabetic and non-diabetic subjects. Waist circumferences were significantly greater in diabetic than non-diabetic subjects after 16 weeks of weight loss (p=0.0004). The percentage change in waist circumference was significantly less in diabetic than non-diabetic subjects after 16 weeks of weight loss (p=0.0103). After adjusting for baseline values diabetic subjects had significantly greater waist circumferences than non-diabetic subjects (p=0.001). Overall, the results of the total abdominal tissue found that diabetic subjects had significantly more abdominal tissue than non-diabetic subjects after 16 weeks of weight loss. These results are consistent with Stoney et al. (246) who compared regional body fat distribution in women with and without type 2 diabetes. The results indicated that total body fat were similar between the two groups, the women with type 2 diabetes had significantly less lowerbody fat, greater waist circumferences and abdominal fat than the women without type 2 diabetes. These researchers concluded that a reduced capacity to deposit 119
137 and/or conserve lower-body fat may be an independent factor associated with the metabolic manifestations of the insulin resistance syndrome in women with type 2 diabetes. Visceral and subcutaneous adipose tissue measurements were by CT. After 16 weeks of weight loss diabetic subjects had significantly greater amount of visceral adipose tissue than non-diabetic subjects (p=0.004). After adjusting for baseline values there was no significant difference in the amount of visceral adipose tissue in diabetic and non-diabetic subjects. After 16 weeks of weight loss there was no significant difference in the amount of subcutaneous adipose tissue between diabetic and non-diabetic subjects. After adjusting for baseline values diabetic subjects had significantly greater subcutaneous adipose tissue than non-diabetic subjects (p=0.034). Overall, the changes in visceral adipose tissue were not significantly different between the groups after weight loss, but diabetic subjects had significantly greater visceral adipose tissue stores than the non-diabetic subjects. After 16 weeks of weight loss there was no difference in subcutaneous adipose tissue stores in diabetic and non-diabetic subjects. After adjusting for baseline values diabetic subjects had significantly less subcutaneous adipose tissue than non-diabetic subjects (p=0.0394). The explanations for these differences are uncertain. To determine the number of subjects needed to see if there was a difference in percentage change in visceral adipose tissue a sample size calculation was conducted. Using a power of 0.8 and an alpha of 0.05, the sample size to determine differences in percentage change of visceral adipose tissue between diabetic and non-diabetic subjects would require 4070 subjects per group for a total of 8140 subjects. After 16 weeks of weight loss there 120
138 was no significant difference in the amount of subcutaneous adipose tissue between diabetic and non-diabetic subjects. This greater number of subjects needed to determine this difference suggests that percentage of visceral adipose tissue change with weight loss is the same in diabetic and non-diabetic subjects. A sample size determination of percentage change in subcutaneous adipose tissue with the same power and alpha would be 17 subjects for each group for a total of 34 subjects. This lower number reflects the significant difference found in subcutaneous adipose tissue in the present study. Despres and Lamarche (247) suggested that a visceral fat accumulation greater than 130 cm 2 could be associated with a decrease in insulin sensitivity. In the present study both diabetic and non-diabetics had visceral fat accumulation greater than this, cm 2 and cm 2, respectively. It should be noted that Karelis et al. (248) also found that metabolically healthy obese women had significantly higher visceral adipose accumulation ( cm 2 ). Despres and Lamarche (65) also concluded that abdominal visceral fat accumulation greater than 100 cm 2 was associated with increased risk factor for coronary heart disease. Williams et al. (249) found similar results in pre- and postmenopausal women and found that intraabdominal fat accumulation greater than 110 cm 2 were at an increased risk for coronary heart disease. In the present study, after weight loss visceral adipose tissue accumulation was still greater than 130 cm 2 in diabetic subjects (132.4 cm 2 ), while the non-diabetics had decreased their visceral fat accumulation to 79.4 cm 2. Thus, the diabetic subjects in the present study are at a greater risk of developing coronary heart disease than the non-diabetic subjects. 121
139 Karelis et al. (248) compared body composition in women considered to be metabolically healthy but obese to obese individuals with risks for the metabolic syndrome. These researchers found that despite similar levels of total body fatness, metabolically healthy obese individuals showed 49% less visceral adipose tissue (as measured from CT) than at-risk subjects with the metabolic syndrome. The metabolically healthy women showed a more favorable lipid profile, including lower fasting triglycerides, higher HDL-cholesterol and lower glucose and insulin concentrations. These results agree with findings of other researchers (250;251) that the amount of visceral fat is an important factor associated with variations in insulin sensitivity. Excessive visceral fat has been associated with a decrease in insulin sensitivity, which could lead to an increase risk of cardiovascular disease (252). In the study by Karelis et al. (248)the higher levels of insulin sensitivity in the metabolically healthy but obese individuals may be due to lower amount of visceral fat despite the presence of large amount of total body fatness. In the present study, there was no significant difference in the change in abdominal visceral adipose tissue between nondiabetic and diabetic subjects. The diabetic subjects had significantly more visceral adipose tissue at baseline and after 16 weeks of weight which would account for their decrease in insulin sensitivity. Miyashita et al. (253) found that individuals consuming a low-carbohydrate diet of approximately 1000 kcal/day with a 9 kg weight loss, visceral-to-subcutaneous adipose tissue ratio (V/S) was significantly decreased from 0.69 to 0.47 (p<0.05). The amount of carbohydrate used in this diet is consistent with the carbohydrate content used in the HMR program. In the present study, before weight loss non- 122
140 diabetic subjects had a V/S ratio of 0.20 while diabetic subjects had a significantly higher ratio of Both groups significantly decreased the V/S ratio to 0.19 and 0.33 for non-diabetic and diabetics respectively; however, there was no significant difference in the amount of change. Effects of Weight Loss in Ghrelin Values The hypothesis that plasma ghrelin levels in response to weight loss would not increase as much in individuals with type 2 diabetes as compared with individuals without type 2 diabetes was supported at week 16 after ghrelin values were adjusted for baseline. However, diabetic subjects had significantly lower ghrelin levels at baseline. Figure 4.11 depicting the rise of ghrelin levels due to weight loss, is consistent with the predicted levels in Figure 2.4. Overall, despite nonsignificant differences after 16 weeks of weight loss, women with type 2 diabetes continually had lower levels of ghrelin and both groups did not increase ghrelin levels to normal. Current research involving this newly discovered hormone is inconclusive and incomplete. Recent studies show that levels of ghrelin (254;255) are inversely related to insulin resistance; visceral adipose tissue accumulation is believed to downregulate ghrelin (254). Pöykkö et al. (256;257) measured fasting plasma ghrelin concentrations in 1,045 individuals of the Oulu Project Elucidating Risk of Atherosclerosis (OPERA) study. The mean fasting plasma ghrelin concentration of the study cohort was 668 pg/ml (range ). Results indicated that ghrelin levels were lower in subjects with type 2 diabetes, which is consistent with previous studies (100;258). This study also demonstrated adiposity to be an important determinant of ghrelin concentrations. Therefore, the lower ghrelin concentrations in 123
141 type 2 diabetic subjects could be due to their higher adiposity. The results of the study suggested that low ghrelin is independently associated with elevated blood pressure level and insulin concentration and the prevalence of type 2 diabetes. Similar to Pöykkö and colleagues (256;257), Katsuki et al. (259) evaluated 18 obese and 18 non-obese patients with type 2 diabetes to investigate ghrelin s possible role in abdominal adiposity, insulin levels and insulin resistance in individuals with type 2 diabetes. These researchers found that ghrelin levels are significantly associated with abdominal adiposity, fasting serum levels of insulin and insulin resistance in patients with type 2 diabetes. However, instead of adiposity as the determinant of ghrelin concentration, they concluded that hyperinsulinemia associated with insulin resistance decreases plasma levels of active ghrelin in patients with type 2 diabetes. Other research has also concluded that insulin is the prime regulator of ghrelin concentrations and that insulin may be the lead candidate for a long-term mediator of ghrelin responses to weight change (260;261). In other studies, the association of ghrelin to visceral adipose tissue and insulin has not been shown. Hansen et al. (262) studied eight obese Caucasian women with a mean age of years attending a 6-month weight loss course organized by The Danish Heart Association. These researchers found that individuals lost 5% of their initial body weight, resulting in an 8% reduction in total body fat and that plasma ghrelin levels increased by 12%. The increase in ghrelin was positively correlated to the weight reduction but not to the decrease in intra-abdominal fat area, plasma insulin or leptin. The possibly discrepancy between these results and other studies could be due to the small sample size and also not including individuals with 124
142 type 2 diabetes into the study. It may be that the genetic factors that predispose certain individuals to type 2 diabetes may also affect an individual s ghrelin production and metabolic responses. Purnell et al. (261) examined the relationship of ghrelin levels to body composition and parameters of glucose and lipid metabolism. They found no relationship of ghrelin to percentage body fat, total fat mass, lean mass, intraabdominal fat or leptin levels. They concluded that ghrelin levels best reflect body weight rather than specific amounts of fat or body fat distribution and that ghrelin levels correlated negatively with insulin and positively with insulin resistance. These results could explain why individuals with type 2 diabetes have lower ghrelin levels than non-diabetic individuals. There are currently no published studies directly examining the effects of weight loss on ghrelin levels in individuals with type 2 diabetes. It has been postulated that ghrelin may function as an adiposity signal contributing to weight regain in post-obese subjects, as evidenced by the increase in circulating ghrelin levels that accompanies voluntary or disease-induced weight loss (96;105;262). The present study found that individuals with type 2 diabetes had significantly lower ghrelin concentrations prior to weight loss which is in agreement with other studies (256;257;259;261). Effects of Weight Loss in Leptin Levels The hypothesis that plasma leptin levels in response to weight loss will not decrease as much in individuals with type 2 diabetes as compared with individuals without type 2 diabetes was not supported by this study. In the present study, plasma leptin levels decreased by 66.9% in non-diabetic subjects and 46.1% in diabetic 125
143 subjects. After adjusting for baseline measurements, leptin levels were still found to be significantly lower in non-diabetic subjects than diabetic subjects after 16 weeks of weight loss (p=0.0105). There are conflicting reports as to whether plasma leptin is associated with total body, subcutaneous or visceral adipose tissue ( ). Recent studies have suggested that it is subcutaneous adipose tissue and not visceral adipose tissue which shows a close association with serum or plasma leptin (263;264;266;270). Vettor et al. (34) found that in 15 obese women and 10 normal control women that leptin concentrations were highly significantly correlated with BMI and total and subcutaneous adipose tissue and significantly less with visceral adipose mass. Kobayashi et al. (271) found that in women abdominal subcutaneous adipose tissue mass was a more important determinant of serum leptin than was visceral fat mass and no relationship between serum leptin levels and lipid parameters of total cholesterol, LDL-cholesterol, HDL-cholesterol and triglyceride levels were shown. In contrast, Ronnemaa et al. (269) suggested that visceral adipose tissue was of special importance in the regulation of leptin levels after investigating 23 healthy identical twin pairs. A study by Gower et al. (272) also showed that in 54 postmenopausal women, visceral adipose tissue was independently related to serum leptin levels after adjusting for subcutaneous adipose tissue, leg fat and lean mass. The conflicting results between researchers as to whether leptin is more closely associated with subcutaneous or visceral adipose tissue are most likely due to the small sample sizes of the studies. Another explanation for the contradictory findings 126
144 is that subcutaneous adipose makes up a greater proportion of abdominal adipose tissue than visceral adipose tissue and thus may skew the results. Results of the present study show that individuals with type 2 diabetes may have alterations in leptin production and metabolic effects in the body. It is known that fasting leptin levels correlate with fasting insulin concentrations (273) and thus may be one of the target points of the complex axis of metabolic disturbances found in individuals with type 2 diabetes, leading to increased risk of other co-morbid conditions such as coronary heart disease. Effects of Weight Loss in Inflammatory Cytokines Findings regarding the hypothesis that obese individuals with type 2 diabetes will have a greater decrease in insulin, IL-6, TNF-α or CRP levels in individuals with type 2 diabetes or without type 2 diabetes were not what was expected. First, obviously, women with type 2 diabetes had higher insulin levels prior to weight loss; however, analysis found that there was no difference between the groups at 16 weeks. In the present study, insulin levels decreased by 30.1% and 28.7% in non-diabetic and diabetic subjects, respectively. These results are consistent with previous findings that insulin levels decrease in both obese diabetic and non-diabetic individuals during weight loss ( ). The importance of reducing insulin concentrations has been apparent. Insulin has been shown to play a role in the long-term regulation of body adiposity (274) and also may mediate the production and effects of cytokines such as ghrelin (261), leptin (86;275), and CRP (140). In the present study no difference was found in IL-6, TNF-α or CRP before or after weight loss. Levels of these inflammatory cytokines all decreased with weight 127
145 loss but non-significantly. Subjects were told not to consume anti-inflammatory medications during the study. These medications obviously effect the cytokine levels of IL-6, TNF-α and CRP. It was originally thought that levels of these cytokines would be increased in obese individuals but significantly greater in obese individuals with type 2 diabetes. Of the 29 subjects in the present study, 15 subjects took antiinflammatory medications throughout the study. Ten of the subjects taking antiinflammatory medications were diabetic and 5 non-diabetic. The majority of individuals took over-the-counter aspirin, ibuprofen or Tylenol. However, 6 individuals took either Vioxx or Celebrex during the study. The use of these medications can explain why there was no difference found in IL-6, TNF-α or CRP levels before or after the 16 weeks of weight loss. Putz et al. (276) has stated that CRP concentrations are elevated in obesity and may be the effect of IL-6 release from adipocytes and higher insulin resistant states (140). Hak et al. (140) found that CRP is elevated in subjects with the metabolic syndrome and appears to progressively increase when glucose metabolism deteriorates. Mc Laughlin et al. (277) also found that CRP concentrations are elevated in obese and/or hyperinsulinemic individuals. These researchers show that CRP levels were higher in obese individuals with insulin resistance compared to obese individuals without insulin resistance. After weight loss CRP concentrations decreased only in the insulin resistant women. These researchers concluded that CRP concentrations are elevated predominantly in obese individuals who are also insulin resistant and fall parallel with weight loss-associated improvements in insulin resistance. The relation between CRP concentrations and insulin resistance is 128
146 independent of obesity. In the present study, if subjects had not taken antiinflammatory medications one would expect that the women with type 2 diabetes would have seen a greater decline in CRP levels as their insulin resistance improved as shown from the improved HOMA-IR values. Xenachis et al. (278) studied 48 morbidly obese subjects who were placed on an 800 kcal formula diet and found that TNF-α levels decreased with weight loss. Dandona et al. (279) found that serum TNF-α concentrations are greater in obese versus lean subjects before and after weight loss. The fall in serum TNF-α concentrations may contribute to the restoration of insulin sensitivity in obese patients who lose weight (280). These results agree with several other studies that serum TNF-α levels decrease with body weight reduction (281;282). TNF-α has been proposed as a mediator of obesity-related insulin resistance (127;283). Katsuki et al. (125) found that TNF-α concentrations were significantly higher in obese individuals with type 2 diabetes as compared to non-obese or non-obese individuals with type 2 diabetes. After weight loss, TNF-α levels significantly decreased in subjects with type 2 diabetes but were unchanged in both the non-obese and non-obese subjects with type 2 diabetes. These researchers suggest that serum TNF-α level may play an important role in the mechanism of insulin resistance associated with obesity. So, as found with CRP concentrations, TNF-α concentrations may play a greater role in insulin sensitivity than adiposity with insulin sensitivity. Esposito et al. (284) studied 120 healthy obese women to determine the effect of a lifestyle and weight loss program on its effects of vascular inflammatory markers. As with other researchers (136;282), IL-6 levels were found to be correlated 129
147 with body weight. Serum IL-6 concentrations were found to decrease with weight loss. Kopp et al. (285) also found similar results in individuals with varying degrees of glucose intolerance after weight loss with gastroplastic surgery. At baseline these researchers found that IL-6 concentrations were more closely related to HbA1c, whereas CRP concentrations were more closely related to glucose-stimulated insulin release. The inflammatory markers of IL-6, CRP and TNF-α were all significantly correlated with insulin resistance. After gastroplastic surgery, a significant weight reduction was produced and levels of IL-6 and CRP were also significantly reduced. Effects of Weight Loss in Thrombotic Cytokines The hypothesis that obese individual with type 2 diabetes will have a greater decrease in serum triglyceride, PAI-1 and resistin compared to obese individuals without type 2 diabetes had varying findings. Triglyceride levels were significantly greater in individuals with type 2 diabetes. This is to be expected since triglyceride levels >150 mg/dl was one of the exclusion criteria used to exclude a non-diabetic subject from the study. Also, visceral adipose tissue mass has a positive relationship with triglycerides ( ) and an inverse relationship with serum HDL-cholesterol (288), while subcutaneous adipose tissue does not have any correlation (269). Contrary to these findings, Kobayashi et al. (271) studied 26 men and 26 women and found that visceral adipose tissue mass had a positive relationship with serum total cholesterol and LDL-cholesterol; however, visceral adipose tissue mass was only associated with triglycerides in men and not women. These findings are consistent with other studies (24;289). Despite the triglyceride exclusion criteria for nondiabetic subjects in the present study, it could be speculated that the higher 130
148 triglyceride levels seen in the diabetic subjects could be due to significantly more visceral adipose tissue and less subcutaneous adipose tissue than the non-diabetic subjects. However, after adjusting for baseline there was no significant difference between the groups after 16 weeks of weight loss. Obese subjects did have a greater decrease in serum triglyceride levels but they were not different after adjusting initial values. Non-diabetic subjects decreased triglyceride levels by 15.1 mg/dl resulting in a 13.1% decrease. Diabetic subjects decreased triglyceride levels by 82.5 mg/dl resulting in a 34.5% decrease in triglyceride levels. These results are consistent with many other findings. Serum triglyceride levels decreased from approximately 15% to as much as 50% during VLED treatment, depending upon initial levels (229;230; ). Marckmann et al. (162) found that weight loss decreases PAI-1 levels in individuals with and without type 2 diabetes. The results of the present study found that PAI-1 levels were not significantly different between diabetic and non-diabetic subjects, but PAI-1 levels did decrease in both diabetic and non-diabetic women. At the end of the weight loss phase PAI-1 levels in diabetic subjects were approaching statistically greater significance than non-diabetic subjects. With adequate sample size a significant difference in PAI-1 levels are expected. A rationale for the increase in PAI-1 levels in the diabetic subjects is most likely associated with increased growth factors such as insulin and TNF-α along with metabolic products such as triglycerides, free fatty acids, and glucose, all of which can stimulate PAI-1 expression ( ;158;293;294). 131
149 Skurk et al. (295) found that IL-6, leptin and adiponectin are associated with impaired fibrinolysis in overweight hypertensive humans. In the present study, diabetic subjects had higher insulin and lower leptin and adiponectin levels than their non-diabetic counterparts, which may provide evidence of an association between body fatness, insulin, leptin and adiponectin as key regulators of risk for developing cardiovascular disease. Also, in a study of obese children and adolescents, Ikezaki et al. (254) found that down-regulation of ghrelin secretion may be a consequence of higher insulin resistance associated with visceral fat accumulation and elevated PAI-1 concentrations. In the present study baseline ghrelin levels were significantly lower in diabetic subjects than non-diabetes and were still lower after 16 weeks of weight loss and thus may further have contributed to the higher insulin resistance, greater visceral fat mass and elevated PAI-1 concentrations in the diabetic subjects. Several small studies have reported that circulating resistin levels are increased in human obesity ( ) and diabetes ( ); however, other data dispute these findings ( ). Previous studies of the effect of weight loss on resistin levels have also been controversial. The results of the present study are consistent with Wolfe et al. (181) and Monzillo et al. (182) in that no significant reduction was found in resistin levels with weight loss. In the present study, plasma resistin levels were significantly greater in individuals with type 2 diabetes than in individuals without type 2 diabetes which is consistent with the findings of Steppan and colleagues (194). However, with weight loss resistin levels did not decrease in either group. Silha et al. (195) found that there was a significant correlation between resistin levels and HOMA-IR in obese subjects independent of BMI. These results 132
150 may indicate that resistin levels are a predictor for type 2 diabetes. Resistin seems to reflect insulin resistance despite an individual s BMI. This would explain why levels did not decrease with weight loss but rather is an independent factor associated with a risk for developing type 2 diabetes. Shetty et al. (175) found a negative correlation between serum resistin and HDL, a positive correlation of serum resistin to CRP; these correlations remained significant after adjusting for type 2 diabetes. The results also indicated that the positive association of resistin to CRP also remained significant despite adjustments for sex and BMI, suggesting that resistin s proinflammatory properties may be independent of overall obesity. However, resistin s association with inflammatory markers appear to be independent of BMI, suggesting that resistin may have a direct proinflammatory role or mediate its effects via yet-to-be discovered obesityindependent mechanism. Heilbronn et al. (299) found that serum resistin concentrations were increased in response to supraphysiological doses of insulin in both obese and obese diabetic subjects. Although the effect was modest, it suggests that resistin expression may be acutely regulated by insulin. These results indicate that resistin concentrations were up-regulated by insulin concentration thus implying that higher fasting insulin concentrations should result in higher serum resistin concentrations. That study however, does not support a role for resistin as a major mediator of insulin sensitivity in humans. Stejskal et al. (300) examined differences in resistin levels among persons with type 2 diabetes, with systemic inflammation and healthy persons. The study 133
151 found that in the healthy subjects there was a significant correlation between leptin and resistin; however, in individuals with type 2 diabetes no significant correlation was found between resistin, insulin sensitivity markers, BMI or leptin. The researchers concluded that concentrations of resistin in persons with type 2 diabetes do not differ from concentrations of healthy subjects. This is consistent with the findings of the present study. No significant difference was found between the obese diabetic subjects and non-diabetic subjects at week 16 after adjusting for initial resistin levels. Effects of Weight Loss in Adiponectin Values The hypothesis that obese individuals with type 2 diabetes will have a greater increase in plasma adiponectin compared to obese individuals without type 2 diabetes is reflected by the current findings of adiponectin levels. As expected, women with type 2 diabetes had significantly lower adiponectin levels at the beginning of the study. After adjusting for baseline there was no significant difference between adiponectin levels after weight loss. An interesting point to recognize is that as expected, adiponectin levels increased in women with type 2 diabetes after weight loss, but although non-significantly, decreased in obese women without type 2 diabetes. These results are consistent with Monzillo et al. (182) who also found that adiponectin levels increased in individuals with type 2 diabetes but not in individuals without type 2 diabetes or who had impaired glucose intolerance without type 2 diabetes. Wolfe et al. (181) also found in normal, healthy weight individuals that adiponectin levels decreased significantly with weight loss. 134
152 In a study of Pima Indians, Krafoff et al. (301) examined the relationship of adiponectin to a variety of markers of inflammation and endothelial dysfunction and assessed the relationship of these markers to a later incidence of diabetes. This research provided further in vivo evidence that adiponectin concentrations correlated with markers of inflammation and endothelial dysfunction (170). They concluded that adiponectin is negatively correlated with markers of inflammation in vivo. Moreover, once adiposity is taken into account, these other markers have little or no predictive value for the development of diabetes. Thus, adiponectin may be an important link between adiposity and inflammation and type 2 diabetes. Stejskal et al. (302) conducted a study consisting of 109 persons with type 2 diabetes and concluded that individuals with type 2 diabetes have lower adiponectin concentrations in serum than patients with a high risk of atherosclerotic complications without type 2 diabetes. These researchers also concluded that adiponectin may be a novel marker of metabolic control in persons with a high risk of cardiovascular complications of atherosclerosis. Shetty et al. (175) found that adiponectin s association with HDL and PAI-1 was independent of BMI, which suggests adiponectin may mediate some effects of adiposity, but whether central obesity or other unrecognized pathways might play a regulatory role remains to be seen. They found that in subjects with diabetes or who are at risk of developing diabetes, adiponectin is negatively correlated with BMI, triglycerides, CRP, PAI-1 and tpa, suggesting that adiponectin may act as an antiinflammatory mediator with respect to CRP, PAI-1 and tpa. These findings are consistent with prior data that adiponectin levels correlate negatively with 135
153 inflammation and endothelial dysfunction (303). Shetty et al. (175)were the first to find a negative correlation with adiponectin to PAI-1, which is also associated with insulin resistance and the metabolic syndrome (304). This provides another possible mode for adiponectin in affecting the metabolic syndrome-induced morbidity and mortality. Satoh et al. (305) found that the ratio of leptin-to-adiponectin may be a potential atherogenic index in obese type 2 diabetic patients. These researchers compared 98 non-obese individuals with type 2 diabetes to 60 obese individuals with type 2 diabetes to see if there were differences in predicting atherosclerosis between the groups. These researchers found that obese individuals with type 2 diabetes have significantly higher leptin-to-adiponectin ratios then the non-obese type 2 diabetic subjects. In the present study no significant difference was found in leptin-toadiponectin ratios between the obese women with or without type 2 diabetes at any time point; however, ratios of leptin-to-adiponectin significantly decreased for both groups with weight loss. An interesting finding is that of the 30 obese females Satoh et al.(305) analyzed, in individuals with a BMI of 27.4 kg/m , the leptin-toadiponectin ratio was This is very close to the results in both the nondiabetic and diabetic subjects in the present study after 16 week of weight loss. Nondiabetics had a BMI of 30.1 kg/m 2 and had a leptin-to-adiponectin ratio of , while diabetic subjects with a BMI of 33.0 kg/m 2 had a ratio Effects of Weight Loss in Lipid Levels and Blood Pressure The fact that total cholesterol, LDL-cholesterol and triglycerides decrease with weight loss is established and systematically reduces an individual s risk for 136
154 coronary heart disease (224;306;307). Anderson and Konz (25) concluded that for every 1 kg reduction in body weight, serum total cholesterol will decrease by 0.99% or 2.28 mg/dl, LDL-cholesterol will decrease by approximately 0.68% or 0.91 mg/dl, and triglycerides will decrease by 1.93% or 1.54 mg/dl. Weight loss also often decreases HDL-cholesterol levels in women (308). In the present study reductions in serum total cholesterol and triglyceride values were seen in both non-diabetic and diabetic subjects. LDL-cholesterol values decreased in the non-diabetic subjects but increased in the diabetic subjects. This occurrence is explained by reporting that in several individuals, LDL-cholesterol raised dramatically. This was most likely due to release of fatty acids from adipose tissue and lack of LDL-receptors on the liver to clear the excess fatty acids from the blood stream. It is recognized that in approximately 85 percent of individuals with hypertension, blood pressure decreases in a linear fashion with weight loss (306). The present study did not find any changes in systolic or diastolic blood pressure measurements. This is due to both non-diabetic and diabetic individuals being excluded if they had uncontrolled hypertension. Some subjects were on medications to control hypertension but after weight loss the medications were either lowered or discontinued. Follicle-Stimulating Hormone Analysis Female sex steroid hormone concentrations regulate adipose tissue mass (309). Menopausal status can be a determinant of body composition changes in women, predominantly in an increase in visceral fat mass, particularly in the abdomen (310). It has also been postulated that changes in sex hormones may also be caused 137
155 by an indirect mechanism related to insulin resistance (310). To eliminate menopausal and sex hormone concentrations as confounding variable in the present study, follicle-stimulating hormone levels were measured. The population in the present study consisted predominantly of postmenopausal women. Normal FSH levels are considered to be within the range of 3 to 10 miu/ml. Basal FSH levels generally rise in the third decade of life through the first few years after menopause due to physiologic and biochemical changes that reduce negative feedback controls on FSH production. Menopause is associated with substantially increased FSH levels, usually greater than 40 miu/ml (311). However, in perimenopausal women the absolute value cannot be relied upon to establish the true onset of menopause (312;313). In the present study, non-diabetic subjects at baseline had FSH levels of 42.9 miu/ml and diabetic subjects had levels of 26.4 miu/ml, indicating that the majority of the subjects were either perimenopausal or menopausal. After analysis of the present FSH levels there was no significant difference between non-diabetic and diabetic subjects at any point throughout the study, indicating that FSH levels could not explain body composition differences between the two groups. FSH levels increased in both groups with weight loss. One could suppose that FSH levels would decrease with weight loss indicating improved fertility status. A possible explanation for FSH levels increasing in the present study could be due to metabolic and biochemical changes that occur with menopause; additional changes in their body composition were not able to compensate for their age and natural progression of menopause. 138
156 Study Limitations It is recognized that there are several limitations to this study that could be addressed in future. The first and primary limitation is the sample size. The sample size was calculated to include 25 subjects with type 2 diabetes and 25 subjects without type 2 diabetes to allow a 20% attrition rate. This means that 20 subjects in both groups needed to complete the study to meet the sample size calculations. Some of the results were approaching significance and may have become significant if enough subjects were recruited for the study. The sample size was not met due to financial and resource limitations on the part of HMR. The second limitation is controlling study subjects medication use. The primary importance of this was a subject s use of non-steroidal anti-inflammatory drugs (NSAIDs). During the phone screen and during the initial screening visit, it was stressed to potential study participants that chronic use of anti-inflammatory medications was not allowed during the study. However, approximately half of the study participants reported use of NSAIDs to the nurses at the HMR program. For any clinical study dealing with individuals on an outpatient basis, it is understood to contain variables that are uncontrollable by the principal investigator and research team. The results of the study would have been stronger if the study subjects use of anti-inflammatory, hypertension and hyperlipidemia medications were better controlled. The third limitation to the study regards determining if individuals with type 2 diabetes have a more difficult time losing weight than individuals without type 2 diabetes; a weight loss protocol in which more individuals in the general population 139
157 could participate would have been beneficial. This study was able to find that medically-supervised programs were safe and effective for individuals with type 2 diabetes but does not explain why under normal dieting experiences individuals often do not lose much weight. A study consisting of a reduced-calorie diet and meal replacements along with encouraged physical activity and record keeping would be better suited to determine this hypothesis. Many individuals are not able to participate in medically-supervised weight loss programs due to location or cost. Instead, providing a reduced-calorie diet with meal replacements could be implemented so that issues of cost or location of a diet program is not a deterring factor for individuals to partake in a weight loss program. Another limitation is that many of the outcome measurements were significantly different between the groups from the outset. Subjects were matched for BMI and age, but there were significant differences in initial body weight and amounts of abdominal fat. In a flawless study there would not have been any variations in the groups prior to weight loss. However, with the limits of time and financial resources it was not feasible to recruit individuals and match every outcome parameter. 140
158 CHAPTER SIX Overall Summary and Conclusion With the increasing prevalence of obesity throughout the world, type 2 diabetes mellitus is dramatically rising as well. Type 2 diabetes is a leading contributor to the risk of coronary heart disease, kidney disease, blindness, stroke, peripheral vascular disease and neuropathy (8). It is of utmost importance in our society to decrease morbidity and mortality in these individuals and to increase their quality of life. The purpose of this study was to evaluate adherence to a medically-supervised LED weight loss program and changes in body composition and metabolic parameters after weight loss in women with and without type 2 diabetes. Previous studies have investigated the effects of weight loss on changes in body composition, adipose tissue hormones, and cytokines in obese individuals, but none has directly compared differences in non-diabetic and diabetic subjects undergoing a medicallysupervised low-energy diet weight loss program (HMR ). It is known that individuals with type 2 diabetes often have a more difficult time losing weight. The important question is if individuals with type 2 diabetes have a greater difficulty in behavioral and environmental cues to lose weight or if metabolic and biochemical adaptations occur in these individuals, making them metabolically dysfunctional to lose weight. Vijan et al. (314) surveyed and conducted focus groups in suburban and urban individuals with type 2 diabetes to evaluate barriers against adherence to following dietary recommendations in this patient population. Overall, these patients seemed 141
159 more likely to cooperate with pharmaceutical diabetes management than with selfcare behaviors such as dietary modification or home glucose monitoring. The patients stated that even moderate dietary modifications were more cumbersome than taking anti-diabetic oral agents. An even stricter diet that promotes weight loss and thus likely to lead to more substantial benefits was seen as having a burden similar to that of twice-daily insulin injections. The cost of a diabetes diet was also barrier mentioned in these focus groups. In the present study, both non-diabetic and diabetic women who completed the 16-week medically-supervised LED weight loss program successfully lost weight. Non-diabetics subject lost 15.4 kg resulting in a 16% decrease in body weight and diabetic subjects lost 12.2 kg resulting in an 11.7% decrease in body weight. However, diabetic women in the study were more likely to drop from the weight loss program and once these women were included in the analysis (intention-to-treat analysis), diabetic subjects overall did not lose as much weight as non-diabetic subjects. There are several possible reasons for these results. It is known that in individuals with type 2 diabetes adherence rates to diet and exercise are low ( ). Many factors that may influence dietary adherence include personal motivation (319), holidays and other social gatherings (177;319), scheduling issues (319), cravings to eat inappropriate foods (177), lack of family support (177), perceived high cost of the diet (320), and displeasure at eating the recommended foods (320). The subjects in the present study underwent a highly rigorous medically-supervised LED weight loss program and thus the women with type 2 diabetes may have had a more difficult time following the diet. 142
160 The next question related to possible differences in body composition and metabolic variations between the diabetic and non-diabetic women, which may explain differences in how diabetic and non-diabetic individuals lose weight. First, although the measurements of the DEXA and BOD POD varied, overall results indicated that the diabetic women had more lean tissue than the non-diabetic women. The higher levels of lean tissue may be related to the insulin resistant state and impaired glucose and fatty acids by skeletal muscle in type 2 diabetes. The women with type 2 diabetes also lost less percent body fat and total body fat mass than the women without type 2 diabetes. More significantly is where, and what type of body fat was decreased in these subjects. It has been well established that abdominal obesity increases the risk of type 2 diabetes (1;29;56-58). In the present study, prior to weight loss there was no difference between the diabetic and non-diabetic women in waist circumference. However, non-diabetic women decreased their waist circumferences significantly more than diabetic women. Although there was no significant difference in the amount of visceral and subcutaneous fat loss after initial adjustment for baseline values it is still important to note that diabetic women had a significantly greater amount of absolute abdominal visceral fat mass than the nondiabetic women before and after equivalent amounts of weight loss. Visceral fat has been shown to be associated with a decrease in insulin sensitivity (252). The higher amounts of insulin may be one of the key initial stimuli for the metabolic disruptions found in obesity causing the increased risk for the other co-morbid diseases associated with obesity and type 2 diabetes mellitus. 143
161 Although the changes in insulin and insulin sensitivity (determined by HOMA-IR) overtime were not significantly different between the two groups in the present study, diabetic individuals still had higher insulin levels and higher insulin resistance than their obese counterparts, despite losing weight. Insulin is thought to increase several stomach and adipose tissue hormones and cytokines causing increased inflammation and thrombotic events in this population, as was in the present study. The production of the adipose tissue derived hormone leptin increases in the presence of higher serum insulin levels. After weight loss leptin levels were still consistently higher in the diabetic subjects than in the non-diabetic subjects. The stomach derived hormone, ghrelin, is also inversely related to insulin resistance and visceral adipose tissue accumulation is believed to down-regulate ghrelin (254). The excess of visceral adipose tissue in the diabetic women even after weight loss would explain why ghrelin levels were lower after weight loss in these women than in the non-diabetic women. The risk of coronary heart disease is increased by proinflammatory and prothrombotic cytokines such as TNF-α, IL-6, CRP, and PAI-1. Although there were no significant changes in the present study, the proinflammatory cytokines, TNF-α, IL-6 and CRP increase with greater serum insulin levels. These cytokines are known to up-regulate and down-regulate each other and most likely play an additional role in this complex system of body fat accumulation and mobilization. The prothrombotic protein PAI-1 plays a key role in the pathogenesis of myocardial infarction, stroke, and other vascular events ( ) and is increased with insulin resistance and type 2 diabetes. In the present study, PAI-1 levels decreased in both diabetic and non- 144
162 diabetic women. Although not statistically significant, PAI-1 levels were higher in diabetic women than non-diabetic women after weight loss. These results indicate that even though diabetic subjects decreased PAI-1 levels with weight loss, they were still at a greater risk of cardiovascular disease than the non-diabetic women. Resistin and adiponectin are recently studied adipose tissue derived hormones, believed to play a role in insulin resistance and either promote cardiovascular risk factors, as in the case of resistin, or have anti-inflammatory properties and reduce the risk of cardiovascular disease, as with adiponectin. Adiponectin levels were significantly lower in the diabetic subjects at baseline and increased with weight loss, demonstrating an improvement in cardiovascular disease risk. These results were consistent with findings of Monzillo et al.(182). There was non-significant reduction in adiponectin levels in the non-diabetic women after weight loss. Although these results were non-significant, Wolfe et al.(181) also found that in normal, healthy weight individuals adiponectin levels decreased significantly with weight loss. In the present study, we may have seen this as well with a larger study population. These results may be due to a decrease in adiposity and not reflect an increase in cardiovascular disease risk. It has been proposed that resistin increases in individuals with type 2 diabetes and is a potential link between obesity and insulin resistance. In the present study resistin levels were significantly greater in diabetic women than non-diabetic women. However, resistin levels did not decrease in either group with weight loss. This data are consistent with Steppan and colleagues (178), but this theory is still controversial. 145
163 Overall, the results of the present study found that medically-supervised LED weight loss programs are safe and effective for treating obesity in individuals with type 2 diabetes. Lipid profiles and cardiovascular risk factors improved in both nondiabetic and diabetic subjects with weight loss. The findings also suggest that insulin may play a critical role in the complex axis affecting changes in body composition and inflammation in individuals with type 2 diabetes. Further research should focus on the effects of body composition, adipose tissue hormones, and inflammatory cytokines in levels of insulin control of individuals with type 2 diabetes mellitus. 146
164 APPENDIX A Patient Screening Information 147
165 Patient Screening Information Subject Number Category Enrolled Randomized Age BMI Screen Date Comments 001 NonDM Yes HMR /21/ DM No No /28/2003 Couldn't follow diet 003 DM Yes HMR /28/ DM Yes HMR /21/ NonDM Yes HMR /4/ DM No No /11/2003 >BMI 006 DM No No /18/2003 Graves Disease 007 DM Yes HMR /4/ DM Yes HMR /24/ DM Yes HMR /6/ DM Yes HMR /8/ DM No No /9/2003 Type 1.5 Diabetes 012 DM Yes HMR /12/ NonDM Yes HMR /6/ DM Yes HMR /11/ DM Yes HMR /12/ NonDM Yes No /13/ DM Yes HMR /7/ DM Yes HMR /18/ NonDM No No /21/2003 Metabolic Syndrome 020 DM Yes HMR /28/ DM Yes No /25/ DM No No /1/2003 Need to increase HbA1c 023 DM Yes HMR /6/ NonDM Yes HMR /3/ DM Yes HMR /4/ NonDM Yes HMR /17/ NonDM No HMR /20/2003 Hypothyroidism 028 NonDM Yes HMR /15/ NonDM Yes HMR /16/ DM Yes HMR /25/ DM Yes HMR /2/ NonDM Yes HMR /25/ NonDM Yes HMR /30/ DM Yes HMR /31/ NonDM No No /1/2004 Prediabetic 036 DM Yes HMR /14/ NonDM Yes HMR /28/ DM Yes HMR /10/ DM Yes HMR /18/ NonDM Yes HMR /19/ DM Yes HMR /20/
166 APPENDIX B Weight and Body Composition Measurements Data Tables 149
167 Non-Diabetic Subjects weight in kg Non-Diabetic Subjects Pt. # Screen Wk1 Wk2 Wk3 Wk4 Wk5 Wk6 Wk7 Wk8 Wk9 Wk10 Wk11 Wk12 Wk13 Wk14 Wk15 Wk Average Count SD SE % LCI % UCI
168 Diabetic subjects weight in kg (WD = withdrew) Diabetic Subjects Pt. # Screen Wk1 Wk2 Wk3 Wk4 Wk5 Wk6 Wk7 Wk8 Wk9 Wk10 Wk11 Wk12 Wk13 Wk14 Wk15 Wk WD WD WD Average Count SD SE % LCI % UCI
169 Percent Weight Loss and Change in kg for Non-Diabetic and Diabetic Completed and ITT Subjects. ITT (Intention-To-Treat) Indicates Last Weight Change Carried Forward for All Study Participants. (WD = withdrew) Non-Diabetic Subjects Scrn % % ITT ITT Pt. # Wt Wk 1 Wk 4 Chg Chg Wk 8 Chg Chg Wk 12 Chg % Chg Wk 16 Chg Chg % Chg % Chg Average Count SD SE % LCI % UCI Diabetic Subjects WD WD WD Average Count SD SE % LCI % UCI
170 Change and Percent Change in BMI (kg/m 2 ) for Non-Diabetic and Diabetic Subjects. (WD = withdrew) Non-Diabetic Subjects Pt. # Screen BMI Final BMI Chg BMI %Chg Average Count SD SE % LCI % UCI Diabetic Subjects WD WD WD Average Count SD SE % LCI % UCI
171 Total Percent Body Fat Determined by DEXA. Non-Diabetic Subjects Pt # DEXA % Total Fat Wk0 Wk8 Chg Wk16 Chg Average Count SD SE % LCI % UCI Diabetic Subjects WD Average Count SD SE % LCI %UCI
172 Percent Trunk Fat Determined by DEXA. Non-Diabetic Subjects DEXA %Trunk Fat Pt # Wk0 Wk8 Chg Wk16 Chg Average Count SD SE % LCI % UCI Diabetic Subjects WD Average Count SD SE % LCI % UCI
173 Total Body Fat in kg Determined by DEXA. Non-Diabetic Subjects Pt # Wk0 Wk8 Chg %Chg Wk16 Chg %Chg Average Count SD SE % LCI % UCI Diabetic Subjects WD Average Count SD SE % LCI % UCI
174 Trunk Fat in kg Determined by DEXA. Non-Diabetic Subjects Pt # Wk0 Wk8 Chg %Chg Wk16 Chg %Chg Average Count SD SE % LCI % UCI Diabetic Subjects WD Average Count SD SE % LCI % UCI
175 Total Lean Tissue in kg Determined by DEXA. Non-Diabetic Subjects Pt # Wk0 Wk8 Chg %Chg Wk16 Chg %Chg Average Count SD SE % LCI % UCI Diabetic Subjects WD Average Count SD SE % LCI % UCI
176 Trunk Lean Tissue in kg Determined by DEXA. Non-Diabetic Subjects Pt # Wk0 Wk8 Chg %Chg Wk16 Chg %Chg Average Count SD SE % LCI % UCI Diabetic Subjects WD Average Count SD SE % LCI % UCI
177 Total Trunk Tissue in kg Determined by DEXA. Non-Diabetic Subjects Pt # Wk0 Wk8 Chg %Chg Wk16 Chg %Chg Average Count SD SE % LCI % UCI Diabetic Subjects WD Average count SD SE % LCI % UCI
178 Percent Body Fat Determined by BOD POD. Non-Diabetic Subjects Pt # Wk0 Wk8 Chg Wk16 Chg Average Count SD SE % LCI % UCI Diabetic Subjects WD Average Count SD SE % LCI % UCI
179 Total Fat in kg Determined by BOD POD. Non-Diabetic Subjects Pt # Wk0 Wk8 Chg Wk16 Chg Average Count SD SE % LCI % UCI Diabetic Subjects WD WD Average Count SD SE % LCI % UCI
180 Total Lean Tissue Determined by BOD POD. Non-Diabetic Subjects Pt # Wk0 Wk8 Chg Wk16 Chg Average Count SD SE % LCI % UCI Diabetic Subjects WD WD Average Count SD SE % LCI % UCI
181 Change in Subcutaneous and Visceral Adipose Tissue Stores for Non-Diabetic and Diabetic Subjects. Non-Diabetic Subjects Subcutaneous Fat 1 Pt # (sq cm) Subcutaneous Fat 2 (sq cm) Visceral Fat 1 (sq cm) Visceral Fat 2 (sq cm) Total Abdominal Fat Loss (sq cm) %Chg Chg (sq cm) %Chg Chg (sq cm) Average Count SD SE % LCI % UCI Diabetic Subjects Average Count SD SE % LCI % UCI
182 Change and Percent Change in Waist Circumference (cm) for Non-Diabetic and Diabetic Subjects. Non-Diabetic Subjects Pt # Wk0 Wk16 Total Change %Chg Average Count SD SE % LCI % UCI Diabetic Subjects WD WD WD Average Count SD SE % LCI % UCI
183 APPENDIX C Computer Tomography Scans 166


184 Patient # 001 Scan 1 Scan 2 167


185 Patient # 005 Scan 1 Scan 2 168

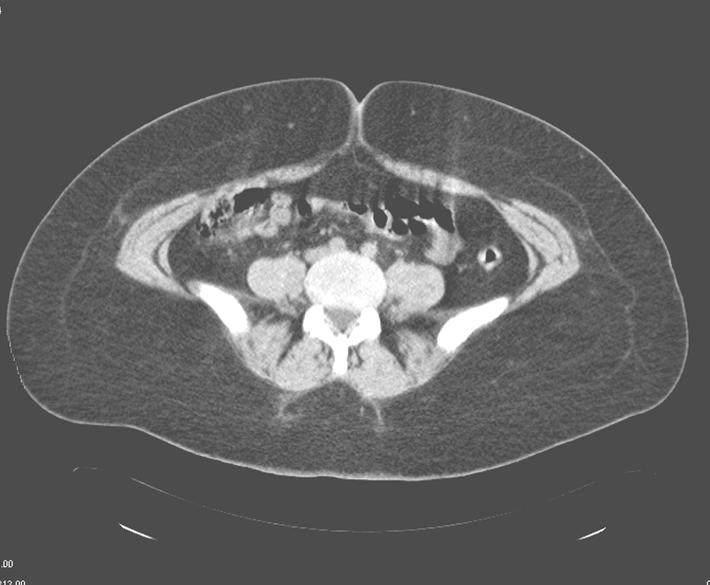
186 Patient #013 Scan 2 169

187 Patient # 024 Scan 2 170


188 Patient #028 Scan 1 Scan 2 171

189 Patient # 029 Scan 1 Scan 2 172

190 Patient #033 Scan 1 Scan 2 173

191 Patient #037 Scan 1 Scan 2 174


192 Patient # 040 Scan 1 Scan 2 175


193 Patient #003 Scan 1 Scan 2 176

194 Patient #008 Scan 1 Scan 2 177


195 Patient #009 Scan 1 Scan 2 178

196 Patient # 012 Scan 1 Scan 2 179
197 Patient # 014 Scan 1 Scan 2 180

198 Patient #017 Scan 1 Scan 2 181

199 Patient # 018 Scan 1 Scan 2 182

200 Patient # 020 Scan 1 Scan 2 183

201 Patient # 023 Scan 1 Scan 2 184

202 Patient # 025 Scan 1 Scan 2 185

203 Patient # 030 Scan 1 Scan 2 186

204 Patient # 31 Scan 1 Scan 2 187
205 Patient # 036 Scan 1 Scan 2 188

206 Patient # 038 Scan 1 Scan 2 189


207 Patient # 039 Scan 1 Scan 2 190


208 Patient # 041 Scan 1 Scan 2 191
3/20/2011. Body Mass Index (kg/[m 2 ]) Age at Issue (*BMI > 30, or ~ 30 lbs overweight for 5 4 woman) Mokdad A.H.
![3/20/2011. Body Mass Index (kg/[m 2 ]) Age at Issue (*BMI > 30, or ~ 30 lbs overweight for 5 4 woman) Mokdad A.H.](/thumbs/82/84935173.jpg "3/20/2011. Body Mass Index (kg/[m 2 ]) Age at Issue (*BMI > 30, or ~ 30 lbs overweight for 5 4 woman) Mokdad A.H.") U.S. Adults: 1988 Nineteen states with 10-14% 14% Prevalence of Obesity (*BMI > 30, or ~ 30 lbs overweight for 5 4 woman) Metabolic John P. Cello, MD Professor of Medicine and Surgery, University of California,
U.S. Adults: 1988 Nineteen states with 10-14% 14% Prevalence of Obesity (*BMI > 30, or ~ 30 lbs overweight for 5 4 woman) Metabolic John P. Cello, MD Professor of Medicine and Surgery, University of California,
Metabolic Syndrome in Asians
 Metabolic Syndrome in Asians Alka Kanaya, MD Asst. Professor of Medicine, UCSF Asian CV Symposium, November 17, 2007 The Metabolic Syndrome Also known as: Syndrome X Insulin Resistance Syndrome The Deadly
Adipose Tissue as an Endocrine Organ. Abdel Moniem Ibrahim, MD Professor of Physiology Cairo University
 Adipose Tissue as an Endocrine Organ Abdel Moniem Ibrahim, MD Professor of Physiology Cairo University Functions of Adipose Tissue Adipose tissue expresses and secretes a variety of bioactive peptides,
Understanding Body Composition
 Understanding Body Composition Chapter 7 Body Composition n Body composition is the ratio between fat and fat-free mass n Fat-free mass includes all tissues exclusive of fat (muscle, bone, organs, fluids)
Roadmap. Diabetes and the Metabolic Syndrome in the Asian Population. Asian. subgroups 8.9. in U.S. (% of total
 Diabetes and the Metabolic Syndrome in the Asian Population Alka Kanaya, MD Associate Professor of Medicine, UCSF Feb 26, 2010 Roadmap 1. Diabetes in Asian Americans Prevalence in the U.S. Risk factors
Obesity, Metabolic Syndrome, and Diabetes: Making the Connections
 Obesity, Metabolic Syndrome, and Diabetes: Making the Connections Alka M. Kanaya, M.D. Associate Professor of Medicine & Epi/Biostats University of California, San Francisco February 26, 21 Roadmap 1.
WEIGHT GAIN DURING MENOPAUSE EMERGING RESEARCH
 MENOPAUSE WHEN DOES IT OCCUR? The cessation of the menstrual cycle for one year. WEIGHT GAIN DURING MENOPAUSE EMERGING RESEARCH Jan Schroeder, Ph.D. Chair of The Department of Kinesiology California State
HSN301 REVISION NOTES TOPIC 1 METABOLIC SYNDROME
 HSN301 REVISION NOTES TOPIC 1 METABOLIC SYNDROME What does the term Metabolic Syndrome describe? Metabolic syndrome describes a cluster of cardio-metabolic conditions that increase one's risk of developing
Metabolic Syndrome. DOPE amines COGS 163
 Metabolic Syndrome DOPE amines COGS 163 Overview - M etabolic Syndrome - General definition and criteria - Importance of diagnosis - Glucose Homeostasis - Type 2 Diabetes Mellitus - Insulin Resistance
Plasma fibrinogen level, BMI and lipid profile in type 2 diabetes mellitus with hypertension
 World Journal of Pharmaceutical Sciences ISSN (Print): 2321-3310; ISSN (Online): 2321-3086 Published by Atom and Cell Publishers All Rights Reserved Available online at: http://www.wjpsonline.org/ Original
The Metabolic Syndrome Update The Metabolic Syndrome: Overview. Global Cardiometabolic Risk
 Update 2013 Marc Cornier, M.D. Associate Professor of Medicine Division of Endocrinology, Metabolism & Diabetes Anschutz Health and Wellness Center University of Colorado School of Medicine Denver Health
Metabolic Syndrome: An overview. Kevin Niswender MD, PhD Vanderbilt University School of Medicine
 Metabolic Syndrome: An overview. Kevin Niswender MD, PhD Vanderbilt University School of Medicine Setting the scene GB, 43 yo AA man followed for hypothyroidism returns on LT4 125 mcg/d and has a TSH=1.1
Objectives. Objectives. Alejandro J. de la Torre, MD Cook Children s Hospital May 30, 2015
 Alejandro J. de la Torre, MD Cook Children s Hospital May 30, 2015 Presentation downloaded from http://ce.unthsc.edu Objectives Understand that the obesity epidemic is also affecting children and adolescents
Chapter 18. Diet and Health
 Chapter 18 Diet and Health Risk Factors and Chronic Diseases Interrelationships among Chronic Diseases Chronic Disease Heart Disease and Stroke Hypertension Cancer Diabetes The Formation of Plaques in
Obesity in aging: Hormonal contribution
 Obesity in aging: Hormonal contribution Hormonal issues in obesity and aging Hormonal role in regulation of energy balance Genetic component in hormonal regulation Life style contribution to hormonal changes
Term-End Examination December, 2009 MCC-006 : CARDIOVASCULAR EPIDEMIOLOGY
 MCC-006 POST GRADUATE DIPLOMA IN CLINICAL CARDIOLOGY (PGDCC) 00269 Term-End Examination December, 2009 MCC-006 : CARDIOVASCULAR EPIDEMIOLOGY Time : 2 hours Maximum Marks : 60 Note : There will be multiple
The Metabolic Syndrome Update The Metabolic Syndrome Update. Global Cardiometabolic Risk
 The Metabolic Syndrome Update 2018 Marc Cornier, M.D. Professor of Medicine Division of Endocrinology, Metabolism & Diabetes Anschutz Health and Wellness Center University of Colorado School of Medicine
KEY COMPONENTS. Metabolic Risk Cardiovascular Risk Vascular Inflammation Markers
 CardioMetabolic Risk Poor blood sugar regulation and unhealthy triglyceride and lipoprotein levels often present long before the diagnosis of type 2 Diabetes. SpectraCell s CardioMetabolic and Pre-Diabetes
Changes and clinical significance of serum vaspin levels in patients with type 2 diabetes
 Changes and clinical significance of serum vaspin levels in patients with type 2 diabetes L. Yang*, S.J. Chen*, G.Y. Yuan, D. Wang and J.J. Chen Department of Endocrinology, Affiliated Hospital of Jiangsu
NUTRITION & MALIGNANCY: An Overview
 NUTRITION & MALIGNANCY: An Overview UNIVERSITY OF PNG SCHOOL OF MEDICINE AND HEALTH SCIENCES DISCIPLINE OF BIOCHEMISTRY & MOLECULAR BIOLOGY PBL MBBS II SEMINAR VJ Temple 1 Malignancy and Weight loss (Cachexia)
ΦΛΕΓΜΟΝΗ ΚΑΙ ΔΙΑΒΗΤΗΣ
 ΦΛΕΓΜΟΝΗ ΚΑΙ ΔΙΑΒΗΤΗΣ ΘΩΜΑΣ ΠΑΠΑΔΟΠΟΥΛΟΣ, MD, PHD ΕΠΕΜΒΑΤΙΚΟΣ ΚΑΡΔΙΟΛΟΓΟΣ ΙΑΤΡΙΚΟ ΔΙΑΒΑΛΚΑΝΙΚΟ ΚΕΝΤΡΟ Inflammation as a cause of disease has entered the popular imagination. Diet ( macronutrients )
902 Biomed Environ Sci, 2014; 27(11):
:") 902 Biomed Environ Sci, 2014; 27(11): 902-906 Letter to the Editor Curcuminoids Target Decreasing Serum Adipocyte-fatty Acid Binding Protein Levels in Their Glucose-lowering Effect in Patients with Type
902 Biomed Environ Sci, 2014; 27(11): 902-906 Letter to the Editor Curcuminoids Target Decreasing Serum Adipocyte-fatty Acid Binding Protein Levels in Their Glucose-lowering Effect in Patients with Type
2/11/2017. Weighing the Heavy Cardiovascular Burden of Obesity and the Obesity Paradox. Disclosures. Carl J. Lavie, MD, FACC, FACP, FCCP
 Weighing the Heavy Cardiovascular Burden of Obesity and the Obesity Paradox Carl J. Lavie, MD, FACC, FACP, FCCP Professor of Medicine Medical Director, Cardiac Rehabilitation and Preventive Cardiology
Metabolic Syndrome. Bill Roberts, M.D., Ph.D. Professor of Pathology University of Utah
 Metabolic Syndrome Bill Roberts, M.D., Ph.D. Professor of Pathology University of Utah Objectives Be able to outline the pathophysiology of the metabolic syndrome Be able to list diagnostic criteria for
Metabolic Syndrome Update The Metabolic Syndrome: Overview. Global Cardiometabolic Risk
 Metabolic Syndrome Update 21 Marc Cornier, M.D. Associate Professor of Medicine Division of Endocrinology, Metabolism & Diabetes University of Colorado Denver Denver Health Medical Center The Metabolic
INSULIN RESISTANCE, POLYCYSTIC OVARIAN SYNDROME An Overview
 INSULIN RESISTANCE, POLYCYSTIC OVARIAN SYNDROME An Overview University of PNG School of Medicine & Health Sciences Division of Basic Medical Sciences PBL MBBS III VJ Temple 1 Insulin Resistance: What is
MALIGNANT CACHEXIA (CACHEXIA ANOREXIA SYNDROME): Overview
: Overview") MALIGNANT CACHEXIA (CACHEXIA ANOREXIA SYNDROME): Overview UNIVERSITY OF PNG SCHOOL OF MEDICINE AND HEALTH SCIENCES DISCIPLINE OF BIOCHEMISTRY & MOLECULAR BIOLOGY PBL MBBS II SEMINAR VJ Temple 1 Cachexia:
MALIGNANT CACHEXIA (CACHEXIA ANOREXIA SYNDROME): Overview UNIVERSITY OF PNG SCHOOL OF MEDICINE AND HEALTH SCIENCES DISCIPLINE OF BIOCHEMISTRY & MOLECULAR BIOLOGY PBL MBBS II SEMINAR VJ Temple 1 Cachexia:
Energy balance. Factors affecting energy input. Energy input vs. Energy output Balance Negative: weight loss Positive: weight gain
 1 Energy balance Energy input vs. Energy output Balance Negative: weight loss Positive: weight gain Special implications Infancy, Illness, Pregnancy & Lactation, Sports Factors affecting energy input neuro-endocrine
SYNOPSIS OF RESEARCH REPORT (PROTOCOL BC20779)
") TITLE OF THE STUDY / REPORT No. / DATE OF REPORT INVESTIGATORS / CENTERS AND COUNTRIES Clinical Study Report Protocol BC20779: Multicenter, double-blind, randomized, placebo-controlled, dose ranging phase
TITLE OF THE STUDY / REPORT No. / DATE OF REPORT INVESTIGATORS / CENTERS AND COUNTRIES Clinical Study Report Protocol BC20779: Multicenter, double-blind, randomized, placebo-controlled, dose ranging phase
OBESITY IN PRIMARY CARE
 OBESITY IN PRIMARY CARE Obesity- definition Is a chronic disease In ICD 10 E66 Overweight and obesity are defined as abnormal or excessive fat accumulation that may impair health. Obesity is a leading
In The Name Of God. In The Name Of. EMRI Modeling Group
 In The Name Of God In The Name Of God EMRI Modeling Group Cells work together in functionally related groups called tissues Types of tissues: Epithelial lining and covering Connective support Muscle movement
Metabolic Syndrome.
 www.bmiweightloss.com.au What is the metabolic syndrome? The was first described in 1988 by Gerald Reavson It was originally described as the clustering of four conditions These conditions when present
Know Your Number Aggregate Report Single Analysis Compared to National Averages
 Know Your Number Aggregate Report Single Analysis Compared to National s Client: Study Population: 2242 Population: 3,000 Date Range: 04/20/07-08/08/07 Version of Report: V6.2 Page 2 Study Population Demographics
Subject Index. postprandial glycemia and suppression in serum 51 recommendations 119, 120 supplementation pros and cons 118, 119
 Acarbose, diabetes prevention trials 32, 33, 40 42 Accelerator hypothesis accelerators beta cell autoimmunity 140, 141, 147, 150, 151 insulin resistance 140, 142 144, 150 obesity 145 148 diabetes risk
Established Risk Factors for Coronary Heart Disease (CHD)
") Getting Patients to Make Small Lifestyle Changes That Result in SIGNIFICANT Improvements in Health - Prevention of Diabetes and Obesity for Better Health Maureen E. Mays, MD, MS, FACC Director ~ Portland
Getting Patients to Make Small Lifestyle Changes That Result in SIGNIFICANT Improvements in Health - Prevention of Diabetes and Obesity for Better Health Maureen E. Mays, MD, MS, FACC Director ~ Portland
The Metabolic Syndrome: Is It A Valid Concept? YES
 The Metabolic Syndrome: Is It A Valid Concept? YES Congress on Diabetes and Cardiometabolic Health Boston, MA April 23, 2013 Edward S Horton, MD Joslin Diabetes Center Harvard Medical School Boston, MA
Rick Fox M.A Health and Wellness Specialist
 Metabolic Diseases Rick Fox M.A Health and Wellness Specialist Metabolic Diseases Metabolism is the process your body uses to get or make energy from the food you eat. Food is made up of proteins, carbohydrates
SUMMARY. Introduction. Study design. Summary
 SUMMARY Introduction The global prevalence of type 2 diabetes is increasing rapidly and nowadays affects almost 250 million people. Cardiovascular disease is the most prevalent complication of type 2 diabetes,
Changes in Cardiotrophin-1 and Fibroblast Growth Factor-21 with Weight Loss. Robert Lawrence Bowers
 Changes in Cardiotrophin-1 and Fibroblast Growth Factor-21 with Weight Loss by Robert Lawrence Bowers A dissertation submitted to the Graduate Faculty of Auburn University in partial fulfillment of the
Hypertension with Comorbidities Treatment of Metabolic Risk Factors in Children and Adolescents
 Hypertension with Comorbidities Treatment of Metabolic Risk Factors in Children and Adolescents Stella Stabouli Ass. Professor Pediatrics 1 st Department of Pediatrics Hippocratio Hospital Evaluation of
Energy balance. Factors affecting energy input. Energy input vs. Energy output Balance Negative: weight loss Positive: weight gain
 1 Energy balance Energy input vs. Energy output Balance Negative: weight loss Positive: weight gain Special implications Infancy, Illness, Pregnancy & Lactation, Sports Factors affecting energy input neuro-endocrine
Cardiovascular Disease Risk Factors:
 Cardiovascular Disease Risk Factors: Risk factors are traits or habits that increase a person's chances of having cardiovascular disease. Some risk factors can be changed. These risk factors are high blood
THE INFLUENCE OF EXERCISE DOSE, EXERCISE INTENSITY, AND WEIGHT LOSS AND CHANGE IN C-REACTIVE PROTEIN IN SEDENTARY OVERWEIGHT WOMEN. Patricia K.
 THE INFLUENCE OF EXERCISE DOSE, EXERCISE INTENSITY, AND WEIGHT LOSS AND CHANGE IN C-REACTIVE PROTEIN IN SEDENTARY OVERWEIGHT WOMEN by Patricia K. Tuite BSN University of Pittsburgh, 1985 MSN University
Understanding & Interpreting Body Composition Measures
 BODY COMPOSITION Understanding & Interpreting Body Composition Measures Body composition = component of health-related fitness & = component of metabolic fitness Unlike other health-related fitness Not
1Why lipids cannot be transported in blood alone? 2How we transport Fatty acids and steroid hormones?
 1Why lipids cannot be transported in blood alone? 2How we transport Fatty acids and steroid hormones? 3How are dietary lipids transported? 4How lipids synthesized in the liver are transported? 5 Lipoprotien
9/26/2018. Andy Weiler, M.Ed. September 26 th, 2018
 Andy Weiler, M.Ed. September 26 th, 2018 1 2 Stay tuned for the answer to our riddle Riddle #2 3 Riddle #2 Riddle #2 4 Riddle #2 The answer: 50%/50% chance to be right Fluids: blood volume, body water,
IL METABOLISMO EPATICO DEI CARBOIDRATI IN FISIOLOGIA E PATOLOGIA
 UNIGASTRO Il fegato come centrale metabolica e i fattori di danno oltre ai virus epatitici IL METABOLISMO EPATICO DEI CARBOIDRATI IN FISIOLOGIA E PATOLOGIA Dr Elisabetta Bugianesi Divisione di Gastro-Epatologia
Cardiovascular Complications of Diabetes
 VBWG Cardiovascular Complications of Diabetes Nicola Abate, M.D., F.N.L.A. Professor and Chief Division of Endocrinology and Metabolism The University of Texas Medical Branch Galveston, Texas Coronary
CARDIOVASCULAR RISK FACTORS IN AMERICAN INDIAN AND AFRICAN AMERICAN WOMEN OF CHILD BEARING AGE AND THE RELATIONSHIP OF THESE FACTORS TO BLOOD
 CARDIOVASCULAR RISK FACTORS IN AMERICAN INDIAN AND AFRICAN AMERICAN WOMEN OF CHILD BEARING AGE AND THE RELATIONSHIP OF THESE FACTORS TO BLOOD LEPTIN CONCENTRATION, INSULIN RESISTANCE AND WAIST CIRCUMFERENCE
Part 1 Risk Factors and Atherosclerosis. LO1. Define the Different Forms of CVD
 Week 3: Cardiovascular Disease Learning Outcomes: 1. Define the difference forms of CVD 2. Describe the various risk factors of CVD 3. Describe atherosclerosis and its stages 4. Describe the role of oxidation,
Obesity D R. A I S H A H A L I E K H Z A I M Y
 Obesity D R. A I S H A H A L I E K H Z A I M Y Objectives Definition Pathogenesis of obesity Factors predisposing to obesity Complications of obesity Assessment and screening of obesity Management of obesity
Empower Preventive Medicine. Timothy J. McCormick, DO, MPH 4221 Baymeadows Suite 6 Jacksonville, FL
 Empower Preventive Medicine Timothy J. McCormick, DO, MPH 4221 Baymeadows Suite 6 Jacksonville, FL 32217 904-367-4005 Drtim@emprevmed.com Obesity Medicine Old paradigm: Obesity was a matter of willpower,
Annals of RSCB Vol. XVI, Issue 1
 THE STUDY OF PROTHROBOTIC STATE IN PATIENTS WITH TYPE 2 DIABETES MELLITUS AND CARDIOVASCULAR DISEASES Oana Bădulescu 1, Codruţa Bădescu 2, Manuela Ciocoiu 1, Magda Bădescu 1 1 DEPARTMENT OF PATHOPHYSIOLOGY;
The promise of the thiazolidinediones in the management of type 2 diabetes-associated cardiovascular disease
 The promise of the thiazolidinediones in the management of type 2 diabetes-associated cardiovascular disease Steve Smith, Group Director Scientific Affairs, Diabetes & Metabolism GlaxoSmithKline R & D
Diabesity. Metabolic dysfunction that ranges from mild blood glucose imbalance to full fledged Type 2 DM Signs
 Diabesity Metabolic dysfunction that ranges from mild blood glucose imbalance to full fledged Type 2 DM Signs Abdominal obesity Low HDL, high LDL, and high triglycerides HTN High blood glucose (F>100l,
Know Your Number Aggregate Report Comparison Analysis Between Baseline & Follow-up
 Know Your Number Aggregate Report Comparison Analysis Between Baseline & Follow-up... Study Population: 340... Total Population: 500... Time Window of Baseline: 09/01/13 to 12/20/13... Time Window of Follow-up:
Arteriosclerosis & Atherosclerosis
 Arteriosclerosis & Atherosclerosis Arteriosclerosis = hardening of arteries = arterial wall thickening + loss of elasticity 3 types: -Arteriolosclerosis -Monckeberg medial sclerosis -Atherosclerosis Arteriosclerosis,
METABOLIC SYNDROME IN REPRODUCTIVE FEMALES
 METABOLIC SYNDROME IN REPRODUCTIVE FEMALES John J. Orris, D.O., M.B.A Division Head, Reproductive Endocrinology & Infertility, Main Line Health System Associate Professor, Drexel University College of
Chapter 12. Ingestive Behavior
 Chapter 12 Ingestive Behavior Drinking a. fluid compartments b. osmometric thirst c. volumetric thirst Eating a. energy sources b. starting a meal c. stopping a meal d. eating disordersd Drinking a. fluid
THE CLINICAL BIOCHEMISTRY OF LIPID DISORDERS
 THE CLINICAL BIOCHEMISTRY OF LIPID DISORDERS Hormonal regulation INSULIN lipid synthesis, lipolysis CORTISOL lipolysis GLUCAGON lipolysis GROWTH HORMONE lipolysis CATECHOLAMINES lipolysis LEPTIN catabolism
OVERWEIGHT AND OBESITY. Dharma Lindarto Div. Endokrin-Metabolik Departemen Penyakit Dalam FK USU/RSUP H Adam Malik Medan.
 OVERWEIGHT AND OBESITY Dharma Lindarto Div. Endokrin-Metabolik Departemen Penyakit Dalam FK USU/RSUP H Adam Malik Medan. Defining obesity Obesity - an excessive accumulation of body fat sufficient to impair
Chapter 2 The Metabolic Syndrome
 Chapter 2 The Metabolic Syndrome Matthew J. Sorrentino Keywords Waist circumference Abdominal obesity Impaired fasting glucose HDL-cholesterol Triglycerides Metabolic syndrome is the designation given
Diabetic Dyslipidemia
 Diabetic Dyslipidemia Dr R V S N Sarma, M.D., (Internal Medicine), M.Sc., (Canada), Consultant Physician Cardiovascular disease (CVD) is a significant cause of illness, disability, and death among individuals
Eugene Barrett M.D., Ph.D. University of Virginia 6/18/2007. Diagnosis and what is it Glucose Tolerance Categories FPG
 Diabetes Mellitus: Update 7 What is the unifying basis of this vascular disease? Eugene J. Barrett, MD, PhD Professor of Internal Medicine and Pediatrics Director, Diabetes Center and GCRC Health System
AMPK. Tomáš Kučera.
 AMPK (AMP- ACTIVATED PROTEIN KINASE ) Tomáš Kučera tomas.kucera@lfmotol.cuni.cz Department of Medical Chemistry and Clinical Biochemistry 2nd Faculty of Medicine, Charles University in Prague and Motol
Dual-energy X-ray absorptiometry (DXA), body composition assessment 62
, body composition assessment 62") Subject Index 3 -Adrenergic receptor, gene polymorphisms and obesity 10 Aging, body composition effects 64, 65 Air-displacement plethysmography, body composition assessment 62 Bioelectrical impedance analysis
Subject Index 3 -Adrenergic receptor, gene polymorphisms and obesity 10 Aging, body composition effects 64, 65 Air-displacement plethysmography, body composition assessment 62 Bioelectrical impedance analysis
JOSHUA K. KAYIMA INTERLINKING CARDIOVASCULAR DISEASE, CHRONIC KIDNEY DISEASE, AND OBESITY
 INTERLINKING CARDIOVASCULAR DISEASE, CHRONIC KIDNEY DISEASE, AND OBESITY JOSHUA K. KAYIMA ASSOCIATE PROFESSOR DEPT. OF CLINICAL MEDICINE AND THERAPEUTICS UNIVERSITY OF NAIROBI Introduction According to
Obesity in the pathogenesis of chronic disease
 Portoroz October 16th 2013 Obesity in the pathogenesis of chronic disease Rocco Barazzoni University of Trieste Department of Medical, Surgical and Health Sciences Obesity Trends* Among U.S. Adults BRFSS,
ARE YOU OBESE?! Aaser Abdelazim
 ARE YOU OBESE?! by Aaser Abdelazim Assistant professor of Medical Biochemistry Zagazig University, Egypt University of Bisha, KSA aaserabdelazim@yahoo.com MAN BODY SHAPES 1. Narrow hips and clavicles 2.
Diabetes Day for Primary Care Clinicians Advances in Diabetes Care
 Diabetes Day for Primary Care Clinicians Advances in Diabetes Care Elliot Sternthal, MD, FACP, FACE Chair New England AACE Diabetes Day Planning Committee Welcome and Introduction This presentation will:
Screening Results. Juniata College. Juniata College. Screening Results. October 11, October 12, 2016
 Juniata College Screening Results Juniata College Screening Results October 11, 2016 & October 12, 2016 JUNIATA COLLEGE The J.C. Blair Hospital CARES team screened 55 Juniata College employees on October
METABOLIC SYNDROME AND HCV: FROM HCV
 METABOLIC SYNDROME AND HCV: FROM THEORY TO PRACTICE HCV Steatosis Insulin resistance Arun J Sanyal M.D. Chairman, Div. of Gastroenterology, Hepatology and Nutrition Virginia Commonwealth University Richmond,
Total risk management of Cardiovascular diseases Nobuhiro Yamada
 Nobuhiro Yamada The worldwide burden of cardiovascular diseases (WHO) To prevent cardiovascular diseases Beyond LDL Multiple risk factors With common molecular basis The Current Burden of CVD CVD is responsible
Ischemic Heart and Cerebrovascular Disease. Harold E. Lebovitz, MD, FACE Kathmandu November 2010
 Ischemic Heart and Cerebrovascular Disease Harold E. Lebovitz, MD, FACE Kathmandu November 2010 Relationships Between Diabetes and Ischemic Heart Disease Risk of Cardiovascular Disease in Different Categories
Effects of whole grain intake on weight changes, diabetes, and cardiovascular Disease
 Effects of whole grain intake on weight changes, diabetes, and cardiovascular Disease Simin Liu, MD, ScD Professor of Epidemiology and Medicine Director, Center for Global Cardiometabolic Health Brown
Common Diabetes-related Terms
 Common Diabetes-related Terms A1C An A1C test measures a person's average blood glucose level over two to three months. Hemoglobin is the part of a red blood cell that carries oxygen to the cells and sometimes
Pathophysiology of Lipid Disorders
 Pathophysiology of Lipid Disorders Henry Ginsberg, M.D. Division of Preventive Medicine and Nutrition CHD in the United States CHD is the single largest killer of men and women 12 million have history
Metabolic Syndrome: What s in a name?
 Commentary Metabolic Syndrome: What s in a name? Deborah P. Wubben, MD, MPH; Alexandra K. Adams, MD, PhD Abstract The term metabolic syndrome has recently become en vogue. But is the definition realistic,
Statistical Fact Sheet Populations
 Statistical Fact Sheet Populations At-a-Glance Summary Tables Men and Cardiovascular Diseases Mexican- American Males Diseases and Risk Factors Total Population Total Males White Males Black Males Total
ADVANCED CARDIOMETABOLIC SCREENING
 ADVANCED CARDIOMETABOLIC SCREENING INTRODUCTION SignatureMD and its affiliated physicians continuously seek out technology to identify health risk factors before they become serious diseases. SignatureMD
SURVIVAL AND INFLAMMATION IN PATIENTS WITH HEART FAILURE: THE IMPACT OF OVERWEIGHT, OBESITY, DIABETES AND FRUIT AND VEGETABLE CONSUMPTION
 University of Kentucky UKnowledge University of Kentucky Doctoral Dissertations Graduate School 2010 SURVIVAL AND INFLAMMATION IN PATIENTS WITH HEART FAILURE: THE IMPACT OF OVERWEIGHT, OBESITY, DIABETES
Diabetes and Heart Disease. Sarah Alexander, MD, FACC Assistant Professor of Medicine Rush University Medical Center
 Diabetes and Heart Disease Sarah Alexander, MD, FACC Assistant Professor of Medicine Rush University Medical Center No conflicts of interest or financial relationships to disclose. 2 What s the problem??
Obesity and the Metabolic Syndrome in Developing Countries: Focus on South Asians
 Obesity and the Metabolic Syndrome in Developing Countries: Focus on South Asians Anoop Misra Developing countries, particularly South Asian countries, are witnessing a rapid increase in type 2 diabetes
Metabolic syndrome. Metabolic syndrome and prediabetes appear to be the same disorder, just diagnosed by a different set of biomarkers.
 Metabolic syndrome Metabolic syndrome is a disorder of energy utilization and storage, diagnosed by a co-occurrence of three out of five of the following medical conditions: abdominal (central) obesity,
AMPK. Tomáš Kuc era. Ústav lékar ské chemie a klinické biochemie 2. lékar ská fakulta, Univerzita Karlova v Praze
 AMPK (AMP- ACTIVATED PROTEIN KINASE ) Tomáš Kuc era Ústav lékar ské chemie a klinické biochemie 2. lékar ská fakulta, Univerzita Karlova v Praze 2013 AMPK AMP-ACTIVATED PROTEIN KINASE present in all eukaryotic
Diabetes and Concomitant Cardiovascular Disease: Guideline Recommendations and Future Directions
 Diabetes and Concomitant Cardiovascular Disease: Guideline Recommendations and Future Directions Diabetes is one of the largest global health emergencies of 21 st century, with the number of people with
HSN301 Diet and Disease Entire Note Summary
 Topic 1: Metabolic Syndrome Learning Objectives: 1. Define obesity 2. Factors causing obesity 3. Obesity as a risk factor for metabolic syndrome 4. The pathogenesis of metabolic syndrome 5. Treatment of
Implications of The LookAHEAD Trial: Is Weight Loss Beneficial for Patients with Diabetes?
 Implications of The LookAHEAD Trial: Is Weight Loss Beneficial for Patients with Diabetes? Boston, MA November 7, 213 Edward S. Horton, MD Professor of Medicine Harvard Medical School Senior Investigator
Inflammasome-mediated caspase-1 activity Gatekeeper of inflammation in the adipose tissue. Rinke Stienstra
 Inflammasome-mediated caspase-1 activity Gatekeeper of inflammation in the adipose tissue Rinke Stienstra Obesity promotes the development of insulin resistance and type 2 diabetes County-level Estimates
Welcome and Introduction
 Welcome and Introduction This presentation will: Define obesity, prediabetes, and diabetes Discuss the diagnoses and management of obesity, prediabetes, and diabetes Explain the early risk factors for
What Is Body Composition?
 Chapter Six What Is Body Composition? Body composition is the body s relative amounts of fat mass and fat-free mass Body fat includes two categories: Essential fat is crucial for normal body functioning
AN EVALUATION OF CARDIOVASCULAR RISK IN EARLY BEREAVEMENT
 AN EVALUATION OF CARDIOVASCULAR RISK IN EARLY BEREAVEMENT THOMAS BUCKLEY, RN, BSc (Honours), MN A thesis submitted in accordance with the total requirements for admission to the degree of Doctor of Philosophy
Health benefits of mango supplementation as it relates to weight loss, body composition, and inflammation: a pilot study
 Title of Study: Health benefits of mango supplementation as it relates to weight loss, body composition, and inflammation: a pilot study Principal Investigator: Dr. Edralin A. Lucas Nutritional Sciences
Effects of growth hormone secretagogue receptor agonist and antagonist in nonobese type 2 diabetic MKR mice
 Effects of growth hormone secretagogue receptor agonist and antagonist in nonobese type 2 diabetic MKR mice Rasha Mosa (MBCHC, M.D, PhD candidate) School of Biomedical Sciences University of Queensland
Risk Factors for Heart Disease
 Risk Factors for Heart Disease Risk Factors we cannot change (Age, Gender, Family History) Risk Factors we can change (modifiable) Smoking Blood pressure Cholesterol Diabetes Inactivity Overweight Stress
FAT. It s Not All That! A Closer Look at the Two Main Types of Fat in Our Bodies: Visceral and Subcutaneous Fat
 Mary-Kate Perrone Capstone Seminar July 14, 2007 Draft #2 Fat Stats FAT. It s Not All That! A Closer Look at the Two Main Types of Fat in Our Bodies: Visceral and Subcutaneous Fat According to the 2003-2004
Pathogenesis of Diabetes Mellitus
 Pathogenesis of Diabetes Mellitus Young-Bum Kim, Ph.D. Associate Professor of Medicine Harvard Medical School Definition of Diabetes Mellitus a group of metabolic diseases characterized by hyperglycemia
Conflict of interest regarding this presentation:
 2 Conflict of interest regarding this presentation: I wish to declare a potential conflict of interest, and that I have received either direct or indirect industry support in relation to all or part of
Diabetes and Heart Disease
 Diabetes and Heart Disease Sarah Alexander, MD Assistant Professor of Medicine Division of Cardiology Rush University Medical Center 2/8/2017 Rush is a not-for-profit health care, education and research
Lipids Carbohydrate Protein. Fatty Acids Glycerol. Mono/di-saccarides. Aminoacids. Fat Liver Muscle. Triglycerides Glycogen Protein
 Lipids Carbohydrate Protein Fatty Acids Glycerol Mono/di-saccarides Fat Liver Muscle Aminoacids Triglycerides Glycogen Protein Microvascular Macrovascular Diabetes-specific Diabetes-enhanced HbA1c 5.7(6.0)