ANALYSIS OF RETINAL FUNDUS IMAGES FOR GLAUCOMA SCREENING. A Dissertation submitted in fulfillment of the requirements for the Degree Of
|
|
|
- Diana Alexander
- 5 years ago
- Views:
Transcription
1 ANALYSIS OF RETINAL FUNDUS IMAGES FOR GLAUCOMA SCREENING A Dissertation submitted in fulfillment of the requirements for the Degree Of MASTER OF ENGINEERING In Electronic Instrumentation & Control Engineering Submitted by Jiwanpreet Kaur Virk Under the Guidance of Mooninder Singh Assistant Professor, EIED 2015 Electrical and Instrumentation Engineering Department Thapar University, Patiala (Declared as Deemed-to-be-University u/s 3 of the UGC Act., 1956) Post Bag No. 32, Patiala Punjab (India)
2


3
4 TABLE OF CONTENTS Contents Page No. DECLARATION... i ACKNOWLEDGEMENT... ii LIST OF TABLES... v LIST OF FIGURES... vi LIST OF ABBREVATIONS...viii ABSTRACT...ix CHAPTER 1 INTRODUCTION Overview of Glaucoma Types of Glaucoma Causes of Glaucoma Diagnosis of Glaucoma Outline of Dissertation 6 CHAPTER 2 LITERATURE REVIEW 8-15 CHAPTER 3 PROBLEM DEFINITION 16 CHAPTER 4 PROPOSED SOLUTION 17 CHAPTER 5 PROPOSED METHODOLOGY Basic Methodology Image Pre-processing Extraction of Optic Disc and Optic Cup Extraction of Optic Disc 19 iii
5 5.3.2 Extraction of Optic Cup Cup-to-Disc Ratio Calculation 23 CHAPTER 6 RESULTS Results of Pre-Processing Results of Extraction of Optic Disc Results of Extraction of Optic Cup Results of Cup-to-Disc Ratio Calculations Evaluating Predictive Parameters Student s T-test Compensated Cup-to-Disk Ratio (CDR) for Minimized Mean Square Error (MSE) 44 CHAPTER 7 CONCLUSIONS AND FUTURE SCOPE Conclusions Future Scope 48 REFERENCES LIST OF PUBLICATIONS 54 PLAGIARISM REPORT iv
6 LIST OF TABLES Table No. Caption Page no. 6.1 Comparison of Measured and True CDR Value (Sample 1-25) Comparison of Measured and True CDR Values (Sample 26-50) Predictive Parameter Values Test Outcomes Mean and Standard Deviation Values of CDR with P-Values Comparison of Compensated CDR values with α = Comparison of Compensated CDR values with α = v
7 LIST OF FIGURES Figure No. Caption Page no. 1.1 Effect of Pressure on Optic Nerve Aqueous Fluid Pathway Normal Fundus (a) Healthy Optic Disc (b) Unhealthy Optic Disc ISNT Rule Optic Nerve damage due to elevated pressure Basic block diagram of Proposed Methodology (a) Original Fundus Image (b) Red Plane (c) Green Plane Flow diagram for extraction of Optic Disc (a) Original Image (b) Erosion (c) Dilation (d) Opening (e) Closing Flow diagram for extraction of Optic Cup (a) Original Fundus Image (b) Red Plane (c) Green Plane Pre-Processed Image (Red plane) Binary Optic disc after thresholding Morphologically Operated Disc Pre-Processed Image (Green plane) Binary Optic Cup after thresholding Morphologically Operated Disc 28 vi
8 6.8 (a) First column represents Original color retinal Fundus images; (b) Second and Third column represents the results of Pre-processing (Red plane and green plane images); (c) Fourth column represents the extracted Optic Disc; (d) Fifth column represents the extracted Optic Cup 6.9 (a) Comparison of Measured and True CDR Value (Sample 1-10) (b) Comparison of Measured and True CDR Value (Sample 11-20) (c) Comparison of Measured and True CDR Value (Sample 21-30) (d) Comparison of Measured and True CDR Value (Sample 31-40) (e) Comparison of Measured and True CDR Value (Sample 41-50) Confusion Matrix Confusion Matrix with Proposed Algorithm Instances 41 vii
9 LIST OF ABBREVIATIONS ACM- Active Contour Model ANFIS- Adaptive Neuro Fuzzy Inference System ANN- Artificial Neural Network ASM- Active Shape Model CDR- Cup-To-Disc Ratio DRIVE- Digital Retinal Images for Vessel Extraction FCM- Fuzzy C-Mean Clustering FDR - False Discovery Rate Fig- Figure FN- False Negative FNR - False Negative Rate FP- False Positive FPR - False Positive rate IOP- Intra-Ocular Pressure ISNT- Inferior Superior Nasal Temporal LDA- Linear Discriminant Analysis NPV - Negative Predictive Value NRRA - Neuro-Retinal Rim Area OC- Optic Cup OD- Optic Disc OHN- Optic Head Normalization ONH- Optic Nerve Head PCA- Principal Component Analysis PPV - Positive Predictive Value RGB- Red Green Blue RNF- Retinal Nerve Fiber SE- Structuring Element STARE- Structured Analysis of Retina TN- True Negative TP- True Positive viii
10 ABSTRACT The processing of a Fundus image using different computer aided techniques are used for the extraction of its distinct features for the diagnosis and screening of the deformities related to human body. The eye's fundus is the only part of the human body where the microcirculation is be observed directly. Several medical signs that can be detected from funduscopy include hemorrhages, blood vessel abnormalities; exudates and pigmentation. The Optic Disc (OD), Optic Cup (OC), Neuro-Retinal Rim Area (NRRA), ISNT (Inferior-Superior-Nasal-Temporal) Quadrants are the main contrasting features of a Fundus image. There are some diseases which do not show any symptoms at early stages but if not detected earlier they may lead to severe consequences. One such disease is Glaucoma. If not detected, diagnosed and cured at prior stages it may lead to complete vision loss. The shape, size and orientation of the Fundus image features are altered in a pathological condition that can be observed during early stages. These changes can be detected and identified by using the image processing techniques and hence preventive measures can be taken to avoid any further damage. The methodology has been applied on a database acquired from a local physician. In this dissertation work, the size and shape of the Optic Disc and Cup are used as the major features for calculating the Cup-to-Disc Ratio which classifies the image samples as normal or suspicious for Glaucoma. The methodology proposed extracts out the Optic Disc and Cup from a color retinal Fundus image. The value of Cup-to-Disc Ratio is calculated by estimating the diameters of the extracted Disc and Cup. This ratio then screens the images for Glaucoma. The ratios obtained are compared with the gold standard values and the algorithm showed a detection rate of 80% and classification accuracy of 95%, sensitivity and specificity of 100% and 91% respectively. ix
11 CHAPTER 1 INTRODUCTION 1.1 Overview Glaucoma is a term referring to a group of eye disorders that leads to optic nerve damage which, in most cases, is associated with an elevated fluid pressure in the eye i.e. Intra-Ocular Pressure (IOP). Most of these diseases give rise to elevated pressure within the eye. The Intra-Ocular Pressure (IOP) is measured in millimeters of Hg and ranges from mm Hg in normal subjects by a tonometer [1, 2]. An elevated eye pressure is one of the major risk factors for glaucoma and can be used for its screening. In Glaucoma, higher eye pressure damages the delicate nerve fibers and blood vessels and finally the optic nerve as shown in Figure 1.1. In front of the eye there is a small space called the anterior chamber and a clear fluid flows through it and nourishes the nearby tissues and the trabecular meshwork. This very fluid is the aqueous humor which is basically a transparent fluid consisting of low protein concentrations. It is discharged by the ciliary bodies (in the posterior chamber a space between the iris and the lens). The fluid after being secreted then flows through the pupil into the anterior chamber between the iris and the cornea and goes in episcleral vein as shown in Figure 1.2. From here it drains through a sponge like structure located at the base of the iris called the trabecular meshwork and finally exits from the eye. In a healthy eye, the rate of secretion is equivalent to the rate of drainage. But in people with Glaucoma this drainage channel is blocked since it does not flow out it starts accumulating in the chamber and this increase the pressure in the chamber as well as within the eye. The pressure then pushes the lens back and presses on the vitreous humor or the body which in turn compresses and damages the blood vessels and the nerve fibers running at the back of the eye and finally the optic nerve, which transmits visual information from the retina to the brain. These injured blood vessels leads to the patches of vision loss and if left untreated may lead to total blindness [2]. Elevated eye pressure signifies that the subject is at risk, but does not mean that she has glaucoma. A person is glaucomatous only if the optic nerve is harmed. If someone has an elevated IOP but unharmed optic nerve, she is not considered glaucomatous but is at risk. 1
![Figure 1.1: Effect of pressure on Optic Nerve [3] Also not everyone with increased IOP will have glaucoma.](/docs-images/81/84261141/images/12-0.jpg "A certain level of eye pressure may be high for one but normal for another. Glaucoma can also develop without an elevated IOP.")
![This is another form of glaucoma called normal-tension glaucoma. Figure 1.2: Aqueous Fluid Pathway [4] 1.](/docs-images/81/84261141/images/12-1.jpg "2 Types of Glaucoma There are different types of glaucoma namely: Open Angle/ Chronic Glaucoma: It is caused by the partial blockage of the")

12 Figure 1.1: Effect of pressure on Optic Nerve [3] Also not everyone with increased IOP will have glaucoma. A certain level of eye pressure may be high for one but normal for another. Glaucoma can also develop without an elevated IOP. This is another form of glaucoma called normal-tension glaucoma. Figure 1.2: Aqueous Fluid Pathway [4] 1.2 Types of Glaucoma There are different types of glaucoma namely: Open Angle/ Chronic Glaucoma: It is caused by the partial blockage of the drainage canal. The angle between cornea and iris is open meaning the entrance to the drain is clear, but the aqueous humor flow is somewhat slow. The pressure in the eye builds up gradually over a long period of time. Also the symptoms appear gradually starting with peripheral vision loss and may go unnoticed until the central vision is affected. The progression can be stopped with the medical 2
13 treatments but the part of vision that is already lost cannot be restored, that is why the early detection of glaucoma is very important. Acute Angle Closure Glaucoma: It is caused by sudden and complete blockage of the aqueous humor drainage. The pressure within the eye arises rapidly and may lead to total vision loss quickly. The anatomical features of eye like narrow drainage angle, shallow anterior chamber, thin and droopy iris make it easier to develop this type of glaucoma. Typically this happens when the pupil is dilated and the lens is stuck to the back of the iris. This prevents the aqueous humor form flowing through the pupil into the anterior chamber. This results in the accumulation of the fluid in the posterior chamber which further presses the iris causing it to bulge outwards and block the drainage angle completely. This is basically a medical emergency and requires immediate attention. Usually, laser surgery and medicines can clear the blockage, lower eye pressure, and protect vision [2]. Normal Tension Glaucoma: It is an eye disorder that shows all the features of traditional glaucoma except the elevated IOP. It is in many cases associated with issues of blood circulation. It has symptoms like increased optic nerve head (ONH) excavation and thinning of the retinal fiber layer, while the patient has an IOP that is regarded as normal. Ocular Hypertension: It is a term signifying the presence of IOP in the absence of optic nerve damage or even visual loss. The normal range of IOP is between mm of Hg. Secondary Glaucoma: This glaucoma results from another eye disease. Like, if the patient had an eye injury or who is on prolonged steroid therapy or who has a tumor may flourish secondary glaucoma. Congenital Glaucoma: It is an infrequent type of glaucoma that evolves in infants and young children and may be inherited. Conventional surgery is the suggested treatment as medicines are not effective and may cause serious side effects in infants [5]. 1.3 Causes of Glaucoma General causes leading to Glaucoma: Old age - People of age above 60 are more prone to develop glaucoma 3

14 Other illnesses and Conditions - People with diabetes have a higher chance of developing glaucoma Eye injuries - Eye injuries are linked to a higher glaucoma risk. Retinal detachment, eye tumors and inflammations can also lead to glaucoma Eye surgery patients who underwent eye surgery have a higher risk of glaucoma Myopia - people with myopia also have a risk of glaucoma Corticosteroids These are a class of chemical drugs that constitutes the steroid hormones. Patients on prolonged use corticosteroids have a higher risk of developing glaucoma Migraine and peripheral vasospasm have also been identified as risk factors for glaucomatous optic nerve damage [5] 1.4 Diagnosis of Glaucoma Glaucomatous diagnosis is based on the patient s family medical and genetic history, thinner corneas, elevated Intra Ocular Pressure and manual assessment of the Optic Nerve Head from the color fundus images [6]. It is basically denoted by the changes in the eye ground i.e. the region of the Optic Nerve Head (ONH) and it is evaluated by analysis of special optic images known as Fundus images acquired with the help of a special instrument called the Ophthalmoscope. This fundus image consists of a few notable features, as shown in Figure 1.3,that are evaluated to conclude and classify it as normal or suspicious (Glaucomatous). Figure 1.3: Normal Fundus [7] 4

15 Optic disc (OD) is the most vivid feature in a normal retinal fundus image and it has an elliptical shape. It appears as a bright orange-pink ellipse with a pale centre. Orange-pink appearance signifies a healthy neuro-retinal tissue. Due to the pathologies, the orange-pink color moderately disappears and appears pale. Blood vessels are emerging out from the Optic Disc (OD). The pale centre is devoid of neuro-retinal tissue and is known as the Optic Cup (OC). The vertical size of this cup can be estimated corresponding to the disc as a whole and extended as a cup-to-disc ratio (CDR). The CDR marks the proportion of the disc encompassed by the cup and is widely accepted figure for the screening of glaucoma. For a normal eye it is acceptable from 0.3 to 0.5. As the neuro-retinal degeneration precedes the ratio increases and at the value of 0.8 the vision is completely lost. Figure 1.4(a) and (b) shows a healthy Optic disc with normal CDR and unhealthy Optic Disc with abnormal CDR value respectively. The CDR value thus may be used to screen glaucomatous cases. For detecting Glaucoma we use CDR primarily for the screening purpose. The subjects with a CDR value higher than 0.5 are considered as suspicious and need further confirmatory tests. The sample with a CDR value lesser than 0.5 is surely not glaucomatous and this does not require any further investigation. For confirming Glaucoma changes in Neuro-Retinal Rim (NRR) and ISNT Quadrants are studied. Figure 1.4: (a) Healthy Optic Disc (b) Unhealthy Optic Disc [8] Neuro-Retinal Rim (NRR) Area is the region between the boundary of the disc and the physiological Cup as shown in Figure 1.4. The NRR is normally thickest in the inferior part; 5

16 followed by the superior, nasal and the temporal. This is referred to as the "ISNT" rule which is observed in the normal cases shown in Figure 1.5. Any change in this pattern is suspicious like if the inferior rim or part is thinner as compared to the superior, it could suggest pathology. The temporal rim is thinnest for normal cases. In glaucomatous cases, the ratio of the area covered by the rim in superior and inferior region reduces and becomes thin as compared to the area covered by the rim in nasal and temporal region. Figure 1.5: ISNT rule [9] The glaucomatous changes observed in the color retinal fundus may include: (i) (ii) (iii) (iv) (v) (vi) expansion of the cavity (Cup), the changes in the appearance of Optic Disc (OD) disc hemorrhage, thinning of the neuro-retinal rim area, unevenness of the cup between left and right eye, loss of retinal nerve fibers 1.5 Outline of Dissertation This dissertation consists of 7 chapters that have been briefed below to get an overview of the work done. Chapter 1 is Introduction. It basically provides an introduction to the disease Glaucoma. Different types of the disease, causes that lead to Glaucoma and its diagnosis have been discussed. It explains different features of the Fundus image. All the features that are altered by the presence of the disease have been discussed. 6
17 Chapter 2 is Literature survey. This chapter highlights the various researches that have been carried out in the field of retinal imaging for the extraction of various features of a Fundus image using image processing. It also compares the different methods followed by the researchers. Chapter 3 is the Problem Definition. It outlines the aim of the dissertation. Chapter 4 is the Proposed Solution. This chapter frames the work carried out. It also briefs the steps taken up to evaluate the performance of the algorithm proposed. Chapter 5 is the Proposed Methodology. It explains the various steps involved in the methodology. The image samples that have been processed upon using the proposed methodology are acquired from a local physician. The images have been applied with image processing techniques. The algorithm has been applied on a total of 50 image samples. Chapter 6 is Results. This chapter highlights the results of the image processing techniques that have been applied on the sample images. It holds the values of diameters of the Optic Disc and Cup and also their Cup-to-Disc Ratios. It mentions the results of Student s t-test applied. The results of the confusion matrix plotted have also been shown. Chapter 7 is Conclusion and Future scope. The conclusion of this research has been mentioned in this chapter. It also highlights the improvements and the future work that can be done. 7
18 CHAPTER 2 LITERATURE REVIEW Huiqi Li et al. (2003) presented a new approach to extract the main features from a color fundus image. Optic disc was first localized by the principal component analysis (PCA) and then its shape was segmented by an active shape model (ASM) [10]. PCA was proposed to localize the optic disc. The procedure was performed on the intensity image. The steps in the localization were: The candidate regions were determined and PCA is employed. A sub-image around the disc was cropped to obtain a training image. An active shape model (ASM) was proposed to detect the disc boundary. James Lowell et al. (2004) localized and segmented the Optic Nerve Head (ONH) from the low resolution retinal fundus images by using template matching for the disc localization followed by a deformable contour model [11]. Kevin Noronha et al. (2006) proposed methods to detect main features of the retinal fundus image including Optic Disc, blood vessels, and exudates [12]. Hough Transform has been used in order to find the centre of the disc and then finally its boundary. Blood vessels have been highlighted, detected and removed by using the bottom hat transformation and the morphological techniques. The method by Atef Z. Ghalwash (2007) et al. included normalizing luminosity and the contrast throughout the image by using illumination equalization along with adaptive histogram equalization methods [13]. The disc detection algorithm was dependent on matching the expected directional order of the retinal blood vessels. A simple matched filter was presented to roughly match or map the direction of the vessels in the Optic Disc (OD) territory. The retinal vessels were firstly segmented using a standard Gaussian matched filter. Ultimately, a vessel direction map of the segmented retinal vessels was obtained using the same segmentation algorithm. 8
19 J. Liu et al. (2008) to extract the optic disc from a retinal fundus image used a variational-levelset method [14]. In case of the optic cup, two methods of color intensity with threshold level set were applied. The results signified potential applicability of these methods for automated screening for early recognition of glaucoma. Variational level-set proceeded to extract the optic disc. The extracted contours were smoothened by using direct ellipse fitting to remove the noise in the extracted boundary. The CDR was then calculated by using the extracted cup and disc dimensions. S. Sekhar (2008) et al. described a novel method to localize the optic disc. The proposed methodology consists of two stages: First step, an elliptical or circular region of interest was extracted by first isolating the brightest region in the image by using of morphological processing, and, Second step, the Hough transform was applied to detect the main circular attribute within the region of interest [15].The boundary of the disc and its center were extracted out by applying the Hough transform to the morphologically operated image. The total number of edge pixels and also the number of radii used were reduced by applying Hough transform only as the computational complexities of Hough transform is completely dependent on the total number of edge pixels and the number of radii to be mapped. Radim Kolář et al. (2008) described a method for glaucoma detection based on fractal dimensions followed by its classification [16]. Two methods for estimating fractal dimensions, which give a different image or tissue description, were proposed. The retinal images were used in which the areas comprising of retinal nerve fibers are examined. The proposed method showed that fractal dimensions can be employed as features for nerve fibers loss detection, which indicates a glaucomatous eye. They proposed new features for Retinal Nerve Fiber (RNF) identification applied to the texture generated by RNF layer. G.B. Kande et al. (2008) used different approaches for the segmentation and detection of optic disc [17]. The Optic Disc centre is approximated by locating a point with maximum local variance and the disc boundary is detected by using geometric active contour. 9
20 X. Zhu et al. (2008) keeping in track the properties of the disc, used different filter methods like sobel or canny edge detectors to detect the edges and the circles using the Hough Transform [18]. The Hough Transform provides us with the centre of the disc as well as its radius and hence finally approximates the boundary or the margin of the disc. The methodology was tested on the DRIVE database. G.B. Kande (2009) et al. applied stepwise preprocessing technique by converting the image into HIS (Hue Saturation Intensity) space followed by a local contrast enhancement method and a median filter which reduces the noise level of the image [19]. The optic disc boundary detection involved the use of color morphology and geometric active contour method with variational formulation. Ahmed W. Reza et al. (2009) first applied an averaging filter to the original image to blend the small objects with lower intensity variations into the background itself leaving the objects of interest unchanged followed by the contrast adjustment of the extracted green channel image to make the brighter object features distinguishable from the background. The proposed algorithm used green component of the image and used preprocessing steps followed by image processing techniques such as morphological operations, maxima operator, minima imposition, and the watershed transformation [20]. The methodology was evaluated using the images of STARE and DRIVE databases by using fixed and variable thresholds. Jagadish Nayak et al. (2009) presented a novel method for glaucoma detection using digital fundus images [21]. The RGB components of the images were analyzed and RED and GREEN image components were extracted out for disc and cup respectively. First morphological operations were applied on both the red and green components of the image. Second, the standard deviation as well as the threshold values for separating out the disc and the cup from the red and green images was evaluated. Third, Using the evaluated threshold values the red and green images were converted to binary images to obtain the disc and cup. S. Ravishankar et al. (2009) presented a different methodology for the localization of different features from a fundus retinal image [22]. The OD is detected by first detecting and then 10
21 removing the blood vessels so that the boundary of the disc becomes clear. Different morphological operators have been applied for the feature detection as well. Jörg Meier et al. (2010) used illumination correction, vessel removal and Optic Head Normalization (OHN) as a part of pre processing of the fundus image [23]. The illumination correction method subtracts the retinal background from the original image to get a uniformly illuminated fundus image. The estimation of the background was done by average intensity filtering. The vessel structures situated in the eye ground were removed by using segmentation and in-painting of the detected vessel branch. Also OHN template-matching, the convergence of the vessel tree or intensity assumptions were applied for OHN normalization. Rudiger Bock et al. (2010) segmented blood vessels to obtain a vessel-free image. Also images were scaled to a uniform size of pixels [24]. Different types of features (pixel intensity values, textures and parameters of a histogram model) were examined. Pixel intensity values were taken as a high dimensional feature and used principal component analysis (PCA) and linear discriminant analysis (LDA). Also the other structural changes resulted by glaucoma a set of Gabor filter banks were applied on preprocessed images. Histograms were also applied to summarize the data in the image. The change in the CDR values shows intensity shifts in the histograms models. Chisako Muramatsu et al. (2010) compared three different methods of active contour model (ACM), artificial neural network (ANN), and fuzzy c-mean (FCM) clustering for the detection and extraction of the optic disc [25]. The results of each of them were evaluated using different databases from different camera systems. Disc detection by ACM: The determination of the optic disc regions was based on the active contour modeling. In this, the expected disc boundaries were searched in spiral directions from the center of the region of interest. Disc detection by pixel classification method: Two kinds of pixel classification techniques were investigated: FCM and ANN. In FCM, the cluster center and the membership degree was updated in every iteration. The algorithm was trained to classify the pixels into 2 to 4 clusters, and a resulting cluster that 11
22 comprised of the center pixel of the ROI regarded as the disc cluster. After applying the morphological opening, an isolated area in the center of the ROI was referred to as the disc region. The ANN was trained with the input data and the clinical data determined by ophthalmologist. The count of the hidden units was varied corresponding to the number of units at the input. The count of output units was set corresponding to the probability of a pixel whether belonging to the disc and background or to the disc. Depending on the number of outputs, some number of pixels per group were randomly drawn or selected from each case and enrolled for training. If the output corresponding to the disc probability has the highest value, these pixels were then classified as a part of the disc region. After opening it morphologically, the isolated region in the center of the ROI was referred to as the final disc area. Arturo Aquino et al. (2010) presented a template-based method which used morphological and edge detection techniques followed by Circular Hough Transform to detect disc boundary approximation [26]. It required a pixel located within the optic disc as the initial information. Firstly, a disc containing image was extracted from the fundus image from which an OD pixel and its neighboring area was selected. For this purpose, an Optic Disc (OD) location method was used. The Optic Disc (OD) boundary was extracted out in parallel from both the channels, red and green, of this sub-image by use of morphological and edge detection methods. Both the boundaries were estimated by using Circular Hough Transform. D.W.K. Wong et al. (2010) presented a supervised learning scheme way out for the extraction of the optic disc [27]. This method used the pixel and local neighborhood features for the segmentation. The Support Vector Machine is the classification method used to classify the subjects. Ahmed E. Mahfouz et al. (2010) proposed a faster method of segmentation of the disc [28]. It works on the projections of the image that encodes the x and the y coordinates of the disc. The resulting projections then estimate the disc boundary. 12
23 P.C. Siddalingaswamy et al. (2010) presented an automated computer aided algorithm for the detection of several features of a retinal fundus image including the optic disc, fovea, blood vessels and exudates [29]. Once the disc is detected, the diameter of the disc and its centre are used to detect the location of other features. Madhusudan Mishra et al. (2011) used active contour method to find the CDR from the fundus images to deduce the pathological procession of glaucoma [30]. Firstly, the images were given illumination correction, after the pre-processing the blood vessels were removed from the image as they were hardly affected by the glaucoma and hence does not play any part in detecting it. And then finally the Cup and the Disc were detected by using multi thresholding and the active contour method. The cup was assigned with a higher threshold value in comparison to the disc. The method was based on the prominence of a curve around the object which is to be detected. Then the cup to disc ratio was calculated by mathematically taking the ratio of the dimensions of the cup to the disc. A.W. Reza et al. (2011) used a methodology for the extraction of the Optic disc along with cotton wool spots and exudates [31]. These features were extracted using marker-controlled watershed segmentation. As the pre-processing steps, average filtering and contrast adjustment has also been used. Fengshou Yin et al. (2011) presented a method dependent on the edge detection, statistical deformable technique and the Circular Hough transform for the segmentation of the disc from the color retinal fundus image [32]. Jun Cheng et al. (2011) segmented the optic disc by using papillary atrophy elimination. These eliminations are done using elliptical Hough Transform and edge filtering [33]. A Dehgani et al. (2011) proposed a novel method for the segmentation the optic disc [34]. To detect the optic disc boundary, after the removal of the blood vessels, the centre of the disc is estimated which makes the segmentation of the disc even easier. 13
24 M. Esmaeili et al. (2012) presented a new disc detection method build on the DCUT and level set method [35]. Firstly the bright lesions are extracted using the DCUT and the variations in the curve-let coefficients. The detected bright lesions distinguish the optic disc and the other features in the retinal fundus image. S. Kavitha et al. (2012) proposed a computer aided system for automated detection of glaucoma from fundus images [36]. Detection of Glaucoma involved the measurement of the size and the shape of the Optic cup as well as Neuroretinal rim. The cup and disc areas differ in color, known as pallor. The technique was based on this pallor using K means clustering proposed to differentiate between the cup- to- disc boundary. Along with the shape based features, textural features were also extracted. The set of features selected by the Genetic algorithm were fed as input to the Adaptive Neuro Fuzzy Inference System (ANFIS) for classification. H. Yu et al. (2012) used template matching to locate the Optic disc candidates [37]. Template matching is performed to basically adapt the different image resolutions. Further the blood vessel pattern is used to determine the disc location. Different morphological operations have been used to remove the blood vessels and other bright speckles or regions other than the disc. M.H.S.P. Kumara et al. (2013) removed the optic disc from the fundus image by using the active contour model [38]. The methodology prevailed by first estimating the disc boundary using Circular Hough Transform, edge detection and morphology and then finally applying the active contour model resulting in the disc boundary. Fauzia Khan et al. (2013) proposed image processing techniques for the early detection and diagnosis of glaucoma [39]. The Optic Disc and Cup were detected by first extracting the V plane from HSV image and then converted to gray scale image. The mean value of the gray scale image was calculated and set as threshold for binary image. For the cup, green plane was taken up and converted to gray scale image. Threshold value for the cup varies as there are gradual changes in the cup color due to which boundary of cup is not clear. 14
25 Preeti et al. (2013) discussed various image processing methods that has been used in the early diagnosis and evaluation of various eye diseases including Glaucoma [40]. These included Enhancement, Classification, Fusion, Segmentation, Registration, Pattern matching, Morphology, Statistical measurements, Feature extraction and Analysis. Jun Cheng et al. (2013) employed the super pixel classification methodology to segment out the optic disc and cup from the fundus image [41]. To segment the disc, histogram and centre statistics are used to classify the pixels. Further to extract the cup out, along with the centre stats and histograms the local information about the cup is also added. Ana Salazar Gonzalez et al. (2014) presented a novel method to segment the blood vessels and the Optic Disc proposed a simple method for the blood vessel segmentation and optic disc extraction [42]. The method involves Markov Random field image restoration by removing the blood vessels from the disc region followed by a compensation factor method to extract out the disc. 15

26 CHAPTER 3 PROBLEM DEFINITION Glaucoma is the most leading factor of blindness today. Usually it develops slowly and do not have early stage symptoms and leads to complete vision loss at the later stages. It arises due to the unbalancing or rather the elevation of the eye pressure. The pressure damages the Optic Nerve, shown in Figure 3.1. This eye pressure, called the Inter-Ocular Pressure (IOP), is maintained by the clear fluid in the eye i.e. aqueous humor. An equal amount of this fluid flows in and out of the eye for normal cases. But in abnormal cases, this fluid flow is not proper. Due to this pressure is built [43]. The vision once lost cannot be restored back which makes its early detection even more cognizant. The disease alters various features of the Fundus image of the eye. A Fundus image of an eye is an optical image which photographs the interior surface of the eye including the retina and has Optic Disc and Optic Cup as its contrasting features. The size and orientation of this Disc and Cup is altered by Glaucoma. Figure 3.1: Optic Nerve Damage due to elevated pressure [44] The aim of this dissertation is to evaluate these features, Optic Disc and Optic Cup, of the Fundus images to screen them whether they are suspicious for Glaucoma or not. 16
27 CHAPTER 4 PROPOSED SOLUTION In this dissertation, to screen a Fundus image a total of 50 image samples have been acquired from a local physician. These images are then worked upon to extract the Optic Disc and Optic Cup, and further their diameters using computer aided techniques. The algorithm for the extraction of Optic Disc and Cup is developed in MATLAB version (R2013a) using the Image Processing Toolbar. The diameters so obtained are then mathematically divided to obtain a ratio, the Cup-to-Disc Ratio, Cup-to-Disk Ratio = (Cup diameter) / (Disk diameter) This ratio is then used for classifying the image samples into normal or suspicious for Glaucoma cases. The classification is done on threshold basis. If the ratio ranges from 0.3 to 0.5, it is considered as normal. But in case this ratio exceeds 0.5, the image sample is considered at risk for Glaucoma. A Confusion matrix has been plotted to visualize the proposed algorithm s performance. After obtaining the CDR a t-test has been conducted on two groups, namely Normal and suspicious for Glaucomatous. The t-test has been applied to determine whether these two groups are significantly different from each other or not. 17
28 CHAPTER 5 PROPOSED METHODOLOGY 5.1 Basic Methodology For the screening of Glaucoma, the most important feature that is considered is the Cup-to-disc Ratio (CDR). It signals whether the subject is suspicious or not. For the calculation and evaluation of the CDR value, firstly the Optic disc and the Cup are required. The normal CDR values range from 0.3 to 0.5 and values greater than 0.5 are considered suspicious. The basic block diagram of the proposed methodology is shown in Figure 5.1. The methodology proceeds by the conversion of the true color RGB image into Red and Green planes which are then converted to binary images. These images are then operated on with Morphological operations to detect the Optic disk and the Cup. Pre-Processing (RGB to Red and Green plane conversion) Image Thresholding (Converting the Red or Green plane to Binary image) Morphological Operation (Dilation followed by Erosion) Extraction of Disc and Cup Diameter Cup to Disc Ratio (CDR) Classification as normal or suspected Figure 5.1: Basic Block diagram of the proposed methodology 18

29 5.2 Image Preprocessing The Fundus image is acquired firstly using an Ophthalmoscope or a Fundus camera which is in the RGB format. This RGB image is then analyzed for its contrast levels and after the analysis of a number of retinal images it was concluded that the optic disc has a better contrast in the Red plane and the optic Cup has a better contrast in the Green plane. Image preprocessing involves the extraction of the Red plane (in case of the optic disc) and the Green plane (in case of optic cup) from the original color retinal fundus image for the extraction of the Disc and the Cup as shown in Figure 5.2. (a) (b) (c) Figure 5.2: (a) Original Fundus Image, (b) Red Plane, (c) Green Plane 5.3 Extraction of Optic Disc and Optic Cup The evaluation of CDR involves the extraction of the Disc and the Cup, to detect the same the Red and Green plane extracted out are then converted into the binary image by thresholding with a specific level or value of threshold for Disc as well as the Cup Extraction of Optic Disk The methodology followed for the extraction of the Disk is given in the Figure 5.3. The image obtained in the pre-processing step is operated upon according to the steps depicted in the flow diagram. The Optic disc is extracted out using thresholding and morphologically operating the pre processed image. 19
30 Step 1: Pre-processed Image The original RGB image is pre processed by converting it into its Red plane as the optic disc has the best contrast in the Red plane. This pre processed image is then applied with further processing steps. Step 2: Image Thresholding The Red plane image obtained is then binarized by thresholding it using a fixed level of threshold. The RGB image is first converted into a grayscale image and then converted to the required binary image. The threshold level is kept same for all the images. Thresholding is an important tool that eliminates the parts of an image that are not required. This binary conversion of the Red plane image brings out the details of the image that are hidden and cannot be recognized in the color image. Figure 5.3 shows the output images obtained after applying different steps of the methodology. Pre-Processed Image (RGB to Red plane converted Image) Image Thresholding (Converting the Red plane to Binary image) Morphological Operation (Dilation followed by Erosion) Extraction of Disc Diameter Figure 5.3: Flow diagram for extraction of Optic Disc Step 3: Morphological Operations In the extraction of the Optic Disc, the Red plane is first converted to the binary image as mentioned earlier. The binary image so obtained has gaps and uneven boundaries in it. As a remedy for these 20

31 gaps and unsymmetrical boundaries, morphological operations are applied to this binary image. The binary image so obtained is applied with the CLOSE operation by using the structuring element DISK. This operation basically involves dilation followed by erosion. Dilation is one of the core morphological operations that usually use a structuring element for scrutinizing and expanding the shapes in the input image, where a structuring element (SE) is an element or a mask used to probe a given image to check as in on how this shape fits or misses the similar shapes in the image. The mathematical formula for dilation is given in eqn 5.1 and 5.2. ˆ A B {z (B) z A Φ} (eqn 5.1) where A is the input image and B being the structuring element DISK. Erosion on the other hand erodes away the boundaries of foreground region i.e. removes structures of certain shape and leads to shrinking of the objects. Erosion can be mathematically expressed as: A B {z (B) z A} (eqn 5.2) A is again the input image and B the structuring element DISK. The basic concept of these morphological operations can be understood by the Figure 5.4. (a) (b) (c) (d) (e) Figure 5.4: (a) Original Image, (b) Erosion, (c) Dilation, (d) Opening, (e) Closing The CLOSE operation, as mentioned earlier, is dilation followed by erosion. Due to dilation the diameter of the required cup increases first, but as it is followed by erosion it compensates for the increased dimension (as the structuring element used is same and of same dimension as well). This closing operation fills in all the gaps in the binary image that are held in the Optic Disc and also 21
32 smoothes the contour of the extracted disc. Also sometimes the binary image obtained, along with the Disc, contains unwanted areas. To remove these small unwanted parts Area Opening is done which provides us with a final image that only contains the Optic Disc and no unwanted areas. Since the optic disk detected is in the form of an ellipse, so the major axis of this ellipse denotes the diameter of the Disc (taken vertically). Step 4: Disc Diameter The disc diameter is calculated from the morphologically operated image as the major axis of the ellipse so obtained. The diameter is extracted as the major axis because the measurements are taken vertically according to the gold standards Extraction of Optic Cup The extraction of the cup involves the same methodology of plane conversion of the original retinal fundus image and then thresholding and finally the cup diameter. Step 1: Pre-processed Image The original RGB image is pre processed by converting it into its Green plane as the optic Cup, unlike Disc, has best contrast in the Green plane. Step 2: Image Thresholding The Green plane image obtained is then converted into its binary form by thresholding it using a fixed level of threshold (a threshold value different from the one used for the Disc). This RGB to binary conversion involves the conversion into a grayscale image and then to the required binary image. The threshold level is fixed for all the samples. The threshold value used in case of the Cup is kept lower than the one used for the Disc. Step 3: Morphological Operations This binary image so obtained again contains the optic cup but with irregular gaps. These gaps are then filled by using the morphological operation CLOSING using the DISK structuring element, the same way as in case of Disc detection, but with a different radius from the one used for Disc 22
33 detection. The morphology used in case of the Cup is similar to the one used in case of the Disc. The flow diagram for Cup diameter extraction can be understood by Figure 5.5. Pre-Processed Image (RGB to Green plane converted Image) Image Thresholding (Converting the Green plane to Binary image) Morphological Operation (Dilation followed by Erosion) Extraction of Cup Diameter Figure 5.5: Flow diagram for extraction of Optic Cup Step 4: Cup Diameter The Cup diameter is also calculated from the morphologically operated image as the major axis of the ellipse so obtained. The diameter is extracted as the major axis because the measurements are taken vertically according to the gold standards. 5.4 Cup-To-Disc Ratio Calculation The Cup-to-Disc ratio is denoted as the ratio of the diameter of the cup to that of the disc. It is calculated by mathematically dividing the value of Cup diameter by the Disk diameter (taken vertically), Cup-to-Disk Ratio = (Cup diameter) / (Disk diameter) 23
34 The values obtained are the CDR values which are further used for the classification of the images or subjects as normal or suspicious for Glaucoma. The images with CDR values ranging from 0.3 to 0.5 are classified as the normal ones and those with values greater than 0.5 are screened for Glaucoma or are considered at risk for Glaucoma. 24
35 CHAPTER 6 RESULTS AND DISCUSSIONS 6.1 Results Of Pre-Processing This section explains the results of the algorithm used. The pre-processing as explained earlier involves the conversion of the color retinal fundus image into their required Red and Green planes from Optic Disc and Optic Cup shown in Figure 6.1. (a) (b) (c) Figure 6.1: (a) Original Fundus Image, (b) Red Plane, (c) Green Plane 25
36 The algorithm has been applied to a database acquired from a local physician. After the analysis of a number of samples, the red and the green plane were best suitable for extracting disc and the cup respectively from the contrast point of view. The database consisted of 50 images, with 21 Glaucomatous and 29 normal images. The red and green planes show the best versions of Optic Disc and the Optic Cup. The binary conversions of these RGB planes bring out the required regions much easily and efficiently. 6.2 Results Of Extraction Of Optic Disc The results of the methodology followed for extracting the Optic Disc are explained in this section. The Optic Disc is the most contrasting feature of a retinal fundus image. The methodology applied is compared with other proposed methods and it is observed that it is the simplest method to extract out the Optic Disc. The methodology involves the basic morphological processes unlike other complex methods that have been followed so far and provides with efficient results. Step 1: Pre-processed Image: As mentioned earlier, for the extraction of Optic Disc the red plane is first extracted out shown below in Figure 6.2. Figure 6.2: Pre-Processed Image (Red plane) Step 2: The results of the image thresholding, i.e. red plane to binary conversion as shown in Figure 6.3. Figure 6.3: Binary Optic disc after thresholding 26

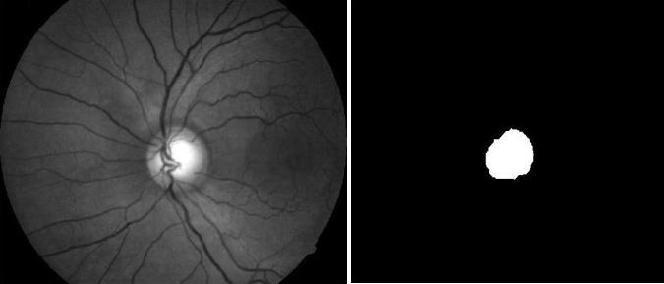
37 Step 3: The binary image so obtained after thresholding comes with irregular gaps and uneven boundaries. These gaps as explained earlier are eliminated by operating the image with morphological operations Dilation and Erosion using a specific Structuring element. These two operations when performed in this order, i.e. dilation followed by erosion, is also known as Closing operation. The resultant image after performing theses operations is shown in Figure 6.4. Figure 6.4: Morphologically Operated Disc 6.3 Results Of Extraction Of Optic Cup The steps for the extraction of Optic Cup from the fundus image are explained in this section. The changes in the area and size of the Optic Cup in a fundus image signify the sample image s condition whether normal or suspicious. Step 1: Pre-processed Image: For the extraction of Optic Cup the green plane extracted out is shown in Figure 6.5 below. This pre processed image is further operated with using thresholding and morphology. Figure 6.5: Pre-Processed Image (Green plane) 27
38 Step 2: The image thresholding, i.e. green plane to binary conversion is shown in the Figure 6.6. Figure 6.6: Binary Optic Cup after thresholding Step 3: Just as the binary operated disc came with some irregularities the optic cup also came with a few gaps and incomplete boundaries. To detect the complete shape of the cup the binary operated disc has to be operated with morphological operations to cover for these incomplete boundaries and irregular shape. The final cup detected after morphology has been shown in the Figure 6.7. Figure 6.7: Morphologically Operated Disc 28


39


40


41


42


43


44
 First column represents Original color retinal Fundus images (b) Second and Third column represents the results")


45 re 6.8: (a) First column represents Original color retinal Fundus images (b) Second and Third column represents the results of Pre-processing (Red plane and green plane images) (c) Fourth column represents the extracted Optic Disc (d) Fifth column represents the extracted Optic Cup 6.4 Results Of Cup-To-Disc Ratio Calculations The methodology is applied on a total of 50 images. The results of the methodology are compared with the gold standard values provided by the physician values. Table and Figure 6.9 (a)-(e) shows the comparison of the measured and the true CDR values of the Cup as well as the disc. The values of the Disc and cup diameter are measured using a fixed threshold. 35
46 Table 6.1: Comparison of Measured and True CDR Value (Sample 1-25) Disk Cup CDR(Measured) CDR(True) Sample Measured True Measured True = Cup(measured)/ = Cup(true)/ Measured True no. Disk(measured) Disk(true) Normal Normal Glaucomatous Glaucomatous Normal Normal Glaucomatous Glaucomatous Glaucomatous Glaucomatous Normal Normal Normal Normal Glaucomatous Glaucomatous Glaucomatous Glaucomatous Normal Normal Normal Normal Glaucomatous Glaucomatous Glaucomatous Normal Normal Glaucomatous Normal Normal Normal Glaucomatous Glaucomatous Normal Normal Normal Normal Normal Normal Normal Normal Normal Normal 36
47 Table 6.2: Comparison of Measured and True CDR Value (Sample 26-50) Disk Cup CDR(Measured) CDR(True) Sample Measured True Measured True = Cup(measured)/ = Cup(true)/ Inference Inference no. Disk(measured) Disk(true) (Measured) (True) Glaucomatous Normal Normal Normal Normal Normal Glaucomatous Glaucomatous Normal Normal Normal Normal Normal Normal Normal Normal Normal Glaucomatous Glaucomatous Glaucomatous Glaucomatous Glaucomatous Glaucomatous Glaucomatous Normal Glaucomatous Glaucomatous Normal Glaucomatous Glaucomatous Glaucomatous Glaucomatous Glaucomatous Glaucomatous Glaucomatous Glaucomatous Glaucomatous Glaucomatous Glaucomatous Normal Normal Normal Normal Normal Normal Normal Normal 37
: Comparison of Measured and True CDR Value (Sample 1-10) Comparison of Measured and True CDR Values 0.8 0.7 0.6 0.5 0.4 0.3 0.2 0.")
48 CDR Value CDR Value Comparison of Measured and True CDR Values Sample Number CDR (Measured) CDR (True) Figure 6.9 (a): Comparison of Measured and True CDR Value (Sample 1-10) Comparison of Measured and True CDR Values Sample Number CDR (Measured) CDR (True) Figure 6.9 (b): Comparison of Measured and True CDR Value (Sample 11-20) 38
49 CDR Value CDR Value Comparison of Measured and True CDR Values Sample Number CDR (Measured) CDR (True) Figure 6.9 (c): Comparison of Measured and True CDR Value (Sample 21-30) Comparison of Measured and True CDR Values Sample Number CDR (Measured) CDR (True) Figure 6.9 (d): Comparison of Measured and True CDR Value (Sample 31-40) 39
: Comparison of Measured and True CDR Value (Sample 41-50) 6.")
50 CDR Values Comparison of Measured and True CDR Values Sample Number CDR (Measured) CDR (True) Figure 6.9 (e): Comparison of Measured and True CDR Value (Sample 41-50) 6.5 Evaluating Predictive Parameters Since the results of the classification of the sample images by the techniques used depends upon the image quality and also on the user experience. To visualize the performance of the algorithm proposed, a confusion matrix is plotted [45]. This matrix consists of predicted class and actual class instances as shown in the Figure Figure 6.10: Confusion Matrix TP (true positive) here depicts the number of samples correctly classified as Glaucomatous. TN (true negative) signifies the number of samples correctly classified as normal samples. FN (false negative) 40

51 and FP (false positive) signifies the number of samples incorrectly classified as normal and Glaucomatous respectively. The confusion matrix with proposed algorithm instances is shown in Figure These instances are used to formulate predictive parameters that are going to analyze the algorithm s performance. Figure 6.11: Confusion Matrix with Proposed Algorithm Instances These predictive parameters are Sensitivity, Specificity, Accuracy, Positive Predictive Value (PPV), Negative Predictive Value (NPV), False Positive rate (FPR), False Discovery Rate (FDR), False Negative Rate (FNR) and F1 Score. Sensitivity, also known as the True Positive rate, measures the positive proportion correctly classified according to the given conditions. It can be calculated as the ratio of true positive to the sum of true positive and false negative. Sensitivity = TP/ (TP+FN) Specificity, also known as True Negative Rate, measures the negative proportion correctly classified as such. It can be formulated by taking the ration of true negative to the sum of true negative and false positive. Specificity = TN/ (TN+FP) Accuracy refers to basically the proximity of the measured results to the true values. It can be calculated as, Accuracy = (TP+TN)/ (TN+TP+FN+FP) 41
Detection of Glaucoma and Diabetic Retinopathy from Fundus Images by Bloodvessel Segmentation
 International Journal of Engineering and Advanced Technology (IJEAT) ISSN: 2249 8958, Volume-5, Issue-5, June 2016 Detection of Glaucoma and Diabetic Retinopathy from Fundus Images by Bloodvessel Segmentation
Detection of Glaucoma using Cup-to-Disc Ratio and Blood Vessels Orientation
 International Journal of Scientific Research in Computer Science, Engineering and Information Technology 2018 IJSRCSEIT Volume 3 Issue1 ISSN : 2456-3307 Detection of Glaucoma using Cup-to-Disc Ratio and
International Journal of Advance Engineering and Research Development EARLY DETECTION OF GLAUCOMA USING EMPIRICAL WAVELET TRANSFORM
 Scientific Journal of Impact Factor (SJIF): 4.72 International Journal of Advance Engineering and Research Development Volume 5, Issue 1, January -218 e-issn (O): 2348-447 p-issn (P): 2348-646 EARLY DETECTION
Automated Detection Of Glaucoma & D.R From Eye Fundus Images
 Reviewed Paper Volume 2 Issue 12 August 2015 International Journal of Informative & Futuristic Research ISSN (Online): 2347-1697 Automated Detection Of Glaucoma & D.R Paper ID IJIFR/ V2/ E12/ 016 Page
Automated Detection of Vascular Abnormalities in Diabetic Retinopathy using Morphological Entropic Thresholding with Preprocessing Median Fitter
 IJSTE - International Journal of Science Technology & Engineering Volume 1 Issue 3 September 2014 ISSN(online) : 2349-784X Automated Detection of Vascular Abnormalities in Diabetic Retinopathy using Morphological
International Journal of Advance Engineering and Research Development. Detection of Glaucoma Using Retinal Fundus Images with Gabor Filter
 Scientific Journal of Impact Factor(SJIF): 3.134 e-issn(o): 2348-4470 p-issn(p): 2348-6406 International Journal of Advance Engineering and Research Development Volume 2,Issue 6, June -2015 Detection of
7.1 Grading Diabetic Retinopathy
 Chapter 7 DIABETIC RETINOPATHYGRADING -------------------------------------------------------------------------------------------------------------------------------------- A consistent approach to the
A Survey on Localizing Optic Disk
 International Journal of Information & Computation Technology. ISSN 0974-2239 Volume 4, Number 14 (2014), pp. 1355-1359 International Research Publications House http://www. irphouse.com A Survey on Localizing
A dynamic approach for optic disc localization in retinal images
 ISSN 2395-1621 A dynamic approach for optic disc localization in retinal images #1 Rutuja Deshmukh, #2 Karuna Jadhav, #3 Nikita Patwa 1 deshmukhrs777@gmail.com #123 UG Student, Electronics and Telecommunication
AUTOMATIC DETECTION OF GLAUCOMA THROUGH CHANNEL EXTRACTION ADAPTIVE THRESHOLD METHOD
 International Journal of Civil Engineering and Technology (IJCIET) Volume 8, Issue 11, November 2017, pp. 69-77, Article ID: IJCIET_08_11_008 Available online at http://www.iaeme.com/ijciet/issues.asp?jtype=ijciet&vtype=8&itype=11
SURVEY OF DIFFERENT TECHNIQUES FOR GLAUCOMA DETECTION AND APPROACH FOR GLAUCOMA DETECTION USING RECONFIGURABLE PROCESSOR
 SURVEY OF DIFFERENT TECHNIQUES FOR GLAUCOMA DETECTION AND APPROACH FOR GLAUCOMA DETECTION USING RECONFIGURABLE PROCESSOR LATA B. HANCHINAL 1 PROF. NATARAJ A. VIJAPUR 2 Dept. of Electronics and communication
EXTRACTION OF RETINAL BLOOD VESSELS USING IMAGE PROCESSING TECHNIQUES
 EXTRACTION OF RETINAL BLOOD VESSELS USING IMAGE PROCESSING TECHNIQUES T.HARI BABU 1, Y.RATNA KUMAR 2 1 (PG Scholar, Dept. of Electronics and Communication Engineering, College of Engineering(A), Andhra
Research Article. Automated grading of diabetic retinopathy stages in fundus images using SVM classifer
 Available online www.jocpr.com Journal of Chemical and Pharmaceutical Research, 2016, 8(1):537-541 Research Article ISSN : 0975-7384 CODEN(USA) : JCPRC5 Automated grading of diabetic retinopathy stages
Segmentation of Optic Nerve Head for Glaucoma Detection using Fundus images
 Biomedical & Pharmacology Journal Vol. 7(2), 697-705 (2014) Segmentation of Optic Nerve Head for Glaucoma Detection using Fundus images GANESH BABU.T.R 1, R.SATHISHKUMAR 2 and RENGARAJVENKATESH 3 1 Electronics
A Novel Method for Automatic Optic Disc Elimination from Retinal Fundus Image Hetal K 1
 IJSRD - International Journal for Scientific Research & Development Vol. 3, Issue 01, 2015 ISSN (online): 2321-0613 A Novel Method for Automatic Optic Disc Elimination from Retinal Fundus Image Hetal K
Implementation of Automatic Retina Exudates Segmentation Algorithm for Early Detection with Low Computational Time
 www.ijecs.in International Journal Of Engineering And Computer Science ISSN: 2319-7242 Volume 5 Issue 10 Oct. 2016, Page No. 18584-18588 Implementation of Automatic Retina Exudates Segmentation Algorithm
Study And Development Of Digital Image Processing Tool For Application Of Diabetic Retinopathy
 Study And Development O Digital Image Processing Tool For Application O Diabetic Retinopathy Name: Ms. Jyoti Devidas Patil mail ID: jyot.physics@gmail.com Outline 1. Aims & Objective 2. Introduction 3.
Automatic Screening of Fundus Images for Detection of Diabetic Retinopathy
 Volume 02 No.1, Issue: 03 Page 100 International Journal of Communication and Computer Technologies Automatic Screening of Fundus Images for Detection of Diabetic Retinopathy 1 C. Sundhar, 2 D. Archana
Comparative Study on Localization of Optic Disc from RGB Fundus Images
 Comparative Study on Localization of Optic Disc from RGB Fundus Images Mohammed Shafeeq Ahmed 1, Dr. B. Indira 2 1 Department of Computer Science, Gulbarga University, Kalaburagi, 585106, India 2 Department
Detection of Abnormalities of Retina Due to Diabetic Retinopathy and Age Related Macular Degeneration Using SVM
 Science Journal of Circuits, Systems and Signal Processing 2016; 5(1): 1-7 http://www.sciencepublishinggroup.com/j/cssp doi: 10.11648/j.cssp.20160501.11 ISSN: 2326-9065 (Print); ISSN: 2326-9073 (Online)
A novel K-means based Glaucoma Detection
 A novel K-means based Glaucoma Detection J.Jaspin Jeni PG Student Department of ECE Satyam College of Engineering E-mail : jaspinjeni59@gmail.com Abstract- Glaucoma is an irreversible chronic eye disease
A Novel Approach towards Automatic Glaucoma Assessment
 281 A Novel Approach towards Automatic Glaucoma Assessment Darsana S 1, Rahul M Nair 2 1 MTech Student, 2 Assistant Professor, 1,2 Department of ECE, Nehru College of Engineering and Research Centre Thrissur,
Extraction of Blood Vessels and Recognition of Bifurcation Points in Retinal Fundus Image
 International Journal of Research Studies in Science, Engineering and Technology Volume 1, Issue 5, August 2014, PP 1-7 ISSN 2349-4751 (Print) & ISSN 2349-476X (Online) Extraction of Blood Vessels and
1 Introduction. Abstract: Accurate optic disc (OD) segmentation and fovea. Keywords: optic disc segmentation, fovea detection.
 segmentation and fovea. Keywords: optic disc segmentation, fovea detection.") Current Directions in Biomedical Engineering 2017; 3(2): 533 537 Caterina Rust*, Stephanie Häger, Nadine Traulsen and Jan Modersitzki A robust algorithm for optic disc segmentation and fovea detection
Current Directions in Biomedical Engineering 2017; 3(2): 533 537 Caterina Rust*, Stephanie Häger, Nadine Traulsen and Jan Modersitzki A robust algorithm for optic disc segmentation and fovea detection
CHAPTER - 2 LITERATURE REVIEW
 CHAPTER - 2 LITERATURE REVIEW Currently, there is an increasing interest for establishing automatic systems that screens a huge number of people for vision threatening diseases like diabetic retinopathy
Automated Assessment of Diabetic Retinal Image Quality Based on Blood Vessel Detection
 Y.-H. Wen, A. Bainbridge-Smith, A. B. Morris, Automated Assessment of Diabetic Retinal Image Quality Based on Blood Vessel Detection, Proceedings of Image and Vision Computing New Zealand 2007, pp. 132
Detection Of Red Lesion In Diabetic Retinopathy Using Adaptive Thresholding Method
 Detection Of Red Lesion In Diabetic Retinopathy Using Adaptive Thresholding Method Deepashree Devaraj, Assistant Professor, Instrumentation Department RVCE Bangalore. Nagaveena M.Tech Student, BMSP&I,
THE CHRONIC GLAUCOMAS
 THE CHRONIC GLAUCOMAS WHAT IS GLAUCOMA People with glaucoma have lost some of their field of all round vision. It is often the edge or periphery that is lost. That is why the condition can be missed until
Intelligent Diabetic Retinopathy Diagnosis in Retinal Images
 Journal of Advances in Computer Research Quarterly ISSN: 2008-6148 Sari Branch, Islamic Azad University, Sari, I.R.Iran (Vol. 4, No. 3, August 2013), Pages: 103-117 www.jacr.iausari.ac.ir Intelligent Diabetic
Detection of Hard Exudates from Diabetic Retinopathy Images using Fuzzy Logic R.H.N.G. Ranamuka and R.G.N. Meegama
 Detection of Hard Exudates from Diabetic Retinopathy Images using Fuzzy Logic R.H.N.G. Ranamuka and R.G.N. Meegama Abstract Diabetic retinopathy, that affects the blood vessels of the retina, is considered
FEATURE EXTRACTION OF RETINAL IMAGE FOR DIAGNOSIS OF ABNORMAL EYES
 FEATURE EXTRACTION OF RETINAL IMAGE FOR DIAGNOSIS OF ABNORMAL EYES S. Praveenkumar Department of Electronics and Communication Engineering, Saveetha Engineering College, Tamil Nadu, India E-mail: praveenkumarsunil@yahoo.com
Segmentation of Tumor Region from Brain Mri Images Using Fuzzy C-Means Clustering And Seeded Region Growing
 IOSR Journal of Computer Engineering (IOSR-JCE) e-issn: 2278-0661,p-ISSN: 2278-8727, Volume 18, Issue 5, Ver. I (Sept - Oct. 2016), PP 20-24 www.iosrjournals.org Segmentation of Tumor Region from Brain
CHAPTER 2 LITERATURE REVIEW
 CHAPTER 2 LITERATURE REVIEW 2.1 Introduction The retina is a light-sensitive tissue lining the inner surface of the eye. The optics of the eye create an image of the visual world on the retina, which serves
Written by Administrator Wednesday, 13 January :27 - Last Updated Thursday, 21 January :34
 angle closure glaucoma A type of glaucoma caused by a sudden and severe rise in eye pressure. Occurs when the pupil enlarges too much or too quickly, and the outer edge of the iris blocks the eye s drainage
Review on Optic Disc Localization Techniques
 Review on Optic Disc Localization Techniques G.Jasmine PG Scholar Department of computer Science and Engineering V V College of Engineering Tisaiyanvilai, India jasminenesathebam@gmail.com Dr. S. Ebenezer
J.Surendiran*et al. /International Journal of Pharmacy & Technology
 ISSN: 0975-766X CODEN: IJPTFI Available Online through Research Article www.ijptonline.com GLAUCOMA DETECTION USING FUZZY C- MEAN (FCM) J.Surendiran 1, Dr.S.V.Saravanan 2, F.Elizabeth Catherine 3 Research
THE CHRONIC GLAUCOMAS
 THE CHRONIC GLAUCOMAS WHAT IS GLAUCOMA? People with glaucoma have lost some of their field of all round vision. It is often the edge or periphery that is lost. That is why the condition can be missed until
ADAPTIVE BLOOD VESSEL SEGMENTATION AND GLAUCOMA DISEASE DETECTION BY USING SVM CLASSIFIER
 ADAPTIVE BLOOD VESSEL SEGMENTATION AND GLAUCOMA DISEASE DETECTION BY USING SVM CLASSIFIER Kanchana.M 1, Nadhiya.R 2, Priyadharshini.R 3 Department of Information Technology, Karpaga Vinayaga College of
Cancer Cells Detection using OTSU Threshold Algorithm
 Cancer Cells Detection using OTSU Threshold Algorithm Nalluri Sunny 1 Velagapudi Ramakrishna Siddhartha Engineering College Mithinti Srikanth 2 Velagapudi Ramakrishna Siddhartha Engineering College Kodali
Segmentation of Color Fundus Images of the Human Retina: Detection of the Optic Disc and the Vascular Tree Using Morphological Techniques
 Segmentation of Color Fundus Images of the Human Retina: Detection of the Optic Disc and the Vascular Tree Using Morphological Techniques Thomas Walter and Jean-Claude Klein Centre de Morphologie Mathématique,
Automatic Classification of Breast Masses for Diagnosis of Breast Cancer in Digital Mammograms using Neural Network
 IJSTE - International Journal of Science Technology & Engineering Volume 1 Issue 11 May 2015 ISSN (online): 2349-784X Automatic Classification of Breast Masses for Diagnosis of Breast Cancer in Digital
Diabetic Retinopathy Classification using SVM Classifier
 Diabetic Retinopathy Classification using SVM Classifier Vishakha Vinod Chaudhari 1, Prof. Pankaj Salunkhe 2 1 PG Student, Dept. Of Electronics and Telecommunication Engineering, Saraswati Education Society
QUANTIFICATION OF PROGRESSION OF RETINAL NERVE FIBER LAYER ATROPHY IN FUNDUS PHOTOGRAPH
 QUANTIFICATION OF PROGRESSION OF RETINAL NERVE FIBER LAYER ATROPHY IN FUNDUS PHOTOGRAPH Hyoun-Joong Kong *, Jong-Mo Seo **, Seung-Yeop Lee *, Hum Chung **, Dong Myung Kim **, Jeong Min Hwang **, Kwang
A New Approach for Detection and Classification of Diabetic Retinopathy Using PNN and SVM Classifiers
 IOSR Journal of Computer Engineering (IOSR-JCE) e-issn: 2278-0661,p-ISSN: 2278-8727, Volume 19, Issue 5, Ver. I (Sep.- Oct. 2017), PP 62-68 www.iosrjournals.org A New Approach for Detection and Classification
Automated Blood Vessel Extraction Based on High-Order Local Autocorrelation Features on Retinal Images
 Automated Blood Vessel Extraction Based on High-Order Local Autocorrelation Features on Retinal Images Yuji Hatanaka 1(&), Kazuki Samo 2, Kazunori Ogohara 1, Wataru Sunayama 1, Chisako Muramatsu 3, Susumu
EFFICIENT TECHNIQUE TO UNRAVEL BLOOD VESSEL ON DIGITAL FUNDUS IMAGES
 International Journal of Advancements in Research & Technology, Volume 2, Issue3, March-2013 1 EFFICIENT TECHNIQUE TO UNRAVEL BLOOD VESSEL ON DIGITAL FUNDUS IMAGES G.Jemilda 1, G.Priyanka 2, Gnanaraj Samuel
relative s privacy, do not identify your relative by full name in any assignment.
 Overview Do you or a family member have glaucoma? Do you wonder what this diagnosis means? Glaucoma affects tens of millions of people worldwide. Despite its prevalence, many people lack accurate information
Image Processing and Data Mining Techniques in the Detection of Diabetic Retinopathy in Fundus Images
 I J C T A, 10(8), 2017, pp. 755-762 International Science Press ISSN: 0974-5572 Image Processing and Data Mining Techniques in the Detection of Diabetic Retinopathy in Fundus Images Payal M. Bante* and
Blood Vessel Segmentation for Retinal Images Based on Am-fm Method
 Research Journal of Applied Sciences, Engineering and Technology 4(24): 5519-5524, 2012 ISSN: 2040-7467 Maxwell Scientific Organization, 2012 Submitted: March 23, 2012 Accepted: April 30, 2012 Published:
Automatic Extraction of Blood Vessel and Eye Retinopathy Detection
 Available online www.ejaet.com European Journal of Advances in Engineering and Technology, 2015, 2(4): 57-61 Research Article ISSN: 2394-658X Automatic Extraction of Blood Vessel and Eye Retinopathy Detection
EXUDATES DETECTION FROM DIGITAL FUNDUS IMAGE OF DIABETIC RETINOPATHY
 EXUDATES DETECTION FROM DIGITAL FUNDUS IMAGE OF DIABETIC RETINOPATHY Namrata 1 and Shaveta Arora 2 1 Department of EECE, ITM University, Gurgaon, Haryana, India. 2 Department of EECE, ITM University, Gurgaon,
EARLY STAGE DIAGNOSIS OF LUNG CANCER USING CT-SCAN IMAGES BASED ON CELLULAR LEARNING AUTOMATE
 EARLY STAGE DIAGNOSIS OF LUNG CANCER USING CT-SCAN IMAGES BASED ON CELLULAR LEARNING AUTOMATE SAKTHI NEELA.P.K Department of M.E (Medical electronics) Sengunthar College of engineering Namakkal, Tamilnadu,
Detection of Diabetic Retinopathy using Kirsch Edge Detection and Watershed Transformation Algorithm
 ISSN: 2454-132X (Volume1, Issue2) Detection of Diabetic Retinopathy using Kirsch Edge Detection and Watershed Transformation Algorithm Divya SN * Department of Computer Science and Engineering, Sri Sairam
Analogization of Algorithms for Effective Extraction of Blood Vessels in Retinal Images
 Analogization of Algorithms for Effective Extraction of Blood Vessels in Retinal Images P.Latha Research Scholar, Department of Computer Science, Presidency College (Autonomous), Chennai-05, India. Abstract
Analysis of the Retinal Nerve Fiber Layer Texture Related to the Thickness Measured by Optical Coherence Tomography
 Analysis of the Retinal Nerve Fiber Layer Texture Related to the Thickness Measured by Optical Coherence Tomography J. Odstrcilik, R. Kolar, R. P. Tornow, A. Budai, J. Jan, P. Mackova and M. Vodakova Abstract
AN ANFIS BASED PATTERN RECOGNITION SCHEME USING RETINAL VASCULAR TREE A COMPARISON APPROACH WITH RED-GREEN CHANNELS
 AN ANFIS BASED PATTERN RECOGNITION SCHEME USING RETINAL VASCULAR TREE A COMPARISON APPROACH WITH RED-GREEN CHANNELS 1 G. LALLI, 2 Dr. D. KALAMANI, 3 N. MANIKANDAPRABU. 1 Assistant Professor (Sl.G.-II),
MRI Image Processing Operations for Brain Tumor Detection
 MRI Image Processing Operations for Brain Tumor Detection Prof. M.M. Bulhe 1, Shubhashini Pathak 2, Karan Parekh 3, Abhishek Jha 4 1Assistant Professor, Dept. of Electronics and Telecommunications Engineering,
implications. The most prevalent causes of blindness in the industrialized world are age-related macular degeneration,
 ISSN: 0975-766X CODEN: IJPTFI Available Online through Research Article www.ijptonline.com AUTOMATIC LOCALIZATION OF OPTIC DISC AND BLOOD VESSELS USING SELFISH GENE ALGORITHM P.Anita*, F.V.Jayasudha UG
Brain Tumor segmentation and classification using Fcm and support vector machine
 Brain Tumor segmentation and classification using Fcm and support vector machine Gaurav Gupta 1, Vinay singh 2 1 PG student,m.tech Electronics and Communication,Department of Electronics, Galgotia College
Unsupervised MRI Brain Tumor Detection Techniques with Morphological Operations
 Unsupervised MRI Brain Tumor Detection Techniques with Morphological Operations Ritu Verma, Sujeet Tiwari, Naazish Rahim Abstract Tumor is a deformity in human body cells which, if not detected and treated,
Detection of Macular Edema and Glaucoma from Fundus Images
 International Journal of Current Engineering and Technology E-ISSN 2277 4106, P-ISSN 2347 5161 2015 INPRESSCO, All Rights Reserved Available at http://inpressco.com/category/ijcet Research Article Detection
DETECTION OF DIABETIC MACULOPATHY IN HUMAN RETINAL IMAGES USING MORPHOLOGICAL OPERATIONS
 Online Journal of Biological Sciences 14 (3): 175-180, 2014 ISSN: 1608-4217 2014 Vimala and Kajamohideen, This open access article is distributed under a Creative Commons Attribution (CC-BY) 3.0 license
Glaucoma. Cornea. Iris
 Glaucoma Introduction Glaucoma is a group of eye diseases that can lead to blindness if not treated. Openangle glaucoma, the most common form of glaucoma, affects about 3 million Americans. Half of those
Diabetic Retinopathy-Early Detection Using Image Processing Techniques
 Diabetic Retinopathy-Early Detection Using Image Processing Techniques V.Vijaya Kumari, Department of ECE, V.L.B. Janakiammal College of Engineering and Technology Coimbatore 641 042, India. N.SuriyaNarayanan
AUTOMATIC DIABETIC RETINOPATHY DETECTION USING GABOR FILTER WITH LOCAL ENTROPY THRESHOLDING
 AUTOMATIC DIABETIC RETINOPATHY DETECTION USING GABOR FILTER WITH LOCAL ENTROPY THRESHOLDING MAHABOOB.SHAIK, Research scholar, Dept of ECE, JJT University, Jhunjhunu, Rajasthan, India Abstract: The major
ROI DETECTION AND VESSEL SEGMENTATION IN RETINAL IMAGE
 ROI DETECTION AND VESSEL SEGMENTATION IN RETINAL IMAGE F. Sabaz a, *, U. Atila a a Karabuk University, Dept. of Computer Engineering, 78050, Karabuk, Turkey - (furkansabaz, umitatila)@karabuk.edu.tr KEY
Detection of Glaucoma Based on CDR, CAR and Blood Vessel Extraction
 402 P a g e INTERNATIONAL RESEARCH JOURNAL IN ADVANCED ENGINEERING AND TECHNOLOGY (IRJAET) www.irjaet.com ISSN (PRINT) : 2454-4744 ISSN (ONLINE): 2454-4752 Vol. 1, Issue 4, pp.402-411, December, 2015 Detection
CHAPTER 8 EVALUATION OF FUNDUS IMAGE ANALYSIS SYSTEM
 CHAPTER 8 EVALUATION OF FUNDUS IMAGE ANALYSIS SYSTEM Diabetic retinopathy is very common retinal disease associated with diabetes. Efforts to prevent diabetic retinopathy though have yielded some results;
Analysis of Human Retinal Images for Automated Glaucoma Screening
 Analysis of Human Retinal Images for Automated Glaucoma Screening Prakash.H.Patil 1, Seema.V.Kamkhedkar 2 1 Professor, 2 Research scholar, 1,2 Department of Electronics & Telecommunication, Indira College
AN APPROACH FOR IRIS SEGMENTATION AND MACULOPATHY DETECTION AND GRADING OF DIABETIC RETINAL IMAGES. Mahaboob Shaik
 ARTICLE AN APPROACH FOR IRIS SEGMENTATION AND MACULOPATHY DETECTION AND GRADING OF DIABETIC RETINAL IMAGES Mahaboob Shaik Dept of ECE, JJT University, Jhunjhunu, Rajasthan, INDIA ABSTRACT Diabetic macular
DETECTING DIABETES MELLITUS GRADIENT VECTOR FLOW SNAKE SEGMENTED TECHNIQUE
 DETECTING DIABETES MELLITUS GRADIENT VECTOR FLOW SNAKE SEGMENTED TECHNIQUE Dr. S. K. Jayanthi 1, B.Shanmugapriyanga 2 1 Head and Associate Professor, Dept. of Computer Science, Vellalar College for Women,
Detection and classification of Diabetic Retinopathy in Retinal Images using ANN
 2016 IJSRSET Volume 2 Issue 3 Print ISSN : 2395-1990 Online ISSN : 2394-4099 Themed Section: Engineering and Technology Detection and classification of Diabetic Retinopathy in Retinal Images using ANN
REVIEW OF METHODS FOR DIABETIC RETINOPATHY DETECTION AND SEVERITY CLASSIFICATION
 REVIEW OF METHODS FOR DIABETIC RETINOPATHY DETECTION AND SEVERITY CLASSIFICATION Madhura Jagannath Paranjpe 1, M N Kakatkar 2 1 ME student, Department of Electronics and Telecommunication, Sinhgad College
Detection of Lesions and Classification of Diabetic Retinopathy Using Fundus Images
 Detection of Lesions and Classification of Diabetic Retinopathy Using Fundus Images May Phu Paing*, Somsak Choomchuay** Faculty of Engineering King Mongkut s Institute of Technology Ladkrabang Bangkok
Detection and Classification of Diabetic Retinopathy in Fundus Images using Neural Network
 Detection and Classification of Diabetic Retinopathy in Fundus Images using Neural Network 1 T.P. Udhaya Sankar, 2 R. Vijai, 3 R. M. Balajee 1 Associate Professor, Department of Computer Science and Engineering,
Flashers and Floaters
 Flashers and Floaters Introduction Sometimes people see small, moving spots or specks in their field of vision. These sensations are called floaters. About 7 out of 10 people experience floaters at some
Diagnosis System for Diabetic Retinopathy to Prevent Vision Loss
 Applied Medical Informatics Original Research Vol. 33, No. 3 /2013, pp: 1-11 Diagnosis System for Diabetic Retinopathy to Prevent Vision Loss Siva Sundhara Raja DHANUSHKODI 1,*, and Vasuki MANIVANNAN 2
International Journal of Computer Sciences and Engineering. Review Paper Volume-5, Issue-12 E-ISSN:
 International Journal of Computer Sciences and Engineering Open Access Review Paper Volume-5, Issue-12 E-ISSN: 2347-2693 Different Techniques for Skin Cancer Detection Using Dermoscopy Images S.S. Mane
Enhanced Detection of Lung Cancer using Hybrid Method of Image Segmentation
 Enhanced Detection of Lung Cancer using Hybrid Method of Image Segmentation L Uma Maheshwari Department of ECE, Stanley College of Engineering and Technology for Women, Hyderabad - 500001, India. Udayini
Blood Vessel Detection from Fundus Image for Diabetic Retinopathy Patients using SVM
 Blood Vessel Detection from Fundus Image for Diabetic Retinopathy Patients using SVM Bibin. s 1, Manikandan. T 2 1 ME communication systems, Rajalakshmi Engineering College, TamilNadu, India 2 Associate
diagnose and treat glaucoma and any resulting visual impairment.
 Overview Do you have a client who has been diagnosed with glaucoma? Do you wonder what this diagnosis means? If so, you are not alone. Glaucoma affects tens of millions of people worldwide. Despite its
Threshold Based Segmentation Technique for Mass Detection in Mammography
 Threshold Based Segmentation Technique for Mass Detection in Mammography Aziz Makandar *, Bhagirathi Halalli Department of Computer Science, Karnataka State Women s University, Vijayapura, Karnataka, India.
Intro to Glaucoma/2006
 Intro to Glaucoma/2006 Managing Patients with Glaucoma is Exciting Interesting Challenging But can often be frustrating! Clinical Challenges To identify patients with risk factors for possible glaucoma.
A Review on Retinal Feature Segmentation Methodologies for Diabetic Retinopathy
 IOSR Journal of Computer Engineering (IOSR-JCE) e-issn: 2278-0661,p-ISSN: 2278-8727, Volume 19, Issue 2, Ver. I (Mar.-Apr. 2017), PP 01-06 www.iosrjournals.org A Review on Retinal Feature Segmentation
Goals. Glaucoma PARA PEARL TO DO. Vision Loss with Glaucoma
 Glaucoma Janet R. Fett, OD Drs. Kincaid, Fett and Tharp So Sioux City, NE eyewear21@hotmail.com Goals Understand Glaucoma Disease process Understand how your data (objective and subjective) assists in
Retinal Blood Vessel Segmentation Using Fuzzy Logic
 Retinal Blood Vessel Segmentation Using Fuzzy Logic Sahil Sharma Chandigarh University, Gharuan, India. Er. Vikas Wasson Chandigarh University, Gharuan, India. Abstract This paper presents a method to
Design and Implementation System to Measure the Impact of Diabetic Retinopathy Using Data Mining Techniques
 International Journal of Innovative Research in Electronics and Communications (IJIREC) Volume 4, Issue 1, 2017, PP 1-6 ISSN 2349-4042 (Print) & ISSN 2349-4050 (Online) DOI: http://dx.doi.org/10.20431/2349-4050.0401001
Lung Tumour Detection by Applying Watershed Method
 International Journal of Computational Intelligence Research ISSN 0973-1873 Volume 13, Number 5 (2017), pp. 955-964 Research India Publications http://www.ripublication.com Lung Tumour Detection by Applying
Automatic Detection of Optic disc in Eye Fundus Images- A REVIEW
 Automatic Detection of Optic disc in Eye Fundus Images- A REVIEW Manpreet Kaur 1 & Mandeep Kaur 2 M. tech Student, Department of Electronics and Communication Engineering, Punjabi University Punjabi university
Published in A R DIGITECH
 Localization of Optic Disc in Retinal Fundus Images for Glaucoma and Diabetes Chaitali D. Dhumane*1, Prof. S. B. Patil*2 *1(Student of Electronics & Telecommunication Department, Sinhgad College of Engineering,
Identification of Sickle Cells using Digital Image Processing. Academic Year Annexure I
 Academic Year 2014-15 Annexure I 1. Project Title: Identification of Sickle Cells using Digital Image Processing TABLE OF CONTENTS 1.1 Abstract 1-1 1.2 Motivation 1-1 1.3 Objective 2-2 2.1 Block Diagram
International Journal of Modern Trends in Engineering and Research e-issn No.: , Date: 2-4 July, 2015
 International Journal of Modern Trends in Engineering and Research www.ijmter.com e-issn No.:2349-9745, Date: 2-4 July, 2015 A Statistical Approach for Blood Vessel Segmentation in Retinal Images for Personal
A NEW APPROACH FOR DETECTION OF BLOOD VESSEL TRACKING SYSTEM AND GLAUCOMA FOR DIABETIC PATIENT
 A NEW APPROACH FOR DETECTION OF BLOOD VESSEL TRACKING SYSTEM AND GLAUCOMA FOR DIABETIC PATIENT R. Raghul and S. Lakshmi Department of Electronics and Communication, Sathyabama University, Chennai, India
Lung Cancer Diagnosis from CT Images Using Fuzzy Inference System
 Lung Cancer Diagnosis from CT Images Using Fuzzy Inference System T.Manikandan 1, Dr. N. Bharathi 2 1 Associate Professor, Rajalakshmi Engineering College, Chennai-602 105 2 Professor, Velammal Engineering
OpticDiscandBloodVesselsScreeninginDiabetesMellitususingOtsusMethod
 : Radiology, iagnostic Imaging and Instrumentation Volume 16 Issue 1 Version 1.0 Year 2016 Type: ouble Blind Peer Reviewed International Research Journal Publisher: Global Journals Inc. (USA) Online ISSN:
COMBINING ALGORITHM FOR AUTOMATIC DETECTION OF DIABETIC RETINOPATHY
 International Journal of Electronics and Communication Engineering & Technology (IJECET) Volume 6, Issue 9, Sep 2015, pp. 57-64, Article ID: IJECET_06_09_007 Available online at http://www.iaeme.com/ijecetissues.asp?jtypeijecet&vtype=6&itype=9
Keywords Fuzzy Logic, Fuzzy Rule, Fuzzy Membership Function, Fuzzy Inference System, Edge Detection, Regression Analysis.
 Volume 6, Issue 3, March 2016 ISSN: 2277 128X International Journal of Advanced Research in Computer Science and Software Engineering Research Paper Available online at: www.ijarcsse.com Modified Fuzzy
ISSN (Online): International Journal of Advanced Research in Basic Engineering Sciences and Technology (IJARBEST) Vol.4 Issue.
: International Journal of Advanced Research in Basic Engineering Sciences and Technology (IJARBEST) Vol.4 Issue.") This work by IJARBEST is licensed under a Creative Commons Attribution 4.0 International License. Available at https://www.ijarbest.com ISSN (Online): 2456-5717 SVM based Diabetic Retinopthy Classification
This work by IJARBEST is licensed under a Creative Commons Attribution 4.0 International License. Available at https://www.ijarbest.com ISSN (Online): 2456-5717 SVM based Diabetic Retinopthy Classification
Diabetic Retinopathy Detection Using Eye Images
 CS365:Artificial Intelligence Course Project Diabetic Retinopathy Detection Using Eye Images Mohit Singh Solanki 12419 mohitss@iitk.ac.in Supervisor: Dr. Amitabha Mukherjee April 18, 2015 Abstract Diabetic