ANNUAL REPORT ON PANCREAS AND ISLET TRANSPLANTATION
|
|
|
- Carmel Sharp
- 5 years ago
- Views:
Transcription


1 ANNUAL REPORT ON PANCREAS AND ISLET TRANSPLANTATION REPORT FOR 2016/2017 (1 APRIL MARCH 2017) PUBLISHED JULY 2017 PRODUCED IN COLLABORATION WITH NHS ENGLAND
2 - 1 - Contents
3 1 Executive Summary Introduction... 6 PANCREAS Pancreas transplant list Patients on the pancreas transplant list as at 31 March, Demographic characteristics, 1 April March Patient waiting times for those currently on the list, 31 March Median waiting time to transplant, 1 April March Response to pancreas offers Offer decline rates, 1 April March Pancreas transplants Pancreas transplants, 1 April March Demographic characteristics, 1 April March Pancreas outcomes Deceased donor graft and patient survival for first SPK transplant Deceased donor graft and patient survival for first PO transplants Survival from listing Patient survival from listing for SPK transplant Form return rates Pancreas form return rates, 1 January 31 December ISLET Islet transplant list Patients on the islet transplant list as at 31 March, Post-registration outcomes, 1 April March Demographic characteristics, 1 April March Patient waiting times for those currently on the list, 31 March Median waiting time to transplant, 1 April March Response to islet offers Offer decline rates, 1 April March Islet transplants Islet transplants, 1 April March Demographic characteristics, 1 April March Islet outcomes Outcome measures for routine islet transplants Form return rates
4 13.1 Islet form return rates, 1 January 31 December APPENDIX A1 Glossary of terms A2 Methods
5 1 Executive Summary Executive Summary - 4 -
6 This report presents key figures about pancreas and islet transplantation in the UK. The period reported covers 10 years of pancreas transplant data, from 1 April 2007 and nine years of islet transplant data, from 1 April The report presents information on the number of transplants and survival analysis after first simultaneous pancreas and kidney and pancreas only transplantation on a national and centre-specific basis. Key findings On the 31 March 2017, there were 224 patients on the UK active pancreas and islet transplant list, which represents a 1% decrease in number of patients a year earlier. The number of patients on the active pancreas list increased by 2% to 203 in 2017 while the active islet transplant list decreased by 25% to 21 patients in the same time period. There were 2,026 pancreas transplants performed in the UK in the ten year period and 217 islet transplants performed in the nine years since islet transplantation was first commissioned in the UK. The number of transplants from donations after brain death has increased slightly by 2% in the last year to 164. However, the number of transplants from donations after circulatory death has decreased by 11% in the last year to 49. The national rates of patient survival one- and five-years after first simultaneous pancreas and kidney transplant from deceased donors are 97% and 89%, respectively. These rates vary between centres, ranging from 94% to 100% at oneyear and 67% to 97% at five-years. All centre rates are risk-adjusted. The national rates of graft survival one- and five-years after first simultaneous pancreas and kidney transplant from deceased donors are 88% and 78%, respectively. These rates vary between centres, ranging from 79% to 96% at oneyear and 59% to 88% at five-years. All centre rates are risk-adjusted. The national rates of patient survival one- and five-years after first pancreas only transplant from deceased donors are 95% and 82%, respectively. The national rates of graft survival one- and five-years are 80% and 53%. Centre specific estimates of these rates must be interpreted with caution due to the small number of transplants upon which they are based. The national rate of ten year patient survival from listing for deceased donor simultaneous pancreas and kidney transplant is 73%. These rates vary between centres, ranging from 66% to 82%. All centre rates are risk-adjusted. The national rate of one year graft survival for patients receiving a routine islet transplant followed by a priority islet transplant within the year is 97% compared with 79% for those patients receiving a routine islet transplant alone. Reductions in annual rate of severe hypoglycaemic events, HbA1c, and insulin dose have been reported at one-year post routine islet transplant. Use of the contents of this report should be acknowledged as follows: Annual Report on Pancreas and Islet Transplantation 2016/17, NHS Blood and Transplant - 5 -
7 2 Introduction Introduction - 6 -
8 This report presents information on pancreas transplant activity between 1 April 2007 and 31 March 2017, for all eight centres performing pancreas transplantation in the UK. Information on islet transplant activity is presented for all seven centres performing islet transplantation, since 1 April 2008 when islet transplantation was first commissioned in the UK. Cambridge, Cardiff, Guy s and WLRTC only perform pancreas transplants while Bristol, King s College and the Royal Free only perform islet transplants. Throughout this report West London Renal and Transplant Centre is labeled as WLRTC. Data were obtained from the UK Transplant Registry, at NHS Blood & Transplant, that holds information relating to donors, recipients and outcomes for all pancreas and islet transplants performed in the UK. Graft and patient pancreas survival estimates are reported at one-year post-transplant for the period 1 April 2012 to 31 March 2016 and five-year post-transplant for the period 1 April 2008 to 31 March Islet transplant survival is measured by four key variables: graft survival, and a reduction in HbA1c, insulin requirements and the annual rate of severe hypoglycaemic events. Islet outcomes are reported at one-year post-transplant for the period 1 April 2008 to 31 March 2016 for the national cohort only. Islet outcomes are unadjusted for risk. Islet outcome data from the UK Transplant Registry is supplemented by data collected from the UK Islet Transplant Consortium. Pancreas patient survival from listing is reported at one, five and ten year post registration for a deceased donor simultaneous pancreas and kidney (SPK) transplant between 1 January 2005 and 31 December The centre specific results for survival estimates are adjusted for differences in risk factors between the centres. The risk models and methods used are described in the Appendix. Patients requiring multi-organ transplants (except simultaneous pancreas and kidney or islets and kidney transplants (SPK, SIK)) are excluded from all analyses apart from in the introduction. All results are described separately for pancreas and islet patients other than those presented in this introduction section. Intestinal transplants that involve a pancreas are excluded from all sections of the report
9 Figure 2.1 shows the number of patients on the pancreas and islet transplant list at 31 March each year between 2008 and The number of patients actively waiting for a pancreas or islet transplant increased each year from 219 in 2008 to 333 in 2010 and has since fallen to 224 patients active on 31 March Figure 2.2 shows the number of patients on the pancreas and islet transplant list at 31 March 2017 for each transplant centre. Oxford has the largest transplant list with 74 patients registered for a pancreas or islet transplant. Of these patients, 62 are registered for a simultaneous pancreas and kidney (SPK) transplant, 5 are registered for a pancreas only transplant and 7 are registered for an islet transplant. Edinburgh has 2 patients waiting for a simultaneous islet and kidney (SIK) transplant
10 Figure 2.3 shows the total number of pancreas and islet transplants performed in the last ten years. Transplant numbers steadily increased from 214 in 2008/09 to 246 in 2013/14. However, the number of transplants performed in 2014/15 decreased to 226 and further to 213 in 2016/17. In particular the number of pancreas only transplants has decreased from 29 transplants in 2014/15 to 17 in 2016/17. Figure 2.4 shows the total number of pancreas and islet transplants performed in 2016/17 at each transplant centre. Oxford performed the most pancreas and islet transplants last year, a total of 69 transplants, whilst Edinburgh performed the most islet - 9 -
11 transplants (17). Manchester performed 1 simultaneous islet and kidney transplant and the Royal Free performed no transplants during this time period. Figure 2.5 details the 213 pancreas and islet transplants performed in the UK between 1 April 2016 and 31 March Data for transplants performed in 2015/16 are also presented. The overall number of whole pancreas transplants performed in 2016/17 has fallen compared with 2015/16, 179 and 185 respectively. However the number of islet transplants has increased from 31 to
.")
12 Geographical variation in pancreas registration and transplant rates All NHS group 1 patients who were registered onto the pancreas or islet transplant lists with an active status between 1 April 2016 and 31 March 2017 were extracted from the UK Transplant Registry on 12 June 2017 (numerator). Only patients registered for pancreas only, kidney and pancreas, islet only and islet and kidney were considered. Patients were assigned to Strategic Health Authorities (SHA) in England using their postcode of residence, as reported at registration. The number of registrations per million population (pmp) by SHA was obtained using mid-2015 population estimates based on the Office for National Statistics (ONS) 2011 Census figures (denominator). No SHA age- or sex-specific standardisation of rates was performed. The registration rates pmp were categorised into four groups low, low-medium, medium-high and high based on the quartiles of their distribution and visualised in a map using contrasting colours. Transplant rates pmp were obtained as the number of pancreas only, pancreas and kidney, islet only and islet and kidney transplants on NHS group 1 recipients from deceased donors between 1 April 2016 and 31 March 2017 (numerator), divided by the mid-2015 population estimates from the ONS (denominator). Transplant rates pmp were categorised and visualised in a map as done for the registration rates. For systematic component of variation only registrations or transplants in England between 1 April 2016 and 31 March 2017 were included. If a patient was re-registered during the time period, only the first registration was considered. If a patient underwent
 between 1 April 2016 and 31 March 2017 compared with pancreas transplant rates pmp for the same time period,")
13 more than one pancreas/islet transplant in the time period, only the first transplant was considered. Figure 2.6 shows rates of registration to the pancreas transplant list per million population (pmp) between 1 April 2016 and 31 March 2017 compared with pancreas transplant rates pmp for the same time period, by recipient country/strategic Health Authority (SHA) of residence. Table 2.1 shows the breakdown of these numbers by recipient country/strategic Health Authority of residence. No adjustments have been made for potential demographic differences in populations. If a patient has had more than one registration/transplant in the period, each registration/transplant is considered. Note that this analysis only considered NHS Group 1 patients. Since there will inevitable be some random variation in rates between areas, the systematic component of variation (SCV) was used to identify if the variation is more (or less) than a random effect for the different SHAs in England only. Only first registrations and transplants in this period were considered. The larger the SCV the greater the evidence of a high level of systematic variation between areas. Both registration and transplant rates yielded a low SCV at 0.1 and 0, respectively, and therefore, no evidence of geographical variation beyond what would be expected at random
14 Table 2.1 Pancreas registration and transplant rates per million population (pmp) in the UK, 1 April March 2017, by Country/Strategic Health Authority Country/ Strategic Health Authority Registrations (pmp) Transplants (pmp) North East 10 (3.8) 8 (3.1) North West 19 (2.6) 14 (2) Yorkshire and The Humber 10 (1.9) 15 (2.8) North of England 39 (2.6) 37 (2.4) East Midlands 17 (3.6) 17 (3.6) West Midlands 27 (4.7) 27 (4.7) East of England 31 (5.1) 22 (3.6) Midlands and East 75 (4.5) 66 (4) London 31 (3.6) 15 (1.7) South East Coast 24 (5.2) 12 (2.6) South Central 30 (6.9) 23 (5.3) South West 20 (3.7) 19 (3.5) South of England 74 (5.1) 54 (3.7) England 219 (4) 172 (3.1) Isle of Man 0 0 Channel Islands 0 0 Wales 18 (5.8) 4 (1.3) Scotland 41 (7.6) 34 (6.3) Northern Ireland 2 (1.1) 3 (1.6) TOTAL 280 (4.3) 213 (3.3)
15 PANCREAS 3 Pancreas transplant list Pancreas transplant list
16 3.1 Patients on the pancreas transplant list as at 31 March, Figure 3.1 shows the number of patients on the pancreas transplant list at 31 March each year between 2008 and The number of patients actively waiting for a pancreas transplant increased from 216 in 2008 to 316 in 2010 and then fell to 228 in Since then, numbers have slowly decreased and 203 patients were listed for a pancreas transplant at 31 March Figure 3.2 shows the number of patients on the active pancreas transplant list at 31 March 2017 by centre. Oxford had the largest proportion of the transplant list (33%) and WLRTC had the smallest proportion (5%)
17 Figure 3.3 shows the number of patients on the pancreas transplant list at 31 March each year between 2008 and 2017 for each transplant centre
 and who died while on the transplant list.")

18 3.2 Post-registration outcomes, 1 April March 2014 An indication of outcomes for patients listed for a pancreas transplant is summarised in Figure 3.4. This shows the proportion of patients transplanted or still waiting one and three years after joining the list. It also shows the proportion removed from the transplant list (typically because they become too unwell for transplant) and who died while on the transplant list. Only 40% of patients registered between 1 April 2013 and 31 March 2014 were transplanted within one year, while three years after listing 76% of patients had received a transplant. There were 7% of patients who had died waiting for a transplant within 3 years of listing. Figure 3.5 shows the proportion of patients transplanted or still waiting three years after joining the list by centre. Three years after listing, Guy s had transplanted 87% of their patients while Manchester only transplanted 57%
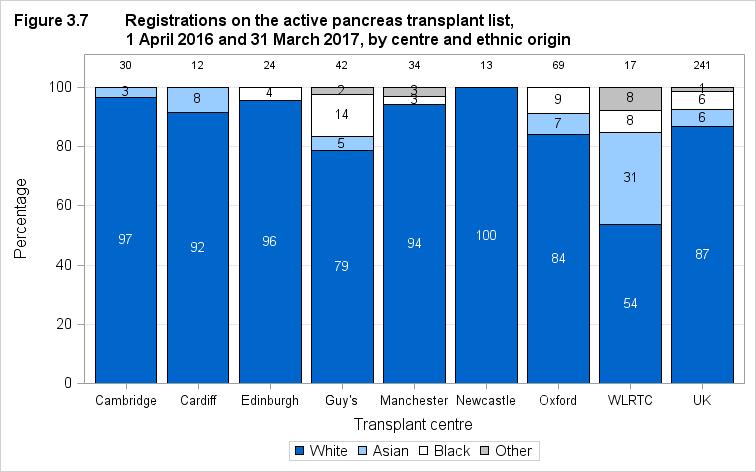
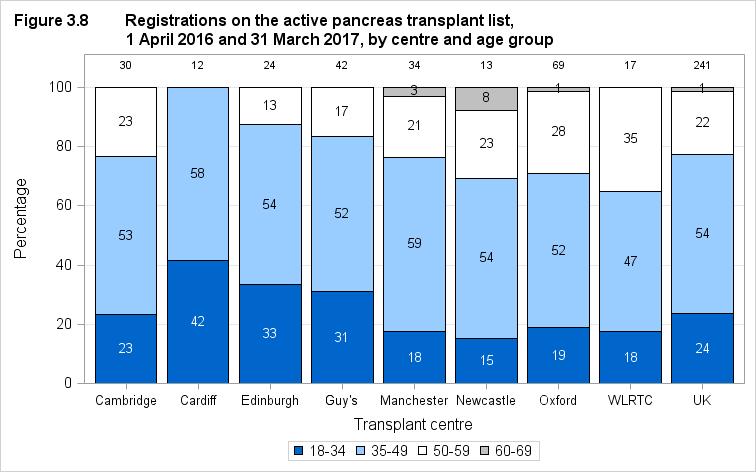
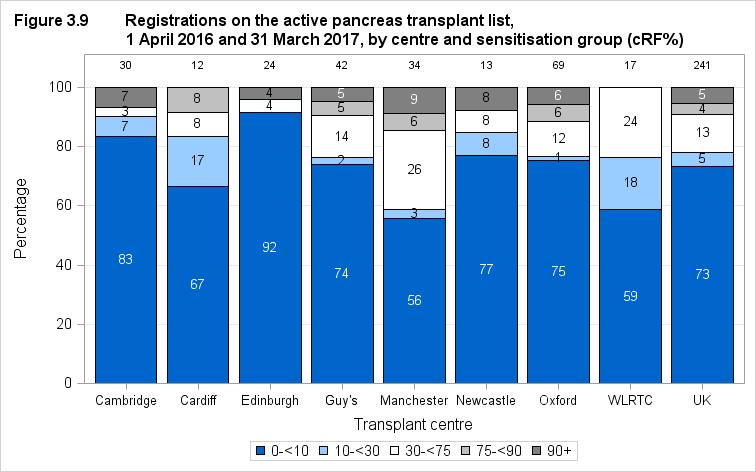
19 3.3 Demographic characteristics, 1 April March 2017 The sex, ethnicity, age group and sensitisiation group (crf%) of patients registered on the pancreas transplant list in 2016/17 are shown by centre in Figures 3.6, 3.7, 3.8, and 3.9 respectively. Note that all percentages quoted are based only on data where relevant information was available. Overall, 241 patients were registered on the pancreas transplant list, 224 (93%) were waiting for a simultaneous kidney/pancreas transplant. Of which 58% were male, 84% were white, the median age was 41 years and the median crf was 0%. Of the 17 (7%) patients on the pancreas only transplant list, 35% were male, 100% were white, the median age was 48 years and the median crf was 47%
20 - 19 -
21 - 20 -

22 3.4 Patient waiting times for those currently on the list, 31 March 2017 Figure 3.10 shows the length of time patients have been waiting on the pancreas transplant list at 31 March 2017 by centre. The majority of patients currently listed have been waiting less than one year. Two patients at Oxford have been waiting more than 7 years for transplant; both are simultaneous kidney/pancreas patients and are highly sensitised with a crf of 99% or more
23 3.5 Median waiting time to transplant, 1 April March 2014 The length of time a patient waits for a pancreas transplant varies across the UK. The median waiting time for deceased donor pancreas transplantation is calculated using the Kaplan-Meier method and is shown in Figure 3.11 and Table 3.1 for patients registered at each individual unit. The median waiting time to transplant for patients registered on the pancreas transplant list between 1 April 2011 and 31 March 2014 is 344 days, just over 11 months. This ranged from 179 days at Cardiff to 521 days at Newcastle. Table 3.1 Median waiting time to pancreas transplant in the UK, for patients registered 1 April March 2014 Transplant centre Number of patients Waiting time (days) registered Median 95% Confidence interval Cambridge Cardiff Edinburgh Guy's Manchester Newcastle Oxford WLRTC UK
24 4 Response to pancreas offers Response to pancreas offers
25 4.1 Offer decline rates, 1 April March 2017 Pancreas offers from DBD and DCD donors whose pancreas was retrieved, offered directly on behalf of a named individual patient and resulted in transplantation were analysed separately. Any offers of pancreases declined for transplantation, pancreases offered for multi-organ or small bowel transplant were excluded, as were offers made through the fast track scheme or the reallocation of the pancreas. Funnel plots are used to compare centre specific offer decline rates and indicate how consistent the rates of the individual transplant centres are with the national rate. Patient case mix is known to influence the number of offers a centre may receive. In this analysis however only individual offers for named patients were considered which excluded any ABO- and HLA-incompatible patients. For this reason it was decided not to risk adjust for known centre differences in patient case mix. Figure 4.1 compares individual centre offer DBD decline rates with the national rate over the time period, 1 April 2014 and 31 March Centres can be identified by the information shown in Table 4.1. Guy s and Cambridge had offer decline rates better than the national rate, whilst Edinburgh and Newcastle had higher rates than the national average
26 Table 4.1 compares individual centre DBD offer decline rates over time by financial year. The offer decline rate for Edinburgh and Newcastle have decreased to 64% and 72% respectively, for this financial year. However, the rates are still higher than the national rate, 54%. Table 4.1 DBD donor pancreas offer decline rates by transplant centre, 1 April 2014 and 31 March 2017 Centre Code 2014/ / /17 Overall N (%) N (%) N (%) N (%) Cambridge A 38 (61) 21 (33) 20 (30) 79 (46) Cardiff B 24 (71) 22 (68) 4 (0) 50 (64) Edinburgh C 43 (70) 58 (72) 56 (64) 157 (69) Guy's D 29 (41) 33 (39) 31 (58) 93 (46) Manchester E 43 (51) 43 (63) 29 (45) 115 (54) Newcastle F 21 (67) 24 (79) 29 (72) 74 (73) Oxford G 81 (47) 99 (57) 93 (49) 273 (51) WLRTC H 23 (70) 15 (40) 10 (70) 48 (60) UK 302 (57) 315 (59) 272 (54) 889 (57) Centre has reached the upper 99.8% confidence limit Centre has reached the upper 95% confidence limit Centre has reached the lower 95% confidence limit Centre has reached the lower 98.8% confidence limit Figure 4.2 compares individual centre offer DCD decline rates with the national rate over the time period, 1 April 2014 and 31 March Centres can be identified by the information shown in Table
27 Table 4.2 compares individual DCD centre offer decline rates over time by financial year. Similarly to DBD decline rates, Guy s and Cambridge had offer decline rates better than the national rate, whilst Edinburgh and Newcastle had higher rates than the national average. Table 4.2 DCD donor pancreas offer decline rates by transplant centre, 1 April 2014 and 31 March 2017 Centre Code 2014/ / /17 Overall N (%) N (%) N (%) N (%) Cambridge A 16 (31) 11 (27) 7 (14) 34 (26) Cardiff B 16 (56) 3 (33) 3 (67) 22 (55) Edinburgh C 7 (71) 7 (100) 4 (100) 18 (89) Guy's D 13 (23) 9 (22) 9 (22) 31 (23) Manchester E 21 (57) 21 (43) 17 (35) 59 (46) Newcastle F 4 (100) 7 (100) 3 (100) 14 (100) Oxford G 24 (33) 19 (32) 21 (43) 64 (36) WLRTC H 4 (100) 5 (40) 5 (40) 14 (57) UK 105 (48) 82 (45) 69 (42) 256 (45) Centre has reached the upper 99.8% confidence limit Centre has reached the upper 95% confidence limit Centre has reached the lower 95% confidence limit Centre has reached the lower 98.8% confidence limit
28 5 Pancreas transplants Pancreas transplants
.")
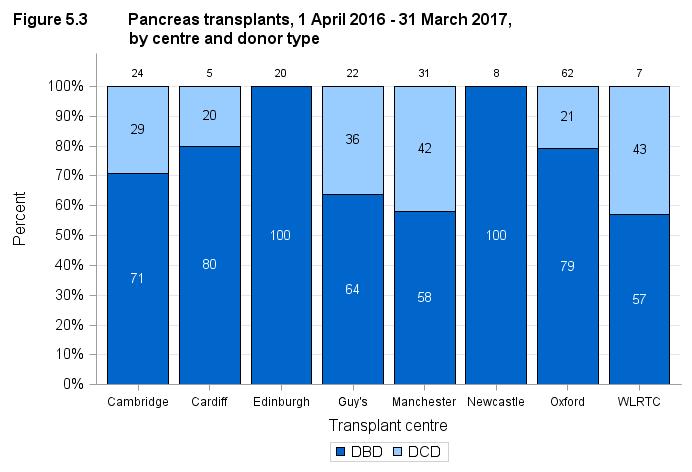
29 5.1 Pancreas transplants, 1 April March 2017 Figure 5.1 shows the total number of pancreas transplants performed in the last ten years, by type of donor. The first DCD pancreas transplant was performed in 2005/06 and by 2007/08 there were 36 DCD transplants (15%). The number of DCD transplants performed reached a peak of 60 in 2014/15 but within the last two financial years, DCD pancreas transplants have dropped to 49 in 2015/16 and 45 in 2016/17 and accounts for a quarter of pancreas transplants in both years. After a fall in 2008/09 and 2009/10, DBD numbers steadily increased between 2010/11 and 2013/14. However, the number of DBD transplants has decreased the last three years to 134 transplants in 2016/17. Figure 5.2 shows the total number of pancreas transplants performed in 2016/17, by centre and type of donor. The same information is presented in Figure 5.3 but this shows the proportion of DBD and DCD transplants performed at each centre. Oxford performed the most DBD and DCD transplants (62). There were no DCD transplants performed at Newcastle and Edinburgh in the last financial year. WLRTC had the largest proportion of DCD transplants (43%), closely followed by Manchester (42%)
30 - 29 -

31 Figure 5.4 shows the total number of pancreas transplants performed in last ten years, by centre and type of donor. Oxford have consistently performed a large number of pancreas transplants since 2007/08 including a number of DCD transplants over the last ten years. However, the number of transplants performed at Oxford has decreased since 2011/
32 5.2 Demographic characteristics, 1 April March 2017 The sex, ethnicity, age group and sensitisation group (crf%) of patients that received a pancreas transplant in 2016/17 are shown by centre in Figures 5.5, 5.6, 5.7 and 5.8 respectively. Note that all percentages quoted are based only on data where relevant information was available. Overall, 179 patients were transplanted on the pancreas transplant list, 162 (91%) were a simultaneous kidney/pancreas transplant. Of which 55% were male, 91% were white, the median age was 43 years and the median crf was 0%. Of the 17 (9%) patients on the pancreas only transplant list, 35% were male, 100% were white, the median age was 46 years and the median crf was 51%
33 - 32 -
.")
34 5.3 Cold ischaemia time, 1 April March 2017 Median cold ischaemia times (CIT) are shown in addition to inter-quartile ranges in Figures 5.9 to Fifty percent of the transplants have a CIT within the inter-quartile range (indicated by a box). Where there is only one observation to report, the single data point is represented by a dash as per the median for multiple observations. There is some variation in average (median) CIT between different transplant centres although all centres continually try to reduce this time. Figure 5.9 shows the median cold ischaemia time in DBD donor pancreas transplants over the last 10 years. During this time period the overall median cold ischaemia time has been fluctuating between 13 hours in 2007/08 and 11 hours in 2016/
35 Figure 5.10 shows the median cold ischaemia time in DBD donor pancreas transplants in 2016/17 for each transplant centre. Three centres had the longest median cold ischaemia time in 2016/17 of 12 hours compared with Cambridge who had the shortest of 9 hours
36 Figure 5.11 shows the median cold ischaemia time in DBD donor pancreas transplants over the last ten years for each transplant centre
37 Figure 5.12 shows the median cold ischaemia time in DCD donor pancreas transplants over the last ten years. Overall median cold ischaemia time has fallen from 15 hours in 2007/08 to 10 hours in 2016/17. Figure 5.9 shows the median cold ischaemia time in DCD donor pancreas transplants in 2016/17 for each transplant centre. Cambridge and Oxford had the shortest median cold ischaemia time of 10 hours, whilst Guy s had the longest median ischaemia time of 12 hours. Cardiff is not shown as the cold ischaemia time was not reported for their single DCD donor pancreas transplant
38 Figure 5.14 shows the median cold ischaemia time in DCD donor pancreas transplants for each transplant centre over the last ten years
39 6 Pancreas outcomes Pancreas outcomes
40 6.1 Deceased donor graft and patient survival for first SPK transplant Funnel plots are used to compare centre specific risk-adjusted patient and graft survival rates and indicate how consistent these rates are with the national survival rates. Note that some patients return to local renal units for follow-up care after their transplant and although we report survival according to transplant unit, patients may in fact be followed up quite distantly from their transplant centre. It is important to note that adjusting for patient mix through the use of risk-adjustment models may not account for all possible causes of centre differences. There may be other factors that are not taken into account in the riskadjustment process that may affect the survival rate of a particular centre. Figures 6.1 and 6.2 compare individual centre survival estimates with the national rates for one-year patient and graft survival for deceased donor first simultaneous pancreas and kidney (SPK) transplants. Figures 6.3 and 6.4 compare five-year survival estimates. The funnel plots show that, for the most part, the centres lie within the confidence limits. Some of the funnel plots show some centres to be above the upper 95% confidence limit. This suggests that these centres may have survival rates that are considerably higher than the national rate. Figure 6.3 shows one centre outside the lower 95% confidence limit, indicating that this centre may have a significantly lower five-year patient survival rate than the national rate. Similarly, Figure 6.4 shows that one centre may have a significantly lower five year graft survival rate compared with the national rate. Centres can be identified by the information shown in Tables 6.1 and
41 - 40 -
42 Table 6.1 Risk-adjusted one and five year patient survival for first SPK transplants using pancreases from deceased donors patient survival One-year* Five-year** Centre Code N % (95% CI) N % (95% CI) Cambridge A N/A (80-97) Cardiff B (71-100) (68-99) Edinburgh C (88-99) (81-99) Guy's D (85-98) (89-100) Manchester E (92-99) (73-93) Newcastle F N/A (59-97) Oxford G (93-99) (84-93) WLRTC H (82-100) (37-85) UK (95-98) (86-91) Centre has reached the lower 99.8% confidence limit Centre has reached the lower 95% confidence limit Centre has reached the upper 95% confidence limit Centre has reached the upper 98.8% confidence limit * Includes transplants performed between 1 April March 2016 ** Includes transplants performed between 1 April March
43 Table 6.2 Risk-adjusted one and five year pancreas graft survival for first SPK transplants using pancreases from deceased donors pancreas graft survival One-year* Five-year** Centre Code N % (95% CI) N % (95% CI) Cambridge A (89-99) (77-94) Cardiff B (71-97) (47-88) Edinburgh C (63-89) (67-93) Guy's D (74-90) (69-89) Manchester E (75-91) (57-82) Newcastle F (56-99) (27-80) Oxford G (85-94) (74-86) WLRTC H (76-100) (38-78) UK (86-90) (75-81) Centre has reached the lower 99.8% confidence limit Centre has reached the lower 95% confidence limit Centre has reached the upper 95% confidence limit Centre has reached the upper 98.8% confidence limit * Includes transplants performed between 1 April March 2016 ** Includes transplants performed between 1 April March Deceased donor graft and patient survival for first PO transplants Individual centre unadjusted survival estimates and national rates for one-year and fiveyear patient and pancreas graft survival for deceased donor first pancreas only (PO) transplants are shown in Tables 6.3 and 6.4, respectively. Centre specific estimates of these rates must be interpreted with caution due to the small number of transplants upon which they are based
44 Table 6.3 Unadjusted one and five year patient survival for first PO transplants using pancreases from deceased donors patient survival One-year* Five-year** Centre Code N % (95% CI) N % (95% CI) Cardiff B Guy's D Manchester E Newcastle F Oxford G (77-98) (64-88) Edinburgh C WLRTC H UK (83-99) (69-90) * Includes transplants performed between 1 April March 2016 ** Includes transplants performed between 1 April March Data not presented where less than 10 transplants included Table 6.4 Unadjusted one and five year pancreas graft survival for first PO transplants using pancreases from deceased donors pancreas graft survival One-year* Five-year** Centre Code N % (95% CI) N % (95% CI) Cambridge A Cardiff B (37-87) (34-86) Edinburgh C Guy's D Manchester E (18-65) Newcastle F Oxford G (70-93) (45-68) WLRTC H (10-66) UK (70-87) (43-61) * Includes transplants performed between 1 April March 2016 ** Includes transplants performed between 1 April March Data not presented where less than 10 transplants included
45 7 Survival from listing Survival from listing
46 7.1 Patient survival from listing for SPK transplant Survival from listing was analysed for all adult ( 18 years) patients registered for the first time for simultaneous pancreas and kidney (SPK) between 1 January 2005 and 31 December Patients registered for a pancreas only or islet transplant have been excluded from this analysis. Survival time was defined as the time from joining the transplant list to death, regardless of the length of time on the transplant list, whether or not the patient was transplanted and any factors associated with such a transplant e.g. donor type. Survival time was censored at either the date of removal from the list, or at the last known follow up date post-transplant when no death date was recorded, or at the time of analysis if the patient was still active on the transplant list. The funnel plot shown in Figure 7.1, compares centre specific ten-year risk-adjusted patient survival rates from the point SPK transplant listing and indicates how consistent the rates of the individual transplant centres are with the national rate. Cambridge, Edinburgh and Guy s all have 10 year survival rates above the upper 99.8% confidence limit indicating that these centres have 10 year survival rates from listing that are considerably higher than the national rate. The 10 year survival rate for Manchester and Oxford were near the lower 95.5% confidence limit. This suggests that 10 year survival from listing at Manchester and Oxford are significantly lower than the national rate. Centres can be identified by the information shown in Table 7.1, which also shows one and five-year riskadjusted survival rates from the point of transplant listing
47 Table 7.1 Risk-adjusted 1, 5 and 10 year patient survival from listing for first deceased donor SPK transplant in patients registered between 1 January 2005 and 31 December 2016 Centre Code One year Five year Ten year N (%) N (%) N (%) Cambridge A 260 (97) 260 (89) 260 (82) Cardiff B 110 (96) 110 (86) 110 (76) Edinburgh C 236 (97) 236 (88) 236 (81) Guy's D 346 (97) 346 (88) 346 (81) Manchester E 385 (97) 385 (82) 385 (71) Newcastle F 104 (96) 104 (83) 104 (67) Oxford G 769 (96) 769 (83) 769 (71) WLRTC H 107 (97) 107 (87) 107 (74) UK 2317 (96) 2317 (85) 2317 (75) Centre has reached the lower 99.8% confidence limit Centre has reached the lower 95% confidence limit Centre has reached the upper 95% confidence limit Centre has reached the upper 98.8% confidence limit
48 8 Form return rates Form return rates
49 8.1 Pancreas form return rates, 1 January 31 December 2016 Form return rates are reported in Table 8.1 for the pancreas transplant record, three month and 1 year follow up form, along with lifetime follow up (more than 2 years). These include all pancreas transplants performed between 1 January and 31 December 2016 for the transplant record, and all requests for follow up forms issued in this time period. Centres highlighted are transplant centres. Overall, 100% of transplant record forms issued and 89% of lifetime follow-up forms issued have been returned. Table 8.1 Form return rates following pancreas transplantation, by centre, 1 January December 2016 Centre Transplant record % N returned 3 month follow-up % N returned 12 month follow-up % N returned Lifetime follow-up % N returned Aberdeen, Aberdeen Royal Infirmary Bangor, Ysbyty Gwynedd District General 3 67 Hospital Basildon, Basildon Hospital Belfast, Antrim Hospital 2 50 Belfast, Belfast City Hospital Belfast, The Ulster Hospital Birmingham, Birmingham Heartlands Hospital Birmingham, Queen Elizabeth Hospital Birmingham Bradford, St Lukes Hospital Brighton, Royal Sussex County Hospital Bristol, Southmead Hospital Camberley, Frimley Park Hospital 1 0 Cambridge, Addenbrookes Hospital Canterbury, Kent And Canterbury Hospital Cardiff, University Of Wales Hospital Carlisle, Cumberland Infirmary Carshalton, St Helier Hospital Chelmsford, Broomfield Hospital Chester, Countess Of Chester Hospital County Down, Daisy Hill Hospital Coventry, University Hospital (walsgrave) Crewe, Leighton Hospital Derby, Royal Derby Hospital Doncaster, Doncaster Royal Infirmary Dorchester, Dorset County Hospital Douglas, Nobles I-o-m Hospital Dudley, Russells Hall Hospital Dulwich, Kings College Dumfries, Dumfries And Galloway Royal Infirmary Dundee, Ninewells Hospital Edinburgh, Royal Infirmary Of Edinburgh Exeter, Royal Devon And Exeter Hospital (wonford) Glasgow, Queen Elizabeth University Hospital Gloucester, Gloucestershire Royal Hospital Hereford, The County Hospital 3 67 Hull, The Hull Royal Infirmary Inverness, Raigmore Hospital
50 Table 8.1 Form return rates following pancreas transplantation, by centre, 1 January December 2016 Centre Transplant record 3 month follow-up 12 month follow-up Lifetime follow-up % % % % N returned N returned N returned N returned Ipswich, Ipswich Hospital Kilmarnock, Crosshouse Hospital 4 0 Leeds, St Jamess University Hospital Leicester, Leicester General Hospital Lincoln, Lincoln County Hospital Liverpool, Royal Liverpool University Hospital Liverpool, University Hospital Aintree 1 0 London, Guys Hospital London, St Georges Hospital 4 25 London, The Royal Free Hospital London, The Royal London Hospital (whitechapel) Londonderry, Altnagelvin Area Hospital 1 0 Manchester, Manchester Royal Infirmary Middlesbrough, The James Cook University Hospital Newcastle, Freeman Hospital Northampton, Northampton General Hospital 6 33 Norwich, Norfolk And Norwich University Hospital Nottingham, Nottingham University Hospitals City Campus Omagh, Tyrone County Hospital 1 0 Oxford, Churchill Hospital Peterborough, Peterborough City Hospital 1 0 Plymouth, Derriford Hospital Portsmouth, Queen Alexandra Hospital Preston, Royal Preston Hospital Reading, Royal Berkshire Hospital Rhyl, Royal Alexandra Hospital Salford, Salford Royal Sheffield, Northern General Hospital Shrewsbury, Royal Shrewsbury Hospital 2 0 St Helier, Jersey General Hospital Stevenage, Lister Hospital Stoke-on-trent, Royal Stoke University Hospital Sunderland, Sunderland Royal Hospital 4 50 Swansea, Morriston Hospital Truro, Royal Cornwall Hospital (treliske) West London Renal Transplant Centre Westcliff On Sea, Southend Hospital Wirral, Arrowe Park Hospital Wolverhampton, New Cross Hospital Wrexham, Maelor General Hospital 8 0 York, York District Hospital Overall
51 ISLET 9 Islet transplant list Islet transplant list
52 9.1 Patients on the islet transplant list as at 31 March, Figure 9.1 shows the number of patients on the islet transplant list at 31 March each year between 2008 and The number of patients active on the islet transplant list has increased from 3 in 2008 (when islet transplantation was first commissioned in the UK) to 36 in 2015, however the number has decreased to 21 in Figure 9.2 shows the number of patients on the active islet transplant list at 31 March 2017 by centre. Eight (38%) of the patients on the active transplant list were registered at Edinburgh, whilst there were no patients registered at Bristol, King s College and the Royal Free
53 Figure 9.3 shows the number of patients on the islet transplant list at 31 March each year between 2008 and 2017 for each transplant centre. The number of active and suspended patients by centre is not recorded prior to 2011, hence only the total number are reported between 2008 and The number of patients actively registered at Edinburgh has decreased from 18 on 31 March 2015 to 8 on 31 March Post-registration outcomes, 1 April March 2014 An indication of outcomes for patients listed for an islet transplant is summarised in Figure 9.4. This shows the proportion of patients transplanted or still waiting one and three years after joining the list. It also shows the proportion removed from the transplant list (typically because they become too unwell for transplant) and those who died while on the transplant list. 45% of patients are transplanted within one year, while three years after listing 77% of patients have received a transplant

54 Figure 9.5 shows the proportion of patients transplanted or still waiting three years after joining the list by centre. Three years after registration, 33% of patients were removed from the list at King s College, although the number of registrations were small. Overall the majority of centres transplanted 50% of patients registered within 3 years. One patient died whilst waiting for a transplant at Edinburgh

55 9.3 Demographic characteristics, 1 April March 2017 The sex and age group of patients registered on the islet transplant list during 2016/17 are shown by centre in Figures 9.6 and 9.7. Note that all percentages quoted are based only on data where relevant information was available. Overall, the majority of patients registered on the islet transplant list were female and the median age was 48 years
 registered at Manchester has been waiting more than 5 years for transplant. 9.")
56 9.4 Patient waiting times for those currently on the list, 31 March 2017 Figure 9.8 shows the length of time patients have been waiting on the islet transplant list at 31 March 2017 by centre. One highly sensitised patient (94% crf) registered at Manchester has been waiting more than 5 years for transplant. 9.5 Median waiting time to transplant, 1 April March 2014 The length of time a patient waits for an islet transplant varies across the UK. The median waiting time for deceased donor islet transplantation is calculated using the Kaplan-Meier method and is shown in Figure 9.9 and Table 9.1 for patients registered at each individual unit. The median waiting time to transplant for patients registered on the islet transplant list between 1 April 2011 and 31 March 2014 is 355 days (almost 12 months), ranging from 146 days at Edinburgh to 1010 days (over 2 and a half years) at Manchester. There was insufficient data to calculate the 95% confidence interval to islet transplant for patients registered at Manchester in this time period
57 Table 9.1 Median waiting time to islet transplant in the UK, for patients registered 1 April March 2014 Transplant centre Number of patients Waiting time (days) registered Median 95% Confidence interval Bristol Edinburgh King's Manchester Newcastle Oxford Royal Free UK Data not presented when less than 10 patients 1 Insufficient data to calculate the 95% Confidence interval
58 10 Response to islet offers Response to islet offers
59 10.1 Offer decline rates, 1 April March 2017 Islet offers from DBD donors whose pancreas was retrieved, offered directly on behalf of a named individual patient and resulted in islet transplantation are included in the analysis. Any offers of islets declined for transplantation or DCD offers were excluded, as were offers made through the fast track scheme or the reallocation of the pancreas. Individual centre offer decline rates by financial year and over the time period, 1 April 2014 and 31 March 2017 are shown in Table Royal Free had the lowest overall rates (0%) whilst Newcastle had the highest rate (66%). Note that all rates are based on a small number of offers. Table 10.1 DBD donor islet offer decline rates by transplant centre, 1 April 2014 and 31 March 2017 Centre Code 2014/ / /17 Overall N (%) N (%) N (%) N (%) Bristol I 4 (75) 2 (50) 1 (0) 7 (57) Edinburgh C 10 (50) 17 (35) 15 (20) 42 (33) King's J 2 (100) 2 (50) 3 (0) 7 (43) Manchester E 3 (33) 1 (0) 5 (60) 9 (44) Newcastle F 8 (63) 15 (60) 12 (75) 35 (66) Oxford G 9 (44) 2 (0) 6 (50) 17 (41) Royal Free K 3 (0) 3 (0) UK 39 (51) 39 (44) 42 (43) 120 (46) Centre has reached the upper 99.8% confidence limit Centre has reached the upper 95% confidence limit Centre has reached the lower 95% confidence limit Centre has reached the lower 98.8% confidence limit
60 11 Islet transplants Islet transplants

61 11.1 Islet transplants, 1 April March 2017 Figure 11.1 shows the total number of islet transplants performed in the last nine years since islet transplantation was first commissioned in the UK, by type of donor. There was a significant increase in 2011/12 from 13 to 30 transplants a year, following the introduction of the national Pancreas Allocation Scheme in This provided islet patients with equal access to donated pancreases for the first time. Since 2011/12, the number of islet transplants remained fairly constant with 34 transplants in 2016/17, although in 2014/15 only 23 transplants were performed
62 Figure 11.2 shows the total number of islet transplants performed in 2016/17, by centre and type of donor. The same information is presented in Figure 11.3 but this shows the proportion of DBD and DCD transplants performed at each centre. Edinburgh performed the most islet transplants in 2016/17 (17), followed by Oxford (7). Edinburgh, Manchester and Oxford performed DCD transplants as well as DBD transplants. Royal Free did not perform any islet transplants in 2016/
63 Figure 11.4 shows the total number of islet transplants performed in last nine years, by centre and type of donor. Oxford and Newcastle have consistently performed a number of islet transplants each year, while Edinburgh has increased their transplant activity in the last six years. Bristol has performed very few transplants over the nine year period


64 11.2 Demographic characteristics, 1 April March 2017 The sex and age group of patients that received an islet transplant in 2016/17 are shown by centre in Figures 11.5 and 11.6 respectively. Note that all percentages quoted are based only on data where relevant information was available. Overall, 34 patients were transplanted on the islet transplant list, the median age was 48 years and the majority were female 23 (68%)

65 12 Islet outcomes Islet outcomes
66 12.1 Outcome measures for routine islet transplants Key measures of islet outcome include graft survival, annual rate of severe hypoglycaemic events, HbA1c and insulin requirements. This section includes outcomes reported to NHS Blood and Transplant for routine islet transplants between 1 April 2008 and 31 March A Kaplan-Meier survival plot showing one-year graft survival by type of graft is shown in Figure Estimated one-year graft survival for routine only grafts is 79%, 95% confidence interval (CI) (64-88%) and for routine followed by priority grafts is 97%, 95% CI (88-99%). There were statistically significant differences between the two groups, p< The median annual rate of severe hypoglycaemic events prior to transplant (reported as number of events between registration and transplant) was 7 events per year (Interquartile range 0-34), and at one-year post-transplant this had been reduced to no events per year. Of the 91 patients where the number of severe hypoglycaemic events at one-year posttransplant was available, 71 (78%) experienced no severe hypoglycaemic events, 13 (14%) experienced one or two events and 7 (8%) experienced three or more events
67 Figure 12.2 shows the reduction in median HbA1c (mmol/mol) for routine islet transplants. Median HbA1c dropped from 64mmol/mol prior to transplant to 51mmol/mol at one-year post-transplant. Of those 93 patients with HbA1c reported at one-year, 54 (58%) had an HbA1c less than 53mmol/mol
68 Figure 12.3 shows the median reduction in insulin dose per kilo recipient body weight at three-months, six-months and one-year post-transplant. Prior to transplant the median insulin dose is 0.51 units/kg, by three-months the median dose has dropped to 0.27 units/kg and this reduction has been maintained at one-year post-transplant with a median dose of 0.24 units/kg. Following islet transplantation of the 94 patients where information was reported, 29 (31%) achieved insulin independence at some point during their first year post-transplant
69 13 Form return rates Form return rates
70 13.1 Islet form return rates, 1 January 31 December 2016 Form return rates are reported in Table 13.1 for the islet transplant record, three month and 1 year follow up form, along with lifetime follow up (more than 2 years). These include all islet transplants performed between 1 January and 31 December 2016 for the transplant record, and all requests for follow up forms issued in this time period. All transplant forms were returned, whereas only 87% of 3-month follow up forms were returned. Table 13.1 Centre Form return rates following islet transplantation, by centre, 1 January December 2016 Transplant record 3 month followup 12 month follow-up Lifetime followup N % returned N % returned N % returned N % returned Bristol, Southmead Hospital Edinburgh, Royal Infirmary Of Edinburgh London, Kings College Hospital London, The Royal Free Hospital Manchester, Manchester Royal Infirmary Newcastle, Freeman Hospital Oxford, Churchill Hospital Overall
71 APPENDIX Appendix
72 A1 Glossary of terms ABO The most important human blood group system for transplantation is the ABO system. Every human being is of blood group O, A, B, AB, or one of the minor variants of these four groups. ABO blood groups are present on other tissues and, unless special precautions are taken, a blood group A pancreas transplanted to a blood group O patient will be rapidly rejected. Active transplant list When a patient is registered for a transplant, they are registered on what is called the active transplant list. This means that when a donor pancreas becomes available, the patient is included among those who are matched against the donor to determine whether or not the pancreas is suitable for them. It may sometimes be necessary to take a patient off the transplant list, either temporarily or permanently. This may be done, for example, if someone becomes too ill to receive a transplant. The patient is told about the decision to suspend them from the list and is informed whether the suspension is temporary or permanent. If a patient is suspended from the list, they are not included in the matching of any donor pancreases that become available. Calculated Reaction Frequency (crf) For a given patient with detectable HLA antibodies, the proportion of blood group identical donors from a pool of 10,000 and for which they would be HLA compatible is calculated. This percentage of donors is termed the calculated Reaction Frequency (crf), more commonly referred to as the sensitisation level. Patients with no detectable HLA antibodies will have 0 sensitisation (0% crf). Case mix The types of patients treated at a unit for a common condition. This can vary across units depending on the facilities available at the unit as well as the types of people in the catchment area of the unit. The definition of what type of patient a person is depends on the patient characteristics that influence the outcome of the treatment. For example the case mix for patients registered for a pancreas transplant is defined in terms of various factors such as the blood group, tissue type and age of the patient. These factors have an influence on the chance of a patient receiving a transplant. Cold ischaemia time (CIT) The length of time that elapses between a pancreas being removed from the donor to its transplantation into the recipient is called the Cold Ischaemia Time (CIT). Generally, the shorter this time, the more likely the pancreas is to work immediately and the better the long-term outcome. The factors which determine CIT include a) transportation of the pancreas from the retrieval hospital to the hospital where the transplant is performed, b) the need to tissue type the donor and cross-match the donor and potential recipients, c) the occasional necessity of moving the pancreas to another hospital if a transplant cannot go ahead, d) contacting and preparing the recipient for the transplant, and e) access to the operating theatre. Confidence interval (CI) When an estimate of a quantity such as a survival rate is obtained from data, the value of the estimate depends on the set of patients whose data were used. If, by chance, data from a different set of patients had been used, the value of the estimate may have been different. There is therefore some uncertainty linked with any estimate. A confidence
ANNUAL REPORT ON PANCREAS AND ISLET TRANSPLANTATION
 ANNUAL REPORT ON PANCREAS AND ISLET TRANSPLANTATION REPORT FOR 2014/2015 (1 APRIL 2005 31 MARCH 2015) PUBLISHED SEPTEMBER 2015 PRODUCED IN COLLABORATION WITH NHS ENGLAND - 1 - Contents 1 Executive Summary...
The number of patients waiting on the pancreas transplant list fell by 1% during the year, to 224 at 31 March 2017
 6 Pancreas Activity Pancreas Activity Key messages The number of patients waiting on the pancreas transplant list fell by 1% during the year, to 224 at 31 March 2017 The number of pancreas donors after
The number of patients waiting on the pancreas transplant list fell by 7% during the year, to 252 at 31 March 2015
 6 Pancreas Activity Pancreas Activity Key messages The number of patients waiting on the pancreas transplant list fell by 7% during the year, to 252 at 31 March 2015 The number of pancreas donors after
The number of patients registered on the kidney transplant list this year fell by 4% from 5,233 to 5,033
 5 Kidney Activity Kidney Activity Key messages The number of patients registered on the kidney transplant list this year fell by 4% from 5,233 to 5,033 The number of deceased kidney donors increased by
The number of patients registered on the kidney transplant list this year fell by 7% from 5686 to 5275
 5 Kidney Activity Kidney Activity Key messages The number of patients registered on the kidney transplant list this year fell by 7% from 5686 to 5275 The number of deceased kidney donors increased by 7%
The number of patients on the active liver transplant list at 31 March 2017 was 530, a fall of 8% from 2016
 8 Liver Activity Liver Activity Key messages The number of patients on the active liver transplant list at 31 March 2017 was 530, a fall of 8% from 2016 The number of liver donors after brain death increased
TRANSPLANT ACTIVITY IN THE UK
 Activity Report 2010/11 TRANSPLANT ACTIVITY IN THE UK www.nhsbt.nhs.uk PREFACE This report has been produced by Statistics and Clinical Audit, NHS Blood and Transplant. All figures quoted in this report
INTERIM REPORT ON KIDNEY TRANSPLANTATION
 INTERIM REPORT ON KIDNEY TRANSPLANTATION 5 YEAR REPORT (1 OCTOBER 2011 30 SEPTEMBER 2016) PUBLISHED MARCH 2017 PRODUCED IN COLLABORATION WITH NHS ENGLAND Contents 1 Executive Summary... 1 2 Introduction...
This report has been produced by Statistics and Clinical Audit, NHS Blood and Transplant.
 Preface This report has been produced by Statistics and Clinical Audit, NHS Blood and Transplant. All figures quoted in this report are as reported to NHS Blood and Transplant by 20 May 2013 for the UK
This report has been produced by Statistics and Clinical Audit, NHS Blood and Transplant.
 Preface This report has been produced by Statistics and Clinical Audit, NHS Blood and Transplant. All figures quoted in this report are as reported to NHS Blood and Transplant by 17 June 2012 for the UK
Transplant Activity in the UK
 Transplant Activity in the UK 2006-2007 This document has been produced by the Statistics and Audit Directorate. UK Transplant August 2007 Cover pictures: Members of Glamorgan County cricket team help
Vascular Access Audit Report 2012 UK Renal Registry and NHS Kidney Care. Kidney Care. Better Kidney Care for All
 Kidney Care Vascular Access Audit Report 2012 UK Renal Registry and NHS Kidney Care Dr Richard Fluck Mr David Pitcher Mrs Retha Steenkamp Better Kidney Care for All Contents Page 1 Foreword... 2 Acknowledgements...
Organ Donation Activity
 3 Organ Donation Activity Organ Donation Activity Key messages There has been a 11% increase in deceased donors (to 1,574) and a
NHS BLOOD AND TRANSPLANT KIDNEY OFFERING SCHEME WORKING GROUP ENDORSEMENT OF A NEW NATIONAL KIDNEY OFFERING SCHEME
 NHS BLOOD AND TRANSPLANT KIDNEY OFFERING SCHEME WORKING GROUP ENDORSEMENT OF A NEW NATIONAL KIDNEY OFFERING SCHEME INTRODUCTION 1 Three working groups were established to consider whether changes were
Organ Donation and Transplantation. Activity Report 2017/18
 Organ Donation and Transplantation Activity Report 2017/18 Preface This report has been produced by Statistics and Clinical Studies, NHS Blood and Transplant. All figures quoted in this report are as reported
Clinical Oncology UK Workforce Report 2012 Faculty of Clinical Oncology
 www.rcr.ac.uk Clinical Oncology UK Workforce Report 2012 Faculty of Clinical Oncology www.rcr.ac.uk Contents Foreword 3 1. Introduction and objectives 4 2. Census methodology 5 3. UK clinical oncology
United Kingdom Transplant Activity UK Transplant. Every statisticisaperson.
 United Kingdom Transplant Activity 2001 UK Transplant Every statisticisaperson. Cover photograph: Caroline and John Fowler s daughter Aimee, now aged two, shared a donated liver in the first operation
Organ Donation and Transplantation. Activity Report 2015/16
 Organ Donation and Transplantation Activity Report 2015/16 Preface This report has been produced by Statistics and Clinical Studies, NHS Blood and Transplant. All figures quoted in this report are as reported
NHS BLOOD AND TRANSPLANT LIVER ADVISORY GROUP WAITING TIMES AND DEATHS ON THE LIST BY BLOOD GROUP SUMMARY
 NHS BLOOD AND TRANSPLANT LIVER ADVISORY GROUP WAITING TIMES AND DEATHS ON THE LIST BY BLOOD GROUP BACKGROUND SUMMARY 1 Restrictions in the allocation of livers were introduced in 2006 to reverse the increasingly
National Haemoglobinopathy Registry. Annual Report 2017/18
 National Haemoglobinopathy Registry Annual Report 2017/18 National Haemoglobinopathy Registry Annual Report (2017/18) Compiled by Mark Foster MDSAS 3 1 Introduction CHAPTER 1 The 2017/18 Annual Report
Summary of Significant Changes. Policy
 This Policy replaces POL186/2 Copy Number Effective 01/04/14 Summary of Significant Changes Clarification of policy approval process Paragraph 2.2.1 Clarification of Kidney Fast Track Scheme offering criteria
Overview of Organ Donation and Transplantation
 2 Overview of Organ Donation and Transplantation Overview of Organ Donation and Transplantation A summary of organ donation and transplantation activity in the UK during the financial year from April 207
National Haemoglobinopathy Registry. Annual Report 2015/16. mdsas
 National Haemoglobinopathy Registry Annual Report 2015/16 mdsas National Haemoglobinopathy Registry Annual Report (2015/16) 3 1 Introduction CHAPTER 1 This 2015/16 data update follows the same format as
Rishi Pruthi a, Rachel Hilton b, Laura Pankhurst c, Nizam Mamode b, Alex Hudson c, Paul Roderick d, Rommel Ravanan e
 UK Renal Registry 16th Annual Report: Chapter 4 Demography of Patients Waitlisted for Renal Transplantation in the UK: National and Centre-specific Analyses Rishi Pruthi a, Rachel Hilton b, Laura Pankhurst
Manchester Royal Infirmary Renal & Pancreas Transplant Unit / 2011 Activity Annual Report
 Manchester Royal Infirmary Renal & Pancreas Transplant Unit 21 / 211 Activity Annual Report Vicki Bowman Renal Transplant Audit & Data Manager Dr Susan Martin Consultant Clinical Scientist / Transplantation
Manchester Royal Infirmary Renal & Pancreas Transplant Unit / 2012 Activity Annual Report
 Manchester Royal Infirmary Renal & Pancreas Transplant Unit 211 / 212 Activity Annual Report Vicki Bowman Renal Transplant Audit & Data Manager Dr Susan Martin Consultant Clinical Scientist / Transplantation
Vascular access. The KidneyCare Audit
 Vascular access The KidneyCare Audit Renal National Service Framework The challenge of vascular access Standard 3 All children, young people and adults with established renal failure are to have timely
NHS BLOOD AND TRANSPLANT ORGAN DONATION AND TRANSPLANTATION DIRECTORATE PANCREAS ADVISORY GROUP AUDIT OF STANDARD CRITERIA FOR LISTING SUMMARY
 INTRODUCTION NHS BLOOD AND TRANSPLANT ORGAN DONATION AND TRANSPLANTATION DIRECTORATE PANCREAS ADVISORY GROUP AUDIT OF STANDARD CRITERIA FOR LISTING SUMMARY 1 Selection criteria for patients onto the national
Chapter 10: Serum Calcium, Phosphate and Parathyroid Hormone
 Chapter 1: Serum Calcium, Phosphate and Parathyroid Hormone Summary Results for corrected calcium are highly dependent on serum albumin measurement. Units using the BCP method of albumin measurement have
Research Involving RaDaR: Nephrotic Syndrome - NephroS/ NURTuRE Studies. Liz Colby Project Manager, University of Bristol
 Research Involving RaDaR: Nephrotic Syndrome - NephroS/ NURTuRE Studies Liz Colby Project Manager, University of Bristol What is Nephrotic Syndrome? Breakdown of the glomerular filtration barrier Massive
Principal Treatment Centres What do the data say for childhood cancer?
 Principal Treatment Centres What do the data say for childhood cancer? Charles Stiller National Registry of Childhood Tumours (NRCT) Childhood Cancer Research Group (CCRG) Children s Cancer and Leukaemia
Organ Donation and Transplantation data for Black, Asian and Minority Ethnic (BAME) communities. Report for 2017/2018 (1 April March 2018)
 communities. Report for 2017/2018 (1 April March 2018)") Organ Donation and Transplantation data for Black, Asian and Minority Ethnic (BAME) communities Report for 07/0 ( April 0 March 0) CONTENTS EXECUTIVE SUMMARY... INTRODUCTION... ORGAN DONOR REGISTER (ODR)...
Organ Donation and Transplantation data for Black, Asian and Minority Ethnic (BAME) communities Report for 07/0 ( April 0 March 0) CONTENTS EXECUTIVE SUMMARY... INTRODUCTION... ORGAN DONOR REGISTER (ODR)...
Chapter 10: Bone Biochemistry: Serum Phosphate, Calcium, Parathyroid Hormone, Albumin and Aluminium
 Chapter 10: Bone Biochemistry: Serum Phosphate, Calcium, Parathyroid Hormone, Albumin and Aluminium Summary. Although serum phosphate control in dialysis patients is unsatisfactory there is a continuing
Organ Donation and Transplantation data for Black, Asian and Minority Ethnic (BAME) communities. Report for 2016/2017 (1 April March 2017)
 communities. Report for 2016/2017 (1 April March 2017)") Organ Donation and Transplantation data for Black, Asian and Minority Ethnic (BAME) communities Report for 6/7 ( April March 7) CONTENTS EXECUTIVE SUMMARY... INTRODUCTION... ORGAN DONOR REGISTER (ODR)...
Organ Donation and Transplantation data for Black, Asian and Minority Ethnic (BAME) communities Report for 6/7 ( April March 7) CONTENTS EXECUTIVE SUMMARY... INTRODUCTION... ORGAN DONOR REGISTER (ODR)...
Nephron 2016;132(suppl1): DOI: /
: DOI: /") Nephron 2016;132(suppl1):253 278 DOI: 10.1159/000444825 Published online: April 19, 2016 UK Renal Registry 18th Annual Report: Chapter 11 2014 Multisite Dialysis Access Audit in England, Northern Ireland
Nephron 2016;132(suppl1):253 278 DOI: 10.1159/000444825 Published online: April 19, 2016 UK Renal Registry 18th Annual Report: Chapter 11 2014 Multisite Dialysis Access Audit in England, Northern Ireland
PAMPERING THERAPY. FB 12p PamperingTherapy PT/09/2018.indd 1 25/09/ :56
 PAMPERING THERAPY www.lgfb.co.uk FB 12p PamperingTherapy PT/09/2018.indd 1 25/09/2018 13:56 The workshop changed my life around and showed how I could look like the me I used to be, not the me who happens
Manchester Royal Infirmary Renal & Pancreas Transplant Unit / 2010 Activity Annual Report
 Manchester Royal Infirmary Renal & Pancreas Transplant Unit 29 / 21 Activity Annual Report Vicki Bowman Renal Transplant Audit & Data Manager Dr Susan Martin Consultant Clinical Scientist / Transplantation
Anirudh Rao a, David Pitcher a, Richard Fluck b, Mick Kumwenda c
 UK Renal Registry 17th Annual Report: Chapter 1 213 Multisite Dialysis Access Audit in England, Northern Ireland and Wales and 212 PD One Year Follow-up: National and Centre-specific Analyses Anirudh Rao
. Time to transplant listing is dependent on. . In 2003, 9.1% of all prevalent transplant. . Patients with diabetes mellitus are less
 Chapter 5: Joint Analyses with UK Transplant in England and Wales; Access to the Renal Transplant Waiting List, Time to Listing, Diabetic Access to Transplantation and the Influence of Social Deprivation
Outcomes after Elective Repair of Infra-renal Abdominal Aortic Aneurysm. A report from The Vascular Society
 Outcomes after Elective Repair of Infra-renal Abdominal Aortic Aneurysm A report from The Vascular Society March 2012 Contents Contents 1 Foreword 3 Preface 4 Authors 6 Glossary 7 About this report 8 Executive
PARTICULARS, SCHEDULE 2 THE SERVICES, A SERVICE SPECIFICATION. A03/S(HSS)/a Pancreas transplantation service (Adult)
/a Pancreas transplantation service (Adult)") A03/S(HSS)/a NHS STANDARD CONTRACT FOR PANCREAS TRANSPLANTATION SERVICE (ADULT) PARTICULARS, SCHEDULE 2 THE SERVICES, A SERVICE SPECIFICATION Service Specification No. Service Commissioner Lead Provider
A03/S(HSS)/a NHS STANDARD CONTRACT FOR PANCREAS TRANSPLANTATION SERVICE (ADULT) PARTICULARS, SCHEDULE 2 THE SERVICES, A SERVICE SPECIFICATION Service Specification No. Service Commissioner Lead Provider
Registered childcare providers and places in England, 30 September October 2004
 Registered childcare providers and places in England, 30 September 2004. 21 October 2004 Contents: Childcare statistics About this publication Registered childcare providers and places in England, by Ofsted
14 January Dear Endometriosis Centre Lead
 14 January 2017 Dear Endometriosis Centre Lead Thank you for your continued support of the Endometriosis Centres Project. With this letter is the summary of data from all the centres for 2016 as we have
East of Scotland Renal Transplantation Service. Annual Report. The Royal Infirmary of Edinburgh
 East of Scotland Renal Transplantation Service Annual Report The Royal Infirmary of Edinburgh April 1 st 29 to March 31 st 21 November 21 CONTENTS Page Introduction 3-4 Recipient Transplant Co-ordinators
Date Title Type Credits Locality Code. Clinical 2. 3-Jan-17 Advanced Nephrology Course Clinical 29 Oxford
 Date Title Type Credits Locality Code 3-Jan-17 How to perform a range of otological procedures - two centuries of experience Clinical 2 1 Wimpole Street, London, W1G 0AE. 108668 3-Jan-17 Advanced Nephrology
Organ Donation and Transplantation data for Black, Asian and Minority Ethnic (BAME) communities. Report for 2015/2016 (1 April March 2016)
 communities. Report for 2015/2016 (1 April March 2016)") Organ Donation and Transplantation data for Black, Asian and Minority Ethnic (BAME) communities Report for 2015/2016 (1 April 2010 31 March 2016) INTRODUCTION This report provides information related to
Organ Donation and Transplantation data for Black, Asian and Minority Ethnic (BAME) communities Report for 2015/2016 (1 April 2010 31 March 2016) INTRODUCTION This report provides information related to
The optimum time to assess complete clinical response (CR)
") The optimum time to assess complete clinical response (CR) following chemoradiation (CRT) using mitomycin C (MMC) or Cisplatin (CisP) with or without Maintenance CisP/5FU in squamous cell carcinoma of
The optimum time to assess complete clinical response (CR) following chemoradiation (CRT) using mitomycin C (MMC) or Cisplatin (CisP) with or without Maintenance CisP/5FU in squamous cell carcinoma of
Clinical Oncology UK Workforce Census Report 2013 Faculty of Clinical Oncology
 www.rcr.ac.uk Clinical Oncology UK Workforce Census Report 2013 Faculty of Clinical Oncology www.rcr.ac.uk Contents Foreword 3 1. Introduction and methodology 4 2. UK clinical oncology workforce overview
Funding research for the future
 Funding research for the future Dr Helen Compton (helen.compton@nihr.ac.uk) Stakeholder Engagement Manager NIHR, Central Commissioning Facility The future of health and social care depends on today's research
BASIL Trials. Professor Andrew Bradbury. Chief Investigator University of Birmingham, UK
 BASIL Trials Professor Andrew Bradbury Chief Investigator University of Birmingham, UK BASIL-1 Trial 2005 Still the only RCT! NIHR HTA funding 1998 Between 1999 and 2003 452 SLI patients randomised : Bypass
UK Liver Transplant Audit
 November 2012 UK Liver Transplant Audit In patients who received a Liver Transplant between 1 st March 1994 and 31 st March 2012 ANNUAL REPORT Advisory Group for National Specialised Services Prepared
Summary of Significant Changes. Policy
 This Policy replaces POL193/6 Copy Number Effective 13/05/16 Summary of Significant Changes Para 1.3.1.6 - Amendment to donor and recipient age match points to reflect the fact that paediatric recipients
The CREST Trial. Funded by Cancer Research UK and developed by the National Cancer Research Institute
 The CREST Trial A randomised phase III study of stenting as a bridge to surgery in obstructing colorectal cancer. Results of the UK ColoRectal Endoscopic Stenting Trial (CREST). Funded by Cancer Research
The UK Pancreas Allocation Scheme for Whole Organ and Islet Transplantation
 American Journal of Transplantation 2015; 15: 2443 2455 Wiley Periodicals Inc. C Copyright 2015 The American Society of Transplantation and the American Society of Transplant Surgeons doi: 10.1111/ajt.13284
Nephron 2017;137(suppl1): DOI: /
: DOI: /") Nephron 2017;137(suppl1):269 296 DOI: 10.1159/000481374 Published online: September 29, 2017 UK Renal Registry 19th Annual Report: Chapter 12 Multisite Dialysis Access Audit in England, Northern Ireland
Nephron 2017;137(suppl1):269 296 DOI: 10.1159/000481374 Published online: September 29, 2017 UK Renal Registry 19th Annual Report: Chapter 12 Multisite Dialysis Access Audit in England, Northern Ireland
BCIS Audit Returns of Interventional Procedures 2000
 BCIS Audit Returns of Interventional Procedures 2 Southampton, October 21 Mark de Belder BCIS UK National Audit Officer on behalf of Council of the British Cardiovascular Intervention Society UK Intervention
HCPC registered Psychologists in the UK
 HCPC registered Psychologists in the UK Author: Hannah Farndon (Hannah.farndon@bps.org.uk) 1. Introduction This report provides the first information and analysis of UK psychologists registered with the
Update on the National HPB Audit. Richard M Charnley Iain C Cameron
 Update on the National HPB Audit Richard M Charnley Iain C Cameron Initial Steps 2007 - Expressions of interest sought from HPB surgeons by AUGIS Council Series of Meetings Agreed - Audit of HPB cancer
National Peer Review Report: Sarcoma Cancer Services Report 2012/2013
 National Peer Review Programme National Peer Review Report: Sarcoma Cancer Services Report 2012/2013 www.nationalpeerreview.nhs.uk Sarcoma MDT Overall Performance All 15 services reviewed against the 36
lnhs BLOOD AND TRANSPLANT RESEARCH, INNOVATION AND NOVEL TECHNOLOGIES ADVISORY GROUP DCD HEART ACTIVITY
 lnhs BLOOD AND TRANSPLANT RESEARCH, INNOVATION AND NOVEL TECHNOLOGIES ADVISORY GROUP INTRODUCTION DCD HEART ACTIVITY 1 DCD heart retrieval began in February 2015 for a 15 month initial evaluation period
INFORMATION TO SUPPORT THE DEVELOPMENT OF THE LINCOLNSHIRE CANCER STRATEGY
 INFORMATION TO SUPPORT THE DEVELOPMENT OF THE LINCOLNSHIRE CANCER STRATEGY Refreshed March 2013 Ann Ellis, Health Improvement Principal, NHS Lincolnshire Andrew Smith, Information Analyst, NHS Lincolnshire
. The median Hb of prevalent patients on HD was g/l.. 59% of HD patients and 55% of PD patients had Hb
 UK Renal Registry 17th Annual Report: Chapter 7 Haemoglobin, Ferritin and Erythropoietin amongst UK Adult Dialysis Patients in 13: National and -specific Analyses Julie Gilg a, Rebecca Evans a, Anirudh
Nephron 2017;000(suppl0): DOI: /
: DOI: /") Nephron 17;(suppl):165 188 DOI:.1159/444818 Published online: Month??, 17 UK Renal Registry 19th Annual Report: Chapter 7 Haemoglobin, Ferritin and Erythropoietin amongst UK Adult Dialysis Patients in
Nephron 17;(suppl):165 188 DOI:.1159/444818 Published online: Month??, 17 UK Renal Registry 19th Annual Report: Chapter 7 Haemoglobin, Ferritin and Erythropoietin amongst UK Adult Dialysis Patients in
Royal Marden Education & Conference Centre, London Total 4 (2 per day) 3D Echo meeting Nottingham 3
 3D Echo meeting Nottingham 3") 2nd Annual Intensive Exam-Focused Congenital Echocardiography Course (2-3 October 2014) The Draycott Conference Centre, London Total 4 (2 per day) 3rd Annual Intensive Exam Orientated Congenital Echocardiography
2nd Annual Intensive Exam-Focused Congenital Echocardiography Course (2-3 October 2014) The Draycott Conference Centre, London Total 4 (2 per day) 3rd Annual Intensive Exam Orientated Congenital Echocardiography
Nephron 2018;139(suppl1): DOI: /
: DOI: /") Nephron 2018;139(suppl1):253 272 DOI: 10.1159/000490968 Published online: July 11, 2018 UK Renal Registry 20th Annual Report: Chapter 10 2016 Multisite Dialysis Access Audit in England, Northern Ireland
Nephron 2018;139(suppl1):253 272 DOI: 10.1159/000490968 Published online: July 11, 2018 UK Renal Registry 20th Annual Report: Chapter 10 2016 Multisite Dialysis Access Audit in England, Northern Ireland
Deceased Organ Donation SECTION 2
 Deceased Organ Donation SECTION 2 This section summarises organ donation in Australia and New Zealand. Figures reported here include the number of donors per million population; and number of transplant
Using Service Improvement Methodology to improve DCD referral Rates Anne-Marie Hill & Ben Cole
 Using Service Improvement Methodology to improve DCD referral Rates Anne-Marie Hill & Ben Cole Midlands DCD referral rate 1 Walsall Healthcare NHS Trust 2 South Warwickshire NHS Foundation Trust 3 University
Safety of IV iron: facts and folklore. Renal Unit, King s College Hospital, London, UK
 Safety of IV iron: facts and folklore Renal Unit, King s College Hospital, London, UK History of IV iron 1946 Goetsch et al IV infusions of ferric hydroxide toxic reactions severe should only be used
Nephron 2016;132(suppl1): DOI: /
: DOI: /") Nephron 16;132(suppl1):169 194 DOI: 10.1159/000444822 Published online: April 19, 16 UK Renal Registry 18th Annual Report: Chapter 8 Haemoglobin, Ferritin and Erythropoietin amongst UK Adult Dialysis Patients
Nephron 16;132(suppl1):169 194 DOI: 10.1159/000444822 Published online: April 19, 16 UK Renal Registry 18th Annual Report: Chapter 8 Haemoglobin, Ferritin and Erythropoietin amongst UK Adult Dialysis Patients
Impact of the Human Transplantation Act (Wales)
") NHSBT BOARD 28th September 2017 Impact of the Human Transplantation Act (Wales) 1. Status Public 2. Executive Summary This paper summarises organ donation activity and s in Wales since the introduction
NHSBT BOARD 28th September 2017 Impact of the Human Transplantation Act (Wales) 1. Status Public 2. Executive Summary This paper summarises organ donation activity and s in Wales since the introduction
A primary care response to domestic abuse from research to mainstream: the IRIS story. Gene Feder. Domestic abuse summit 2018 London 4 th May 2018
 A primary care response to domestic abuse from research to mainstream: the IRIS story Gene Feder Domestic abuse summit 2018 London 4 th May 2018 Constance 43 year old care worker who had been my patient
Chapter 8: Management of Anaemia in Dialysis Patients
 Chapter 8: Management of Anaemia in Dialysis Patients Donald Richardson, Daniel Ford, Julie Gilg and Andrew J Williams Summary. In the UK, 40% of patients commenced dialysis therapy with a Hb
Overview of Organ Donation
 Chapter 1 Overview of Organ Donation 215 ANZOD Registry Annual Report Data to 31-Dec-214 Contents: Actual Deceased Donors 1 2 Organ Dona on Pathway 1 5 Overview and New Zealand 1 6 Organ Transplants 1
Summary of Significant Changes. Policy
 This Policy replaces POL196/4 Copy Number Effective 14/12/2015 Offering to Group 2 patients Super urgent registrations Timing of fast-track offers Summary of Significant Changes Policy This policy has
NHS BLOOD AND TRANSPLANT MINUTES OF THE THIRTIETH MEETING OF THE KIDNEY ADVISORY GROUP HELD AT A.M. ON MONDAY 5 TH DECEMBER 2016 AT ODT, BRISTOL
 NHS BLOOD AND TRANSPLANT MINUTES OF THE THIRTIETH MEETING OF THE KIDNEY ADVISORY GROUP HELD AT 10.30 A.M. ON MONDAY 5 TH DECEMBER 2016 AT ODT, BRISTOL PRESENT: Prof Chris Watson Ms Lorna Marson Mr John
Organ Donation and Transplantation in Wales
 Organ Donation and Transplantation in Wales How are we doing? Cornea: 119 Lung: 9 Liver: 37 Heart: 12 Kidneys: 127 Pancreas: 4 Small bowel: 0 Number of Transplants in Wales in 2016/17 Report 2016/17 Referrals
Renal Transplant Registry Report 2008
 Renal Transplant Registry Report 28 Contents:. Introduction Page 2. Summary of transplant activity 27-28 Page 2 3. Graft and Patient Survival analysis 989-28 Page 3 4. Acute rejection 989-28 Page 24. Comparison
National Lung Cancer Audit Lung cancer consultant outcomes publication 2016 (for the 2013 audit period)
") Society for Cardiothoracic Surgery in Great Britain and Ireland National Lung Cancer Audit Lung cancer consultant outcomes publication 2016 (for the 2013 audit period) In association with: Lung cancer
Society for Cardiothoracic Surgery in Great Britain and Ireland National Lung Cancer Audit Lung cancer consultant outcomes publication 2016 (for the 2013 audit period) In association with: Lung cancer
Other NCAS Providers. Locality Region Organisation responsible Helpline/Contact number. Barking and Dagenham London Pohwer ICAS
 Other NCAS Providers Locality Region Organisation responsible Helpline/Contact number Barking and Dagenham London Pohwer ICAS 0300 456 2370 Barnet London Pohwer ICAS 0300 456 2370 Barnsley Y&H Barnsley
BASIL Investigators Meeting Vascular Society Manchester 1 December 2016
 BASIL Investigators Meeting Vascular Society Manchester 1 December 2016 BASIL Introduction and Overview Professor Andrew Bradbury Chief Investigator BASIL Trials Overview Severe Limb Ischaemia (SLI) (RP
Chapter 11: Factors which may Influence Cardiovascular Disease Blood Pressure and Serum Cholesterol
 Chapter 11: Factors which may Influence Cardiovascular Disease Blood Pressure and Serum Cholesterol Summary. Many units still fail to return blood pressure data to the Renal Registry.. In England & Wales,
Nephron 2018;139(suppl1): DOI: /
: DOI: /") Nephron 18;139(suppl1):165 1 DOI: 1.1159/4965 Published online: July 11, 18 UK Renal Registry th Annual Report: Chapter 7 Haemoglobin, Ferritin and Erythropoietin in UK Adult Dialysis Patients in 16: National
Nephron 18;139(suppl1):165 1 DOI: 1.1159/4965 Published online: July 11, 18 UK Renal Registry th Annual Report: Chapter 7 Haemoglobin, Ferritin and Erythropoietin in UK Adult Dialysis Patients in 16: National
Eligibility, patient pathway & treatment. Amy Campbell Clinical Trial Coordinator
 Eligibility, patient pathway & treatment Amy Campbell Clinical Trial Coordinator Trial design Eligible patients consenting to OPTIMA 4500 patients 100 UK sites 4 years recruitment Randomisation 2250 2250
New Zealand Kidney Allocation Scheme
 New Zealand Kidney Allocation Scheme The New Zealand Kidney Allocation Scheme (NZKAS) has been developed to ensure that kidney allocation in NZ is performed on an equitable, accountable and transparent
Chapter 1. Organ Donation. in Australia and New Zealand
 Chapter 1 Organ Donation in and New Zealand n and New Zealand donor figures include all donors consented for organ and tissue donation who went to the operating theatre for the purpose of organ or tissue
BUPA ESSENTIAL HEALTH DISCOVER HOW YOUR LIFESTYLE IMPACTS YOUR HEALTH. bupa.co.uk
 BUPA ESSENTIAL HEALTH DISCOVER HOW YOUR LIFESTYLE IMPACTS YOUR HEALTH bupa.co.uk BUPA ESSENTIAL HEALTH BUILDING A PICTURE OF YOUR HEALTH Do you have a busy work and social life, with little time to relax?
Chapter 9 Haemoglobin, ferritin and erythropoietin amongst patients receiving dialysis in the UK in 2007: national and centre-specific analyses
 Haemoglobin, ferritin and erythropoietin amongst patients receiving dialysis in the UK in 2007: national and centre-specific analyses Donald Richardson a, Daniel Ford b, Julie Gilg b and Andrew J Williams
Sentinel Stroke National Audit Programme (SSNAP) Based on stroke patients admitted to hospital for thrombectomy between April 2016 and March 2017
 Based on stroke patients admitted to hospital for thrombectomy between April 2016 and March 2017") Thrombectomy Sentinel Stroke National Audit Programme (SSNAP) Thrombectomy Report for April 2016 - March 2017 National results July 2017 Based on stroke patients admitted to hospital for between April
Thrombectomy Sentinel Stroke National Audit Programme (SSNAP) Thrombectomy Report for April 2016 - March 2017 National results July 2017 Based on stroke patients admitted to hospital for between April
NHS BLOOD AND TRANSPLANT CARDIOTHORACIC ADVISORY GROUP URGENT HEART ALLOCATION SCHEMES 2015/2016 ACTIVITY SUMMARY
 INTRODUCTION NHS BLOOD AND TRANSPLANT CARDIOTHORACIC ADVISORY GROUP URGENT HEART ALLOCATION SCHEMES 2015/2016 ACTIVITY SUMMARY 1 This paper is a review of the usage of the Adult Urgent Heart Allocation
Chapter 6: Transplantation
 Chapter 6: Transplantation Introduction During calendar year 2012, 17,305 kidney transplants, including kidney-alone and kidney plus at least one additional organ, were performed in the United States.
NHS BLOOD AND TRANSPLANT ORGAN DONATION & TRANSPLANTATION DIRECTORATE
 NHS BLOOD AND TRANSPLANT ORGAN DONATION & TRANSPLANTATION DIRECTORATE MINUTES OF THE FIRST MEETING OF THE PAEDIATRIC SUB-GROUP OF THE KIDNEY ADVISORY GROUP HELD ON WEDNESDAY, 22 OCTOBER 2008 IN CONFERENCE
Supplementary appendix
 Supplementary appendix This appendix formed part of the original submission and has been peer reviewed. We post it as supplied by the authors. Supplement to: Cook G, Williams C, Brown JM, et al, on behalf
UK Renal Registry 15th Annual Report: Chapter 9 Centre Variation in Access to Renal Transplantation in the UK ( )
") UK Renal Registry 15th Annual Report: Chapter 9 Centre Variation in Access to Renal Transplantation in the UK (2006 2008) Rishi Pruthi a, Rommel Ravanan b, John O Neill c, Paul Roderick d, Laura Pankhurst
UK Renal Registry 15th Annual Report: Chapter 9 Centre Variation in Access to Renal Transplantation in the UK (2006 2008) Rishi Pruthi a, Rommel Ravanan b, John O Neill c, Paul Roderick d, Laura Pankhurst
Preventing the uptake of smoking by children
 Action on Smoking and Health (ASH) ASLEF Association of Directors of Adult Social Services Association of Pschoanalytic Psychotherapy in the NHS Association of Public Health Observatories Asthma UK Bedfordshire
Quality care. Everywhere? An audit of prostate cancer services in the UK
 Quality care. Everywhere? An audit of prostate cancer services in the UK Foreword Why should a man who lives in Essex receive worse care and support for prostate cancer than a man who comes from Manchester?
Kidney Transplant Activity New Zealand
 Kidney Transplant Activity New Zealand 2017 Calendar Year Author: Nick Cross, Clinical Director National Renal Transplant Service Date: 13 March 2018 Data Collection Data is provided directly to the National
Chapter 10: Factors which may influence cardiovascular disease blood pressure and serum cholesterol
 Chapter 10: Factors which may influence cardiovascular disease blood pressure and serum cholesterol Summary. Blood pressure returns to the Renal Registry continue to be poor from some centres.. In England
U.S. changes in Kidney Allocation
 U.S. changes in Kidney Allocation Match kidneys with longest survival to patients with longest survival No parallel matching for kidneys with lower survival potential Decrease discard of kidneys with lower
NATIONAL POISONS INFORMATION SERVICE. Combined annual report
 NATIONAL POISONS INFORMATION SERVICE Combined annual report 24-5 Poisons enquiries 87 6 6266 NPIS Centres in: Belfast Birmingham Cardiff Edinburgh London Newcastle upon Tyne Associated Centre: National
Population-wide Chronic Kidney Disease Management Reducing the Incidence of Kidney Failure
 Population-wide Chronic Kidney Disease Management Reducing the Incidence of Kidney Failure Dr Hugh Rayner MD FRCP DipMedEd Consultant Nephrologist Heart of England NHS Foundation Trust hughrayner@nhs.net