File name: Supplementary Information Description: Supplementary Figures, Supplementary Table and Supplementary References
|
|
|
- Steven Joseph
- 5 years ago
- Views:
Transcription
1 File name: Supplementary Information Description: Supplementary Figures, Supplementary Table and Supplementary References File name: Supplementary Data 1 Description: Summary datasheets showing the spatial coordinates and the intra-clonal and interclonal Euclidean distances of the labeled cortical interneuron clones in the barcoded datasets by Mayer et al. and Harwell et al. File name: Peer Review File Description:


2 Supplementary Figure 1: Clonally related interneurons reliably form local clusters in the cortex. (a) Dendrograms of multi-cell clones in the left or right cortical hemisphere of the individual barcoded datasets with 1
3 single-cell resolution of clonal identity from Mayer et al. (n=3 brains) 1 and Harwell et al. (n=1 brain) 2. Dendrograms were created by the linkage function according to their Euclidean distances (MATLAB, MathWorks). Numbers and colors indicate the lineal relationship between two or more cells based on the recovered barcodes. Colored lines below the numbers indicate spatially isolated clonal clusters. Colored dots mark a sibling neuron located away from the corresponding clonal cluster. Broken black lines indicate two local clonal clusters occupying the same or nearby space. (b) Quantifications of the average intra-clonal and inter-clonal Euclidean distances of all labeled cortical interneurons in individual brains of the Mayer et al. or Harwell et al. datasets as illustrated in the inset (top). The data are presented as the box and whisker plot with whiskers indicating the minimum and maximum values. The number above the whiskers indicates the total number of intra-clonal or inter-clonal interneuron pairs. The value above the lines indicates the statistical significance (Mann-Whitney t-test). Similar data display is used in the subsequent panel. (c) Quantifications of the average intra-clonal and inter-clonal Euclidean distances of all labeled cortical interneurons in all four brains of the Mayer et al. and Harwell et al. datasets as illustrated in b. Note that the intra-clonal distance is highly significantly shorter than the inter-clonal distances calculated in different ways, suggesting that spatial clustering is a reliable feature of clonally-related interneuron in the cortex. The value above the lines indicates the statistical significance (Mann-Whitney t-test). 2
 Histograms of the inter-clonal and intra-clonal Euclidean distances of all labeled cortical interneuron clones in Mayer et al. and Harwell et al. datasets (n=4 brains). ***, p<0.")
4 Supplementary Figure 2: Spatial clustering of clonally related interneurons is more prominent at the short distance range. (a) Histograms of the inter-clonal and intra-clonal Euclidean distances of all labeled cortical interneuron clones in Mayer et al. and Harwell et al. datasets (n=4 brains). ***, p<0.001 (Kolmogorov-Smirnov test). Red arrow indicates that within m distance range of our electrophysiological experiments, clonally related interneuron pairs (green) are more abundant than non-clonally related interneuron pairs (black). (b) Quantification of the percentage of sparsely labeled interneurons that are definitively clonally related in Mayer et al. at different distance ranges. Note that within 450 m, 67% of labeled interneuron pairs are unequivocally clonally related. The numbers of intra-clonal or inter-clonal interneuron pairs within each distance range are listed in the bar graph. *, p<0.05; ***, p<0.001; N.S., not significant (chi-square test). 3
 Representative sample traces of the responses of EGFPexpressing interneurons arising from the MGE/PoA at E12 to somatic current injections at different postnatal time points.")
5 Supplementary Figure 3: Progressive maturation in membrane properties and synaptic activity of sparsely labeled neocortical interneurons in clusters. (a) Representative sample traces of the responses of EGFPexpressing interneurons arising from the MGE/PoA at E12 to somatic current injections at different postnatal time points. Subthreshold membrane potential oscillations, an early indication of FS interneuron, are shown in the insets. Scale bars: 50 mv and 200 msec. (b) Summary of the resting membrane potential (RMP) at different postnatal time points (P2, ± 1.5 mv, n=22; P4, ± 1.1 mv, n=31; P8, ± 1.1 mv, n=32; P12, ± 1.3 mv, n=32; P16, ± 0.7 mv, n=29; P20, ± 1.1 mv, n=30). Note a progressive hyperpolarization of the RMP as time 4
6 proceeds. Thick green lines indicate mean ± s.e.m.; *, p<0.05; **, p<0.01; N.S., not significant (unpaired t-test). (c) Summary of the maximum firing frequency at different postnatal time points (P2, 21.1 ± 2.1 Hz, n=22; P4, 24.8 ± 2.5 Hz, n=31; P8, 31.1 ± 2.1 Hz, n=32; P12, 34.8 ± 2.0 Hz, n=28; P16, 69.1 ± 6.3 Hz, n=30; P20, 74.1 ± 6.0 Hz, n=30). Note a progressive increase in the maximum firing frequency as time proceeds. Thick green lines indicate mean ± s.e.m.; **, p<0.01; ***, p<0.001 (unpaired t-test). (d) Sample traces of spontaneous postsynaptic currents (spscs) recorded from EGFP-expressing interneurons at different postnatal time points. Scale bars: 20 pa and 1 sec. (e, f) Summary of the frequency (e) (P2, 0.3 ± 0.03 Hz, n=9; P4, 0.3 ± 0.05 Hz, n=9; P8, 0.4 ± 0.1 Hz, n=14; P12, 2.1 ± 0.4 Hz, n=15; P16, 6.1 ± 1.4 Hz, n=11; P20, 6.0 ± 1.3 Hz, n=15) and amplitude (f) (P2, 10.3 ± 0.8 pa, n=9; P4, 11.7 ± 0.8 pa, n=9; P8, 12.3 ± 1.3 pa, n=14; P12, 10.2 ± 0.9 pa, n=15; P16, 10.0 ± 1.0 pa, n=11; P20, 12.7 ± 0.8 pa, n=15) of spscs at different postnatal time points. Note that the frequency of spscs drastically increased but plateaued after P14, whereas the average amplitude of spscs did not change significantly. The data are presented as the box and whisker plot with whiskers indicating the minimum and maximum values. **, p<0.01; ***, p<0.001; N.S., not significant (unpaired t-test). 5
 Quantifications of the resting membrane potential, AP threshold, input resistance, maximal firing frequency, firing frequency adaptation ratio, AP half width, AP rise and delay time constants,")

7 Supplementary Figure 4: Intrinsic membrane and firing properties of recorded neocortical FS and Non-FS interneurons. (a) Schematic diagram of an AP and related analyses. (b) Quantifications of the resting membrane potential, AP threshold, input resistance, maximal firing frequency, firing frequency adaptation ratio, AP half width, AP rise and delay time constants, AHP time from peak, AHP amplitude of the recorded FS (n=243) and Non-FS (n=292) interneurons ( P14). Note that FS interneurons exhibited significantly higher AP threshold, AHP amplitude, and maximal firing frequency, but smaller input resistance, spike frequency adaptation, AP half-width, AP rise and decay time constants, and AHP time from peak, than non-fs interneurons. Individual dots and squares represent individual recorded interneurons. Thick red lines indicate mean ± s.e.m.; ***, p<0.001; N.S., not significant (Mann- Whitney t-test). 6
 Confocal images of a pair of sparsely labeled EGFP-expressing interneurons (green, 1 and 2, broken lines and arrowheads) in cluster labeled at E12, examined by dual whole-cell patch clamp")
 Morphological reconstruction of the two recorded sparsely labeled interneurons in a.")
8 Supplementary Figure 5: Electrical synapse formation between sparsely labeled FS interneurons in clusters. (a, b) Confocal images of a pair of sparsely labeled EGFP-expressing interneurons (green, 1 and 2, broken lines and arrowheads) in cluster labeled at E12, examined by dual whole-cell patch clamp recordings at P14 and stained with DAPI (blue). Alexa 568 hydrazide (red) was included in the recording pipettes to confirm the identity of the recorded neurons. The wavy line indicates electrical coupling. Scale bar: 50 m. (c) Morphological reconstruction of the two recorded sparsely labeled interneurons in a. (d) Firing patterns of the two sparsely labeled interneurons in a. Note that both cells are FS. Scale bars: 50 mv and 200 msec. (e) Dual whole-cell recordings of the two sparsely labeled interneurons in a. Brief and long duration depolarizing and hyperpolarizing current injections (gray) in one of the two sparsely labeled interneurons (driver; red) led to simultaneous depolarization or hyperpolarization of the 7
9 other labeled interneuron (receiver; blue, arrowheads), indicating the electrical coupling of the two sparsely labeled interneurons in cluster. Scale bars: 1,200 pa (gray), 50 mv (red), 5 mv (blue), and 200 msec. 8

 in cluster by in utero intraventricular RCAS injection at E12 and")
10 Supplementary Figure 6: Chemical synapse formation between sparsely labeled neocortical interneurons in clusters. (a) Confocal image of a pair of sparsely labeled EGFP-expressing interneurons (broken lines) in cluster by in utero intraventricular RCAS injection at E12 and examined by dual whole-cell patch clamp recordings at P22. 9
11 Alexa 568 hydrazide (red) was included in the recording pipettes to confirm the identity of the recorded neurons. Scale bar: 50 m. (b) Morphological reconstruction of the two recorded sparsely labeled interneurons in a. (c) Firing patterns of the two recorded sparsely labeled interneurons in a responding to somatic current injections. Note that cell 1 is FS and cell 2 is Non-FS. Scale bars: 50 mv and 400 msec. (d) Confocal images of the two sparsely labeled interneurons expressing EGFP (green, 1 and 2, arrowheads) in a filled with Alexa 568 hydrazide (red) and stained for PV (blue) and SST (white). High magnification images of the cell bodies (broken lines) are shown in the insets. The bar-headed line indicates the chemical synaptic connection. Note that cell 1 is PV-positive whereas cell 2 is SST-positive. Scale bar: 50 m. (e) Dual whole-cell recordings of the two sparsely labeled interneurons in a. Brief and long duration depolarizing currents (gray) were injected sequentially into one of the two sparsely labeled interneurons (presynaptic, red) to trigger action potentials and the postsynaptic responses were monitored in the other labeled interneuron (postsynaptic, green) under current-clamp mode. Note that action potentials in cell 2 reliably elicited postsynaptic responses in cell 1 (arrows) with a brief delay (broken lines). A similar panel layout is used in subsequent figures. Scale bars: 1,200 pa (gray), 40 mv (red), 0.5 mv (green), and 200 msec; 1,200 pa (gray), 50 mv (red), 0.2 mv (green), and 10 msec (insets). (f) Postsynaptic responses in cell 1 recorded at -70 mv and -20 mv under voltage-clamp mode. Note that the responses switch from inward to outward, consistent with the reversal potential (-35 mv) of the postsynaptic response. Scale bars: 20 pa and 20 msec. (g) Blockade of postsynaptic responses by the GABA-A receptor antagonist bicuculline (Bic, 100 M). Scale bars: 50 mv (red), 20 pa (black), and 20 msec. (h) Summary of the frequency of chemical synapses between sparsely labeled interneuron pairs in clusters after P14. The doubled bar-headed line represents both unidirectional and bidirectional chemical synaptic connections. The numbers of the recorded pairs are listed in the bar graph. Similar display is used in the subsequent Figures. 10
 Confocal images of a pair of sparsely labeled EGFP-expressing interneurons (green, 1 and 2, broken lines and arrowheads) in cluster by in utero RCAS injection at E12, examined by dual")

12 Supplementary Figure 7: Simultaneous electrical and chemical synapse formation between sparsely labeled neocortical interneurons in clusters. (a, b) Confocal images of a pair of sparsely labeled EGFP-expressing interneurons (green, 1 and 2, broken lines and arrowheads) in cluster by in utero RCAS injection at E12, examined by dual whole-cell patch clamp recordings at P15, and stained with DAPI (blue). Alexa 568 hydrazide (red) was included in the recording pipettes to confirm the identity of the recorded neurons. The wavy line indicates electrical coupling and the double bar-headed line indicates bidirectional chemical synaptic connections. Scale bar: 50 µm. (c) Morphological reconstruction of the two recorded labeled interneurons in a. (d) Sample traces of the membrane potentials or currents of the two labeled interneurons in a in response to brief and extended depolarizing and hyperpolarizing current injections (gray) under current-clamp (IC, green) and voltage-clamp (VC, blue) modes. Note that depolarization and hyperpolarization of one of the two EGFP-expressing labeled interneurons (red) led to 11
13 simultaneous depolarization or hyperpolarization of the other EGFP-expressing labeled interneuron (green and blue), suggesting their electrical coupling. Scale bars: 1,200 pa (gray), 50 mv (red), 3 mv (green), 30 pa (blue), and 200 msec. (e) Sample traces of the postsynaptic currents of the postsynaptic interneurons recorded at -70 mv (green) or -20 mv (blue) triggered by action potentials in the presynaptic interneuron (gray). Note that the postsynaptic responses become biphasic (arrowheads and arrows) at -20 mv, indicating the co-existence of both electrical and inhibitory chemical synapses. Scale bars: 1,200 pa (gray), 50 mv (red), 50 pa (green), 20 pa (blue), and 20 msec. 12
 Quantification of the percentage of sparsely (n=6 hemispheres) or densely (n=4 hemispheres) labeled interneurons by low- or high-titer RCAS in")
 Quantification of the percentage of sparsely (n=6 hemispheres) or densely (n=4 hemispheres) labeled interneurons by low- or high-titer RCAS in")
14 Supplementary Figure 8: Similar relative regional and layer distribution of sparsely or densely labeled interneurons originating from the MGE/PoA. (a) Quantification of the percentage of sparsely (n=6 hemispheres) or densely (n=4 hemispheres) labeled interneurons by low- or high-titer RCAS in different regions of the forebrain. N. S., not significant (unpaired t-test). (b) Quantification of the percentage of sparsely (n=6 hemispheres) or densely (n=4 hemispheres) labeled interneurons by low- or high-titer RCAS in different layers of the SCX and VCX. N. S., not significant (unpaired t-test). 13
15 14
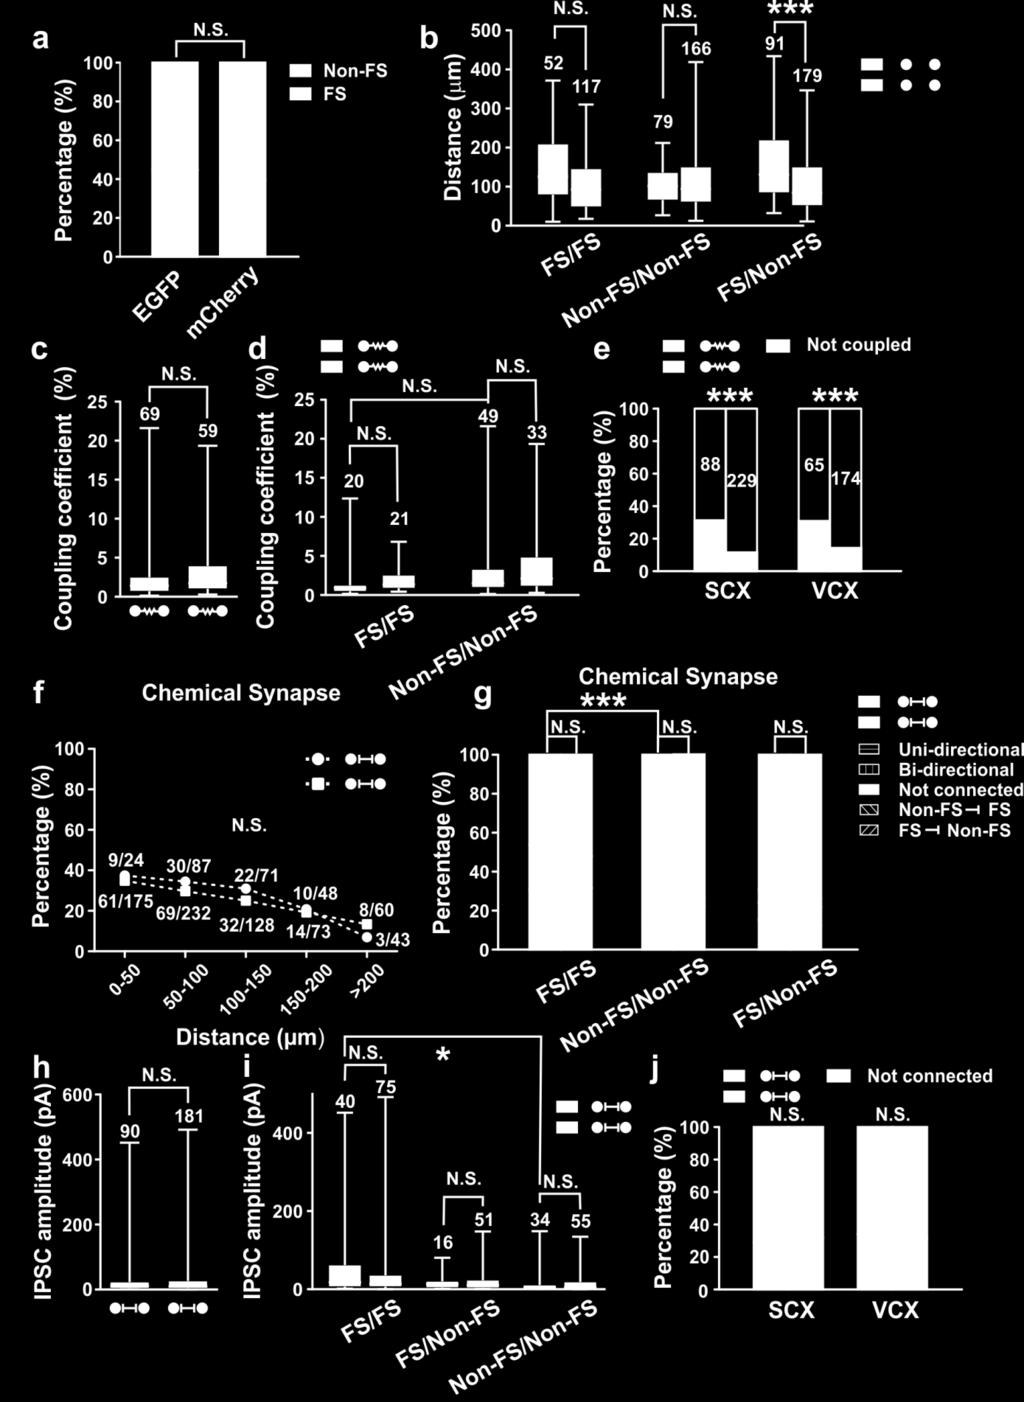
16 Supplementary Figure 9: Properties of electrical coupling and chemical synaptic connection between sparsely labeled neocortical interneurons in clusters. (a) Percentage of FS and Non-FS subtypes among recorded EGFPand mcherry-expressing interneurons arising from the MGE/PoA after P14. The numbers of interneurons are listed in the bar graph. N.S., not significant (chi-square test). (b) Distances between the cell bodies of sparsely labeled (green) or non-clonally related (orange) neocortical interneuron pairs with regard to their subtypes after P14. The data are presented as the box and whisker plot with whiskers indicating the minimum and maximum values. The numbers of recorded pairs are listed above each whisker plot. ***, p<0.001; N.S., not significant (unpaired t-test). (c) Summary of the coupling coefficient between sparsely labeled (2.2±0.3%, n=69) and non-clonally related (2.9 ± 0.3%, n=59) neocortical interneurons. The data are presented as the box and whisker plot with whiskers indicating the minimum and maximum values. N.S., not significant (unpaired t-test). (d) Summary of the coupling coefficient between different subtypes. The data are presented as the box and whisker plot with whiskers indicating the minimum and maximum values. N.S., not significant (unpaired t-test). (e) Summary of the frequency of electrical coupling between sparsely labeled and non-clonally related interneurons in the SCX and VCX. ***, p<0.001; **, p<0.01 (chi-square test). (f) Summary of the frequency of chemical synaptic connectivity between sparsely labeled (green) or non-clonally related (orange) neocortical interneuron pairs with regard to the inter-soma distance after P7. N.S., not significant (chi-square test). (g) Summary of the frequency of chemical synaptic connectivity between sparsely labeled (green) or non-clonally related (orange) neocortical interneurons with regard to their subtypes after P14. Note the absence of preferential chemical synaptic connectivity between sparsely labeled interneurons and the significantly higher chemical synaptic connectivity between FS/FS pairs than Non-FS/Non-FS pairs. ***, p<0.001; N.S., not significant (chi-square test). (h) Summary of the chemical connection strength between sparsely labeled and non-clonally related neocortical interneurons. The data are presented as the box and whisker plot with whiskers indicating the minimum and maximum values. N.S., not significant. (i) Summary of the chemical connection strength between different subtypes. The data are presented as the box and whisker plot with whiskers indicating the minimum and maximum values. *, p<0.05; N.S., not significant. (unpaired t-test). (j) Summary of the frequency of chemical synaptic connectivity between sparsely labeled and non-clonally related interneurons in the SCX and VCX. N.S., not significant (chi-square test). 15
17 16
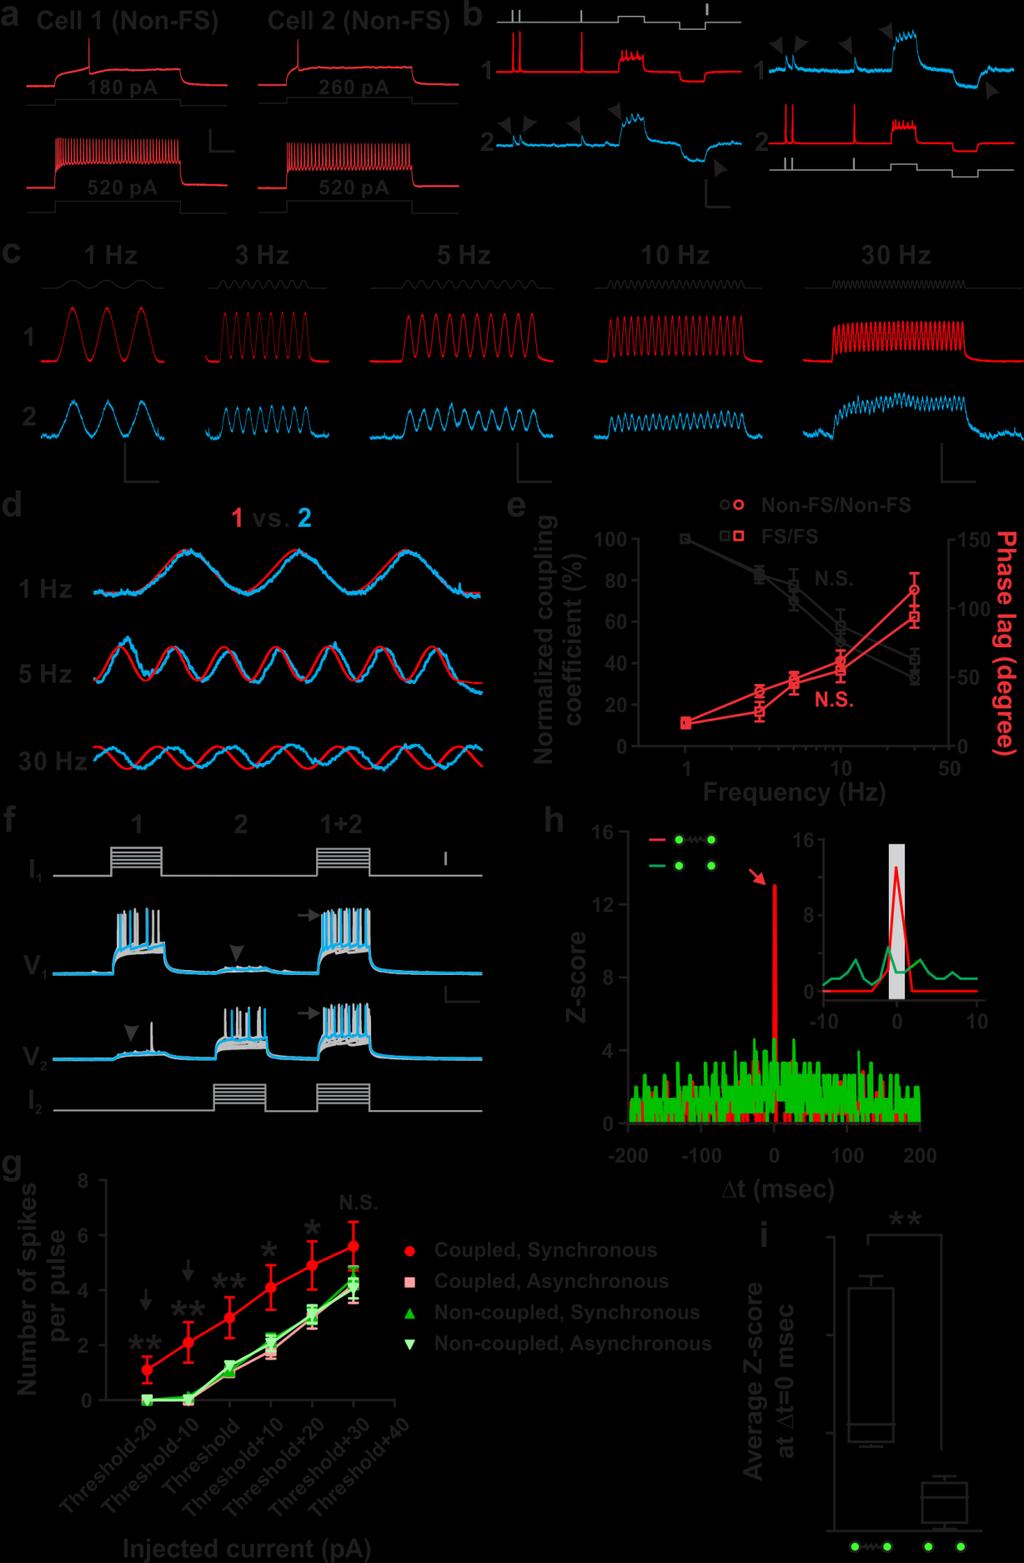
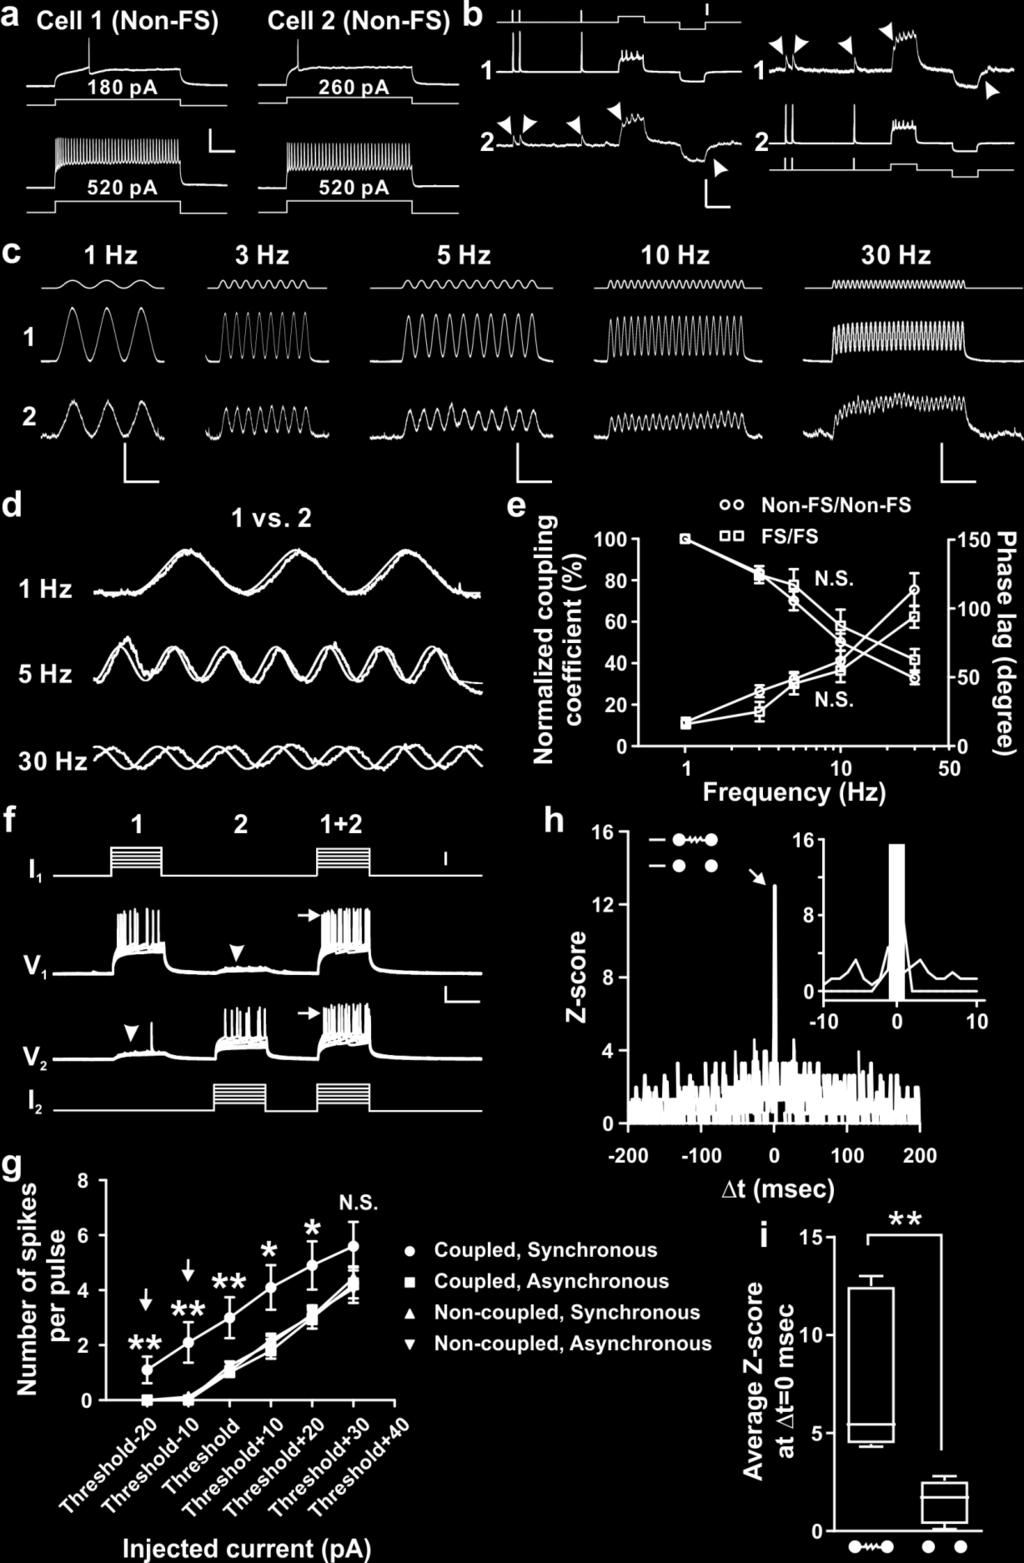
18 Supplementary Figure 10: Frequency-dependent signal transmission through electrical coupling between sparsely labeled neocortical interneurons in clusters promotes action potential generation and synchronous firing. (a) Firing patterns of two sparsely labeled neocortical interneurons in clusters, indicating that both are Non- FS. Scale bars: 50 mv and 200 msec. (b) Dual whole-cell recordings of the two sparsely labeled neocortical interneurons in a. Depolarizing and hyperpolarizing current injections (gray traces, scale bar, 600 pa) in one of the two sparsely labeled interneurons (driver, red) led to simultaneous depolarization or hyperpolarization of the other labeled interneuron (receiver, arrowheads, blue), indicating their electrical coupling. Scale bars: 100 mv (red), 5 mv (blue) and 200 msec. (c) Sample traces of the membrane potential oscillations (blue, receiver 2) produced in the electrically coupled, sparsely labeled interneurons in clusters upon injection of various frequency sine wave currents (black) into one of them (red, driver 1). Scale bars: 20 mv (red), 1.5 mv (blue) and 1 sec (1 and 3 Hz); 20 mv (red), 1.5 mv (blue) and 500 msec (5 and 10 Hz); 20 mv (red), 0.75 mv (blue) and 250 msec (30 Hz). (e) Normalized traces of the membrane potential oscillations between the driver (red) and receiver (blue) interneurons. (e) Frequency dependence of sine wave currents transmitted through electrical synapses of FS/FS pairs (square, n=5) and Non-FS/Non-FS pairs (circle, n=10). Black traces indicate the normalized coupling coefficient and red traces indicate the phase lag between the membrane potential oscillations. Note that as the frequency increases, the coupling coefficient decreases and the phase lag increases. Data are presented as mean±s.e.m. N.S., not significant (unpaired t-test). (f) Sample traces of synchronous (1+2) or asynchronous (1 or 2) injection of subthreshold and suprathreshold current pulses (gray) into electrically coupled, sparsely labeled neocortical interneurons in clusters. Arrowheads indicate voltage deflection due to electrical transmission. Note that synchronous injection, but not asynchronous injection, results in more action potential generation (arrows). Scale bars: 50 pa (gray), 20 mv (black), and 200 msec. (g) Summary of the firing rate in electrically coupled (n=10) or non-coupled (n=16) sparsely labeled interneurons in clusters responding to synchronous or asynchronous current injections. Data are presented as mean±s.e.m. *, p<0.05; **, p<0.01 (unpaired t-test). (h) Normalized cross-correlogram (Z-score) for an electrically coupled or a non-coupled sparsely labeled interneuron pair responding to synchronous current injections. Bin size is 1 msec. Note that the frequency of events is significantly increased around 0 msec (red arrow and inset) for electrically coupled pairs, but not for non-coupled pairs, suggesting that the preferential coupling facilitates AP generation and synchronous firing. The gray region in the inset corresponds to 1 msec Δt 1 msec. (i) Average Z score at Δt = 0 msec for electrically coupled (n=6) or non-coupled (n=8) sparsely labeled interneurons in clusters responding to synchronous current injections. The data are presented as the box and whisker plot with whiskers indicating the minimum and maximum values. **, p<0.01 (unpaired t-test). 17
19 Supplementary Table 1: Summary table showing the intrinsic membrane and firing properties of the recorded FS and Non-FS interneurons in the neocortex. Rest Membrane Potential (mv) FS (n= 243) Non-FS ( n= 292) p-value ( Mann-Whitney t-test) p-value significance ± ± not significant Input Resistance (MΩ) ± ± *** Action potential (AP) Threshold (mv) ± ± *** Half width (msec) 1.1 ± ± *** Rise tau (msec) 0.9 ± ± *** Decay tau (msec) 3.3 ± ± *** Maximal firing frequency (Hz) (1 sec) 1 st 100 msec maximal firing frequency (Hz) Firing frequency adaption ratio Afterhyperpolarization (AHP) 98.7 ± ± *** ± ± *** 1.7 ± ± *** Time from peak (msec) 3.6 ± ± *** Amplitude (mv) 16.6 ± ± *** 18
20 References 1. Mayer, C., et al. Clonally Related Forebrain Interneurons Disperse Broadly across Both Functional Areas and Structural Boundaries. Neuron 87, (2015). 2. Harwell, C.C., et al. Wide Dispersion and Diversity of Clonally Related Inhibitory Interneurons. Neuron 87, (2015). 19
Nature Methods: doi: /nmeth Supplementary Figure 1. Activity in turtle dorsal cortex is sparse.
 Supplementary Figure 1 Activity in turtle dorsal cortex is sparse. a. Probability distribution of firing rates across the population (notice log scale) in our data. The range of firing rates is wide but
Supplementary figure 1: LII/III GIN-cells show morphological characteristics of MC
 1 2 1 3 Supplementary figure 1: LII/III GIN-cells show morphological characteristics of MC 4 5 6 7 (a) Reconstructions of LII/III GIN-cells with somato-dendritic compartments in orange and axonal arborizations
SUPPLEMENTARY INFORMATION. Supplementary Figure 1
 SUPPLEMENTARY INFORMATION Supplementary Figure 1 The supralinear events evoked in CA3 pyramidal cells fulfill the criteria for NMDA spikes, exhibiting a threshold, sensitivity to NMDAR blockade, and all-or-none
Nature Neuroscience: doi: /nn Supplementary Figure 1. MADM labeling of thalamic clones.
 Supplementary Figure 1 MADM labeling of thalamic clones. (a) Confocal images of an E12 Nestin-CreERT2;Ai9-tdTomato brain treated with TM at E10 and stained for BLBP (green), a radial glial progenitor-specific
Astrocyte signaling controls spike timing-dependent depression at neocortical synapses
 Supplementary Information Astrocyte signaling controls spike timing-dependent depression at neocortical synapses Rogier Min and Thomas Nevian Department of Physiology, University of Berne, Bern, Switzerland
SUPPLEMENTARY INFORMATION
 SUPPLEMENTARY INFORMATION doi:10.1038/nature11306 Supplementary Figures Supplementary Figure 1. Basic characterization of GFP+ RGLs in the dentate gyrus of adult nestin-gfp mice. a, Sample confocal images
Dep. Control Time (min)
") aa Control Dep. RP 1s 1 mv 2s 1 mv b % potentiation of IPSP 2 15 1 5 Dep. * 1 2 3 4 Time (min) Supplementary Figure 1. Rebound potentiation of IPSPs in PCs. a, IPSPs recorded with a K + gluconate pipette
aa Control Dep. RP 1s 1 mv 2s 1 mv b % potentiation of IPSP 2 15 1 5 Dep. * 1 2 3 4 Time (min) Supplementary Figure 1. Rebound potentiation of IPSPs in PCs. a, IPSPs recorded with a K + gluconate pipette
Unique functional properties of somatostatin-expressing GABAergic neurons in mouse barrel cortex
 Supplementary Information Unique functional properties of somatostatin-expressing GABAergic neurons in mouse barrel cortex Luc Gentet, Yves Kremer, Hiroki Taniguchi, Josh Huang, Jochen Staiger and Carl
Ivy/Neurogliaform Interneurons Coordinate Activity in the Neurogenic Niche
 Ivy/Neurogliaform Interneurons Coordinate Activity in the Neurogenic Niche Sean J. Markwardt, Cristina V. Dieni, Jacques I. Wadiche & Linda Overstreet-Wadiche Supplementary Methods. Animals We used hemizygous
Ube3a is required for experience-dependent maturation of the neocortex
 Ube3a is required for experience-dependent maturation of the neocortex Koji Yashiro, Thorfinn T. Riday, Kathryn H. Condon, Adam C. Roberts, Danilo R. Bernardo, Rohit Prakash, Richard J. Weinberg, Michael
Wenqin Hu, Cuiping Tian, Tun Li, Mingpo Yang, Han Hou & Yousheng Shu
 Distinct contributions of Na v 1.6 and Na v 1.2 in action potential initiation and backpropagation Wenqin Hu, Cuiping Tian, Tun Li, Mingpo Yang, Han Hou & Yousheng Shu Supplementary figure and legend Supplementary
Supplementary Figure 1. GABA depolarizes the majority of immature neurons in the
 Supplementary Figure 1. GABA depolarizes the majority of immature neurons in the upper cortical layers at P3 4 in vivo. (a b) Cell-attached current-clamp recordings illustrate responses to puff-applied
Nature Neuroscience: doi: /nn Supplementary Figure 1. Trial structure for go/no-go behavior
 Supplementary Figure 1 Trial structure for go/no-go behavior a, Overall timeline of experiments. Day 1: A1 mapping, injection of AAV1-SYN-GCAMP6s, cranial window and headpost implantation. Water restriction
Supplementary Figure 1
 Supplementary Figure 1 Localization of virus injections. (a) Schematic showing the approximate center of AAV-DIO-ChR2-YFP injection sites in the NAc of Dyn-cre mice (n=8 mice, 16 injections; caudate/putamen,
Supplementary Figure 1
 8w Pia II/III IV V VI PV EYFP EYFP PV EYFP PV d PV EYFP Supplementary Figure a Spike probability x - PV-Cre d Spike probability x - RS RS b e Spike probability Spike probability.6......8..... FS FS c f
Supplementary Figure 1. ACE robotic platform. A. Overview of the rig setup showing major hardware components of ACE (Automatic single Cell
 2 Supplementary Figure 1. ACE robotic platform. A. Overview of the rig setup showing major hardware components of ACE (Automatic single Cell Experimenter) including the MultiClamp 700B, Digidata 1440A,
Desynchronization of Neocortical Networks by Asynchronous Release of GABA at Autaptic and Synaptic Contacts from Fast-Spiking Interneurons
 Desynchronization of Neocortical Networks by Asynchronous Release of GABA at Autaptic and Synaptic Contacts from Fast-Spiking Interneurons Frédéric Manseau 1, Silvia Marinelli 1, Pablo Méndez 1, Beat Schwaller
Supplementary Figure 1 Information on transgenic mouse models and their recording and optogenetic equipment. (a) 108 (b-c) (d) (e) (f) (g)
 108 (b-c) (d) (e) (f) (g)") Supplementary Figure 1 Information on transgenic mouse models and their recording and optogenetic equipment. (a) In four mice, cre-dependent expression of the hyperpolarizing opsin Arch in pyramidal cells
Supplementary Figure 1 Information on transgenic mouse models and their recording and optogenetic equipment. (a) In four mice, cre-dependent expression of the hyperpolarizing opsin Arch in pyramidal cells
Intro. Comp. NeuroSci. Ch. 9 October 4, The threshold and channel memory
 9.7.4 The threshold and channel memory The action potential has a threshold. In figure the area around threshold is expanded (rectangle). A current injection that does not reach the threshold does not
Supplementary Figure 1
 Supplementary Figure 1 Arcuate ChIEF-tdTomato neurons expressed TH These micrographs show that TH-Cre-ChIEF-tdTomato (magenta), expressed by AAV in a TH-Cre mouse, were immunostained with TH (green) in
Nature Neuroscience: doi: /nn Supplementary Figure 1. Diverse anorexigenic signals induce c-fos expression in CEl PKC-δ + neurons
 Supplementary Figure 1 Diverse anorexigenic signals induce c-fos expression in CEl PKC-δ + neurons a-c. Quantification of CEl c-fos expression in mice intraperitoneal injected with anorexigenic drugs (a),
Theta sequences are essential for internally generated hippocampal firing fields.
 Theta sequences are essential for internally generated hippocampal firing fields. Yingxue Wang, Sandro Romani, Brian Lustig, Anthony Leonardo, Eva Pastalkova Supplementary Materials Supplementary Modeling
Short- and long-lasting consequences of in vivo nicotine treatment
 Short- and long-lasting consequences of in vivo nicotine treatment on hippocampal excitability Rachel E. Penton, Michael W. Quick, Robin A. J. Lester Supplementary Figure 1. Histogram showing the maximal
SUPPLEMENTARY INFORMATION
 doi:10.1038/nature10776 Supplementary Information 1: Influence of inhibition among blns on STDP of KC-bLN synapses (simulations and schematics). Unconstrained STDP drives network activity to saturation
Nature Neuroscience: doi: /nn Supplementary Figure 1
 Supplementary Figure 1 Atlas representations of the midcingulate (MCC) region targeted in this study compared against the anterior cingulate (ACC) region commonly reported. Coronal sections are shown on
Nature Neuroscience: doi: /nn Supplementary Figure 1. Distribution of starter cells for RV-mediated retrograde tracing.
 Supplementary Figure 1 Distribution of starter cells for RV-mediated retrograde tracing. Parcellation of cortical areas is based on Allen Mouse Brain Atlas and drawn to scale. Thick white curves, outlines
Nature Neuroscience: doi: /nn Supplementary Figure 1
 Supplementary Figure 1 Bidirectional optogenetic modulation of the tonic activity of CEA PKCδ + neurons in vitro. a, Top, Cell-attached voltage recording illustrating the blue light-induced increase in
Supplementary Information
 Supplementary Information D-Serine regulates cerebellar LTD and motor coordination through the 2 glutamate receptor Wataru Kakegawa, Yurika Miyoshi, Kenji Hamase, Shinji Matsuda, Keiko Matsuda, Kazuhisa
Supporting Information
 ATP from synaptic terminals and astrocytes regulates NMDA receptors and synaptic plasticity through PSD- 95 multi- protein complex U.Lalo, O.Palygin, A.Verkhratsky, S.G.N. Grant and Y. Pankratov Supporting
Cholinergic Activation of M2 Receptors Leads to Context- Dependent Modulation of Feedforward Inhibition in the Visual Thalamus
 Cholinergic Activation of M2 Receptors Leads to Context- Dependent Modulation of Feedforward Inhibition in the Visual Thalamus Miklos Antal., Claudio Acuna-Goycolea., R. Todd Pressler, Dawn M. Blitz, Wade
Bursting dynamics in the brain. Jaeseung Jeong, Department of Biosystems, KAIST
 Bursting dynamics in the brain Jaeseung Jeong, Department of Biosystems, KAIST Tonic and phasic activity A neuron is said to exhibit a tonic activity when it fires a series of single action potentials
Supplementary Information. Errors in the measurement of voltage activated ion channels. in cell attached patch clamp recordings
 Supplementary Information Errors in the measurement of voltage activated ion channels in cell attached patch clamp recordings Stephen R. Williams 1,2 and Christian Wozny 2 1 Queensland Brain Institute,
Resonant synchronization of heterogeneous inhibitory networks
 Cerebellar oscillations: Anesthetized rats Transgenic animals Recurrent model Review of literature: γ Network resonance Life simulations Resonance frequency Conclusion Resonant synchronization of heterogeneous
Supplementary Figure 1: Kv7 currents in neonatal CA1 neurons measured with the classic M- current voltage-clamp protocol.
 Supplementary Figures 1-11 Supplementary Figure 1: Kv7 currents in neonatal CA1 neurons measured with the classic M- current voltage-clamp protocol. (a), Voltage-clamp recordings from CA1 pyramidal neurons
SUPPLEMENTARY INFORMATION
 doi:1.138/nature1139 a d Whisker angle (deg) Whisking repeatability Control Muscimol.4.3.2.1 -.1 8 4-4 1 2 3 4 Performance (d') Pole 8 4-4 1 2 3 4 5 Time (s) b Mean protraction angle (deg) e Hit rate (p
Supplementary Figure 1. Basic properties of compound EPSPs at
 Supplementary Figure 1. Basic properties of compound EPSPs at hippocampal CA3 CA3 cell synapses. (a) EPSPs were evoked by extracellular stimulation of the recurrent collaterals and pharmacologically isolated
SUPPLEMENTARY INFORMATION
 Supplementary Figure 1. Normal AMPAR-mediated fepsp input-output curve in CA3-Psen cdko mice. Input-output curves, which are plotted initial slopes of the evoked fepsp as function of the amplitude of the
An acetylcholine-activated microcircuit drives temporal dynamics of cortical activity
 An acetylcholine-activated microcircuit drives temporal dynamics of cortical activity Naiyan Chen, Hiroki Sugihara, & Mriganka Sur Nature America, nc. All rights reserved. Cholinergic modulation of cortex
Supralinear increase of recurrent inhibition during sparse activity in the somatosensory cortex
 Supralinear increase of recurrent inhibition during sparse activity in the somatosensory cortex Christoph Kapfer 1,2, Lindsey L Glickfeld 1,3, Bassam V Atallah 1,3 & Massimo Scanziani 1 The balance between
What do you notice? Edited from
 What do you notice? Edited from https://www.youtube.com/watch?v=ffayobzdtc8&t=83s How can a one brain region increase the likelihood of eliciting a spike in another brain region? Communication through
Astrocytes gate Hebbian synaptic plasticity in the striatum
 Received 13 Dec 215 Accepted 4 Nov 216 Published 2 Dec 216 Astrocytes gate Hebbian synaptic plasticity in the striatum Silvana Valtcheva 1,2 & Laurent Venance 1,2 DOI: 1.138/ncomms13845 OPEN Astrocytes,
Increased serotonin transporter expression reduces fear and recruitment of. parvalbumin interneurons of the amygdala
 Increased serotonin transporter expression reduces fear and recruitment of parvalbumin interneurons of the amygdala Marco Bocchio, Giulia Fucsina, Lydia Oikonomidis, Stephen B McHugh, David M Bannerman,
Nature Neuroscience: doi: /nn Supplementary Figure 1
 Supplementary Figure 1 Relative expression of K IR2.1 transcript to enos was reduced 29-fold in capillaries from knockout animals. Relative expression of K IR2.1 transcript to enos was reduced 29-fold
Supplementary Figure 1. SDS-FRL localization of CB 1 in the distal CA3 area of the rat hippocampus. (a-d) Axon terminals (t) in stratum pyramidale
 Axon terminals (t) in stratum pyramidale") Supplementary Figure 1. SDS-FRL localization of CB 1 in the distal CA3 area of the rat hippocampus. (a-d) Axon terminals (t) in stratum pyramidale (b) show stronger immunolabeling for CB 1 than those in
Supplementary Figure 1. SDS-FRL localization of CB 1 in the distal CA3 area of the rat hippocampus. (a-d) Axon terminals (t) in stratum pyramidale (b) show stronger immunolabeling for CB 1 than those in
Neuroscience 201A (2016) - Problems in Synaptic Physiology
 - Problems in Synaptic Physiology") Question 1: The record below in A shows an EPSC recorded from a cerebellar granule cell following stimulation (at the gap in the record) of a mossy fiber input. These responses are, then, evoked by stimulation.
Question 1: The record below in A shows an EPSC recorded from a cerebellar granule cell following stimulation (at the gap in the record) of a mossy fiber input. These responses are, then, evoked by stimulation.
Microcircuitry coordination of cortical motor information in self-initiation of voluntary movements
 Y. Isomura et al. 1 Microcircuitry coordination of cortical motor information in self-initiation of voluntary movements Yoshikazu Isomura, Rie Harukuni, Takashi Takekawa, Hidenori Aizawa & Tomoki Fukai
Is action potential threshold lowest in the axon?
 Supplementary information to: Is action potential threshold lowest in the axon? Maarten H. P. Kole & Greg J. Stuart Supplementary Fig. 1 Analysis of action potential (AP) threshold criteria. (a) Example
Supplementary Figure 1
 Supplementary Figure 1 Miniature microdrive, spike sorting and sleep stage detection. a, A movable recording probe with 8-tetrodes (32-channels). It weighs ~1g. b, A mouse implanted with 8 tetrodes in
Supplementary Figure 1. SybII and Ceb are sorted to distinct vesicle populations in astrocytes. Nature Neuroscience: doi: /nn.
 Supplementary Figure 1 SybII and Ceb are sorted to distinct vesicle populations in astrocytes. (a) Exemplary images for cultured astrocytes co-immunolabeled with SybII and Ceb antibodies. SybII accumulates
Inhibition: Effects of Timing, Time Scales and Gap Junctions
 Inhibition: Effects of Timing, Time Scales and Gap Junctions I. Auditory brain stem neurons and subthreshold integ n. Fast, precise (feed forward) inhibition shapes ITD tuning. Facilitating effects of
Supplementary Figure 1. Nature Neuroscience: doi: /nn.4547
 Supplementary Figure 1 Characterization of the Microfetti mouse model. (a) Gating strategy for 8-color flow analysis of peripheral Ly-6C + monocytes from Microfetti mice 5-7 days after TAM treatment. Living
Nature Neuroscience doi: /nn Supplementary Figure 1. Characterization of viral injections.
 Supplementary Figure 1 Characterization of viral injections. (a) Dorsal view of a mouse brain (dashed white outline) after receiving a large, unilateral thalamic injection (~100 nl); demonstrating that
STRUCTURAL ELEMENTS OF THE NERVOUS SYSTEM
 STRUCTURAL ELEMENTS OF THE NERVOUS SYSTEM STRUCTURE AND MAINTENANCE OF NEURONS (a) (b) Dendrites Cell body Initial segment collateral terminals (a) Diagrammatic representation of a neuron. The break in
CALLOSAL RESPONSES OF FAST-RHYTHMIC-BURSTING NEURONS DURING SLOW OSCILLATION IN CATS
 Neuroscience 147 (2007) 272 276 RAPID REPORT CALLOSAL RESPONSES OF FAST-RHYTHMIC-BURSTING NEURONS DURING SLOW OSCILLATION IN CATS Y. CISSÉ, 1,2 D. A. NITA, 2 M. STERIADE AND I. TIMOFEEV* Department of
Axon Initial Segment Kv1 Channels Control Axonal Action Potential Waveform and Synaptic Efficacy
 Article Axon Initial Segment Kv1 Channels Control Axonal Action Potential Waveform and Synaptic Efficacy Maarten H.P. Kole, 1,2 Johannes J. Letzkus, 1,2 and Greg J. Stuart 1, * 1 Division of Neuroscience,
Predictive Features of Persistent Activity Emergence in Regular Spiking and Intrinsic Bursting Model Neurons
 Emergence in Regular Spiking and Intrinsic Bursting Model Neurons Kyriaki Sidiropoulou, Panayiota Poirazi* Institute of Molecular Biology and Biotechnology (IMBB), Foundation for Research and Technology-Hellas
Supplementary Information
 Hyperpolarization-activated cation channels inhibit EPSPs by interactions with M-type K + channels Meena S. George, L.F. Abbott, Steven A. Siegelbaum Supplementary Information Part 1: Supplementary Figures
Structural basis for the role of inhibition in facilitating adult brain plasticity
 Structural basis for the role of inhibition in facilitating adult brain plasticity Jerry L. Chen, Walter C. Lin, Jae Won Cha, Peter T. So, Yoshiyuki Kubota & Elly Nedivi SUPPLEMENTARY FIGURES 1-6 a b M
LECTURE 2. C. Reason correlation and synaptic delay not enough to prove direct connection. D. Underlying mechanism behind oscillations possibilities
 LECTURE 2 A. Identifying Swimmy neurons B. Finding E and I inputs to cells 1 and 2 C. Reason correlation and synaptic delay not enough to prove direct connection D. Underlying mechanism behind oscillations
What is Anatomy and Physiology?
 Introduction BI 212 BI 213 BI 211 Ecosystems Organs / organ systems Cells Organelles Communities Tissues Molecules Populations Organisms Campbell et al. Figure 1.4 Introduction What is Anatomy and Physiology?
Chapter 6 subtitles postsynaptic integration
 CELLULAR NEUROPHYSIOLOGY CONSTANCE HAMMOND Chapter 6 subtitles postsynaptic integration INTRODUCTION (1:56) This sixth and final chapter deals with the summation of presynaptic currents. Glutamate and
Light-evoked hyperpolarization and silencing of neurons by conjugated polymers
 Light-evoked hyperpolarization and silencing of neurons by conjugated polymers Paul Feyen 1,, Elisabetta Colombo 1,2,, Duco Endeman 1, Mattia Nova 1, Lucia Laudato 2, Nicola Martino 2,3, Maria Rosa Antognazza
Title: Plasticity of intrinsic excitability in mature granule cells of the dentate gyrus
 Title: Plasticity of intrinsic excitability in mature granule cells of the dentate gyrus Authors: Jeffrey Lopez-Rojas a1, Martin Heine b1 and Michael R. Kreutz ac1 a Research Group Neuroplasticity, b Research
Reward prediction based on stimulus categorization in. primate lateral prefrontal cortex
 Reward prediction based on stimulus categorization in primate lateral prefrontal cortex Xiaochuan Pan, Kosuke Sawa, Ichiro Tsuda, Minoro Tsukada, Masamichi Sakagami Supplementary Information This PDF file
Social transmission and buffering of synaptic changes after stress
 SUPPLEMENTARY INFORMATION Articles https://doi.org/10.1038/s41593-017-0044-6 In the format provided by the authors and unedited. Social transmission and buffering of synaptic changes after stress Toni-Lee
Synaptic Integration
 Synaptic Integration 3 rd January, 2017 Touqeer Ahmed PhD Atta-ur-Rahman School of Applied Biosciences National University of Sciences and Technology Excitatory Synaptic Actions Excitatory Synaptic Action
Transitions between dierent synchronous ring modes using synaptic depression
 Neurocomputing 44 46 (2002) 61 67 www.elsevier.com/locate/neucom Transitions between dierent synchronous ring modes using synaptic depression Victoria Booth, Amitabha Bose Department of Mathematical Sciences,
Consequences of sequences: Studies on convergent and divergent elements of neocortical inhibitory microcircuits. Ph.D. thesis.
 Consequences of sequences: Studies on convergent and divergent elements of neocortical inhibitory microcircuits Ph.D. thesis János Szabadics Supervisor: Gábor Tamás, Ph.D. Department of Comparative Physiology,
The control of spiking by synaptic input in striatal and pallidal neurons
 The control of spiking by synaptic input in striatal and pallidal neurons Dieter Jaeger Department of Biology, Emory University, Atlanta, GA 30322 Key words: Abstract: rat, slice, whole cell, dynamic current
SUPPLEMENTARY INFORMATION
 doi: 1.138/nature6416 Supplementary Notes Spine Ca 2+ signals produced by glutamate uncaging We imaged uncaging-evoked [Ca 2+ ] transients in neurons loaded with a green Ca 2+ - sensitive indicator (G;
Synaptic and Network Mechanisms of Sparse and Reliable Visual Cortical Activity during Nonclassical Receptive Field Stimulation
 Article Synaptic and Network Mechanisms of Sparse and Reliable Visual Cortical Activity during Nonclassical Receptive Field Stimulation Bilal Haider, 1 Matthew R. Krause, 1 Alvaro Duque, 1 Yuguo Yu, 1
Neurons of the Bed Nucleus of the Stria Terminalis (BNST)
") Neurons of the Bed Nucleus of the Stria Terminalis (BNST) Electrophysiological Properties and Their Response to Serotonin DONALD G. RAINNIE a Harvard Medical School and Department of Psychiatry, Brockton
Neurons of the Bed Nucleus of the Stria Terminalis (BNST) Electrophysiological Properties and Their Response to Serotonin DONALD G. RAINNIE a Harvard Medical School and Department of Psychiatry, Brockton
The Role of Mitral Cells in State Dependent Olfactory Responses. Trygve Bakken & Gunnar Poplawski
 The Role of Mitral Cells in State Dependent Olfactory Responses Trygve akken & Gunnar Poplawski GGN 260 Neurodynamics Winter 2008 bstract Many behavioral studies have shown a reduced responsiveness to
Cellular properties of principal neurons in the rat entorhinal cortex. I. The lateral entorhinal cortex
 Cellular properties of principal neurons in the rat entorhinal cortex. I. The lateral entorhinal cortex Cathrin B. Canto 1, and Menno P. Witter 1, 1 Kavli Institute for Systems Neuroscience and Centre
Supplementary Materials for VAMP4 directs synaptic vesicles to a pool that selectively maintains asynchronous neurotransmission
 Supplementary Materials for VAMP4 directs synaptic vesicles to a pool that selectively maintains asynchronous neurotransmission Jesica Raingo, Mikhail Khvotchev, Pei Liu, Frederic Darios, Ying C. Li, Denise
Action potentials propagate down their axon
 Action potentials propagate down their axon Larger diameter axons have less resistance to ion flow Speed of conduction is faster in large diameter axons Saltatory conduction in myelinated axons Large myelinated
Impaired excitability of somatostatin- and parvalbumin-expressing cortical interneurons in a mouse model of Dravet syndrome.
 Impaired excitability of somatostatin- and parvalbumin-expressing cortical interneurons in a mouse model of ravet syndrome hao Tai a, Yasuyuki Abe a,b, Ruth E. Westenbroek a, Todd Scheuer a, and William
BIONB/BME/ECE 4910 Neuronal Simulation Assignments 1, Spring 2013
 BIONB/BME/ECE 4910 Neuronal Simulation Assignments 1, Spring 2013 Tutorial Assignment Page Due Date Week 1/Assignment 1: Introduction to NIA 1 January 28 The Membrane Tutorial 9 Week 2/Assignment 2: Passive
Part 11: Mechanisms of Learning
 Neurophysiology and Information: Theory of Brain Function Christopher Fiorillo BiS 527, Spring 2012 042 350 4326, fiorillo@kaist.ac.kr Part 11: Mechanisms of Learning Reading: Bear, Connors, and Paradiso,
Supplementary Table I Blood pressure and heart rate measurements pre- and post-stroke
 SUPPLEMENTARY INFORMATION doi:10.1038/nature09511 Supplementary Table I Blood pressure and heart rate measurements pre- and post-stroke Pre Post 7-days Systolic Diastolic BPM Systolic Diastolic BPM Systolic
Neuronal Oscillations Enhance Stimulus Discrimination by Ensuring Action Potential Precision
 Neuronal Oscillations Enhance Stimulus Discrimination by Ensuring Action Potential Precision Andreas T. Schaefer 1, Kamilla Angelo 1, Hartwig Spors 2, Troy W. Margrie 1* PLoS BIOLOGY 1 Department of Physiology,
Human Brain and Senses
 Human Brain and Senses Outline for today Levels of analysis Basic structure of neurons How neurons communicate Basic structure of the nervous system Levels of analysis Organism Brain Cell Synapses Membrane
Nature Neuroscience: doi: /nn Supplementary Figure 1. Large-scale calcium imaging in vivo.
 Supplementary Figure 1 Large-scale calcium imaging in vivo. (a) Schematic illustration of the in vivo camera imaging set-up for large-scale calcium imaging. (b) High-magnification two-photon image from
Signal Propagation and Logic Gating in Networks of Integrate-and-Fire Neurons
 10786 The Journal of Neuroscience, November 16, 2005 25(46):10786 10795 Behavioral/Systems/Cognitive Signal Propagation and Logic Gating in Networks of Integrate-and-Fire Neurons Tim P. Vogels and L. F.
Nature Neuroscience: doi: /nn Supplementary Figure 1. Lick response during the delayed Go versus No-Go task.
 Supplementary Figure 1 Lick response during the delayed Go versus No-Go task. Trial-averaged lick rate was averaged across all mice used for pyramidal cell imaging (n = 9). Different colors denote different
Chapter 3 subtitles Action potentials
 CELLULAR NEUROPHYSIOLOGY CONSTANCE HAMMOND Chapter 3 subtitles Action potentials Introduction (3:15) This third chapter explains the calcium current triggered by the arrival of the action potential in
Emergence of Metastable State Dynamics in Interconnected Cortical Networks with Propagation Delays
 Emergence of Metastable State Dynamics in Interconnected Cortical Networks with Propagation Delays Katrina M. Kutchko 1,2, Flavio Fröhlich 1,2,3,4,5 * 1 Department of Psychiatry, University of North Carolina
Chapter 4 Neuronal Physiology
 Chapter 4 Neuronal Physiology V edit. Pg. 99-131 VI edit. Pg. 85-113 VII edit. Pg. 87-113 Input Zone Dendrites and Cell body Nucleus Trigger Zone Axon hillock Conducting Zone Axon (may be from 1mm to more
Embryological origin of thalamus
 diencephalon Embryological origin of thalamus The diencephalon gives rise to the: Thalamus Epithalamus (pineal gland, habenula, paraventricular n.) Hypothalamus Subthalamus (Subthalamic nuclei) The Thalamus:
Introduction to Neurobiology
 Biology 240 General Zoology Introduction to Neurobiology Nervous System functions: communication of information via nerve signals integration and processing of information control of physiological and
Anatomy Review. Graphics are used with permission of: Pearson Education Inc., publishing as Benjamin Cummings (
 Anatomy Review Graphics are used with permission of: Pearson Education Inc., publishing as Benjamin Cummings (http://www.aw-bc.com) Page 1. Introduction Neurons communicate with other cells at junctions
CYTOARCHITECTURE OF CEREBRAL CORTEX
 BASICS OF NEUROBIOLOGY CYTOARCHITECTURE OF CEREBRAL CORTEX ZSOLT LIPOSITS 1 CELLULAR COMPOSITION OF THE CEREBRAL CORTEX THE CEREBRAL CORTEX CONSISTS OF THE ARCHICORTEX (HIPPOCAMPAL FORMA- TION), PALEOCORTEX
Non-linear developmental trajectory of electrical phenotype in rat substantia nigra pars compacta dopaminergic neurons
 RESEARCH ARTICLE elifesciences.org Non-linear developmental trajectory of electrical phenotype in rat substantia nigra pars compacta dopaminergic neurons Martial A Dufour 1,2, Adele Woodhouse 1,2, Julien
Action potential. Definition: an all-or-none change in voltage that propagates itself down the axon
 Action potential Definition: an all-or-none change in voltage that propagates itself down the axon Action potential Definition: an all-or-none change in voltage that propagates itself down the axon Naturally
Investigation of Physiological Mechanism For Linking Field Synapses
 Investigation of Physiological Mechanism For Linking Field Synapses Richard B. Wells 1, Nick Garrett 2, Tom Richner 3 Microelectronics Research and Communications Institute (MRCI) BEL 316 University of
Modeling Excitatory and Inhibitory Chemical Synapses
 In review, a synapse is the place where signals are transmitted from a neuron, the presynaptic neuron, to another cell. This second cell may be another neuron, muscle cell or glandular cell. If the second
Matthew E. Larkum 1 and J. Julius Zhu 1,2,3
 The Journal of Neuroscience, August 15, 2002, 22(16):6991 7005 Signaling of Layer 1 and Whisker-Evoked Ca 2 and Na Action Potentials in Distal and Terminal Dendrites of Rat Neocortical Pyramidal Neurons
Authors: K. L. Arendt, M. Royo, M. Fernández-Monreal, S. Knafo, C. N. Petrok, J.
 SUPPLEMENTARY INFORMATION Title: PIP 3 controls synaptic function by maintaining AMPA receptor clustering at the postsynaptic membrane Authors: K. L. Arendt, M. Royo, M. Fernández-Monreal, S. Knafo, C.
Supplementary Figure 2. Inter discharge intervals are consistent across electrophysiological scales and are related to seizure stage.
 Supplementary Figure 1. Progression of seizure activity recorded from a microelectrode array that was not recruited into the ictal core. (a) Raw LFP traces recorded from a single microelectrode during
EE 791 Lecture 2 Jan 19, 2015
 EE 791 Lecture 2 Jan 19, 2015 Action Potential Conduction And Neural Organization EE 791-Lecture 2 1 Core-conductor model: In the core-conductor model we approximate an axon or a segment of a dendrite