Nature Methods: doi: /nmeth Supplementary Figure 1. Activity in turtle dorsal cortex is sparse.
|
|
|
- Jocelin Nicholson
- 5 years ago
- Views:
Transcription
1 Supplementary Figure 1 Activity in turtle dorsal cortex is sparse. a. Probability distribution of firing rates across the population (notice log scale) in our data. The range of firing rates is wide but rates are strongly biased towards low values with an average of 0.04 spikes/s. b. Average autocorrelation function normalized by the total number of spikes fired by each neuron. Notice low values for all lags indicating rare bursting activity. c. Average cross-correlation between neurons. For every neuron we calculated the cross-correlation with all simultaneously recorded neurons, normalized to the total number of spikes fired by the neuron. These normalized functions were averaged over the population. Notice low correlation values across all lags. For all plots, neurons with low SNR (<0.5), average spike amplitude (<10µV) or low number of spikes (<200) were rejected from this analysis.
, enables recording from very large slabs of intact cortex with high spatial resolution (pitch = 17.5 μm). b. High-pass filtered spike template (10ms window starting 1.")
2 Supplementary Figure 2 Scalability to large, high-density CMOS electrode arrays. a. Bright-field image of a cortical slab on a CMOS electrode array. The large size of the active area (2.1mm x 3.85mm), enables recording from very large slabs of intact cortex with high spatial resolution (pitch = 17.5 μm). b. High-pass filtered spike template (10ms window starting 1.5ms before spike time) over 1024 simultaneously recorded electrodes. Template was averaged over 500 consecutive spikes identified in one channel as negative peaks exceeding 5.5 median absolute deviations. c. Spike-triggered average of raw voltage traces over the spikes and electrodes in b (200ms window starting 100ms before spike time). The positive amplitude of each trace is color-coded. Note the dominant positive slow SIFs following the spike waveform.
3 Supplementary Figure 3 Simultaneous patch-mea recordings. a. Schematic drawing of recording configuration with combining intracellular whole-cell patch-clamp (black pipette) and extracellular MEA recording (grid). Cortical slabs are typically placed on the MEA ventricular face down. b. Simultaneous whole-cell patch-clamp (upper black trace) and MEA (lower red trace) recordings of current-induced action potentials in one interneuron. Lower trace: step current injection. c. Correspondence between average intracellular and extracellular spike waveforms.
4 Supplementary Figure 4 Robustness of triangulation of soma position and comparison of exponential to power-law decay model. a. Spatial spread of extracellular spike signal from a sorted unit. Each box represents the mean (red) and individual traces (grey; see look-up-table at right; P = probability of occurrence over 250 consecutive spikes) originating from source location (blue dot at center) in x,y plane. Vertical gray line indicates spike peak time (t=0). Electrode pitch: 40µm. The somatic and axonal signals differ both in shape (bi or tri-phasic for axonal, see top row) and timing (note delays in the axonal negative peak. Note that soma triangulation is not affected by the bias introduced by the axon. b. Spatial exponential decay (λ = 42µm) of peak spike amplitude (data from neuron in a). Distance measured in x,y,z from position of source, itself computed by triangulation. Red curve fitted to points in black. Data points corresponding to the axonal signal (negative potentials) do not affect the fitting parameters and the resulting exponential curve. c. Comparison of fitting error between exponential (Exp; "V=" "V" _"0" "e" ^("-" x/λ ) ) and power law (Pow; "V=" "V" _"0" "x" ^("-" λ )) models for spatial decay of spike amplitude from the soma. The central mark in the box plot indicates the median, and the bottom and top edges of the box indicate the 1st (Q1) and 3rd (Q3) quartiles, respectively (148 neurons; 3 preparations). Whiskers at [Q1-1.5*(Q3- Q1), Q3+1.5*(Q3-Q1)].

5 Supplementary Figure 5 Propagation of axonal spikes. a. Left: An example of the spatial spread of the averaged (unfiltered) spike waveform across the different electrodes. Notice the triphasic axonal-like signal near top right. A negative field is visible following the spike. Right: timing of spike at different electrodes (red circles) is determined from the negative peak of the highpass (>200Hz) waveform after smoothing with a median filter of 0.35ms. Only significant peaks with peak prominence > 1 (findpeaks, Matlab), width at half prominence > 0.5ms and absolute peak height > 5*std are shown (std is the standard deviation during 1.5-4ms before spike peak). The temporal shift in spike peak is clearly visible. b. Estimation of axonal propagation velocity. The distance of every electrode from the triangulated soma position is plotted as a function of the corresponding spike-peak delay for all significant peaks. To calculate the velocity, a least square fit is performed and Cook s distances are calculated. The final speed is calculated by refitting over data points not rejected. Rejected (red circles) are points with a Cook distance larger than median + 0.5*MAD of the Cook distances. c. Left: scanning electron microscope image from a block scan of turtle cortex. Inset shows an enlargement of area marked by the red square. One of the axons in the image (white arrow) was traced from its cell body by serial block-face scanning, and its diameter calculated as a function of distance from the cell body (right: blue) and converges to a diameter of <500nm. The axon of a different cell is shown in red. d. Distribution of propagation velocities calculated (as in b) across neurons. To select only neurons for which propagation can be accurately calculated we considered only those with enough (>20) significant peaks at distances >300µm from the triangulated cell body position and with a p-value < 10-4 for the speed term in the linear regression (in total, 821 neurons). Red line marks the average value (153µm/ms).
. b. Average waveforms of each one of the clusters in a.")
6 Supplementary Figure 6 Fine characterization of SIF sub-types. a. Ordered correlation matrix of SIF waveforms from 1411 separated units (see methods) obtained from seven cortex preparations. The blue rectangle corresponds to excitatory cells; the red, purple and green rectangles correspond to inhibitory cells with SIFs of different amplitudes and delays (as shown in b). b. Average waveforms of each one of the clusters in a. Initial negativity at t = 0 represents the action potential. Templates with positive SIFs differ in their amplitude as well as kinetics, possibly due, in some cases, to contamination by polysynaptic effects. c. Correspondence between SIF amplitude, polarity and spike width for different SIF templates. Spike width was measured as the width at half the maximal amplitude on the electrode with the maximal spike amplitude on the array. d. SIFs yield better type separation than spike width. Red and blue correspond to inhibitory and excitatory neurons classified as in Fig 3. SIF score was determined by first extracting, for each electrode, the maximal correlation value between all templates and all electrodes with distances of up to 290µm from the spike peak electrode. Finally the score was calculated as the sum over the correlation values to inhibitory templates minus the correlation values to excitatory templates. e. Frequency (probability) distribution of correlation between each spike waveform and I1 template waveform (red in b) after removing cluster I2 (purple in a-c, <18% of all neurons). Two clear modes can be identified, corresponding to the E and I populations. Only a small fraction of the waveforms (1.9%, grey band) show low correlation values that preclude clear classification.
7
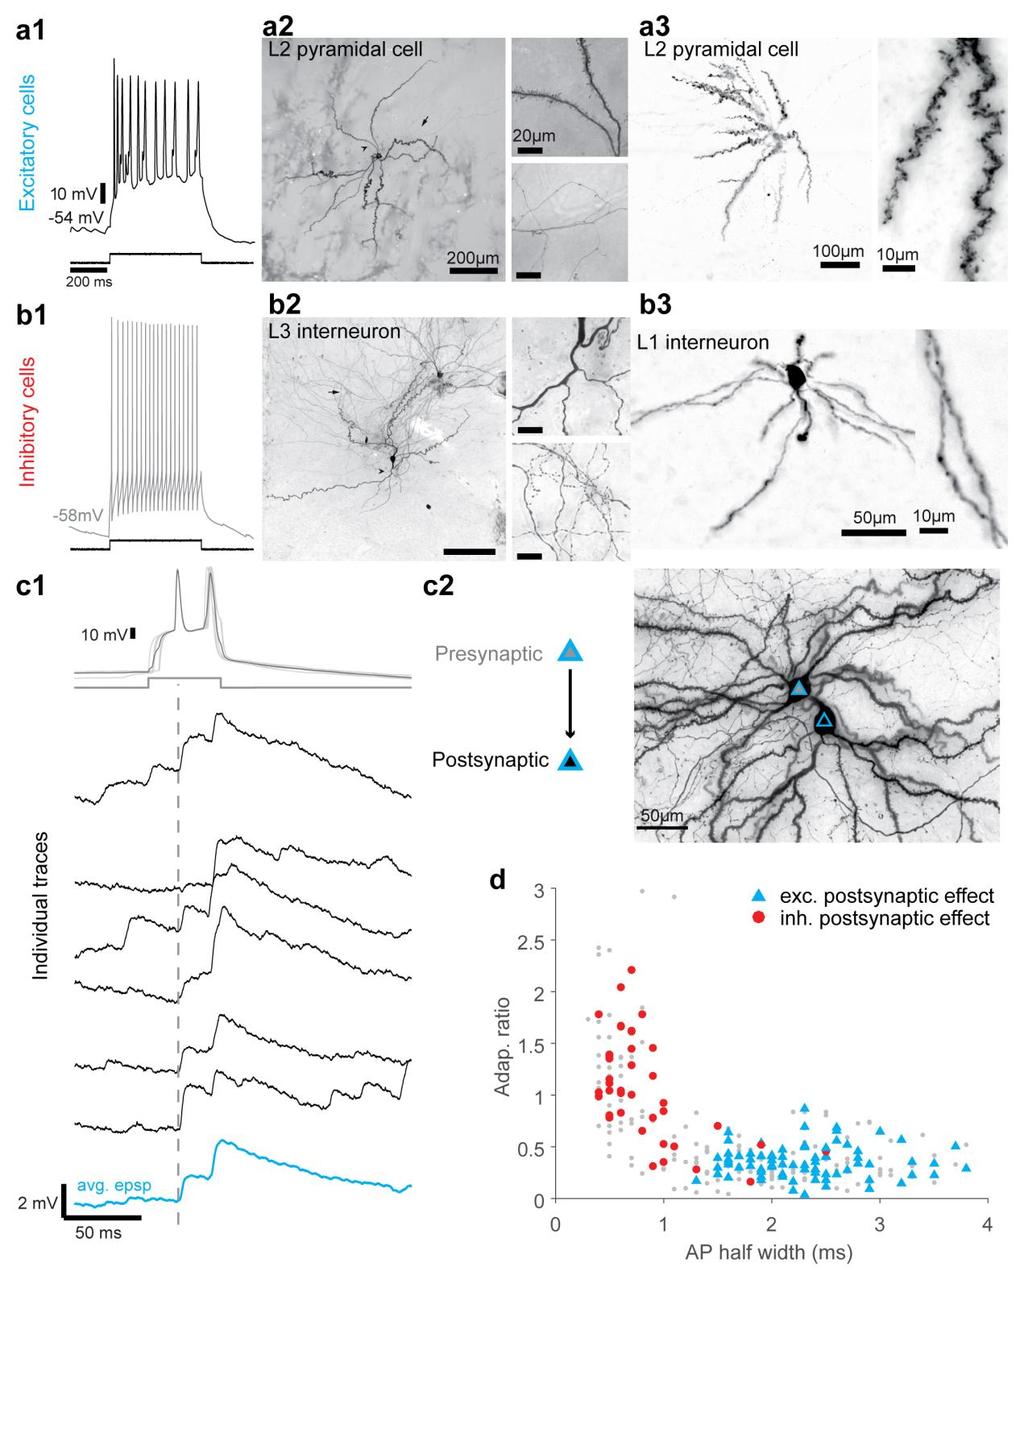
8 Supplementary Figure 7 Intrinsic electrical properties, morphology and postsynaptic effect identify neuron types. Patched neurons in turtle cortex could be classified as excitatory or inhibitory using electrophysiological criteria, such as spike width, firing frequency and firing frequency adaptation, as well as morphological parameters such as the presence (in excitatory neurons) or absence (in inhibitory neurons) of dendritic spines. As ground truth we used evoked monosynaptic postsynaptic potentials/currents in paired recordings. The ground truth data suggests a very good match with the morphological feature of spiny vs. aspiny dendrites, which were thus used when no paired recordings were performed. a. Excitatory neurons. a1: Current-induced spike train in an excitatory neuron. Note the typical adaptation of spike frequency, long action potential half-width and spikelets. a2: Morphology of the neuron in a1, stained with biocytin and viewed from the ventricular side of cortex. Arrows point to segments shown in insets. Insets: zoom-ins on dendritic (top) and axonal (bottom) segments. a3: Images of another stained excitatory cell with clear spiny dendrites (right). b. Inhibitory neurons. Same as in a but for two cortical interneurons (b2: layer 3; b3: layer 1). Note facilitation of spike frequency and short AP half-width. Dendrites appear aspiny and axonal bouton density is higher than in pyramidal neurons. c. Spiny pyramidal neurons have excitatory postsynaptic effects. c1: Current induced spiking of a pyramidal neuron elicited excitatory postsynaptic potentials (epsps) in a simultaneously recorded spiny pyramidal neuron. Six trials of the presynaptic Vm were aligned to the peak of the first action potential (vertical broken grey line), overlaid and are shown together with the average Vm (grey). Postsynaptic responses and the average (blue) epsp are shown below. c2: Schematic connectivity (left) and morphologies of the two cells recorded in c1 (tangential view). d. Scatterplot of the action potential half-width versus adaptation ratio for 282 cortical neurons (grey dots). Red dots and blue triangles show neurons with inhibitory and excitatory postsynaptic effect, respectively. Neurons with excitatory effect had spiny dendrites, while neurons with inhibitory effects had aspiny smooth dendrites.

9 Supplementary Figure 8 Suppression of all spatial SIF components following synaptic block. a. A pyramidal neuron was patched and its extracellular action potential and SIF waveforms were recorded on a planar MEA before (gray) and after (red) application of synaptic blockers. A top view of the reconstructed axons is superimposed in magenta. Note that, whereas the SIF is abolished following synaptic block, the spike waveform is unaffected. b. Same as (a) for a different pyramidal neuron.
10 Supplementary Figure 9 Correspondence between spatial distribution of SIFs and axonal projections. Pyramidal neurons were patched and their extracellular action potential and SIF waveforms (black traces, right column) were recorded on a planar MEA (120 electrodes and 100μm pitch in a and c, 59 electrodes and 200μm pitch in b). The neuron was stained by intracellular injection of biocytin, reconstructed, and its morphology aligned to the MEA. Top: perspective from one side to see depth of axonal projections. Bottom: top view of the neuron on the array s x,y plane. Dendrite shown in grey. Axon collaterals shown in color code, where hue represents distance from electrode array. In all cases, SIF amplitudes are larger where axon collaterals run close to the MEA electrodes.
11
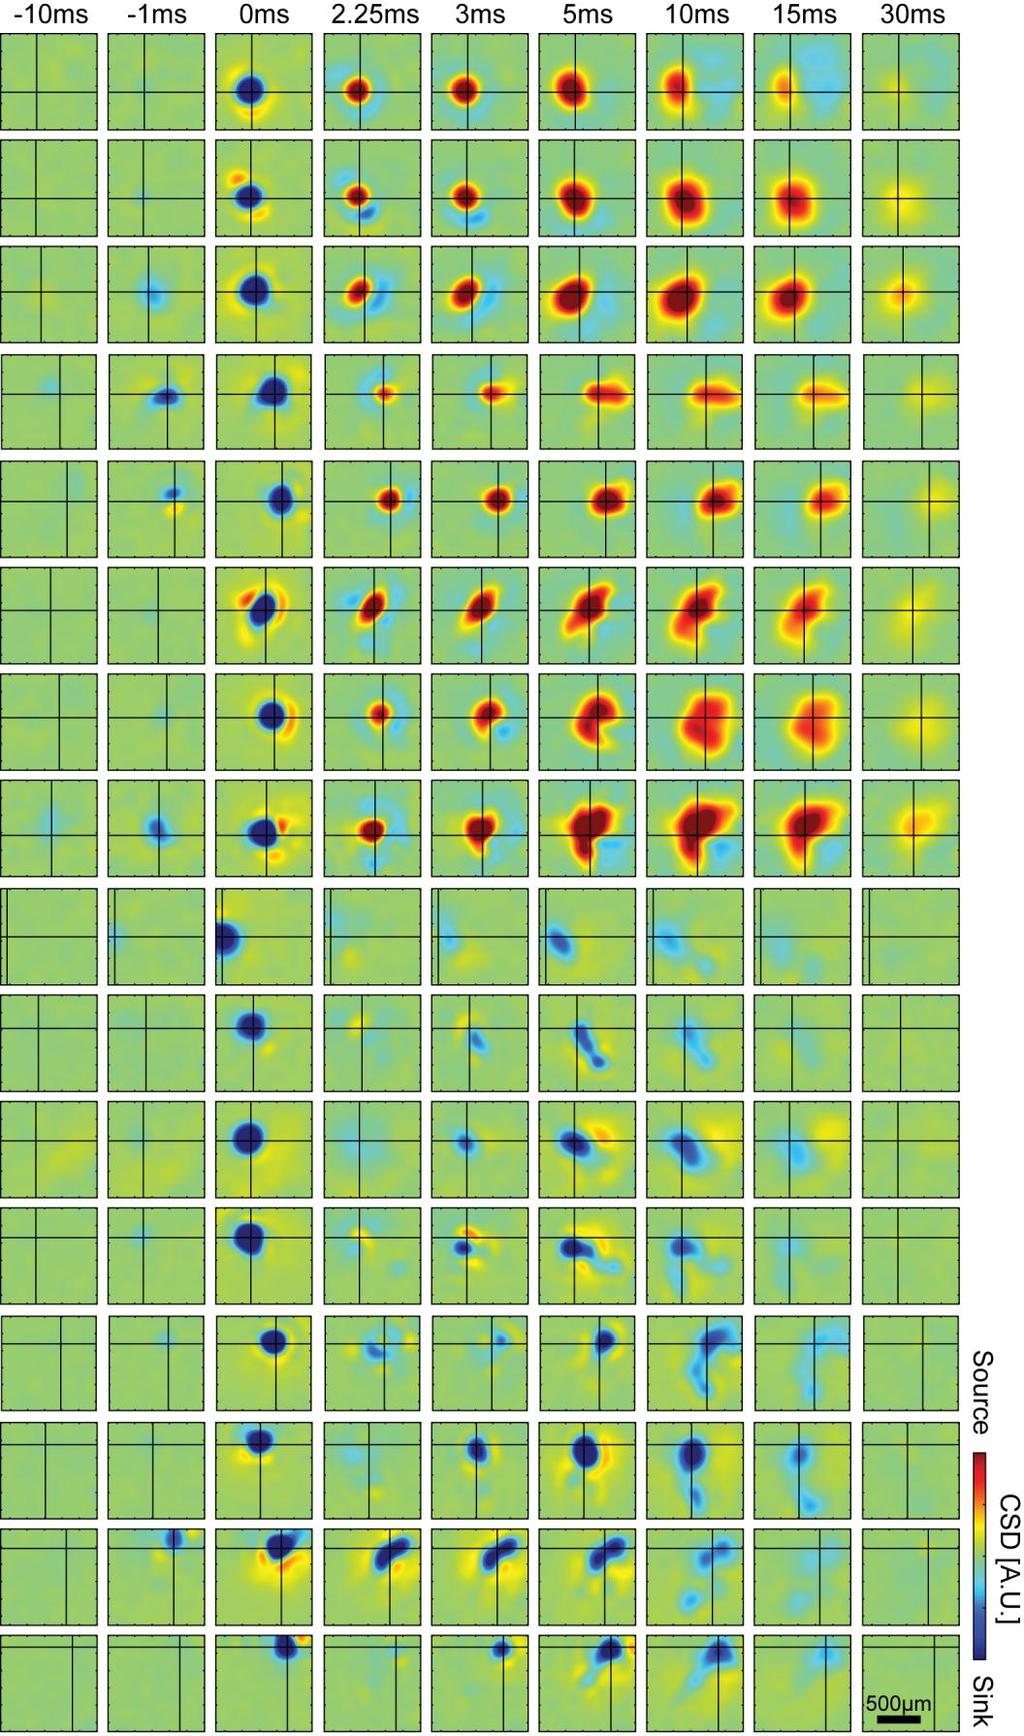
12 Supplementary Figure 10 SIF dynamics. Current-source density analysis applied to spike-sorted data in the x-y plane (details in Methods) for 16 neurons (8 interneurons, top; 8 excitatory cells, bottom) recorded simultaneously. Blue shading: negative or inward ( sink ); red shading: positive or outward ( source ). 0ms is time of action potential s negative peak. Cross-hair on triangulated soma position.
 was extracted and high-activity events were detected (grey, see Methods) and separated from low-activity events (white). b.")
13 Supplementary Figure 11 Dependence of SIF spatial distribution on network firing rates. a. Identification of high and low network firing epochs. The high-frequency activity intensity (AI) was extracted and high-activity events were detected (grey, see Methods) and separated from low-activity events (white). b. Examples of SIFs of two neurons (top and bottom rows) calculated from spikes fired during low (left) and high (right) activity epochs. SIF morphology can be either insensitive (top row) or sensitive (bottom row) to activity levels, as evident by the high (0.99) or low (0.21) spatial correlation value between SIFs, respectively. Intersection of red lines marks the triangulated position of the cell body in x,y plane. c. The distribution of the relative (absolute value normalized to the maximal amplitude) peak amplitude difference between low and high activity epochs. For most (more than half) neurons, the relative difference is below 20%). d. The distribution of the spatial correlation between SIFs during high and low activity levels. For most neurons (more than half), the correlation value is above 0.7. In c and d, only neurons (n=808) for which SIFs could be accurately estimated (fired at least 250 spikes during both high and low activity epochs) were considered.

14 Supplementary Figure 12 Reliability of orientation-bias detection. The reliability of SIF orientation-bias detection was tested against potential measurement or analytical artifacts. In a and b, we rejected all neurons contained in a 300µm-wide inner ring starting at the edge of the MEA, thus precluding artifacts linked to biased sampling of neurons at the edges (N=147 excitatory neurons, 531 interneurons). In c and d, we rejected all neurons with spike amplitude <10µV, nspikes<200 and SNR<0.5 (see methods) (N=151 excitatory neurons, 646 interneurons).
15 In e and f, we rejected all neurons with positive, low amplitude SIFs (cluster I2 in Suppl. Fig. 6b, purple) (N=150 excitatory neurons, 651 interneurons from the 1411 neurons analyzed in Suppl Fig 6). In g and h, we extracted SIFs only from spikes fired during low network activity epochs. Note the remaining bias in excitatory projections, and the reduction of inhibitory projection fields, presumably linked to the absence of compound polysynaptic SIFs. Neurons with low SNR (<0.5), average spike amplitude (<5µV) or low number of spikes (<100) were rejected. (N=108 excitatory neurons, 114 interneurons). a,c,e,g: Density plot of SIF vector distribution in Cartesian coordinates (as in Fig. 5c) pooled over 7 preparations for inhibitory (left) and excitatory (right) neurons. b,d,f,h: Average (interpolated) SIFs over 7 preparations for inhibitory (left) and excitatory (right) neurons (as in Fig. 5d).
SUPPLEMENTARY INFORMATION. Supplementary Figure 1
 SUPPLEMENTARY INFORMATION Supplementary Figure 1 The supralinear events evoked in CA3 pyramidal cells fulfill the criteria for NMDA spikes, exhibiting a threshold, sensitivity to NMDAR blockade, and all-or-none
File name: Supplementary Information Description: Supplementary Figures, Supplementary Table and Supplementary References
 File name: Supplementary Information Description: Supplementary Figures, Supplementary Table and Supplementary References File name: Supplementary Data 1 Description: Summary datasheets showing the spatial
Supplementary figure 1: LII/III GIN-cells show morphological characteristics of MC
 1 2 1 3 Supplementary figure 1: LII/III GIN-cells show morphological characteristics of MC 4 5 6 7 (a) Reconstructions of LII/III GIN-cells with somato-dendritic compartments in orange and axonal arborizations
Astrocyte signaling controls spike timing-dependent depression at neocortical synapses
 Supplementary Information Astrocyte signaling controls spike timing-dependent depression at neocortical synapses Rogier Min and Thomas Nevian Department of Physiology, University of Berne, Bern, Switzerland
Supplementary Figure 1. Basic properties of compound EPSPs at
 Supplementary Figure 1. Basic properties of compound EPSPs at hippocampal CA3 CA3 cell synapses. (a) EPSPs were evoked by extracellular stimulation of the recurrent collaterals and pharmacologically isolated
Dep. Control Time (min)
") aa Control Dep. RP 1s 1 mv 2s 1 mv b % potentiation of IPSP 2 15 1 5 Dep. * 1 2 3 4 Time (min) Supplementary Figure 1. Rebound potentiation of IPSPs in PCs. a, IPSPs recorded with a K + gluconate pipette
aa Control Dep. RP 1s 1 mv 2s 1 mv b % potentiation of IPSP 2 15 1 5 Dep. * 1 2 3 4 Time (min) Supplementary Figure 1. Rebound potentiation of IPSPs in PCs. a, IPSPs recorded with a K + gluconate pipette
Supplementary Figure 1. ACE robotic platform. A. Overview of the rig setup showing major hardware components of ACE (Automatic single Cell
 2 Supplementary Figure 1. ACE robotic platform. A. Overview of the rig setup showing major hardware components of ACE (Automatic single Cell Experimenter) including the MultiClamp 700B, Digidata 1440A,
Nature Neuroscience: doi: /nn Supplementary Figure 1. Trial structure for go/no-go behavior
 Supplementary Figure 1 Trial structure for go/no-go behavior a, Overall timeline of experiments. Day 1: A1 mapping, injection of AAV1-SYN-GCAMP6s, cranial window and headpost implantation. Water restriction
Axon Initial Segment Kv1 Channels Control Axonal Action Potential Waveform and Synaptic Efficacy
 Article Axon Initial Segment Kv1 Channels Control Axonal Action Potential Waveform and Synaptic Efficacy Maarten H.P. Kole, 1,2 Johannes J. Letzkus, 1,2 and Greg J. Stuart 1, * 1 Division of Neuroscience,
Unique functional properties of somatostatin-expressing GABAergic neurons in mouse barrel cortex
 Supplementary Information Unique functional properties of somatostatin-expressing GABAergic neurons in mouse barrel cortex Luc Gentet, Yves Kremer, Hiroki Taniguchi, Josh Huang, Jochen Staiger and Carl
Wenqin Hu, Cuiping Tian, Tun Li, Mingpo Yang, Han Hou & Yousheng Shu
 Distinct contributions of Na v 1.6 and Na v 1.2 in action potential initiation and backpropagation Wenqin Hu, Cuiping Tian, Tun Li, Mingpo Yang, Han Hou & Yousheng Shu Supplementary figure and legend Supplementary
Microcircuitry coordination of cortical motor information in self-initiation of voluntary movements
 Y. Isomura et al. 1 Microcircuitry coordination of cortical motor information in self-initiation of voluntary movements Yoshikazu Isomura, Rie Harukuni, Takashi Takekawa, Hidenori Aizawa & Tomoki Fukai
Is action potential threshold lowest in the axon?
 Supplementary information to: Is action potential threshold lowest in the axon? Maarten H. P. Kole & Greg J. Stuart Supplementary Fig. 1 Analysis of action potential (AP) threshold criteria. (a) Example
Supplementary materials for: Executive control processes underlying multi- item working memory
 Supplementary materials for: Executive control processes underlying multi- item working memory Antonio H. Lara & Jonathan D. Wallis Supplementary Figure 1 Supplementary Figure 1. Behavioral measures of
A tale of a thousand electrodes and one - Combining multielectrode array with patch clamp
 A tale of a thousand electrodes and one - Combining multielectrode array with patch clamp Technical Journal Club March 26 2018 Marc Emmenegger The brain Regulation of involuntary and voluntary internal
SUPPLEMENTARY INFORMATION
 doi:1.138/nature1139 a d Whisker angle (deg) Whisking repeatability Control Muscimol.4.3.2.1 -.1 8 4-4 1 2 3 4 Performance (d') Pole 8 4-4 1 2 3 4 5 Time (s) b Mean protraction angle (deg) e Hit rate (p
Theta sequences are essential for internally generated hippocampal firing fields.
 Theta sequences are essential for internally generated hippocampal firing fields. Yingxue Wang, Sandro Romani, Brian Lustig, Anthony Leonardo, Eva Pastalkova Supplementary Materials Supplementary Modeling
Chapter 6 subtitles postsynaptic integration
 CELLULAR NEUROPHYSIOLOGY CONSTANCE HAMMOND Chapter 6 subtitles postsynaptic integration INTRODUCTION (1:56) This sixth and final chapter deals with the summation of presynaptic currents. Glutamate and
Neurons. Pyramidal neurons in mouse cerebral cortex expressing green fluorescent protein. The red staining indicates GABAergic interneurons.
 Neurons Pyramidal neurons in mouse cerebral cortex expressing green fluorescent protein. The red staining indicates GABAergic interneurons. MBL, Woods Hole R Cheung MSc Bioelectronics: PGEE11106 1 Neuron
Supralinear increase of recurrent inhibition during sparse activity in the somatosensory cortex
 Supralinear increase of recurrent inhibition during sparse activity in the somatosensory cortex Christoph Kapfer 1,2, Lindsey L Glickfeld 1,3, Bassam V Atallah 1,3 & Massimo Scanziani 1 The balance between
Title: Plasticity of intrinsic excitability in mature granule cells of the dentate gyrus
 Title: Plasticity of intrinsic excitability in mature granule cells of the dentate gyrus Authors: Jeffrey Lopez-Rojas a1, Martin Heine b1 and Michael R. Kreutz ac1 a Research Group Neuroplasticity, b Research
Supplementary Figure 1. SDS-FRL localization of CB 1 in the distal CA3 area of the rat hippocampus. (a-d) Axon terminals (t) in stratum pyramidale
 Axon terminals (t) in stratum pyramidale") Supplementary Figure 1. SDS-FRL localization of CB 1 in the distal CA3 area of the rat hippocampus. (a-d) Axon terminals (t) in stratum pyramidale (b) show stronger immunolabeling for CB 1 than those in
Supplementary Figure 1. SDS-FRL localization of CB 1 in the distal CA3 area of the rat hippocampus. (a-d) Axon terminals (t) in stratum pyramidale (b) show stronger immunolabeling for CB 1 than those in
Synaptic Integration
 Synaptic Integration 3 rd January, 2017 Touqeer Ahmed PhD Atta-ur-Rahman School of Applied Biosciences National University of Sciences and Technology Excitatory Synaptic Actions Excitatory Synaptic Action
Supplementary Information. Errors in the measurement of voltage activated ion channels. in cell attached patch clamp recordings
 Supplementary Information Errors in the measurement of voltage activated ion channels in cell attached patch clamp recordings Stephen R. Williams 1,2 and Christian Wozny 2 1 Queensland Brain Institute,
Nature Neuroscience: doi: /nn Supplementary Figure 1
 Supplementary Figure 1 Relative expression of K IR2.1 transcript to enos was reduced 29-fold in capillaries from knockout animals. Relative expression of K IR2.1 transcript to enos was reduced 29-fold
Nature Neuroscience doi: /nn Supplementary Figure 1. Characterization of viral injections.
 Supplementary Figure 1 Characterization of viral injections. (a) Dorsal view of a mouse brain (dashed white outline) after receiving a large, unilateral thalamic injection (~100 nl); demonstrating that
Part 11: Mechanisms of Learning
 Neurophysiology and Information: Theory of Brain Function Christopher Fiorillo BiS 527, Spring 2012 042 350 4326, fiorillo@kaist.ac.kr Part 11: Mechanisms of Learning Reading: Bear, Connors, and Paradiso,
Supplementary Figure 1 Information on transgenic mouse models and their recording and optogenetic equipment. (a) 108 (b-c) (d) (e) (f) (g)
 108 (b-c) (d) (e) (f) (g)") Supplementary Figure 1 Information on transgenic mouse models and their recording and optogenetic equipment. (a) In four mice, cre-dependent expression of the hyperpolarizing opsin Arch in pyramidal cells
Supplementary Figure 1 Information on transgenic mouse models and their recording and optogenetic equipment. (a) In four mice, cre-dependent expression of the hyperpolarizing opsin Arch in pyramidal cells
Behavioral generalization
 Supplementary Figure 1 Behavioral generalization. a. Behavioral generalization curves in four Individual sessions. Shown is the conditioned response (CR, mean ± SEM), as a function of absolute (main) or
Nature Neuroscience: doi: /nn Supplementary Figure 1. Behavioral training.
 Supplementary Figure 1 Behavioral training. a, Mazes used for behavioral training. Asterisks indicate reward location. Only some example mazes are shown (for example, right choice and not left choice maze
Early Learning vs Early Variability 1.5 r = p = Early Learning r = p = e 005. Early Learning 0.
 The temporal structure of motor variability is dynamically regulated and predicts individual differences in motor learning ability Howard Wu *, Yohsuke Miyamoto *, Luis Nicolas Gonzales-Castro, Bence P.
Supplementary Figure 1. GABA depolarizes the majority of immature neurons in the
 Supplementary Figure 1. GABA depolarizes the majority of immature neurons in the upper cortical layers at P3 4 in vivo. (a b) Cell-attached current-clamp recordings illustrate responses to puff-applied
Ube3a is required for experience-dependent maturation of the neocortex
 Ube3a is required for experience-dependent maturation of the neocortex Koji Yashiro, Thorfinn T. Riday, Kathryn H. Condon, Adam C. Roberts, Danilo R. Bernardo, Rohit Prakash, Richard J. Weinberg, Michael
Neuroscience 201A (2016) - Problems in Synaptic Physiology
 - Problems in Synaptic Physiology") Question 1: The record below in A shows an EPSC recorded from a cerebellar granule cell following stimulation (at the gap in the record) of a mossy fiber input. These responses are, then, evoked by stimulation.
Question 1: The record below in A shows an EPSC recorded from a cerebellar granule cell following stimulation (at the gap in the record) of a mossy fiber input. These responses are, then, evoked by stimulation.
Supporting Information
 ATP from synaptic terminals and astrocytes regulates NMDA receptors and synaptic plasticity through PSD- 95 multi- protein complex U.Lalo, O.Palygin, A.Verkhratsky, S.G.N. Grant and Y. Pankratov Supporting
Supplementary Information
 Supplementary Information D-Serine regulates cerebellar LTD and motor coordination through the 2 glutamate receptor Wataru Kakegawa, Yurika Miyoshi, Kenji Hamase, Shinji Matsuda, Keiko Matsuda, Kazuhisa
Electrophysiology. General Neurophysiology. Action Potentials
 5 Electrophysiology Cochlear implants should aim to reproduce the coding of sound in the auditory system as closely as possible, for best sound perception. The cochlear implant is in part the result of
Introduction to Electrophysiology
 Introduction to Electrophysiology Dr. Kwangyeol Baek Martinos Center for Biomedical Imaging Massachusetts General Hospital Harvard Medical School 2018-05-31s Contents Principles in Electrophysiology Techniques
STRUCTURAL ELEMENTS OF THE NERVOUS SYSTEM
 STRUCTURAL ELEMENTS OF THE NERVOUS SYSTEM STRUCTURE AND MAINTENANCE OF NEURONS (a) (b) Dendrites Cell body Initial segment collateral terminals (a) Diagrammatic representation of a neuron. The break in
SUPPLEMENTARY INFORMATION
 doi:10.1038/nature10776 Supplementary Information 1: Influence of inhibition among blns on STDP of KC-bLN synapses (simulations and schematics). Unconstrained STDP drives network activity to saturation
Chapter 3 subtitles Action potentials
 CELLULAR NEUROPHYSIOLOGY CONSTANCE HAMMOND Chapter 3 subtitles Action potentials Introduction (3:15) This third chapter explains the calcium current triggered by the arrival of the action potential in
BIONB/BME/ECE 4910 Neuronal Simulation Assignments 1, Spring 2013
 BIONB/BME/ECE 4910 Neuronal Simulation Assignments 1, Spring 2013 Tutorial Assignment Page Due Date Week 1/Assignment 1: Introduction to NIA 1 January 28 The Membrane Tutorial 9 Week 2/Assignment 2: Passive
Sum of Neurally Distinct Stimulus- and Task-Related Components.
 SUPPLEMENTARY MATERIAL for Cardoso et al. 22 The Neuroimaging Signal is a Linear Sum of Neurally Distinct Stimulus- and Task-Related Components. : Appendix: Homogeneous Linear ( Null ) and Modified Linear
Chapter 5 subtitles GABAergic synaptic transmission
 CELLULAR NEUROPHYSIOLOGY CONSTANCE HAMMOND Chapter 5 subtitles GABAergic synaptic transmission INTRODUCTION (2:57) In this fifth chapter, you will learn how the binding of the GABA neurotransmitter to
Action potential. Definition: an all-or-none change in voltage that propagates itself down the axon
 Action potential Definition: an all-or-none change in voltage that propagates itself down the axon Action potential Definition: an all-or-none change in voltage that propagates itself down the axon Naturally
Supplementary Information
 Hyperpolarization-activated cation channels inhibit EPSPs by interactions with M-type K + channels Meena S. George, L.F. Abbott, Steven A. Siegelbaum Supplementary Information Part 1: Supplementary Figures
EXTRACELLULAR RECORDINGS OF SPIKES
 EXTRACELLULAR RECORDINGS OF SPIKES Information about spiking is typically extracted from the high frequency band (>300-500Hz) of extracellular potentials. Since these high-frequency signals generally stem
Ivy/Neurogliaform Interneurons Coordinate Activity in the Neurogenic Niche
 Ivy/Neurogliaform Interneurons Coordinate Activity in the Neurogenic Niche Sean J. Markwardt, Cristina V. Dieni, Jacques I. Wadiche & Linda Overstreet-Wadiche Supplementary Methods. Animals We used hemizygous
Supplementary Information Supplementary Table 1. Quantitative features of EC neuron dendrites
 Supplementary Information Supplementary Table 1. Quantitative features of EC neuron dendrites Supplementary Table 2. Quantitative features of EC neuron axons 1 Supplementary Figure 1. Layer distribution
CYTOARCHITECTURE OF CEREBRAL CORTEX
 BASICS OF NEUROBIOLOGY CYTOARCHITECTURE OF CEREBRAL CORTEX ZSOLT LIPOSITS 1 CELLULAR COMPOSITION OF THE CEREBRAL CORTEX THE CEREBRAL CORTEX CONSISTS OF THE ARCHICORTEX (HIPPOCAMPAL FORMA- TION), PALEOCORTEX
Supplemental Information. A Visual-Cue-Dependent Memory Circuit. for Place Navigation
 Neuron, Volume 99 Supplemental Information A Visual-Cue-Dependent Memory Circuit for Place Navigation Han Qin, Ling Fu, Bo Hu, Xiang Liao, Jian Lu, Wenjing He, Shanshan Liang, Kuan Zhang, Ruijie Li, Jiwei
Supplementary Figure 1. Recording sites.
 Supplementary Figure 1 Recording sites. (a, b) Schematic of recording locations for mice used in the variable-reward task (a, n = 5) and the variable-expectation task (b, n = 5). RN, red nucleus. SNc,
Axon initial segment position changes CA1 pyramidal neuron excitability
 Axon initial segment position changes CA1 pyramidal neuron excitability Cristina Nigro and Jason Pipkin UCSD Neurosciences Graduate Program Abstract The axon initial segment (AIS) is the portion of the
OPTO 5320 VISION SCIENCE I
 OPTO 5320 VISION SCIENCE I Monocular Sensory Processes of Vision: Color Vision Mechanisms of Color Processing . Neural Mechanisms of Color Processing A. Parallel processing - M- & P- pathways B. Second
Electrophysiological and firing properties of neurons: categorizing soloists and choristers in primary visual cortex
 *Manuscript Click here to download Manuscript: Manuscript revised.docx Click here to view linked Referenc Electrophysiological and firing properties of neurons: categorizing soloists and choristers in
Analysis of in-vivo extracellular recordings. Ryan Morrill Bootcamp 9/10/2014
 Analysis of in-vivo extracellular recordings Ryan Morrill Bootcamp 9/10/2014 Goals for the lecture Be able to: Conceptually understand some of the analysis and jargon encountered in a typical (sensory)
Information Processing During Transient Responses in the Crayfish Visual System
 Information Processing During Transient Responses in the Crayfish Visual System Christopher J. Rozell, Don. H. Johnson and Raymon M. Glantz Department of Electrical & Computer Engineering Department of
What do you notice? Edited from
 What do you notice? Edited from https://www.youtube.com/watch?v=ffayobzdtc8&t=83s How can a one brain region increase the likelihood of eliciting a spike in another brain region? Communication through
Cellular Bioelectricity
 ELEC ENG 3BB3: Cellular Bioelectricity Notes for Lecture 24 Thursday, March 6, 2014 8. NEURAL ELECTROPHYSIOLOGY We will look at: Structure of the nervous system Sensory transducers and neurons Neural coding
CELLULAR NEUROPHYSIOLOGY
 CELLULAR NEUROPHYSIOLOGY CONSTANCE HAMMOND 6. SYNAPTIC INTEGRATION Video 6-1: Compound PSP, PSP propagation and summation Compound postsynaptic potential 2 whole-cell configuration current-clamp mode somatic
Nature Neuroscience: doi: /nn Supplementary Figure 1. Lick response during the delayed Go versus No-Go task.
 Supplementary Figure 1 Lick response during the delayed Go versus No-Go task. Trial-averaged lick rate was averaged across all mice used for pyramidal cell imaging (n = 9). Different colors denote different
SUPPLEMENTARY INFORMATION
 Supplementary Figure 1. Normal AMPAR-mediated fepsp input-output curve in CA3-Psen cdko mice. Input-output curves, which are plotted initial slopes of the evoked fepsp as function of the amplitude of the
DUAL INTRACELLULAR RECORDINGS AND COMPUTATIONAL MODELS OF SLOW INHIBITORY POSTSYNAPTIC POTENTIALS IN RAT NEOCORTICAL AND HIPPOCAMPAL SLICES
 Pergamon Neuroscience Vol. 92, No. 4, pp. 1193 1215, 1999 Copyright 1999 IBRO. Published by Elsevier Science Ltd Printed in Great Britain. All rights reserved PII: S0306-4522(99)00021-4 0306-4522/99 $20.00+0.00
Sample Lab Report 1 from 1. Measuring and Manipulating Passive Membrane Properties
 Sample Lab Report 1 from http://www.bio365l.net 1 Abstract Measuring and Manipulating Passive Membrane Properties Biological membranes exhibit the properties of capacitance and resistance, which allow
SYNAPTIC COMMUNICATION
 BASICS OF NEUROBIOLOGY SYNAPTIC COMMUNICATION ZSOLT LIPOSITS 1 NERVE ENDINGS II. Interneuronal communication 2 INTERNEURONAL COMMUNICATION I. ELECTRONIC SYNAPSE GAP JUNCTION II. CHEMICAL SYNAPSE SYNAPSES
What is Anatomy and Physiology?
 Introduction BI 212 BI 213 BI 211 Ecosystems Organs / organ systems Cells Organelles Communities Tissues Molecules Populations Organisms Campbell et al. Figure 1.4 Introduction What is Anatomy and Physiology?
Tuning properties of individual circuit components and stimulus-specificity of experience-driven changes.
 Supplementary Figure 1 Tuning properties of individual circuit components and stimulus-specificity of experience-driven changes. (a) Left, circuit schematic with the imaged component (L2/3 excitatory neurons)
Supplementary Figure S1: Histological analysis of kainate-treated animals
 Supplementary Figure S1: Histological analysis of kainate-treated animals Nissl stained coronal or horizontal sections were made from kainate injected (right) and saline injected (left) animals at different
Introduction to EEG del Campo. Introduction to EEG. J.C. Martin del Campo, MD, FRCP University Health Network Toronto, Canada
 Introduction to EEG J.C. Martin, MD, FRCP University Health Network Toronto, Canada What is EEG? A graphic representation of the difference in voltage between two different cerebral locations plotted over
Nature Medicine: doi: /nm.4084
 Supplementary Figure 1: Sample IEDs. (a) Sample hippocampal IEDs from different kindled rats (scale bar = 200 µv, 100 ms). (b) Sample temporal lobe IEDs from different subjects with epilepsy (scale bar
BIPN 140 Problem Set 6
 BIPN 140 Problem Set 6 1) The hippocampus is a cortical structure in the medial portion of the temporal lobe (medial temporal lobe in primates. a) What is the main function of the hippocampus? The hippocampus
Structural basis for the role of inhibition in facilitating adult brain plasticity
 Structural basis for the role of inhibition in facilitating adult brain plasticity Jerry L. Chen, Walter C. Lin, Jae Won Cha, Peter T. So, Yoshiyuki Kubota & Elly Nedivi SUPPLEMENTARY FIGURES 1-6 a b M
Supplementary Information for Correlated input reveals coexisting coding schemes in a sensory cortex
 Supplementary Information for Correlated input reveals coexisting coding schemes in a sensory cortex Luc Estebanez 1,2 *, Sami El Boustani 1 *, Alain Destexhe 1, Daniel E. Shulz 1 1 Unité de Neurosciences,
Beyond Vanilla LTP. Spike-timing-dependent-plasticity or STDP
 Beyond Vanilla LTP Spike-timing-dependent-plasticity or STDP Hebbian learning rule asn W MN,aSN MN Δw ij = μ x j (v i - φ) learning threshold under which LTD can occur Stimulation electrode Recording electrode
Supplementary Figure 1: Kv7 currents in neonatal CA1 neurons measured with the classic M- current voltage-clamp protocol.
 Supplementary Figures 1-11 Supplementary Figure 1: Kv7 currents in neonatal CA1 neurons measured with the classic M- current voltage-clamp protocol. (a), Voltage-clamp recordings from CA1 pyramidal neurons
BIPN 140 Problem Set 6
 BIPN 140 Problem Set 6 1) Hippocampus is a cortical structure in the medial portion of the temporal lobe (medial temporal lobe in primates. a) What is the main function of the hippocampus? The hippocampus
PSY 215 Lecture 3 (1/19/2011) (Synapses & Neurotransmitters) Dr. Achtman PSY 215
 (Synapses & Neurotransmitters) Dr. Achtman PSY 215") Corrections: None needed. PSY 215 Lecture 3 Topic: Synapses & Neurotransmitters Chapters 2 & 3, pages 40-57 Lecture Notes: SYNAPSES & NEUROTRANSMITTERS, CHAPTER 3 Action Potential (above diagram found
Corrections: None needed. PSY 215 Lecture 3 Topic: Synapses & Neurotransmitters Chapters 2 & 3, pages 40-57 Lecture Notes: SYNAPSES & NEUROTRANSMITTERS, CHAPTER 3 Action Potential (above diagram found
Supplementary Figure 1
 Supplementary Figure 1 Localization of virus injections. (a) Schematic showing the approximate center of AAV-DIO-ChR2-YFP injection sites in the NAc of Dyn-cre mice (n=8 mice, 16 injections; caudate/putamen,
Supplementary Figure 1
 Supplementary Figure 1 Miniature microdrive, spike sorting and sleep stage detection. a, A movable recording probe with 8-tetrodes (32-channels). It weighs ~1g. b, A mouse implanted with 8 tetrodes in
Light-evoked hyperpolarization and silencing of neurons by conjugated polymers
 Light-evoked hyperpolarization and silencing of neurons by conjugated polymers Paul Feyen 1,, Elisabetta Colombo 1,2,, Duco Endeman 1, Mattia Nova 1, Lucia Laudato 2, Nicola Martino 2,3, Maria Rosa Antognazza
Chapter 4 Neuronal Physiology
 Chapter 4 Neuronal Physiology V edit. Pg. 99-131 VI edit. Pg. 85-113 VII edit. Pg. 87-113 Input Zone Dendrites and Cell body Nucleus Trigger Zone Axon hillock Conducting Zone Axon (may be from 1mm to more
Thalamo-Cortical Relationships Ultrastructure of Thalamic Synaptic Glomerulus
 Central Visual Pathways V1/2 NEUR 3001 dvanced Visual Neuroscience The Lateral Geniculate Nucleus () is more than a relay station LP SC Professor Tom Salt UCL Institute of Ophthalmology Retina t.salt@ucl.ac.uk
Cholinergic Activation of M2 Receptors Leads to Context- Dependent Modulation of Feedforward Inhibition in the Visual Thalamus
 Cholinergic Activation of M2 Receptors Leads to Context- Dependent Modulation of Feedforward Inhibition in the Visual Thalamus Miklos Antal., Claudio Acuna-Goycolea., R. Todd Pressler, Dawn M. Blitz, Wade
Supplementary Figure 2. Inter discharge intervals are consistent across electrophysiological scales and are related to seizure stage.
 Supplementary Figure 1. Progression of seizure activity recorded from a microelectrode array that was not recruited into the ictal core. (a) Raw LFP traces recorded from a single microelectrode during
The control of spiking by synaptic input in striatal and pallidal neurons
 The control of spiking by synaptic input in striatal and pallidal neurons Dieter Jaeger Department of Biology, Emory University, Atlanta, GA 30322 Key words: Abstract: rat, slice, whole cell, dynamic current
EE 791 Lecture 2 Jan 19, 2015
 EE 791 Lecture 2 Jan 19, 2015 Action Potential Conduction And Neural Organization EE 791-Lecture 2 1 Core-conductor model: In the core-conductor model we approximate an axon or a segment of a dendrite
G5)H/C8-)72)78)2I-,8/52& ()*+,-./,-0))12-345)6/3/782 9:-8;<;4.= J-3/ J-3/ "#&' "#% "#"% "#%$
H/C8-)72)78)2I-,8/52& ()*+,-./,-0))12-345)6/3/782 9:-8;<;4.= J-3/ J-3/ #&' #% #% #%$") # G5)H/C8-)72)78)2I-,8/52& #% #$ # # &# G5)H/C8-)72)78)2I-,8/52' @5/AB/7CD J-3/ /,?8-6/2@5/AB/7CD #&' #% #$ # # '#E ()*+,-./,-0))12-345)6/3/782 9:-8;;4. @5/AB/7CD J-3/ #' /,?8-6/2@5/AB/7CD #&F #&' #% #$
# G5)H/C8-)72)78)2I-,8/52& #% #$ # # &# G5)H/C8-)72)78)2I-,8/52' @5/AB/7CD J-3/ /,?8-6/2@5/AB/7CD #&' #% #$ # # '#E ()*+,-./,-0))12-345)6/3/782 9:-8;;4. @5/AB/7CD J-3/ #' /,?8-6/2@5/AB/7CD #&F #&' #% #$
Vizcarra-Chacón et al. BMC Neuroscience 2013, 14:60
 Vizcarra-Chacón et al. BMC Neuroscience 2013, 14:60 RESEARCH ARTICLE Open Access Contribution of different classes of glutamate receptors in the corticostriatal polysynaptic responses from striatal direct
The mammalian cochlea possesses two classes of afferent neurons and two classes of efferent neurons.
 1 2 The mammalian cochlea possesses two classes of afferent neurons and two classes of efferent neurons. Type I afferents contact single inner hair cells to provide acoustic analysis as we know it. Type
What Cell Make Up the Brain and Spinal Cord
 What Cell Make Up the Brain and Spinal Cord Jennifer LaVail, Ph.D. (http://anatomy.ucsf.edu/pages/lavaillab/index.html) What kinds of cells are these?" Neuron?" Epithelial cell?" Glial cell?" What makes
Plasticity of Cerebral Cortex in Development
 Plasticity of Cerebral Cortex in Development Jessica R. Newton and Mriganka Sur Department of Brain & Cognitive Sciences Picower Center for Learning & Memory Massachusetts Institute of Technology Cambridge,
Prolonged Synaptic Integration in Perirhinal Cortical Neurons
 RAPID COMMUNICATION Prolonged Synaptic Integration in Perirhinal Cortical Neurons JOHN M. BEGGS, 1 JAMES R. MOYER, JR., 1 JOHN P. MCGANN, 2 AND THOMAS H. BROWN 1 3 1 Department of Psychology, 2 Interdepartmental
Cerebral Cortex. Edmund T. Rolls. Principles of Operation. Presubiculum. Subiculum F S D. Neocortex. PHG & Perirhinal. CA1 Fornix CA3 S D
 Cerebral Cortex Principles of Operation Edmund T. Rolls F S D Neocortex S D PHG & Perirhinal 2 3 5 pp Ento rhinal DG Subiculum Presubiculum mf CA3 CA1 Fornix Appendix 4 Simulation software for neuronal
Supplementary Figure 1. Localization of face patches (a) Sagittal slice showing the location of fmri-identified face patches in one monkey targeted
 Sagittal slice showing the location of fmri-identified face patches in one monkey targeted") Supplementary Figure 1. Localization of face patches (a) Sagittal slice showing the location of fmri-identified face patches in one monkey targeted for recording; dark black line indicates electrode. Stereotactic
Supplementary Figure 1. Localization of face patches (a) Sagittal slice showing the location of fmri-identified face patches in one monkey targeted for recording; dark black line indicates electrode. Stereotactic
The storage and recall of memories in the hippocampo-cortical system. Supplementary material. Edmund T Rolls
 The storage and recall of memories in the hippocampo-cortical system Supplementary material Edmund T Rolls Oxford Centre for Computational Neuroscience, Oxford, England and University of Warwick, Department
Nature Neuroscience: doi: /nn Supplementary Figure 1. Large-scale calcium imaging in vivo.
 Supplementary Figure 1 Large-scale calcium imaging in vivo. (a) Schematic illustration of the in vivo camera imaging set-up for large-scale calcium imaging. (b) High-magnification two-photon image from
Chapter 11 Introduction to the Nervous System and Nervous Tissue Chapter Outline
 Chapter 11 Introduction to the Nervous System and Nervous Tissue Chapter Outline Module 11.1 Overview of the Nervous System (Figures 11.1-11.3) A. The nervous system controls our perception and experience
Short- and long-lasting consequences of in vivo nicotine treatment
 Short- and long-lasting consequences of in vivo nicotine treatment on hippocampal excitability Rachel E. Penton, Michael W. Quick, Robin A. J. Lester Supplementary Figure 1. Histogram showing the maximal
MCB MIDTERM EXAM #1 MONDAY MARCH 3, 2008 ANSWER KEY
 MCB 160 - MIDTERM EXAM #1 MONDAY MARCH 3, 2008 ANSWER KEY Name ID# Instructions: -Only tests written in pen will be regarded -Please submit a written request indicating where and why you deserve more points