13 Electroencephalography
|
|
|
- Albert Murphy
- 6 years ago
- Views:
Transcription
1 13 Electroencephalography 13.1 INTRODUCTION The first recording of the electric field of the human brain was made by the German psychiatrist Hans Berger in 1924 in Jena. He gave this recording the name electroencephalogram (EEG). (Berger, 1929).(From 1929 to 1938 he published 20 scientific papers on the EEG under the same title "Über das Elektroenkephalogram des Menschen".) 1. spontaneous activity, 2. evoked potentials, and 3. bioelectric events produced by single neurons. Spontaneous activity is measured on the scalp or on the brain and is called the electroencephalogram. The amplitude of the EEG is about 100 µv when measured on the scalp, and about 1-2 mv when measured on the surface of the brain. The bandwidth of this signal is from under 1 Hz to about 50 Hz, as demonstrated in Figure As the phrase "spontaneous activity" implies, this activity goes on continuously in the living individual. Evoked potentials are those components of the EEG that arise in response to a stimulus (which may be electric, auditory, visual, etc.) Such signals are usually below the noise level and thus not readily distinguished, and one must use a train of stimuli and signal averaging to improve the signal-to-noise ratio. Single-neuron behavior can be examined through the use of microelectrodes which impale the cells of interest. Through studies of the single cell, one hopes to build models of cell networks that will reflect actual tissue properties THE BRAIN AS A BIOELECTRIC GENERATOR PRECONDITIONS: SOURCE: Distribution of impressed current source elements i (volume source) CONDUCTOR: Finite, inhomogeneous The number of nerve cells in the brain has been estimated to be on the order of Cortical neurons are strongly interconnected. Here the surface of a single neuron may be covered with 1, ,000 synapses (Nunez, 1981). The electric behavior of the neuron corresponds to the description of excitable cells introduced in the earlier chapters. The resting voltage is around -70 mv, and the peak of the action potential is positive. The amplitude of the nerve impulse is about 100 mv; it lasts about 1 ms. The bioelectric impressed current density i associated with neuronal activation produces an electric field, which can be measured on the surface of the head or directly on the brain tissue. The electric field was described by Equation 7.10 for a finite inhomogeneous model. This equation is repeated here: (13.01) While for most excitable tissue the basis for the impressed current density i is the propagating action potential, for the EEG it appears to arise from the action of a chemical transmitter on postsynaptic cortical neurons. The action
2 causes localized depolarization - that is, an excitatory postsynaptic potential (EPSP) - or hyperpolarization - that is, an inhibitory postsynaptic potential (IPSP). The result in either case is a spatially distributed discontinuity in the function σφ (i.e., σ o Φ o - σ i Φ i ) which, as pointed out in Equation 8.28, evaluates a double layer source in the membranes of all cells. This will be zero for resting cells; however, when a cell is active by any of the aforementioned processes (in which case Φ o - Φ i = V m varies over a cell surface), a nonzero primary source will result. For distant field points the double layer can be summed up vectorially, yielding a net dipole for each active cell. Since neural tissue is generally composed of a very large number of small, densely packed cells, the discussion in Section 8.5 applies, leading to the identification of a continuous volume source distribution i which appears in Equations 7.6 and Although in principle the EEG can be found from the evaluation of Equation 7.10, the complexity of brain structure and its electrophysiological behavior have thus far precluded the evaluation of the source function i. Consequently, the quantitative study of the EEG differs from that of the ECG or EMG, in which it is possible to evaluate the source function. Under these conditions the quantitative EEG is based on a statistical treatment, whereas the clinical EEG is largely empirical.. Fig Frequency spectrum of normal EEG EEG LEAD SYSTEMS The internationally standardized system is usually employed to record the spontaneous EEG. In this system 21 electrodes are located on the surface of the scalp, as shown in Figure 13.2A and B. The positions are determined as follows: Reference points are nasion, which is the delve at the top of the nose, level with the eyes; and inion, which is the bony lump at the base of the skull on the midline at the back of the head. From these points, the skull perimeters are measured in the transverse and median planes. Electrode locations are determined by dividing these perimeters into 10% and 20% intervals. Three other electrodes are placed on each side equidistant from the neighboring points, as shown in Figure 13.2B (Jasper, 1958; Cooper, Osselton, and Shaw, 1969). In addition to the 21 electrodes of the international system, intermediate 10% electrode positions are also used. The locations and nomenclature of these electrodes are standardized by the American Electroencephalographic Society (Sharbrough et al., 1991; see Figure 13.2C). In this recommendation, four electrodes have different names compared to the system; these are T 7, T 8, P 7, and P 8. These electrodes are drawn black with white text in the figure.
.")
.")
3 Besides the international system, many other electrode systems exist for recording electric potentials on the scalp. The Queen Square system of electrode placement has been proposed as a standard in recording the pattern of evoked potentials in clinical testings (Blumhardt et al., 1977). Bipolar or unipolar electrodes can be used in the EEG measurement. In the first method the potential difference between a pair of electrodes is measured. In the latter method the potential of each electrode is compared either to a neutral electrode or to the average of all electrodes (see Figure 13.3). The most recent guidelines for EEG-recording are published in (Gilmore, 1994). Fig The international system seen from (A) left and (B) above the head. A = Ear lobe, C = central, Pg = nasopharyngeal, P = parietal, F = frontal, Fp = frontal polar, O = occipital. (C) Location and nomenclature of the intermediate 10% electrodes, as standardized by the American Electroencephalographic Society. (Redrawn from Sharbrough, 1991.).
 Bipolar and (B) unipolar measurements. Note that the waveform of the EEG depends on the measurement location. 13.")
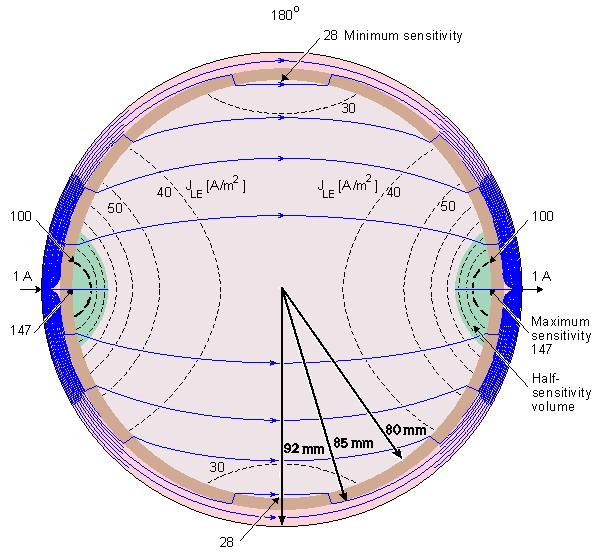
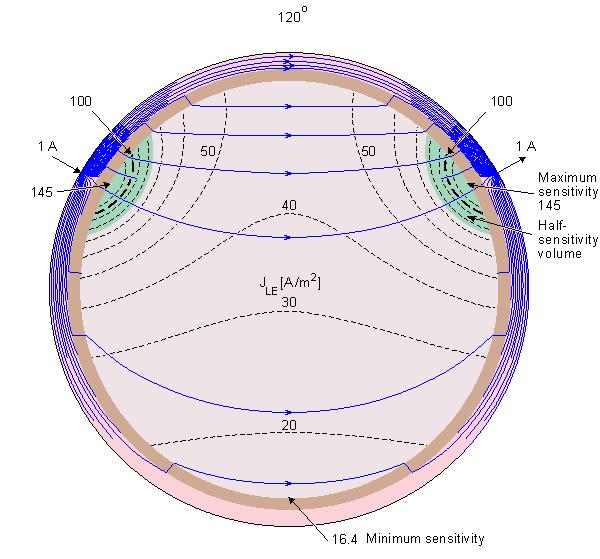
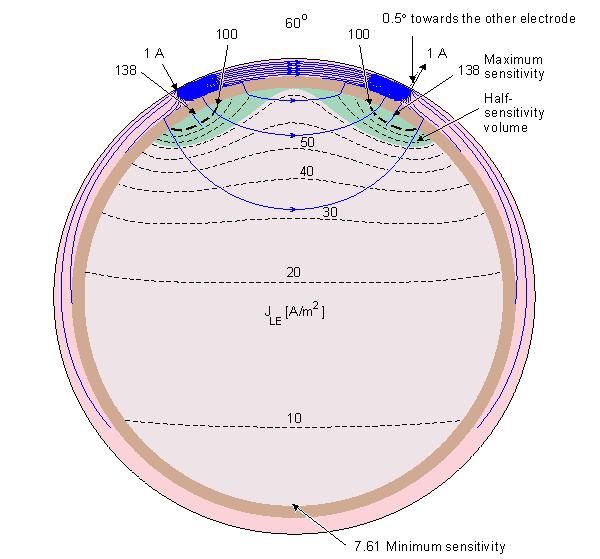
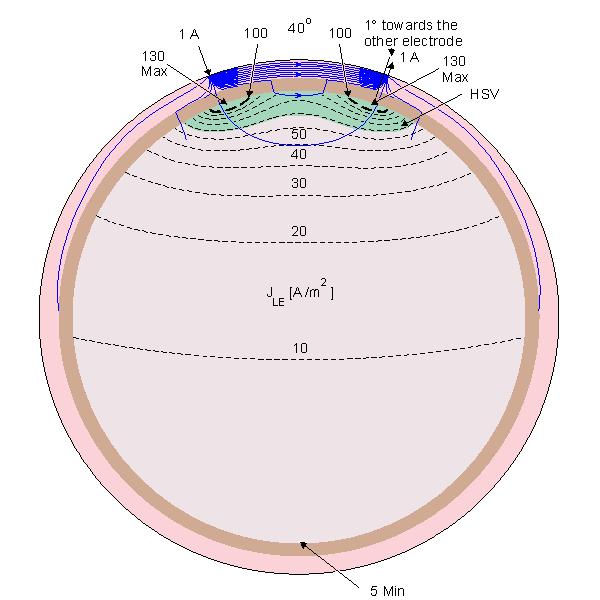
4 Fig (A) Bipolar and (B) unipolar measurements. Note that the waveform of the EEG depends on the measurement location SENSITIVITY DISTRIBUTION OF EEG ELECTRODES Rush and Driscoll (1969) calculated the sensitivity distribution of bipolar surface electrodes on the scalp based on a concentric spherical head model. They published the results in the form of lead field isopotential lines. The direction of the lead field current density - that is, the direction of the sensitivity - is a negative gradient of the potential field. This is not immediately evident from such a display. Puikkonen and Malmivuo (1987) recalculated the sensitivity distribution of EEG electrodes with the same model as Rush and Driscoll, but they presented the results with the lead field current flow lines instead of the isopotential lines of the lead field. This display is illustrative since it is easy to find the direction of the sensitivity from the lead field current flow lines. Also the magnitude of the sensitivity can be seen from the density of the flow lines. A minor problem in this display is that because the lead field current distributes both in the plane of the illustration as well as in the plane normal to it, part of the flow lines must break in order to illustrate correctly the current density with the flow line density in a three-dimensional problem. Suihko, Malmivuo and Eskola (1993) calculated further the isosensitivity lines and the half-sensitivity volume for the electric leads. As discussed in Section , the concept half-sensitivity volume denotes the area where the lead field current density is at least one half from its maximum value. Thus this concept is a figure of merit to describe how concentrated the sensitivity distribution of the lead is. As discussed in Section , when the conductivity is isotropic, as it is in this head model, the isosensitivity lines equal to the isofield lines of the (reciprocal) electric field. If the lead would exhibit such a symmetry that adjacent isopotential surfaces would be a constant distance apart, the isosensitivity lines would coincide with the isopotential lines. That is not the case in the leads of Figure Figure 13.4 displays the lead field current flow lines, isosensitivity lines and half-sensitivity volumes for the spherical head model with the electrodes located within 180, 120, 60, 40, and 20 angles. Note that in each case the two electrodes are connected with 10 continuous lead field flow lines. Between them are three flow lines which are broken from the center, indicating that the lead field current distributes also in the plane normal to the paper. The figure shows clearly the strong effect of the poorly conducting skull to the lead field. Though in a homogeneous model the sensitivity would be highly concentrated at the electrodes, in the 180 case the skull allows the sensitivity to be very homogeneously distributed throughout the brain region. The closer the electrodes are to each other, the smaller the part of the sensitivity that locates within the brain region. Locating the electrodes closer and closer to each other causes the lead field current to flow more and more within the skin region, decreasing the sensitivity to the brain region and increasing the noise.
5
6
7
8
, isosensitivity lines (dotted lines) and the half-sensitivity volumes (shaded region).")
9 Fig Sensitivity distribution of EEG electrodes in the spherical head model. The figure illustrates the lead field current flow lines (thin solid lines), isosensitivity lines (dotted lines) and the half-sensitivity volumes (shaded region). The sensitivity distribution is in the direction of the flow lines, and its magnitude is proportional to the density of the flow lines. The lead pair are designated by small arrows at the surface of the scalp and are separated by an angle of 180, 120, 60, 40, and 20 shown at the top of each figure THE BEHAVIOR OF THE EEG SIGNAL From the EEG signal it is possible to differentiate alpha (α), beta (β), delta (δ), and theta (Θ) waves as well as spikes associated with epilepsy. An example of each waveform is given in Figure The alpha waves have the frequency spectrum of 8-13 Hz and can be measured from the occipital region in an awake person when the eyes are closed. The frequency band of the beta waves is Hz; these are detectable over the parietal and frontal lobes. The delta waves have the frequency range of Hz and are detectable in infants and sleeping adults. The theta waves have the frequency range of 4-8 Hz and are obtained from children and sleeping adults..
10 Fig Some examples of EEG waves THE BASIC PRINCIPLES OF EEG DIAGNOSIS The EEG signal is closely related to the level of consciousness of the person. As the activity increases, the EEG shifts to higher dominating frequency and lower amplitude. When the eyes are closed, the alpha waves begin to dominate the EEG. When the person falls asleep, the dominant EEG frequency decreases. In a certain phase of sleep, rapid eye movement called (REM) sleep, the person dreams and has active movements of the eyes, which can be seen as a characteristic EEG signal. In deep sleep, the EEG has large and slow deflections called delta waves. No cerebral activity can be detected from a patient with complete cerebral death. Examples of the above-mentioned waveforms are given in Figure
11 Fig EEG activity is dependent on the level of consciousness. REFERENCES Berger H (1929): Über das Elektroenkephalogram des Menschen. Arch. f. Psychiat. 87: Blumhardt LD, Barrett G, Halliday AM, Kriss A (1977): The asymmetrical visual evoked potential to pattern reversal in one half field and its significance for the analysis of visual field effects. Br. J. Ophthalmol. 61: Cooper R, Osselton JW, Shaw JC (1969): EEG Technology, 2nd ed., 275 pp. Butterworths, London. Gilmore RL (1994): J. Clin. Neurophysiol RL Gilmore (ed.): American Electroencephalographic Society guidelines in electroencephalography, evoked potentials, and polysomnography, J. Clin. Neurophysiol. 11:(1, January) 147 pp. Jasper HH (1958): Report of the Committee on Methods of Clinical Examination in Electroencephalography. Electroenceph. Clin. Neurophysiol. 10: Nunez PL (1981): Electric Fields of the Brain: The Neurophysics of EEG, 484 pp. Oxford University Press, New York. Puikkonen J, Malmivuo JA (1987): Theoretical investigation of the sensitivity distribution of point EEG-electrodes on the three concentric spheres model of a human head - An application of the reciprocity theorem. Tampere Univ. Techn., Inst. Biomed. Eng., Reports 1:(5) 71. Rush S, Driscoll DA (1969): EEG-electrode sensitivity - An application of reciprocity. IEEE Trans. Biomed. Eng. BME-16:(1) Sharbrough F, Chatrian G-E, Lesser RP, Lüders H, Nuwer M, Picton TW (1991): American Electroencephalographic Society Guidelines for Standard Electrode Position Nomenclature. J. Clin. Neurophysiol 8: Suihko V, Malmivuo JA, Eskola H (1993): Distribution of sensitivity of electric leads in an inhomogeneous spherical head model. Tampere Univ. Techn., Ragnar Granit Inst., Rep. 7:(2).
5.4 ANATOMY AND PHYSIOLOGY OF THE BRAIN Introduction
 5.4 ANATOMY AND PHYSIOLOGY OF THE BRAIN 5.4.1 Introduction Action pulses generated at the distal end of sensory neurons propagate first to the cell body and then onward, conveyed by long axonal pathways.
Electroencephalography
 The electroencephalogram (EEG) is a measure of brain waves. It is a readily available test that provides evidence of how the brain functions over time. The EEG is used in the evaluation of brain disorders.
Practical 3 Nervous System Physiology 2 nd year English Module. Dept. of Physiology, Carol Davila University of Medicine and Pharmacy
 Electroencephalography l h (EEG) Practical 3 Nervous System Physiology 2 nd year English Module Dept. of Physiology, Carol Davila University of Medicine and Pharmacy What is EEG EEG noninvasively records
CHAPTER 6 INTERFERENCE CANCELLATION IN EEG SIGNAL
 116 CHAPTER 6 INTERFERENCE CANCELLATION IN EEG SIGNAL 6.1 INTRODUCTION Electrical impulses generated by nerve firings in the brain pass through the head and represent the electroencephalogram (EEG). Electrical
Biomedical Research 2013; 24 (3): ISSN X
: ISSN X") Biomedical Research 2013; 24 (3): 359-364 ISSN 0970-938X http://www.biomedres.info Investigating relative strengths and positions of electrical activity in the left and right hemispheres of the human brain
Biomedical Research 2013; 24 (3): 359-364 ISSN 0970-938X http://www.biomedres.info Investigating relative strengths and positions of electrical activity in the left and right hemispheres of the human brain
Physiology Unit 2 CONSCIOUSNESS, THE BRAIN AND BEHAVIOR
 Physiology Unit 2 CONSCIOUSNESS, THE BRAIN AND BEHAVIOR In Physiology Today What the Brain Does The nervous system determines states of consciousness and produces complex behaviors Any given neuron may
states of brain activity sleep, brain waves DR. S. GOLABI PH.D. IN MEDICAL PHYSIOLOGY
 states of brain activity sleep, brain waves DR. S. GOLABI PH.D. IN MEDICAL PHYSIOLOGY introduction all of us are aware of the many different states of brain activity, including sleep, wakefulness, extreme
Effects of Light Stimulus Frequency on Phase Characteristics of Brain Waves
 SICE Annual Conference 27 Sept. 17-2, 27, Kagawa University, Japan Effects of Light Stimulus Frequency on Phase Characteristics of Brain Waves Seiji Nishifuji 1, Kentaro Fujisaki 1 and Shogo Tanaka 1 1
Electroencephalographic Study of Essential Oils for Stress Relief
 Applied Mechanics and Materials Online: 2013-10-11 ISSN: 1662-7482, Vol. 437, pp 1085-1088 doi:10.4028/www.scientific.net/amm.437.1085 2013 Trans Tech Publications, Switzerland Electroencephalographic
Physiology Unit 2 CONSCIOUSNESS, THE BRAIN AND BEHAVIOR
 Physiology Unit 2 CONSCIOUSNESS, THE BRAIN AND BEHAVIOR What the Brain Does The nervous system determines states of consciousness and produces complex behaviors Any given neuron may have as many as 200,000
This presentation is the intellectual property of the author. Contact them for permission to reprint and/or distribute.
 Modified Combinatorial Nomenclature Montage, Review, and Analysis of High Density EEG Terrence D. Lagerlund, M.D., Ph.D. CP1208045-16 Disclosure Relevant financial relationships None Off-label/investigational
Neurorobotics, and brain-machine interfaces. Oct. 10 th, 2006.
 Neurorobotics, and brain-machine interfaces Oct. 10 th, 2006. Catching up from last class Pg 121 Wessberg ( ) Nicolelis, Real-time prediction of hand trajectory by ensembles of cortical neurons in primates
Introduction to EEG del Campo. Introduction to EEG. J.C. Martin del Campo, MD, FRCP University Health Network Toronto, Canada
 Introduction to EEG J.C. Martin, MD, FRCP University Health Network Toronto, Canada What is EEG? A graphic representation of the difference in voltage between two different cerebral locations plotted over
Introduction to the EEG technique
 Introduction to the EEG technique Part 1: neural origins of the EEG Niko Busch Charité University Medicine Berlin The History of the EEG 18th cent. Physiologists discover elctrical properties of living
Models and Physiology of Macroscopic Brain Ac5vity. Jose C. Principe University of Florida
 Models and Physiology of Macroscopic Brain Ac5vity Jose C. Principe University of Florida Literature W. Freeman- Mass Ac5on in the Nervous System P. Nunez Electric Fields of the Brain H. Berger- On the
The Sonification of Human EEG and other Biomedical Data. Part 3
 The Sonification of Human EEG and other Biomedical Data Part 3 The Human EEG A data source for the sonification of cerebral dynamics The Human EEG - Outline Electric brain signals Continuous recording
PD233: Design of Biomedical Devices and Systems
 PD233: Design of Biomedical Devices and Systems (Lecture-7 Biopotentials- 2) Dr. Manish Arora CPDM, IISc Course Website: http://cpdm.iisc.ac.in/utsaah/courses/ Electromyogram (EMG) Skeletal muscles are
STRUCTURAL ELEMENTS OF THE NERVOUS SYSTEM
 STRUCTURAL ELEMENTS OF THE NERVOUS SYSTEM STRUCTURE AND MAINTENANCE OF NEURONS (a) (b) Dendrites Cell body Initial segment collateral terminals (a) Diagrammatic representation of a neuron. The break in
EEG History. Where and why is EEG used? 8/2/2010
 EEG History Hans Berger 1873-1941 Edgar Douglas Adrian, an English physician, was one of the first scientists to record a single nerve fiber potential Although Adrian is credited with the discovery of
Sleep stages. Awake Stage 1 Stage 2 Stage 3 Stage 4 Rapid eye movement sleep (REM) Slow wave sleep (NREM)
 Slow wave sleep (NREM)") Sleep stages Awake Stage 1 Stage 2 Stage 3 Stage 4 Rapid eye movement sleep (REM) Slow wave sleep (NREM) EEG waves EEG Electrode Placement Classifying EEG brain waves Frequency: the number of oscillations/waves
Sleep stages Awake Stage 1 Stage 2 Stage 3 Stage 4 Rapid eye movement sleep (REM) Slow wave sleep (NREM) EEG waves EEG Electrode Placement Classifying EEG brain waves Frequency: the number of oscillations/waves
STRUCTURAL ORGANIZATION OF THE NERVOUS SYSTEM
 STRUCTURAL ORGANIZATION OF THE NERVOUS SYSTEM STRUCTURAL ORGANIZATION OF THE BRAIN The central nervous system (CNS), consisting of the brain and spinal cord, receives input from sensory neurons and directs
EEG Instrumentation, Montage, Polarity, and Localization
 EEG Instrumentation, Montage, Polarity, and Localization 2 Krikor Tufenkjian The Source of EEG The source of the EEG potentials recorded from the scalp is the excitatory and inhibitory postsynaptic potentials
Introduction to Electrophysiology
 Introduction to Electrophysiology Dr. Kwangyeol Baek Martinos Center for Biomedical Imaging Massachusetts General Hospital Harvard Medical School 2018-05-31s Contents Principles in Electrophysiology Techniques
EEG, ECG, EMG. Mitesh Shrestha
 EEG, ECG, EMG Mitesh Shrestha What is Signal? A signal is defined as a fluctuating quantity or impulse whose variations represent information. The amplitude or frequency of voltage, current, electric field
PSD Analysis of Neural Spectrum During Transition from Awake Stage to Sleep Stage
 PSD Analysis of Neural Spectrum During Transition from Stage to Stage Chintan Joshi #1 ; Dipesh Kamdar #2 #1 Student,; #2 Research Guide, #1,#2 Electronics and Communication Department, Vyavasayi Vidya
Brain and Cognition. Cognitive Neuroscience. If the brain were simple enough to understand, we would be too stupid to understand it
 Brain and Cognition Cognitive Neuroscience If the brain were simple enough to understand, we would be too stupid to understand it 1 The Chemical Synapse 2 Chemical Neurotransmission At rest, the synapse
Active Electric Biosignals Part III: Biosignals of f Next Organs
 Active Electric Biosignals Part III: Biosignals of f Next Organs Assoc. Prof. Katarína Kozlíkov ková,, RN., PhD. IMPhBPhITM FM CU in Bratislava katarina.kozlikova@fmed.uniba.sk The presentation is a part
Recording Cortical EEG Subcortically Improved EEG Monitoring from Depth-Stimulation Electrodes
 NFSI & ICBEM, Banff, Canada, May 13-15, 2011 Recording Cortical EEG Subcortically Improved EEG Monitoring from Depth-Stimulation Electrodes Katrina Wendel 1 *, Kalervo Suominen 2, Pasi Kauppinen 1, Eila
AUTOCORRELATION AND CROSS-CORRELARION ANALYSES OF ALPHA WAVES IN RELATION TO SUBJECTIVE PREFERENCE OF A FLICKERING LIGHT
 AUTOCORRELATION AND CROSS-CORRELARION ANALYSES OF ALPHA WAVES IN RELATION TO SUBJECTIVE PREFERENCE OF A FLICKERING LIGHT Y. Soeta, S. Uetani, and Y. Ando Graduate School of Science and Technology, Kobe
Physiological and Physical Basis of Functional Brain Imaging 6. EEG/MEG. Kâmil Uludağ, 20. November 2007
 Physiological and Physical Basis of Functional Brain Imaging 6. EEG/MEG Kâmil Uludağ, 20. November 2007 Course schedule 1. Overview 2. fmri (Spin dynamics, Image formation) 3. fmri (physiology) 4. fmri
Quantitative Electrophysiology
 ECE 795: Quantitative Electrophysiology Notes for Lecture #10 Wednesday, November 22, 2006 14. FUNDAMENTALS OF FUNCTIONAL ELECTRICAL STIMULATION (FES) We will look at: Design issues for FES Subthreshold
Neurons. Pyramidal neurons in mouse cerebral cortex expressing green fluorescent protein. The red staining indicates GABAergic interneurons.
 Neurons Pyramidal neurons in mouse cerebral cortex expressing green fluorescent protein. The red staining indicates GABAergic interneurons. MBL, Woods Hole R Cheung MSc Bioelectronics: PGEE11106 1 Neuron
Chapter 2--Introduction to the Physiology of Perception
 Chapter 2--Introduction to the Physiology of Perception Student: 1. Our perception of the environment depends on A. the properties of the objects in the environment. B. the properties of the electrical
ISSN: (Online) Volume 3, Issue 7, July 2015 International Journal of Advance Research in Computer Science and Management Studies
 Volume 3, Issue 7, July 2015 International Journal of Advance Research in Computer Science and Management Studies") ISSN: 2321-7782 (Online) Volume 3, Issue 7, July 2015 International Journal of Advance Research in Computer Science and Management Studies Research Article / Survey Paper / Case Study Available online
ISSN: 2321-7782 (Online) Volume 3, Issue 7, July 2015 International Journal of Advance Research in Computer Science and Management Studies Research Article / Survey Paper / Case Study Available online
Spatial localisation of EEG dipoles in MRI using the International System anatomical references
 Proc. of First Int'l Workshop on Image and Signal Processing and Analysis Spatial localisation of EEG dipoles in MRI using the 10-20 International System anatomical references J. Pascau a,b, M. Desco a,
Lesson 14. The Nervous System. Introduction to Life Processes - SCI 102 1
 Lesson 14 The Nervous System Introduction to Life Processes - SCI 102 1 Structures and Functions of Nerve Cells The nervous system has two principal cell types: Neurons (nerve cells) Glia The functions
EEG in Medical Practice
 EEG in Medical Practice Dr. Md. Mahmudur Rahman Siddiqui MBBS, FCPS, FACP, FCCP Associate Professor, Dept. of Medicine Anwer Khan Modern Medical College What is the EEG? The brain normally produces tiny
EEG in the ICU: Part I
 EEG in the ICU: Part I Teneille E. Gofton July 2012 Objectives To outline the importance of EEG monitoring in the ICU To briefly review the neurophysiological basis of EEG To introduce formal EEG and subhairline
Action potential. Definition: an all-or-none change in voltage that propagates itself down the axon
 Action potential Definition: an all-or-none change in voltage that propagates itself down the axon Action potential Definition: an all-or-none change in voltage that propagates itself down the axon Naturally
: Biomedical Signal Processing
 : Biomedical Signal Processing 0. Introduction: Biomedical signal processing refers to the applications of signal processing methods, such as Fourier transform, spectral estimation and wavelet transform,
Introduction (1) Nervous System & EEG. Introduction (2)
 Nervous System & EEG. Introduction (2)") Introduction () Nervous System & EEG Achmad Rizal BioSPIN Chapter 7, Biointrumentation, Webster Nervous system is defined as all cell, tissues, and organ that regulate the body s response to internal &
Introduction () Nervous System & EEG Achmad Rizal BioSPIN Chapter 7, Biointrumentation, Webster Nervous system is defined as all cell, tissues, and organ that regulate the body s response to internal &
Neurophysiology & EEG
 Neurophysiology & EEG PG4 Core Curriculum Ian A. Cook, M.D. Associate Director, Laboratory of Brain, Behavior, & Pharmacology UCLA Department of Psychiatry & Biobehavioral Sciences Semel Institute for
Emotion Detection Using Physiological Signals. M.A.Sc. Thesis Proposal Haiyan Xu Supervisor: Prof. K.N. Plataniotis
 Emotion Detection Using Physiological Signals M.A.Sc. Thesis Proposal Haiyan Xu Supervisor: Prof. K.N. Plataniotis May 10 th, 2011 Outline Emotion Detection Overview EEG for Emotion Detection Previous
Electrophysiology. General Neurophysiology. Action Potentials
 5 Electrophysiology Cochlear implants should aim to reproduce the coding of sound in the auditory system as closely as possible, for best sound perception. The cochlear implant is in part the result of
Separation Of,, & Activities In EEG To Measure The Depth Of Sleep And Mental Status
 Separation Of,, & Activities In EEG To Measure The Depth Of Sleep And Mental Status Shah Aqueel Ahmed 1, Syed Abdul Sattar 2, D. Elizabath Rani 3 1. Royal Institute Of Technology And Science, R. R. Dist.,
EE 4BD4 Lecture 11. The Brain and EEG
 EE 4BD4 Lecture 11 The Brain and EEG 1 Brain Wave Recordings Recorded extra-cellularly from scalp (EEG) Recorded from extra-cellularly from surface of cortex (ECOG) Recorded extra-cellularly from deep
Outline of Talk. Introduction to EEG and Event Related Potentials. Key points. My path to EEG
 Outline of Talk Introduction to EEG and Event Related Potentials Shafali Spurling Jeste Assistant Professor in Psychiatry and Neurology UCLA Center for Autism Research and Treatment Basic definitions and
The AASM Manual for the Scoring of Sleep and Associated Events
 The AASM Manual for the Scoring of Sleep and Associated Events Summary of Updates in Version 2.1 July 1, 2014 The American Academy of Sleep Medicine (AASM) is committed to ensuring that The AASM Manual
INTERNATIONAL JOURNAL OF ELECTRONICS AND COMMUNICATION ENGINEERING & TECHNOLOGY (IJECET)
") INTERNATIONAL JOURNAL OF ELECTRONICS AND COMMUNICATION ENGINEERING & TECHNOLOGY (IJECET) International Journal of Electronics and Communication Engineering & Technology (IJECET), ISSN 0976 ISSN 0976 6464(Print)
INTERNATIONAL JOURNAL OF ELECTRONICS AND COMMUNICATION ENGINEERING & TECHNOLOGY (IJECET) International Journal of Electronics and Communication Engineering & Technology (IJECET), ISSN 0976 ISSN 0976 6464(Print)
University of Cyprus Biomedical Imaging and Applied Optics. ECE 370 Introduction to Biomedical Engineering. Bioelectricity
 University of Cyprus Biomedical Imaging and Applied Optics ECE 370 Introduction to Biomedical Engineering Bioelectricity Membrane Potential Opposite charges attract and similar repel Membrane potential
EEG and some applications (seizures and sleep)
") EEG and some applications (seizures and sleep) EEG: stands for electroencephalography and is a graphed representation of the electrical activity of the brain. EEG is the recording of electrical activity
EEG and some applications (seizures and sleep) EEG: stands for electroencephalography and is a graphed representation of the electrical activity of the brain. EEG is the recording of electrical activity
Neural Correlates of Human Cognitive Function:
 Neural Correlates of Human Cognitive Function: A Comparison of Electrophysiological and Other Neuroimaging Approaches Leun J. Otten Institute of Cognitive Neuroscience & Department of Psychology University
Chapter 11 Introduction to the Nervous System and Nervous Tissue Chapter Outline
 Chapter 11 Introduction to the Nervous System and Nervous Tissue Chapter Outline Module 11.1 Overview of the Nervous System (Figures 11.1-11.3) A. The nervous system controls our perception and experience
MOTOR EVOKED POTENTIALS AND TRANSCUTANEOUS MAGNETO-ELECTRICAL NERVE STIMULATION
 MOTOR EVOKED POTENTIAS AND TRANSCUTANEOUS MAGNETO-EECTRICA NERVE STIMUATION Hongguang iu, in Zhou 1 and Dazong Jiang Xian Jiaotong University, Xian, People s Republic of China 1 Shanxi Normal University,
QEEG markers in stroke, ageing and cognitive decline
 QEEG markers in stroke, ageing and cognitive decline When is theta actually alpha? Simon Finnigan Senior Research Fellow UQ Centre for Clinical Research & Royal Brisbane Clinical Unit University of Queensland,
Selection of Feature for Epilepsy Seizer Detection Using EEG
 International Journal of Neurosurgery 2018; 2(1): 1-7 http://www.sciencepublishinggroup.com/j/ijn doi: 10.11648/j.ijn.20180201.11 Selection of Feature for Epilepsy Seizer Detection Using EEG Manisha Chandani
LESSON 1.3 WORKBOOK. How can we study the behaving brain?
 LESSON 1.3 WORKBOOK How can we study the behaving brain? We are in the middle of a technological revolution when it comes to how closely we can look at the behaving brain. Scientists and doctors now have
Functional Connectivity and the Neurophysics of EEG. Ramesh Srinivasan Department of Cognitive Sciences University of California, Irvine
 Functional Connectivity and the Neurophysics of EEG Ramesh Srinivasan Department of Cognitive Sciences University of California, Irvine Outline Introduce the use of EEG coherence to assess functional connectivity
Theme 2: Cellular mechanisms in the Cochlear Nucleus
 Theme 2: Cellular mechanisms in the Cochlear Nucleus The Cochlear Nucleus (CN) presents a unique opportunity for quantitatively studying input-output transformations by neurons because it gives rise to
Lesson 5 EEG 1 Electroencephalography: Brain Rhythms
 Physiology Lessons for use with the Biopac Science Lab MP40 PC running Windows XP or Mac OS X 10.3-10.4 Lesson 5 EEG 1 Electroencephalography: Brain Rhythms Lesson Revision 2.23.2006 BIOPAC Systems, Inc.
The Nervous System. Neuron 01/12/2011. The Synapse: The Processor
 The Nervous System Neuron Nucleus Cell body Dendrites they are part of the cell body of a neuron that collect chemical and electrical signals from other neurons at synapses and convert them into electrical
Effects of Inhibitory Synaptic Current Parameters on Thalamocortical Oscillations
 Effects of Inhibitory Synaptic Current Parameters on Thalamocortical Oscillations 1 2 3 4 5 Scott Cole Richard Gao Neurosciences Graduate Program Department of Cognitive Science University of California,
Restoring Communication and Mobility
 Restoring Communication and Mobility What are they? Artificial devices connected to the body that substitute, restore or supplement a sensory, cognitive, or motive function of the nervous system that has
Event Related Potentials: Significant Lobe Areas and Wave Forms for Picture Visual Stimulus
 Available Online at www.ijcsmc.com International Journal of Computer Science and Mobile Computing A Monthly Journal of Computer Science and Information Technology ISSN 2320 088X IMPACT FACTOR: 6.017 IJCSMC,
Brain Computer Interface. Mina Mikhail
 Brain Computer Interface Mina Mikhail minamohebn@gmail.com Introduction Ways for controlling computers Keyboard Mouse Voice Gestures Ways for communicating with people Talking Writing Gestures Problem
What do you notice? Woodman, Atten. Percept. Psychophys., 2010
 What do you notice? Woodman, Atten. Percept. Psychophys., 2010 You are trying to determine if a small amplitude signal is a consistent marker of a neural process. How might you design an experiment to
Localization a quick look
 Localization a quick look Covering the basics Differential amplifiers Polarity convention 10-20 electrode system Basic montages: bipolar and referential Other aspects of displaying the EEG Localization
Nature Neuroscience: doi: /nn Supplementary Figure 1. Large-scale calcium imaging in vivo.
 Supplementary Figure 1 Large-scale calcium imaging in vivo. (a) Schematic illustration of the in vivo camera imaging set-up for large-scale calcium imaging. (b) High-magnification two-photon image from
EEG Electrode Placement
 EEG Electrode Placement Classifying EEG brain waves Frequency: the number of oscillations/waves per second, measured in Hertz (Hz) reflects the firing rate of neurons alpha, beta, theta, delta Amplitude:
EEG- A Brief Introduction
 Fatemeh Hadaeghi EEG- A Brief Introduction Lecture Notes for BSP, Chapter 4 Master Program Data Engineering 1 4 Introduction Human brain, as the most complex living structure in the universe, has been
Ameen Alsaras. Ameen Alsaras. Mohd.Khatatbeh
 9 Ameen Alsaras Ameen Alsaras Mohd.Khatatbeh Nerve Cells (Neurons) *Remember: The neural cell consists of: 1-Cell body 2-Dendrites 3-Axon which ends as axon terminals. The conduction of impulse through
Outline. Neuron Structure. Week 4 - Nervous System. The Nervous System: Neurons and Synapses
 Outline Week 4 - The Nervous System: Neurons and Synapses Neurons Neuron structures Types of neurons Electrical activity of neurons Depolarization, repolarization, hyperpolarization Synapses Release of
Na + K + pump. The beauty of the Na + K + pump. Cotransport. The setup Cotransport the result. Found along the plasma membrane of all cells.
 The beauty of the Na + K + pump Na + K + pump Found along the plasma membrane of all cells. Establishes gradients, controls osmotic effects, allows for cotransport Nerve cells have a Na + K + pump and
Normal EEG of wakeful resting adults of years of age. Alpha rhythm. Alpha rhythm. Alpha rhythm. Normal EEG of the wakeful adult at rest
 Normal EEG of wakeful resting adults of 20-60 years of age Suthida Yenjun, M.D. Normal EEG of the wakeful adult at rest Alpha rhythm Beta rhythm Mu rhythm Vertex sharp transients Intermittent posterior
BENG 260 Supplementary neurophysiology slides
 BENG 260 Supplementary neurophysiology slides Fall 2013 Slides are taken from Vander s Human Physiology, 11 th edition, McGraw Hill (ISBN 0077216091)" These slides cover:" Chapter 6, Neuronal Signaling
Supplemental Digital Content 1: Supplemental Results
 Supplemental Digital Content 1: Supplemental Results Fig. 1 presents the normalized symbolic transfer entropy (NSTE) matrix of eight electroencephalographic channels and significant changes of connectivity
Resonant synchronization of heterogeneous inhibitory networks
 Cerebellar oscillations: Anesthetized rats Transgenic animals Recurrent model Review of literature: γ Network resonance Life simulations Resonance frequency Conclusion Resonant synchronization of heterogeneous
EEG SPIKE CLASSIFICATION WITH TEMPLATE MATCHING ALGORITHM. Çamlık Caddesi No:44 Sarnıç Beldesi İZMİR 2 Elektrik ve Elektronik Müh.
 EEG SPIKE CLASSIFICATION WITH TEMPLATE MATCHING ALGORITHM Selim BÖLGEN 1 Gülden KÖKTÜRK 2 1 Pagetel Sistem Müh. San. Tic. Ltd. Şti. Çamlık Caddesi No:44 Sarnıç Beldesi İZMİR 2 Elektrik ve Elektronik Müh.
Nerve. (2) Duration of the stimulus A certain period can give response. The Strength - Duration Curve
 Duration of the stimulus A certain period can give response. The Strength - Duration Curve") Nerve Neuron (nerve cell) is the structural unit of nervous system. Nerve is formed of large numbers of nerve fibers. Types of nerve fibers Myelinated nerve fibers Covered by myelin sheath interrupted
Nerve Neuron (nerve cell) is the structural unit of nervous system. Nerve is formed of large numbers of nerve fibers. Types of nerve fibers Myelinated nerve fibers Covered by myelin sheath interrupted
The secrets of conventional EEG
 The secrets of conventional EEG The spike/sharp wave activity o Electro-clinical characteristics of Spike/Sharp wave The polymorphic delta activity o Electro-clinical characteristics of Polymorphic delta
What is Anatomy and Physiology?
 Introduction BI 212 BI 213 BI 211 Ecosystems Organs / organ systems Cells Organelles Communities Tissues Molecules Populations Organisms Campbell et al. Figure 1.4 Introduction What is Anatomy and Physiology?
Spectro-temporal response fields in the inferior colliculus of awake monkey
 3.6.QH Spectro-temporal response fields in the inferior colliculus of awake monkey Versnel, Huib; Zwiers, Marcel; Van Opstal, John Department of Biophysics University of Nijmegen Geert Grooteplein 655
Students will be able to determine what stage of sleep someone is in by analyzing their EEG.
 Outline 2Lesson Unit1.2 OVERVIEW Rationale: This lesson is intended to engage students with the concept of the neural circuit. The lesson and unit as a whole use sleep, a behavior everyone is familiar
Electroencephalogram (EEG) Hsiao-Lung Chan Dept Electrical Engineering Chang Gung University
 Hsiao-Lung Chan Dept Electrical Engineering Chang Gung University") Electroencephalogram (EEG) Hsiao-Lung Chan Dept Electrical Engineering Chang Gung University chanhl@mail.cgu.edu.tw Cerebral function examination Electroencephalography (EEG) Near infrared ray spectroscopy
Electroencephalogram (EEG) Hsiao-Lung Chan Dept Electrical Engineering Chang Gung University chanhl@mail.cgu.edu.tw Cerebral function examination Electroencephalography (EEG) Near infrared ray spectroscopy
ANALYSIS OF BRAIN SIGNAL FOR THE DETECTION OF EPILEPTIC SEIZURE
 ANALYSIS OF BRAIN SIGNAL FOR THE DETECTION OF EPILEPTIC SEIZURE Sumit Kumar Srivastava 1, Sharique Ahmed 2, Mohd Maroof Siddiqui 3 1,2,3 Department of EEE, Integral University ABSTRACT The electroencephalogram
Thalamo-Cortical Relationships Ultrastructure of Thalamic Synaptic Glomerulus
 Central Visual Pathways V1/2 NEUR 3001 dvanced Visual Neuroscience The Lateral Geniculate Nucleus () is more than a relay station LP SC Professor Tom Salt UCL Institute of Ophthalmology Retina t.salt@ucl.ac.uk
Basic Mechanism for Generation of Brain Rhythms
 203 Continuing Medical Education Basic Mechanism for Generation of Brain Rhythms Wei-Hung Chen Abstract- Study of the basic mechanism of brain rhythms adds to our understanding of the underlying processes
Matrix Energetics Research Brainwaves and Heart waves Research on Matrix Energetics in Action
 Matrix Energetics Research Brainwaves and Heart waves Research on Matrix Energetics in Action QEEG (quantitative electroencephalography) and HRV (heart rate variability analysis) tests revealed Dr. Richard
Stacked generalization for early diagnosis of Alzheimer's disease
 Rowan University Rowan Digital Works Theses and Dissertations 4-25-2007 Stacked generalization for early diagnosis of Alzheimer's disease Hardik P. Gandhi Rowan University Follow this and additional works
Omar Sami. Muhammad Abid. Muhammad khatatbeh
 10 Omar Sami Muhammad Abid Muhammad khatatbeh Let s shock the world In this lecture we are going to cover topics said in previous lectures and then start with the nerve cells (neurons) and the synapses
Neuro Q no.2 = Neuro Quotient
 TRANSDISCIPLINARY RESEARCH SEMINAR CLINICAL SCIENCE RESEARCH PLATFORM 27 July 2010 School of Medical Sciences USM Health Campus Neuro Q no.2 = Neuro Quotient Dr.Muzaimi Mustapha Department of Neurosciences
WAVELET ENERGY DISTRIBUTIONS OF P300 EVENT-RELATED POTENTIALS FOR WORKING MEMORY PERFORMANCE IN CHILDREN
 WAVELET ENERGY DISTRIBUTIONS OF P300 EVENT-RELATED POTENTIALS FOR WORKING MEMORY PERFORMANCE IN CHILDREN Siti Zubaidah Mohd Tumari and Rubita Sudirman Department of Electronic and Computer Engineering,
SLEEP STAGING AND AROUSAL. Dr. Tripat Deep Singh (MBBS, MD, RPSGT, RST) International Sleep Specialist (World Sleep Federation program)
 International Sleep Specialist (World Sleep Federation program)") SLEEP STAGING AND AROUSAL Dr. Tripat Deep Singh (MBBS, MD, RPSGT, RST) International Sleep Specialist (World Sleep Federation program) Scoring of Sleep Stages in Adults A. Stages of Sleep Stage W Stage
SLEEP STAGING AND AROUSAL Dr. Tripat Deep Singh (MBBS, MD, RPSGT, RST) International Sleep Specialist (World Sleep Federation program) Scoring of Sleep Stages in Adults A. Stages of Sleep Stage W Stage
Active Control of Spike-Timing Dependent Synaptic Plasticity in an Electrosensory System
 Active Control of Spike-Timing Dependent Synaptic Plasticity in an Electrosensory System Patrick D. Roberts and Curtis C. Bell Neurological Sciences Institute, OHSU 505 N.W. 185 th Avenue, Beaverton, OR
Neural Basis of Motor Control
 Neural Basis of Motor Control Central Nervous System Skeletal muscles are controlled by the CNS which consists of the brain and spinal cord. Determines which muscles will contract When How fast To what
Beyond Blind Averaging: Analyzing Event-Related Brain Dynamics. Scott Makeig. sccn.ucsd.edu
 Beyond Blind Averaging: Analyzing Event-Related Brain Dynamics Scott Makeig Institute for Neural Computation University of California San Diego La Jolla CA sccn.ucsd.edu Talk given at the EEG/MEG course
PSY 215 Lecture 3 (1/19/2011) (Synapses & Neurotransmitters) Dr. Achtman PSY 215
 (Synapses & Neurotransmitters) Dr. Achtman PSY 215") Corrections: None needed. PSY 215 Lecture 3 Topic: Synapses & Neurotransmitters Chapters 2 & 3, pages 40-57 Lecture Notes: SYNAPSES & NEUROTRANSMITTERS, CHAPTER 3 Action Potential (above diagram found
Corrections: None needed. PSY 215 Lecture 3 Topic: Synapses & Neurotransmitters Chapters 2 & 3, pages 40-57 Lecture Notes: SYNAPSES & NEUROTRANSMITTERS, CHAPTER 3 Action Potential (above diagram found