HYPOXIC SIGNALS IN THE ISCHEMIC MYOCARDIUM: ROLE OF GALECTIN-1 AND GALECTIN-3
|
|
|
- Eric Stevenson
- 5 years ago
- Views:
Transcription

1 United Arab Emirates University Dissertations Electronic Theses and Dissertations Summer HYPOXIC SIGNALS IN THE ISCHEMIC MYOCARDIUM: ROLE OF GALECTIN-1 AND GALECTIN-3 Satwat Hashmi Follow this and additional works at: Part of the Medical Pathology Commons Recommended Citation Hashmi, Satwat, "HYPOXIC SIGNALS IN THE ISCHEMIC MYOCARDIUM: ROLE OF GALECTIN-1 AND GALECTIN-3" (2014). Dissertations. Paper 25. This Dissertation is brought to you for free and open access by the Electronic Theses and Dissertations at It has been accepted for inclusion in Dissertations by an authorized administrator of
2 United Arab Emirates University College of Medicine and Health Sciences HYPOXIC SIGNALS IN THE ISCHEMIC MYOCARDIUM: ROLE OF GALECTIN-1 AND GALECTIN-3 Satwat Hashmi This dissertation is submitted in partial fulfillment of the requirements for the degree of Doctor of Philosophy Under the direction of Dr. Suhail Al-Salam TITLE PAGE May 2014 i
3 DECLARATION OF ORIGINAL WORK PAGE I, Satwat Hashmi, the undersigned, a graduate student at the United Arab Emirates University (UAEU) and the author of the dissertation entitled HYPOXIC SIGNALS IN THE ISCHEMIC MYOCARDIUM: ROLE OF GALECTIN-1 AND GALECTIN-3, hereby solemnly declare that this dissertation is an original work done and prepared by me under the guidance of Dr. Suhail Al-Salam, in the College of Medicine and Health Sciences at UAEU. This work has not been previously formed as the basis for the award of any degree, diploma or similar title at this or any other university. The materials borrowed from other sources and included in my thesis/dissertation have been properly acknowledged. Student s Signature Date ii
4 Copyright 2014 by Satwat Hashmi All Rights Reserved COPYRIGHT PAGE iii
5 Approved by PhD Examining Committee: 1) Advisor (Committee Chair): Dr. Suhail Al Salam Title: Associate professor Department: Pathology Institution: College of medicine and health sciences, UAE University Signature. Date. 2) Member: Dr. Abderrahim Nemmar Title: Professor Department: Physiology Institution: College of medicine and health sciences, UAE University Signature. Date.. 3) Member: Dr. Abdu Adem Title: Professor Department: Pharmacology Institution: College of medicine and health sciences, UAE University Signature. Date.. 4) Member (External Examiner): Dr. Dominicus P.V. de Kleijn Title: Professor Department: Surgery and Cardiovascular Research Institute Institution: National University Singapore National University Health System, Singapore Signature. Date.. SIGNATURE PAGE iv
6 Accepted by Dean of the College of Medicine and Health Sciences Signature. Date Dean of the College of Graduate Studies Signature. Date... Copy. of v
7 ABSTRACT Myocardial infarction is the most serious manifestation of coronary artery disease and the cause of significant levels of mortality and morbidity worldwide. Galectin-1 (GAL-1) and Galectin-3 (GAL-3) are beta galactoside binding lectins with diverse functions. Hypoxia inducible factor-1 alpha (HIF-1α) is a transcription factor mediating early and late responses to myocardial ischemia. We aim to study the direct effects of ischemia on GAL-1, GAL-3 and HIF-1α in the heart. Male C57B6/J and GAL-3 knockout mice were used for our two disease models. In the Myocardial infarction (MI) model, the left anterior descending artery of the heart is permanently ligated to create ischemia in the anterior myocardium. In the Ischemia reperfusion model (IR), the artery is temporarily ligated for a specific period of time and then reperfusion is established. Heart samples were processed for immunohistochemical and immunofluorescent labeling, western blotting, Enzyme linked immunosorbent assay and quantitative real time PCR. Inflammatory, Apoptotic and Oxidative stress markers were also studied. We show for the first time that GAL-1, GAL-3 and HIF-1α levels in the left ventricle are raised in early ischemic period in conjunction with a predominant antiapoptotic activity in the heart. Our identification of the pattern of expression of GAL-1, GAL-3 and HIF-1α in the heart during the first 24 hours following acute MI has helped in understanding early molecular changes in this event and may provide methods to overcome serious complications. Our work further showed that GAL-3 acted as a regulator of proinflammatory and antiapoptotic mechanisms in the myocardium after myocardial infarction that will shape the future course of the disease. GAL-3 was also shown to interfere with vi
8 redox pathways controlling cell survival and death and plays a protective role in the pathogenesis of ischemia reperfusion injury in the heart. Our work has contributed in understanding the local microenvironment in which GAL-3 works in the heart after ischemia/infarction or ischemia-reperfusion and has opened a new window in understanding the exact role of GAL-3 in the heart. Key words: Myocardial infarction, Ischemia reperfusion injury, Galectin-1, Galectin-3, HIF-1 α. vii
9 (ARABIC) ABSTRACTملخص األطروحة يعتبر احتشاء العضلة القلبيه من اخطر مظاهر أمراض الشريان اإلكليلي وسبب رئيسي للوفيات والمراضه في جميع انحاء العالم. جالكتين 1 و جالكتين 3 هي بروتينات لها خاصية االتحاد مع بيتا جالكتوسايد وتتمتع بوظائف متنوعة. اما العامل المحرض لنقص االكسجة - ١ نوع أ فهو عامل نسخ يساهم في االستجابات المبكرة والمتأخرة الناجمة عن ضعف تروية العضلة القلبيه. في هذا العمل نهدف الى دراسة االثار المباشرة لنقص تروية العضله القلبيه على بروتينات جالكتين 1 و جالكتين 3 و العامل المحرض لنقص االكسجة -1 نوع أ في القلب. تم استخدام فئران نوع C57B6 وفئران منزوعه لجين الجالكتين 3 في نموذجي التجارب المستخدمه في هذه الدراسه. ففي نموذج احتشاء العضله القلبيه قمنا بعمل عقده دائمية للشريان القلبي االمامي االيسر النازل لخلق نقص في تروية عضلة القلب األمامية. بينما في نموذج نقص الترويه واعادة الضخ قمنا بعمل عقده مؤقته للشريان القلبي االمامي االيسر النازل بعدها يتم اعادة الضخ. تم تجهيز عينات القلب الجراء الصبغات النسيجية المناعيه و الصبغات المستشعه المناعيه و فحص التنشيف الغربي وفحص االنزيم المرتبط المناعي وفحص الوقت الحقيقي الكمي لتفاعل سلسة البلمرة. وكذلك تم دراسة معلمات االلتهابات والموت المبرمج للخاليا و والشد التأكسدي. أظهرنا للمره االولى ارتفاع تركيز بروتينات جالكتين 1 و جالكتين 3 و العامل المحرض لنقص االكسجة -1 نوع أ في البطين االيسر في فتره مبكره بعد نقص الترويه بالتزامن مع نشاط مضاد لموت الخاليا المبرمج. و تعتبر نتائجنا عن زيادة تركيز بروتينات جالكتين 1 و جالكتين 3 و العامل المحرض لنقص االكسجة -1 نوع أ في البطين االيسرخالل االربع والعشرين ساعة االولى بعد نقص الترويه مهمة جدا لفهم التغيرات الجزيئيه المصاحبه لنقص التروية ويمكن أن توفر وسائل للتغلب على مضاعفات خطيرة. وكذلك اظهرت نتائجنا بأن بروتين جالكتين 3 يعمل كمنظم آلليات األلتهابات وموت الخاليا المبرمج في عضلة القلب بعد احتشاء عضلة القلب والتي ستشكل المسار المستقبلي للمرض. وقد تبين أيضا بأن بروتين جالكتين 3 يتدخل في مسارات األكسده المسيطره على بقاء وموت الخليه ويلعب دورا وقائيا ضد األذى الناتج عن نقص التروية وأعادة الضخ في القلب. وقد ساهم عملنا في فهم البيئه المجهريه المحليه التي يعمل بها بروتين جالكتين 3 في القلب بعد نقص التروية أو نقص الترويه واعادة الضخ وفتحت نافذة جديدة في فهم الدور المحدد من بروتين جالكتين 3 في القلب. الكلمات الرئيسية: احتشاء عضلة القلب نقص التروية واعادة الضخ جالكتين 1 جالكتين 3 العامل المحرض لنقص االكسجة -1 نوع أ viii
10 ACKNOWLEDGEMENTS I would like to express my sincere gratitude to my supervisor Dr. Suhail Al- Salam. He has been a tremendous mentor. I wish to thank him for his continuous encouragement, support and trust in my capabilities which helped me grow as a scientist. I have learned a lot from him about life and his advice has been priceless. I would also like to thank my advisory committee members, Professor Abdu Adem, Professor Nemmar, and Professor Bassam Ali for their brilliant suggestions and for facilitating my work by providing all the help I needed from their laboratories. A special thanks to my friend, Naheed who has been my teacher, my confidante and my critic all at the same time. I am deeply grateful to Loay, Azeem, Dr. Lammers, Shekar and Mr. Singh for teaching me the required research techniques. I am also thankful to Hiba and Manjusha for assisting me in our lab. I am grateful to my fellow PhD students and friends, especially Amal and Nadia A. I was new to the UAE and did not know anyone here but they made me feel like one of their own and during our times of tribulations of PhD we forged a deep friendship that I will cherish forever. I am indebted to my parents for giving me a wonderful environment to grow up in and develop my confidence. They have always supported and encouraged me to find and realize my full potential. I am also grateful to my mother-in-law for her prayers and her help with my children in my hours of need. ix
11 Thanks to my dear husband, Ehtisham, whose unconditional love and support made it possible for me to successfully complete my PhD. It was through his patience and practical help that I was able to meet the challenges of being a wife and a mother along with competing demands of research, study and personal development. Last but not the least, I owe a lot to my two sons, Maaz and Raaid. They are the joy of my life and they make everything worthwhile. x
12 DEDICATION This thesis is dedicated to my wonderful mother, Zahida, who is my constant source of inspiration, strength and prayers. xi
13 TABLE OF CONTENTS Table of Contents TITLE PAGE... i DECLARATION OF ORIGINAL WORK PAGE... ii COPYRIGHT PAGE... iii SIGNATURE PAGE... iv ABSTRACT... vi ABSTRACT (ARABIC)... viii ACKNOWLEDGEMENTS... ix DEDICATION... xi TABLE OF CONTENTS... xii LIST OF TABLES... xvi LIST OF FIGURES... xvii LIST OF ABBREVIATIONS... xx Chapter 1: Introduction Overview Review of Literature The Heart The Galectins family Galectin Galectin HIF-1 alpha Myocardial infarction and Myocardial Ischemia reperfusion Injuries Aims and Objectives Chapter 2: Materials and methods Ethical Approval Animal strains and experimental groups Murine model of myocardial infarction and Ischemia Reperfusion Injury Methods Sample Collection Protein and RNA Extraction Sample Processing for Histology Immunohistochemistry xii
14 2.4.5 Immunofluorescent labeling Morphometric analysis Enzyme Linked Immunosorbent Assay Quantitative Real Time Polymerase Chain (qrt-pcr) Sodium dodececyl-sulphate polyacrylamide gel electrophoresis (SDS- PAGE) and Western Blotting Troponin-I Assay Glutathione Assay Superoxide dismutase (SOD) activity assay Bioinformatic Analysis Statistical Analysis Chapter 3: Results and Discussion Section 1: Galectin-1 in Early Myocardial infarction Background Results Electrocardiographic Study GAL-1 in the heart tissue GAL-1 mrna expression in post MI heart tissue GAL-1 Levels in Plasma Morphometric analysis Discussion Conclusions Section 2: Galectin-3 is expressed in the myocardium very early post myocardial infarction Background Results Left ventricular GAL-3 level is increased within one hour post MI GAL-3 mrna expression in post MI groups Plasma GAL-3 levels are significantly increased at 24 hour post MI Discussion Conclusion Section 3: Hypoxia Inducible factor-1 alpha in Early Myocardial Infarction Background xiii
15 3.3.2 Results HIF-1 α in heart tissue HIF-1 alpha mrna expression at 20 mins post MI: Morphometric analysis Discussion Conclusions Section 4: HIF-1 α correlates with GAL-1 and GAL-3 in Early Myocardial Infarction Background GAL-1 and HIF-1α GAL-3 and HIF-1 α Results Co-localization of GAL-1 and HIF-1 α GAL-3 co-localize with HIF-1 α in early post MI Bioinformatic analysis results Proliferation and Apoptosis in Early Post Myocardial Infarction Discussion Conclusion Section 5: Galectin-3 is an antiapoptotic and proinflammatory mediator at 24 hours post myocardial infarction Background Results GAL-3 is a proinflammatory mediator at 24 hour post MI time GAL-3 has an anti-apoptotic role at 24 hour post MI time GAL-3 and Oxidative stress GAL-3 and Troponin I Discussion Conclusion Section 6: Galectin-3 reduces myocardial damage in Ischemia/Reperfusion injury Background Results GAL-3 is increased after Ischemia-reperfusion injury in the heart GAL-3 decreases myocardial injury in IR model xiv
16 GAL-3 and oxidative stress in IR GAL-3 role is proinflammatory and anti-apoptotic in IR Discussion Conclusion Section 7: Myocardial Infarction and Myocardial Ischemia-Reperfusion: A Comparison from GAL-3 perspective Background Results Histological changes in MI and IR models Inflammatory mediators are raised in the MI model Apoptotic markers are raised in the IR model Antioxidant enzyme levels in MI and IR models Troponin I is raised in the MI model Discussion Conclusion Chapter 4: General Conclusions and Future Directions General conclusions Future directions References xv
17 LIST OF TABLES Table 3.1: GAL-1 levels in ng/mg of total protein at different time points post myocardial infarction Table 3.2: Fold changes in GAL-1 mrna expression in the ILV (Infarcted left ventricle) and NILV (Non-infarcted left ventricle) relative to sham at respective time points post MI Table 3.3: Morphometric analysis of expression of GAL-1 in cardiomyocytes, endothelial cells and neutrophil polymorphs at different time points following ligation of LAD Table 3.4: GAL-3 levels in pg/mg of total protein at respective points post myocardial infarction Table 3.5: Fold changes in GAL-3 mrna expression in the ILV (Infarcted left ventricle) and NILV (Non-infarcted left ventricle) relative to sham at respective time points post MI Table. 3.6: HIF-1 α levels in pg/mg of total protein at different time points post myocardial infarction Table. 3.7: HIF-1 α levels in pg/mg total protein in nuclear and cytoplasmic fractions of left ventricular heart tissue at 20 min post myocardial infarction Table 3.8: Morphometric analysis of expression of HIF-1α in cardiomyocytes, endothelial cells and neutrophil polymorphs at different time points following ligation of LAD Table 3.9: IL-6 and IL-1β levels in pg/mg of total protein in LV of wild type and GAL-3 KO mice at 24-hour post MI xvi
18 LIST OF FIGURES Figure 1.1: Types of Galectin... 8 Figure 1.2: Protective and deleterious effects of HIF-1α Figure 3.1: Electrocardiography of the heart at post MI groups Figure 3.2: (A) The graph represents left ventricular GAL-1 concentrations post myocardial infarction (B) GAL-1 mrna expression in the ILV and NILV expressed as fold changes relative to sham at respective time points post MI Figure 3.3: Western blot for detection of GAL-1 and beta actin in respective time points post MI with corresponding sham Figure 3.4: GAL-1 expression in naïve heart Figure 3.5: GAL-1 expression 20 minutes following ligation of LAD Figure 3.6: GAL-1 expression 30 minutes following ligation of LAD Figure 3.7: GAL-1 expression 60 minutes following ligation of LAD Figure 3.8: GAL-1 expression 4 hours following ligation of LAD Figure 3.9: GAL-1 24 hours following ligation of LAD Figure 3.10: Plasma GAL Figure 3.11: (A) GAL-3 levels in the LV of post MI heart (B)Time course of GAL-3 protein levels in the LV for the first 24 hours post MI Figure 3.12: Western blot for detection of GAL-3 and beta actin in respective time points post MI with corresponding sham Figure 3.13: GAL-3 expression in naïve heart Figure 3.14: GAL-3 expression at 20 min post MI Figure 3.15: GAL-3 expression at 30 min post MI Figure 3.16: GAL-3 expression at 60 min post MI Figure 3.17: GAL-3 expression at 4 hours post MI Figure 3.18: GAL-3 expression at 24 hours post MI Figure 3.10: Ratio of plasma GAL-3 concentration in myocardial infarction to plasma GAL-3 concentration in sham operated mice Figure 3.21: HIF-1 α concentrations in C57BL6 mouse left ventricle Figure 3.22: HIF-1 α levels in nuclear and cytoplasmic extracts of LV mouse heart at 20 minutes following MI Figure 3.23: HIF-1 α expression of the heart Figure 3.24: HIF-1α mrna expression at 20 min Post MI time point in the ILV and NILV expressed as fold changes relative to sham at respective time points post MI xvii
19 Figure 3.25: Co-localization of Galectin-1 and HIF-1 α Figure 3.26: Co-localization of GAL-1, HIF-1 α, CD31, desmin and CD Figure 3.27: Co-localization of GAL-3, HIF-1 α, desmin, factor 8 related antigen, lysozyme and myeloperoxidase (MPO) Figure 3.28 (A) Pattern of GAL-1 and HIF-1 α in the heart from 20 min post MI till 24 hour post MI time points. (B) Pattern of GAL-3 and HIF-1 α in the heart from 20 min post MI till 24 hour post MI time points Figure 3.29: Ki-67 proliferative activity in the left ventricle Figure 3.30: Apoptotic activity in the left ventricle Figure 3.31: Bcl2 activity in left ventricle Figure 3.32.Potential HREs in the promoter region of GAL-1 gene Figure 3.33 :(A) left ventricular GAL-3 concentrations at 24 hours post myocardial infarction in wild type C57BL6 and GAL-3 KO mouse heart. (B) Plasma GAL-3 levels in the same group Figure 3.34:(A) left ventricular IL-6 (B) IL1β concentrations at 24 hours post myocardial infarction in wild type C57BL6 and GAL-3 KO mouse heart and (C) Plasma IL-6 levels in the same groups Figure 3.35: Myeloperoxidase (MPO) expression in the neutrophil polymorphs in the heart sections of GAL-3 wild type and GAL-3 KO groups Figure 3.36 :( A) Plasma concentrations of Troponin I at 24 hours post myocardial infarction in wild type C57BL6 and GAL-3 KO mouse heart (B) left ventricular Cleaved Caspse-3 and (C) Total Akt-1 concentrations at 24 hours post myocardial infarction in wild type C57BL6 and GAL-3 KO mouse heart Figure 3.37: Apoptotic markers in myocardial infarction Figure 3.38: (A) represents cyclin D1 expression in the heart section for GAL-3 wild type MI group. (B )show the heart sections from the GAL-3 wild type sham operated group. (C)& (D) represent the GAL-3 KO MI and GAL-3 KO sham heart sections respectively Figure 3.39: (A) SOD % inhibition activity and (B) total Glutathione levels in the LV at 24 hours post myocardial infarction with corresponding sham operated groups in wild type C57BL6 and GAL-3 KO mouse heart Figure 3.40: (A) left ventricular GAL-3 concentrations in the wild type C57BL6 IR group and GAL-3 KO IR group with their corresponding shams (B) Plasma troponin I levels in the same groups Figure 3.41: GAL-3 expression in IR group as compared to Sham operated control group Figure 3.42: (A) left ventricular Total GSH concentrations in the wild type C57BL6 IR group and GAL-3 KO IR group. (B) left ventricular SOD inhibition activity in the same groups Figure 3.43: Expression of catalase in GAL-3 wild type IR group and GAL-3 KO IR group xviii
20 Figure 3.44: (A) left ventricular cleaved caspase-3 in the wild type C57BL6 IR group and GAL-3 KO IR group. (B) left ventricular IL-6 and (C) IL-1β in the same groups Figure 3.45: Cytochrome c, bcl-2 and cleaved caspase-3 expression in GAL-3 wild type IR and GAL-3 KO IR groups Figure 3.46: Myeloperoxidase (MPO) expression in the neutrophil in heart sections of GAL-3 wild type IR (A,C) and GAL-3 KO IR (B,D) groups Figure 3.47: Wild type MI and GAL-3 KO MI heart sections Figure 3.48: Wild type IR and GAL-3 KO IR heart sections Figure 3.49: (A) left ventricular IL-6 concentrations (B) Plasma IL-6 levels and (C) left ventricular IL-1β concentrations in 24 hour MI and IR groups Figure 3.50: (A) left ventricular cleaved caspase-3 concentrations and (B) Plasma troponin I levels in 24 hour MI and IR groups Figure 3.51: Cytochrome c, bcl-2 and cleaved caspase-3 expression in MI and IR groups Figure 3.52: (A) left ventricular Total glutathione concentration and (B) left ventricular SOD % inhibition activity in 24 hour MI and IR groups xix
21 LIST OF ABBREVIATIONS Cardiovascular diseases (CVDs) World Health Organization (WHO) United Arab Emirates (UAE) Health Authority Abu Dhabi (HAAD) Coronary artery disease (CAD) Heart failure (HF) Myocardial infarction (MI) Percutaneous coronary intervention (PCI) Ischemia reperfusion (IR) Galectn-1 (GAL-1) Galectin-3 (GAL-3) Hypoxia-inducible factor-1 alpha (HIF-1 α) Left anterior descending artery (LAD) Left circumflex artery (LCX) Carbohydrate recognition domain (CRD) N-terminal domain (ND) Advanced glycation endproduct (AGE) TRAIL (tumor necrosis factor-related apoptosis-inducing ligand) Phosphatidylinositol 3-kinase (PI3K) Angiotensin II (AngII) Aryl hydrocarbon receptor nuclear translocator (ARNT) Helix-loop-helix (HLH) Per period circadian protein, Arnt aryl hydrocarbon receptor nuclear translocator protein, Sim single-minded protein (PAS) xx
22 Hypoxia response elements (HREs) Prolyl hydroxylases (PHDs) Oxygen dependent degradation domain (ODDD) von Hippel Lindau tumor suppressor protein (pvhl) Factor Inhibiting HIF-1α (FIH1) ROS (reactive oxygen species) Erythropoietin (EPO) Vascular endothelial growth factor (VEGF) Inducible nitrics oxide synthase (inos) Hemeoxygenase-1 (HMOX-1) Cardiotrophin-1 (CT-1) Dimethyloxalylglycine (DMOG) Short hairpin RNA interference (shrna) G-protein estrogen receptor (GPER) Sarco/endoplasmic reticulum Ca 2+ -ATPase gene (SERCA) AMP-activated protein kinase (AMPK) Peroxisome proliferator-activated receptor γ coactivator-1 (PGC-1) Mitochondrial permeability transition pore (MPTP) Superoxide dismutase (SOD) Glutathione (GSH) Knockout (KO) Polyethylene (PE) Phenylmethanesulfonyl fluoride (PMSF) Dithiothreitol (DTT) Diaminobenzidine (DAB) xxi
23 Tetramethylbenzidine (TMB) Quantitative Real Time Polymerase Chain (qrt-pcr) Reverse transcription (RT) Sodium dodececyl-sulphate polyacrylamide gel electrophoresis (SDS-PAGE) 5, 5 -dithiobis (2-nitrobenzoic acid) (DTNB) 5-thio-2-nitrobenzoic acid (TNB) Xanthine oxidase (XO) Analysis of variance (ANOVA) Enzyme linked immunosorbent assay (ELISA) Myeloperoxidase (MPO) Tumor necrosis factor (TNF)-α, xxii
24 Chapter 1: Introduction 1
25 1.1 Overview Cardiovascular diseases (CVDs) are the number one cause of death in the world today. According to the World Health Organization (WHO), more people die annually from CVDs than from any other cause (1). An estimated 17.3 million people died from CVDs in 2008 and out of these deaths, 7.3 million were due to coronary heart disease (1). The number of people who will die from CVDs is projected to increase to 23.3 million by 2030 (1, 2). These figures show that the epidemic of CVD is a global phenomenon (3) and the magnitude of this problem will increase. CVDs are also the major cause of death in the United Arab Emirates (UAE). Health Authority Abu Dhabi (HAAD) statistics from 2012 put cardiovascular diseases as the leading cause of death in Abu Dhabi comprising 39% of all causes of deaths (4). Coronary artery disease (CAD) is the leading cause of heart failure (HF). The Framingham Heart Study suggests that the most common cause of HF is no longer hypertension or valvular heart disease, as in previous decades, but rather CAD (5). This shift may be related to improved survival of patients after acute myocardial infarction (MI) (6). MI is the most dreaded but most likely manifestation of CAD. Early diagnosis and timely intervention remains the cornerstone of therapy for acute MI. The standard care for the treatment of acute MI is primary reperfusion therapies, including primary percutaneous coronary intervention (PCI) and thrombolysis. Prompt restoration of blood flow to ischemic myocardium on the one hand limits infarct size and reduces mortality (7) but on the other hand can lead to further damage to the heart, referred to as reperfusion injury (8). 2
26 Understanding the very early changes that occur in the myocardium after myocardial infarction is essential in understanding the pathophysiology of the disease. It is the key to devising ways that will ultimately enable diagnosing a cardiac ischemic event before it has caused significant damage to the heart. In addition, looking at the players that take part in myocardial ischemia/infarction (MI) and myocardial ischemia reperfusion (IR) injuries is also fundamental to our understanding of the critical differences between these two types of injuries. In this thesis we have attempted to look at these processes in association with our proteins of interest Galectn-1 (GAL-1), Galectin-3 (GAL-3) and Hypoxiainducible factor-1 alpha (HIF-1 α). In the results and discussion chapter of the thesis in Sections 1, 2 and 3, we have shown that GAL-1, GAL-3 and HIF α -1 are expressed in the myocardium at various time points post MI. Section 4 deals with how GAL-1 and GAL-3 correlate with HIF-1 α within 24 hours post MI time. In Section 5, we have shown that at 24-hour post MI time GAL-3 is a proinflammatory and anti-apoptotic mediator using GAL-3 knockout animals. Section 6 emphasizes GAL-3 s role in oxidative stress after IR injuries in the myocardium. Finally Section 7 explains the differences we observed in the two models of disease studied i.e., MI and IR and discusses GAL-3 s contribution to these two mechanisms of injury. 3
27 1.2 Review of Literature The Heart The heart has its reasons which reason knows not. Blaise Pascal The heart beats more than 2.5 billion times in an average life time. Its muscular walls contract to pump blood to all parts of the body. Effective function of the heart requires an efficient oxygen delivery system. The heart maintains a high level of oxygen extraction of 70% to 80% compared with 30% to 40% in skeletal muscle (9) which is supported by capillary density of 3000 to 4000 compared with 500 to 2000 per 1 mm 2 in skeletal muscle and a tight regulation of the coronary blood flow (10). The human heart contains an estimated 2 to 3 billion cardiac muscle cells which make up less than a third of the total number of cells in the heart. The other cell types are smooth muscle and endothelial cells of the coronary vasculature and the endocardium, fibroblasts and other connective tissue cells, mast cells, and immune system related cells (11). The normal anatomy of the heart is comprised of 4 chambers, 2 atria and 2 ventricles and 4 valves, the mitral, tricuspid, aortic and pulmonary. The heart has its own vascular system called the coronary arterial system. It comprises two major coronary arteries, the right and the left. The two coronary ostia arise from the sinuses of Valsalva just above the aortic valve. The left coronary artery divides into the left anterior descending artery (LAD) and circumflex artery (LCX). It supplies the lateral and anterior walls of the left ventricle, and the anterior two thirds of the interventricular septum. The right coronary artery supplies the right ventricle, the posterior wall of the left ventricle and posterior third of the septum. 4
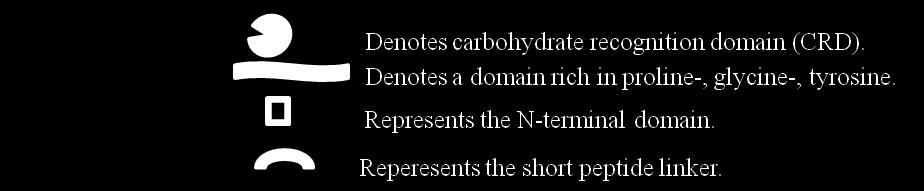
28 Balance between metabolic demand and supply in the myocardium is crucial for the survival and proper functioning of the heart. Myocardial ischemia can result if there is an imbalance due either to decreased coronary blood flow or increased requirement, giving rise to the clinical conditions of acute coronary syndrome or stable coronary artery disease. Hypoxia is an integral component in ischemic cardiomyocytes which triggers multiple signaling pathways that cause these cells to adapt and subsequently survive ischemic insult (12) The Galectins family Galectins are a family of β-galactoside-binding lectins (13). Fifteen members have been identified and are found to be widely distributed from lower invertebrates to mammals (14, 15). Barondes et al. proposed the name of galectins and suggested that all the galectins need to have affinity for β- galactosides and sequence similarity in the carbohydrate binding site (13, 14). Galectins are classified on the basis of their biochemical structure into three groups (16): (a) Prototype galectins (galectins-1, -2, -5, -7, -10, -11, -13, -14 and - 15). These contain one carbohydrate recognition domain (CRD) and a short N- terminal sequence and can exist as monomers or non-covalent homodimers; (b) Tandem Repeat group (galectin-4, -6, -8, -9, and -12). These consist of two CRDs linked via a short peptide sequence, and (c) Chimera-type galectins (galectin-3). These exist as monomers with a long N-terminal tail containing a proline-, glycine-, tyrosine-rich domain fused onto the CRD that allows the formation of oligomers (17, 18) (Fig. 1.1). Galectins are highly conserved evolutionary (19). They are present in intracellular as well as extracellular compartments. They lack the signal sequence required for secretion through the classic secretory pathway suggesting that they 5
29 are secreted through the non-classical pathway (20, 21). Their extracellular functions are through the interactions with cell surface and extracellular matrix. The intracellular functions are via interaction with cytoplasmic and nuclear proteins (22-25). Galectins show great diversity in functions. From regulation of cell growth, apoptosis, inflammation and cell adhesion to embryonic development, they play variable roles at different times and under different conditions (15, 22, 24-29). GAL-1 and GAL-3 are the most studied galectins of all and we will focus our attention on these two members with emphasis on their role in the heart under ischemic/hypoxic conditions Galectin-1 Galectin-1 (GAL-1) is a pleiotropic dimeric protein of 14 kd participating in a variety of normal and pathological processes (13). In humans it is encoded by the LGALS1 gene and is highly conserved across species. GAL-1 belongs to the galectin family of lectins and is characterized by one carbohydrate recognition domain (CRD) that can occur as a monomer or as a non-covalent homodimer consisting of subunits of one CRD (13, 26). GAL-1 is ubiquitously expressed. It can act both inside cells, via sugarindependent interactions, and outside cells displaying lectin activity (26). GAL-1 is secreted and found on the cell surface, as well as in the extracellular matrix. GAL-1 s export from mammalian cells have been shown to occur in a nonclassical manner independent of the function of the endoplasmic reticulum (ER) and the Golgi (20). It lacks recognizable secretion signal sequences and is secreted via inside-out transportation involving direct translocation across the 6


30 Figure 1.1: Types of Galectin. 7
31 plasma membrane requiring unidentified integral membrane proteins and cytosolic factors (30). In the extra cellular compartment, GAL-1 forms lattice-like complexes with receptors that participate in recognition of cell matrix (31-34). It binds to various cell matrix components in a dose-dependent and β-galactoside-dependent manner in the following order: laminin > cellular fibronectin > thrombospondin > plasma fibronectin > vitronectin > osteopontin (35). In the Intracellular compartment GAL-1 has been shown to be present in cells nuclei and cytosols (26). Due to its pervasive presence both inside and outside the cells and its production by various cells of vascular, interstitial, epithelial, and immune origin (36-39), GAL-1 is involved in a variety of biological functions, including cell-cell and cell-matrix interactions, cell adhesion, migration, invasion, metastasis, apoptosis, regulation of cell cycle, RNA splicing and transcription (34, 40-44). GAL-1 has both positive and negative effects on cell growth depending on cell type, activation status or intracellular versus extracellular forms (26). For example, GAL-1 is mitogenic for hepatic stellate cells (45) and mammalian vascular cells (46, 47) but inhibits growth in bone marrow cells (48). The antiproliferative effects of GAL-1 result from the inhibition of the Ras-MEK-ERK pathway. Gal-1 induces p21 transcription and selectively increases p27 protein stability. This GAL-1 -mediated accumulation of p27 and p21 inhibits cyclindependent kinase 2 activity which ultimately results in G1 cell cycle arrest and growth inhibition (49). GAL-1 is also involved in apoptosis. The events that lead to GAL-1 mediated apoptosis involve the modulation of Bcl-2 protein production, cytochrome c release, activation of caspases and the participation of the ceramide 8
32 pathway among other pathways (50, 51). GAL-1 is also implicated in cytochrome c and caspase independent cell death which involves the rapid nuclear translocation of EndoG from mitochondria (52). GAL-1 is known to be involved in the initiation, amplification, and resolution of inflammatory responses (36). GAL-1 also suppresses the secretion of the proinflammatory cytokine IL-2 and favors the secretion of the antiinflammatory cytokine IL-10 (53, 54). GAL-1 has been shown to reduce transmigration of both neutrophils and mast cells into the tissue (55) and to be responsible for inhibiting mast cell degranulation, and eosinophil migration (56-58). These studies suggest that GAL-1 inhibits the migration of inflammatory cells. GAL-1 plays a role in neutrophil priming by inducing an oxidative burst in neutrophils that have extravasated into tissue (59). GAL-1 is important in chronic inflammation. It attenuates disease processes in experimental models of autoimmune encephalomyelitis (60), arthritis (61), colitis (62) and hepatitis (63). As a whole, GAL-1 functions as a homeostatic agent by modulating innate and adaptive immune responses (26). Although GAL-1 is involved in very important functions in vitro and in vivo, GAL-1 null mice are viable indicating that its presence is not critical for mammalian development or survival (33) Galectin-1: a hypoxia induced protein Studies have identified GAL-1 as hypoxia-induced protein. The hypoxic regulation of GAL-1 at mrna and protein levels has been demonstrated in tumor biology and has the potential to be used as a prognostic marker of malignancy (64). Under hypoxic or ischemic conditions in the brain either in vitro or in vivo, GAL-1 was found to inhibit the proliferation of astrocytes and attenuate 9
33 astrogliosis. GAL-1 treatment reduces apoptosis of neurons, decreased brain infarction volume and improved neurological function induced by the ischemia, making GAL-1 a potential therapeutic target for attenuating neuronal damage and promoting recovery of brain ischemia (65). Studies have shown that in lung tissue, the expression of GAL-1 is diffusely distributed throughout the interstitium and near to the basement membrane of vessels and airways in both normal and hypoxia-exposed mice. The difference is that the intensity of GAL-1staining was increased in hypoxia-exposed mice, which suggests that GAL-1 may be important in adaptive responses of murine lung to chronic hypoxia (66). The abovementioned studies have shown that GAL-1 is regulated by hypoxia but its exact mechanism remains elusive. Recently, Zhao et al (67) have demonstrated that hypoxia inducible factor- 1α (HIF- 1α) significantly increases GAL-1 expression in messenger RNA and protein levels in four colorectal cancer cell lines and it has been proposed that GAL-1 gene is a direct target of transcriptional factor HIF-1 α (66, 67) Galectin-1 in heart GAL-1 plays a role in the development and regenerative ability of the muscles. It induces non-committed myogenic cells to express myogenic markers and in this way increases terminal differentiation of committed myogenic cells (68-70). GAL-1 is a major component of the contractile machinery in cardiomyocytes (71) which suggests that it must be playing an important role in regulating cardiac functions. Very recently it was seen in a study by Seropian et al that GAL-1 expression is increased in patients with end stage chronic heart failure (72). In murine models of MI it was increased at one week after MI suggesting a role of this lectin in post infarction remodeling (72). GAL-1 10
34 knockout animals showed enhanced cardiac inflammation and the animals treated with recombinant GAL-1 attenuated cardiac damage which points towards a positive role of GAL-1 in cardiac homeostatsis and post infarction remodeling via preventing cardiac inflammation. GAL-1 s role in the pathophysiology of the heart is an area of ongoing research. Till today very little is known about the exact function of GAL-1 in the myocardium and in this thesis we will investigate whether there is any change in the endogenous production of GAL-1 in early ischemia and its pattern of expression in the ischemic and non-ischemic cardiomyocytes Galectin-3 Galectin-3 (GAL-3) plays a central regulatory role in several diverse biological processes and disease states. GAL-3 is a member of the Galectin family of lectins that specifically bind to N-acetyl-lactosamine-containing glycoproteins (13). GAL-3 is the sole member of this family that contains one CRD linked to a proline, glycine, and tyrosine-rich repeat N-terminal domain (ND) (19). The CRD is composed of approximately 130 amino acids and is responsible for the lectin activity of GAL-3. The ND is composed of amino acids, lacks the carbohydrate binding activity but is essential for full biological activity of GAL-3(73). GAL-3 exists in both phosphorylated and unphosphorylated forms. Phosphorylated form is found in cytoplasm and nucleus whereas unphosphorylated form is only found in the cytoplasm (74). GAL-3 is ubiquitously expressed. It is expressed in a variety of cells, e.g., endothelial and epithelial cells, activated macrophages (75-77), activated microglial cells (78, 79), inflammatory cells including macophages, basophils, mast cells, eosinophils, and neutrophils (41, 80, 81) (20, 82) and subsets of 11
35 neurons (83). Galectin-3 is considered a macrophage activation marker due to the fact that its expression is up-regulated in phagocytic macrophages (84). In tissues, galectin-3 is expressed in lung, spleen, stomach, colon, adrenal gland, uterus, ovary, prostate, kidney, heart, cerebrum, pancreas, and the liver (85). GAL-3 is distributed in the extracellular as well as intracellular compartments. Extracellular GAL-3 plays a role in cell-cell adhesion, cell-matrix interaction and signaling (86-89). There have been reports of extracellular GAL-3 acting as a factor that induces apoptosis (90). Intracellular GAL-3 on the other hand is involved in cell proliferation, mitosis and acts as an anti-apoptotic mediator (91-94). It affects K-Ras (95, 96) and Akt proteins (97, 98) and so also regulates differentiation, survival, and death (99, 100). Intra-nuclear localization of GAL-3 is well documented even in the absence of a nuclear localization signal. It is involved in spliceosome assembly (101) and pre-mrna splicing ( ). Also it is implicated in regulation of gene transcription (92) and Wnt/β-catenin signaling pathway. Cellular localization of GAL-3 determines its biological functions. Some cell types show intense cytoplasmic localization but do not express GAL-3 in the nucleus (104, 105) even if GAL-3 is overexpressed (106), suggesting the importance of variable GAL-3 functions in specific cell types. Its localization depends on factors such as proliferation state of cells ( ), cultivation conditions (112), neoplastic progression ( ) and transformation (118) (73). Its distribution in many types of cells and tissues, combined with variable subcellular localization signifies that GAL-3 is central to many physiological and pathological conditions (119, 120). 12
36 GAL-3 is secreted outside the cell through non-classical pathway (121). Despite its lack of appropriate signal peptides GAL-3 can cross the plasma membrane through its interaction with extracellular matrix proteins. Secretion of GAL-3 is critically regulated at the plasma membrane (122). Regulation of GAL- 3 expression is a very complex mechanism that involves many transcription factors and signaling pathways GAL-3 in inflammation GAL-3 is involved in many processes during the acute inflammatory response. In addition to being highly expressed and secreted by macrophages (123), it causes neutrophil activation and adhesion (124), chemoattraction of monocytes or macrophages (77) and activation of mast cells (125). Intracellular GAL-3 is also shown to promote the survival of inflammatory cells resulting in persistence of inflammation (76). Secreted GAL-3 can also stimulate oxidative burst in neutrophils (126). In a study involving GAL-3 knockout mice, it was shown that these mice developed severe pneumonia and that GAL-3 induced lung damage by acting as a neutrophil activating agent. Exogenous galectin-3 also augmented neutrophil phagocytosis of bacteria and delayed neutrophil apoptosis (127). Neutrophils expression can be activated by extracellular GAL-3. It was found that neutrophil survival is enhanced after incubation with exogenous galectin-3 (127). The same observation regarding GAL-3 was also reported in a study of airway inflammation and bronchial hyper-responsiveness in a murine model of ovalbumin-induced asthma (27). Peribronchial inflammatory cells and bronchoalveolar lavage fluid expressed large amounts of galectin-3 in experimental animals compared to experimental controls (128). 13
37 In addition to its role in acute inflammatory responses, GAL-3 also acts as a very important factor in chronic inflammation and its resulting fibrosis. In a mouse model of renal unilateral ureteric obstruction leading to renal fibrogenesis it was found that GAL-3 was raised in the kidney and played a role in renal myofibroblast accumulation and fibrogenesis (129). In some instances GAL-3 can also act as a protective factor in disease processes. It was observed in diabetic mice that GAL-3 null mice developed increased proteinuria, albuminuria, glomerular sclerosis and more marked accumulation of glomerular advanced glycation endproduct (AGE) suggesting a favorable role of GAL-3 in the kidney (130, 131). Therefore GAL-3 can be viewed as a regulatory molecule acting at various stages along the continuum from acute inflammation to chronic inflammation and tissue fibrogenesis (132) GAL-3 in Apoptosis GAL-3 can act as both proapoptotic and antiapoptotic protein. Intercellular GAL-3 acts as an antiapoptotic factor and extracellular GAL-3 as a proapoptotic factor in various states (73). There is evidence that GAL-3 contains the anti-death Asp-Trp-Gly-Arg (NWGR) motif (7, 13) which is critical for its antiapoptotic function. The anti-apoptotic activity of GAL-3 was also demonstrated in peritoneal macrophages when those from galectin-3-deficient mice were more sensitive to apoptotic stimuli than those from control mice (75). GAL-3 protects cells against apoptosis by working through different mechanisms which suggests that GAL-3 regulates the common apoptosis commitment step. Regarding the proapoptotic activity of GAL-3, Lee et al. have shown that GAL-3 overexpression potentiated TRAIL (tumor necrosis factor-related apoptosis-inducing ligand) induced cytotoxicity (97). 14
38 GAL-3 translocates to the perinuclear membrane following apoptotic stimuli (133) (134). It is enriched in the mitochondria and prevents mitochondrial damage and cytochrome c release. GAL-3 s antiapoptotic effect is proposed to be due to its activation of the phosphatidylinositol 3-kinase (PI3K)/Akt pathway, which blocks loss of the mitochondrial membrane potential, resulting in inhibition of caspase-9 and caspase-3 activation and suppression of apoptosis (98). The most interesting feature regarding GAL-3 is its expression in different cell types under different physiological and pathophysiological conditions. Although considerable work has been conducted to elucidate the pathways regulating its expression precise mechanism nevertheless still remains uncertain GAL-3 in the heart Recently published data has established a very strong role of GAL-3 in heart failure (135). Sharma et al. (136) showed that a 4-week continuous infusion of low dose GAL-3 into the pericardial sac of healthy Sprague Dawley rats led to left ventricular dysfunction, with a threefold differential increase of collagen I over collagen III. In heart failure prone hearts in mice, it was also shown that GAL-3 was a robustly over-expressed gene in failing versus functionally compensated hearts (136). Thandavarayan et al. (137) recently showed that upregulation of GAL-3 in the left ventricle is a general phenomenon of LV dysfunction and not confined to models with increased angiotensin II (AngII) signaling. Increased Gal-3 secretion stimulates release of various mediators, such as transforming growth factor β and promotes enhanced macrophage and mast cell infiltration, cardiac fibroblast proliferation, with development of interstitial and perivascular fibrosis, collagen deposition, and ventricular dysfunction (136, 138). GAL-3 was localized at the very sites of fibrosis, colocalizing with fibroblasts and 15
39 macrophages and its binding sites were localized predominantly to fibrotic areas (136). In humans, ventricular biopsies from patients with aortic stenosis with preserved or depressed ejection fraction were studied. The results showed that GAL-3 was upregulated in the biopsies from patients with depressed ejection fraction (136) lending support to the notion that GAL-3 is associated with decompensated heart failure. Higher levels of GAL-3 were associated with recurrent heart failure and increased risk of death in a number of studies ( ). This has led to the use of GAL-3 levels as a prognostic marker in patients with heart failure. GAL-3 also predicted all-cause death (143) and demonstrated a relationship between GAL-3 and future heart failure and re-hospitalizations in the general population (144). Despite its established role in heart failure, GAL-3 has not been studied directly in relation to cardiac ischemia. In other organs, e.g., Galectin-3 mrna increased after ischemic injury in acute renal failure in rats (145). There was also up-regulated expression of GAL-3 in the ischemic brain following transient middle cerebral artery occlusion in rats and in neonatal hypoxic ischemic brain injury (79, 146). In this thesis, we aim to study the direct effects of ischemia on GAL-3 levels in the heart very early in the course of events following myocardial infarction HIF-1 alpha Hypoxia-inducible factor-alpha (HIF-1α) is the master regulator of cell response to hypoxia (147). It activates transcription of many genes, the protein products of which increase oxygen delivery or facilitate metabolic adaptation to hypoxia, and thus plays an essential role in the pathophysiology of ischemic 16
40 diseases. HIF-1 α is a heterodimeric DNA-binding complex composed of two basic helix-loop-helix proteins, the constitutive expressed HIF-β or aryl hydrocarbon receptor nuclear translocator (ARNT) and the oxygen sensitive hypoxia-inducible HIF-α (148). HIFα exists in three isoforms HIF1α, HIF2α and HIF3α (149). which heterodimerize with ARNT (HIF-1β), ARNT2, or ARNT3 subunit through their HLH (helix-loop-helix) and PAS (Per period circadian protein, Arnt aryl hydrocarbon receptor nuclear translocator protein, Sim single-minded protein) domains. HIF heterodimers recognize and bind to hypoxia response elements (HREs) in the genes that have the consensus sequence G/ACGTG (150). HIF-1α and ARNT (HIF-1β) mrna are expressed in most of the mammalian tissues; though, HIF-2α, HIF-3α, ARNT2, and ARNT3 show a more restricted pattern of expression (151) Regulation of HIF-1 α Normoxic conditions lead to hydroxylation of two prolyl residues by prolyl hydroxylases (PHDs) in the oxygen dependent degradation domain (ODDD) of the α-subunit of HIF-1 α. This causes the von Hippel Lindau tumor suppressor protein (pvhl) to interact with the α-subunit, targeting it for proteolysis by the ubiquitin proteasome pathway (152, 153). Therefore, in normoxia HIF-α subunit has a very short half-life (154) and cells continuously synthesize and degrade HIF-α protein. Hypoxia causes inhibition of the prolyl hydroxylation, HIF-α protein escapes proteasomal degradation, translocates to the nucleus and dimerizes with HIF-1β. This complex then binds to the HRE in promoter or enhancer sequences of target genes (155) and results in their transcription. HIF α subunits are also degraded by oxygen sensitive Factor Inhibiting HIF-1α (FIH1), 17
41 an asparaginyl hydroxylase that stops the interaction between HIF-1α and coactivators p300/cbp and impairs transcription (156, 157) HIF-1 α in the heart HIF-1α is involved in the pathophysiological responses of a variety of diseases, including cancer, inflammation and tissue ischemia (158). Expression microarray analysis of genes induced by hypoxia showed that 45 genes were upregulated by hypoxia and 40 (89%) of these were regulated by HIF-1 α (159). There is a great body of evidence supporting the protective role of HIF-1α in cardiovascular pathophysiology, however, newer studies hint at a maladaptive and deleterious role of this transcription factor that merits further investigation HIF-1 α is cardio-protective An increase in the level of HIF-1α is one of the first adaptations of human myocardium to ischemia (160) (Fig.1.2) HIF1α can directly reprogram the metabolic state in cells (158) and set it in a prosurvival mode. HIF-1 α on the one hand increases transcription of glucose transporters and glycolytic enzymes to improve glucose utilization ( ) and on the other hand inhibits mitochondrial respiration ( ) to decrease oxygen usage. It establishes balance between glycolytic and oxidative metabolism that maximizes ATP production without increasing ROS (reactive oxygen species) levels (167). HIF-1 α targets that have cardioprotective effects in the setting of ischemic and or ischemia/reperfusion injury include a variety of genes, including erythropoietin (EPO), vascular endothelial growth factor (VEGF), inducible nitrics oxide synthase (inos), hemeoxygenase-1 (HMOX-1) and cardiotrophin. EPO is well known for its effect on the red cell mass to increase oxygen delivery 18

42 Figure 1.2: Protective and deleterious effects of HIF-1α. BNIP3 indicates BCL2/adenovirus E1B 19 kda protein-interacting protein3; CT-1, cardiotropin-1; EPO, erythropoietin; GLEN, glycolytic enzymes; GLUT, glucose transporters; GPER, G-protein estrogen receptor; HIGD-1, hypoxia-induced gene domain family-1α; HMOX-1, hemeoxygenase-1; inos, inducible nitric oxide synthase; MEN, mitochondrial enzymes; p53, tumor suppressor protein 53; ROS, reactive oxygen species; SERCA, sarco/endoplasmic reticulum Ca2+-ATPase; sflt-1, soluble fms-like tyrosine kinase-1; VEGF, vascular endothelial growth factor. (Hashmi S, Al-Salam S. Hypoxia-inducible factor-1 alpha in the heart: a double agent? Cardiol Rev Nov-Dec; 20(6):268-73) 19
43 to the tissues in response to hypoxia (168). This effect is protective in the long term but EPO is also shown to have cardioprotective effects in vivo and in vitro in directly improving left ventricular function and deceasing activity of the proapoptotic caspase-3 by activating PI3K-Akt cell survival pathways (169, 170). VEGF imposes cardioprotection through increased cardiac vascularization (171, 172) while inos achieves this ( ) through cgmp and subsequent opening of mitochondrial potassium-atp channels, hence preventing ATP depletion, which is advantageous in the heart. HIF-1 α target HMOX-1 is cardioprotective (176, 177) via multiple pathways that involve direct cytoprotective and antiapoptotic effects of carbon monoxide and antioxidant effects of biliverdin/bilirubin and ferritin (178). HIF-1 α is directly involved in the upregulation of Cardiotrophin-1 (CT-1) which protects cardiomyocytes from hypoxia-induced apoptosis (179, 180). Cardioprotection mediated by HIF-1 α results in decreased infarct size and improved cardiac function. These beneficial effects were seen in murine hearts exposed to constitutive overexpression of HIF-1α (172). HIF-1α contributes to the limitation of infarct size mainly by promoting angiogenesis (181). Cultured neonatal cardiomyocytes were protected against ischemia-reperfusion injury by adenovirus-mediated expression of constitutively stable hybrid forms of HIF-1 α through induction of multiple protective genes (182). HIF-1α is also involved in cardioprotection by ischemic pre-conditioning and post-conditioning. Preconditioning is a phenomenon where one or more short ischemic episodes confer protection against cell death following the actual prolonged ischemic insult (183). HIF-1α is postulated to play a role by regulating mitochondrial respiration (184). Post-conditioning is induced by repetitive short episodes of reperfusion and 20
44 ischemic re-occlusion before permanent reperfusion and HIF-1α attenuates myocardial injury through this phenomenon (185). Some authors suggest a positive association of HIF-1α with ischemiainduced coronary collateralization (186, 187) which by increasing blood supply to hypoperfused regions of the heart confers protection to the myocardium against ischemic injury. PHDs inhibition is another mechanism to achieve HIF-1α mediated effects. Mammalian cells have 3 types of PHDs: PHD1, PHD2 and PHD3. PHD2 and PHD3 are highly expressed in the heart (188). Inhibition of PHD2 by Dimethyloxalylglycine (DMOG) and GSK360A (189, 190), short hairpin RNA interference (shrna) (191) and use of transgenic mice with cardiomyocyte specific PHD2 knockout (192) showed cardioprotective effects. Up-to-date studies have identified HIF-1α to be a very credible candidate for gene therapy and this has led to encouraging results. HIF-1α gene delivery in skeletal muscle preceding induction of myocardial infarction has led to reduction in infarct size and left ventricular remodeling as well as preservation of hemodynamic function in vivo (193). Initial data from a clinical trial with HIF-1α delivered to ischemic cardiac muscle via a type 2 adenoviral (Ad2HIF) vector is also promising (194). Results at one year follow up show improved ventricular function and increased perfusion of the myocardium which was initially viable but hypoperfused. Newer studies are constantly reporting on the advantageous effects of HIF-1α. Up regulation of HIF-1α protected cardiac myocytes against nitrate tolerance (195) and improved the responsiveness of ageing myocytes to inotropic stimulation (196). 21
45 There are considerable sex related differences in the HIF-1α response which merit careful consideration. HIF protein increased significantly in both male and female murine hearts subjected to myocardial infarction by ligation of left anterior descending artery (LAD), relative to sham-operated animals, but this increase was 60% greater in females than in males (197). mrna expression of HIF was significantly increased in 24 hour post myocardial infarction in female mice hearts versus male and sham-operated animals. Expression of downstream HIF target genes was increased in proportion to the levels of HIF expression (197). Many studies have shown that in the cardiovascular system, estrogens play a protective role against ischemia (198, 199). The ability of 17- beta estradiol (E2) to counter the oxygen radicals has been considered as a principal factor of overall cardioprotection (200). G-protein estrogen receptor (GPER), has been found recently to mediate the estrogen effects (201). GPER is an HIF target gene, providing evidence for a new mechanism by which estrogens exert biological effects under hypoxic conditions. Hypoxia-induced expression of GPER may be included among the mechanisms involved in anti-apoptotic effects elicited by estrogens, particularly in a low oxygen microenvironment (202). There are also significant sex differences in adaptation to chronic hypoxia that may reflect the different sensitivity of males and females to oxygen deprivation and other stresses (203). Sex dependence in development of cardiac hypertrophy and the reduced risk for cardiovascular diseases in females have also been reported in both epidemiological and experimental studies (204, 205). In light of the above observations, the diagnostic and therapeutic procedures related to HIF-1 α have to be optimized based on sex (203). 22
46 HIF-1 α is cardio-deleterious The first evidence for a cardio-deleterious role of HIF-1α came from a study by Lei et al. where knocking-out the von Hippel- Lindau gene led to stabilization of HIF-1α and resulted in dilated cardiomyopathy with a variety of marked histological findings including lipid accumulation, myocyte loss, fibrosis, and even malignant transformation (206). HIF- 1α was implicated in this development due to the observation that concomitant deletion of von Hippel- Lindau gene and HIF-1α in the heart prevented this phenotype and restored normal longevity. Bekeredjian et al (207) generated a transgene containing the human HIF- 1α cdna with alanine substitutions at Pro402, Pro564, and Asn803 (denoted HIF-1a-PPN) to study the effects of enhancing HIF-1 α activity in the adult animals in a normoxic environment (207). These animals showed enhanced angiogenesis which was expected, but also showed ventricular dysfunction. A possible explanation for this observation was substantial down-regulation of the mrna for sarco/endoplasmic reticulum Ca 2+ -ATPase gene (SERCA) (Fig.1.2) leading to reduced ionotropy, and ventricular dysfunction (207). Interestingly, these effects were reversible on cessation of transgene expression indicating that the dysfunction was not related to cardiomyocyte death (207). Another study showed that although infarct size and perioperative mortality were significantly lower in the mice which lacked cardiac PHD2 compared with the PHD2-proficient mice, cardiac function deteriorated more rapidly in mice which lacked cardiac PHD2 (208). Combined loss of PHD2 and PHD3 in the heart shows significant left ventricular dysfunction and premature mortality associated with myocardial thinning and LV dilatation, hallmarks of severe cardiomyopathy (208). 23
47 HIF1α also plays an important role in adaptive cardiopulmonary responses. Some studies have shown that HIF-1 plays a protective role in cardiac hypertrophy through maintenance of the cgmp signaling pathway (209), however, others have concluded that pressure-overloaded cardiac hypertrophy in the rat leads to abnormal regulation of HIF-1α, VEGF and BNP (210). Increased hemodynamic load is also known to unmask deleterious consequences of cardiacspecific PHD2 inactivation (208). An interesting observation made by Bohuslavová et al. is that the hypoxic responses by HIF-1α target genes are differently regulated in left and right ventricles as a means of adaptation to sustained chronic hypoxia (203) and that the regulation of gene expression is significantly affected by HIF-1α deficiency The heart of the matter lies in balance How HIF-1α will ultimately influence the heart depends on the balance between its various actions. Taking into account the results of the studies reviewed, these actions at times appear to act in conflict. HIF-1α transcribes a number of genes that play proapoptotic or antiapoptotic roles according to tissue specificity and conditions (211). HIF -1α interacts with and activates tumor suppressor p53, which increases mitochondrial apoptosis by inducing Bax production, cytochrome C release and activation of caspases 3 and 9 (212). HIF- 1α also activates genes for the pro-apoptotic proteins NIP3 (213), BNIP3 (214), and Noxa (215). Regarding specific effects on the heart, HIF-1a pathway is potentially cardioprotective in reducing cytochrome c levels (166) and inducing Higd-1 (hypoxia induced gene domain family-1a), a mitochondrial membrane protein possessing anti-apoptotic effect through inhibition of cytochrome C release and reduction of caspase activities (216, 217). The direct evidence of the 24
48 role of HIF-1α- mediated apoptosis in the cardiomyocytes came from a study which showed acute hypoxia for 24 hours enhanced primary neonatal rat ventricular myocyte apoptosis through the activation of HIF-1α. In addition, hypoxia increased the expression levels of HIF-1α and proapoptotic protein Bnip3 and when HIF-1α was inhibited by YC-1 (3-(5'-hydroxymethyl-2'-furyl)-1- benzylindazole), there was a corresponding decrease in the level of expression of Bnip3 protein and the degree of apoptosis (218, 219). Biological activity of VEGF is increased by the hypoxic upregulation of VEGF receptor-1 (VEGFR-1/Flt-1) (220). VEGF mrna stability is also increased under hypoxic conditions (221). VEGF directly induced by HIF-1 α (222) is generally considered to be cardioprotective. Both intramyocardial gene delivery of HIF-1α and cardiac-specific over expression of HIF-1α has led to increased cardiac vascularization with increased VEGF (171, 172). VEGF derived increased capillary vascularity in addition to being advantageous in restoring the delivery of blood to the heart can also contribute to cardiac dysfunction through changes in tissue architecture, interstitial edema, or perhaps paracrine signaling between endothelial cells and cardiomyocytes (208). VEGF exerts its effects through its receptor vascular endothelial growth factor receptor (VEGFR). VEGFR-1 (or Flt-1) exists under soluble fms-like tyrosine kinase (sflt-1) or membrane-bound fms-like tyrosine kinase (mflt-1) form. sflt-1 is antiangiogenic, and mflt-1 is proangiogenic (223). sflt1 traps circulating VEGFA, VEGFB preventing their further binding to membrane associated VEGFRs (224). Long term hibernation of cardiomyocytes was induced by conditional overexpression of sflt1 which was accompanied by cardiomyocyte dysfunction 25
49 and reduced ventricular contraction (225). sflt1 levels are increased in coronary artery disease (226) post MI (227) and in patients developing severe acute heart failure (228). They are also shown to predict mortality in patients with symptoms of acute MI (229). HIF-1 α upregulates sflt1 expression (230) and so this factor needs to be considered in the sustained HIF-1 α activity in the setting of chronic ischemia Is there a cutoff point? There is a general agreement that HIF-mediated responses appear to differ under conditions of acute and chronic oxygen deprivation. The intensity and sustainability of HIF-1α activation are major determinants of whether the responses are pathological or beneficial. HIF activation is seen to be beneficial in the setting of acute myocardial ischemia and deleterious in chronic conditions (208). Sustained angiogenesis over a long term (208), uninhibited mitochondrial apoptosis (212) and HIF-1 α controlled metabolic changes in the cell which may be adaptive over a short period of time but maladaptive if sustained over prolonged periods, are some possible mechanistic basis for these differences between acute and chronic activation of HIF HIF-1 α: more questions? The role of HIF-1α is extremely complex. The heterogenousity of its effects on the heart is a challenge for scientists because on the one hand the therapeutic strategies aiming at increasing HIF-1α in the heart are very actively being pursued but, on the other hand, the long term effects of these modalities are yet to be made clear. It is not merely a matter of acute and chronic hypoxia exposure, but the challenge now for scientists is to determine the cutoff or the threshold where HIF- 1α stops being beneficial and starts its detrimental effects. A very recently 26
50 published study shows that in the heart, exposure to acute or chronic hypoxia does not involve HIF-1α stabilization (231). In this study, the measured HIF-1α in cardiac nuclear extracts at both protein and transcriptional levels by immunoblotting and by qrt-pcr, showed no changes in HIF-1α protein and mrna amounts (231). The authors claimed that inhibition of complex I and complex III of the electron transport chain in the mitochondria destabilizes HIF- 1α ( ) and so in acute hypoxia AMPK (AMP-activated protein kinase) activation governs the metabolic adaptation with Bnip3 upregulation and PGC-1 (peroxisome proliferator-activated receptor γ coactivator-1) downregulation, whereas in chronic hypoxic conditions up-regulation of enzymes involved in antioxidant defense and misfolded protein degradation and down-regulation of enzymes controlling anaerobic metabolism are important. To add to the complexity of HIF -1α influence in our cellular functions, we know that HIF-1α is not only induced in hypoxia but other factors such as insulin-like growth factor, epidermal growth factor, interleukin-1 and Ras and Src oncogenes are also known to regulate it ( ). There is a possibility therefore that an interplay of these and other factors-in addition to the hypoxia-creates a local environment that will cause HIF-1 α levels to fluctuate and exert its prosurvival or disadvantageous effects. The effects of HIF-1 α in the heart should not be taken only in the context of its effects in response to decreased oxygen levels or the duration of its activity in ischemia but in relation to other players that are increased or decreased in myocardial ischemia and which can independently regulate HIF-1 α. Further work needs to be done to understand these interactions so that a clearer picture emerges regarding the role of HIF-1 α in the heart. 27
51 1.2.6 Myocardial infarction and Myocardial Ischemia reperfusion Injuries Myocardial infarction denotes the death of cardiac myocytes due to extended ischemia, which may be caused by an increase in perfusion demand or a decrease in blood flow. Persistent elevation of the ST-segment on ECG indicates total occlusion of a coronary artery that causes necrosis of the myocardial tissue. The term "acute" denotes infarction less than 3-5 days old, when the inflammatory infiltrate is primarily neutrophilic (241). If coronary occlusion is removed within approximately 20 minutes after onset, tissue viability is preserved (242) and the myocardial damage is transient resulting in temporary contractile failure of the myocardium, but it is not associated with development of necrosis. Prolonging the period of acute myocardial ischemia for more than 20 minutes causes a wave front of cardiomyocyte death that begins in the subendocardium and extends transmurally toward the epicardium (242). This is the reason that when a patient is presented with an acute myocardial infarction, the most effective therapeutic intervention is timely myocardial reperfusion using thrombolytic therapy or primary percutaneous coronary intervention to salvage the ischemic myocardium. Myocardial reperfusion is the restoration of coronary blood flow, which either occurs spontaneously or is therapeutically induced, after a period of coronary occlusion. Reperfusion has the potential to salvage ischemic myocardium but paradoxically it can cause a wide spectrum of deleterious effects results from reperfusion itself when it is superimposed on already ischemic-altered myocardium. The net effect depends upon the severity and duration of the ischemic insult before reperfusion (243). 28
52 Mechanism of Injury in MI In severe myocardial ischemia, there is lack of oxygen which switches the cell metabolism to anaerobic respiration. This leads to the production of lactate which decreases the intracellular ph. Glycogenolysis and anaerobic glycolysis with production of ATP continue for a while (244) but is ultimately inhibited by lactate accumulation and acidosis. In myocardial tissue, metabolic markers of ischemia are initially decreasing levels of creatine phosphate and ATP, followed by increasing lactate (245). The change in ph causes Na + -H + exchanger to extrude H + which leads to an intracellular Na + overload, which activates the 2Na + - Ca 2+ exchanger to function in reverse to extrude Na + and leads to intracellular Ca 2+ overload. Due to lack of ATP the Na + -K + ATPase ceases to function, exacerbating intracellular Na + overload (246). The acidic conditions during ischemia prevent the opening of the mitochondrial permeability transition pore (MPTP) at this time. With severe ischemia, cardiomyocyte cell death begins within 20 to 60 minutes after the onset and continues to nearly all cells in the ischemic area within 6 hours (247). The major determinants of myocardial infarct size are duration and severity of ischemia, size of the myocardial area at risk, and magnitude of collateral blood flow. Alterations in the adrenergic nervous system and local alterations in the adrenergic receptor-adenylate cyclase system also influence the progression of myocardial ischamic injury. During myocardial ischemia, concentrations of catecholamines may rise in the ischemic tissue (248) which may impose a risk of further damage to the myocardium. In addition to the above mechanisms, myocardial ischemia and infarction may induce serious ventricular arrhythmias 29
53 early within the first hour of ischemia (249) which may add to the direct ischemic damage Pathology of Acute Myocardial infarction Myocardial infarction shows features of typical ischemic coagulative necrosis (241). Grossly, the earliest change that can be seen is pallor of the myocardium, which is visible 12 hours or later after the onset of irreversible ischemia. The infarcted area is well defined at 2-3 days, with a central area of yellow discoloration surrounded by the appearance of dark mottling. At 5-7 days, the central yellow area is surrounded by hyperemic borders; At 1-2 weeks, the borders assume a red grey color, from 2 8 weeks the scar starts to develop from the periphery to the centre and healing may be complete as early as 4-6 weeks for small infarcts or may take as long as 2-3 months for large ones (241, 250). Microscopic appearance before 12 hours is difficult to interpret but there are hypereosinophilic changes of the myocyte sarcoplasms with loss of cross striations before neutrophilic infiltrates flood the area of infarct. Waviness may be seen at the border of the ischemic myocardium. Coagulative necrosis starts at 12 hours post myocardial infarction. There is nuclear pyknosis, early karyorrhexis, and karyolysis. Neutrophil infiltration is prominent at 24 hours post infarction which becomes extensive by 48 hours. By 5-7 days, macrophages and fibroblasts begin to appear in the border areas. Macrophages remove the necrotic myocytes. After the first week, the number of neutrophils decline and granulation tissue is established. Fibroblasts actively produce collagen, and angiogenesis occurs in the area of healing. The granulation tissue promotes the deposition of dense collagen by the second week and complete scar formation is completed by the second month (241). 30
54 Mechanism of injury in IR It was thought initially that reperfusion only has a beneficial effect on the ischemic myocardium and there was no cell death related to myocardial reperfusion (243, 251, 252). When cell death was observed after reperfusion a new idea emerged that reperfusion only accelerates the death of already irreversibly damaged cardiomyocytes during ischemia, but does not induce death of the cells which are still viable (253). The concept of reperfusion injury states that reperfusion by itself may be able to induce death to cells that have survived through ischemia (254). There are four recognizable forms of reperfusion injury (255). 1) Reperfusion-induced arrhythmias: Reperfusion can lead to cardiac arrhythmias which can terminate by themselves or are treated (256). 2) Myocardial stunning: Reperfusion can also lead to a transient and reversible myocardial contractile dysfunction (257). 3) Microvascular obstruction: Microvascular obstruction or "no-reflow" phenomenon is the inability to reperfuse a previously ischemic region (258). The main causes of this phenomenon include capillary damage, external capillary compression by endothelial cell and cardiomyocyte swelling, micro-embolization of friable material released from the atherosclerotic plaque, platelet microthrombi, the release of soluble vasomotor and thrombogenic substances, and neutrophil plugging ( ). No effective therapy currently exists for reducing this phenomenon in patients who have undergone PCI. 4) Lethal myocardial reperfusion injury Reperfusion can cause death of cardiomyocytes that were viable at the end of the index ischemic event (8). This 31
55 is called lethal myocardial reperfusion injury. We will discuss the mechanism of this injury in detail below. The major contributory factors in lethal myocardial reperfusion injury include oxidative stress, calcium overload, mitochondrial permeability transition pore (MPTP) opening, and hypercontracture (263). A hallmark of myocardial reperfusion is the increased generation of reactive oxygen species (264). Mitochondria are the most important source of ROS in the myocardium. There are many reasons for this. Cardiomyocytes have very high energy demands thus contain a large amount of mitochondria (265). Mitochondria have all the biomolecules that are exposed to free radical reactions, e.g., they contain high levels of unsaturated fatty acids that are susceptible to peroxidation reactions (266). Mitochondria are an important source of superoxide, hydrogen peroxide and nitrous oxide generation during ischemia and reperfusion ( ) and so regulate ROS mediated cell death (271). During reperfusion, the electron transport chain is reactivated, generating ROS. Other sources of ROS include xanthine oxidase from endothelial cells and NADPH oxidase from neutrophils (255). ROS mediate myocardial reperfusion injury by inducing the opening of the MPTP, acting as a neutrophil chemoattractant, and mediating dysfunction of the sarcoplasmic reticulum (SR) (255). At the time of myocardial reperfusion, there is an abrupt increase in intracellular Ca2+. This phenomenon is termed the calcium paradox. This is caused by damage to the sarcolemmal membrane and sarcoplasmic reticulum which are then unable to regulate Ca2+ in the cardiomyocyte. This Ca2+ overload can cause injury by opening the MPTP and thereby causing hypercontracture in the cardiomyocytes (8). 32
56 Reperfusion causes rapid restoration blood flow to the ischemic area which results in washout of lactic acid and recovery of physiologic ph. This phenomenon is termed the ph paradox. It causes activation of the Na + -H + exchanger which contributes to lethal reperfusion injury by releasing the inhibitory effect on MPTP opening and cardiomyocyte contracture (272). Mitochondrial PTP is a critical determinant of lethal reperfusion injury. It is a nonselective channel on the inner mitochondrial membrane. Opening of this channel causes loss of mitochondrial membrane potential and uncouples oxidative phosphorylation, resulting in ATP depletion and cell death (273). Mitochondrial PTP opens in reperfusion in response to mitochondrial Ca2+ overload, oxidative stress, restoration of a physiologic ph, and ATP depletion (274, 275). Neutrophils also accumulate in the infarcted myocardial tissue several hours after the onset of myocardial reperfusion in response to the release of the chemoattractants ROS, cytokines, and activated complement (255). All the above described factors involved in the lethal myocardial reperfusion injury attenuate the full benefits of myocardial reperfusion. The importance of myocardial reperfusion injury is evident from the fact that it may account for up to 50% of the final MI infarct size (255, 263) Pathology of IR The macroscopic appearance of reperfused MI is typically haemorrhagic. In the reperfused myocardium the infarcted region appears red because of trapping of the red cells and hemorrhage from ruptured necrotic capillaries. Ischemic 33
57 myocytes following reperfusion develop ultrastructural changes which is indicative of cell death, but from a histological point of view they may seem normal (276). There is a possibility that most of the myocytes are already irreversibly injured by the time reperfusion occurs, and reperfusion is simply accelerating the phenomenon (277). Morphologic features which are typical of reperfusion are contraction band necrosis, the no reflow phenomenon, and intramyocardial haemorrhage. These changes are in addition to the coaglative necrosis that occurs in ischemic myocardial damage (276). Contraction band necrosis occurs due to a rapid re energisation of myocytes with calcium overload (278). Contraction bands are seen in irreversibly injured myocytes and morphologicaly they are characterised by intensely eosinophilic transverse bands comprising of closely packed hypercontracted sarcomeres (250). No reflow phenomenon concerns small vessels which are either damaged or showing small thrombo or athero emboli. This leads to endothelial cell swelling which occludes the small capillaries and prevents local reperfusion of ischemic myocardium (279, 280). Reperfused myocardial infarcts frequently appear reddish because of intramyocardial haemorrhage (281). They are caused by vascular cell damage with leakage of blood from the injured vessels (282) Antioxidants in IR Most cells contain enzymatic antioxidant defense mechanisms that quickly tackle the ROS generated during biological processes. Antioxidants can act through many mechanisms such as scavenging the ROS, inhibiting the formation of ROS, attenuating the catalysis of ROS generation via binding to metals ions 34
58 and enhancing endogenous antioxidant generation (283). There are many endogenous antioxidants produced within the body. Superoxide dismutase (SOD), catalase and glutathione (GSH) are among the most important. SOD is present in the cytoplasm as well as on the endothelial cell surface with either copper or zinc (CuSOD, ZnSOD) and in the mitochondria with manganese (MnSOD)(284). SOD can be either reduced or oxidized to convert superoxide to oxygen and hydrogen peroxide (21, 285). Hydrogen peroxide is subsequently converted to water by either catalase (286) or by the glutathione peroxidase system (287). Guarnieri et al. (288) have demonstrated that ischemia and reperfusion impaired superoxide dismutase activity and decreased the cellular glutathione-to-glutathione disulfide ratio. Experiments using isolated heart models in the presence or absence of superoxide dismutase also showed ROS as likely mediators of reperfusion injury (289, 290). The effectiveness of GSH as an antioxidant is a result of its ability to remove hydrogen peroxide, a reaction catalyzed by GSH peroxidase. The oxidized glutathione (GSSG) is reduced back to GSH by GSH reductase. Glutathione is an important antioxidant enzyme in myocardial ischemia-reperfusion injuries (291). Intracellular GSH status appears to be a sensitive indicator of the overall health of a cell, and of its ability to resist toxic challenge. Myocardial glutathione plays an important role in protecting the ischemic myocardium against reperfusion injury (292). Catalase is a membrane bound enzyme which is present in peroxisomes and in the mitochondrial matrix (293). Catalase activity and its mrna expression was found to be higher in rabbit hearts subjected to IR injury (294) (295, 296). 35
59 Catalase and SOD together are important in protecting the myocardium against ischemia reperfusion (297, 298). This has been shown in genetically engineered animal models as well as isolated heart models (299). The effectiveness of antioxidants in protecting the heart against ischemia reperfusion injuries depends on the severity of oxidative stress and the interaction of antioxidants with ROS The dilemma of Myocardial reperfusion The model of reperfused infarction (300, 301) affects mostly a larger portion of left ventricle than the infarction itself (302), but reperfusion still leads to a faster resolution of inflammation and scar formation emphasizing the importance of reperfusion in restoring the viability of the myocardium. With new advances in medicine, the process of myocardial reperfusion continues to improve with more timely and effective reperfusion strategies. PCI technology, antiplatelet and antithrombotic agents are very effective in maintaining the patency of the infarctrelated coronary artery, but there is still no effective therapy for preventing myocardial reperfusion injury. Myocardial reperfusion injury reduces the full benefits of myocardial reperfusion and thus represents an important target for cardioprotection in patients. 36
60 1.3 Aims and Objectives The main aim of our project was to establish a murine model of myocardial infarction and ischemia reperfusion injury in our lab and to use these two models to investigate the role of GAL-1, GAL-3 and HIF-1α in myocardial infarction and Ischemia reperfusion injury. Specific objectives of our work are listed as follows: 1. Identifying the role of GAL-1, GAL-3 and HIF-1 α in early cardiac ischemia. 2. Determining the expression of GAL- 1, GAL-3 and HIF-1α within cardiac myocytes, macrophages and endothelial cells and interstitial cells during ischemia. 3. Determining the potential of using Galectins as markers for early detection of cardiac ischemia/infarction. 4. Comparing the two types of myocardial injury, MI and IR in terms of their mechanism of injury. 5. Investigating specific role of GAL-3 in MI and IR by using GAL-3 knockout mice. 37
61 Chapter 2: Materials and methods 38
62 2.1 Ethical Approval The Animal Research Ethics Committee of the College of Medicine and Health Sciences, UAE University, has approved all experimental procedures (Protocol No.A12/10 Murine Model of Myocardial Infarction). All experiments were performed with the guidelines from the Principles of Laboratory Animal Care and the Guide for the care and use of laboratory animals published by NIH (NIH Publication No , revised 1996), and specific national laws have been observed. 2.2 Animal strains and experimental groups C57B6/J mice and Galectin-3 knockout (KO) mice with C57B6 background were used in this study. All the animals were male, aged weeks and weighed 20-25g. Wild type C57B6/J mice were divided into 5 groups with the following time points: Group I: 20 minute post MI (n=8), Group II: 30 minute post MI (n=8), Group III: 60 minute post MI (n = 8), Group IV: 4- hour post MI (n = 8) and Group V: 24- hour post MI (n =8). Samples from sham operated animals, which are our controls, (20 minute sham, n=7, 30 minute sham, n=7, 60 minute sham, n=7, 4- hour sham, n=7 and 24- hour sham, n=7) for each mentioned time points were also studied. Samples from non-operated normal animals (Naïve, n=7) were also studied. Wild type C57B6/J (WT) mice and GAL-3 KO mice were also used for our Myocardial infarction and Ischemia reperfusion comparison experiments. WT 24hour MI group (n=8), WT 24 hour sham group (n=8), WT IR group (n=8), GAL-3KO 24hr MI group (n=8), GAL-3 KO sham group (n=6) and GAL-3 KO IR group (n=8). 39
63 Separate experiments for each group (n=6) were performed for sample collection for RNA extraction and quantitative real time PCR. Also, another set of independent experiments were conducted for respective time points for formalin fixed paraffin embedded tissue preparation for H&E staining, immunohistochemistry and immunofluorescent techniques. 2.3 Murine model of myocardial infarction and Ischemia Reperfusion Injury C57B6/J mice and GAL-3 KO for the experimental groups mice were anesthetized by an intraperitoneal injection of a combination of Ketamine (100 mg/kg) and Xylazine (10 mg/kg). The animal is checked by toe-pinch reflex to determine adequate anesthesia. The mice were then intubated by transesophageal illumination using a modified 22-gauge plastic cannula and fixed on the operating pad in the supine position by taping all four extremities. The mice were connected to a mouse ventilator (Harvard apparatus Minivent Hugo Sachs Electronik) which supplied room air supplemented with 100% oxygen (tidal volume 0.2 ml/min., rate 120 strokes/min). Rectal temperature was continuously monitored and maintained within o C using a heat pad. The lead II ECG (ADInstrument multi-channel recorder interfaced with a computer running Power lab 4/30 data acquisition software) was recorded from needle electrodes inserted subcutaneously. Myocardial infarction was induced in the mice by permanently occluding the left anterior descending coronary (LAD) artery as described earlier (303, 304). The chest was opened with a lateral incision at the 4 th intercostal space on the left side of the sternum. Next the chest wall was retracted for better visualization of the heart. With minimal manipulation, the pericardial sac was removed and the 40
64 left anterior descending artery (LAD) was visualized with a stereomicroscope (Zeiss STEMI SV8). An 8-0 silk suture was passed under the LAD and ligated 1 mm distal to left atrial appendage. The distance of 1mm was measured by a scale and strictly followed in all the animals to maintain constant area of infarction. This position induces ischemia in about 40 50% of the LV area (305). Occlusion was confirmed by observing immediate blanching of the left ventricle (LV) post ligation. An accompanying ECG recording showed characteristic ST-elevation, which further confirmed ischemia. The chest wall was closed by approximating the third and fourth ribs with one or two interrupted sutures. The muscles returned back to their original position and the skin closed with 4-0 prolene suture. The animal was gently disconnected from the ventilator and spontaneous breathing was seen immediately. Postoperative analgesic (Butorphanol 2 mg/kg, s/c, 6 hourly) was given at the end of the procedure. The animal was gently placed in a warm cage and temperature maintained for 2-3 hours until the animal was fully conscious and moving. The body temperature of the animal was strictly controlled at degree Celsius throughout the procedure. For our IR model, after the 8-0 silk suture was passed under the LAD, a small 1 mm polyethylene tubing (PE) was placed on top of the LAD and the suture was ligated on the top of the PE tubing without damaging the artery. Ischemia was confirmed by the discoloration of the left ventricle. An accompanying ECG also showed corresponding ST- elevation. After 30 minutes of ischemia the ligature is removed by cutting the knot on top of this PE tube. Reperfusion was confirmed visually and by ECG changes. Sham operated mice groups are our controls for MI and IR experimental groups and they exactly follow the same time points of corresponding MI and IR groups. Sham operated 41
65 mice underwent exactly the same procedure described above, except that the suture passed under the LAD is left open and untied. 2.4 Methods Sample Collection According to the experimental protocol, mice were sacrificed at a designated time after induction of MI or IR. The method of euthanasia started with intraperitoneal injection of anesthetic drugs, which included a combination of Ketamine (100 mg/kg) and Xylazine (10 mg/kg). When the mouse was completely anesthetized, skin and chest wall were reopened. Blood was collected in EDTA vacutainers and the heart was resected, washed in ice cold phosphate buffered saline (PBS), the right ventricle and both atria were dissected away and LV was immediately frozen in liquid nitrogen and stored in a freezer at -80 o C for later protein extraction. Collected blood was centrifuged at 3000 RPM for 15 minutes. The plasma was collected, alliquoted and stored at -80 o C until further analysis. Heart samples from the same time point following LAD ligation were also fixed in 10% buffered formal-saline for 24 hours. Heart samples from the respective time points were also stored in RNA later for RNA extraction and subsequent Real time PCR Protein and RNA Extraction Protein extraction Total protein was extracted from heart samples by homogenizing with lysis buffer and collecting the supernatant after centrifugation. For total cell lysate, the left ventricular heart along with the septum samples were thawed, weighed and put in cold lysis buffer containing 50 mm Tris, 300 mm NaCl, 1 mm MgCl2, 3 42
66 mm EDTA, 20 mm b-glycerophosphate, 25 mm NaF, 1% Triton X-100, 10%w/v Glycerol and protease inhibitor tablet (Roche Complete protease inhibitor cocktail tablets). The hearts were homogenized on ice by a homogenizer (IKA T25 Ultra Turrax). The samples were then centrifuged at RPM for 15 minutes at 4 o C, supernatant collected, alliquoted and stored at -80 o C until further analysis. Nuclear and cytoplasmic protein extraction was done following the protocol described elsewhere (306). Briefly, the heart LV were thawed on ice, weighed and homogenized on ice with buffer containing Tris HCl 10 mmol/l, CaCl2 3 mmol/l, MgCl2 2 mmol/l, EDTA 0.1 mmol/l, Phenylmethanesulfonyl fluoride (PMSF) 0.5 mmol/l, Sucrose 0.32 mmol/l, Dithiothreitol (DTT) 1 mmol/l, Nonidet P-40 (NP- 40) 0.5% and Protease inhibitor cocktail 1%. The homogenates were centrifuged at 800 g for 10 minutes. The supernatant was removed and kept as cytoplasmic fraction. The pellet was washed twice with homogenization buffer without NP-40 and resuspended with a low salt buffer containing HEPES 20 mmol/l, MgCl2 1.5 mmol/l, KCl 20 mmol/l, EDTA 0.2 mmol/l. Glycerol 25%, PMSF 0.5 mmol/l and DTT 0.5 mmol/l. After incubation on ice for 5 minutes, an equal volume of high salt buffer containing HEPES 20 mmol/l, MgCl2 1.5 mmol/l, KCl 800 mmol/l, EDTA 0.2 mmol/l. Glycerol 25%, PMSF 0.5 mmol/l, DTT 0.5 mmol/l, NP-40 1% and protease inhibitor cocktail 1%, was added, the mixture incubated on ice for 30 minutes, centrifuged at g for 15 minutes at 4 o C and supernatants saved as the nuclear fraction. Total protein concentration was determined by BCA protein assay method (Thermo Scientific Pierce BCA Protein Assay Kit) RNA Extraction The mouse LV heart samples were divided into infarcted and non-infarcted tissue by using stereomicroscope. The tissues were homogenized in TRI Reagent 43
67 (Ambion) and RNA was isolated by phenol-chloroform method (307). Briefly, 1 ml of TRI Reagent and tissue samples were put in a 2 ml DNase/RNase-Free tube and homogenized on ice using a mechanical homogenizer (IKA T25 Ultra Turrax). Homogenized samples are incubated at room temperature for 10 minutes with occasional vortexing. Phase separation is achieved by adding 200ul of chloroform, shaking vigorously, incubating for 2-3 minutes at room temperature and then centrifuging at g for 15 minutes at 4 o C. Aqueous phase is transferred carefully to a fresh DNase/RNase-Free tube and isopropanol is added to it, mixed by pipetting up and down and incubated at room temperature for 10 minutes. The mixture is then centrifuged for g for 15 minutes at 4 o C, the supernatant obtained is discarded and 75% cold ethanol is added to it and centrifuged at 7500 g for 5 minutes at 4 o C. The supernatant is discarded and the pellet is washed again with 75% cold ethanol. After the second wash the RNA pellet is air dried for 5-10 minutes and resuspended in nuclease-free water and stored at -80 o C. RNA was quantified using a NanoDrop spectrophotometer Sample Processing for Histology Hearts were excised, washed with ice-cold PBS and weighed. Each heart was sectioned into 4 equal transverse (coronal) sections, cassetted and fixed directly in 10% buffered formalin. Sections were dehydrated in increasing concentrations of ethanol, cleared with xylene and embedded in paraffin. Three-um sections were prepared from paraffin blocks and stained with haematoxylin and eosin (H&E). H&E stain was performed as follows. Sections were dewaxed with xylene, rehydrated with graded alcohol and washed in running tap water for 5 minutes. Tissue sections were incubated in haematoxylin for 5 minutes followed by washing in tap water. The slides were checked for bluing of the nuclei. If the 44
68 intensity of blue color is high, the slides were given a quick dip in1% acid alcohol solution. Sections were rinsed in running tap water until a satisfactory blue colors of nuclei were achieved. The slides were then stained with Eosin for 1 minute, washed in running tap water, dehydrated, cleared and mounted with DPX Immunohistochemistry 5-um sections were prepared and mounted on aminopropyltriethoxysilane-coated slides. After dewaxing with xylene and rehydrating with graded alcohol, slides were placed in a 0.01 M citrate buffer solution (ph=6.0) and pre-treatment procedures to unmask the antigens was performed in a microwave oven for 10 minutes. Sections were treated with peroxidase and protein block for 60 minutes each and then incubated overnight at 4 o C with anti- GAL-1 (rabbit anti-mouse polyclonal antibody 1:2500, Davids Biotechnologie GmbH, Germany), anti- HIF 1 a (rabbit anti-mouse polyclonal antibody 1:300, Davids Biotechnologie GmbH, Germany), anti- GAL-3 (rabbit anti-mouse polyclonal antibody 1:2500, Davids Biotechnologie GmbH, Germany), anti-cleaved caspase- 3(Rabbit polyclonal, ASP 175, Cell Signaling Technology, USA), anti-bcl2 (Mouse monoclonal, SP66, Cell Marque, USA ), anti-ki67 (Rabbit monoclonal, SP6, 1:100, Cell Marque, USA), anti- Myeloperoxidase (MPO) (Rabbit Polyclonal, 1:2000, Santa Cruz biotechnology, USA), anti-cyclin D1 (Rabbit monoclonal, SP4, 1:25, Thermo Scientific, USA, USA ), anti- Cytochrome c (Rabbit Polyclonal, 1:400, Santa Cruz biotechnology, USA) and anti-catalase (Rabbit Polyclonal, 1:400, Sigma) antibodies. Sections were then washed with PBS for 15 minutes in three changes and incubated with biotin-labeled secondary antibody (Thermo Scientific, USA) for 20 minutes at room temperature. Finally, sections were incubated with streptavidin peroxidase 45
69 complex for 20 minutes at room temperature (Thermo Scientific, USA), Diaminobenzidine (DAB) chromogen (Thermo Scientific, USA) added and counter staining done with haematoxylin. Appropriate positive controls were used. For negative control, the primary antibody was not added to sections and the whole procedure carried out in the same manner as mentioned above. Positive and negative controls were used in every batch of slides that were stained Immunofluorescent labeling 5-um sections were deparaffinized with xylene and rehydrated with graded alcohol. Sections were placed in EnVisionTM FLEX Target Retrieval Solution with a high PH (PH 9) (DAKO Cytomation, Denmark) in a water bath at 80 o C for one hour. Sections were washed with distilled water for 5 minutes followed by PBS for 5 minutes. Later they were incubated with anti-hif-1 α (rabbit antimouse polyclonal antibody, 1:50,Davids Biotechnologie GmbH, Germany), anti- GAL-1 (rabbit anti-mouse polyclonal antibody, 1:50, Davids Biotechnologie GmbH, Germany), anti-gal 3(rabbit anti-mouse polyclonal antibody, 1:50,Davids Biotechnologie GmbH, Germany), anti-caspase-3 (Rabbit polyclonal, (CPP32) Ab-4, 1:50, Thermo Scientific TM Lab Vision, USA), anti-ki67 (Rabbit monoclonal, SP6, 1:50, Cell Marque, USA) and anti-mpo (Rabbit Polyclonal, 1:50, Santa Cruz biotechnology, USA), anti-desmin (Rabbit polyclonal antibody, 1:50, Santa Cruz biotechnology, USA), anti-cd31 (Rabbit polyclonal antibody, 1:50, Santa Cruz biotechnology, USA), anti-cd68 (Rabbit polyclonal antibody, 1:50, Santa Cruz biotechnology, USA), anti-factor-8 related antigen (Rabbit polyclonal antibody, Ab-1,1:50, Thermo Scientific TM Lab Vision, USA ), and anti-lysozyme (Rabbit polyclonal antibody, EC ,1:50, DAKO Cytomation, Denmark), overnight at room temperature. Sections were 46
70 subsequently incubated with Donkey anti-rabbit Ig conjugated- Rhodamine (Santa Cruz Biotechnology, USA, 1:100), or with donkey anti-rabbit Alexa Fluor 488, (Invitrogen, USA, 1:100) antibodies. Finally, sections were mounted in watersoluble mounting media and viewed with Olympus Fluorescent microscope. Immunofluorescent double labeling was done following the same procedure as above. The first primary antibody was labeled with fluorescein-labeled secondary antibody; the second primary antibody was added afterwards followed by fluorescein-labeled secondary antibody with different excitation colour. Appropriate positive control sections were used. For negative control, the primary antibody was not added to sections and the whole procedure carried out in the same manner as mentioned above. Positive and negative controls were used in every batch of slides that were stained Morphometric analysis Morphometric analysis of expression of our proteins of interest in cardiomyocytes, endothelial cells and neutrophil polymorphs was done at different time points following ligation of LAD using ImageJ software ( GAL-1 labeling was determined by counting the number of cardiomyocytes, endothelial cells and neutrophil polymorphs in 10 randomly-selected fields in the left ventricle. For GAL-1 labeling, cells were considered positive when there was a cytoplasmic and/or nuclear staining pattern. The labeling index for cardiomyocytes, endothelial cells and neutrophils were expressed as the percentage of labeled cells against the total number of cells enumerated. For HIF-1α labeling, cells were considered positive when there was a nuclear staining pattern. The labeling index for cardiomyocytes, endothelial cells and 47
71 neutrophils were expressed in the same way as done for GAL-1. Neutrophil polymorphs were counted only in 24h post MI time point. Cyclin D1 labeling was determined by counting the number of cells expressing cyclin D1 in 10 randomly selected fields in the left ventricle. For Cyclin D1 labeling, cells were considered positive when there was a nuclear staining pattern. The labeling index was expressed as the percentage of labeled cells against the total number of cells enumerated Enzyme Linked Immunosorbent Assay Left ventricular myocardial concentration and plasma levels of our proteins of interest was determined using DuoSet enzyme linked immunosorbent assay (ELISA) Development kit (R&D Systems, Minneapolis, MN, USA) for sandwich ELISA, using standard procedure according to the manufacturer s instructions (Mouse galectin-1 (DY1245), Mouse galectin-3 (DY1197), Mouse Total HIF-1 α (DYC1935-5), Mouse IL-6 (DY406), Mouse IL-1β/IL-1F2 (DY401), Mouse cleaved caspase-3 (Asp175) (DYC835-5), Mouse Total Akt-1( DYC1775-5). 96- well plates (Nunc-Immuno Plate MaxiSorp Surface (NUNC Brand Products, A/S, Roskilde, Denmark), were coated with antibody specific to our proteins. Biotinylated detection antibody and streptavidin conjugated horseradish peroxidase were used for detection of captured antigens. The plates between steps were aspirated and washed 3 times using ELISA plate washer (BioTek ELx50). Captured antigens were visualized using tetramethylbenzidine (TMB)/hydrogen peroxide. Absorbance readings were made at 450 nm, using a 96-well plate spectrophotometer (BioTek ELx800). Protein levels in samples were determined by interpolation from a standard curve. Standards and samples were assayed in 48
72 duplicate. For any particular protein of interest, each assay was at least repeated twice. The levels were normalized to total protein concentrations Quantitative Real Time Polymerase Chain (qrt-pcr) Reverse transcription Reverse transcription of RNA into cdna was done using High-Capacity cdna Reverse Transcription kit (Part # , PN , Applied Biosystems) according to the recommended protocol. A total volume of 20ul reaction was prepared with 10 μl of sample mixture containing 2 μg of template RNA and 10 μl of master mix. The master mix for 1 reaction was prepared as below. 10x RT Buffer 25x dntp Mix 10xRTRandomPrimers MultiScribeReversetran criptase RNase Inhibitor Nuclease-free H 2 O Total volume 2.0μl 0.8μl 2.0μl 1.0μl 1.0μl 3.2μl 10 μl The RT reaction was carried out in a programmable thermal controller (GeneAmp PCR system 9700, Applied Biosystems Inc CA, USA) with the following conditions. Step 1 Step 2 Step 3 Step 4 Temp o C 25 o C 37 o C 85 o C 4 o C Time 10 minutes 120 minutes 5 minutes The cdna was diluted 1:10 and stored at -80 o C. 49
73 Real Time Polymerase Chain Reaction The expression levels of mrna were analyzed using target specific TaqMan gene expression assays using the 7500 Real-Time PCR system (Applied Biosystems Inc CA, USA). The reaction mix of 20 ul contained 5 µl of sample, 10 ul of TaqMan Gene Expression Master Mix (Part # ), 1ul of Primer probe mix and 4 ul of nuclease free water. Each well was run in duplicate for gene of interest and reference primer 18S rrna (Applied Biosystems). The following primers and probes, purchased from Applied Biosystems, were used for TaqMan real-time RT-PCR reactions: HIF-1α: Mm _m1 GAL-1: Mm _g1 GAL-3: Mm _m1 Rn 18S: Mm _g1 The PCR reaction was carried out as follows: 95 C for 3 minutes, followed by 95 C for 15 seconds, 55 C for 15 seconds, 72 C for 1 minute X 40 cycles, then followed by 95 C for 15 seconds, then 60 C for 15 seconds and finally 95 C for 15 seconds. Data acquisition was done by using 7500 software v2.0.6 (Applied Biosystems, US). Analysis was carried out using the comparative Ct method. The level of GAL-1, GAL-3 and HIF-1α expression was normalized to 18S rrna and fold changes calculated relative to expression in sham operated LV heart tissue using the formula 2 -ΔΔCt. Many aspects of MIQE guidelines were taken into consideration for methods and analysis (308). 50
74 2.4.9 Sodium dodececyl-sulphate polyacrylamide gel electrophoresis (SDS- PAGE) and Western Blotting Total protein extracts (30 ug) from each sample were resolved by SDS PAGE on 12% polyacrylamide gels using a vertical electrophoresis tank Biorad Mini ProteanTetra Cell system. Samples were electrophoresed at 200 volts using electrophoresis buffer for minutes, adjacent to pre-stained molecular weight markers (PageRuler Prestained Protein Ladder,Thermo scientific). The protein on gels was transferred onto nitrocellulose membranes (Whatman, GE Healthcare ) using the semi dry blotting system (Pierce Fast Semi-Dry Blotter, Thermo scientific). Non-specific binding sites were blocked by incubation with 5% non-fat dry milk solution in Phosphate Buffered Saline (PBS)-Tween 20 (0.1%) (PBST) for one hour at room temperature. The membranes were subsequently incubated overnight with Primary antibody anti-gal-3 (rabbit anti-mouse polyclonal antibody 1:1000, Davids Biotechnologie GmbH, Germany) and anti-gal-1 (rabbit anti-mouse polyclonal antibody 1:5000, Davids Biotechnologie GmbH, Germany), diluted in blocking buffer at 4 o C. Membranes were also incubated overnight 4 o C for Beta-actin antibody (1:5000, Abcam, USA) diluted in PBST to control for equal loading. Blots were then incubated with horseradish peroxidaseconjugated secondary antibodies (rabbit anti-mouse Thermo-Pierce) and developed using ECL plus substrate (Thermo Pierce). Protein bands were visualized by a laser scanner (Typhoon FLA 9500). Appropriate positive control samples were used with each run. 51
75 Troponin-I Assay Mouse cardiac troponin I levels in plasma were measured by using a high sensitivity mouse cardiac troponin-i Elisa kit ( HSP, Life Diagnostics, Inc.) according to the manufacturer s instructions Glutathione Assay Total glutathione level in the heart protein extract was measured by a Glutathione Assay kit (CS0260 Sigma-Aldrich). The sample was first deproteinized with 5% 5-sulphosalicylic acid, centrifuged to remove precipitated protein and then assayed for glutathione. 2GSH +DTNB --- GSSG +2 TNB Glutathione reductase GSSG +NADPH + H GSH +NADP + The combined reaction: Glutathione reductase DTNB + H + + NADPH TNB +NADP + GSSG/GSH Glutathione (GSH) cause a continuous reduction of 5, 5 -dithiobis (2-nitrobenzoic acid) (DTNB) to TNB and the GSSG forms was recycled by glutathione reductase and NADPH. The yellow product, 5-thio-2-nitrobenzoic acid (TNB) was measured spectrophotometrically at 412nm by a kinetic read at 1 minute interval for 5 minutes. Glutathione standard solutions were used to generate a standard curve and GSH levels calculated using Megallan6 software Superoxide dismutase (SOD) activity assay Superoxide dismutase (SOD) activity was measured using the SOD determination kit (19160 Sigma-Aldrich). Dojindo s highly water-soluble tetrazolium salt, WST-1 (2-(4-Iodophenyl)-3-(4-nitrophenyl)-5-(2,4-disulfophenyl)-2H- 52
76 tetrazolium, monosodium salt) produces a water-soluble formazan dye upon reduction with a superoxide anion. The rate of the reduction with O2 is linearly related to the xanthine oxidase (XO) activity, and is inhibited by SOD, therefore, the IC50 (50% inhibition activity of SOD) is determined by a colorimetric method. The samples were added to the 96-well plate. Appropriate blanks were also set up according to the manufacturer s instructions. WST working solution and enzyme working solution were added to the samples, incubated at 37 o C for 20 minutes and absorbance was read at 450 nm. SOD activity (inhibition rate %) was calculated by an equation: SOD activity (inhibition rate %) = {[(Ablank 1 - Ablank 3) - Asample - Ablank 2)]/ (Ablank 1 - Ablank 3)} x Bioinformatic Analysis We used the bioinformatic analysis program Clustalw2 available on the Internet ( to find out the core HIF-1α binding motif RCGTG, the Hypoxia response element (HRE) (150) in the promoter region of the mouse and human GAL-1 gene. 2.6 Statistical Analysis Statistical analysis was conducted using IBM SPSS Statistics version 20. Data are presented in mean ± Standard Error. Statistically significant differences (p<0.05) were calculated between experimental group and corresponding shamoperated group for each time point by Student t test. One-way ANOVA was used to test for differences among the various time points within the MI groups. Chi square test was used to assess differences in the expression of GAL-1 and HIF-1α in cardiomyocytes & endothelial cells at different time points following MI for morphometric analysis. 53
77 Chapter 3: Results and Discussion Section 1: Galectin-1 in Early Myocardial infarction 54
78 3.1.1 Background Galectin-1 (GAL-1) is a prototypical member of the galectin family of lectins. It is a divalent 14.5-kDa protein characterized by one carbohydrate recognition domain (CRD) that can occur as a monomer or as a non-covalent homodimer (13, 26). GAL-1 is produced by a variety of vascular, interstitial, epithelial, and immune cells (36-39). GAL-1 is present both inside and outside cells, and has both intracellular and extracellular functions. The extracellular functions require the carbohydrate-binding properties while the intracellular functions are associated with protein-protein interactions (26). GAL-1 lacks recognizable secretion signal sequences and does not pass along the standard endoplasmic reticulum/golgi pathway (20). GAL-1 is secreted through the non-classical pathway via inside-out transportation involving direct translocation across the plasma membrane (30). In the extracellular compartment GAL-1 regulates cellcell and cell-matrix interactions, the immune response, apoptosis, and neoplastic transformation. In the intracellular compartment it regulates cell cycle, RNA splicing and transcription (34, 40-44). Intracellular GAL-1 has been shown to be present in cells nuclei and cytosols (26). Although GAL-1 is involved in very important functions in vitro and in vivo, GAL-1 null mice are viable indicating that its presence is not critical for mammalian development or survival (33). GAL-1 is a hypoxia-induced protein. Studies have shown that GAL-1 is an important mediator in the adaptive responses of murine lung to chronic hypoxia (66). The expression of GAL-1 was increased throughout the interstitium and near to the basement membrane of vessels and airways in the lung of hypoxia-exposed mice as compared to the control mice. In the brain, under hypoxic or ischemic 55
79 conditions, both in vitro and in vivo, GAL-1 was found to attenuate the proliferation of astrocytes. It reduced apoptosis of neurons, decreased brain infarction volume, improved neurological function and promoted recovery of brain ischemia (65). GAL-1 is also regulated by hypoxia at the gene and protein levels in some tumors (64). The above-mentioned studies have shown that GAL-1 is regulated by hypoxia but its exact mechanism remains elusive. GAL-1 is a major component of the contractile machinery in cardiomyocytes (71) which suggests that it must be playing an important role in regulating cardiac functions but its exact pathophysiological role in the heart is unknown. In the present study we investigated if there is any change in the endogenous production of GAL-1 in early ischemia and its pattern of expression in the ischemic and nonischemic cardiomyocytes. For this purpose we have employed Murine model of Permanent ligation of Left anterior descending artery (LAD). Details can be seen in the Material and Methods section (p.40) of this dissertation Results Electrocardiographic Study The ECG records for mice groups, 20 minute, 30 minute, 60 minute, 4 hour and 24 hour following permanent ligation of LAD show persistent ST elevations. The ECG for 20 min, 30 min and 60 min post LAD ligation groups were monitored for the whole duration of time whereas for 4 hours and 24 hours post MI groups it was monitored for the first 15 minutes (Fig 3.1). We have used persistent elevation of ST- segment in the ECG as a control for selection of animals to be included in our study. 56
80 GAL-1 in the heart tissue GAL-1 concentration in Left ventricular (LV) heart tissue of naïve group is 66.32±4.69 ng/mg. GAL-1 concentration in LV tissue is significantly increased at 20 minutes (148.91±6.65 vs ±4.45 ng/mg P = *) and 30 minutes (117.45±3.49 vs ±2.63 ng/mg, P = 0.004*) post MI groups compared to corresponding sham operated control groups (Table 3.1) (Fig 3.2 A). GAL-1 values at 60 minutes and 4 hours post MI groups show a higher tendency than their corresponding sham operated control groups but do not reach statistical significance (100.43±3.05 vs 94.99±2.76 ng/mg, P = and 97.01±3.31 vs 91.07±3.26 ng/mg, P = 0.224). At 24-hour post MI group, GAL-1 concentration in sham-operated control group is slightly higher than its corresponding MI group (85.24±2.42 ng/mg vs 75.71±3.87) but shows no statistical significance. GAL-1 values in LV in all MI groups are higher than the baseline naïve control group. This is also shown in the corresponding blots where the difference between MI and Sham blots is seen in the first hour post MI time points (Fig. 3.3). There was a statistically significant difference between the different time points within the MI groups as determined by one-way ANOVA (F (4,35) = , p =.000). A Tukey post-hoc test revealed that the 20 minutes post MI GAL-1 level (M = 148.9, 95% CI [133.18, 164.6]) is significantly higher than the 30 minutes (M = 117.4, 95% CI [109.2, ], p = 0.00), 60 minutes(m = , 95% CI [93.22, ], p = 0.00), 4 hour (M = 97.01, 95% CI [89.18, ], p = 0.00) and 24 hour post MI group (M = 75.71, 95% CI [66.57, 84.86], p = 0.00 ). 30 minutes post MI. 57

81 Figure 3.1: Electrocardiography of the heart at 20 minute, 30 minute, 60 minute, 4-hour and 24-hour post MI groups showing ST elevation compared to normal ECG in sham operated groups. 58
 The graph represents left ventricular GAL-1 concentrations at 20 min, 30 min, 60 min, 4 hour and 24 hour post")

82 A. B. Figure 3.2 (A) The graph represents left ventricular GAL-1 concentrations at 20 min, 30 min, 60 min, 4 hour and 24 hour post myocardial infarction with corresponding sham operated groups in C57BL6 mouse heart. Control represents non-operated normal animal heart. (B) GAL-1 mrna expression in the ILV (Infarcted left ventricle) and NILV (Non-infarcted left ventricle) expressed as fold changes relative to sham at respective time points post MI (* shows p<0.05). 59
83 Table 3.1: GAL-1 levels in ng/mg of total protein at different time points post myocardial infarction. Groups n Mean (ng/mg) Std Dev Std Error p value Naïve min MI min sham min MI min sham min MI min sham hour MI hour sham hour MI hour sham * 0.004* * shows p<0.05. Table 3.2: Fold changes in GAL-1 mrna expression in the ILV (Infarcted left ventricle) and NILV (Non-infarcted left ventricle) relative to sham at respective time points post MI. Sham NILV ILV P value 20 min Post MI min Post MI * 60 min Post MI hr Post MI * 24 hr Post MI * shows p values comparing ILV and sham groups for respective time points. * shows p<
84 20 min 20 min MI Sham 30 min 30 min MI Sham 60 min 60 min MI Sham GAL-1 Beta actin 4 hour 4 hour MI Sham 24 hour 24 hour MI Sham GAL-1 Beta actin Figure 3.3 Western blot for detection of GAL-1 and beta actin in respective time points post MI with corresponding sham. 61
85 GAL-1 value is also higher than the 4 hour (p = 0.015), and 24 hour time point (p = 0.00). 30 minute post MI GAL-1 value is also higher than 60 minute post MI group but does not reach statistical significance (p = 0.058). 60 minute post MI group value is significantly higher than the 24 hour MI group (p = 0.002) and 4 hour MI level is significantly higher than 24 hour post MI time point (p = 0.01). In normal hearts, GAL-1 is mainly seen to be expressed by cardiomyocytes and endothelial cells (Fig. 3.4). The expression is more pronounced in the right ventricle as compared to the left ventricle (Fig. 3.4, D, E, F). In the left ventricle, GAL-1 is mainly expressed by endothelial cells and few cardiomyocytes (Fig. 3.4, E). A very characteristic staining pattern is seen in immunofluorescent labeling of GAL-1, which gives a mesh-like staining pattern of myocardium (Fig. 3.4 G, H, I). There is an increase in the expression of GAL-1 in the LV as compared with sham operated heart sections. In MI groups, the expression of GAL-1 is well demarcated in the area supplied by LAD artery at 24- hour, 20, 30, 60 minute and 4- hour following MI (Fig. 3.5, 3.6, 3.7, 3.8, 3.9 respectively). Both cardiac myocytes and endothelial cells show high expression of GAL-1 (Fig. 3.5 E, 3.6 F, 3.7 F, 3.8 F). In addition, there are foci of low or no expression of GAL-1 surrounded by areas of high expression (Fig. 3.5, 3.6, 3.7, 3.8, 3.9 ). The number of cardiac myocytes that express GAL-1 is decreased as the time following ligation is increased. This phenomenon is also seen to a lesser extent in endothelial cells. Hence, areas of low or no expression of GAL-1 increase in size and become more demarcated as we reach 4 hours and then 24 hours following MI (Fig. 3.9 E, F, G & 3.8 D, E, F, G, H). In 24 hour post MI, the GAL-1 expression is seen in areas surrounding the infarction (Fig. 3.8 E, F, G, H& I). There is no expression of GAL-1 in the dead 62
86 cardiomyocytes hence, these areas are very sharply demarcated (Fig. 3.9 E, F, G, H& I). Neutrophil polymorphs, which are abundant at 24 hour post MI group, also show high expression of GAL-1 (Fig. 3.9 G& H). GAL-1 shows many patterns of staining in the heart at different time points following MI which include diffuse cytoplasmic staining (Fig. 3.6 G& I), Z bands staining (Fig. 3.5 H), cell membrane staining (Fig. 3.4 G, H, I) and nuclear staining (Fig. 3.5 E&F) GAL-1 mrna expression in post MI heart tissue GAL-1 gene expression is first seen to be significantly increased at 30 min post MI time points in the infarcted part of left ventricle compared to the sham. GAL-1 mrna at 4 hour and 24 hour post MI group is also significantly high in the Infarcted LV as compared to Sham. 60 min post MI GAL mrna is higher than the Sham but does not reach statistical significance (p=0.129). (Refer to Table 3.2 and Fig. 3.2 B for fold differences in the GAL-1 mrna expression in the infarcted and non infarcted left ventricular tissue compared to the sham operated LV tissue) GAL-1 Levels in Plasma Plasma GAL-1 concentration in naïve group is 8.71±0.83 ng/ml. Plasma GAL-1 concentration is significantly raised at 4 hour (15.05±1.09 vs 9.91±1.35 ng/ml, P = 0.012*) and 24 hour (22.59±0.42 vs 17.86±0.93 ng/ml, P = 0.001*) post MI groups compared to corresponding sham operated control. 63
, interventricular septum (thick arrow) and right ventricle wall (thin arrow), H&E stain.")
87 Figure 3.4: GAL-1 expression in naïve heart. A. Low power view of the heart showing the left ventricle (arrow head), interventricular septum (thick arrow) and right ventricle wall (thin arrow), H&E stain. B&C are representative sections of the left and right ventricles respectively, H&E stain. D. showing low and focal expression of galectin-1 in the wall of the right ventricle (thin arrow) and the interventricular septum (thick arrow). E. A representative section of left ventricle showing mild expression of galectin-1 by endothelial cells (arrow head). F. A representative section of right ventricle showing low cytoplasmic expression of galectin-1 by cardiac myocyte (arrow head) and endothelial cells (thin arrow). G, H&I, immunofluorescent labeling of sections of the heart showing a net-like pattern of galectin-1 staining of cardiac myocytes (thin arrow) and cytoplasmic staining of endothelial cells (arrow head). 64
 and the interventricular septum (thick arrow).")
88 Figure 3.5: GAL-1 expression 20 minutes following ligation of LAD. A. Low power view of the heart showing a high expression of galectin-1 in the anterior wall of left ventricle in the area supplied by LAD (thin arrow) and the interventricular septum (thick arrow). There is also increase in the expression of galectin-1 in the right ventricle (arrow head). B. Sham operated heart showing lower expression of galectin-1 in the left ventricle and right ventricle (thin arrow). C. Negative control section of the heart showing absence of galectin-1 staining. D, E&F. Representative sections of the left ventricle from area supplied by LAD showing high cytoplasmic expression of galectin-1 by cardiac myocytes (thin arrow D). High power views show a well demarcated area of high cytoplasmic expression of galectin-1 by cardiac myocytes (thin arrow) and endothelial cells (arrow head, E&F), There is also nuclear expression of galectin 1 by cardiac myocytes (thick arrow E&F), streptavidin- biotin immunoperoxidase method. G, H&I. Representative section from left ventricle shows a well demarcated area of high cytoplasmic expression of galectin-1 by cardiac myocytes (thin arrow).there is also high expression of galectin- 1 in the Z bands (arrow head), Alexa Fluor 488 immunofluorescent technique. 65
 and the interventricular septum (thick arrow).")
89 Figure 3.6: GAL-1 expression 30 minutes following ligation of LAD. A. A low power view of the heart showing a high expression of galectin-1 in the anterior wall of left ventricle in the area supplied by LAD (thin arrow) and the interventricular septum (thick arrow). There is also increase in the expression of galectin-1 in the right ventricle (arrow head), streptavidin- biotin immunoperoxidase method. B. Sham operated heart showing lower expression of galectin-1 in the left ventricle and right ventricle (thin arrow), streptavidin- biotin immunoperoxidase method. C. Negative control section of the heart showing absence of staining of galectin-1. D. A galectin-1 positive control section from prostate gland showing cytoplasmic expression of galectin- 1 by prostatic acini. E, F & G. Representative sections of the left ventricle from areas supplied by LAD showing high cytoplasmic expression of galectin-1 by cardiac myocytes (thin arrow), streptavidin- biotin immunoperoxidase method. H, I&J. Representative sections from left ventricle showing a well demarcated area of high cytoplasmic expression of galectin-1 by cardiac myocytes (thin arrow), Alexa Fluor 488 immunofluorescent technique. 66
 and the interventricular septum (thick")
90 Figure 3.7: GAL-1 expression 60 minutes following ligation of LAD. A& B, A low power view of the heart showing a high expression of galectin-1 in the anterior wall of left ventricle in the area supplied by LAD (thin arrow) and the interventricular septum (thick arrow). There is also increase in the expression of galectin-1 in the right ventricle (arrow head), streptavidin- biotin immunoperoxidase method. C. Sham operated heart showing low expression of galectin-1 in the left ventricle and right ventricle (thin arrow), streptavidin- biotin immunoperoxidase method. D. Negative control section of the heart showing absence of staining of galectin-1. E, F & G, Representative sections of the left ventricle from areas supplied by LAD showing high cytoplasmic expression of galectin-1 by cardiac myocytes (thin arrow) surrounding areas of low or absence of expression (star shape), streptavidin- biotin immunoperoxidase method. H, I& J, Representative section from left ventricle showing a well demarcated area of high cytoplasmic expression of galectin-1 by cardiac myocytes (thin arrow), Alexa Fluor 488 immunofluorescent technique. 67
 and the interventricular septum (thick arrow).")
91 Figure 3.8: GAL-1 expression 4 hours following ligation of LAD. A.A low power view of the heart showing a high expression of galectin-1 in the anterior wall of left ventricle in the area supplied by LAD (thin arrow) and the interventricular septum (thick arrow). There is also increase in the expression of galectin-1 in the right ventricle (arrow head), streptavidin- biotin immunoperoxidase method. B. Sham operated heart showing low expression of galectin-1 in the left ventricle (thin arrow) and right ventricle (arrow head), streptavidin- biotin immunoperoxidase method. C. Negative control section of the heart showing absence of staining of galectin-1. D. Representative section of the left ventricle from area supplied by LAD showing high cytoplasmic expression of galectin-1 by cardiac myocytes (thin arrow) surrounding areas of low or no expression (star shape), streptavidin- biotin immunoperoxidase method. E&F, Representative section of the left ventricle from area supplied by LAD showing a well demarcated area of high cytoplasmic expression of galectin-1 by cardiac myocytes (thin arrow), streptavidin- biotin immunoperoxidase method. G, H&I. Representative section from left ventricle showing a well demarcated area of high cytoplasmic expression of galectin-1 by cardiac myocytes (thin arrow) 68
 accompanied by heavy neutrophil polymorphs infiltration (arrow heads), H&E. B.")
92 Figure 3.9: GAL-1 24 hours following ligation of LAD. A. A high power view of left ventricle in an area supplied by LAD showing coagulative necrosis (thin arrows) accompanied by heavy neutrophil polymorphs infiltration (arrow heads), H&E. B. A low power view ofthe heart showing areas of high expression of galectin-1 (thick arrows) surrounding areas of no expression (star shape) in the left ventricle and interventricular septum in the area supplied by LAD, streptavidin- biotin immunoperoxidase method. C. Sham operated heart showing lower expression of galectin-1 in the left ventricle and right ventricle (thick arrows), streptavidin- biotin immunoperoxidase method. D. Negative control section of the heart showing absence of staining of galectin-1. E, F&G. Representative section of the left ventricle from area supplied by LAD showing high cytoplasmic expression of galectin-1 by cardiac myocytes (thick arrow), surrounding areas of no expression (thin arrow). Many neutrophil polymorphs are also showing cytoplasmic expression of Galectin-1(arrow head), Streptavidinbiotin immunoperoxidase method. H, I&J. Representative section from left ventricle showing a well demarcated area of high cytoplasmic expression of galectin-1 by cardiac myocytes (thick arrow) surrounding areas of no expression (thin arrow), many neutrophil polymorphs (arrow head) show cytoplasmic expression of Galectin-1, Alexa Fluor 488 immunofluorescent technique. 69
93 groups (Fig. 3.10). Plasma GAL-1 values at 30 minute and 60 minute post MI groups are not significantly different from their corresponding sham-operated control groups (15.49±1.29 vs 14.06±0.78 ng/ml and 14.27±0.72 vs 13.33±1.49 ng/ml) Morphometric analysis The frequency of cardiomyocytes expressing GAL-1 in 20 and 30 minute post MI groups is higher than other MI groups and show statistically significance when compared with 24-hour post MI group (Chi squared = with 1 degree of freedom, P = 0.009* and Chi squared = with 1 degree of freedom, P = 0.001*, respectively). The frequency of endothelial cells expressing GAL-1 in 20 minute post MI group is higher than other MI groups and shows statistical significance when compared with 60 minute, 4-hour and 24-hour post MI groups (Chi squared = with 1 degree of freedom, P = 0.03*, Chi squared = with 1 degree of freedom, P = 0.01*, Chi squared = 9.29 with 1 degree of freedom, P = 0.002*, respectively). The frequency of endothelial cells expressing GAL-1 in 30 minutes post MI group is significantly higher than 24-hour post MI groups (Chi squared = with 1 degree of freedom, P = 0.047*). The frequency of endothelial cells expressing GAL-1 is significantly higher than cardiomyocytes at 20 minute, 30 minute, 60 minute, 4-hour and 24-hour post MI groups (Chi squared = 42.4 with 1 degree of freedom, P = *, Chi squared = 25.9 with 1 degree of freedom, P = *, Chi squared = 31.1 with 1 degree of freedom, P = *, Chi squared = 34.3 with 1 degree of freedom, P = *, Chi squared = 38.8 with 1 degree of freedom, P = *, respectively). 70
94 The frequency of neutrophil polymorphs expressing GAL-1 is significantly higher than cardiomyocytes and endothelial cells at 24-hour post MI groups (Chi squared = 69.8 with 1 degree of freedom, P = * and Chi squared = 5.72 with 1 degree of freedom, P = 0.016*, respectively). A decrease in the number of cardiomyocytes and endothelial cells that express GAL- 1 is associated with the increase in post MI time. Neutrophil polymorphs were counted at 24-hour following MI as they are not seen before 4 hour post MI time (Table 3.3) Discussion Galectins are highly conserved, from fungi to mammals with their existence dating back more than 800 million years. This suggests that these endogenous proteins must be serving an important purpose ( ). Although GAL-1 knockout mice fail to show any abnormalities (33), but knocking down GAL-1- like protein in the zebrafish shows defects in muscle development and disorganized muscle fibers (312). There is also evidence that GAL-1 has a significant role in the regeneration of muscles (68, 313, 314). Galectin-1 is endogenous to the heart. The level of expression in cardiomyocytes is among the highest compared to other organs of the body (71). In accordance with a previous report (71), our immunohistochemistry and immunoflorescence staining of heart sections show that it is expressed in cardiac muscles as diffuse cytoplasmic staining, as an organized Z bands staining, as a membranous staining and as nuclear staining. 71
95 Figure 3.10: Plasma GAL-1: The graph represents ratio of GAL-1 concentration in myocardial infarction to sham operated C57BL6 mice. 4 hour and 24 hour post myocardial infarction show significant difference from sham operated mice (* p<0.05). Table 3.3 : Morphometric analysis of expression of GAL-1 in cardiomyocytes, endothelial cells and neutrophil polymorphs at different time points following ligation of LAD. Galectin-1 Morphometric analysis Post MI Time points Cardiomyocytes % Endothelial cells % Neutrophils % 20 MINUTES MINUTES MINUTES HOURS HOURS
96 Acute MI in our mice model shows an increase in the level of GAL-1 in the heart at a very early stage in the course of events. We show a significant increase in tissue GAL-1 levels at 20 minutes and 30 minutes following MI as compared to related sham operated control groups. The values at 60 minutes and 4 hours are also higher than their corresponding sham operated control groups but do not reach statistical significance (Fig. 3.2). These results demonstrate that there is a transient rise in the GAL-1 level in the LV within one hour of permanent ligation of LAD. This is supported by one-way ANOVA and Tukey post-hoc test analysis of MI groups which show GAL-1 values at 20 and 30 minutes MI group are significantly higher than other MI groups. The immunohistochemical and immunofluorescent staining patterns for GAL-1 in cardiac muscles are also very characteristic and supportive of this finding. The increased expression of GAL-1 in the left ventricle is very well demarcated in the MI group in all tested time points. We also noticed that as the time of ischemia increases from 20 minutes to 4 hours and then 24 hours we are able to recognize areas of low or no expression of GAL-1 being surrounded by areas of high expression of GAL-1. The well demarcated areas of no or low expression of GAL-1 are increased as the time of ischemia increases which means that as time proceeds dying cells will stop expression of GAL-1 in the area supplied by LAD, while survived cells in the ischemic zone, which are seen at the periphery of infarction zone, are showing high expression of GAL-1, which might explain the absence of statistical significance at 60 minute, 4-hour and 24-hour post MI time points when compared to corresponding sham operated control groups. This is supported by our morphometric analysis which shows a significant decrease in the frequency of cardiomyocytes and endothelial cells that express 73
97 GAL-1 with the increase of post MI time. This phenomenon is clearly seen in 24 hour post MI sections (Figure 3.9 E, F, G, H, &I) where GAL-1 is observed to be high in the surviving cardiomyocytes and invading neutrophil polymorphs in the immunohistochemical and immunofluorescent- stained sections, while dead cells in the infarction zone do not show any expression which explains the absence of statistical significance in our ELISA results at this time point. GAL-1mRNA in the infarcted tissue is detected to be higher at 30 minute post MI time compared to Sham. GAL-1 mrna is also significantly increased at 4 hour and 24 hour post MI time points. This result indicates that the increase in GAL-1 at the protein level in early post MI time is due to transcriptional pressure from transcription factors like HIF-1α that have come into play due to Ischemic/hypoxic injury to the myocardium. Another significant finding of our study is that GAL-1 plasma level is significantly high around 4 hour and 24 hour post MI compared to sham operated control mice (Fig. 3.10). There can be two possible explanations for this phenomenon. We know that GAL-1 is present in the heart tissue in significant amounts, acute myocardial infarction and subsequent cell membrane damage and necrosis promotes its leakage outside the cells into the blood. This phenomenon is similar to the raised Troponin-I protein (315) that escapes the injured cardiomyocytes and can be detected in the blood. The other explanation for raised plasma levels is that GAL-1 in heart tissue is increased in early ischemic period due to increased transcriptional pressure from transcriptional factors that come into action in response to hypoxia and is secreted from the heart through the nonclassical pathway. We suspect that plasma GAL-1 levels in the first hour post infarction signify an increase in transcription of the protein and leakage from the 74
98 cells, whereas, at 4 hour and 24 hour post MI, the high GAL-1 plasma levels are mainly due to leakage of this protein from cardiomyocytes. We have observed in our study that the levels of GAL- 1 in sham operated animals were higher than the non- operated naïve animals. This increase in sham operated animals can be due to factors related to surgical stress. There have been reports in germane literature that there is stress-induced increase of GAL-1 in serum which is regulated by the sympathetic nervous system (316). As there is some degree of mechanical/surgical stress applied to the sham operated mice we suggest that GAL-1 levels seen in sham groups may be the result of these factors. For these reasons we made sham operated groups as our controls for all time points, and all our statistics were done in comparison between MI groups and sham-operated groups to take out the effect of mechanical/surgical stress from the real ischemic effect due to ligation of LAD. In all early MI groups the values of GAL-1 are higher than corresponding sham groups and show statistical significance at certain time points. So the significant rise of GAL-1 levels at certain time points in MI groups when compared to sham-operated groups is purely due to ischemia and not surgical stress Conclusions We show for the first time that GAL-1 level in the LV is increased in early ischemic period. We also report for the first time that in mouse model of myocardial infarction plasma GAL-1 level is significantly raised as early as 4 hours of the event. This is significant because it can help in understanding the very early changes that occur in the myocardium after acute infarction and help devise ways to an early diagnosis and save viable tissue before permanent damage sets in. Raised plasma GAL-1 levels in this early phase of infarction in the mice is 75
99 significant in terms of its potential use as a biomarker for MI, but further studies are still needed to elaborate on its role. 76
100 Section 2: Galectin-3 is expressed in the myocardium very early post myocardial infarction 77
101 3.2.1 Background Galectin-3 (GAL-3) is ~35 kda protein. It is a unique chimera-like galectin that has one C-terminal carbohydrate recognition domain (CRD) connected to a long N-terminal domain (ND) (19). It is found on the cell surface and within the extracellular matrix, as well as in the cytoplasm and the nucleus of cells. Its localization depends on factors such as cell type and proliferation status ( ), cultivation conditions (112), neoplastic progression ( ) and transformation (73, 118). The distribution in many types of cells, together with varied subcellular localization, indicates galectin-3 has many different roles in normal and pathophysiological conditions (119, 120). Intracellular GAL-3 is involved in regulating cell differentiation, survival, and death (99, 100), through its effect on mitosis, proliferation of cells and antiapoptotic mechanisms (91-94). Extracellular GAL-3 mediates cell-cell adhesion, cell-matrix interaction and signaling (86-89) and pro-apoptotic mechanisms (90). GAL-3 is expressed in a variety of cells, e.g., endothelial and epithelial cells, activated macrophages (75-77), activated microglial cells (78, 79), inflammatory cells including macrophages, basophils, mast cells, eosinophils, and neutrophils (20, 41, 80-82). In tissues, GAL-3 is expressed in the lungs, spleen, stomach, colon, adrenal gland, uterus, and ovary and at a lower level in kidney, heart, cerebrum, pancreas, and the liver (85). GAL-3 plays a very well documented role in heart failure (135). Higher levels were associated with recurrent heart failure and increased risk of death in a number of studies ( ). This has led to its use as a prognostic marker in patients with heart failure. GAL-3 also predicted all-cause death (143) and demonstrated a relationship with future heart failure and rehospitalizations in the 78
102 general population (144). Despite its established role in heart failure, GAL-3 has not been studied directly in relation to cardiac ischemia. In other organs, e.g., in kidneys GAL-3 mrna increased after ischemic injury in acute renal failure in rats (145). There was also up-regulated expression of GAL-3 in the ischemic brain following transient middle cerebral artery occlusion in rats and in neonatal hypoxic ischemic brain injury (79, 146). We aim to study the direct effects of ischemia on GAL-3 levels in the heart very early in the course of events following myocardial infarction (MI) Results Left ventricular GAL-3 level is increased within one hour post MI GAL-3 level in the naïve heart was measured to be ± pg/mg. We observed an increase in GAL-3 protein level in the left ventricular heart tissue as early as 30 min post MI as compared to sham operated animals ( ± vs ± pg/mg, p=0.021*) (Fig and Fig. 3.12). GAL-3 levels are continuously high in the heart till 24 hour post MI time point (Table 3.4). This is also shown in the corresponding blots where the difference between MI and Sham blots till 24 hour post MI time points is shown (Fig. 3.12) Immunohistochemistry results show that in the normal naïve heart, GAL-3 is mainly seen to be expressed by endothelial cells and only a few cardiomyocytes. The expression is more prominent in the right ventricle as compared to the left ventricle and GAL-3 is mostly seen as a cytoplasmic staining (Fig. 3.13). In MI groups, the expression of GAL-3 is well demarcated in the area supplied by LAD artery in all the time points tested (Fig. 3.14, 3.15, 3.16, 3.17, and 3.18). Both cardiac myocytes and endothelial cells show high expression of GAL-3. GAL-3 79
103 is seen as diffuse cytoplasmic staining, Z bands staining, cell membrane staining and nuclear staining at the different post MI time points. At 30 min, 60 min and 4-hour post MI groups (Fig. 3.15, 3.16, 3.17 respectively) we see that the intensity and pattern of staining is the same although higher than the 20 min post MI group (Fig. 3.14). GAL-3 shows both nuclear and cytoplasmic staining. The 24 hour post MI group has a very characteristic pattern. There is very high expression in the area of LAD supply surrounding an area of very low or no expression (Fig.3.18). We observed that the area showing no expression is the area of the infarct consisting of dead cardiomyocytes and the surviving cardiomyocytes and endothelial cells surrounding the infarct are showing very high GAL-3 staining (Fig. 3.18). Neutrophil polymorphs, which are abundant in the area of the infarct at 24 hour post MI are the only cells in the infarct region that show high expression of GAL-3 (Fig. 3.18). The sharp demarcation between completely dead cardiomyocytes and those which survived is very characteristic at this time point GAL-3 mrna expression in post MI groups GAL-3 gene expression is first seen to be significantly increased at 60 min post MI time points in the infarcted part of left ventricle compared to the sham (p=0.032*). GAL-3 mrna at 4 hour and 24 hour post MI group is also significantly high in the Infarcted LV as compared to Sham (p=0.012*, p=0.00*). 30 min post MI GAL mrna is higher than the Sham and almost reaching statistical significance (p=0.056) (Table. 3.5, Fig. 3.19). 80
104 A. B. Figure 3.11 (A) GAL-3 levels measured by ELISA in the LV of post MI heart compared to sham operated hearts at respective time points. (B)Time course of GAL-3 protein levels in the LV for the first 24 hours post MI. * shows p<0.0 81
105 Table 3.4: GAL-3 levels in pg/mg of total protein at respective points post myocardial infarction Groups N Mean Std Dev Std Error p value Control Heart Galectin- 3 pg/mg 20 min MI min sham min MI min sham min MI min sham hours MI hours sham * 0.029* 0.015* 24 hour MI 24 hour Sham * 30 min 30 min MI Sham 60 min 60 min MI Sham GAL-3 Beta actin 4 hour 4 hour MI Sham 24 hour 24 hour MI Sham GAL-3 Beta actin Figure 3.12: Western blot for detection of GAL-3 and beta actin in respective time points post MI with corresponding sham. 82
.")
106 Figure 3.13: GAL-3 expression in naïve heart. Naïve heart: A, Low power view of the cross section of the murine heart showing low cytoplasmic GAL-3 in the left ventricle, interventricular septum and right ventricle wall (arrow heads). B, showing expression of GAL-3 in the wall of the right ventricle (black arrow head) and interventricular septum (white arrow head), Streptavidin- biotin immunoperoxidase method. C, Immunofluorescent labeling of sections of the naïve heart showing pattern of GAL-3 staining. D, Cardiac myocytes (arrow head) show a characteristic sub-sarcolemmal distribution while and nuclear staining (arrow), Alexa Fluor 488 immunofluorescent technique. E, GAL-3 positive control section from prostate gland showing cytoplasmic expression in prostatic acini, Streptavidin- biotin immunoperoxidase method. F, Negative control section of the heart showing absence of GAL-3 staining, Streptavidin- biotin immunoperoxidase method. 83

107 Figure 3.14: GAL-3 expression at 20 min post MI A, Low power view of the cross sectional area of the heart showing a patchy expression of GAL-3 in the anterior wall of left ventricle in the area supplied by LAD, interventricular septum and the right ventricular wall (arrow heads). B, Sham operated heart showing lower expression of GAL-3 in the left ventricle and right ventricle (arrow heads). C. Representative sections of the left ventricle from area supplied by LAD showing high cytoplasmic expression of GAL-3 by cardiac myocytes (arrow head). D, High power views show a well demarcated area of high cytoplasmic expression of GAL-3 by cardiac myocytes bordering with area of no expression of GAL-3. Streptavidin- biotin immunoperoxidase method. E&F, immunoflorescence pattern of GAL-3 in the area of LV supplied by LAD showing fields of cardiomyocytes with higher cytoplasmic expression of GAL-3 (E) (arrow heads). High power view (F) shows GAL-3 expression in cardiomyocytes (arrow head) with prominent staining of cross striations and endothelial cell (thin arrow). Alexa Fluor 488 immunofluorescent technique. 84

108 Figure 3.15: GAL-3 expression at 30 min post MI A low power view of the cross sectional area of the heart showing expression of GAL-3. The high expression is confined to the area supplied by LAD in the anterior wall of left ventricle. B, Sham operated heart showing lower expression of GAL-3 in the left ventricle and right ventricle (arrow heads).c&d, Representative sections of the left ventricle from area supplied by LAD showing high cytoplasmic expression of GAL-3 by cardiac myocytes (arrow head) interspersed with cardiomyocytes with low expression. D, High power view shows expression of GAL-3 in the cardiac myocytes cytoplasm (arrow heads), nucleus (thick arrow) and endothelial cells (thin arrow), Streptavidin- biotin immunoperoxidase method. E&F, immunofluorescent pattern of GAL-3 in the area of LV supplied by LAD showing cardiomyocytes with higher cytoplasmic expression of GAL-3 (E) (arrow heads). High power view (F) shows GAL-3 cytoplasmic expression in cardiomyocytes (arrow head), nuclear expression in cardiomyocytes (thick arrow) and endothelial cell (thin arrow). Alexa Fluor 488 immunofluorescent technique. 85

109 Figure 3.16: GAL-3 expression at 60 min post MI A, Low power view of the heart showing a high expression of GAL-3 in the anterior wall of left ventricle in the area supplied by LAD, interventricular septum(arrow heads) and right ventricle (thin arrow). B, Sham operated heart section showing low expression in the corresponding areas. C&D, Representative sections of the left ventricle from area supplied by LAD showing high cytoplasmic expression of GAL-3 by cardiac myocytes (arrow head) interspersed with cardiomyocytes with low expression. D, High power view shows expression of GAL-3 in the cardiac myocytes cytoplasm (arrow heads), nucleus (thick arrow) and endothelial cells (thin arrow). Streptavidin- biotin immunoperoxidase method. E&F, immunofluorescent pattern of GAL-3 in the area of LV supplied by LAD showing cardiomyocytes with higher cytoplasmic expression of GAL-3 (E) (arrow heads). High power view (F) shows GAL-3 cytoplasmic expression in cardiomyocytes (arrow head), nuclear expression in cardiomyocytes (thick arrow), prominent cross striations with z-band staining (thin arrows) and endothelial cell (curved arrows). Alexa Fluor 488 immunofluorescent technique. 86

110 Figure 3.17: GAL-3 expression at 4 hour post MI A, Low power view of the heart showing a high expression of GAL-3 in the anterior wall of left ventricle in the area supplied by LAD, interventricular septum(arrow heads) and right ventricle (thin arrow). B, Sham operated heart section showing low expression in the corresponding areas. C, Representative sections of the left ventricle from area supplied by LAD showing high cytoplasmic expression of GAL-3 by cardiac myocytes (arrow head) diffusely surrounding the area of cardiomyocytes with low expression. D, High power view shows expression of GAL-3 in the cardiac myocytes cytoplasm (arrow heads) nucleus (thick arrow) and endothelial cells (thin arrow). Z-band staining is also seen (curved arrow), Streptavidin- biotin immunoperoxidase method. E&F, immunofluorescent pattern of GAL-3 in the area of LV supplied by LAD showing cardiomyocytes with higher cytoplasmic expression of GAL-3(E) (arrow heads). High power view (F) shows GAL-3 cytoplasmic expression in cardiomyocytes (arrow head), nuclear expression in cardiomyocytes (thin arrow), prominent cross striations with z-band staining (thick arrows) and endothelial cell (curved arrows). Alexa Fluor 488 immunofluorescent technique. 87

111 Figure 3.18: GAL-3 expression at 24 hour post MI A, Low power view of the heart showing a high expression of GAL-3 in the anterior wall of left ventricle in the area supplied by LAD, interventricular septum (arrow heads) and right ventricle (thin arrow). Left ventricular area also shows a cluster of inflammatory cells showing intense staining with GAL-3 (thick arrow). B, Sham operated heart section showing low expression in the corresponding areas. C. Representative section of the left ventricle from area supplied by LAD showing high cytoplasmic expression of GAL-3 by cardiac myocytes (arrow heads), surrounding areas of no expression. Many neutrophil polymorphs (thick arrows) are also showing cytoplasmic expression of GAL-3. D, High power view showing a well demarcated area of high cytoplasmic expression of GAL-3 by cardiac myocytes (arrow heads) and endothelial cells (thin arrow). Numerous neutrophil polymorphs expressing GAL-3 (thick arrows) are also seen in the section scavenging the dead cardiomyocytes. Streptavidin- biotin immunoperoxidase method. E&F, Alexa Fluor 488 immunofluorescent labeling of GAL-3 in the area of LV supplied by LAD showing cardiomyocytes with higher cytoplasmic expression of GAL-3 which is sharply demarcated from the surrounding dead cardiomyocytes infiltrated with GAL-3 expressing neutrophil polymorphs (E) (arrow heads). High power view (F) shows GAL-3 cytoplasmic expression in cardiomyocytes (arrow head), nuclear expression in cardiomyocytes (thin arrow) and neutrophil polymorphs (thick arrow). Alexa Fluor 488 immunofluorescent technique. 88
112 Figure 3.19: GAL-3 mrna expression in the ILV (Infarcted left ventricle) and NILV (Non-infarcted left ventricle) expressed as fold changes relative to sham at respective time points post MI (*shows p<0.05). Figure 3.10: The graph represents ratio of plasma GAL-3 concentration in myocardial infarction to plasma GAL-3 concentration in sham operated mice C57BL6 mice. 24 hours post myocardial infarction show significant difference from sham operated mice (*shows p < 0.05). 89
113 Table 3.5: Fold changes in GAL-3 mrna expression in the ILV (Infarcted left ventricle) and NILV (Non-infarcted left ventricle) relative to sham at respective time points post MI Sham Non-Infarcted LV (NILV) Infarcted LV (ILV) P value 20 min Post MI min Post MI min Post MI * 4 hr Post MI * 24 hr Post MI * shows p values comparing ILV and sham groups for respective time points (* shows p<0.05) Plasma GAL-3 levels are significantly increased at 24 hour post MI Plasma GAL-3 values in the naive control group were ± pg/ml. GAL-3 plasma levels were significantly raised at 24 hour post MI compared to sham operated mice ( ± vs ± p=0.01*). There was no significant difference between MI groups and sham groups at earlier time points (Fig. 3.20) Discussion Myocardial Infarction is the leading cause of heart failure. The association of GAL-3 with heart failure is already well established so it becomes important to know when GAL-3 starts to appear after MI and whether ischemia regulates it at transcriptional or translational levels in the myocardium. Permanent LAD ligation in mice is a very appropriate in vivo model to study the very early changes that occur in the heart following occlusion of blood flow to the myocardium. Our results show that GAL-3 starts to increase in the left ventricle in the area of infarction within one hour of ischemia/hypoxia. GAL-3 stays high till 4 90
114 hour post MI after which at 24 hour post MI it increases several fold compared to the sham operated animals. GAL-3mRNA is also detected to be high at one hour post MI time point in the infarcted tissue which stays high till 24 hours time point. An interesting observation was that GAL-3mRNA increases in the infarcted tissue at 60 min and 4 hours time points but as the time of ischemia/infarction increases to 24 hours, the expression increases and spreads to the non-infarcted tissue of the left ventricle surrounding the infarcted area. We know that GAL-3 is important in the inflammatory response which plays a role in cardiac remodeling (317). The several fold increase in the protein as well as mrna levels of GAL-3 at 24 hour post MI is understandable. At this time a full fledge inflammatory response is underway in the infarcted myocardium, there is coagulative necrosis and the area is flooded with neutrophils, which also expresses GAL-3. The increase in myocardial GAL-3 levels in the first 4 hours of MI gives us an insight into how the myocardium reacts immediately after the ischemic insult. The neutrophil polymorphs have not yet reached the area of infarction and the response seen at these earlier time points is purely due to the resident cells, which are mainly the cardiomyocytes and the endothelial cells. Our immunohistochemistry and immunofluorescent staining results show that GAL-3 is expressed by cardiomyocytes and endothelial cells during the early ischemic event and it co-localized with desmin in cardiomyocytes and factor 8- relaed antigen in endothelial cells (Fig. 3.27). In a study on heart failure model on Ren-2 rats, GAL-3 was shown to be expressed in fibroblasts and macrophages, but not with cardiomyocytes (136). This difference may be due to the difference in disease models used in the two studies. The appearance of GAL-3 at this early time following MI is very significant in terms of its causal or consequential role in 91
115 heart failure. We believe that GAL-3 increase at this early time post MI is an immediate response of the myocardium to hypoxia or ischemia. Plasma GAL-3 levels were high at 24 hour post MI time point compared to sham operated animals which was expected due to the several fold high GAL-3 protein and mrna levels seen in the LV tissue. We have observed in our study that the levels of GAL-3 in sham operated animals were higher than the non-operated naïve animals. The reason for this increase is not clearly known, but may involve a generalized stress response to the sham surgical procedure. It has been reported in traumatic brain injury model that animals exposed to sham surgery had higher GAL-3 levels when compared to naïve animals (318). As there is some degree of mechanical/surgical stress applied to the sham operated mice we suggest that GAL-3 levels seen in sham groups may be the result of these factors. For these reasons we made sham operated groups as our controls for all time points, and all our statistics were calculated in comparison between MI groups and sham-operated groups to take out the effect of mechanical/surgical stress from the real ischemic effect due to ligation of LAD. In all early MI groups the values of GAL-3 are higher than corresponding sham groups and show statistical significance at certain time points. So the significant rise of GAL-3 levels at certain time points in MI groups when compared to sham-operated groups is purely due to ischemia and not surgical stress. Although a contributory role for GAL-3 in the pathophysiology of heart failure is already defined, we think that GAL-3 at early time point post MI works to sustain the myocardium against the initial injury. Further studies need to be carried out for proper assessment of GAL-3 in cardiovascular disease specially 92
116 after Myocardial infarction to ascertain when GAL-3 becomes responsible for the onset and progression of cardiac fibrosis and reduced ventricular function (144) Conclusion We have shown for the first time that GAL-3 is increased at both transcriptional and translational level in the LV in early ischemic period. We have also shown for the first time that GAL-3 is produced by cardiomyocytes and endothelial cells in early post MI time which is significant because it can help in understanding the mechanism of very early response of the myocardium after acute infarction and help devise ways to save the viable tissue before permanent damage sets in. 93
117 Section 3: Hypoxia Inducible factor-1 alpha in Early Myocardial Infarction 94
118 3.3.1 Background Hypoxia-inducible factor (HIF) is a set of transcription factors that regulate the cellular response to hypoxia (147). HIF is a heterodimeric DNA-binding complex composed of two basic helix-loop-helix proteins, the constitutive expressed HIF-β or aryl hydrocarbon receptor nuclear translocator (ARNT) and the oxygen sensitive hypoxia-inducible HIF-α (148). HIF-α heterodimerizes with ARNT (HIF-1β), recognizes and binds to hypoxia response elements (HREs) in the genes that have the consensus sequence G/ACGTG (150). The α-subunit is degraded during normoxia mainly through a proteasome-dependent pathway (152, 153) after hydroxylation of two proline residues by prolyl-hydroxilases (PHDs) (319, 320). During hypoxia, PHDs are inhibited and HIF-1 α subunit accumulates, dimerizes with HIF-1β and drives expression of HIF target genes (155). Hypoxia contributes significantly to the pathophysiology of major human disease, including myocardial and cerebral ischemia, cancer and pulmonary hypertension and so HIF-1α is a major player in the mechanism of injury in these diseases (158). HIF-1 alpha role in the heart is shrouded with many conflicting reports (321) as discussed in detail in the review of literature of this dissertation, however there is a general agreement that increase in the level of HIF-1α is one of the first adaptations of the myocardium to ischemia (160). Here we look at the HIF-1 α levels in the myocardium very early following MI in the mouse model of permanent LAD ligation. 95
119 3.3.2 Results HIF-1 α in heart tissue HIF-1 α concentration in LV tissue of the naïve group is 31.97±2.18 pg/mg of total protein. HIF-1 α protein concentration shows a significant increase in the LV at 20 minutes following MI group compared to sham operated control group (95.5±12.4 vs 65.6±0.7 pg/mg, P = 0.047*) (Table 3.6) (Fig. 3.21). HIF-1 α values in the MI groups are higher than corresponding sham operated groups at 30 minutes, 60 minutes and 4-hour groups but show no statistical significance (36.34±2.62 vs 30.54±1.42 pg/mg, 40.85±4.6 vs 40.01±5.15 pg/mg, and 59.35±3.22 vs 54.98±4.26 pg/mg,). The 24-hour HIF-1 α level in sham-operated group appears to be higher than the MI group but does not reach statistical significance (46.65±2.42 vs 40.75±2.61 pg/mg). HIF-1 α value in LV in all MI groups is higher than the baseline naïve control group. The pattern of HIF-1 α protein expression in the LV after permanent ligation of LAD shows a transient significant peak at 20 minutes following MI, which declines afterwards but still remains high compared to the naïve control animal group (Table 3.6) (Fig. 3.21). As we observed a peak of HIF-1 α at 20 minutes post MI time point, so we did a separate experiment for 20 minutes time point to measure the HIF-1 α concentration in the nuclear and cytoplasmic extracts of the LV. The results show a significant rise of HIF-1 α concentration in the nuclear extract of the MI group compared to the sham operated group (87.84±5.41 vs 70.75±3.72 pg/mg, p = 0.03*) (Table 3.7) (Fig ). 96

.")
120 Figure 3.21: HIF-1 α concentrations at 20 mins, 30 mins, 60 mins, 4 hours and 24 hours post myocardial infarction with corresponding sham operated groups in C57BL6 mouse left ventricle. Control represents non-operated normal animal heart (*shows p<0.05). Figure 3.22: HIF-1 α levels in nuclear and cytoplasmic extracts of LV mouse heart at 20 minutes following MI (*shows p<0.05). 97
121 Table. 3.6 : HIF-1 α levels in pg/mg of total protein at different time points post myocardial infarction. Groups Number Mean(pg/mg) Std. Dev. Std. Error p value Naive min MI * 20 min sham min MI min sham min MI min sham hour MI hour sham hour MI hour sham * shows p<0.05 Table. 3.7: HIF-1 α levels in pg/mg total protein in nuclear and cytoplasmic fractions of left ventricular heart tissue at 20 min post myocardial infarction HIF-1α (LV) Groups N Mean Std. Dev Std. Error P value Nuclear fraction pg/mg 20 min MI * 20 min Sham Cytoplasmic fraction pg/mg 20 min MI min Sham * shows p<
122 There was a statistically significant difference between the different time points within the MI groups as determined by one-way ANOVA (F (4,34) = , p =.000). Tukey post-hoc tests showed that the 20 min post MI HIF-1 α level (M = 95.48, 95% CI [66.15, 24.82]) was significantly higher than 30 minute (M = 36.34, 95% CI [30.15, 42.53], p = 0.00), 60 minute (M = 40.85, 95% CI [30.00, 51.7], p = 0.00), 4 hour (M = 59.35, 95% CI [51.72, 66.98], p = 0.003), and 24 hour post MI groups (M = 40.75, 95% CI [34.37, 47.13], p = 0.00). The expression of HIF-1α is predominantly seen in the nuclei of endothelial cells (Fig A) in the naïve heart. The expression of HIF-1 α in the nuclei of cardiomyocytes is very low and in few cells in naïve heart. There is a higher nuclear expression of HIF-1 α by cardiac myocytes and endothelial cells in the area supplied by LAD artery at 20 (Fig E, G, H) and 30 minute (Fig I, K, L), groups when compared with 60 minute (Fig M, O, P), 4 hour (Fig Q, S, T), and 24 hour (Fig. 3.9 K) following MI groups and all sham operated groups. In 60 minutes (Fig M, O, P) and 4 hours (Fig Q, S, T), we noticed a decrease in the number of cardiac myocytes that expresses HIF-1 α and most of the cells that express HIF-1 α are endothelial cells. In the 24 hour post MI group the expression of HIF-1α is in the nuclei of few cardiomyocytes and more endothelial cells in areas surrounding the infarction while cardiomyocytes in the center of infarction does not show any expression of HIF-1α (Fig. 3.9 K). On the contrary, many infiltrating neutrophil polymorphs in the center of infarction show nuclear expression of HIF-1 α (Fig. 3.9 K). As early as 60 minutes following MI we can identify an area of infarcted cardiomyocytes that do not express HIF-1 α (Fig M), this area is more obvious at 4 hours (Fig Q) and 24 hours following MI (Fig. 3.9 K). 99
, streptavidin- biotin immunoperoxidase method. B.")
123 Figure 3.23: HIF-1 α expression of the heart. A. Representative section of naïve heart showing nuclear expression of HIF-1 by a few endothelial cells (arrow head), streptavidin- biotin immunoperoxidase method. B. Negative control section showing no HIF-1 a staining, streptavidinbiotin immunoperoxidase method. C. Positive control section of mouse placenta showing nuclear staining of HIF-1 a by trophoblastic cells, Rhodamine, immunofluorescent technique. D. Negative control section for HIF-1 a. Rhodamine, immunofluorescent technique. E,I,M&Q shows representative sections from the anterior wall of left ventricle in the area supplied by LAD 20 min, 30 min, 60 min and 4 hours following ligation of LAD, showing variable nuclear staining of HIF-1 a by cardiac myocytes at different time points (arrow head) and endothelial cells (thin arrow), streptavidin- biotin immunoperoxidase method. F,J,N&R shows their corresponding Sham operated hearts showing low nuclear expression of HIF-1 a by few endothelial cells (thin arrow), streptavidinbiotin immunoperoxidase method. Low and high power views of the left ventricle 20 min (G&H), 30 min (K&L), 60 min (O&P) and 4 hours (S&T) following ligation of LAD showing high nuclear staining of HIF-1 a by cardiac myocytes (arrow head), Rhodamine, immunofluorescent technique. 100
124 HIF-1 alpha mrna expression at 20 mins post MI: As HIF-1 alpha protein level was significantly high at 20 mins post MI time point. We checked the mrna level at this point which showed no upregulation of mrna at 20 min post MI time point (Table 3.24) Morphometric analysis The frequency of cardiomyocytes expressing HIF-1 α in 20 minute post MI group was significantly higher than 30 minute, 60 minute, 4-hour and 24-hour post MI groups (Chi squared = with 1 degree of freedom, P = 0.002*, Chi squared = 34.1 with 1 degree of freedom, P = *, Chi squared = with 1 degree of freedom, P = *, Chi squared = 84.5 with 1 degree of freedom, P = *, respectively). The frequency of endothelial cells expressing HIF-1 α in 20 minute post MI group is significantly higher than 30 minute, 60 minute, 4- hour and 24-hour post MI groups (Chi squared = 12.3 with 1 degree of freedom, P = *, Chi squared = 36.5 with 1 degree of freedom, P = , Chi squared = 49.1 with 1 degree of freedom, P = , Chi squared = 54.3 with 1 degree of freedom, P = *, respectively). The frequency of endothelial cells expressing HIF-1 α is significantly higher than cardiomyocytes at 4-hour and 24-hour post MI groups (Chi squared = 6.84 with 1 degree of freedom, P = 0.008* and Chi squared = with 1 degree of freedom, P = *, respectively). The frequency of neutrophil polymorphs expressing HIF-1 α was significantly higher than cardiomyocytes and endothelial cells at 24-hour post MI groups (Chi squared = 81.9 with 1 degree of freedom, P= * and Chi squared = 27.9 with 1 degree of freedom, P= *, respectively). A decrease in the number of cardiomyocytes and endothelial cells that express HIF-1 α is 101
 and NILV (Non-infarcted left ventricle) expressed as fold changes relative to sham at respective time")
125 * Figure. 3.24: HIF-1α mrna expression at 20 min Post MI time point in the ILV (Infarcted left ventricle) and NILV (Non-infarcted left ventricle) expressed as fold changes relative to sham at respective time points post MI. Table 3.8: Morphometric analysis of expression of HIF-1α in cardiomyocytes, endothelial cells and neutrophil polymorphs at different time points following ligation of LAD. HIF-1α Morphometric analysis Post MI time points Cardiomyocytes % Endothelial cell s% Neutrophil Polymorphs % 20 MINUTES MINUTES MINUTES HOURS HOURS
126 associated with the increase in post MI time. Neutrophil polymorphs were counted at 24-hour following MI as they are not seen before 4 hour post MI time (Table 3.8) Discussion HIF-1 α levels in the LV show a significant increase in 20 minute post MI group compared to sham operated control group (Fig. 3.21, 3.22). In addition, HIF-1 α value in the MI groups at 30 minutes, 1 hour and 4 hours are higher than corresponding sham operated control groups but shows no statistical significance. This is supported by one-way ANOVA and Tukey post-hoc test analysis of MI groups which shows HIF-1 α value at 20 minute MI group is significantly higher than other MI groups. Moreover, HIF-1 α values in all MI groups are higher than the baseline non-operated naïve control groups. We show for the first time a transient peak in LV HIF-1 α level at 20 minutes following MI, which declines afterwards. The immunohistochemical and immunofluorescent staining results are very characteristic and supportive of this pattern (Fig. 3.23). We believe that in our experiments, the initial increase in HIF-1 α levels in the LV is due to stabilization of HIF-1 α as a result of low intracellular level of oxygen secondary to complete ligation of LAD artery. This observation is supported by our real time PCR results that show no upregulation of HIF-1 α mrna at this early time point. We also observed a decrease in LV level of HIF-1 α as the time of ischemia increased. We think that as the time of ischemia increases the cardiomyocytes become necrotic and HIF-1 α level go down due to protein degradation. As previously mentioned in the methods section (p. 42), we took only the LV protein extraction, so the mass of heart tissue is similar between samples. If the cells in the middle of the infarct are necrotic and HIF- 1 α is 103
127 degraded as the time of ischemia increases then it is understandable that the levels of HIF-1 α in the 1 hour, 4-hour and 24-hour post MI groups are not significantly higher than corresponding sham operated groups. HIF-1 α is being expressed by the nuclei of cardiomyocytes and endothelial cells follows the same pattern seen in immunohistochemical and immunofluorescent-stained sections and we are able to see that as the time of ischemia increases the number of cells with high expression of HIF-1 α decreases. This is supported by our morphometric analysis which shows a significant decrease in the frequency of cardiomyocytes and endothelial cells that express HIF-1 α with the increase of post MI time. Another observation pertinent to HIF-1 α staining was that while the expression of HIF-1 α decreases in cardiomyocytes as the time of ischemia increases, its expression in endothelial cells essentially remains the same. A possible explanation for this can be related to the fact that endothelial cells are proliferating cells that participate in healing process of the infarcted zone and in the formation of collaterals while survived cardiomyocytes do not proliferate. We think that when continuous ischemia damages the cardiomyocytes its expression is lost but the surrounding endothelial cells keep on proliferating and expressing HIF-1 α. HIF-1 α is a protective factor that mediates the survival of injured cardiomyocytes in the setting of ischemic injury by transcribing a variety of cardioprotective genes including erythropoietin, vascular endothelial growth factor, inducible nitric oxide synthase, hemeoxygenase-1 and cardiotropin (321). So we think that presence of HIF-1 α is protective in the early post MI time point tested. We have observed in our study that the level of HIF-1 α in sham operated animals was higher than the non-operated naïve animals. This increase in sham 104
128 operated animals can be due to factors related to surgical stress. One of the studies (322) demonstrated that HIF-1 α protein in the myocardium could be induced by mechanical stress to the heart. As there is some degree of mechanical/surgical stress applied to the sham operated mice we suggest that HIF-1 α levels seen in sham groups may be the result of these factors. For these reasons we make sham operated group as our control for all time points, and all our statistics were done in comparison between MI groups and sham-operated groups to take out the effect of mechanical/surgical stress from the real ischemic effect due to ligation of LAD. The significant rise of HIF-1 α levels at certain time points in MI groups when compared to sham-operated groups is purely due to ischemia and not surgical stress Conclusions We report for the first time that HIF-1 α is significantly increased at 20 minutes following myocardial infarction. 105
129 Section 4: HIF-1 α correlates with GAL-1 and GAL-3 in Early Myocardial Infarction 106
130 3.4.1 Background GAL-1 and HIF-1α GAL-1 has been identified as a hypoxia-induced protein in a number of studies (64-66). Recently, Zhao et al. (67) have demonstrated that HIF- 1 α significantly increased GAL-1 expression in messenger RNA and protein levels in four colorectal cancer cell lines and it has been proposed that GAL-1 gene is a direct target of transcriptional factor HIF-1 α (66, 67). HIF-1 α itself is a transcription factor mediating early (160) as well as late responses to myocardial ischemia (323). We tried to establish whether there is any correlation between GAL-1 and HIF-1 α in the ischemic myocardium at early post MI time points in the murine model of permanent LAD ligation GAL-3 and HIF-1 α GAL-3 has been linked to hypoxic/ischemic injuries in a number of studies in the kidneys, and brain (79, 145, 146). We have also shown in our work that GAL-3 is expressed in relation to cardiac ischemia very early in the post MI period. There is experimental evidence that GAL-3 expression is dependent on HIF-1 α activity. It was shown on nucleus pulposus cells that upregulation of HIF- 1α caused an elevation in GAL-3 promoter activity and deletion of HIF-1 caused loss of galectin-3 promoter activity. HIF-1 null cells also showed minimal expression of GAL- 3. These results support the observation that GAL-3 is an HIF-1 transcriptional target and that HIF-1 serves as a major regulator of GAL-3 expression (324). 107
131 We sought to discover whether there was any correlation between GAL-3 and HIF-1 α in the ischemic myocardium at early post MI time points in the murine model of permanent LAD ligation Results Co-localization of GAL-1 and HIF-1 α Co-localization of GAL-1 and HIF-1 α cardiomyocytes and endothelial cells is shown in Fig All cardiac myocytes that show nuclear expression of HIF-1 α also express GAL-1 in the cytoplasm and some nuclei. All endothelial cells that show nuclear expression of HIF-1 α also express GAL-1 in the cytoplasm and some nuclei. GAL-1 expression in cardiomyocytes is confirmed by co-localizing it with Desmin (Fig C). GAL-1 and HIF-1 α expression in endothelial cells is shown with co-localization with CD31 (Fig F&O, respectively). Few tissue histiocytes, which express CD68, also show co-localization with GAL-1 and HIF-1 α (Fig I& L respectively). In general, few tissue histiocytes are noticed during the first 24 hours following MI GAL-3 co-localize with HIF-1 α in early post MI GAL-3 and HIF-1 α co-localize in cardiomyocytes and endothelial cells are shown in Fig C. All cardiac myocytes that show nuclear expression of HIF-1 α also express GAL-3 in the cytoplasm and some nuclei and endothelial cells that show nuclear expression of HIF-1 α also express GAL-3 in the cytoplasm and some nuclei. GAL-3 expression in cardiomyocytes is shown by co-localizing it with Desmin (Fig F). GAL-3 expression in endothelial cells is shown with co-localization with factor-8 related antigen (Fig I). GAL-3 presence in the neutrophil polymorphs is also confirmed by co-localization with lysozyme and 108
, 20 minutes (high power view), 30 minutes, 60 minutes, 4 hours and 30 minutes")
132 Figure 3.25: Co-localization of Galectin-1 and HIF-1 α. A,D,G,J,M, Q show representative sections of the left ventricle from areas supplied by LAD in 20 minutes (low power view), 20 minutes (high power view), 30 minutes, 60 minutes, 4 hours and 30 minutes (high power view) following MI respectively, showing high cytoplasmic expression of galectin-1 by cardiac myocytes (thin arrow), Alexa Fluor 488 immunofluorescent technique. B,E,H,K,N,W show representative sections of the left ventricle from areas supplied by LAD in 20 minutes (Low power view), 20 minutes (high power view), 30 minutes, 60 minutes, 4 hours and 30 minutes (High power view) following MI respectively showing high nuclear expression of HIF-1a by cardiac myocytes (thin arrow), Rhodamine immunofluorescent technique. C,F,I,L,P,X shows Co-localization of galectin-1 and HIF-1 a in the same sections at the respective time points. (arrow head), Alexa Fluor-Rhodamine immunofluorescent technique. 109

133 Figure 3.26: Co-localization of GAL-1, HIF-1 α, CD31, desmin and CD68. A,D,G, Representative section of the left ventricle from areas supplied by LAD showing high cytoplasmic expression of galectin-1 by cardiac myocytes, endothelial cells and histiocytes respectively (thin arrows). J, showing high cytoplasmic expression of CD68 in tissue histiocytes (thin arrows) and M showing high cytoplasmic expression of CD31 in endothelial cells (thin arrows). Alexa Fluor 488 immunofluorescent technique. B. showing high cytoplasmic expression of desmin by cardiac myocytes (thin arrow), E. showing high cytoplasmic expression of CD31 by endothelial cells (thin arrow), H. showing high cytoplasmic expression of CD68 by histiocytes (thin arrow), K. showing high nuclear expression of HIF-1 a by histiocytes (thin arrow), N. showing high nuclear expression of HIF 1 a by endothelial cells (thin arrow), Rhodamine, immunofluorescent technique. C. Co-localization of galectin-1 and desmin in cardiac myocytes. F. Colocalization of galectin-1 and CD31 in endothelial cells (arrow head), I. Colocalization of galectin-1 and CD68 in histiocytes (arrow head), L. Colocalization of CD68 and HIF-1 a in tissue histiocytes (arrow head), O. Co-localization of CD31 and HIF-1 a in endothelial cells (arrow head). Alexa Fluor 488-Rhodamine immunofluorescent technique. 110
 and endothelial cells (arrow heads), Alexa Fluor 488")
134 Figure 3.27: Co-localization of GAL-3, HIF-1 α, desmin, factor 8 related antigen, lysozyme and myeloperoxidase (MPO). A, shows representative section of the left ventricle from areas supplied by LAD showing expression of GAL-3 by cardiac myocytes (thick arrows) and endothelial cells (arrow heads), Alexa Fluor 488 immunofluorescent labeling. B shows HIF-1 alpha expression in the nuclei of the same section, Rhodamine immunofluorescent labeling and C represents the co-localization of GAL-3 and HIF-1 α. D, shows GAL-3 expression by cardiomyocytes (thick arrows) Alexa Fluor 488 DAPI-immunofluorescent labeling, E shows the same section with cytoplasmic expression of desmin, Rhodamine immunofluorescent labeling and F shows the co-localization of GAL-3 with desmin in cardiomyocytes (nuclei stained by DAPI). G shows GAL-3 expression in the endothelial cells (thin arrows) and cardiomyocytes (arrow head), Alexa Fluor 488 immunofluorescent labeling, H shows endothelial cells expressing factor-8 related antigen (thin arrows) in the same section, Rhodamine immunofluorescent labeling and I, shows the colocalization of GAL-3 and factor-8 related antigen in the endothelial cells. J, shows lysozyme staining in the neutrophil polymorphs (arrow heads), Alexa Fluor 488 DAPIimmunofluorescent labeling, K, shows neutrophil polymorphs expressing GAL-3 (arrow heads)in the same section, Rhodamine-DAPI- immunofluorescent labeling, and L shows the double labeling of GAL-3 and lysozyme in the neutrophil polymorphs. M, shows myeloperoxidase expression in the neutrophil polymorphs (arrow heads), Alexa Fluor 488 DAPI-immunofluorescent labeling, N, shows neutrophil polymorphs expressing GAL-3 (arrow heads)in the same section, Rhodamine- DAPI- immunofluorescent labeling, and O shows the double labeling of GAL-3 and myeloperoxidase in the neutrophil polymorphs. 111
135 myeloperoxidase (MPO) in the neutrophils (Fig. 3.27, L and O) Bioinformatic analysis results The output from the clustalw2 program is shown in Fig We found at least 4 potential HREs in the promoter region of Human GAL-1 gene (Fig.3.32, A&B) and potential HREs in the promoter region of mouse GAL-1 gene (Fig. 3.32, C&D). Bioinformatic analysis shows that there are two potential HREs (hypoxia response elements) in the promoter region of GAL-3 gene (324) Proliferation and Apoptosis in Early Post Myocardial Infarction Our staining with Ki-67 showed that there is a low proliferative activity in 20 minute, 30 minute, 60 minute and 4-hour post MI sections (Fig. 3.29). However, in 24 hour post MI sections we are able to clearly see an increase in the expression of Ki-67 in the endothelial cells in the area of infarction (Fig U&V) while the relevant sham operated sections show very low expression of Ki-67 (Fig X). We also found that there is very low expression of caspase-3 and cleaved caspase-3 at 30 minutes, 60 min and 4 hours time points (Fig D, E, F). At 24 hour post MI group, however, we do find an increase in the expression of caspase- 3 and cleaved caspase-3 activity (Fig A, C), compared to the sham group (Fig B). The expression of caspase-3 and cleaved caspase-3 was seen 112
136 A. B. Figure 3.28: (A) Pattern of GAL-1 and HIF-1 α in the heart from 20 min post MI till 24 hour post MI time points. (B) Pattern of GAL-3 and HIF-1 α in the heart from 20 min post MI till 24 hour post MI time points. 113
.")
137 Figure 3.29: Ki-67 proliferative activity in the left ventricle. A, B, C, D, Low Ki-67 proliferative activity in normal left ventricle showing nuclear staining of Ki-67 in one interstitial cell (arrow head). E, F, G, 20 minutes MI; I,J, K, 30 minutes MI; M,N,O 60 minutes MI; Q,R,S, 4-hour MI, Low Ki-67 proliferative activity: showing nuclear staining of Ki-67 in few endothelial cells (arrow head) in left ventricle. U, V, W, 24-hour MI, high Ki-67 proliferative activity showing nuclear staining of Ki-67 in a large number of endothelial cells (arrow head) in the infarction area of left ventricle. H, L, P, T, X, showing faint nuclear staining of Ki-67 in one endothelial cell in 20 minutes, 30 minutes, 60 minutes, 4-hours and 24 hour sham-operated left ventricle. A, E, I, M, Q, U are stained by Streptavidin-Biotin immunoperoxidase method. The others are stained by Alexa Fluor 488 immunofluorescent technique. 114

138 Figure 3.30: Apoptotic activity in the left ventricle. A. showing high expression of caspase- 3 in cardiac myocytes (arrow head) surrounding the necrotic area, endothelial cells (thin arrow), and neutrophil polymorphs (thick arrow) in 24-hour post MI, Alexa Fluor 488 immunofluorescent technique. B. showing no expression of caspase 3 in 24-hour sham-operated left ventricle. C, showing high expression of cleaved caspase- 3 in cardiac myocytes (thick arrows). Many apoptotic bodies (arrow head) are seen in the infarcted area of left ventricle, streptavidin- biotin immunoperoxidase method. D, showing very low apoptotic activity, only one cell stained with anti-cleaved caspase 3 (arrow head) in the area of infraction in the left ventricle of 4-hour post MI, streptavidin- biotin immunoperoxidase method. E, F, Showing no staining with anti-cleaved caspase 3 in the left ventricle of 30 minutes and 60 minutes post MI, streptavidin- biotin immunoperoxidase method 115
, and endothelial cells (arrow head) at 30 minutes post MI in an area supplied by LAD in the left ventricle,")
139 Figure 3.31: Bcl2 activity in left ventricle. A, B, C, D, showing high cytoplasmic expression of bcl2 by cardiac myocytes (thick arrow), and endothelial cells (arrow head) at 30 minutes post MI in an area supplied by LAD in the left ventricle, streptavidin- biotin immunoperoxidase method. E, F, showing very low expression of bcl2 in few endothelial cells (arrow head) in the left ventricle of naïve and 30-minutes sham operated heart. Streptavidin- biotin immunoperoxidase method. 116
140 in cardiac myocytes and endothelial cells in the area of infarction. Many apoptotic bodies, expressing cleaved caspase-3, are seen in the area of infarction (Fig C) at 24-hour following MI. Bcl-2 expression is increased in the 30 minutes post infarction time in the LV in the area of infarction of the left ventricle (Fig A D). Its expression is seen in the cardiomyocytes and endothelial cells. However, the expression in the endothelial cells is considerably greater than the cardiomyocytes. The Sham group showed faint staining of bcl-2 and only in the endothelial cells Discussion We have shown co-localization of GAL-1 and HIF-1 α in cardiac myocytes and endothelial cells in LV sections from areas supplied by LAD at different time points in the first 4 hours following MI. Cardiomyocytes and endothelial cells that show nuclear expression of HIF-1 α also show cytoplasmic and nuclear expression of GAL-1, while cells that do not express HIF-1 α also show no expression of GAL-1, which might indicate a possible correlation in the expression of both proteins. In Fig. 3.9 K, L, M, we are able to show co-expression of GAL-1 and HIF-1 α in surviving cardiomyocytes and endothelial cells at the periphery of infarction zone while dead cardiomyocytes in the centre of infarction do not show any expression, which might also support a possible correlation between both proteins. In the same figure, we are also able to show co-expression of GAL-1 and HIF-1 α by neutrophil polymorphs that infiltrate the myocardium following MI to digest dead cells and facilitate their removal at a later time by macrophages. Those neutrophil polymorphs are moving in between dead cells in the ischemic zone, so they are expected to be under hypoxic condition. Therefore, they are expressing 117
141 HIF-1 α, as hypoxia can stabilize HIF-1 α and prevent its proteasomal degradation. At the same time, we notice those invading neutrophil polymorphs are also expressing GAL-1, which might also support a possible correlation. In Fig we show the pattern of GAL-1 and HIF-1 α in the heart from 20 minutes till 24 hours post MI time points. It shows both proteins follow the same pattern in the first 24 hours following MI and their co-localization seen by immunofluorescent staining further supports our idea that GAL-1 is a possible transcriptional target of HIF-1 α in the heart at least in the early period after MI. We also found potential HREs in the promoter region of GAL- 1 through bioinformatics analysis (Fig. 3.32). This is supported by a previous study (67), which also showed that there are seven potential HREs within 2.2 kb region upstream the transcriptional start site of GAL-1. We suggest that in our experiment, GAL-1 gene transcription by HIF-1 α can lead to increased expression of GAL-1 in cardiomyocytes, which might also prove to be cardioprotective due to its anti-inflammatory properties (60, 61). As the time of ischemia increases, cells in the centre of the infarct loose HIF-1 α and consequently GAL-1 while the surrounding surviving cells express high levels of HIF-1 α and subsequent GAL-1 to limit damage and prevent further injury We have also shown co-localization of GAL-3 and HIF-1 alpha in cardiomyocytes and endothelial cells in the area of infarction in the LV (Fig. 3.27). Cardiomyocytes and endothelial cells that show nuclear expression of HIF- 1 α also show cytoplasmic and nuclear expression of GAL-3, while cells that do not express HIF-1 α they also show no expression of GAL-3. This indicates a possible correlation also in the expression of both proteins. 118
142 Recent studies have indicated that GAL-3 expression is dependent on HIF-1 α activity. It was shown on nucleus pulposus cells that upregulation of HIF-1α caused an elevation in galectin-3 promoter activity and deletion of HIF-1 α caused loss of GAL-3 promoter activity (324). HIF-1 α null cells also showed minimal expression of GAL-3. These results support the observation that GAL-3 is an HIF-1 α transcriptional target and that HIF-1 α serves as a major regulator of GAL-3 expression (324). Bioinformatic analysis shows that there are two potential HREs (hypoxia response elements) in the promoter region of GAL-3 gene (324). We therefore believe that GAL-3 is a transcriptional target of hypoxia induced HIF-1 α in the early post MI heart and that its role in myocardial ischemia needs to be elaborated. To further look into the biological role underlying the early expression of GAL-1, GAL-3 and HIF-1 α in cardiomyocytes, we looked at the pro-apoptotic and anti-apoptotic proteins at these early time points. Pro-apoptotic caspase-3 and cleaved caspase-3 were found to have a very low expression at early time points post MI, while in the 24-hour post MI group the expression is increased in the area of infarction compared to the sham operated group (Fig. 3.31). Moreover, the anti-apoptotic Bcl-2 expression is high at early time points, especially in 30 minute post MI group, in the area of infarction (Fig. 3.32). Regarding GAL-1, and HIF-1 α, we can see that in the early post MI time points there is predominantly antiapoptotic activity in the left ventricle which correlates with the high tissue GAL-1 and HIF-1 α levels at that time. While in 24-hour post MI time point we have high apoptotic activity which correlates with low tissue levels of GAL-1 and HIF-1 alpha at that time. This further supports our concept that GAL-1 and HIF-1 119
143 alpha are part of the prosurvival mode of action of the cell after ischemic insult at least in the early myocardial infarction time. Gal-3 is shown to regulate survival in some tissues (98) but how Gal-3 regulates survival in cardiomyocytes still remains to be determined. One way of mediating its pro-survival effects is through its role in apoptosis. The first molecule in the cytosol identified as a GAL-3 ligand in vivo was Bcl-2, a molecule involved in regulation of apoptosis (93). We have shown earlier (325) that the anti-apoptotic Bcl-2 expression is high at early time points, especially in 30 minute post MI group, in the area of infarction which points towards an antiapoptotic role of GAL-3 in early MI. We have shown that in the early post MI time points the total caspase-3 activity and Cleaved caspase-3 activity is low (325) so we can conclude that there is predominantly antiapoptotic activity in the left ventricle which correlates with the high tissue GAL-3 levels at that time. Given the upregulation of GAL-3 in the myocardium very early after MI and its correlation with HIF-1 α and anti-apoptotic proteins we believe that it may be part of a pro-survival mechanism of the myocardium to deal with the ischemic/hypoxic insult which can possibly be a part of the prosurvival gene expression profile transcribed by HIF-1 α. Although a contributory role for GAL-3 in the pathophysiology of heart failure is already defined, we believe that GAL-3 at early time point post MI works to sustain the myocardium against the initial injury. Further studies need to be conducted for proper assessment of GAL-3 in cardiovascular disease especially after myocardial infarction to see when GAL-3 becomes responsible for the onset and progression of cardiac fibrosis and reduced ventricular function (144). 120
. C, Mouse GAL-1 promoter with consensus sequence NCGTG (2978). D, Mouse GAL-1 promoter with consensus sequence TGCAC (2640).")
144 Figure 3.32: Potential HREs in the promoter region of GAL-1 gene. A, Human GAL-1 promoter with consensus sequence ACGTG (-1075). B, Human GAL-1 promoter with consensus sequence CACGC (2519, 2533, 2935). C, Mouse GAL-1 promoter with consensus sequence NCGTG (2978). D, Mouse GAL-1 promoter with consensus sequence TGCAC (2640). We found that in the early post MI time there is low proliferative activity in the LV (Fig. 3.29), so we are unable to comment on any proliferative role of GAL-1, GAL-3 and HIF-1 α at these time points. While in 24-hour post MI group, where we have a very high level of GAL-3, we noticed an increase in the proliferative activity of endothelial cells around the area of infarction (Fig.3.29, U&V) when compared with the sham-operated group, as part of the attempts to increase vascularity in the ischemic area to overcome low perfusion as well as participating in the healing process (326) Conclusion We show for the first time that GAL-1 and GAL-3 levels in the LV are increased in early ischemic period which can possibly be a part of the prosurvival gene expression profile transcribed by HIF-1 α. 121
145 Section 5: Galectin-3 is an antiapoptotic and proinflammatory mediator at 24 hours post myocardial infarction 122
146 3.5.1 Background Galectin-3 (GAL-3) has been associated with heart failure (HF) in recent years (144). Increased levels of GAL-3 were related to recurrent HF and increased risk of death in a number of studies ( ). GAL-3 was found to be upregulated in animal models of HF even before the development of HF (136) which makes it very interesting to determine what happens in the heart when GAL-3 levels are high after myocardial infarction and before the development of HF symptoms and signs. Myocardial Ischemia/Infarction is a complex process involving different mechanisms and pathways culminating in cardiac structural and contractile dysfunction (327). It is closely associated with an inflammatory reaction, which is necessary for healing and scar formation (328). Experimental and clinical studies have shown that the inflammatory response to myocardial infarction is associated with the induction of cytokines such as tumor necrosis factor (TNF)-α, interleukin (IL)-1β, and IL-6 ( ). Apoptosis in addition to necrosis is a mechanism which mediates cardiac myocyte death during ischemic injury (253, ). Hypoxia was shown to be the proximate stimulus for myocyte apoptosis (337) and alone was able to induce apoptosis in primary cultures of neonatal and adult cardiac myocytes (338). Apoptosis is a highly regulated process in which several regulatory proteins participate. It is the balance between these regulatory proteins that decides the fate of the cell. Bax, bcl-2, Caspase-3, and cytochrome c are some of these proteins related to apoptosis that have been studied in myocardial infarction (339). Inflammation and apoptosis play a crucial role in MI and the question whether these processes affect cardiomyocyte loss is extremely important. There are 123
147 potential ways to inhibit inflammation and apoptosis and such inhibition can result in reduction in infarct size and improved myocardial function. To tackle these interrelated issues, it is first necessary to identify key regulatory molecules that mediate these two mechanisms. GAL-3 is involved in many processes during the acute inflammatory response. In addition to being highly expressed and secreted by macrophages (123), it causes neutrophil activation and adhesion (124), chemoattraction of monocytes or macrophages (77) and activation of mast cells (125). Intracellular GAL-3 is also shown to promote the survival of inflammatory cells resulting in persistence of inflammation (76). Regarding the role of GAL-3 in apoptosis, there is evidence that GAL-3 contains the anti-death Asp-Trp-Gly-Arg (NWGR) motif (7, 13) which is critical for its antiapoptotic function. The anti-apoptotic activity of GAL-3 was also demonstrated in peritoneal macrophages when those from galectin-3-deficient mice were more sensitive to apoptotic stimuli than those from control mice (75). GAL-3 protects cells against apoptosis by working through different mechanisms which suggest that GAL-3 regulates the common apoptosis commitment step. As our previous results show substantial increase in the GAL-3 levels in the cardiomyocytes, endothelial cells and neutrophil polymorphs in the heart as well as plasma at 24 hours post MI time point, we tried to investigate if this high GAL- 3 at 24 hours post MI time has any role in inflammation and apoptosis in the heart. We used male C57BL6 mice and GAL-3 KO mice with the same background strain to look for inflammatory and apoptotic markers in 24 hour post myocardial infarction heart samples. 124
148 3.5.2 Results GAL-3 is a proinflammatory mediator at 24 hour post MI time IL-6 levels were significantly higher in the LV of GAL-3 wild type mice at 24-hour post MI time point as compared to GAL-3 KO mice (98.91 ± vs ± 8.84 pg/mg, p=0.05) as measured by ELISA (Fig A). This was also reflected in the plasma where GAL-3 wild type plasma levels were higher than GAL-3 KO plasma (Fig C) (Table. 3.9) IL-1β in the LV tissue also showed higher values in the GAL-3 wild type compared to GAL-3 KO (53.38 ± 7.66 vs ± 5.99 pg/mg, p=0.21) but did not reach statistical significance (Fig B). We also did immunohistochemical staining of 24 hour MI sections with myeloperoxidase (MPO). MPO is an indicator of neutrophil polymorphs (PMN) presence in tissues and is very important during inflammatory processes, so we used MPO as an inflammatory marker (340). 24 hour MI heart sections are visibly full of PMNs as part of the acute inflammatory response following MI. Both GAL-3 wild type and GAL-3 KO LV sections showed neutrophils expressing MPO. We observed no significant difference in the MPO expression or the number of neutrophil polymorphs between the GAL-3 wild type and GAL-KO heart sections (Fig. 3.35). 125
 left ventricular GAL-3 concentrations at 24 hours post myocardial infarction with corresponding sham operated groups")
149 A. B. Figure 3.33: (A) left ventricular GAL-3 concentrations at 24 hours post myocardial infarction with corresponding sham operated groups in wild type C57BL6 and GAL-3 KO mouse heart. (B) Plasma GAL-3 levels in the same groups (*shows p<0.05). 126
 left ventricular IL-6 (B) IL1β concentrations")
 Plasma IL-6")
150 A. B. C. Figure 3.34: (A) left ventricular IL-6 (B) IL1β concentrations at 24 hours post myocardial infarction in wild type C57BL6 and GAL-3 KO mouse heart and (C) Plasma IL-6 levels in the same groups (*shows p<0.05). 127

151 Table 3.9. IL-6 and IL-1β levels in pg/mg of total protein in LV of wild type and GAL-3 KO mice at 24-hour post MI. Inflammatory markers in the Heart Mean Wild type± S.E pg/mg Mean GAL-3 KO± S.E pg/mg p value IL ± ± * IL-1β ± ± * Denotes p < 0.05, S.E = Standard error of mean Figure 3.35: This figure shows myeloperoxidase (MPO) expression in the neutrophil polymorphs at the site of infarction in the heart sections of GAL-3 wild type (A,B,C) and GAL-3 KO (D,E,F) groups. Arrow heads show neutrophil polymorphs expressing MPO. Streptavidin- biotin immunoperoxidase method (A, B, D, E) and Alexa Fluor 488 immunofluorescent technique (C, F). 128
152 GAL-3 has an anti-apoptotic role at 24 hour post MI time Cleaved Capase-3 activity was measured by ELISA in the tissue homogenate of LV of 24 hour post MI hearts in the wild type and GAL-3 KO mice. Our results show that Cleaved Caspase-3 is significantly raised in the KO group as compared to the wild type ( ± vs ± pg/mg, *p=0.00) (Figure 3.36 B). Immunohistochemical staining of the heart tissue sections showed a granular cytoplasmic and nuclear expression of cleaved caspase-3 in apoptotic cells in the area of infarction in both the GAL-3 wild type and GAL-3 KO groups. The number of apoptotic cells that express Cleaved Caspase-3 in the GAL-3KO group was significantly higher than the wild type group (Fig. 3.37). Immunohistochemical staining of other players of apoptosis was also carried out. The expression of cytochrome c was cytoplasmic mainly seen in the cardiomyocytes but endothelial cells and neutrophil polymorphs also stained positive. We found increased intensity of expression of cytochrome c at 24 hour KO MI group as compared to sham. The number of cardiomyocytes expressing cytochrome c was also higher in the GAL-3 KO group than GAL-3 wild type group (Fig. 3.37). Bcl-2 was expressed by cardiac myocytes and endothelial cells in the area of infarction in GAL-3 wild type mice. While in GAL-3 KO group there was no expression of Bcl2 in the area of infarction (Fig. 3.37). 24 hour post MI time is associated with high proliferative activity in the myocardium so we stained our sections with cyclin D1 to see if raised GAL-3 levels have any relation to the proliferative activity in the heart. Cyclin D1 showed characteristic nuclear expression mainly in the endothelial cells concentrated in the area of infarction. Some Neutrophils also stained positive for 129
 Plasma concentrations of Troponin I at 24 hours post myocardial infarction with corresponding sham operated groups in wild type C57BL6 and GAL-3 KO mouse heart.")
153 A. B. C... Figure 3.36: (A) Plasma concentrations of Troponin I at 24 hours post myocardial infarction with corresponding sham operated groups in wild type C57BL6 and GAL-3 KO mouse heart. (B) left ventricular Cleaved Caspse-3 and (C) Total Akt-1 concentrations at 24 hours post myocardial infarction in wild type C57BL6 and GAL-3 KO mouse heart (*shows p<0.05). 130
 and GAL-3 KO MI heart section (D) expressing cytochrome c in the cytoplasm of cardiomyocytes.")
154 Figure 3.37: Apoptotic markers in myocardial infarction A&B represents low power view of heart sections showing higher expression of cytochrome c in GAL-3 KO MI (B) than GAL-3 wild type MI (A). C&D show high power view of GAL-3 wild type (C) and GAL-3 KO MI heart section (D) expressing cytochrome c in the cytoplasm of cardiomyocytes. The intensity and extent of staining in KO group is higher than the wild type, Streptavidin-biotin immunoperoxidase method. E&F represents low power view of heart sections expressing bcl2 in GAL-3 wild type MI (E) and GAL-3 KO MI (F) groups. G&H are the high power views of these sections showing increase in bcl2 immunostaining in the wild type group (G) compared to GAL-3 KO (H) group, Streptavidin-biotin immunoperoxidase method. I&J represent heart sections from the GAL-3 -wild type MI group showing cleaved caspase-3 expression in apoptotic cells (arrow head)in the area of infarction. K&L represent heart sections from GAL-3 KO MI group showing increase in the number of apoptotic cells expressing cleaved caspase-3 (arrow head). 131
155 cyclin D1. We found no significant difference in the number of cells stained or the intensity of expression between GAL-3 wild type and GAL-3 KO post MI groups (Fig. 3.38). Total Akt-1 was measured in LV tissue homogenates by ELISA and heart sections stained for phospho-akt showed no significant differences between the GAL-3 wild type and GAL-3 KO groups (Fig C) GAL-3 and Oxidative stress Superoxide dismutase (SOD) and Total Glutathione were measured in the LV homogenate and found to be not significantly different between Wild type MI and GAL-3 KO groups (Fig. 3.39) GAL-3 and Troponin I There was no significant difference between the plasma troponin I values between the 24-hour post MI GAL-3 wild type and GAL-3 KO groups. Both of the groups show clear rise of Troponin I as compared to corresponding shams but fail to show any differences between the GAL-3 KO and GAL-3 wild type (Fig A) Discussion The functions of GAL-3 are diverse depending upon its localization within the tissue. It may be extracellular, cytoplasmic or nuclear (107, 108, 110, 111). To understand the precise function of GAL-3 in regulating different biological functions requires that specific in vivo model systems be used (341). Our model is a murine model of MI where the LV has undergone infarction and the LV as a whole is used to look for changes that may have occurred in wild type and GAL-3 KO hearts. 132

156 Figure 3.38: A represents cyclin D1 expression in the heart section for GAL-3 wild type MI group showing a characteristic nuclear expression (arrow heads) in the cardiomyocytes. B show the heart sections from the GAL-3 wild type sham operated group clearly showing a decrease in number of cardiomyocytes expressing cyclin D1. C&D represent the GAL-3 KO MI and GAL-3 KO sham heart sections respectively showing increased number of cardiomyocytes expressing cyclin D1 in MI as compared to the sham group. No difference was observed in the GAL-3 wild type MI and GAL-3 KO MI heart sections. 133
 SOD % inhibition activity and (B) total Glutathione levels in the LV at 24 hours post myocardial")
157 A. B. Figure 3.39: (A) SOD % inhibition activity and (B) total Glutathione levels in the LV at 24 hours post myocardial infarction with corresponding sham operated groups in wild type C57BL6 and GAL-3 KO mouse heart. 134
158 Previously we have shown that after 24 hours of permanent ligation of LAD, the LV tissue of wild type mice showed a significant increase in GAL-3 level in MI group when compared with corresponding sham group and that it was being produced by cardiomyocytes, endothelial cells and neutrophils. This significant increase prompted us to investigate the role of GAL-3 in relation to inflammation and apoptosis in the heart. Our results here show that IL-6 levels were significantly higher in the GAL-3 wild type mice as compared to GAL-3 KO after 24 hours of permanent ligation of LAD. Plasma IL-6 also showed the same pattern of increase as the LV tissue. This means that GAL-3 plays a role in the regulation of IL-6 production in the LV of the heart 24 hours post MI. This was previously seen in breast cancer cells where upregulation of IL-6 involved activation of the Ras/MEK/ERK pathway which was activated by GAL-3 (96). IL-6 role in ischemia and hypoxia is well established. Studies have shown that IL-6 is produced by cultured neonatal cardiac myocytes in response to hypoxic stress (342) and by cardiac myocytes in vitro and in vivo in response to ischemia (343). IL-6 plasma levels have also been shown to be elevated in acute MI after short periods of coronary occlusion (343). Here we report that in the Heart LV the high GAL-3 levels regulate IL-6 production and so point towards its proinflammatory role in MI. Our results did not show any difference in the LV IL-1β levels between GAL-3 wild type and GAL-3 KO mice suggesting that GAL-3 has no regulatory effect on IL-1β at 24 hours post MI time point. Our immunohistochemical staining of neutrophils with MPO in the 24 hour post MI heart sections also showed no significant differences between the number of neutrophil polymorphs between GAL-3 wild type and GAL-3KO. Also the expression of MPO was not different between the two 135
159 groups. A previous study has shown that GAL-3 can directly activate both mouse and human neutrophils (127). GAL-3 KO mice were also shown to produce a reduced inflammatory response after the induction of peritonitis (76) implying that intracellular GAL-3 promoted the survival of inflammatory cells resulting in the prolongation of inflammation (76). Our model did not demonstrate any difference in the neutrophils number or activity between GAL-3 wild type and KO groups which may be due to the difference in the mechanism of disease studied. Here we are studying the infarcted myocardium which may behave in a completely different way than peritonitis, for example. In the immune system, GAL-3 displays both pro- and anti-inflammatory roles depending on the target cell type, whether GAL-3 is acting exogenously or endogenously, its expression level and other inflammatory factors (76). We report here that at 24- hour post MI time GAL-3 has a predominant proinflammatory role in the myocardium. Regarding the role of apoptosis in MI, we know that there are two major apoptotic pathways namely intrinsic and extrinsic pathway. Intrinsic apoptotic signaling causes cytochrome c release from the mitochondria. Cytochrome c in the cytosol initiates the formation of apoptosome, which consists of cytochrome c, caspase adaptor proteins such as Apaf-1, and caspases ( ) and results in caspase activation, a commitment step for apoptosis induction. Extrinsic apoptotic signals are mediated by cell-surface death receptors, including tumor necrosis factor, Fas and TRAIL receptor families. The death domains of the death receptor form the death-inducing signaling complex, where caspases are activated. GAL-3 has been found to be critically involved in apoptosis depending on its subcellular localization. Intracellular GAL-3 can inhibit apoptosis (93) whereas extracellular GAL-3 induces apoptosis (90). Our results show that proapoptotic 136
160 protein like Cleaved caspase-3 and Cytochrome c are significantly high in GAL-3 KO group as compared to GAL-3 wild type. We checked anti apoptotic Bcl-2 and found that its expression is considerably reduced in GAL-3 KO compared to GAL-3 wild type. Our results suggest that at 24 hour post MI time, GAL-3 is controlling the apoptotic pathway by negatively regulating the proapoptotic proteins and increasing the anti-apoptotic bcl-2. Studies have shown that in ischemia induced apoptosis in rats there was a decrease in bcl-2 protein values and an increase in the expression of Bax (336). It has already been shown by us that the level of proapoptotic proteins was significantly higher in MI group compared to sham. We also know that GAL-3 translocates to the perinuclear membrane following apoptotic stimuli (133) (134). It is enriched in the mitochondria and prevents mitochondrial damage and cytochrome c release. Caspase-3 is a critical downstream protease in the apoptotic cascade (347, 348). In this study we show that at 24 hour post MI time GAL-3 is acting as an antiapoptotic molecule which is evident by higher expression of bcl2 in GAL-3 wild type mice when compared with GAL-3 KO mice as well as a lower expression of Cytochrome c in GAL-3 wild type mice than GAL-3 KO mice. This leads to a lower number of apoptotic cells in GAL-3 wild type mice than GAL-3 KO mice. Knocking out GAL-3 gene leads to increase in cleaved caspase -3 activity and apoptotic cells in the area of infarction. To investigate if anti apoptotic activity of GAL-3 is associated with its ability to activate Akt signaling, we checked total Akt-1 levels in LV tissue homogenates. Akt is an anti-apoptotic protein, activated by phospholipid products of phosphatidylinositol 3-kinase (PI3K) and is a downstream target of PI3K in cell survival signaling (349). We found higher levels of Total Akt-1 in the GAL-3 137
161 wild type group compared to the GAL-3KO group but the trend did not reach statistical significance. Thus it is not clear if the anti apoptotic role of GAL-3 at 24 hours post MI time is due to Akt activation. PI3K/AKT pathway can be activated by multiple factors and there are many players that are working at the same time in the infarcted myocardium of the heart, GAL-3 being one of them. We also stained our heart sections for cyclin D1 to see if GAL-3 has any effect on the proliferative activity of 24-hour post MI myocardium. GAL-3 has been shown to activate cyclin D1 which is important for cardiac fibroblast proliferation leading to myocardial fibrosis and heart failure (92). Nuclear GAL-3 expression may cause these effects through enhanced cyclin D1 promoter activity (24). Although cyclin D1 activity was seen to be significantly increased in MI groups as compared to sham operated animals we found no differences between GAL-3 wild type and GAL-3 KO groups suggesting that at this time point post MI GAL-3 does not affect the proliferation of cardiac fibroblast. Our study demonstrates here that at 24 hours after the infarction the high GAL-3 levels in the myocardium are mediating a proinflammatory and anti apoptotic environment that may shape the future course of the disease. Inflammation will cause healing and scarring which if excessive can lead to adverse cardiac remodeling progressing to heart failure (350). Anti apoptotic mechanism in cardiomyocytes on the one hand may be beneficial as it may protect the cardiomyocytes against death and prevent myocyte loss though on the other hand may prove to be deleterious. The rescued cardiomyocytes may not remain functional or may undergo necrosis later or maybe apoptosis is a mechanism by which the heart limits the extent of a more destructive process of necrosis with its accompanying inflammation (337). In addition, inhibition of apoptosis in the 138
162 neutrophil polymorphs can prolong its stay in the infarcted myocardium potentiating the effect of inflammation and destruction (127). Apoptosis can therefore be considered a double edged sword which can work in either way. Considering the Troponin I levels in the plasma of GAL-3 wild type and GAL-3 KO mice we found that the levels were not significantly different in the two groups. Troponin I can be taken as a marker of cardiomyocyte necrosis (351, 352) and can be indirectly linked to the infarct size necrosis (351, 352). We can suggest from this result that GAL-3 may have no effect on infarct size. The level of oxidative stress was also not significantly different between the two groups. Lieberthal et al. showed that the severity and duration of ATP depletion determines the mechanism of death (353). ATP concentration below a certain threshold become necrotic, whereas an ATP value above that threshold induces apoptosis (353) At 24-hour post infarction time the predominant form of cell injury is necrosis. Ischemia/ infarction in cardiomyocytes results in metabolic inhibition with ATP depletion and favors necrotic cell death, whereas metabolic inhibition under ATP replenishing conditions, which happens with ischemia/reperfusion, increases the proportion of apoptotic cells (353, 354). The predominant mode of cell death here in our model is cardiac myocytes coagulative necrosis and so it is very likely that GAL-3 role in apoptosis is not very prominent at 24 hour permanent ligation model. Our previous experimental results have shown that GAL-3 expressed very early after MI may be part of the survival mechanism of the cardiomyocytes after ischemia or infarction. Along the same continuum, other studies have linked GAL-3 to fibrosis and heart failure (138). We, therefore, propose that GAL-3 139
163 should be viewed as regulatory molecule acting in the myocardium at various stages of myocardial infarction Conclusion In conclusion we showed in our study that after 24-hour of permanent ligation of LAD GAL-3 levels are high which regulate proinflammatory and antiapoptotic mechanisms in the myocardium that will shape the future course of the disease. 140
164 Section 6: Galectin-3 reduces myocardial damage in Ischemia/Reperfusion injury 141
165 3.6.1 Background Early and successful myocardial reperfusion after an acute myocardial infarction is the most effective strategy for salvaging the myocardium and improving the clinical outcome. This process of restoring blood flow to the ischemic myocardium can, however, induce myocardial reperfusion injury and can paradoxically reduce the beneficial effects of myocardial reperfusion. The injury results in the death of cardiac myocytes that were viable immediately before myocardial reperfusion (8). This is the reason that despite optimal myocardial reperfusion, the rate of death after an acute myocardial infarction approaches 10% (355), and the incidence of cardiac failure after an acute myocardial infarction is almost 25%. Reperfusion injury can cause four types of cardiac dysfunctions. The first type is myocardial stunning, when despite restoration of coronary flow, the myocardium shows mechanical dysfunction (356). The second type is the noreflow phenomenon, when there is a failure to reperfuse an ischemic area (258, 259). The third type is the reperfusion arrhythmia (357) and the last type is lethal reperfusion injury. The concept of this unique type of injury was first introduced when researchers noticed (358) that a large fraction of cellular enzymes were released not during hypoxia, but on sudden reoxygenation (358) emphasizing the point that reoxygenation of ischemic myocardium generates a degree of myocardial injury that greatly exceeds the injury induced by ischemia alone (358). Experimental studies have shown that the reperfusion of ischemic myocardium generates oxidative stress (359). The generations of reactive oxygen species (ROS) act as the central mediators of ischemia-reperfusion injury. These species can initiate spontaneous, and self-propagating radical reactions with 142
166 biomolecules that can impair myocardial function by activating intracellular proteolytic enzymes and induce cell death by initiating mitochondrial permeability transition (264). O 2 is the parent radical involved in reperfusion (360, 361). This was earlier shown as part of ROS generation in an intact dog model (362). Most cells including cardiomyocytes contain enzymatic antioxidant defense mechanisms that quickly convert ROS to water. These antioxidant systems include superoxide dismutase, catalase, and the glutathione redox system (363). Superoxide dismutase (SOD) is one of the most important antioxidant enzymes, which can be either reduced or oxidized to convert O2 to O2 and H2O2(285) (21). H2O2 is then converted to water by catalase (286) or by the glutathione peroxidase system (287). Experiments using isolated heart models in the presence or absence of superoxide dismutase also showed ROS as likely mediators of reperfusion injury (289, 290). The effectiveness of GSH as an antioxidant is a result of its ability to remove hydrogen peroxide, a reaction catalyzed by GSH peroxidase. The oxidized glutathione (GSSG) is reduced back to GSH by GSH reductase. Glutathione is an important antioxidant (291) and plays an important role in protecting the ischemic myocardium against reperfusion injury (292). Catalase also provides significant antioxidant protection to the myocardium against ischemia reperfusion (297, 298). So far we know that GAL-3 is closely associated with myocardial infarction in the early post MI time point and later with myocardial fibrosis and heart failure. We want to further investigate its role in ischemia-reperfusion injuries as this phenomenon is extremely relevant to the early intervention after acute MI and will open a door to look at this molecule from a new perspective. We have used a 143
167 murine model of Ischemia-reperfusion in the heart where a period of 30 min ischemia was followed by 24 hours of reperfusion Results GAL-3 is increased after Ischemia-reperfusion injury in the heart GAL-3 levels were significantly higher in the LV of GAL-3 wild type mice at 30 min ischemia and 24 hour post reperfusion time point as compared to sham operated mice ( ± vs ± pg/mg, p=0.00) as measured by ELISA (Fig A). Our immunohistochemistry results also show significantly increased expression of GAL-3 in the heart section of IR group as compared to sham operated animals (Fig. 3.41) GAL-3 decreases myocardial injury in IR model To assess the extent of myocardial injury we checked plasma Troponin I levels in GAL-3 Wild type IR group and GAL-3 KO IR group. The results show that Troponin I levels were significantly increased in the plasma of GAL-3 KO IR group as compared to the GAL-3 Wild type IR group (8.97 ± 1.38 vs 3.73 ± 1.17 ng/ml, p=0.012) (Fig B) GAL-3 and oxidative stress in IR To assess the effect of GAL-3 on the oxidative stress we measured the status of the anti oxidant enzymes SOD and Total Glutathione in the LV tissue protein extract in the GAL-3 wild type IR group and GAL-3 KO IR group. Total glutathione levels were significantly raised in the GAL-3 wild type IR group (Fig A) compared to the GAL-3 KO IR group (5.77 ± 0.51 vs 3.13 ± 0.32 nmoles/ mg protein, p=0.001). 144
 left ventricular GAL-3 concentrations in the wild type C57BL6 IR group and GAL-3 KO IR group with")
168 A. B. Figure 3.40: (A) left ventricular GAL-3 concentrations in the wild type C57BL6 IR group and GAL-3 KO IR group with their corresponding shams. (B) Plasma troponin I levels in the same groups (*shows p<0.05). 145
 as well as right ventricular wall (thin arrow) (A).")
169 Figure 3.41: A&B represents low power view of heart sections showing GAL-3 expression in IR group (A) as compared to Sham operated control group (B). Expression is seen as more intense staining in the LV area supplied by LAD (arrow heads) as well as right ventricular wall (thin arrow) (A). C&D show high power view of IR (C) and sham heart section (D) expressing GAL-3 in the cytoplasm of cardiomyocytes (arrow head) and nuclei (thin arrow) (C). The intensity and number of positive staining in IR group is higher than the Sham. Streptavidin- biotin immunoperoxidase method. 146
170 A. B. Figure 3.42: (A) left ventricular Total GSH concentrations in the wild type C57BL6 IR group and GAL-3 KO IR group. (B) left ventricular SOD inhibition activity in the same groups (*shows p<0.05). 147
 in the area supplied by the LAD in GAL-3 wild type IR group (A) as")
171 Figure 3.43 : A&B represent a low power view of heart sections showing a significantly increased expression of catalase (thin arrows) in the area supplied by the LAD in GAL-3 wild type IR group (A) as compared to the GAL-3 KO IR (B) group, Alexa Fluor 488 immunofluorescent labeling. C&D represent high power view of heart section showing cardiomyocytes (thin arrows) and inflammatory cells (arrow heads) expressing catalase in GAL-3 wild type IR group (C). GAL- 3KO IR group shows comparatively fewer cardiomyocytes expressing catalase and mainly expressed by inflammatory cells (arrow heads), Alexa Fluor 488 immunofluorescent labeling. E, shows a high power view of GAL-3 wild type IR group showing catalase expression by cardiomyocytes (arrow heads), inflammatory cells (thin arrows). Some neutrophil polymorphs are surrounding a dead cardiomyocyte (thick arrow). F, represents a corresponding high power view of heart section from the GAL-3 KO IR group with visibly lower catalase expression in cardiomyocytes (thick arrow) and mainly expressed by inflammatory cells (arrow heads). Alexa Fluor 488 immunofluorescent labeling. G&I show the low and high power view of the heart section of the GAL-3 wild type IR group expressing catalase as a diffuse cytoplasmic staining in cardiomyocytes (arrow heads) and endothelial cells (thick arrow). Streptavidin- biotin immunoperoxidase method. H&J represent low and high power views of the GAL-3 KO IR group showing a lower expression of catalase by cardiomyocytes (arrow heads), endothelial cells (thick arrow) and inflammatory cells (thin arrows). Streptavidin- biotin immunoperoxidase method. 148
172 SOD levels were also significantly raised in the GAL-3 wild type IR group as compared to GAL-3 KO IR group ( ± vs ± , p=0.041) (Fig B). Immunohistochemical and immunofluorescent stained sections of the LV show increased expression of catalase in GAL-3 wild IR group than in GAL-3 KO group (Fig. 3.43) GAL-3 role is proinflammatory and anti-apoptotic in IR Cleaved Capase-3 activity was measured by ELISA in the tissue homogenate of LV of 24 hour post MI hearts in the GAL-3 wild type IR and GAL-3 KO IR mice. Our results show that Cleaved Caspase-3 is significantly raised in the GAL- 3 KO group as compared to the GAL-3 wild type ( ± vs ± pg/mg, *p=0.045) (Fig A). Immunohistochemical staining of heart tissue sections showed a granular cytoplasmic and nuclear expression of cleaved caspase-3 in apoptotic cells in the LV, in the area supplied by LAD, in both the GAL-3 wild type IR and GAL-3 KO IR groups. The number of apoptotic cells in the GAL-3KO IR group was higher than the GAL-3 wild type IR group (Fig. 3.45). The expression of cytochrome c was cytoplasmic mainly seen in the cardiomyocytes but endothelial cells and neutrophil polymorphs also stained positive. We found increased intensity of expression of cytochrome c in the LV, in the area supplied by LAD, in GAL-3 wild type IR group and GAL-3 KO IR group as compared to sham. The cardiomyocytes expressing cytochrome c was also comparatively higher by intensity and number of cells in GAL-3 KO IR group than GAL-3 wild type IR group (Fig. 3.45). Immunohistochemical staining of Bcl-2 expression in LV sections have shown Bcl-2 was expressed by cardiac myocytes and endothelial cells in the LV, 149
173 A. B. C. Figure 3.44: (A) left ventricular cleaved caspase-3 in the wild type C57BL6 IR group and GAL-3 KO IR group. (B) left ventricular IL-6 and (C) IL-1β in the same groups (*shows p<0.05). 150
 and GAL-3 KO IR heart section expressing cytochrome c in the cytoplasm of cardiomyocytes.")
174 Figure 3.45: A&B represents low power view of heart sections showing cytochrome c expression in GAL-3 wild type IR (A) and GAL-3 KO IR (B) groups. C&D show high power view of GAL-3 wild type (C) and GAL-3 KO IR heart section expressing cytochrome c in the cytoplasm of cardiomyocytes. The intensity and number of positive staining in KO group is higher than the wild type. Streptavidin- biotin immunoperoxidase method.e&f represents low power view of heart sections expressing bcl2 in GAL-3 wild type IR (E) and GAL-3 KO IR (F) groups. G&H are the high power views of these sections showing increase in bcl2 immunostaining in cardiac myocytes (arrow heads) and endothelial cells (thin arrows) in the GAL-3 wild type group (G) compared to GAL-3 KO (H) group. Streptavidin- biotin immunoperoxidase method. I&J represent high power views of heart sections from the GAL-3 wild type MI group showing cleaved caspase-3 expression in apoptotic cells (arrow heads) in the area of infarction. K&L represent high power views of heart section from the GAL-3 KO MI group showing increase in the number of apoptotic cells expressing cleaved caspase-3, (arrow heads). Streptavidin- biotin immunoperoxidase method. 151
175 in the area supplied by LAD, in GAL-3 wild type IR mice and GAL-3 KO IR mice. The expression of Bcl2 was comparatively higher by intensity and number of cells in GAL-3 wild type mice than in Gal-3 KO mice (Fig. 3.45). IL-6 levels were significantly higher in the LV of GAL-3 wild type IR as compared to GAL-3 KO IR mice (61.22 ± 7.14 vs ± 2.03 pg/mg, p=0.041) as measured by ELISA (Fig B). IL-1β in the LV did not show any difference between the wild type IR compared to GAL-3 KO IR ( ± vs ± pg/mg) (Fig C) We also conducted immunohistochemical staining of IR sections with myeloperoxidase (MPO). MPO is an indicator of neutrophil polymorphs (PMN) presence in tissues and is very important during inflammatory processes, so we used MPO as an inflammatory marker (340). IR heart sections are visibly full of PMNs as part of the acute inflammatory response. Both GAL-3 wild type IR and GAL-3 KO IR LV sections showed neutrophils expressing MPO. We observed no significant difference in the number of MPO expressing neutrophils in the GAL-3 wild type IR as compared to the GAL-KO IR heart sections (Fig. 3.46). 152
 expression in the neutrophil polymorphs at the site of infarction in the heart sections of GAL-3 wild type IR (A,C) and GAL-3 KO IR (B,D)")
176 Figure 3.46: This figure shows myeloperoxidase (MPO) expression in the neutrophil polymorphs at the site of infarction in the heart sections of GAL-3 wild type IR (A,C) and GAL-3 KO IR (B,D) groups. Arrows show expression of MPO by neutrophil polymorphs stained by Streptavidin- biotin immunoperoxidase method (A, B) and Alexa Fluor 488 immunofluorescent technique (C, D). 153
177 3.6.3 Discussion Blumgart et al. (364) reported pathologic observations that extensive infarction occurred when coronary occlusion was maintained for 40 minutes or longer, while occlusions of 5 20 minutes did not result in infarction. With occlusions of intermediate duration, the extent of necrosis depended on the time to reperfusion (365). After 30 minutes of Ischemia followed by 24 hours reperfusion we create an environment where ischemic damage is limited to a time when irreversible damage starts to occur and 24 hour reperfusion time gives adequate time for reperfusion related changes to take place. Our results here show that there is significant increase in GAL-3 levels in the heart LV of IR mice as compared to sham which signifies that GAL-3 plays a role in the ischemia/reperfusion injury in the heart. Most interestingly, we found a significant difference in the plasma levels of troponin I between GAL-3 wild type IR and the GAL-3 KO IR mice groups. We found that the troponin I levels were significantly higher in GAL-3 KO group than the GAL-3 wild type group depicting that GAL-3 is regulating troponin I levels in the IR model. This observation made us explore the cause of this change. In MI where the predominant injury was myocardial necrosis we failed to find a significant difference between troponin I values between GAL-3 wild type and GAL-3 KO groups suggesting that GAL-3 has no obvious role in regulating cardiomyocytes necrosis in 24 hour permanent ligation model. In IR, however, GAL-3 is decreasing the myocardial injury as shown by lower troponin I levels in GAL-3 IR mice. In support of our observation we noticed more anti-apoptotic and less pro-apoptotic protein expression in GAL-3 wild IR group than in GAL-3 KO 154
178 IR group, leading to more apoptotic cells in GAL-3 KO IR group supporting the anti apoptotic role of GAL-3 in IR. Oxidative stress plays a major role in causing IR injuries in the heart. To see if GAL-3 in IR causes any change in the level of anti oxidant enzymes to counter the oxidative stress we tested the SOD levels and Total Glutathione levels in the heart LV and stained the heart sections for catalase. Our results show that both the SOD and Glutathione levels were significantly increased in the GAL-3 wild type IR as compared to the GAL-3 KO IR. This signifies that GAL-3 is associated with an increase in the anti oxidant activity in the IR injured myocardium. The immunohistochemical and immunofluorescent staining results also show higher expression of catalase in GAL-3 wild type IR mice than in GAL-3 KO IR mice which also supports an anti-oxidant role of GAL-3. SOD, Glutathione and catalase are the most important cellular defense mechanism against oxidative injury and are the major intracellular redox buffer in ubiquitous cell types (366) (367). Accumulating evidence suggests that the intracellular redox status regulates various aspects of cellular function (367). GAL-3 actions with regards to oxidative stress are variable. Some studies point to its role as an inducer of ROS, but other studies explain its role as a molecule that is protective against ROS mediated injuries. In an ischemia reperfusion model in the kidney it was shown that ROS production was more prominent in GAL-3 wild type control mice as compared to GAL-3 knockout mice (368). Early data have also demonstrated that GAL-3 could stimulate superoxide production by neutrophils (126) and by monocytes (123). Thus the presence of GAL-3 produces more ROS and more damage. However, here we 155
179 found increased anti-oxidant activity in the LV myocardium after IR in conjunction with less myocardial damage. There can be many explanations for this phenomenon. The function of antioxidant systems is to modify the highly reactive oxygen species to form intermediate which no longer pose a threat to the cell. A balance is essential between oxidation and antioxidant s level in the system for healthy biological integrity to be maintained. In previous studies, ischemia and reperfusion impaired superoxide dismutase activity and decreased cellular glutathione-to-glutathione disulfide ratio suggested that the extent of superoxide anion radical produced at reperfusion exceeded the capacity of endogenous cellular antioxidant systems (288). However, the same oxidative stress can lead to increase in the antioxidant capacity and so the increase we witness in the antioxidant enzymes may be due to the increase in the oxidative stress. This phenomenon was observed in a study by Bandeira et al. when the total SOD activity and the lipid peroxidation were higher in diabetics compared to non-diabetics (369). Another study by Savu et al also showed increase in antioxidant capacity despite high levels of oxidative stress (370). GAL-3 has been reported to interfere with ROS generation (94). It is suggested that GAL-3 might interfere with very early stages of cell death that are associated with perturbation of mitochondrial homeostasis and subsequent formation of ROS. Some studies have indicated GAL-3 to be protective in ischemia reperfusion injuries. It was found to be involved in the kidney regeneration following ischemia reperfusion injury (371). Also, it was shown to play a protective role against liver ischemia reperfusion injury (372). Thus the increase in the anti-oxidant activity linked to GAL-3, observed in the present study, may suggest two possibilities. Either it is the result of a possible adaptive 156
180 response, probably due to the increased production of the oxidative radicals or due to the inherent role of GAL-3 in decreasing oxidative stress. The second possibility holds more weight as this anti-oxidant activity is in conjunction with a lower cleaved caspase-3 and lower Troponin I level in GAL-3 wild IR group when compared with GAL-3 KO group. Our results also point towards a proinflammatory and antiapoptotic activity of GAL-3 in the heart after IR injury. This is in accordance with our results from MI groups Conclusion GAL-3 can interfere with redox pathways controlling cell survival and death and plays a protective a role in the pathogenesis of ischemia reperfusion injury in the heart. 157
181 Section 7: Myocardial Infarction and Myocardial Ischemia-Reperfusion: A Comparison from GAL-3 perspective 158
182 3.7.1 Background Coronary Heart Disease affects the heart due to the detrimental effects of acute myocardial infarction (MI) and Ischemia-reperfusion injury (IR). Understanding the mechanism underlying these two processes is important as these two types of injuries are interrelated as well as different. Prolonging the period of acute myocardial ischemia for more than 20 minutes causes a wave front of cardiomyocyte death that begins in the subendocardium and extends transmurally toward the epicardium (242). This is the reason for why when a patient is presented with an acute myocardial infarction, the most effective therapeutic intervention is timely myocardial reperfusion using thrombolytic therapy or primary percutaneous coronary intervention to salvage the ischemic myocardium. The process of reperfusion, the very event critical for survival, can itself cause injury to the cardiomyocytes, a phenomenon known as the reperfusion injury (8, 243, 263). During acute myocardial ischemia, the lack of oxygen switches the cell metabolism to anaerobic respiration, with lactate accumulation, ATP depletion, Na + and Ca 2+ overload and inhibition of myocardial contractile function (246, 255). Reperfusion results in reactivation of electron transport chain which generates ROS. ROS induces opening of MPTP, contributing to intracellular Ca 2+ overload, lipid peroxidation of cell membrane, and oxidative damage to DNA. In addition there is neutrophil accumulation in response to ROS, cytokines and complement. All these processes can independently induce cardiomyocyte death of the acutely ischemic myocardium (8, 243, 263). Oxidative stress, apoptosis and inflammation are the most important mechanisms that are initiated during ischemia and continue over several hours 159
183 into reperfusion (255). Understanding the contribution of these processes to MI and IR is essential to look for therapeutic measures that can help reduce the myocardial infarct size. In order to investigate these processes, we compared the pathology and the oxidative, apoptotic and inflammatory changes in these two models of MI and IR. Our MI model has permanent LAD ligation for 24 hours and our IR model has LAD ligation for 30 minutes followed by reperfusion for 24 hours Results Histological changes in MI and IR models The main histologic change in acute MI at 24-hour time point is coagulative necrosis of cardiomyocytes with heavy neutrophil polymorphs infiltration (Fig. 3.47). The ischemic cardiomyocytes appear eosinophilic with loss the cross striation and disappearance of the nuclei. LV sections studied 24 hours after IR injury show necrosis of cardiomyocytes with interstitial edema and accumulation of RBCs in the interstitial space with many neutrophil polymorphs infiltration the injured myocardium (Figure 3.48). These features are seen both in wild type mice and in GAL-3 KO mice (Fig. 3.47, 3.48) Inflammatory mediators are raised in the MI model IL-6 levels in the LV of the MI group were significantly raised as compared to the IR group (98.91 ± vs ± 7.14 pg/mg, *p=0.013). Plasma IL-6 was also significantly increased in the MI group as compared to the IR group ( ± vs 59.68±9.61 pg/ml, *p=0.046) (Fig A&B). 160
 and neutrophil")
184 Figure 3.47: A&B represent high power views of wild type MI heart sections showing characteristic ischemic cardiomyocytes appearing eosinophilic with loss of cross striations (thin arrow) and neutrophil polymorphs (arrow heads) flooding the infarcted area. C&D show the corresponding heart sections from GAL-3 KO MI group showing the same changes as stated above. H&E staining method. 161
, RBCs in the interstitial")
185 Figure 3.48: A&B represent high power views of wild type IR heart sections showing injured cardiomyocytes with interstitial edema (thick arrow), RBCs in the interstitial spaces (thin arrow) and neutrophil polymorphs infiltration (arrow heads). C&D show the same histological features in the GAL-3 KO IR heart sections. 162
186 A. B. C. Figure 3.49: (A) left ventricular IL-6 concentrations (B) Plasma IL-6 levels and (C) left ventricular IL-1β concentrations in 24 hour MI and IR groups (*shows p<0.05). 163
187 Heart LV IL-1β concentrations were not significantly different between the groups (Fig C). Immunohistochemical staining of the heart section with Myeloperoxidase (MPO) showed significant differences between the MI and IR groups. The number of neutrophils as well as the intensity of staining was increased in the MI group as compared to the IR group Apoptotic markers are raised in the IR model Heart LV cleaved caspase-3 levels were significantly increased in the IR group as compared to the MI group ( ± vs ± pg/mg protein. *p=0.01) (Fig A) Immunohistochemical staining of the heart sections with cleaved caspase-3 also showed more apoptotic cells in the IR group as compared to the MI group (Figure 3.51). Cytochrome c was also seen to be increased in the heart sections from the IR group as compared to the MI group by immunohistochemistry. The expression is cytoplasmic seen predominantly in cardiomyocytes, but endothelial cells and neutrophil polymorphs also stained positive for it (Fig. 3.51). The anti apoptotic protein Bcl-2 was seen to be expressed by cardiomyocytes and endothelial cells. The expression was higher in the IR compared to the MI groups (Fig. 3.51) Antioxidant enzyme levels in MI and IR models The levels of antioxidant enzymes are not significantly different between the MI group and the IR group. Heart LV Total Glutathione levels was ± 9.41 pg/mg in the MI group as compared to the IR group, which showed ± 3.68 pg/mg. 164
188 A. B. Figure 3.50: (A) left ventricular cleaved caspase-3 concentrations and (B) Plasma troponin I levels in 24 hour MI and IR groups (*shows p<0.05). 165
 and IR heart section expressing cytochrome c in the cytoplasm of cardiomyocytes. The intensity and number of positive staining in IR group is higher than the MI.")
189 Figure 3.51: A&B represents low power view of heart sections showing cytochrome c expression in MI (A) and IR (B) groups. C&D show high power view of MI (C) and IR heart section expressing cytochrome c in the cytoplasm of cardiomyocytes. The intensity and number of positive staining in IR group is higher than the MI. Streptavidin- biotin immunoperoxidase method. E&F represents low power view of heart sections expressing bcl2 in MI (E) and IR (F) groups. G&H are the high power views of these sections showing increase in bcl2 immunostaining in cardiac myocytes (arrow heads) and endothelial cells (thin arrows) in the IR group (G) compared to MI (H) group. Streptavidin- biotin immunoperoxidase method. K&L represent high power views of heart sections from the MI group showing cleaved caspase-3 expression in apoptotic cells (arrow heads) in the area of infarction. I&J represent high power views of heart section from the IR group showing increase in the number of apoptotic cells expressing cleaved caspase-3, (arrow heads). Streptavidin- biotin immunoperoxidase method. 166
 left ventricular Total glutathione concentration and (B) left ventricular SOD")
190 A. B. Figure 3.52: (A) left ventricular Total glutathione concentration and (B) left ventricular SOD % inhibition activity in 24 hour MI and IR groups (*shows p<0.05). 167
shehab Moh Tarek ... ManarHajeer
 3 shehab Moh Tarek... ManarHajeer In the previous lecture we discussed the accumulation of oxygen- derived free radicals as a mechanism of cell injury, we covered their production and their pathologic
Mechanisms of Gene Regulation and Signal! Transduction in Hypoxia!
 Mechanisms of Gene Regulation and Signal! Transduction in Hypoxia! Lorenz Poellinger! Dept. of Cell and Molecular Biology! Karolinska Institutet, Stockholm, Sweden! Normoxia - O 2 availability is in balance
Post-translational modifications of proteins in gene regulation under hypoxic conditions
 203 Review Article Post-translational modifications of proteins in gene regulation under hypoxic conditions 1, 2) Olga S. Safronova 1) Department of Cellular Physiological Chemistry, Tokyo Medical and
renoprotection therapy goals 208, 209
 Subject Index Aldosterone, plasminogen activator inhibitor-1 induction 163, 164, 168 Aminopeptidases angiotensin II processing 64 66, 214 diabetic expression 214, 215 Angiotensin I intrarenal compartmentalization
PHYSIOLOGY AND MAINTENANCE Vol. II Physiological Regulation of Gene Activity by Oxygen (O 2 ) - Juha-Pekka Pursiheimo
 - Juha-Pekka Pursiheimo") PHYSIOLOGICAL REGULATION OF GENE ACTIVITY BY OXYGEN (O 2 ) Juha-Pekka Turku Centre for Biotechnology, Turku, Finland Keywords: Genes, Hypoxia, Hypoxia inducible factor, Erythropoietin, Heart failure, Tumors,
PHYSIOLOGICAL REGULATION OF GENE ACTIVITY BY OXYGEN (O 2 ) Juha-Pekka Turku Centre for Biotechnology, Turku, Finland Keywords: Genes, Hypoxia, Hypoxia inducible factor, Erythropoietin, Heart failure, Tumors,
C H A R A C T E R I Z A T I O N O F T H E N O V E L D O M A I N W I T H N O N A M E G E N E I N C O L O N C A N C E R
 C H A R A C T E R I Z A T I O N O F T H E N O V E L D O M A I N W I T H N O N A M E G E N E I N C O L O N C A N C E R Charleen Rupnarain A dissertation submitted to the Faculty of Science, University of
NFκB What is it and What s the deal with radicals?
 The Virtual Free Radical School NFκB What is it and What s the deal with radicals? Emily Ho, Ph.D Linus Pauling Institute Scientist Department of Nutrition and Food Management Oregon State University 117
BIOL 4374/BCHS 4313 Cell Biology Exam #1 February 13, 2001
 BIOL 4374/BCHS 4313 Cell Biology Exam #1 February 13, 2001 SS# Name This exam is worth a total of 100 points. The number of points each question is worth is shown in parentheses. Good luck! 1. (2) The
Reperfusion Injury: How Can We Reduce It?
 MI/CAD: Practical Question in Management of AMI Patients Reperfusion Injury: How Can We Reduce It? Hyun-Jai Cho, M.D., Ph.D Cardiovascular Center & Department of Internal Medicine Seoul National University
AperTO - Archivio Istituzionale Open Access dell'università di Torino
 AperTO - Archivio Istituzionale Open Access dell'università di Torino From the nucleus to the mitochondria and backthe odyssey of a multitask STAT3 This is the author's manuscript Original Citation: From
In the name of GOD. Animal models of cardiovascular diseases: myocardial infarction & hypertension
 In the name of GOD Animal models of cardiovascular diseases: myocardial infarction & hypertension 44 Presentation outline: Cardiovascular diseases Acute myocardial infarction Animal models for myocardial
1. to understand how proteins find their destination in prokaryotic and eukaryotic cells 2. to know how proteins are bio-recycled
 Protein Targeting Objectives 1. to understand how proteins find their destination in prokaryotic and eukaryotic cells 2. to know how proteins are bio-recycled As a protein is being synthesized, decisions
Supplemental Figure 1. Western blot analysis indicated that MIF was detected in the fractions of
 Supplemental Figure Legends Supplemental Figure 1. Western blot analysis indicated that was detected in the fractions of plasma membrane and cytosol but not in nuclear fraction isolated from Pkd1 null
Molecular Cell Biology Problem Drill 16: Intracellular Compartment and Protein Sorting
 Molecular Cell Biology Problem Drill 16: Intracellular Compartment and Protein Sorting Question No. 1 of 10 Question 1. Which of the following statements about the nucleus is correct? Question #01 A. The
ACTIVATION OF T LYMPHOCYTES AND CELL MEDIATED IMMUNITY
 ACTIVATION OF T LYMPHOCYTES AND CELL MEDIATED IMMUNITY The recognition of specific antigen by naïve T cell induces its own activation and effector phases. T helper cells recognize peptide antigens through
CELL BIOLOGY - CLUTCH CH THE IMMUNE SYSTEM.
 !! www.clutchprep.com CONCEPT: OVERVIEW OF HOST DEFENSES The human body contains three lines of against infectious agents (pathogens) 1. Mechanical and chemical boundaries (part of the innate immune system)
CYTOKINE RECEPTORS AND SIGNAL TRANSDUCTION
 CYTOKINE RECEPTORS AND SIGNAL TRANSDUCTION What is Cytokine? Secreted popypeptide (protein) involved in cell-to-cell signaling. Acts in paracrine or autocrine fashion through specific cellular receptors.
The recruitment of leukocytes and plasma proteins from the blood to sites of infection and tissue injury is called inflammation
 The migration of a particular type of leukocyte into a restricted type of tissue, or a tissue with an ongoing infection or injury, is often called leukocyte homing, and the general process of leukocyte
ROMANIAN ACADEMY INSTITUTE OF CELLULAR BIOLOGY AND PATHOLOGY NICOLAE SIMIONESCU. PhD THESIS Summary
 ROMANIAN ACADEMY INSTITUTE OF CELLULAR BIOLOGY AND PATHOLOGY NICOLAE SIMIONESCU PhD THESIS Summary INVOLVEMENT OF ALARMIN HMGB1 IN INFLAMMATORY PROCESSES ASSOCIATED WITH VASCULAR DYSFUNCTION IN HYPERLIPIDEMIA
Connective tissue CONNECTIVE TISSUE Part I
 Connective tissue CONNECTIVE TISSUE Part I Part 1 Connective Tissue Found everywhere in the body (app. 50% of body weight) Includes the most abundant and widely distributed tissues General features of
Essentials of Anatomy and Physiology, 9e (Marieb) Chapter 3 Cells and Tissues. Short Answer. Figure 3.1
 Chapter 3 Cells and Tissues. Short Answer. Figure 3.1") Essentials of Anatomy and Physiology, 9e (Marieb) Chapter 3 Cells and Tissues Short Answer Figure 3.1 Using Figure 3.1, match the following: 1) The illustration of simple cuboidal epithelium is. Answer:
Essentials of Anatomy and Physiology, 9e (Marieb) Chapter 3 Cells and Tissues Short Answer Figure 3.1 Using Figure 3.1, match the following: 1) The illustration of simple cuboidal epithelium is. Answer:
Subject Index. Bcl-2, apoptosis regulation Bone marrow, polymorphonuclear neutrophil release 24, 26
 Subject Index A1, apoptosis regulation 217, 218 Adaptive immunity, polymorphonuclear neutrophil role 31 33 Angiogenesis cancer 178 endometrium remodeling 172 HIV Tat induction mechanism 176 inflammatory
Cell morphology. Cell organelles structure and function. Chapter 1: UNIT 1. Dr. Charushila Rukadikar
 UNIT 1 Cell morphology Cell organelles structure and function Chapter 1: Dr. Charushila Rukadikar Assistant Professor Department Of Physiology ZMCH, Dahod Physiology The science that is concerned with
COURSE: Medical Microbiology, MBIM 650/720 - Fall TOPIC: Antigen Processing, MHC Restriction, & Role of Thymus Lecture 12
 COURSE: Medical Microbiology, MBIM 650/720 - Fall 2008 TOPIC: Antigen Processing, MHC Restriction, & Role of Thymus Lecture 12 FACULTY: Dr. Mayer Office: Bldg. #1, Rm B32 Phone: 733-3281 Email: MAYER@MED.SC.EDU
ulcer healing role 118 Bicarbonate, prostaglandins in duodenal cytoprotection 235, 236
 Subject Index Actin cellular forms 48, 49 epidermal growth factor, cytoskeletal change induction in mucosal repair 22, 23 wound repair 64, 65 polyamine effects on cytoskeleton 49 51 S-Adenosylmethionine
c Ischemia (30 min) Reperfusion (8 w) Supplementary Figure bp 300 bp Ischemia (30 min) Reperfusion (4 h) Dox 20 mg/kg i.p.
 Reperfusion (8 w) Supplementary Figure bp 300 bp Ischemia (30 min) Reperfusion (4 h) Dox 20 mg/kg i.p.") a Marker Ripk3 +/ 5 bp 3 bp b Ischemia (3 min) Reperfusion (4 h) d 2 mg/kg i.p. 1 w 5 w Sacrifice for IF size A subset for echocardiography and morphological analysis c Ischemia (3 min) Reperfusion (8
a Marker Ripk3 +/ 5 bp 3 bp b Ischemia (3 min) Reperfusion (4 h) d 2 mg/kg i.p. 1 w 5 w Sacrifice for IF size A subset for echocardiography and morphological analysis c Ischemia (3 min) Reperfusion (8
G-Protein Signaling. Introduction to intracellular signaling. Dr. SARRAY Sameh, Ph.D
 G-Protein Signaling Introduction to intracellular signaling Dr. SARRAY Sameh, Ph.D Cell signaling Cells communicate via extracellular signaling molecules (Hormones, growth factors and neurotransmitters
General information. Cell mediated immunity. 455 LSA, Tuesday 11 to noon. Anytime after class.
 General information Cell mediated immunity 455 LSA, Tuesday 11 to noon Anytime after class T-cell precursors Thymus Naive T-cells (CD8 or CD4) email: lcoscoy@berkeley.edu edu Use MCB150 as subject line
T-cell activation T cells migrate to secondary lymphoid tissues where they interact with antigen, antigen-presenting cells, and other lymphocytes:
 Interactions between innate immunity & adaptive immunity What happens to T cells after they leave the thymus? Naïve T cells exit the thymus and enter the bloodstream. If they remain in the bloodstream,
International Graduate Research Programme in Cardiovascular Science
 1 International Graduate Research Programme in Cardiovascular Science This work has been supported by the European Community s Sixth Framework Programme under grant agreement n LSHM-CT-2005-01883 EUGeneHeart.
Structure and Function of Antigen Recognition Molecules
 MICR2209 Structure and Function of Antigen Recognition Molecules Dr Allison Imrie allison.imrie@uwa.edu.au 1 Synopsis: In this lecture we will examine the major receptors used by cells of the innate and
VIII Curso Internacional del PIRRECV. Some molecular mechanisms of cancer
 VIII Curso Internacional del PIRRECV Some molecular mechanisms of cancer Laboratorio de Comunicaciones Celulares, Centro FONDAP Estudios Moleculares de la Celula (CEMC), ICBM, Facultad de Medicina, Universidad
Sphingosine-1-phosphate signaling and cardiac fibrosis. Department of Physiology, Kanazawa University School of Medicine, Kanazawa, Japan
 96 Special Issue: Cellular and Molecular Bases for Fibrotic Diseases Review Article Sphingosine-1-phosphate signaling and cardiac fibrosis Noriko Takuwa 1, 2, ), Yasuo Okamoto 1), Kazuaki Yoshioka 1) and
Cell Quality Control. Peter Takizawa Department of Cell Biology
 Cell Quality Control Peter Takizawa Department of Cell Biology Cellular quality control reduces production of defective proteins. Cells have many quality control systems to ensure that cell does not build
Myocardial Infarction
 Myocardial Infarction MI = heart attack Defined as necrosis of heart muscle resulting from ischemia. A very significant cause of death worldwide. of these deaths, 33% -50% die before they can reach the
University of Milan spin-off founded in 2004 and now fully owned by Genextra S.p.A.
 Mitochondrial Platform Targeting the Permebility Transition Pore Company Overview University of Milan spin-off founded in 2004 and now fully owned by Genextra SpA Focused on identifying and advancing novel
Mechanisms of Cell Injury
 Causes of Cell Injury 1- oxygen deprivation (anoxia) 2- physical agents 3- chemical agents 4- infections agents 5- immunologic reactions 6- genetic defects 7- nutritional imbalances Mechanisms of Cell
Role of Inflammation in Pulmonary Hypertension
 Role of Inflammation in Pulmonary Hypertension K. R. Stenmark University of Colorado Denver, USA Prominent Fibroproliferative Changes are Observed in the Lung Vasculature of Infants With Pulmonary Arterial
Cells & Tissues. Chapter 3
 Cells & Tissues Chapter 3 Cell Theory Cell is structural and functional unit of life Activity of an organism is dependent upon its cells Principle of Complementarity functions of cells are dependent upon
Mechanistic Toxicology
 SECOND EDITION Mechanistic Toxicology The Molecular Basis of How Chemicals Disrupt Biological Targets URS A. BOELSTERLI CRC Press Tavlor & France Croup CRC Press is an imp^t o* :H Taylor H Francn C'r,,jpi
Lecture 14 - The cell cycle and cell death
 02.17.10 Lecture 14 - The cell cycle and cell death The cell cycle: cells duplicate their contents and divide The cell cycle may be divided into 4 phases The cell cycle triggers essential processes (DNA
Robertson Ward, MD. theredoxdoc.com
 Robertson Ward, MD theredoxdoc.com Cell Anatomy = Human Anatomy Cell Membrane = Kidney Nucleus = Brain Endoplasmic Reticulum = Liver Mitochondrion = Lung Vacuole = Colon Lysosome = Stomach Golgi Apparatus
Cell-Derived Inflammatory Mediators
 Cell-Derived Inflammatory Mediators Introduction about chemical mediators in inflammation Mediators may be Cellular mediators cell-produced or cell-secreted derived from circulating inactive precursors,
BIOCHEMICAL EXAMINATION OF ACUTE MYOCARDIAL INFARCTION. Written by Lenka Fialová, translated by Jan Pláteník
 BIOCHEMICAL EXAMINATION OF ACUTE MYOCARDIAL INFARCTION 1 Structure of heart muscle Written by Lenka Fialová, translated by Jan Pláteník Heart muscle (myocardium) is a particular form of striated muscle,
Hematopoiesis. Hematopoiesis. Hematopoiesis
 Chapter. Cells and Organs of the Immune System Hematopoiesis Hematopoiesis- formation and development of WBC and RBC bone marrow. Hematopoietic stem cell- give rise to any blood cells (constant number,
Introduction to pathology lecture 5/ Cell injury apoptosis. Dr H Awad 2017/18
 Introduction to pathology lecture 5/ Cell injury apoptosis Dr H Awad 2017/18 Apoptosis = programmed cell death = cell suicide= individual cell death Apoptosis cell death induced by a tightly regulated
Lymphoid System: cells of the immune system. Answer Sheet
 Lymphoid System: cells of the immune system Answer Sheet Q1 Which areas of the lymph node have most CD3 staining? A1 Most CD3 staining is present in the paracortex (T cell areas). This is towards the outside
Sestrin2 and BNIP3 (Bcl-2/adenovirus E1B 19kDa-interacting. protein3) regulate autophagy and mitophagy in renal tubular cells in. acute kidney injury
 regulate autophagy and mitophagy in renal tubular cells in. acute kidney injury") Sestrin2 and BNIP3 (Bcl-2/adenovirus E1B 19kDa-interacting protein3) regulate autophagy and mitophagy in renal tubular cells in acute kidney injury by Masayuki Ishihara 1, Madoka Urushido 2, Kazu Hamada
Sestrin2 and BNIP3 (Bcl-2/adenovirus E1B 19kDa-interacting protein3) regulate autophagy and mitophagy in renal tubular cells in acute kidney injury by Masayuki Ishihara 1, Madoka Urushido 2, Kazu Hamada
Doctor of Philosophy
 Regulation of Gene Expression of the 25-Hydroxyvitamin D la-hydroxylase (CYP27BI) Promoter: Study of A Transgenic Mouse Model Ivanka Hendrix School of Molecular and Biomedical Science The University of
Innate Immunity. Chapter 3. Connection Between Innate and Adaptive Immunity. Know Differences and Provide Examples. Antimicrobial peptide psoriasin
 Chapter Know Differences and Provide Examples Innate Immunity kin and Epithelial Barriers Antimicrobial peptide psoriasin -Activity against Gram (-) E. coli Connection Between Innate and Adaptive Immunity
Molecular biology :- Cancer genetics lecture 11
 Molecular biology :- Cancer genetics lecture 11 -We have talked about 2 group of genes that is involved in cellular transformation : proto-oncogenes and tumour suppressor genes, and it isn t enough to
MOLECULAR CELL BIOLOGY
 1 Lodish Berk Kaiser Krieger scott Bretscher Ploegh Matsudaira MOLECULAR CELL BIOLOGY SEVENTH EDITION CHAPTER 13 Moving Proteins into Membranes and Organelles Copyright 2013 by W. H. Freeman and Company
Biomarkers in cardiovascular disease. Felix J. Rogers, DO, FACOI April 29, 2018
 Biomarkers in cardiovascular disease Felix J. Rogers, DO, FACOI April 29, 2018 Biomarkers NIH: A biomarker is a characteristic that is objectively measured and evaluated as an indicator of normal biological
Supplementary Figure 1. Confocal immunofluorescence showing mitochondrial translocation of Drp1. Cardiomyocytes treated with H 2 O 2 were prestained
 Supplementary Figure 1. Confocal immunofluorescence showing mitochondrial translocation of Drp1. Cardiomyocytes treated with H 2 O 2 were prestained with MitoTracker (red), then were immunostained with
Lecture 19 Summary Gestational Diabetes and Complications of Diabetes. Gestational diabetes;
 Lecture 19 Summary Gestational Diabetes and Complications of Diabetes Gestational diabetes; - Type of diabetes that only develops during pregnancy Usually diagnosed in late pregnancy Causes high blood
A. Major parts 1. Nucleus 2. Cytoplasm a. Contain organelles (see below) 3. Plasma membrane (To be discussed in Cellular Transport Lecture)
 3. Plasma membrane (To be discussed in Cellular Transport Lecture)") Lecture 5: Cellular Biology I. Cell Theory Concepts: 1. Cells are the functional and structural units of living organisms 2. The activity of an organism is dependent on both the individual and collective
Lecture 5: Cellular Biology I. Cell Theory Concepts: 1. Cells are the functional and structural units of living organisms 2. The activity of an organism is dependent on both the individual and collective
Scott Abrams, Ph.D. Professor of Oncology, x4375 Kuby Immunology SEVENTH EDITION
 Scott Abrams, Ph.D. Professor of Oncology, x4375 scott.abrams@roswellpark.org Kuby Immunology SEVENTH EDITION CHAPTER 13 Effector Responses: Cell- and Antibody-Mediated Immunity Copyright 2013 by W. H.
RAS Genes. The ras superfamily of genes encodes small GTP binding proteins that are responsible for the regulation of many cellular processes.
 ۱ RAS Genes The ras superfamily of genes encodes small GTP binding proteins that are responsible for the regulation of many cellular processes. Oncogenic ras genes in human cells include H ras, N ras,
Antigen presenting cells
 Antigen recognition by T and B cells - T and B cells exhibit fundamental differences in antigen recognition - B cells recognize antigen free in solution (native antigen). - T cells recognize antigen after
Chapter 9. Cellular Signaling
 Chapter 9 Cellular Signaling Cellular Messaging Page 215 Cells can signal to each other and interpret the signals they receive from other cells and the environment Signals are most often chemicals The
Innate Immunity. Connection Between Innate and Adaptive Immunity. Know Differences and Provide Examples Chapter 3. Antimicrobial peptide psoriasin
 Know Differences and Provide Examples Chapter * Innate Immunity * kin and Epithelial Barriers * Antimicrobial peptide psoriasin -Activity against Gram (-) E. coli Connection Between Innate and Adaptive
Research progress on the use of estrogen receptor agonist for treatment of spinal cord injury
 Research progress on the use of estrogen receptor agonist for treatment of spinal cord injury Swapan K. Ray, PhD Professor, Department of Pathology, Microbiology, and Immunology USC School of Medicine,
Cells. Variation and Function of Cells
 Cells Variation and Function of Cells Cell Theory states that: 1. All living things are made of cells 2. Cells are the basic unit of structure and function in living things 3. New cells are produced from
Index. A Action potential duration, increased, by decreases in sodium current,
 Heart Failure Clin 1 (2005) 313 319 Index Note: Page numbers of article titles are in boldface type. A Action potential duration, increased, by decreases in sodium current, 201 202 Adenylyl cyclase, overexpression
Ischemic heart disease
 Ischemic heart disease Introduction In > 90% of cases: the cause is: reduced coronary blood flow secondary to: obstructive atherosclerotic vascular disease so most of the time it is called: coronary artery
Signaling Vascular Morphogenesis and Maintenance
 Signaling Vascular Morphogenesis and Maintenance Douglas Hanahan Science 277: 48-50, in Perspectives (1997) Blood vessels are constructed by two processes: vasculogenesis, whereby a primitive vascular
Cigarette Smoke Exposure and HIV-Related Neurologic Disease Progression Basic Mechanisms and Clinical Consequences
 Cigarette Smoke Exposure and HIV-Related Neurologic Disease Progression Basic Mechanisms and Clinical Consequences Walter Royal, III, MD Professor of Neurology University of Maryland School of Medicine
Gene expression was analyzed by real time PCR (SYBR GREEN PCR Master. Mix, Roche Applied Science) using specific oligonucleotides.
 using specific oligonucleotides.") 1 SUPPLEMENTAL MATERIAL SUPPLEMENT METHODS Real Time PCR. Gene expression was analyzed by real time PCR (SYBR GREEN PCR Master Mix, Roche Applied Science) using specific oligonucleotides. Rat ST2L forward
1 SUPPLEMENTAL MATERIAL SUPPLEMENT METHODS Real Time PCR. Gene expression was analyzed by real time PCR (SYBR GREEN PCR Master Mix, Roche Applied Science) using specific oligonucleotides. Rat ST2L forward
Cell therapy: enhancing the therapeutic potential of cardiac progenitors for delivery post myocardial infarction. Rita Alonaizan
 Cell therapy: enhancing the therapeutic potential of cardiac progenitors for delivery post myocardial infarction Rita Alonaizan Department of Physiology, Anatomy & Genetics St Catherine s College Supervisor:
Significance of the MHC
 CHAPTER 8 Major Histocompatibility Complex (MHC) What is is MHC? HLA H-2 Minor histocompatibility antigens Peter Gorer & George Sneell (1940) Significance of the MHC role in immune response role in organ
INFLAMMATION & REPAIR
 INFLAMMATION & REPAIR Lecture 7 Chemical Mediators of Inflammation Winter 2013 Chelsea Martin Special thanks to Drs. Hanna and Forzan Course Outline i. Inflammation: Introduction and generalities (lecture
In Vivo Animal Models of Heart Disease. Why Animal Models of Disease? Timothy A Hacker, PhD Department of Medicine University of Wisconsin-Madison
 In Vivo Animal Models of Heart Disease Timothy A Hacker, PhD Department of Medicine University of Wisconsin-Madison Why Animal Models of Disease? Heart Failure (HF) Leading cause of morbidity and mortality
Supplementary Figure 1:
 Supplementary Figure 1: (A) Whole aortic cross-sections stained with Hematoxylin and Eosin (H&E), 7 days after porcine-pancreatic-elastase (PPE)-induced AAA compared to untreated, healthy control aortas
Supplementary Figure 1. Spatial distribution of LRP5 and β-catenin in intact cardiomyocytes. (a) and (b) Immunofluorescence staining of endogenous
 and (b) Immunofluorescence staining of endogenous") Supplementary Figure 1. Spatial distribution of LRP5 and β-catenin in intact cardiomyocytes. (a) and (b) Immunofluorescence staining of endogenous LRP5 in intact adult mouse ventricular myocytes (AMVMs)
Supplementary Figure 1. Spatial distribution of LRP5 and β-catenin in intact cardiomyocytes. (a) and (b) Immunofluorescence staining of endogenous LRP5 in intact adult mouse ventricular myocytes (AMVMs)
Scott Abrams, Ph.D. Professor of Oncology, x4375 Kuby Immunology SEVENTH EDITION
 Scott Abrams, Ph.D. Professor of Oncology, x4375 scott.abrams@roswellpark.org Kuby Immunology SEVENTH EDITION CHAPTER 11 T-Cell Activation, Differentiation, and Memory Copyright 2013 by W. H. Freeman and
Zool 3200: Cell Biology Exam 4 Part I 2/3/15
 Name: Key Trask Zool 3200: Cell Biology Exam 4 Part I 2/3/15 Answer each of the following questions in the space provided, explaining your answers when asked to do so; circle the correct answer or answers
Inflammation I. Dr. Nabila Hamdi MD, PhD
 Inflammation I Dr. Nabila Hamdi MD, PhD http://library.med.utah.edu/webpath/exam/m ULTGEN/examidx.htm 2 ILOs Distinguish between acute and chronic inflammation with respect to causes, nature of the inflammatory
Uncovering the mechanisms of wound healing and fibrosis
 Any Questions??? Ask now or contact support support@sabiosciences.com 1-888-503-3187 International customers: SABio@Qiagen.com Uncovering the mechanisms of wound healing and fibrosis Webinar related questions:
10. Which of the following immune cell is unable to phagocytose (a) neutrophils (b) eosinophils (c) macrophages (d) T-cells (e) monocytes
 neutrophils (b) eosinophils (c) macrophages (d) T-cells (e) monocytes") Chapter 2. Acute and chronic inflammation(6): 1. In acute inflammation, which events occur in the correct chronological order? (Remembered from 2000, 2004 exam.) p50 (a) transient vasoconstriction, stasis
Chapter 2. Acute and chronic inflammation(6): 1. In acute inflammation, which events occur in the correct chronological order? (Remembered from 2000, 2004 exam.) p50 (a) transient vasoconstriction, stasis
B-cell. Astrocyte SCI SCI. T-cell
 RF #2015 P-01 PI: Azizul Haque, PhD Grant Title: Targeting Enolase in Spinal Cord Injury 12-month Technical Progress Report Progress Report (First Six Months): Enolase is one of the most abundantly expressed
FOCUS ON CARDIOVASCULAR DISEASE
 The Consequences of Vitamin D Deficiency: FOCUS ON CARDIOVASCULAR DISEASE Vitamin D deficiency is a global health problem. With all the medical advances of the century, vitamin D deficiency is still epidemic.
Aberrant Promoter CpG Methylation is a Mechanism for Lack of Hypoxic Induction of
 Aberrant Promoter CpG Methylation is a Mechanism for Lack of Hypoxic Induction of PHD3 in a Diverse Set of Malignant Cells Abstract The prolyl-hydroxylase domain family of enzymes (PHD1-3) plays an important
VII SYNOPSIS. Cancer is a disease, causes due to failure of control of growth and. cell proliferation mechanisms. There are genetic control systems,
 VII SYPSIS Cancer is a disease, causes due to failure of control of growth and cell proliferation mechanisms. There are genetic control systems, regulate the balance between cell birth and death in response
3.D- Cell Communication
 3.D- Cell Communication Big Idea 3: Living systems store, retrieve, transmit and respond to information essential to life processes. EU 3.A: Heritable information provides for continuity of life. EU 3.B:
1. Cardiomyocytes and nonmyocyte. 2. Extracellular Matrix 3. Vessels שאלה 1. Pathobiology of Heart Failure Molecular and Cellular Mechanism
 Pathobiology of Heart Failure Molecular and Cellular Mechanism Jonathan Leor Neufeld Cardiac Research Institute Tel-Aviv University Sheba Medical Center, Tel-Hashomer שאלה 1 התא הנפוץ ביותר (75%~) בלב
Chapter 11. Cell Communication
 Chapter 11 Cell Communication Overview: The Cellular Internet Cell-to-cell communication Is absolutely essential for multicellular organisms Concept 11.1: External signals are converted into responses
The Endocrine System. I. Overview of the Endocrine System. II. Three Families of Hormones. III. Hormone Receptors. IV. Classes of Hormone Receptor
 The Endocrine System I. Overview of the Endocrine System A. Regulates long term metabolic processes B. Releases hormones from endocrine cells 1. Hormones are chemicals 2. Alter metabolism of cells 3. Release
CELL PARTS TYPICAL ANIMAL CELL
 AP BIOLOGY CText Reference, Campbell v.8, Chapter 6 ACTIVITY1.12 NAME DATE HOUR CELL PARTS TYPICAL ANIMAL CELL ENDOMEMBRANE SYSTEM TYPICAL PLANT CELL QUESTIONS: 1. Write the name of the cell part in the
Cytokines modulate the functional activities of individual cells and tissues both under normal and pathologic conditions Interleukins,
 Cytokines http://highered.mcgraw-hill.com/sites/0072507470/student_view0/chapter22/animation the_immune_response.html Cytokines modulate the functional activities of individual cells and tissues both under
Risk Stratification in Heart Failure: The Role of Emerging Biomarkers
 Risk Stratification in Heart Failure: The Role of Emerging Biomarkers David G. Grenache, PhD Associate Professor of Pathology, University of Utah Medical Director, ARUP Laboratories Salt Lake City, UT
IL-24 AND ITS ROLE IN WOUND HEALING
 IL-24 AND ITS ROLE IN WOUND HEALING Nancy J. Poindexter, Ryan Williams, Garth Powis, Sunil Chada, and Elizabeth A. Grimm & Introgen Therapeutics, Inc., Houston, TX IL-24/MDA 24/MDA-77 is a Tumor Suppressor
Cell Signaling part 2
 15 Cell Signaling part 2 Functions of Cell Surface Receptors Other cell surface receptors are directly linked to intracellular enzymes. The largest family of these is the receptor protein tyrosine kinases,
BIO360 Fall 2013 Quiz 1
 BIO360 Fall 2013 Quiz 1 1. Examine the diagram below. There are two homologous copies of chromosome one and the allele of YFG carried on the light gray chromosome has undergone a loss-of-function mutation.
Chapter 13: Cytokines
 Chapter 13: Cytokines Definition: secreted, low-molecular-weight proteins that regulate the nature, intensity and duration of the immune response by exerting a variety of effects on lymphocytes and/or
CHANTALE T. GUY, M5C. A Thesis. for the Degree. Doctor of Philosophy. McMaster University. (c) Copyright by Chantale T.
 Copyright by Chantale T.") ROLE AND MECHANISM OF ACTION OF TYROSINE KINASES IN MAMMARY TUMORIGENESIS By CHANTALE T. GUY, M5C. A Thesis Submitted to the School of Graduate Studies in Partial Fulfilment of the Requirements for the
ROLE AND MECHANISM OF ACTION OF TYROSINE KINASES IN MAMMARY TUMORIGENESIS By CHANTALE T. GUY, M5C. A Thesis Submitted to the School of Graduate Studies in Partial Fulfilment of the Requirements for the
ACTIVATION AND EFFECTOR FUNCTIONS OF CELL-MEDIATED IMMUNITY AND NK CELLS. Choompone Sakonwasun, MD (Hons), FRCPT
, FRCPT") ACTIVATION AND EFFECTOR FUNCTIONS OF CELL-MEDIATED IMMUNITY AND NK CELLS Choompone Sakonwasun, MD (Hons), FRCPT Types of Adaptive Immunity Types of T Cell-mediated Immune Reactions CTLs = cytotoxic T lymphocytes
ACTIVATION AND EFFECTOR FUNCTIONS OF CELL-MEDIATED IMMUNITY AND NK CELLS Choompone Sakonwasun, MD (Hons), FRCPT Types of Adaptive Immunity Types of T Cell-mediated Immune Reactions CTLs = cytotoxic T lymphocytes
Supplementary data Table S3. GO terms, pathways and networks enriched among the significantly correlating genes using Tox-Profiler
 Supplementary data Table S3. GO terms, pathways and networks enriched among the significantly correlating genes using Tox-Profiler DR CALUX Boys Girls Database Systemic lupus erythematosus 4.4 0.0021 6.7