FDA Briefing Document. Endocrinologic and Metabolic Drugs Advisory Committee (EMDAC) December 14, 2015
|
|
|
- Marshall Lewis
- 6 years ago
- Views:
Transcription
1 FDA Briefing Document Endocrinologic and Metabolic Drugs Advisory Committee (EMDAC) December 14, 2015
2 FOOD AND DRUG ADMINISTRATION (FDA) Center for Drug Evaluation and Research (CDER) Endocrinologic and Metabolic Drugs Advisory Committee (EMDAC) Meeting FDA White Oak Campus, New Hampshire Avenue Building 31 Conference Center, the Great Room (Rm. 1503), Silver Spring, Maryland Disclaimer The attached package contains background information prepared by the Food and Drug Administration (FDA) for the panel members of the advisory committee. The FDA background package often contains assessments and/or conclusions and recommendations written by individual FDA reviewers. Such conclusions and recommendations do not necessarily represent the final position of the individual reviewers, nor do they necessarily represent the final position of the Review Division or Office. We have brought the discussion of the efficacy and safety of the IMProved Reduction of Outcomes: Vytorin Efficacy International Trial (IMPROVE IT) that was submitted to support supplemental new drug applications 21445/S 038 and 21687/S 054, ZETIA (ezetimibe) and VYTORIN (ezetimibe/simvastatin) tablets to this Advisory Committee in order to gain the Committee s insights and opinions, and the background package may not include all issues relevant to the final regulatory recommendation and instead is intended to focus on issues identified by the Agency for discussion by the advisory committee. The FDA will not issue a final determination on the issues at hand until input from the advisory committee process has been considered and all reviews have been finalized. The final determination may be affected by issues not discussed at the advisory committee meeting.
3 FOOD AND DRUG ADMINISTRATION (FDA) Center for Drug Evaluation and Research (CDER) Endocrinologic and Metabolic Drugs Advisory Committee (EMDAC) Meeting FDA White Oak Campus, New Hampshire Avenue Building 31 Conference Center, the Great Room (Rm. 1503), Silver Spring, Maryland Table of Contents I. II. III. Draft Points to Consider Statistical Summary Clinical Summary
4 FOOD AND DRUG ADMINISTRATION (FDA) Center for Drug Evaluation and Research (CDER) Endocrinologic and Metabolic Drugs Advisory Committee (EMDAC) Meeting FDA White Oak Campus, New Hampshire Avenue Building 31 Conference Center, the Great Room (Rm. 1503), Silver Spring, Maryland I. Draft Points to Consider
5 FOOD AND DRUG ADMINISTRATION (FDA) Center for Drug Evaluation and Research (CDER) Endocrinologic and Metabolic Drugs Advisory Committee (EMDAC) Meeting FDA White Oak Campus, New Hampshire Avenue Building 31 Conference Center, the Great Room (Rm. 1503), Silver Spring, Maryland Draft Points to Consider 1. In the IMPROVE-IT trial, 2572 (28.4%) of 9067 patients in the ezetimibe/simvastatin arm and 2742 (30.2%) of 9077 patients in the simvastatin arm had at least one primary composite endpoint event, defined as cardiovascular death, non-fatal myocardial infarction, non-fatal stroke, documented unstable angina requiring hospitalizations, or coronary revascularization (at least 30 days after randomization). According to the primary analysis (intent-to-treat), this yielded a 6.4% relative risk reduction for ezetimibe/simvastatin compared with simvastatin (HR 0.94; 95% CI, ; p=0.016). Provide your interpretation of the efficacy results from the IMPROVE-IT trial. Specifically discuss the magnitude of the observed treatment effect; the robustness of the result of the primary composite endpoint (considering, for example, the extent and pattern of missing follow-up time); and any comments you may have regarding observed effects on components of the primary composite endpoint or secondary endpoints. 2. Multiple subgroup analyses of the primary composite endpoint were specified in the statistical analysis plan. The most notable differences in treatment effect were observed in subgroups defined by age (using a threshold at 75 years), as summarized in the table below. Subgroup n HR (95% CI) P P (interaction) Non-Diabetics (0.91, 1.04) 0.49 Diabetics (0.78, 0.94) Age < (0.91, 1.03) 0.34 Age (0.70, 0.90) Provide your interpretation of these subgroup findings. 3. The applicant has proposed that the results from IMPROVE-IT, which tested the addition of ezetimibe to simvastatin among patients with very recent acute coronary syndrome, can be extrapolated to other clinical situations, such as adding ezetimibe onto any statin among patients with stable coronary heart disease. Discuss the extent to which such extrapolation is reasonable. 4. Discuss the safety findings of the IMPROVE-IT trial. 5. Do the efficacy and safety data from the IMPROVE-IT trial provide substantial evidence to support approval of a claim that adding ezetimibe to statin therapy reduces the risk of cardiovascular events? If so, please comment on your rationale and whether such claim should carry any limits (e.g., whether the data support use in only certain clinical situations or subgroups).
6 FOOD AND DRUG ADMINISTRATION (FDA) Center for Drug Evaluation and Research (CDER) Endocrinologic and Metabolic Drugs Advisory Committee (EMDAC) Meeting FDA White Oak Campus, New Hampshire Avenue Building 31 Conference Center, the Great Room (Rm. 1503), Silver Spring, Maryland II. Statistical Summary

7 U.S. Department of Health and Human Services Food and Drug Administration Center for Drug Evaluation and Research Office of Translational Sciences Office of Biostatistics S TATISTICAL A SSESSMENT OF E FFICACY B ACKGROUND I NFORMATION FOR A DVISORY C OMMITTEE ON THE IMPROVE- IT T RIAL FOR C ARDIOVASCULAR O UTCOMES Statistical briefing material for the Endocrinologic and Metabolic Drugs Advisory Committee. December 14, 2015 Jennifer Clark, PhD Mark Rothmann, PhD Division of Biometrics II Office of Biostatistics Office of Translational Sciences Center for Drug Evaluation and Research U.S. Food and Drug Administration Document Date: November 16, 2015
8 Statistical Briefing Document Jennifer Clark, PhD Table of Contents 1 EXECUTIVE SUMMARY OVERVIEW OF IMPROVE-IT ANALYSIS OF CARDIOVASCULAR OUTCOMES Statistical Methods... 6 Results... 6 MISSING DATA AND SENSITIVITY ANALYSES Characterizing the Missing Data Tipping Point Analysis SUBGROUP RESULTS SUMMARY AND CONCLUDING REMARKS APPENDIX TABLE OF TABLES Table 1: Primary and Secondary Endpoint Results... 4 Table 2: Primary and Secondary Endpoints for IMPROVE-IT... 5 Table 3: Number of Events/Censorings over time... 7 Table 4: Estimated Kaplan-Meier Hazards*... 8 Table 5: Events for Primary Endpoint Components Table 6: Hazard Ratios for Secondary Endpoints Table 7: Follow-up for the Primary Endpoint Table 8: Patient Years for the Primary Endpoint Table 9: Tipping Point Analysis Results Table 10: Distribution of population and events for Diabetes and Age Subgroups Table 11: Subgroup results for Diabetes and Age Table 12: Tipping Point Analysis Results in List Form Table 13: Diabetic and Age Subgroups for MI and stroke endpoints TABLE OF FIGURES Figure 1: Venn-Diagram of Event Overlap between all Endpoints... 6 Figure 2: Kaplan Meier Curves for the Primary Endpoint... 8 Figure 3: Hazard Ratio (95% CI) for Individual Components of the Primary Endpoint Figure 4: Kaplan Meier Plots and Hazard Ratio Results for Secondary Endpoints Figure 5: Last follow-up for the Primary Endpoint in those censored prematurely
9 Statistical Briefing Document Jennifer Clark, PhD 1 EXECUTIVE SUMMARY This large, multinational cardiovascular outcomes study was designed with the main goal of addressing whether the addition of ezetimibe to simvastatin reduces the risk of cardiovascular events for patients having a previous cardiovascular event. The primary endpoint was a composite cardiovascular primary endpoint, which included CV death, nonfatal MI, documented UA requiring admission to the hospital, all coronary revascularization with PCI or CABG at least 30 days after randomization, and nonfatal stroke, with the addition of ezetimibe on top of simvastatin. The estimated hazard ratio for the primary endpoint from the primary analysis was 0.94 with a corresponding 95% confidence interval of (0.89, 0.99). The applicant is seeking the additional proposed indication of reduce the risk of cardiovascular events (cardiovascular death, nonfatal myocardial infarction, nonfatal stroke, hospitalization for unstable angina, or need for revascularization) in patients with coronary heart disease (CHD). Statistical topics, issues and findings for this review include: We will characterize the treatment difference on the individual components of the primary endpoint and whether they may or may not be affected by the addition of ezetimibe. The observed treatment difference on the primary endpoint is primarily driven by differences in the number/rate of MIs and non-fatal strokes. See section for further details. We examine the robustness of the primary analysis results based on the assumptions made on early discontinuation of follow-up for CV events. Much of the early discontinuation of follow-up for CV events began during the first year of patient followup where the CV event rate was the greatest. Approximately 11% of subjects discontinued their follow-up for the primary endpoint early. For further details on this and on tipping point analyses, see section 4.2 We examine the consistency of the observed effect across subgroups of varying CV risk. The observed treatment difference on the primary endpoint was more favorable for patients 75 years old or older and also for patients with diabetes. There was not a favorable observed difference among non-diabetic patients younger than 75. See section 5 for further details. Composite cardiovascular secondary endpoints indicate similar results as the primary endpoint. See section for further details. 3
10 Statistical Briefing Document Jennifer Clark, PhD 2 Overview of IMPROVE-IT The IMProved Reduction of Outcomes: Vytorin Efficacy International Trial (IMPROVE-IT) study was a large multicenter, randomized, double-blind, controlled study in subjects with stabilized high-risk Acute Coronary Syndrome (ACS). All subjects had a qualifying event which established a diagnosis of high-risk ACS before entering the study. A total of 1147 centers treated and monitored the 18,144 subjects. These subjects were randomized 1:1 to either ezetimibe/simvastatin combination, 9067, or simvastatin 40 mg QD, 9077 with stratification by three factors, previous enrollment in EARLY-ACS trial, experience with lipid-lowering therapy, and high-risk ACS diagnosis. The first subject was randomized on October 26, 2005 and the last subject was randomized on July 8, Subjects with a last visit on or after May 1, 2014, or who had an event prior to May 1, 2014 are regarded as having complete information (i.e., nonmissing data) on the CV endpoints and all-cause mortality. The protocol specified all subjects should be followed a minimum of 2.5 years and the trial would continue until at least 5250 primary endpoint events had accrued. This was based on power calculations assuming a 9.375% hazard rate reduction. The actual observed reduction in the hazard rate from the trial was 6.4%. Clinical visits were scheduled at the end of Months 1 and 4 after randomization, and every 4 months thereafter. Those who discontinued from treatment were to be monitored by phone at the same visit schedule for clinical endpoint events until the termination of the trial. Four composite cardiovascular endpoints, one primary and three secondary, were specified in the protocol. Results for these endpoints are given in Table 1. All endpoints were considered statistically significant under the pre-specified Cox model analyses. The breakdown of the components for each of these endpoints is shown in Table 2. A single subject could experience multiple events in each endpoint but the endpoint will only reflect the time until the first event. Table 2 shows the number of first events that occurred for each component which sums to the total number of events in the endpoint. Table 1: Primary and Secondary Endpoint Results Composite Cardiovascular Endpoints HR (95% CI) P- value Primary Endpoint 0.94 (0.89, 0.99) Secondary Endpoint (0.9, 1.00) Secondary Endpoint (0.85, 0.98) Secondary Endpoint (0.90, 1.00)
11 Statistical Briefing Document Jennifer Clark, PhD Table 2: Primary and Secondary Endpoints for IMPROVE-IT First Events (% of Endpoint) Endpoint Primary Endpoint Event Components CV Death EZ/Simva 342 (13.3%) Simva 319 (11.6%) Non-fatal MI 782 (30.4%) 902 (32.9%) Documented UA requiring admission to a hospital All coronary revascularization with PCI or CABG at least 30 days after randomization Non-fatal stroke 117 (4.55%) 107 (3.9%) 1153 (44.8%) 1175 (42.9%) 178 (6.9%) (8.7%) Total Secondary Endpoint 1 All Cause Death 859 (27.8%) (25.4%) Non-fatal MI 782 (25.3%) 902 (27.8%) Documented UA requiring admission to a hospital All coronary revascularization with PCI or CABG at least 30 days after randomization Non-fatal stroke 117 (3.8%) 107 (3.3%) 1153 (37.3%) 1175 (36.2%) 178 (5.8%) 239 (7.4%) (25.2%) (22.6%) 935 (70.7%) 1076 (74.3%) 54 (4.1%) 45 (3.1%) (12.2%) (10.9%) 767 (28.2%) 116 (4.3%) 881 (30.7%) 106 (3.7%) 1332 (49%) 1337 (46.6%) 171 (6.3%) 233 (8.1%) Total Coronary Heart Disease Death Secondary Endpoint 2 Non-fatal MI Urgent Coronary revascularization with PCI or CABG at least 30 days after randomization Total CV Death Secondary Endpoint 3 Non-fatal MI Documented UA requiring admission to a hospital All revascularization (coronary and non-coronary) at least 30 days after randomization Non-fatal stroke Total There is considerable overlap in the components of these endpoints with 41% of the total number of first events in the primary endpoint also making up a portion of all three secondary endpoint. Figure 1 below illustrates the amount of overlap existing for the total number of first events in each of the endpoints using a Venn-diagram. Composite secondary endpoints can be looked at as providing additional supportive evidence for the primary endpoint rather than a new set of information. 5

12 Statistical Briefing Document Jennifer Clark, PhD Figure 1: Venn-Diagram of Event Overlap between all Endpoints 3 Analysis of Cardiovascular Outcomes 3.1 Statistical Methods A Cox proportional-hazard model was pre-specified for the statistical analysis with covariates for treatment and stratification factors, early use of eptifibatide, statin experience, and high-risk ACS diagnosis. The original protocol specified one interim analysis for efficacy to occur once 50% of the expected primary events were reported. A later protocol amendment specified a second at 75%. A third interim analysis for efficacy was done at approximately 85% at the request of the DSMB. The Lan-DeMet approximation to the O Brien-Fleming methodology was pre-specified to adjust for interim analyses. This led to a final alpha of to preserve the type I error rate at the 0.05 level. In addition to the primary composite endpoint for cardiovascular outcomes, three secondary endpoints were also specified with Hochberg s method applied to control the overall type I error. Multiple imputation analyses were performed by the applicant to assess the robustness of the primary analysis results. These analyses made assumptions on the rate of events for each treatment arm for the missing follow-up. Where the analyses tipped to non-statistical significance is provided in section Similar analyses were also performed by the FDA (see section 4.2). 3.2 Results Primary Endpoint Table 3 shows the number of primary endpoint events and censorings occurring during each year of follow-up. Since the last subject was randomized almost four years before study cut-off, all censoring we see in the first three years of the study would not be due to study cut-off. 6
13 Statistical Briefing Document Jennifer Clark, PhD Table 3: Number of Events/Censorings over time Ezetimibe/Simvastatin Simvastatin Year Censored Event Censored Event Total Due to interim analyses, the p-value from the Cox model specified for the primary endpoint had to be less than for the final analysis. The model results for the treatment effect were statistically significant with p=0.016 and a hazard ratio of 0.94 and corresponding 95% confidence interval of (0.89, 0.99). Kaplan-Meier curves for the primary endpoint are shown in Figure 2 with the number at risk each year listed below. Table 4 shows the estimated Kaplan- Meier Hazards, per 100 patient years, for each year of the study. The highest hazard rate occurred in the first year; this was also when the largest number of subjects discontinued followup for those who had missing follow-up time (Figure 5). 7
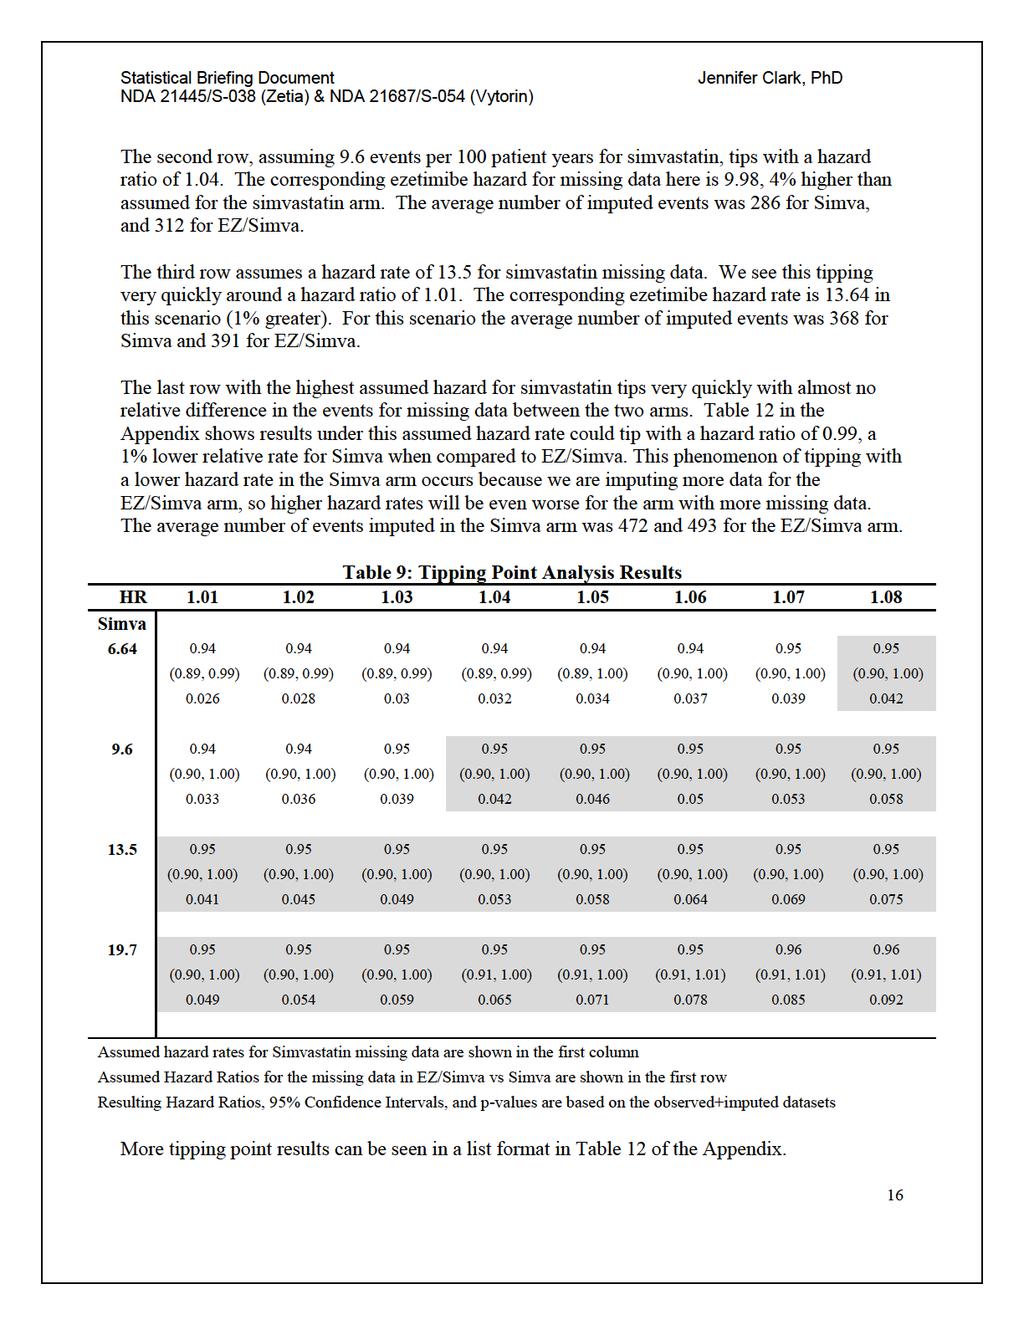
14 Statistical Briefing Document Jennifer Clark, PhD Figure 2: Kaplan Meier Curves for the Primary Endpoint Table 4: Estimated Kaplan-Meier Hazards* Years Hazard Ez/Simva Simva to to to to to to to to 8 *Rates are per 100 patient years Censoring is treated as non-informative A multiple imputation analysis performed by the applicant showed results for this study being statistically non-significant when using an assumed event rate of 6.64 (the estimated event rate in the simvastatin arm) per 100 patient years for those missing in the simvastatin arm, and 7.17 per 100 patient years for the ezetimibe/simvastatin arm. This means the hazard ratio for imputing missing time-to-event data for those who discontinued before study cut-off was approximately 1.08 in their sensitivity analysis. While the estimated hazards from the observed data can be a good guidance for choosing hazards to impute missing data, those subjects who continue treatment and are observed throughout the study will typically be different from those who discontinue a study. A number of factors could potentially cause the hazard ratio for those with missing time-to-event data to be larger than what we see in the observed data. Table 9 contains 8
15 Statistical Briefing Document Jennifer Clark, PhD results we found from running similar multiple imputation analyses. Different assumed event rates and hazard ratios were used to help characterize the missing data in order to find tipping points where the assumed parameters for the missing data will tip the results from statistically significant to non-significant for the primary endpoint. Separate analyses were performed for each of the cardiovascular events making up the composite primary endpoint. Table 5 shows the number of subjects experiencing each of the different cardiovascular events along with the percentage of the treatment arm. Table 2 shows the proportion of first events that each of these components made up for the composite endpoints. Figure 3 provides the hazard ratio and 95% CIs for the primary endpoint, time to CV death, time to first nonfatal MI, time to first MI, time to first hospitalized UA, time to first PCI or CABG at least 30 days after treatment, time to first nonfatal stroke and time till first stroke. Table 5 gives the breakdown of the number of events for each treatment groups. These endpoints were used in separate models to estimate the hazard ratios and 95% confidence intervals shown in Figure 3. Results in these tables indicate that much of the significance that is seen in the primary endpoint is driven by differences in MIs and non-fatal strokes. 9
16 Statistical Briefing Document Jennifer Clark, PhD Table 5: Events for Primary Endpoint Components EZ/Simva Simva Subjects with Events Subjects with Events Primary Endpoint Composite 2572 (28.4%) 2742 (30.2%) CV Death 537 (5.9%) 538 (5.9%) Non-fatal MI 945 (10.4%) 1083 (11.9%) All MI 977 (10.8%) 1118 (12.3%) Hospitalized Unstable Angina 156 (1.7%) 148 (1.6%) PCI or CABG 30 Days after Treatment 1690(18.6%) 1793 (19.8%) Non-fatal Stroke 245 (2.7%) 305 (3.4%) All Strokes 296 (3.3%) 345 (3.8%) Figure 3: Hazard Ratio (95% CI) for Individual Components of the Primary Endpoint The applicant also performed a sensitivity analysis of recurrent events for the primary composite endpoint. Results from their analysis found an estimated event rate ratio or hazard ratio of with 95% confidence interval (0.885, 0.986). Based on an Anderson-Gil model, which was requested by the FDA, the estimated hazard ratio was with 95% confidence interval (0.874, 0.984). The hazard ratio for the first event and the hazard ratio for any event (i.e., for a multiple events analysis) are different parameters, but often have similar values in practice. As a multiple events analysis includes more follow-up and more events, a prime motivation to perform a multiple event analysis is determining a more precise estimate on how two treatment groups compare in their event rates. In this study, however, the estimate of the hazard ratio for any event from the applicant was not more precise than the estimate of the hazard ratio for a first event, which had a 95% confidence interval of (0.887, 0.987). 10
17 Statistical Briefing Document Jennifer Clark, PhD Secondary Endpoints Hochberg s method was stipulated to adjust for multiplicity with the secondary endpoints, defined earlier in Table 2. As the least significant of the secondary endpoints (p=0.035) had a p- value below , all three secondary endpoints were considered statistically significant. Results for each of the secondary endpoints are shown in Table 6 along with Kaplan Meier Curves and hazard ratios for each of the components of the secondary endpoints in Figure 4. The secondary endpoint results were similar to the results in the primary endpoint; differences in the nonfatal MIs and nonfatal strokes seem to be driving most of the differences. Urgent revascularization seems like it could be a factor for some of the efficacy seen in secondary endpoint 2. However, the 510 events in the ezetimibe arm and 626 in the simvastatin arm only translated to 54 (4.1%) first events in ezetimibe and 45 (3.1%) in simvastatin since most subjects experienced a non-fatal MI before the urgent revascularization (Table 2). Table 6: Hazard Ratios for Secondary Endpoints Ezetimibe/Simvastatin Simvastatin Events Censored (%) Events Censored (%) HR (95% CI) Secondary Endpoint (65.9%) (64.2%) 0.95 (0.9, 0.996) Secondary Endpoint (85.4%) (84.1%) 0.91 (0.85, 0.98) Secondary Endpoint (70.1%) (68.4%) 0.95 (0.9, 0.996) P 11
18 Statistical Briefing Document Jennifer Clark, PhD Figure 4: Kaplan Meier Plots and Hazard Ratio Results for Secondary Endpoints 4 Missing Data and Sensitivity Analyses 4.1 Characterizing the Missing Data Characterizing the missing data and how it affects the primary endpoint results is critical when assessing the treatment effect. Follow-up in the form of either a patient visit or phone call was specified to be every four months until study conclusion. Subjects with a last visit on or after May 1, 2014 have complete information (i.e., non-missing data) on the CV endpoints and allcause mortality. Those censored at non-cv death before 5/1/14 were not considered to have missing data for the primary endpoint if they died within a four month window of their last 12
19
20 Statistical Briefing Document Jennifer Clark, PhD Table 8: Patient Years for the Primary Endpoint Total Patient Years for Primary Endpoint EZ/Simva Simva Potential Patient Years Observed (90.9%) (91.4%) Unobserved (9.1%) 3766 (8.6%) Figure 5: Last follow-up for the Primary Endpoint in those censored prematurely 4.2 Tipping Point Analysis The primary analysis model has missing time-to-event for patients whose time was prematurely censored represented by patients in the same treatment group still being followed for an event. The censoring of the patient s time is referred as non-informative censoring. There are 14
21 Statistical Briefing Document Jennifer Clark, PhD approximately 11% of subjects having missing data for the primary endpoints (Table 7) with more subjects missing earlier in the ezetimibe/simvastatin group (Figure 5). This timing is important since we observed a much higher event rate in the first year after randomization than in the rest of the study (Table 4), so it is possible that subjects discontinued follow-up earlier in the study may have a higher event rate than those discontinued later. Approximately 9% of unobserved time in the study will be generated under varying assumptions for this analysis (Table 8). Understanding the qualities of the missing data allows us to make better assumptions about how the missing data could affect analysis results. For this tipping point analysis we must make assumptions on the following parameters: 1. The hazard rate for the missing time in the simvastatin arm and 2. The hazard ratio comparing missing data in the ezetimibe arm to missing data in the simvastatin arm. The data that we impute under these assumptions will be used for the missing data in the study along with the actual observed data. This combined data would give us a full dataset upon which we could perform the primary endpoint analysis. We can vary these assumptions on the missing data to create different scenarios until we see a scenario where the results tip from statistically significant to non-significant. Table 9 shows results from running 2000 imputations for each scenario and compiling the results to attain the hazard ratios, 95% confidence intervals, and p-values shown in the table. The highlighted cells show where results tip to statistically non-significant under the assumed simvastatin event rate and hazard ratio for the missing data. The results tip statistically once we see a p-value exceeding the adjusted alpha rate of (adjusted for interim analyses discussed in section 3.1). Each of the rows in this table represents a different assumed event rate per 100 patient years for the simvastatin arm. The estimated event rate, weighted by previous lipid lowering status, in the observed data was 6.64 events per 100 patient years for the simvastatin arm. When looking at this rate in the pooled subjects who discontinued study treatment but continued with study follow-up, the group of subjects with non-missing data that is probably closest to our missing group, we find a rate of 9.6 events per 100 patient years. The highest observed event rate during the study was during the first year with 13.5 events per 100 patient years. The event rate in the first year for the pooled off-treatment subjects was Results in Table 9 indicate that when we assume a hazard rate of 6.64 per 100 patient years in the missing data for the simvastatin arm, we see the results tipping at a hazard ratio of The corresponding hazard rate for the missing data in the ezetimibe group is 7.17, 8% higher than assumed for the simvastatin arm. The average number of imputed events, averaged over the 2000 imputations for this scenario, was 212 in the Simva arm and 240 in the EZ/Simva arm. 15
22
23 Statistical Briefing Document Jennifer Clark, PhD 5 Subgroup Results Twenty-three subgroups in this study were evaluated. Interpretation of any subgroup analysis should be done with caution. The most notable differences in the observed treatment effect were seen with age and diabetes status. Table 10 shows the distribution for the number of subjects and the percentage of subjects experiencing a primary endpoint event in each of these two subgroups. It is of note that while diabetics only made up 27% of the study population, 36% experienced a primary endpoint event when compared to just 27% of non-diabetics. Similarly, the older, over 75, population only made up 15% of the population but 36% experienced a primary event compared to 28% in the younger subgroup. These smaller subgroups had the largest event rate of all the subgroups with approximately 36% of subjects in both groups experiencing a primary endpoint event. The marked difference in the number of events in each of these subgroups suggests that these are both highly prognostic variables. Table 10: Distribution of population and events for Diabetes and Age Subgroups No Diabetes Diabetes Total <75 n (%) (61.9%) 4113 (22.7%) (84.6%) % with Primary Event 25.7% 34.2% 28% 75 n (%) 1977 (10.9%) 820 (4.5%) 2797 (15.4%) % with Primary Event 32.9% 44.6% 36.4% Total n (%) (72.8%) 4933 (27.2%) % with Primary Event 26.8% 35.9% 5313 Table 11 shows subgroup analysis results for these subgroups as well as further analyses to examine treatment effect in older and younger diabetic populations. Interaction p-values for the diabetes and over 75 subgroups were 0.02 and 0.005, respectively. Combining these groups using three way interactions, we see the highest event rate in the elderly, regardless of diabetes status, and the lowest in younger non-diabetics. 17
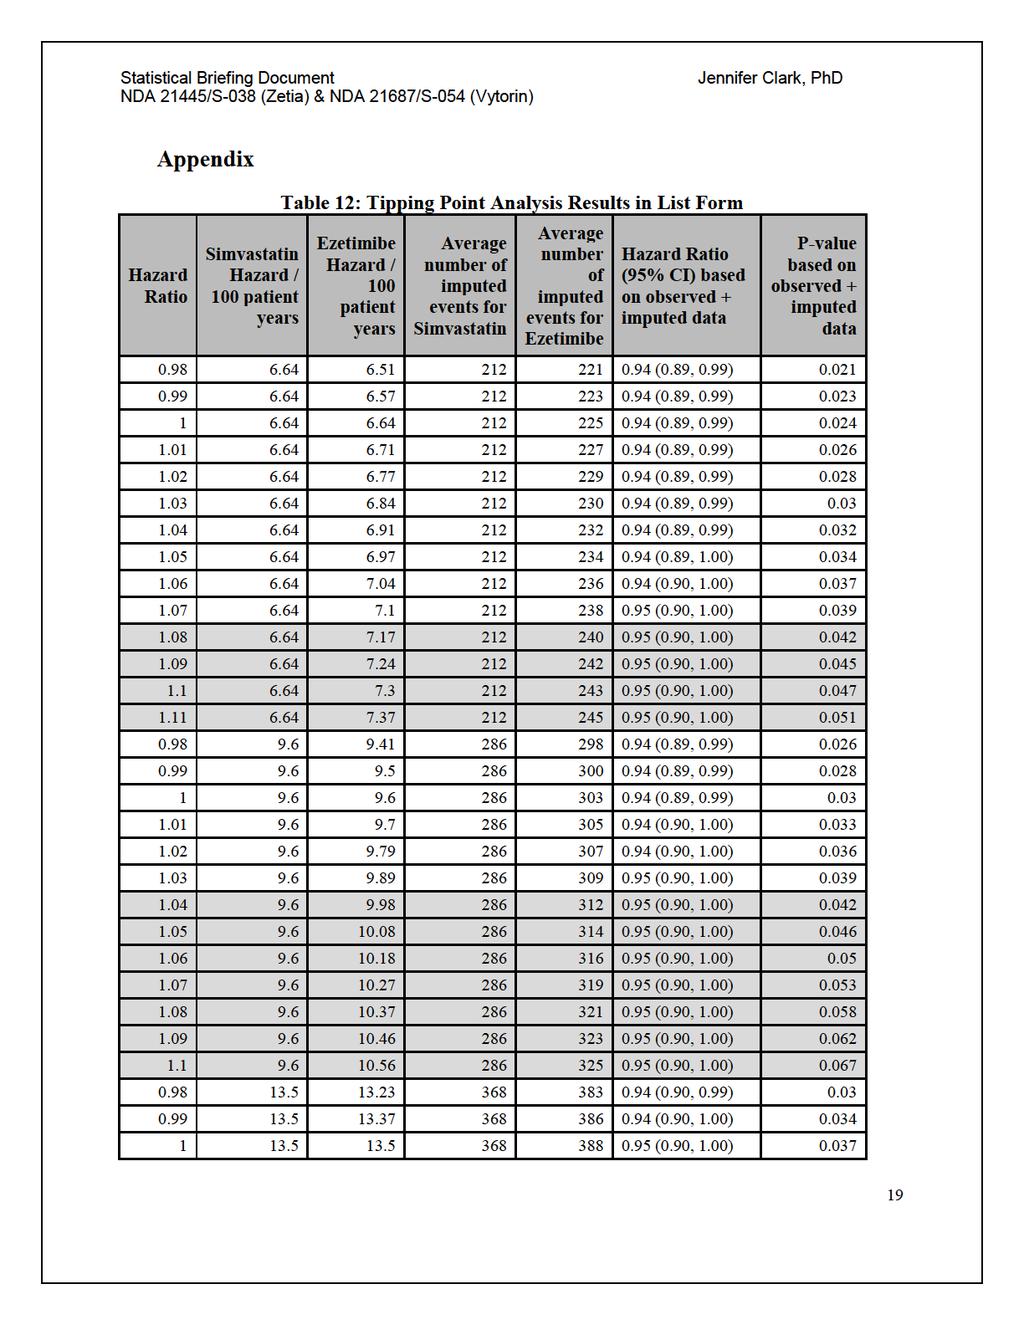
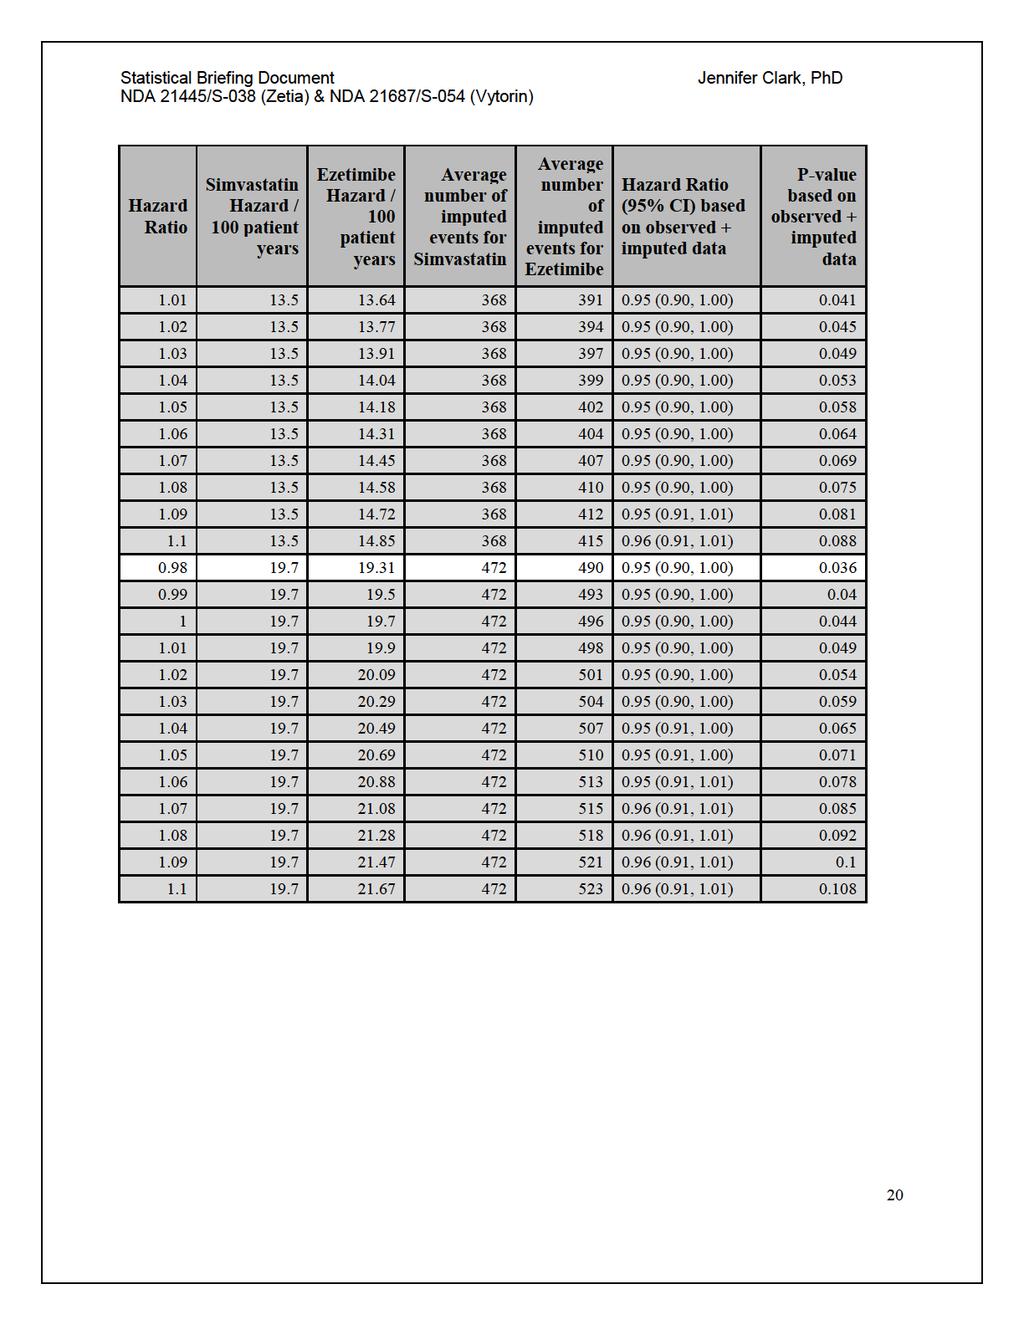
24 Statistical Briefing Document Jennifer Clark, PhD Table 11: Subgroup results for Diabetes and Age Subgroup HR Std Error 95% CL P Non-Diabetics Diabetics Age< Age <75 Non-diabetic <75 Diabetic Non-diabetic Diabetic Similar to what was seen in the primary analysis endpoint, much of the efficacy seen in the subgroups is due to stroke, especially non-fatal stroke, and MI (see Table 13 in the Appendix). 6 Summary and Concluding Remarks The results for the primary cardiovascular endpoint in the IMPROVE-IT trial were statistically significant with a hazard ratio of 0.94 (0.89, 0.99). Differences in the number/rate of events for two of these components, MI and non-fatal stroke are driving the results (Figure 3). Secondary endpoints, which are similar composites of cardiovascular events (Table 2), have similar findings with either one or both MI and non-fatal stroke driving efficacy (Figure 4). The tipping point analysis (Table 9) has results from multiple scenarios where the assumed hazard ratio for the missing data was increased until results tipped from statistically significant to non-significant. Subgroup analysis results suggest a more favorable treatment effect for the diabetic and elderly (at least 75 years old) patients in this study. There was no effect seen among the under 75, nondiabetic subgroup (Table 11), which were a majority of the study population. 18
25
26
27 Statistical Briefing Document Jennifer Clark, PhD Table 13: Diabetic and Age Subgroups for MI and stroke endpoints Endpoint Group N Censored All MI (Fatal or Not) % Censored Hazard Ratio 95% CL Overall Diabetic Non-Diabetic Age Age< Non-Fatal MI Overall Diabetic Non-Diabetic Age Age< Fatal MI Overall Diabetic Non-Diabetic Age Age< All stroke (fatal or non) Overall Diabetic Non-Diabetic Age Age< Non-fatal stroke Overall Diabetic Non-Diabetic Age Age< Fatal Stroke Overall Diabetic Non-Diabetic Age Age<
28 FOOD AND DRUG ADMINISTRATION (FDA) Center for Drug Evaluation and Research (CDER) Endocrinologic and Metabolic Drugs Advisory Committee (EMDAC) Meeting FDA White Oak Campus, New Hampshire Avenue Building 31 Conference Center, the Great Room (Rm. 1503), Silver Spring, Maryland III. Clinical Summary
29 CLINICAL BRIEFING DOCUMENT Endocrinologic and Metabolic Drugs Advisory Committee Meeting December 14, 2015 NDA 21445/S-038: Zetia (ezetimibe) NDA 21687/S-054: Vytorin (ezetimibe and simvastatin) Applicant: MSD International GmbH Clinical Reviewer: Table of Contents 1 EXECUTIVE SUMMARY Product Information & Proposed Indications Other Relevant Background OVERVIEW OF CLINICAL TRIAL REVIEW OF EFFICACY Efficacy Summary Demographics Subject Disposition Analysis of Primary Endpoint Analysis of Secondary Endpoints(s) Other Endpoints Subpopulations Additional Analyses Selected Lipid-related Results REVIEW OF SAFETY Methods Adequacy of Safety Assessments Overall Exposure at Appropriate Doses/Durations and Demographics of Target Populations Routine Clinical Testing Major Safety Results Deaths Nonfatal Serious Adverse Events Dropouts and/or Discontinuations Significant Adverse Events Submission Specific Primary Safety Concerns Supportive Safety Results Common Adverse Events APPENDICES Literature Review/References
30 Table of Tables Table 1: Serious Adverse Events Identified through the Reconciliation Process Table 2: Potential Efficacy Endpoints Identified through Data Reconciliation and Database Locks Table 3: Summary CEC Definition IMPROVE-IT MI and Unstable Angina Requiring Admission to a Hospital Table 4: Investigator-Reported vs. CEC-Confirmed Events Table 5: Major Cardiovascular Events by Treatment Group, ITT Population Table 6: Patient Characteristics, ITT Population Table 7: Patient Medical History Prior to Qualifying Event, ITT Population Table 8: Types of Statins Used Prior to Qualifying Event, ITT Population Table 9: Statin Use/ Potency Prior to Qualifying Event, ITT Population Table 10: Types of Statins Used at Time of Qualifying Event to Randomization, ITT Population Table 11: Statin Use/Potency from Time of Qualifying Event to Randomization, ITT Population Table 12: IMPROVE-IT Disposition of Patients, Reason for Study Drug Discontinuation, and Reason for Study Discontinuation, ITT Population Table 13: Patient Disposition, Reason for Study Drug Discontinuations for Patients who did not Complete Study, ITT Population, Continued Table 14: Summary of Follow-Up Time for Primary Endpoint by Treatment Arm, ITT Population Table 15: Summary of Follow-Up Time for the Primary Composite Endpoint by Treatment Arm, On-Treatment Population Table 16: Primary Efficacy Analysis, ITT Population Table 17: Number Needed to Treat for Primary Efficacy Endpoint Based on Kaplan-Meir Curve, ITT Population Table 18: Types of CEC-Adjudicated Non-fatal Myocardial Infarction That Contributed to the Primary Composite Endpoint Table 19: Investigator-reported Diagnoses for CEC-adjudicated Non-fatal MIs in Primary Composite Table 20: Adjudication Criteria Met for Non-fatal MIs in Primary Composite Table 21: Peak Troponin Values Surrounding Selected Non-procedural MIs (see text) 63 Table 22: Investigator-reported Resolution of Signs/Symptoms for Non-fatal Strokes in Primary Composite Table 23: Investigator-reported Event Types vs. CEC-Adjudicated Stroke Types for Primary Composite Table 24: Adjudication Criteria Met for Unstable Angina Events in Primary Composite 65 Table 25: Analysis of Individual Endpoints: Death from Any Cause, Myocardial Infarction, Stroke and Subsets of those Endpoints, ITT Population Table 26: Types of Myocardial Infarction for All First Myocardial Infarction Events (Nonfatal and Fatal), ITT Population Table 27: Incidence of Hemorrhagic Stroke by Baseline Characteristics, ITT Population
31 Table 28: Analysis of Individual Endpoints: Unstable Angina, Coronary Revascularization and Subsets of those Endpoints, ITT Population Table 29: Summary of All Coronary Revascularization Events by Urgency and Treatment Group Table 30: Sensitivity Analysis of Primary Composite Endpoint with Multiple Imputation of Missing Follow-up Data Table 31: Sensitivity Analysis of the Primary Composite Endpoint, Including All Coronary Revascularization Events, ITT Population Table 32: Sensitivity Analysis of Primary Composite Endpoint: Patients Censored at Time of Simvastatin Titration, ITT Population Table 33: Sensitivity Analysis of Primary Composite Endpoint, On-Treatment Population with Events Censored at 30 Days of Study Drug Discontinuation Table 34: Events Occurring After a Final Visit Date Table 35: Secondary Endpoint: Death from Any Cause, Major Coronary Event, or Nonfatal Stroke, ITT Population Table 36: Secondary Endpoint: CHD Death, Non-fatal MI, or Urgent Coronary Revascularization with PCI or CABG > 30 days after Randomization, ITT Population Table 37: Secondary Endpoint: CV Death, Non-fatal MI, Documented UA requiring Hospitalization, All Revascularization, or Non-fatal Stroke, ITT Population Table 38: Exploratory Composite Endpoint: Cardiovascular death, Non-fatal MI, Nonfatal Stroke, ITT Population Table 39: Exploratory Composite Endpoint: CHD death, Non-fatal MI, or Coronary Revascularization with PCI or CABG 30 Days after Revascularization, ITT Population Table 40: Exploratory Composite Endpoint: CHD death or Non-fatal MI, ITT Population Table 41: Exploratory Composite Endpoint: Cardiovascular death or Non-fatal MI, ITT Population Table 42: Time-weighted Average LDL-C (mg/dl), Age 75 years, ITT Population Table 43: Time-weighted Average LDL-C (mg/dl), Age < 75 years, ITT Population Table 44: Time-weighted Average Triglycerides (mg/dl), Age 75 years, ITT Population Table 45: Time-weighted Average Triglycerides (mg/dl), Age < 75 years, ITT Population Table 46: Time-weighted Average HDL-C (mg/dl), Age > 75 years, ITT Population Table 47: Time-weighted Average HDL-C (mg/dl), Age < 75 years, ITT Population Table 48: Time-Weighted Average for LDL-C (mg/dl), Non-Diabetics, ITT Population 89 Table 49: Time-Weighted Average for LDL-C (mg/dl), Diabetics, ITT Population Table 50: Time-weighted average Triglyceride (mg/dl), Diabetics, ITT Population Table 51: Time-weighted average Triglyceride (mg/dl), Non-Diabetics, ITT Population Table 52: Time-weighted average HDL-C in Diabetics, ITT Population Table 53: Time-weighted average HDL-C in Non-diabetics, ITT Population Table 54: Analysis of Recurrent Events of the Primary Composite Endpoint, ITT Population
32 Table 55: Time between Qualifying LDL-C Level and Randomization (Days) For All Available Qualifying LDL-C Measurements, ITT Population Table 56: Time between Qualifying LDL-C Level and Randomization (Days) for Qualifying LDL-C Measurements Obtained Prior to ACS Event Table 57: Patients Discontinuing Study Medication Due to Two Consecutive LDL-C Measurements 100 mg/dl Table 58: Comparison of LDL-C Values by Study Treatment Status (On-Treatment vs. Off Treatment) and by Treatment Group Table 59: Analysis of Lipids (mg/dl) at 1 Year, Baseline Measured at Time of Qualifying Event, ITT Population Table 60: Analysis of Lipids (mg/dl) and hs-crp (mg/l) as a Time-Weighted Average, Baseline Measured at Time of Randomization, ITT Population Table 61: Analysis of Primary Composite Endpoint Based on LDL-C < 70 mg/l or hs- CRP < 2.0 mg/dl at Month 1, Regardless of Treatment Table 62: Analysis of Primary Composite Endpoint Based on LDL-C < 70 mg/dl or hs- CRP < 2.0 mg/l at Month 4, Regardless of Treatment Table 63: Treatment Differences for Adverse Events of Special Interest, ITT Population Table 64: Overall Study Drug Exposure (Months), ITT Population Table 65: Doses of Simvastatin Taken During IMPROVE-IT, ITT Population Table 66: Duration of Study Drug Exposure by Age Category Table 67: Duration of Study Drug Exposure by Gender Table 68: Duration of Study Drug Exposure by Race Table 69: Routine Laboratory Tests Collected During Study Table 70: Summary of All Deaths, ITT Population Table 71: Summary of CEC Adjudicated Cardiovascular Deaths by System Organ Class and Preferred Term Table 72: Summary of CEC Adjudicated Non-Cardiovascular Deaths by System Organ Class and Preferred Term*, ITT Population Table 73: Summary of Serious Adverse Events, Incidence 2% in Any Treatment Group, ITT Population Table 74: Adverse Events (by SOC) Leading to Study Drug Discontinuation with a Difference of 10 Patients between Treatment Groups Table 75: Summary of CEC Adjudicated Cancer Cases, ITT Population Table 76: Patients with CEC Determined Deaths from New Cancers by Site, ITT Population Table 77: Patients with CEC Adjudicated New, Relapsing, and Progressing Malignancies by Site, ITT Population Table 78: Summary of Muscle-Related Events, ITT Population Table 79: Exposure-adjusted Rate of Myopathy and Rhabdomyolysis by Treatment Group (excluding Patients who Never Took Drug) Table 80: CEC-adjudicated cases of Rhabdomyolysis Table 81: Patients with Myopathy but not Rhabdomyolysis on Study Treatment within 30 days period prior to event Table 82: Patients with Alternate Explanations for Meeting Biochemical Criteria for Drug Induced Liver Injury
33 Table 83: Patients with Aminotransferase, Bilirubin, and Alkaline Phosphatase Elevations, ITT Population Table 84: Exposure-adjusted Rate of Elevations in ALT/AST (>3XULN, consecutive) by Treatment Group and Dose, Excluding Patients Who Never Took Study Drug Table 85: Summary of Liver-Related Deaths, CEC Adjudicated Table 86: Gallbladder Related and Cholecystectomy Analysis, ITT-Population Table 87: Patients with Gallbladder-related Adverse Events, ITT Population Table 88: New Onset Diabetes Mellitus, by Treatment Arm, ITT Population Table 89: Patients with Pancreatitis-Related Adverse Events, ITT-Population Table 90: Patients with Hypersensitivity-Related Adverse Events, ITT Population Table 91: Summary of Acute Renal Failure- Related Adverse Events by Treatment Arm, ITT Population Table 92: Summary of Interstitial Lung Disease- Related Adverse Events by Treatment Arm, ITT Population Table 93: Overall Number and Percent of Patients with an Adverse Event within a System Organ Class, by Treatment Arm, ITT Population Table 94: Preferred Terms under Musculoskeletal and Connective Tissue Disorder by Treatment Arm, ITT Population Table 95: Patients with Adverse Events by System Organ Class and Preferred Terms with an Incidence 2% in Any Treatment Group, ITT Population
34 Table of Figures Figure 1: IMPROVE-IT Study Design Figure 2: Kaplan-Meier Plot for Primary Endpoint, ITT Population Figure 3: Kaplan-Meier Plot of Sensitivity Analysis of Primary Endpoint, On-Treatment with Events Censored 30 Days after Study Drug Discontinuation Figure 4: Kaplan-Meier Curve of Secondary Endpoint: Death from Any Cause, Major Coronary Event, or Non-fatal Stroke, ITT Population Figure 5: Kaplan-Meier Curve of Secondary Endpoint: CHD Death Non-fatal MI, or Urgent Coronary Revascularization with PCI or CABG > 30 days after Randomization, ITT Population Figure 6: Kaplan-Meier Curve Secondary Endpoint: CV Death, Non-fatal MI, Documented UA requiring Hospitalization, All Revascularization, or Non-fatal Stroke, ITT Population Figure 7: Subgroup Analysis of Primary Composite Endpoint with Demographic Characteristics, ITT Population Figure 8: Subgroup Analysis of Primary Endpoint with Lipid Parameters, ITT Population Figure 9: Subgroup Analysis of Primary Composite Endpoint with Medical History, ITT Population Figure 10: Landmark Analysis of Primary Composite Endpoint, ITT Population Figure 11: LDL-C over Time, ITT Population Figure 12: Cumulative Incidence Rate of Any Death due to Malignancy, CEC Adjudicated, ITT Population Figure 13: Cumulative Incidence Rate of Any New, Relapsing, or Progressing Malignancy (Excluding Non-melanotic Skin Cancer) CEC Adjudicated, ITT Population
35 Abbreviation/Term ACS AE AESI ALT ANOVA ANCOVA AST ATP CABG CEC CFR CHD CHF CI CK CK-MB CSR CTD CTT CV DAP DCRI DILI DSMB ECG ecrf EZ/SV HR FSG hs-crp ITT LDL-C LDH LMC LS means MI NA, N/A NCEP NSAID NSTE NSTEMI PCI Intervention PLL SAE Definition Acute Coronary Syndrome Adverse Event Adverse Event of Special Interest Alanine Aminotransferase (SGPT) Analysis of variance Analysis of covariance Aspartate Aminotransferase (SGOT) Adult Treatment Panel CABG Coronary Artery Bypass Grafting Clinical Events Committee Code of Federal Regulations Coronary Heart Disease Congestive Heart Failure Confidence interval Creatine Phosphokinase Creatine Kinase, MB Fraction Clinical study report Clinical Trial Directive Cholesterol Treatment Trialists Cardiovascular Data Analysis Plan Duke Clinical Research Institute Drug Induced Liver Injury Data and Safety Monitoring Board Electrocardiogram Electronic Case Report Form Ezetimibe/Simvastatin Hazard Ratio Fasting serum glucose High sensitivity C-Reactive Protein Intention-to-Treat Low-Density-Lipoprotein Cholesterol Lactate Dehydrogenase LDL-C Monitoring Committee Least-squares means Myocardial Infarction Not Applicable National Cholesterol Education Program Nonsteroidal anti-inflammatory drug Non-ST Segment Elevation Non-ST Segment Elevation Myocardial Infarction Percutaneous Coronary Intervention Prescription Lipid Lowering Serious Adverse Event 7
36 Abbreviation/Term SAP SD SEM SOP STEMI SV TC TIA TIMI ULN UA Definition Statistical analysis plan Standard deviation Standard error of the mean Standard Operating Procedure ST-Elevation Myocardial Infarction Simvastatin Total Cholesterol Transient Ischemic Attack Thrombolysis In Myocardial Infarction Upper limit of normal Unstable Angina 8
37 1 Executive Summary Zetia (ezetimibe) is a non-statin, lipid-lowering drug that was approved in October 2002 based on its LDL-C-lowering efficacy in short duration trials with lipid endpoints. The fixed-combination drug product Vytorin (ezetimibe and simvastatin) was approved in 2004, also on the basis of its ability to modulate lipids. The lack of data regarding the effect of these drugs on cardiovascular outcomes became a subject of controversy with the publication of the ENHANCE trial in 2008, which failed to show a statistically significant reduction in the progression of carotid intima-media thickness among patients with heterozygous familial hypercholesterolemia who were treated with ezetimibe/simvastatin vs. simvastatin alone. Six months later, the SEAS trial called into question both the efficacy and safety of ezetimibe, since there was no statistically significant effect of ezetimibe/simvastatin, compared with placebo, on the primary composite endpoint, and since adverse events related to cancer occurred with greater frequency in the ezetimibe/simvastatin group. The IMPROVE-IT trial, which was ongoing at the time, was expected to provide additional data to further inform both the efficacy and safety of ezetimibe. The IMPROVE-IT (IMProved Reduction of Outcomes: Vytorin Efficacy International Trial) trial was initiated in October 2005 and completed nearly 9 years later (September 2014). The main objective was to evaluate the clinical benefit of ezetimibe/simvastatin combination compared with simvastatin monotherapy in patients with stabilized acute coronary syndrome (ACS) either acute myocardial infarction or documented unstable angina. The trial enrolled 18,144 patients at 1147 centers in 39 countries, randomly assigning them 1:1 to either ezetimibe/simvastatin or simvastatin alone. The primary endpoint was a composite of CV death, major coronary events (defined as non-fatal MI, documented unstable angina that required hospitalization, and all coronary revascularization with either percutaneous coronary intervention [PCI] or coronary artery bypass grafting [CABG] occurring at least 30 days after randomization), and non-fatal stroke. The final protocol called for the trial to continue until 5250 primary endpoint events had accrued and all patients had been followed a minimum of 2.5 years. This was based on power calculations assuming an average between-group difference in LDL-C of 15 mg/dl yielding a 9.375% reduction in hazard. Of the 18,144 patients randomized into the study, 4,416 (24.3%) were female and 13,728 (75.7%) were male. The mean age was 63.6 years. Approximately 84% were Caucasian, 4.3% were Asian, 4.5% were of Spanish descent, 2.8% were Black, and 4.3% were Other. Twenty-one percent of patients had a previously documented MI, and 26.6% had a history of Coronary Heart Disease (CHD), with 29.2% of those exhibiting disease in 3 vessels. A history of diabetes mellitus was reported by 27.2%, 61% had hypertension, and 4% of patients had a previous history of stroke. Mean LDL-C at time of qualifying event was 94 mg/dl. Approximately 2/3 of patients qualified for the study with NSTE-ACS (NSTEMI or unstable angina) and 1/3 qualified with a STEMI event. Of 9
38 note, 64% percent of patients were naïve to lipid lowering therapy prior to their qualifying ACS event. The ITT population included 9,067 patients in the ezetimibe/simvastatin treatment arm and 9,077 patients in the simvastatin treatment arm. Approximately 13.6% patients in the ezetimibe/simvastatin arm and 13.8% patients in the simvastatin arm did not complete the study with a final visit on or after May 1, 2014 (excludes those who died prior to final visit). Results from the primary analysis of the IMPROVE-IT trial suggest that compared to simvastatin, the combination of ezetimibe/simvastatin significantly reduced the risk of the primary composite endpoint by 6.4% (HR 0.936; 95% CI, ; p=0.016). The effect on the primary composite endpoint appears to be driven by effects on nonfatal MI and non-fatal stroke. The absolute risk reduction in this ACS population was 1.8%. The mean LDL-C levels achieved on treatment at year 1 were 72 mg/dl in the simvastatin group and 55 mg/dl in the ezetimibe/simvastatin group. According to the investigators, the relative risk reduction observed is consistent with what one would expect based on the between-group difference in achieved LDL-C. Three pre-specified secondary composite endpoints comprised various combinations of clinical events, many of which overlapped with events composing the primary composite endpoint. In fact, according to the statistical reviewer, approximately 41% of the total number of first events in the primary composite endpoint also contributed to all secondary composite endpoints. Therefore, it is not surprising that effects on the secondary endpoint were quite similar to the primary endpoint. According to the statistical reviewer, 11% of patients were censored for the primary endpoint prior to May 1, Most of this censoring occurred during the first year of a subject s participation in the trial, with more patients in the ezetimibe/simvastatin arm missing follow-up time earlier in the trial than patients in the simvastatin arm. This timing could be important for the interpretation of the possible consequences of this missingness, since there was a much higher event rate during the first year after randomization (approximately 13.5%) than during the rest of the study (range, 5.3% to 2.6%). Therefore, more primary endpoint events may have been missed in the ezetimibe/simvastatin arm than the simvastatin arm. See the statistical review for further discussion of the potential impact of missing data, including tipping point analyses. In this clinical review, the applicant s analyses are presented. The treatment effect for the primary endpoint was assessed across multiple subgroups. The unadjusted interaction p-values for age (< 75 years vs. 75 years) and diabetes (yes vs. no) were p=0.005 and p=0.023, respectively. According to the statistical review, although diabetics only made up 27% of the study population, 36% experienced a primary endpoint event compared to 27% of non-diabetics. Similarly, although the 75 10
39 year-old population only made up 15% of the population, 36% experienced a primary event compared to 28% in the <75 year-old subgroup. A total of 8,851patients were exposed to any dose of ezetimibe/simvastatin, and 8,855 patients were exposed to any dose of simvastatin alone. The mean duration of exposure was 3.8 years in the ezetimibe/simvastatin group and 3.9 years in the simvastatin group. Women had a lower exposure to study drug compared to men (3.6 years vs. 4.3 years, respectively), and patients 65 years-old had a lower exposure than those < 65 years (3.8 years vs. 4.3 years, respectively). Approximately 6% of patients in the ezetimibe/simvastatin treatment arm were uptitrated to ezetimibe/simvastatin 80 mg compared to 27% of patients in the simvastatin treatment arm. The concern regarding cancer raised by the SEAS trial led to changes in the statistical analysis plan, including adjudication of cancer cases by the CEC and pre-specified inferential testing for effects on the incidence of cancer and cancer-related deaths. In IMPROVE-IT, for Any Death due to Malignancy, there were 280 (3.1%) deaths in ezetimibe/simvastatin arm and 272 (3.0%) in the simvastatin arm, with HR (0.873, 1.219), p= Deaths Due to New Malignancy were also similar between treatment arms: 242 (2.7%) in the ezetimibe/simvastatin arm vs. 238 (2.6%) in the simvastatin arm, HR (0.854, 1.221), p= Treatment comparisons were also similar for any new malignancy, whether nonmelanotic skin cancers were excluded (p=0.570) or included (p=0.987). Additionally, treatment comparisons between arms were similar for any new, relapsing, or progressing malignancy (whether including or excluding non-melanotic skin cancer). The HRs for these endpoints are all very near 1.0 (range ), with the upper bounds of the 95% CIs between and Fifty-nine patients experienced a hemorrhagic stroke in the ezetimibe/simvastatin group compared to 43 patients in the simvastatin monotherapy group (HR 1.377, 95% CI , p=0.110). In the on-treatment analysis, which censored events occurring beyond 30 days after the date of permanent discontinuation of study drug, there were 32 hemorrhagic stroke events in the ezetimibe/simvastatin group compared with 34 in the simvastatin group. No association was identified between LDL-C level achieved (at either Month 1 or Month 4) and hemorrhagic stroke. The incidence of CEC-adjudicated myopathy/rhabdomyolysis was similar between patients allocated to ezetimibe/simvastatin vs. simvastatin monotherapy, despite more subjects being exposed to simvastatin 80 mg in the simvastatin monotherapy group. The incidence rates (events per 10,000 patient-years) of myopathy/ rhabdomyolysis were similar between treatment groups among those receiving simvastatin 40 mg as well as between treatment groups among those receiving simvastatin 80 mg. The incidence of patients with consecutive ALT and/or AST values 3xULN was similar between treatment groups. There were patients who met the biochemical criteria for 11
40 drug-induced liver injury, but in all but 3 cases (2 patients in the ezetimibe/simvastatin treatment group, 1 in simvastatin monotherapy group) an alternative explanation for the elevated transaminase level was identified. There was limited information available concerning these three individuals and a definitive assessment could not be made. Safety analyses were also conducted for new onset diabetes. In one analysis, new onset diabetes mellitus was defined as 1) initiation of an anti-diabetic medication during trial or 2) two consecutive fasting glucose 126 mg/dl. Patients were excluded from the analysis if they were previously on an anti-diabetic medication or elevated glucose was noted at randomization (fasting 126 mg/dl or non-fasting 200 mg/dl). The incidence of new onset diabetes in the ezetimibe/simvastatin arm was 13.6% compared with 13.0% in the simvastatin arm, HR 1.04, 95% CI (0.94, 1.15). Other safety analyses did not show any clinically meaningful differences between the two treatment arms. 1.1 Product Information & Proposed Indications Zetia (ezetimibe), which inhibits the intestinal absorption of cholesterol and related phytosterols via inhibition of the sterol transporter Niemann-Pick C1-Like 1 (NPC1L1), was approved in the United States on October 25, Vytorin, which contains ezetimibe and the HMG-CoA reductase inhibitor simvastatin, was initially approved on July 23, Simvastatin was approved on December 23, Zetia is indicated as an adjunct to diet for the following: 1. primary hyperlipidemia a. administered alone, for the reduction of elevated total-c, LDL-C, Apo B, and non-hdl-c in patients with primary (heterozygous familial and nonfamilial) hyperlipidemia; b. administered in combination with a statin, for the reduction of elevated total-c, LDL-C, Apo B, and non-hdl-c in patients with primary (heterozygous familial and non-familial) hyperlipidemia; c. administered in combination with fenofibrate, for the reduction of elevated total-c, LDL-C, Apo B, and non-hdl-c in adult patients with mixed hyperlipidemia 2. homozygous familial hypercholesterolemia (HoFH) a. administered in combination with atorvastatin or simvastatin, for the reduction of elevated total-c and LDL-C levels in patients with HoFH, as an adjunct to other lipid-lowering treatments (e.g., LDL apheresis) or if such treatments are unavailable 3. homozygous sitosterolemia a. for the reduction of elevated sitosterol and campesterol levels in patients with homozygous familial sitosterolemia The current Zetia label includes the following limitation of use: The effect of ZETIA on cardiovascular morbidity and mortality has not been determined. 12
41 Simvastatin is indicated as an adjunct to diet for the following: 1. reduction in risk of coronary heart disease (CHD) mortality and cardiovascular events a. In patients at high risk of coronary events because of existing CHD, diabetes, peripheral vessel disease, history of stroke or other cerebrovascular disease, simvastatin is indicated to reduce the risk of total mortality by reducing CHD deaths; reduce the risk of nonfatal myocardial infarction and stroke; and reduce the need for coronary and non-coronary revascularization procedures; 2. hyperlipidemia a. reduce elevated total-c, LDL-C, Apo B, and TG, and to increase HDL-C in patients with primary hyperlipidemia (Fredrickson type IIa, heterozygous familial and nonfamilial) or mixed dyslipidemia (Fredrickson type IIb); b. reduce elevated TG in patients with hypertriglyceridemia (Fredrickson type IV hyperlipidemia); c. reduce elevated TG and VLDL-C in patients with primary dysbetalipoproteinemia (Fredrickson type III hyperlipidemia); d. reduce total-c and LDL-C in patients with HoFH as an adjunct to other lipid-lowering treatments (e.g., LDL apheresis) or if such treatments are unavailable; Currently, Vytorin is indicated as an adjunct to diet for: 1. the reduction of elevated total-c, LDL-C, Apo B, TG, and non-hdl-c, and to increase HDL-C in patients with primary (heterozygous familial and non-familial) hyperlipidemia or mixed hyperlipidemia; and 2. the reduction of elevated total-c and LDL-C in patients with homozygous familial hypercholesterolemia, as an adjunct to other lipid-lowering treatments (e.g., LDL apheresis) or if such treatments are unavailable. The current Vytorin label includes the limitation that no incremental benefit of Vytorin on cardiovascular morbidity and mortality over and above that demonstrated for simvastatin has been established. The applicant has submitted the results from the IMPROVE-IT trial to support new indications for both Zetia and Vytorin. Although IMPROVE-IT studied patients with stabilized ACS and only used simvastatin as the background statin, the Applicant has proposed the following indication for Zetia: Zetia, administered in combination with an HMG-CoA reductase inhibitor (statin), is indicated to reduce the risk of cardiovascular events (cardiovascular death, nonfatal myocardial infarction, nonfatal stroke, hospitalization for unstable angina, or need for revascularization) in patients with coronary heart disease (CHD). The Applicant has also proposed the following indication for Vytorin: 13
42 Vytorin is indicated to reduce the risk of cardiovascular events (cardiovascular death, nonfatal myocardial infarction, nonfatal stroke, hospitalization for unstable angina, or need for revascularization) in patients with coronary heart disease (CHD). To date, no lipid-modulating drug has been indicated as an adjunct to statin therapy for the reduction of cardiovascular events. As shown in the prescribing information for Zetia (ezetimibe), when Zetia was added to ongoing statin therapy in a multicenter, double-blind, placebo-controlled, 8-week study of 769 patients with primary hyperlipidemia, LDL-C was reduced an average of 21%, compared with placebo, from the statin-treated baseline. In this trial, 40% of patients were receiving background atorvastatin, 31% simvastatin, and 29% others (pravastatin, fluvastatin, cerivastatin, and lovastatin). Rosuvastatin and pitavastatin were not available at the time that Zetia was approved. 1.2 Other Relevant Background The lack of clinical outcomes data for Zetia and Vytorin has been the focus of controversy, and the publication of the ENHANCE and SEAS trials in 2008 stimulated much debate. ENHANCE was a multicenter, double-blind, randomized, placebocontrolled trial in which 725 adults with heterozygous familial hypercholesterolemia were assigned to daily simvastatin (80 mg) in combination with either placebo or ezetimibe (10 mg). The primary outcome was the change in the mean carotid-artery intima-media thickness (CIMT) from baseline to 24 months. By 24 months, mean LDL had decreased from 318 mg/dl to 193 mg/dl (-39%) in the simvastatin-only group and from 319 mg/dl to 141 mg/dl (-56%) in the ezetimibe/simvastatin group. Despite the incremental LDL reduction with the addition of ezetimibe, this trial failed to detect a statistically significant difference in CIMT at 24 months (mean change from baseline: ± mm vs ± mm for simvastatin monotherapy and ezetimibe/simvastatin, respectively; p=0.29). Despite several reasonable hypotheses to explain this result, the possibility remained that lowering LDL with ezetimibe/simvastatin yields outcomes distinct from lowering LDL with simvastatin alone. SEAS was a multicenter, double-blind, randomized, placebo-controlled trial in which 1873 adults with mild-to-moderate, asymptomatic aortic stenosis were assigned to daily ezetimibe/simvastatin (10/40 mg) or placebo. Among the exclusion criteria were diabetes mellitus, current lipid-lowering therapy, and established coronary, cerebral, or peripheral vascular disease. The primary composite outcome of major cardiovascular events included death from cardiovascular causes, aortic-valve replacement, congestive heart failure resulting from progression of aortic-valve stenosis, nonfatal MI, hospitalization for unstable angina, CABG, PCI, or nonhemorrhagic stroke. By 8 weeks, mean LDL had decreased from 140 mg/dl to 53 mg/dl (-61%) in the ezetimibe/simvastatin group. During a median follow-up of 4.4 years, there was no evidence for a statistically significant difference between groups with regard to the 14
43 primary outcome (HR 0.96; 95% CI ; p=0.59). There was a suggestion, however, that ezetimibe/simvastatin may reduce the risk of ischemic events, a secondary composite outcome (HR 0.78; 95% CI ; p=0.02). Regardless of the interpretation of this result, the SEAS design precluded isolating the effect of ezetimibe. Not only did the SEAS trial strengthen the debate questioning the efficacy of ezetimibe to improve clinical outcomes, the trial also called its safety into question by generating the hypothesis that ezetimibe/simvastatin may increase the risk for cancer. Cancer was reported in 105 patients (11.1%) in the ezetimibe/simvastatin group and in 70 patients (7.5%) in the placebo group. In addition, 39 patients (4.1%) died from cancer in the ezetimibe/simvastatin group compared with 23 (2.5%) in the placebo group; this suggested a 67% increase in the relative risk of cancer-related death among those treated with ezetimibe/simvastatin (HR 1.67; 95% CI ; p=0.05). There was a qualitatively similar imbalance in incident cancer diagnoses. These data seemed to conflict with the totality of evidence from randomized trials involving statins. To test the hypothesis that ezetimibe may increase the risk for cancer, Peto et al. analyzed unblinded interim data regarding cancer from 20,617 patients randomized in the thenongoing SHARP and IMPROVE-IT trials. During a combined 36,501 person-years, 313 cancers occurred among patients assigned to an ezetimibe-containing regimen and 326 cancers among patients not taking ezetimibe (p=0.61). There was neither a suggestion of site-specificity nor a trend in the relative risk for cancer death over time. Based on a review of these studies, FDA issued a drug safety communication expressing the belief that it is unlikely that Vytorin or Zetia increase the risk of cancer or cancer-related death (December 22, 2009). SHARP was a multinational, randomized, placebo-controlled, double-blind trial that investigated the effect of ezetimibe/simvastatin 10/20 mg, compared with placebo, on the time to a first major vascular event (MVE) among 9,438 patients with moderate to severe chronic kidney disease (~1/3 on dialysis at baseline) who did not have a history of myocardial infarction or coronary revascularization. An MVE was defined as nonfatal MI, cardiac death, stroke, or any revascularization procedure. The median follow-up duration was 4.98 years, and the median estimated GFR was approximately 26 ml/min/1.73m 2. Eligibility did not depend on lipid levels; mean baseline LDL-C was 108 mg/dl. In the primary ITT analysis, patients initially allocated to ezetimibe/simvastatin had a 16% relative risk reduction of MVE (risk ratio 0.85; 95% CI ; p=0.001) in the overall population. Cancer was diagnosed during the trial in 9.4% and 9.5% of patients assigned to ezetimibe/simvastatin and placebo, respectively. The study design precluded drawing conclusions regarding the independent contribution of either ezetimibe or simvastatin to the observed effect on the reduction of risk of major vascular events. On this background, the results of IMPROVE-IT have been long-awaited to determine whether ezetimibe, when added to simvastatin, reduces cardiovascular risk. 15
44 2 Overview of Clinical Trial In support of the proposed indication, the Applicant submitted the results of a single trial entitled Improved Reduction of Outcomes: Vytorin Efficacy International Trial (IMPROVE-IT). The trial enrolled 18,144 patients at 1,147 sites in 39 countries. Trial Administrative Structure Study Coordinating Centers The Thrombolysis in Myocardial Infarction (TIMI) Study Group is an Academic Research Organization (ARO) of the Brigham and Women s Hospital and Harvard Medical School. Specific responsibilities for the IMPROVE-IT trial included: Leadership on the design of the protocol; Management of the safety desk for serious adverse experience (SAE) reporting; Management of the Clinical Endpoints Committee (CEC); Management of the Data and Safety Monitoring Board (DSMB); Management and monitoring of selected North American sites in US and Canada Management of the Lipid Monitoring Committee (LMC) Oversight of Worldwide Clinical Trials (WCT) Clinical Research Organization The Duke Clinical Research Institute (DCRI) is an ARO of Duke University Medical Center. Specific responsibilities included: Leadership on the design of the protocol; Management of the study database and programming for data displays; Management and monitoring of selected North American sites in US and Canada. Oversight of the Clinsys (Clinical Research Organization in India) Executive Committee/ Steering Committee An Executive Committee was responsible for the trial design and conduct, including the development of protocol amendments. The Executive Committee was composed of representatives from Thrombolysis in Myocardial Infarction (TIMI), the Duke Clinical Research Institute (DCRI), and the Applicant (Merck). A Steering Committee, which consisted of Executive Committee members and designated representatives of the Study Investigators (National Lead Investigators), was chaired by Dr. Eugene Braunwald and Dr. Robert Califf, and was created to provide clinical guidance on implementation and conduct of the study, and on interpretation of results. Data Safety Monitoring Board (DSMB) An independent DSMB analyzed the safety results, the overall rate of clinical endpoint events, and the efficacy findings at specific intervals. Per the Charter, the full DSMB was scheduled to conduct two interim analyses for efficacy (when approximately 50% and 75% of the expected total primary events accrued). After the second pre-specified interim analysis following the 75% review, the DSMB requested an additional review of 16
45
46 were implemented with Amendment 5. Major changes in the amendments are summarized below. The final protocol is summarized later in this review. Amendment 1, finalized 19 Apr 2007: Added assessments for biomarkers, pharmaco-economic factors, quality of life factors, and renal function. Clarified the definition of all revascularization in the secondary endpoints to include coronary and non-coronary revascularization. Clarified that investigators were to report clinical endpoint events in the clinical events module of the ecrf, rather than other pages of the CRF such as the SAE page, and the events the Clinical Endpoints Committee will adjudicate. Clarified that a subject who reported a non-fatal suspected clinical endpoint should continue to receive blinded study medication to the end of the trial. Amendment 2, finalized 20 Sep 2007: Called for the number of patients with a diagnosis of STEMI as the qualifying event to be approximately 4,000 and halted enrollment of new patients with a qualifying event of STEMI in order to maintain the proportion of STEMI/NSTEMI as pre-specified in the protocol. Increased the sample size from 10,000 to a maximum of 12,500 subjects because the primary endpoint event rate was lower than anticipated in the original design. Increased the number of required adjudicated primary endpoint events from 2,955 to 5,250. Clarified that the anticipated absolute difference of 15 mg/dl in LDL-C should be associated with an estimated 9.375% reduction in hazard. Reviewer Comment: The following rationale for increasing sample size and primary endpoint events was provided in a memo to investigators: Following publication of the Cholesterol Treatment Trialist's overview of placebo controlled trials in September 2005, the Operations Committee began a detailed review of the statistical assumptions used to initially determine the sample size of IMPROVE IT. In the CTT analysis, they were able to calculate what percent LDL reduction translated into a 1% reduction of clinical events. Subsequently another meta-analysis of the 4 trials of intensive vs. standard statin therapy also was able to determine the same calculation. Both analyses indicated that the percent reduction of clinical events would be slightly lower than what we had used in the statistical assumptions of the IMPROVE-IT trial developed back in In addition, use of a hazard ratio, as was done in these meta-analyses, as opposed to relative risk in the IMPROVE IT protocol needed to be adjusted. Finally, it was observed in these meta-analyses that the percent reduction in events was more modest in the first 6 months of treatment, and thus this should be factored into the statistical assumptions for IMPROVE-IT. Many internal and external statisticians and lipid trialists reviewed these data and thus, we have determined that a sample size of 12,500 patients and a total of 5250 primary endpoint events are needed to keep the trial hypothesis the same. (Memo 48; 15 Oct 2007; Dr. Eugene Braunwald). 18
47 Scenario 1.6 mg/dl ~ 1% RR Reduction in Hazard Ratio Rx Effect first 6 Months Study Duration Years (Months) 9.4% 50% (66-72 mos) Total Sample Size (# of Events) patients (5250 events) Amendment 3, finalized 30 Apr 2008: Increased the sample size to a maximum of 18,000 subjects from the previous number of 12,500 subjects because the primary endpoint event rate was lower than anticipated with Amendment 2. Clarified the summary of the Cholesterol Treatment Trialists (CTT) analyses of mortality and morbidity from large-scale randomized, placebo-controlled trials of statin therapy. Clarified the definition of NSTE-ACS as referring to subjects with either unstable angina or NSTEMI. Reviewer Comment: According to the Applicant, the availability of better estimates of aggregate, blinded event rates in IMPROVE-IT led to the decision to increase the sample size further (up to 18,000 patients) in order to ensure the accrual of the needed number of clinical events in the most timely manner. Amendment 4 was implemented in conjunction with Amendment 5 (i.e., Amendment 4 was not released to sites although it had gone through approval by study leadership and the Applicant, because it became clear that additional changes would be needed). All changes to the trial since Amendment 3 were contained in Amendment 5. Amendment 5, finalized 22 Jun 2011: Added a second interim analysis when 75% of the expected total primary events were available. Specified a nominal alpha level of to be used for the first interim analysis (50% of events) and a nominal alpha level of to be used for the second interim analysis (75% of events). Overwhelming efficacy for early study termination minimally required significance for the primary efficacy endpoint at the specified nominal significance levels and a directionally consistent reduction in total mortality. Added creatine phosphokinase measurement to all routine abbreviated and extended safety laboratory panels. Restricted the highest dose of simvastatin 80 mg to those subjects who had tolerated that highest dose for 12 months or more without evidence of significant muscle toxicity; all other subjects were to receive a maximum simvastatin dose of 40 mg. Modified the reasons to have a subject discontinued from the trial to include a subject who has LDL-C concentration 100 mg/dl (>2.6 mmol/l) at 2 consecutive observations. Subjects meeting this criterion were to be discontinued from study medication to allow for medical management at the discretion of the treating physician. These subjects were to continue all follow-up requirements of the trial. 19
48 Added monitoring of CK and potential occurrences of myopathy at every visit for subjects receiving ezetimibe/simvastatin combination 10/80 mg or Simvastatin 80 mg and for subjects undergoing dummy titration. Reviewer Comment: In June 2011, after review of the Study of the Effectiveness of Additional Reductions in Cholesterol and Homocysteine (SEARCH) trial, the Agency issued a Drug Safety Communication regarding the 80 mg dose of simvastatin. This communication was issued simultaneously with changes to the simvastatin drug label. The safety communication included the following: 1. Simvastatin 80 mg should not be started in new patients, including patients already taking lower doses of the drug. 2. Simvastatin 80 mg should be used only in patients who have been taking this dose for 12 months or more without evidence of muscle injury (myopathy). 3. Drug interaction information that included recommendations for a maximum dose of simvastatin 20 mg daily in patients taking amlodipine or ranolazine was added. The Applicant amended the IMPROVE-It trial to align with the revised labeling for simvastatin. These changes are described in Simvastatin 80 mg Dose Adjustment section, below. Other changes in the conduct of the trial were: 1. The reporting process for cancer or neoplasm was revised due to the results of the Simvastatin and Ezetimibe in Aortic Stenosis (SEAS) study published in Due to these findings, the IMPROVE-IT investigators created a Malignancy plan as outlined in Memo 90 to collect more detailed information regarding the occurrence of malignancy in all IMPROVE-IT subjects. 2. Granularity was expanded to capture the reason a subject discontinued taking study medication: a. The ecrf was modified to provide additional reasons that a subject may have been discontinued from taking study medication: 1. Need for prohibited medication; 2. Patient did not want to take 3 pills/study drug compliance; 3. Patient moved and could not be assigned to new site; 4. Patient withdrew consent for all procedures; 5. Patient is lost to follow-up; 6. Patient insisted on knowing LDL-C values; 7. Other Free text field for Site to provide detailed explanation b. Vital Status ecrf was added in 2012 per Memo 360 Statistical Analysis Plan The Statistical Analysis Plan (SAP) was finalized on October 8, The SAP was subsequently updated three times. 25 Feb 2010: Included plans for the second interim analysis which was added to protocol amendment #5. 01 Feb 2012: Added inferential testing for gallbladder-related adverse events; changed the methodology for testing adverse events from a Chi-square test to the Miettinen and Nurimen method to align with Merck best practices; and clarified that the alpha level for the analysis of the primary endpoint at the interim 20
49 analyses would be adjusted using the pre-specified alpha-spending function if the actual number of events at the interims did not match the planned number of events 12 Oct 2012: Clarified that the pre-specified alpha-spending function for the analysis of the primary endpoint would continue to be used for additional interim analyses beyond those planned in the protocol DCRI Statistical Analysis Plan DCRI prepared three statistical analysis plans: January 5, 2010: DCRI Guidance Document for Interim Sample Size Reevaluation, provided justification and methodology for determining sample size re-evaluation December 6, 2011: DCRI DSMB SAP, described analyses and summaries that were reported at DSMB meetings October 15, 2014: DCRI Study SAP, described methods for analyses and largely referenced the Merck SAP and Statistical Considerations Memo; an addendum on October 21, 2014 detailed the non-cardiovascular hospitalizations and serious adverse event reconciliation effort and the timing of the first and second database lock and their impact on analyses Important Trial Dates The IMPROVE-IT trial was initiated on October 26, 2005 (first patient first visit). The Applicant considered a patient to have completed the study if a final visit occurred on or after May 1, The last patient visit occurred on September 18, Although not originally intended, two database locks occurred for this trial; see section Reconciliation Process and Database Lock below for additional detail. The first database lock occurred on October 21, 2014, which provided the data for the final analysis scheduled to be presented at the scientific sessions of the American Heart Association on November 17, After additional SAE reconciliation, the second database lock occurred on January 23, Study Design IMPROVE-IT was a randomized, double-blind, controlled study of 18,144 patients with stabilized acute coronary syndrome (ACS) who were enrolled within ten days of hospitalization for either a non-st elevation-acs (unstable angina or non-st elevation myocardial infarction [NSTEMI] or ST elevation myocardial infarction (STEMI). Eligible patients LDL-C was to be 50 mg/dl and 125 mg/dl if statin naïve or < 100 mg/dl if receiving statin therapy. Eligible patients enrolled into this trial were randomized in a 1:1 ratio to either ezetimibe/simvastatin (EZ/SV) 10/40 mg or simvastatin (SV) 40 mg. Trial drug was to be taken once daily in the evening. To maintain the blind and also allow for titration of simvastatin if needed, patients took a total of 3 tablets daily (see Study Procedures, below). 21
50 Randomized treatment assignment was stratified by three factors: Whether or not patients entered IMPROVE-IT from the EARLY-ACS trial (P03684), regardless of treatment assignment to eptifibatide or placebo in that study. Experience with lipid-lowering therapy: subjects receiving chronic prescription lipid-lowering therapy (PLL) for >4 weeks prior to and continuing until admittance into a hospital or subjects not receiving chronic prescription lipid lowering therapy. Enrollment of subjects receiving chronic prescription lipid lowering therapy was to be limited to < 50% of all subjects within each country. High-risk ACS diagnosis: NSTE-ACS (UA or NSTEMI) or STEMI. Reviewer Comment: The EARLY ACS trial compared early GP IIb/IIa inhibitor (eptifibatide) vs. provisional use in catheterization lab. The primary endpoint was death or MI at 96 hours. Patients who participated in the EARLY ACS trial were eligible for IMPROVE-IT if they a) completed the 96 hour follow-up, b) were clinically stable, c) had no planned CABG, and d) were within 10 days of admission for ACS. The following figure shows the overall design of the IMPROVE-IT study. 22
51 Figure 1: IMPROVE-IT Study Design Source: IMPROVE-IT Protocol, Amendment #5, Figure 2.1, pg. 1025/2388. Study Objectives The primary objective of this trial was to evaluate the clinical benefit of ezetimibe/simvastatin (EZ/SV) combination compared with simvastatin monotherapy (SV) in patients presenting with stabilized ACS either acute myocardial infarction (MI) or documented unstable angina (UA). Clinical benefit was defined as the reduction in the risk of the occurrence of the composite primary endpoint of CV death, non-fatal MI, documented UA that required admission into a hospital, all coronary revascularization with either percutaneous coronary intervention (PCI) or coronary artery bypass grafting (CABG) occurring at least 30 days after randomized treatment assignment, and nonfatal stroke. Only revascularization events that occurred after the first 30 days of treatment were included as clinical endpoint events in order to focus on revascularization events that could be reasonably expected to be affected by treatment and were less likely to be related to the initial ACS event. The three secondary objectives were to evaluate supportive composite endpoints (change from primary endpoint noted in bold): a. death due to any cause, major coronary events, or non-fatal stroke. 23
52 b. death due to coronary heart disease (CHD death), non-fatal MI, and urgent coronary revascularization (either PCI or CABG occurring at least 30 days after randomization). c. CV death, non-fatal MI, documented UA that requires admission into a hospital, all revascularization (including both coronary and non-coronary) occurring at least 30 days after randomization, and non-fatal stroke. Reviewer Comment: Major coronary events include non-fatal MI, documented unstable angina that required admission into a hospital, and all coronary revascularization with either percutaneous coronary intervention (PCI) or coronary artery bypass grafting (CABG) occurring at least 30 days after randomized treatment assignment. CHD death is defined as death due to atherosclerotic coronary heart disease, and includes deaths due to acute MI, sudden death, non-sudden death (symptoms of cardiovascular nature with gradual deterioration prior to death), unwitnessed death (not seen > 24 hours), and procedure-related deaths. CV death includes CHD death, death due to atherosclerotic vascular disease (excluding coronary disease), as well as death due to non-atherosclerotic cardiovascular disease. Study Population Adult men and women with NSTEMI, STEMI, or hospitalized documented unstable angina were eligible for entry into the trial. The following are the inclusion and exclusion criteria for the study. Inclusion Criteria A patient must have met all criteria listed for entry: 1. Patient may be of either sex and of any race; 2. A patient in whom a PCI was planned as management for the qualifying ACS event should have undergone PCI prior to Randomization and within the 10-day period after initial hospitalization for the qualifying ACS event. Although subsequent staged PCI procedures were permitted, all planned PCIs that were known at the time of screening must have been completed within 30 days of Randomization. Whenever possible, PCI procedures (including staged procedures) known to be indicated at the time of screening should have been completed prior to Randomization; 3. Patient must have had NSTE-ACS (unstable angina or NSTEMI) or STEMI according to the following criteria: a. A NSTE-ACS (unstable angina or NSTEMI) patient participating in the EARLY-ACS Trial (Protocol No. P03684) who had been clinically stabilized was to be eligible for entry in IMPROVE-IT under Protocol No. P04103 < 10 days (<240 hours) of presenting to the hospital. The patient must have completed the 96-hour primary endpoint of the acute segment of EARLY-ACS treatment (the acute segment of EARLY-ACS treatment was the initial phase of administration of randomized treatment with eptifibatide or matching placebo through catheterization) and have been clinically stable before enrolling in IMPROVE-IT; OR 24
53 b. A patient not participating in the EARLY-ACS Trial, but who was defined as NSTE-ACS (unstable angina or NSTEMI) by meeting all of the following criteria, and had been clinically stable for at least 24 hours prior to screening/randomization, was to be eligible to enter directly into the IMPROVE-IT trial 10 days ( 240 hours) of acute admittance into a hospital: 1. The patient had experienced symptoms of cardiac ischemia at rest prompting acute care hospitalization with at least one episode lasting at least 10 minutes; years of age; and 3. Any 1 of the following criteria: a. Electrocardiogram changes characterized by either of the following: 1. New or presumably new ST-segment depression 0.1 mv in at least 2 contiguous ECG leads; or 2. Transient (<30 minutes) ST-segment elevation 0.1 mv in at least 2 contiguous ECG leads. b. Any of the following cardiovascular biomarkers elevated above the upper limit of normal (ULN):1) Troponin I; 2) Troponin T and/or 3) Creatine kinase-mb fraction (CK-MB). c. Diabetes mellitus; d. History of prior MI; e. History of peripheral arterial disease; f. History of cerebrovascular disease; g. History of CABG 3 years prior to entry; (Note: This was 1 item in a list of 8 criteria. If the patient had had CABG within the 3 years prior, they still may have been eligible if at least one criterion of a f or h from this list were met.); or h. Multi-vessel coronary artery disease previously documented by catheterization (2 or 3 vessels with 50% stenosis) including the catheterization performed during the index admission for the qualifying event 4. Patient must have met the following criteria for LDL-C concentrations at the time of admittance into a hospital (Each measurement of LDL-C performed within the first 24 hours of admittance must have met the criteria): a. Definition of chronic prescription lipid-lowering therapy and lipid therapy naïve. 1. A patient was considered to be receiving chronic prescription lipid-lowering therapy if he/she had been receiving any prescription lipidlowering therapy continuously for >4 weeks prior to and continuing until the qualifying ACS hospital admission; 2. All other patients (including those who initiate prescription lipidlowering therapy after the qualifying ACS hospital admission) were considered to be lipid-therapy naïve ; 3. To be eligible, a patient receiving chronic prescription lipidlowering therapy must have been receiving therapy with a lipid-lowering potency equal to or less than simvastatin 40 mg QD: 25
54 a. A patient receiving chronic lipid-lowering therapy with LDL-C lowering potency greater than simvastatin 40 mg was not to be eligible. The prohibited chronic lipid lowering therapies were the following: 1. All doses of simvastatin >40 mg; 2. All doses of atorvastatin 40 mg; 3. All doses of rosuvastatin; 4. All doses of ezetimibe/simvastatin combination; 5. Ezetimibe co-administered with any dose of any statin. b. For the purposes of this protocol, all other chronic prescription lipid lowering therapies were to be considered equal or less potent than simvastatin 40 mg QD and patients taking such therapies may have been considered for enrollment. b. A lipid-therapy naïve patient was to be eligible to enroll if his/her LDL-C concentration was 50 mg/dl and 125 mg/dl; c. A patient receiving chronic prescription lipid-lowering therapy was to be eligible to enroll, if his/her LDL-C concentration was 50 mg/dl and 100 mg/dl; d. Observe the following conditions concerning lipid concentrations and experience with chronic prescription lipid-lowering therapy: 1. Blood lipid levels, including LDL-C, were to have been measured as close as possible to each subject s presentation to a hospital, but no later than 24 hours after admission. A subject s baseline LDL-C and lipid-lowering-therapy status were to be based on the subject s status at the time of the initial acute event leading to admittance into a hospital; 2. The specimens did not need to be obtained after fasting. In addition if the blood lipid levels were not measured at the time of admittance, they may have been determined later on blood from the subject that was obtained at the time of admittance into the hospital 3. If a recent lipid panel (<6 months prior to presentation) was available, the values may have been used for subject screening and determination of eligibility if the subject s therapy had not changed since the lipid measurement and if no specimen was drawn within the first 24 hours after admission to a hospital; 4. If only a total cholesterol (TC) level was available at the time of admission, the patient was still eligible if TC concentrations met the following criteria at the time of admission and repeat lipid measurements (preferred but not obligate fasting) are obtained as soon as possible (preferably within 24 hours of admission) meet the above LDL-C criteria: a. TC concentration 190 mg/dl for a lipid-therapy naïve subject; b. TC concentration 150 mg/dl for a subject receiving chronic prescription lipid-lowering therapy. 26
55 5. Patient must have had a plasma triglyceride (TG) level 350 mg/dl. A subject found to have had a non-fasting TG >350 mg/dl but <1500 mg/dl upon admittance into a hospital, must have had TG 350 mg/dl on a fasting specimen obtained as soon as possible (preferably within 24 hours of admission); 6. Patient s clinical laboratory tests must have been within reference ranges or clinically acceptable to the investigator/sponsor; e. At Screening/Randomization each woman of child-bearing potential must have agreed to use a medically accepted method of contraception while receiving protocol-specified medication and for 6 weeks after stopping the medication. All post-menarchal women who were <2 years menopausal or who had not had surgical sterilization or a hysterectomy were considered to be women of childbearing potential. Acceptable methods of contraception included condoms (male or female) with or without a spermicidal agent, diaphragm or cervical cap with spermicide, medically prescribed intrauterine device (IUD), oral or injectable hormonal contraceptive, and surgical sterilization (e.g., hysterectomy or tubal ligation); f. Each woman of child-bearing potential who was not currently sexually active must have agreed to use a medically accepted method of contraception should she become sexually active while participating in the trial. Major Exclusion Criteria The patient was to be excluded from entry if any of the criteria listed below were met: 1. Patient who was clinically unstable. A patient was considered clinically unstable if he/she displayed any of the following events within 24 hours prior to Screening/Randomization: a. Hemodynamic events: (1) Hypotension was defined as sustained systolic blood pressure of <90 mmhg due to cardiac failure with associated symptoms; (2) Unstable or severe pulmonary edema/decompensated CHF; (3) Acute mitral regurgitation; acute ventricular septal defect. b. Recurrent symptoms of cardiac ischemia; stroke or transient ischemic attack; c. Arrhythmic events: (1) Ventricular fibrillation; (2) Sustained ventricular tachycardia lasting >30 seconds or in association with symptoms; (3) Complete heart block; (4) High grade second degree heart block. 2. Patient who planned or underwent CABG in response to the initial episode of ACS. 3. Patient who must have continued to receive treatment that is listed on the prohibited medication list. These prohibited medications were to be stopped at entry and not to be taken during the trial after randomization. There were no washout periods for medications prohibited at entry. 27
56 4. Patient is receiving chronic lipid-lowering therapy with LDL-C lowering potency greater than simvastatin 40 mg. 5. Patient with active liver disease or persistent serum transaminase elevations (> 2XULN). 6. Patient with a calculated creatinine clearance (CrCl) < 30 ml/min or dialysis within 30 days. 7. Patient has a history of alcohol and/or drug abuse. 8. Patient is pregnant or lactating woman, or is intending to become pregnant. 9. Patient with a prior enrollment in this current study. Study Procedures All patients who met the entry criteria were assigned to receive randomized treatment in one of the two treatment groups in a 1:1 ratio. Treatment was composed of three tablets (double-dummy) as follows: EZ/SV Treatment Group: One ezetimibe/simvastatin combination 10/40 mg tablet plus two placebo tablets (each matching simvastatin 40 mg in appearance); or SV Treatment Group: One simvastatin 40 mg tablet plus two placebo tablets (one matching ezetimibe/simvastatin 10/40 mg and the other matching simvastatin 40 mg). Specifically, treatment was provided in 3 bottles: Bottle A, Bottle B, and Bottle C. Patients were to take 1 tablet from each bottle once each day in the evening. At the time of treatment assignment, medications in the bottles were as follows: For subjects assigned to receive Ezetimibe/Simvastatin 10/40: Bottle A contained Ezetimibe/Simvastatin Combination 10/40 tablets. Bottle B and Bottle C each contained matching placebo tablets for Simvastatin 40 mg; For subjects assigned to receive simvastatin 40 mg: Bottle A contained matching placebo tablets for Ezetimibe/Simvastatin Combination 10/40 tablets. Bottle B contained simvastatin 40 mg tablets. Bottle C contained matching placebo tablets for Simvastatin 40 mg. 28
57 Clinical Briefing Document 29
58 Increasing Simvastatin Dose in Response to LDL-C Levels Lipid values were to remain unknown to the investigators and subjects throughout the trial. Central laboratory results that required action (e.g., simvastatin uptitration), described below, were relayed to the investigators without revealing the specific lab value; dummy titration subjects were also contacted at random in a pre-specified ratio to subjects who actually required titration. Prior to Amendment 5, the IMPROVE-IT protocol allowed for the simvastatin dose to be increased in a blinded manner to the maximum dose of 80 mg in either treatment group according to the following algorithm: 1. If a patient was found to have an LDL-C concentration of >79 mg/dl at any visit (in the absence of non-compliance with dosing and diet), that patient was to be instructed to return in 2 months for a repeat blood draw. 2. If the LDL-C concentration from the repeat blood draw was confirmed to be >79 mg/dl at 2 consecutive observations in the absence of noncompliance with dosing and diet, that patient was to have his/her simvastatin dose increased to 80 mg in a double-blind manner at the next visit. 3. If a patient, whose simvastatin dose had already been increased to 80 mg due to LDL-C >79 mg/dl, was found to have an LDL-C concentration >100 mg/dl in the absence of noncompliance with dosing and diet and the observation was confirmed to be >100 mg/dl on 2 consecutive measurements, the patient was to be discontinued from study medication at the investigator s and patient s discretion, but was to be monitored for any endpoint event until the termination of the study. To achieve the increase in the simvastatin dose to 80 mg without unblinding treatment, a simvastatin 40 mg tablet replaced a simvastatin 40 mg placebo tablet in the dosing regimen in Bottle C. As mentioned above, to avoid alerting investigators and patients as to who was receiving a total dose of simvastatin 80 mg daily, dummy titration subjects with LDL-C 79 mg/dl were included among those asked to return for a repeat blood draw; however, the dummy patients did not have their simvastatin dose increased to 80 mg. Dummy titration patients were selected at random from across the study in a ratio of 1 dummy subject to every 2 to subjects with LDL-C concentrations actually requiring a repeat blood draw. If a patient had his/her simvastatin dose increased to 80 mg during the study, a CK measurement was to be performed at the time of the next scheduled visit. Similarly, a CK measurement was to be performed on the dummy titration patients at the time of the next scheduled visit. 30
59 Simvastatin 80 mg Dose Adjustment On June 8, 2011, the FDA released a Drug Safety Communication regarding the simvastatin 80 mg dose and made changes to the simvastatin labeling based on the risk of serious muscle toxicity with simvastatin 80 mg. The increased risk was noted to be greatest during the first year of treatment. Subsequently the IMPROVE-IT protocol was changed with Amendment #5 which modified use of simvastatin 80 mg in the study as follows: No additional patients were to have their simvastatin dose increased to 80 mg; Patients who had been taking the simvastatin dose of 80 mg for less than 12 months were to have their dose decreased to 40 mg; Patients who were taking simvastatin 80 mg and also amlodipine or ranolazine and were not able stop those concomitant treatments or change to an alternative were to have their simvastatin dose decreased to 40 mg; Patients who had been tolerating the simvastatin dose of 80 mg for 12 months or longer without evidence of significant toxicity and were also not receiving amlodipine or ranolazine were to continue on the 80 mg dose. In a blinded manner, the lists of patients requiring action on simvastatin dose adjustment were provided to the investigational sites. To minimize the effect of these changes on the study blind, a proportion of patients who had already been recalled as a dummy titration patient for testing of LDL-C but did not have his/her simvastatin dose increased to 80 mg were also included on the lists. The ratio of patients who had been actually receiving SV 80 mg to dummy subjects was 2:1. All patients identified on the lists were contacted and instructed to temporarily discontinue taking medication from Bottle C until the next scheduled visit. At that visit they were given a new medication supply in which Bottle C contained simvastatin placebo. In some cases in which the investigator and/or patient were concerned about the possibility of the patient receiving simvastatin at the 80 mg dose or if a patient deduced that Bottle C would unavoidably contain placebo, the sites allowed such patients to stop taking medication from Bottle C. Reconciliation Process and Database Locks In October 2014, in connection with study close out and prior to the planned database lock, the Applicant identified reports of non-cardiovascular hospitalizations without corresponding SAEs reported in the clinical database. This issue was identified only weeks prior to scheduled database lock (October 21, 2014). According to a statistical analysis plan addendum dated October 21, 2014, it was found late in the process of data cleaning that the hospitalizations previously identified as not potentially an endpoint event, AE or SAE of special interest or cancer associated were being under reported as SAE s. The time required to complete this additional cleaning requirement was incompatible with locking the data base on October 21th as planned. 31
60 All other data cleaning criteria for efficacy endpoints and predefined safety endpoints have been fully met and CEC adjudication has been completed. Importantly, a commitment had been made to present the trial results at the scientific sessions at the AHA [American Heart Association] on November 17 th, The sponsor decided to perform two separate locks of the database instead of one. Prior to the first data base lock, it was decided that the final analysis would be performed on these data, supporting both the presentation of the trial results at the AHA and for preparation of the manuscript. Subsequently, the hospitalizations/saes would be reconciled, and any additional clinical events, protocol-defined safety endpoints, or other safety events of concern would be submitted for review by either the CEC or the SAE safety desk. Any such events were to be flagged as post-study events that would be excluded from the final analysis. The second lock occurred on January 23, 2015, after the reconciliation was completed. The second lock was used to support safety reporting (except for the selected safety events of interest). Reviewer Comment: Locking a clinical trial database with knowledge of incomplete data cleaning is highly unusual. Based on the submitted hospitalization dataset (hospfu.xpt), there were 15,262 records where the investigator included free text related to the cause of the hospitalization. This reconciliation process ultimately identified 1,148 hospitalizations for which a temporally associated SAE had not been reported. Investigator sites were queried to determine if an SAE should be reported and received responses in 98% (n=1,127) of the cases. Of these, a total of 926 SAEs were added to the IMROVE-IT trial database. Hospitalizations that did not meet SAE criteria made up 201 cases (see table below). There were 21 events for which a query response was not received. Seventeen of these events occurred in subjects at closed investigator sites and therefore the Applicant was not able to retrieve any additional information. However, an associated non-serious AE (NSAE) was identified by the Applicant in 9 of the 21 cases. The Applicant used the investigator causality assessment assigned to the previously reported NSAE to report the SAE in the Applicant s safety database. The remaining 12 events were reviewed by a trained Merck physician and assigned causality as per the Company Causality Standard Operating Procedure to the Applicant s safety database. Table 1: Serious Adverse Events Identified through the Reconciliation Process Category Count Hospitalization without an Associated SAE 1148 Query response received 1127 New SAE Form Submitted 926 No SAE (Hospitalization did not meet SAE criteria) 201 HOSP Form created in error 3 Pre-planned event 80 32
61 Subject was not admitted 51 Hospitalization related to previously reported endpoint 18 Hospitalization associated with an existing SAE 31 Subject discontinued study therapy for > 30 days 18 No response received 21 No associated NSAE 12 Associated NSAE 9 Source: IMPROVE-IT CSR, Table 9-5, pg. 107/793. The 21 hospitalizations for which a query response was not received during the reconciliation effort are summarized in the following table. Upon reviewing these events, their inclusion would not affect conclusions regarding safety from this trial. Eleven potential efficacy endpoints were identified during the SAE/hospitalization reconciliation process. These eleven potential endpoints were submitted to the CEC for adjudication, and four were positively adjudicated (1 EZ/SV and 3 SV). Because the first database lock was specified to support the final analysis, these four events were excluded. Table 2: Potential Efficacy Endpoints Identified through Data Reconciliation and Database Locks Site Subject Treatment group Event Type Adjudication Outcome Simvastatin Unstable Angina Positively adjudicated Ezetimibe/simvastatin Unstable Angina Negatively adjudicated Ezetimibe/simvastatin Unstable Angina Negatively adjudicated Simvastatin Stroke Negatively adjudicated Ezetimibe/simvastatin Stroke Positively adjudicated Non-hemorrhagic Cerebral Infarction Simvastatin Stroke Negatively adjudicated Simvastatin Stroke Positively adjudicated Primary Hemorrhagic Simvastatin Stroke Negatively adjudicated Simvastatin Stroke Positively adjudicated Primary Hemorrhagic Simvastatin Stroke Negatively adjudicated Simvastatin Stroke Negatively adjudicated Source: IMPROVE-IT CSR, Table 11-30, pg. 253/793. An additional 19 potential safety endpoints were identified in the SAE/hospitalization process. Although these events were submitted to the CEC for adjudication, they were not used for reporting. All events were potential cancer-related events and only 3 were positively adjudicated (2 EZ/SV, 1 SV). 33
62 Endpoint Ascertainment and Clinical Endpoint Committee (CEC) Process According to a document titled IMPROVE-IT Trigger Logic dated 07 November 2014, a few approaches were used to identify clinical events that required adjudication, whether related to efficacy endpoints or specific safety endpoints (unexplained myopathy or malignancy), a few approaches were used. On a case report form filled out at each site visit (or phone call), investigators checked Yes or No in response to questions such as: Since last visit, did the Patient experience: o Hospitalization for any reason o Death o MI/Unstable Angina/ or chest pain requiring evaluation in an emergency room or hospital setting o Stroke / Transient Ischemic Attack (TIA) / Cerebrovascular Event Affirmative responses to these items created additional case report forms to collect more information, which then led to triggers for adjudication if appropriate. Adjudication was not triggered, for example, if the investigator selected MI/Unstable Angina/ or chest pain. but then selected either Stable Angina or Non-Ischemic Etiology as the diagnosis of suspected ischemic event on the case report form that collected more information about potential MI/UA events. No triggers were defined for CHF, PCI, or CABG events, since these were not adjudicated by the CEC. Regarding safety events, triggers were defined for unexplained myopathy events and malignancy. In addition to capturing events triggered by these Yes/No queries on case report forms, all adverse event records were reviewed to determine whether a trigger was expected and sites were queried if the response to a trigger question was inconsistent with the AE. This included a clinical review of each preferred coding term by DCRI Clinical. In addition, the TIMI Safety group performed the same QC check on all SAEs as they were entered throughout the trial. Finally, all case report forms that recorded information regarding hospitalizations were reviewed to ensure that both pre-specified and free text Reason for Hospitalization data triggered adjudication as expected; sites were queried for any missing trigger data. DCRI Clinical reviewed each free text field. Regarding CEC Processes, briefly, TIMI was responsible for assembling the relevant, data-cleaned case report forms along with all supporting documentation (e.g., relevant ECGs) for distribution (in duplicate) to the CEC where each endpoint package would be randomly assigned to two independent physician reviewers. Endpoint packages were to contain all potential events during one hospitalization for a given subject so that all could be reviewed together. Adjudicators were blind to treatment group and patient identification. Any CEC-generated queries (e.g., requests for clarification, additional information, etc.) were routed back to TIMI via a query system; the CEC did not interact with the sites directly. The physician reviewers reviewed the cases assigned, documented supporting information for each event s adjudication in the endpoint package, and brought their cases to scheduled CEC meetings. During the meeting, the 34
63 two physicians would compare adjudications; in the case of a discrepancy after reviewing the case together, or at the discretion of the reviewer(s), the case would be presented to the full CEC (minimum 3 persons) for discussion and final adjudication. In the case of concordance between the reviewers, the event would be considered adjudicated without committee discussion. According to the CEC Manual of Operations, adjudication meetings were to be scheduled on an as-needed basis but no less than quarterly. After each meeting, all signed adjudication pages were sent to DCRI. Endpoint packages were to include an overall subject summary, relevant CRF pages, narratives, relevant laboratories, and imaging data. For deaths, autopsy reports were requested, if performed. For ACS events, ECGs before, during, and after the event were expected, labeled with date and time. For strokes, any supporting documents/scans were requested. Myalgia events required central and local relevant labs. For malignancy events, pathology reports (unless the investigator stated, in writing, that such reports were unavailable), operative reports, imaging studies, and oncology/surgical consult notes were relevant source documents. The CEC also required any narratives or submitted documentation to be legible and translated into English, if applicable. Endpoint Definitions Used by the Clinical Endpoint Committee (CEC) Death Classification Death was classified in two primary categories, Cardiovascular or Non- Cardiovascular, and also in two secondary categories, Coronary Heart Disease or Non-Coronary Heart Disease. All deaths were assumed Cardiovascular (Category I) in nature unless a Non- Cardiovascular (Category II) cause could be clearly shown, with the exception of death without any additional information, which was classified as Unknown (Category III). Allcause mortality includes all deaths, regardless of whether the cause of death was determined. I. Cardiovascular (CV) Death A. Atherosclerotic Coronary Heart Disease (CHD Death) 1. Acute Myocardial Infarction death occurring after a documented MI in which there is not conclusive evidence of another cause of death; autopsy evidence of a recent infarct with no other conclusive evidence of another cause of death; abrupt death that has suggestive criteria for an infarct but does not meet the strict definition of an MI (requires presentation of chest pain AND either ECG changes indicative of myocardial injury, abnormal markers without evolutional changes [e.g., death preceded subsequent draws], or other evidence of new wall motion abnormality) 2. Sudden Death death that occurred suddenly and unexpectedly within 24 hours of last being known alive 3. Non-Sudden Death symptoms of a CV nature that gradually deteriorated prior to death (e.g., worsening heart failure leading to death) 35
64 II. III. 4. Unwitnessed Death (not seen > 24 hrs) death that occurred unexpectedly and had no known other major causes of death 5. Procedural death related to any of the usual coronary artery procedures (surgery, PCI, angiography) within 7 days of the procedure B. Atherosclerotic Vascular Disease, Excluding Coronary Disease includes cerebrovascular disease (including cerebrovascular peri-procedural deaths) or other vascular causes of death (e.g., aortic, mesenteric, renovascular, peripheral vascular disease, or procedures related to these vascular beds) C. Other Cardiovascular Disease (Non-Atherosclerotic) e.g., pulmonary embolism, endocarditis, valvular heart disease, cardiac valve surgery Non-Cardiovascular Death e.g., accidental, diabetes, malignancy, renal, suicide Unknown Myocardial Infarction All definite myocardial infarctions were counted as events whether they represented the reason for the hospitalization or occurred during a hospitalization. In addition, they were counted as events whether they occurred spontaneously or as the direct consequences of an investigation/procedure or operation. The definition of MI as an endpoint was taken into account whether a subject had a recent MI or had undergone revascularization with PCI or CABG surgery. In order to meet the criteria as an endpoint, an MI must have been distinct from the qualifying event (i.e., re-infarction for a subject who qualified for the study based on recent MI). An MI was considered to be present at the initial presentation of the qualifying ACS event if at presentation or 8 hours, troponin I or T, or CK-MB was elevated >1X ULN. If troponin I or T, or CK-MB was elevated <16 hours from presentation, and no symptoms, PCI, or CABG had occurred in the first 16 hours after presentation and enrollment, this also was considered an MI at presentation. Two definitions of myocardial infarction were evaluated by the CEC during adjudication of suspected cases of MI the IMPROVE-IT MI definition and the EARLY ACS MI definition -- as described below. The primary analysis utilized the IMPROVE-IT MI definition. I. IMPROVE-IT MI Definition A. Myocardial infarction was defined by a clinical scenario consistent with MI, confirmed by the presence of either ECG evidence or cardiac marker evidence (post-cabg, both ECG and cardiac marker evidence were required, if the CK- MB was 5X ULN to <10X ULN). 1. ECG evidence of infarction or re-infarction required new Q-waves ( 0.04s) in two or more contiguous leads that was not an ambiguous change from baseline. 2. Cardiac marker evidence of infarction (or reinfarction) required troponin or CK-MB elevation greater than the ULN, or when neither troponin nor CK-MB were available, elevation of the total CK 2X ULN. Following PCI, CK-MB (or CK) elevation had to be 3X ULN. Following CABG, CK-MB (or CK) elevation had to be 5X ULN (if accompanied by ECG criteria) or 10X ULN (without ECG criteria). The reviewers should also consider the clinical features (e.g., renal insufficiency), possible alternative diagnoses (e.g., pericarditis), pattern of marker release (e.g., absence of a rise and fall), and known sensitivity/ 36
65 II. specificity of the various cardiac markers in the adjudication of infarction, particularly when there is discordance in the results of multiple markers. B. Additional requirements for an endpoint MI, applicable to particular cases, were as follows: 1. In subjects with acute MI as the index event, within the first 72 hours after the index MI, enzyme criteria for recurrent infarction were re-elevation of the troponin or CKMB >ULN and increased by at least 50% over the previous value. If neither the troponin nor CK-MB were available, total CK must have been 2 x ULN and increased by at least 50% over the previous value. Following PCI, CK-MB (or CK) elevation must have been 3 x ULN and increased by at least 50% over the previous value. 2. In the 72-hour period following CABG, the definition for a recurrent infarction required both enzyme and ECG criteria if the CK-MB (or total CK if CK-MB was not available) was 5X ULN but <10X ULN. If the cardiac markers were 10X ULN, ECG criteria were not required. The CEC could have also considered information regarding new wall motion abnormalities (when available) in determining whether an MI occurred post-cabg. EARLY-ACS Trial Definition (not considered for the primary endpoint analysis for the IMPROVE-IT trial). Documented Unstable Angina Requiring Admission into Hospital In order to meet the criteria as an endpoint, the subject must first have had an episode of ischemic discomfort consistent with unstable angina (ischemic discomfort either at rest, of new onset, or in an accelerating pattern) lasting 10 minutes, which occurred before the subject presented to the hospital. The subject must then have been hospitalized (including a stay in the emergency department or observation unit of at least 12 hours) and have had at least one of the following to meet the criteria for unstable angina requiring re-hospitalization: 1. Another episode of ischemic discomfort that occurred after arrival to the hospital and occurred at rest, lasting 10 minutes, was distinct from the episode that occurred outside of the hospital, and that was attributed to myocardial ischemia according to the treating physician. OR 2. New ST segment or new T-wave changes consistent with ischemia in two or more contiguous leads in association with an episode of ischemic discomfort. Note: If subjects were admitted with suspected unstable angina, and subsequent testing revealed a non-cardiac or non-ischemic etiology, this would not be recorded as meeting this primary endpoint (or composite thereof). 37

66 Table 3: Summary CEC Definition IMPROVE-IT MI and Unstable Angina Requiring Admission to a Hospital 38

67 a: Hierarchy for Cardiac Markers is as follows: Spontaneous re-infarctions: troponin, CK-MB, CK Post-PCI: CK-MB, CK, troponin Post-CABG: CK-MB, CK b: MI: Requires evaluation in a hospital and must be distinct from qualifying event (i.e., re-infarction for a subject who qualified for the study based on recent MI) c: The CEC will also consider information regarding new wall motion abnormalities (when available) in determining whether an MI occurred post-cabg. d: If subjects are admitted with suspected unstable angina and subsequent testing reveals a non-cardiac or nonischemic etiology, this will not be recorded as meeting this primary end-point (or composite thereof). Source: IMPROVE-IT Inter-Lab-Standard, Table-1, pg. 4009/4087. Coronary Revascularization This endpoint was investigator-determined based on information reported on the CRF and did not require CEC review or adjudication. Coronary revascularization occurring at least 30 days post randomization was defined as all PCI and CABG performed >30 days (i.e., after hour periods had passed) after randomization was counted as an endpoint event. Attempted revascularization procedures, even if not successful, were counted. Revascularization was divided by type and urgency. Urgent Revascularization was defined as coronary revascularization (PCI or CABG) that occurred during a 39
68 hospitalization prompted by myocardial infarction or recurrent unstable angina with an episode of ischemic discomfort at rest lasting at least 10 minutes. Stroke Stroke was defined as an acute new neurological deficit ending in death or lasting >24 hours, and classified by a physician as a stroke. Stroke was sub-classified into one of the following 4 groups: 1. Primary Hemorrhagic: an intracerebral hemorrhage or subdural hematoma: 2. Non-hemorrhagic Cerebral Infarction: Stroke without focal collections of intracerebral blood on a brain image. 3. Non-hemorrhagic Infarction with Hemorrhagic Conversion: Cerebral infarction with blood felt to represent hemorrhagic conversion and not a primary hemorrhage. 4. Uncertain: Any stroke without brain imaging (e.g., CT or MRI), surgical exploration, autopsy, other documentation of type, or if tests are inconclusive. The CEC Manual of Operations also contained endpoint definitions for unexplained myalgia, myopathy, and rhabdomyolysis, as well as a classification for malignancies. See the related safety sections of this review for descriptions. Alignment Between Investigators & CEC The Agency requested the Applicant to provide data regarding the concordance between investigator-reported events and CEC-confirmed events. Using the data submitted, the exploratory analysis below shows the proportion of investigator-reported cases that were positively adjudicated by the CEC by treatment arm as well as the proportion of total positively adjudicated events that were initially reported by investigators as potential endpoints (as opposed to other triggering methods, such as programmatic review of AEs/SAEs/hospitalizations). Note that events of coronary revascularization were all investigator-reported in the trial and were not adjudicated by the CEC. Table 4: Investigator-Reported vs. CEC-Confirmed Events Event Ezetimibe/Simvastatin % of Investigator- Reported Events Confirmed by CEC % of Total Confirmed Events Initially Reported by Investigator % of Investigator- Reported Events Confirmed by CEC Simvastatin % of Total Confirmed Events Initially Reported by Investigator CV Death 94% (374/397) 70% (374/537) 92% (395/430) 73% (395/538) Non-fatal MI 93% (995/1071) 80% (995/1250) 94% (1123/1192) 79% (1123/1428) Non-fatal stroke 84% (225/267) 82% (225/273) 82% (265/322) 75% (265/351) UA requiring hosp. 9% (171/1961) 99% (171/173) 8% (164/2006) 98% (164/168) Source: Derived from 22 Sept 2015 response to information request. There was a lower rate of alignment between investigators and CEC regarding unstable angina requiring admission to a hospital. However, investigators were instructed to report any potential event of unstable angina requiring hospitalization for CEC review, 40
69 and they then applied the stringent criteria for unstable angina in the CEC Manual of Procedures: The patient must first have an episode of ischemic discomfort consistent with unstable angina (ischemic discomfort either at rest, of new onset, or in an accelerating pattern) lasting 10 minutes, which occurs before the patient presents to the hospital. The patient must then be hospitalized (including a stay in the emergency department or observation unit of at least 12 hours) and have at least one of the following to meet the criteria for unstable angina requiring re-hospitalization: 1. Another episode of ischemic discomfort that occurs after arrival to the hospital and occurs at rest, lasts 10 minutes, is distinct from the episode that occurred outside of the hospital, and that is attributed to myocardial ischemia according to the treating physician. OR b. New ST segment or new T-wave changes consistent with ischemia in two or more contiguous leads in association with an episode of ischemic discomfort. If patients were admitted with suspected unstable angina, but subsequent testing revealed a non-cardiac or non-ischemic etiology, then the investigator reported event was not positively adjudicated by the CEC as an unstable angina event. 3 Review of Efficacy Efficacy Summary IMPROVE-IT was conducted to evaluate the clinical benefit of ezetimibe/simvastatin combination, compared with simvastatin, in patients with stabilized ACS, either acute myocardial infarction or unstable angina. In the IMPROVE-IT trial, the mean age of the study population was 63.6 years. Only 24% of patients randomized into the trial were female. Approximately two-thirds of patients qualified for the study with NSTE-ACS (unstable angina and non-st elevation MI), and approximately one-third qualified with a STEMI event. Only one-third of subjects reported prior prescription lipid lowering therapy experience (defined as any prescription lipid-lowering therapy taken continuously for > 4 weeks prior the qualifying ACS hospital admission). A total of 18,144 patients were randomized into the study. The protocol-defined intentto-treat (ITT) population included 9,067 patients in the EZ/SV group and 9,077 patients in the SV monotherapy group. Overall, 13,728 (75.7%) patients completed the study, defined as having a final study visit on or after May 1, In the EZ/SV arm, 27.6% (2501 of 9067) discontinued the study drug and 13.6% (1235 of 9067) did not complete a study visit on or after May 1, 2014 (excludes those who died prior to this date). Therefore, approximately 41.2% of randomized patients either withdrew from the study or finished the study but off of study drug. In the SV arm, 28.7% (2607 of 9077) discontinued study drug prematurely and 13.8% (1249 of 9077) 41
70 discontinued the study prematurely. Therefore, approximately 42.5% of randomized patients either withdrew from the study or completed the study but off of study drug. The mean LDL-C levels achieved on treatment at year 1 were 72 mg/dl in the simvastatin group and 55 mg/dl in the ezetimibe/simvastatin group. The numbers of patients who at some point had their dose of simvastatin increased from 40 to 80 mg per day was greater in the simvastatin (SV) group compared to the ezetimibe/simvastatin (EZ/SV) group (6.2% in the EZ/SV and 27.0% in the SV monotherapy group). According to FDA statisticians, approximately 11.4% of patients in EZ/SV arm and 11.1% of patients in the SV treatment arm were censored for the primary endpoint prior to May 1, 2014; therefore, they had missing follow-up time with regard to the primary composite endpoint. A multiple imputation analysis for missing data was conducted by the Applicant and is summarized within this section. See the FDA statistical review for additional analyses. The primary objective of this study was to evaluate the clinical benefit of EZ/SV combination compared with SV in stabilized ACS subjects defined as the reduction in the risk of the occurrence of the composite endpoint of CV death, major coronary events, and non-fatal stroke. Major coronary events included non-fatal MI, documented UA that required admission into a hospital, and all coronary revascularization with either percutaneous coronary intervention (PCI) or coronary artery bypass grafting (CABG) occurring at least 30 days after randomized treatment assignment. The primary efficacy endpoint measure was the time from randomization to the first occurrence of one of the following: CV death, major coronary events (nonfatal MI, documented UA that requires admission into a hospital, all coronary revascularization with either PCI or CABG occurring at least 30 days after randomization), or non-fatal stroke. The following table summarizes the effects on the various endpoints defined by the applicant for the ITT population. 42
71 Table 5: Major Cardiovascular Events by Treatment Group, ITT Population Ezetimibe/Simvastatin 10/40 mg* N=9067 Simvastatin 40 mg N=9077 Outcome n K-M% n K-M% Primary Composite Efficacy Endpoint (CV death, Major Coronary Events and non-fatal stroke) % % Secondary Composite Efficacy Endpoints CHD death, nonfatal MI, urgent coronary revascularization after 30 days % % Major Coronary Events, non-fatal stroke, death (all causes) % % CV death, non-fatal MI, unstable angina requiring hospitalization, any revascularization, non-fatal stroke Tertiary and Exploratory Endpoints (first occurrences of specified event at any time) Cardiovascular death Major Coronary Event: % % % % Non-fatal MI^ % % Unstable angina requiring hosp % % Coronary revasc after 30 days % % Non-fatal stroke^ % % All MI (fatal and non-fatal) % % All stroke (fatal and non-fatal) % % Non-hemorrhagic stroke ^ % % Hemorrhagic stroke^ % % Death from any cause % % * 6% were uptitrated to ezetimibe/simvastatin 10/80 mg. 27% were uptitrated to simvastatin 80 mg. Kaplan-Meier estimate at 7 years. includes ischemic stroke or stroke of undetermined type. ^Exploratory endpoints Hazard Ratio (95% CI) (0.887, 0.988) (0.847, 0.983) (0.903, 0.996) (0.897, 0.996) (0.887, 1.127) (0.798, 0.950) (0.846, 1.326) (0.886, 1.012) (0.678, 0.949) (0.800, 0.950) (0.734, 1.001) (0.670, 0.939) (0.930, 2.040) (0.914, 1.070) p- value
72 EZ/SV reduced the risk of the primary composite endpoint (CV death, major coronary events, and non-fatal stroke) by 6.4% (HR 0.936; 95% CI 0.887, 0.988, p=0.016) with EZ/SV patients experiencing fewer non-fatal MI as the first event (782 [8.62%] vs. 902 [9.94%]) and fewer non-fatal strokes (178 [1.96%] vs. 239 [2.63%] compared to patients on SV monotherapy. Three secondary composite endpoints were similar in the results for the primary endpoint; differences in non-fatal MI and nonfatal strokes between the treatment arms seemed to drive the favorable results of ezetimibe/simvastatin over simvastatin. The treatment effect for the primary endpoint was assessed across multiple subgroups. The unadjusted interaction p-values for age (< 75 years vs. 75 years) and diabetes (yes vs. no) were p=0.005 and p=0.023, respectively. According to the statistical review, although diabetics only made up 27% of the study population, 36% experienced a primary endpoint event compared to 27% of non-diabetics. Similarly, although the 75 year-old population only made up 15% of the population, 36% experienced a primary event compared to 28% in the <75 year-old subgroup. These observed differences are not explained at this time. 3.1 Demographics Patients enrolled in the IMPROVE-IT trial were hospitalized for ST-segment elevation myocardial infarction (STEMI), non-st segment elevation myocardial infarction (NSTEMI), or unstable angina (UA) within 10 days prior to randomization. Although patients in the EARLY ACS trial were eligible to enroll into the IMPROVE-IT trial, this composed only 2% of the IMPROVE-IT trial population. Patient Characteristics Of the 18,144 patients randomized into the study, 4,416 (24.3%) were women and 13,728 (75.7%) were men. Then mean age was 63.6 years. Approximately 15,202 patients were Caucasian (83.8%), 773 (4.3%) were Asian, 808 (4.5%) were of Spanish descent, 499 (2.8%) were Black, and 772 (4.3%) were Other. The majority of patients (78.1%) were enrolled from North America or Western Europe. Approximately 2/3 of patients qualified for the study with NSTE-ACS (NSTEMI or unstable angina) and 1/3 qualified with a STEMI event. 44
73 Table 6: Patient Characteristics, ITT Population 45
74 46
75 Source: IMPROVE-IT CSR, pg. 16/793. The historical information collected at entry in IMPROVE-IT focused on CV history, CV risk factors (including diabetes), CV medications, lipid lowering therapies, and antidiabetes therapies. Population characteristics were similar between the two treatment groups. Approximately 61% of patients had a history of hypertension (61.5% in the EZ/SV group vs. 61.2% in the SV group). Twenty-one percent of patients had a previously documented MI, 26.6% had a history of Coronary Heart Disease (CAD), with 29.2% of these patients exhibiting disease in 3 vessels. A history of diabetes was reported by 27.2% and 20.4% of patients were treated with antidiabetic medications. Prior to the qualifying event, 19% of patients reported a previous PCI and 9.3% had previously undergone CABG. Nearly 4% of patients reported a history of stroke. 47
76 Table 7: Patient Medical History Prior to Qualifying Event, ITT Population Source: IMPROVE-IT CSR, Table 10-4, pg
77 Patient Medical History Prior to Qualifying Event, ITT Population, continued Source: IMPROVE-IT CSR, Table 10-4, pg
78 Patient Medical History Prior to Qualifying Event, ITT Population, continued Source: IMPROVE-IT CSR, Table 10-4, pg Patient Medications Prior to Qualifying Event Use of concomitant medications was similar between treatment groups and consistent with expected needs of the studied population. The following is a list of commonly used medications in patients prior to their qualifying (index) event: Lipid-lowering therapy (35.5%), dual antiplatelet (8.8%), thienopyridine (10.8%), aspirin (42.2%), warfarin (2.8%), agents acting on the renin-angiotensin system (40.9%), diuretics (20.4%), drugs used for diabetes (20.4%), hormone replacement therapy (2.6%), beta-blocking agents (34.7%), calcium channel blockers (15.3%), and nitrate (13.8%). Of note 64% percent of patients in the protocol defined ITT population were naïve to lipid lowering therapy prior to their qualifying ACS event. Of the approximate 36% who were on lipid lowering therapy, the majority were on statins. The types of stains and their frequency of use are summarized in the table below. Recall that patients would not have been eligible for the trial if they had been receiving >4 weeks of lipid-lowering therapy with simvastatin >40 mg, atorvastatin 40 mg, any dose of rosuvastatin, or ezetimibe co-administered with any dose of statin. If a patient had been taking one of these regimens for <4 weeks prior to their qualifying event, they would have been eligible for enrollment. Table 8: Types of Statins Used Prior to Qualifying Event, ITT Population Type of Statin EZ/SV SV Total N (%) N (%) N(%) Yes-On a Statin Prior to Index Event 3135 (34.6) 3111 (34.3) 6246 (34.4) Fluvastatin 38 (1.2) 45 (1.4) 83 (1.3) Pravastatin 196 (6.3) 183 (5.9) 379 (6.1) Simvastatin 1787 (57.0) 1775 (57.1) 3562 (57.0) Atorvastatin 879 (28.0) 912 (29.3) 1791 (28.7) Rosuvastatin 31 (1.0) 21 (0.7) 52 (0.8) Lovastatin 203 (6.5) 174 (5.6) 377 (6.0) Source: IMPROVE-IT CSR, Table 10-5, pg The following table shows statin use/potency in patients prior to their qualifying event. 50
79 Table 9: Statin Use/ Potency Prior to Qualifying Event, ITT Population Statin Potency EZ/SV SV Total N (%) N (%) N(%) Yes-On a Statin Prior to Index Event 3135 (34.6) 3111 (34.3) 6246 (34.4) Potency Simvastatin 40 mg 2984 (95.2) 2986 (96.0) 5970 (95.6) Potency > Simvastatin 40 mg 146 (4.7) 122 (3.9) 268 (4.3) Missing 5 (0.2) 3 (0.1) 8 (0.1) Not on Statin Prior to Index Event 5925 (65.3) 5953 (65.6) (65.5) Missing 7 (0.1) 13 (0.1) 20 (0.1) Source: IMPROVE-IT CSR, Table 10-5, pg Patient Medications Between Qualifying Event and Randomization Although treatment during the acute phase of the qualifying ACS event was not controlled by the protocol, medication use at the time of and during the treatment for the qualifying event was well balanced between the treatment groups. The following is a list of commonly used medications during the time of qualifying event to randomization. Note that although only 34% of patients were taking statin therapy prior to their qualifying event, 77% were taking a statin therapy at the time of randomization, which reflects the initiation of statin treatment between their qualifying event and randomization. As shown in Table 6, the median [IQR] time between the qualifying event and randomization was 5 [3, 8] days. Medication use at time of randomization included lipid-modifying agents (77.6%), dual antiplatelet (thienopyridine+ aspirin) (81.9%), thienopyridine (83.5%), aspirin (96.9%), warfarin (3.5%), antithrombotic therapy (86.4%), glycoprotein IIb/IIIa inhibitor (35.9%), agents acting on the renin-angiotensin system (68.2%), diuretics (22.2%), drugs used for diabetes (21.5%), hormone replacement therapy (1.8%), beta-blocking agents (84.4%), calcium channel blockers (16.1%), and nitrate (70.2%). The type, potency and frequency of statin used between the qualifying event and randomization are summarized in the following tables. Table 10: Types of Statins Used at Time of Qualifying Event to Randomization, ITT Population Type of Statin EZ/SV SV Total N (%) N (%) N(%) Yes-On a Statin During Qualifying Event to Randomization 7023 (77.8) 7003 (77.2) (77.3) Fluvastatin 68 (1.0) 82 (1.2) 150 (1.1) Pravastatin 267 (3.8) 273 (3.9) 540 (3.8) Simvastatin 3554 (50.6) 3543 (50.6) 7097 (50.6) Atorvastatin 2680 (38.2) 2673 (38.2) 5353 (38.2) Rosuvastatin 154 (2.2) 139 (2.0) 293 (2.1) Lovastatin 300 (4.3) 293 (4.2) 593 (4.2) No Statin During Qualifying Event to Randomization 2039 (22.5) 2066 (22.8) 4105 (22.6) Missing 5 (0.1) 8 (0.1) 13 (0.1) Source: IMPROVE-IT CSR, Table 10-6, pg
80 Table 11: Statin Use/Potency from Time of Qualifying Event to Randomization, ITT Population Statin Potency EZ/SV SV Total N (%) N (%) N(%) Yes-On a Statin During Qualifying Event to Randomization 7023 (77.5) 7003 (77.2) (77.3) Potency Simvastatin 40 mg 5078 (72.3) 5106 (72.9) (72.6) Potency > Simvastatin 40 mg 1944 (27.7) 1893 (27.0) 3837 (27.4) Missing 1 (0.0) 4 (0.1) 5 (0.0) No Statin During Qualifying Event to Randomization 2039 (22.5) 2066 (22.8) 4105 (22.6) Missing 5 (0.1) 8 (0.1) 13 (0.1) Source: IMPROVE-IT CSR, pg Subject Disposition In the IMPROVE-IT trial, there was no formal tracking of patients who were screened but not randomized. Patients who agreed to participate and who completed the study were defined as those who were followed from time of randomization through at least May 1, These completers were then subcategorized as those who completed on therapy (on study drug) or off therapy (off study drug). Patients who did not complete the study were further categorized as follows: Vital Status Only: Patients who discontinued participation and per protocol follow-up, but for whom vital status (i.e., whether alive or dead) on or after January 1, 2014 could be determined; Withdrew Consent/No Vital Status: Patients who withdrew consent, were not contacted again, and for whom vital status could not be established. In some cases the subjects could not be located by the investigators. In other cases, local laws prohibited contact of a subject by the investigator to inquire about vital status or to pursue registry information; Site Closure: Patients who ended participation for administrative reasons (e.g., site closure) where further follow-up was not possible. Some sites closed of necessity prior to the end of the trial and the continuing patients were unable to transfer to a different study site. Lost to Follow-up: Patients who were randomized into the trial, may have participated for a period, but did not have any contact with the site or vital status on or after January 1, A total of 18,144 patients were randomized into the study at 1,147 sites in 39 countries. There were 9,067 patients in the ezetimibe/simvastatin (EZ/SV) group and 9,077 patients in the simvastatin monotherapy (SV) group. 52
81 Of the 9,067 patients in the EZ/SV arm, 6,868 (75.7%) completed the study, 964 (10.6%) died before the final visit, and 1,235 (13.6%) did not complete the study but were not known to have died. Among the 6,868 who completed the study, 4,294 remained on study drug until the final visit, 2,501 had discontinued study drug, and 73 had never received study drug. Of the 9,077 patients in the SV treatment arm, 6,860 (75.6%) completed the study, 968 (10.7%) died before the final visit, and 1,249 (13.8%) did not complete the study but were not known to have died. Among the 6,860 who completed the study, 4,168 remained on study drug until the final visit, 2,607 had discontinued study drug, and 85 had never received study drug. Of the patients who did not complete a final visit on or after May 1, 2014, the following disposition table shows how many patients had vital status determined or were lost to follow-up. Overall, 728 of 18,144 (4%) patients in both treatment arms were lost to follow up or whose vital status could not be determined. 53
82 Table 12: IMPROVE-IT Disposition of Patients, Reason for Study Drug Discontinuation, and Reason for Study Discontinuation, ITT Population % = n / Number of subjects in protocol-defined ITT population. Completed final visit was defined as an office or telephone visit on or after 5/1/2014. Completed Final visit on study drug on or after 5/1/2014 Subject was alive and taking study drug within 60 days of their final visit (office or telephone) on or after 5/1/
83 Died before final visit includes deaths that occurred within 4 months of an office or telephone visit. Vital status Vital status on or after 1/1/2014. Source: IMPROVE-IT CSR, Table 10-1, pg Reviewer Comment: Among patients who completed the study, 164 had discontinued study drug for the reason other (84 on EZ/SV and 80 on SV). In the majority of cases, there was no verbatim term corresponding to the Other reason for drug discontinuation (108 of 164 patients) because the Applicant classified patients who permanently stopped study medication more than 60 days prior to a final visit on or after May 1, 2014 as having Completed Off Study Drug. Of the remaining patients, there was one case patient refused by general condition worsened, which might be interpreted as an adverse event; however, this one case would not change the overall incidence of drug discontinuation due to an AE. The table above includes the reasons for study drug discontinuation among patients who completed the study. The following table includes the reasons for study drug discontinuation for patients who did not complete the study or who died before final visit. 55
84 Table 13: Patient Disposition, Reason for Study Drug Discontinuations for Patients who did not Complete Study, ITT Population, Continued Source: Applicant Submission, 14-Oct Reviewer Comment: Among patients who did not complete the study, 60 patients had discontinued study drug for the reason other (32 in EZ/SV and 28 in SV). Review of verbatim terms showed there was one patient in the EZ/SV arm (ID# 03326/010617) who recovered from a CEC-adjudicated event of myopathy. Patient s study drug was interrupted and later permanently discontinued. Another patient in the SV arm (ID#03803/001185) reported muscle weakness and pain with CK values in the normal range; patient discontinued study drug within two weeks of reporting the adverse event. Clinical follow-up was defined as time from randomization to the last office or telephone visit or time to death, provided that death occurred within 4 months of an office or telephone visit. Patient-years of follow-up for each patient was based on the day of randomization to the day of the first occurrence of primary endpoint event, the day of 56
85 death on follow-up, or the last office or phone visit. Follow-up time was similar between the two treatment arms for the ITT population, as shown in the table below. Table 14: Summary of Follow-Up Time for Primary Endpoint by Treatment Arm, ITT Population Source: IMPROVE-IT CSR, Table 10-13, pg. 167/793. The median length of follow-up for the primary endpoint in the protocol-defined ITT population was 56.9 months (4.7 years), with only 1.4 months difference between the EZ/SV arm (57.6 months) and the SV arm (56.2 months). On- treatment follow-up was based on the first dose of study medication to the day of the first occurrence of a primary endpoint event while on-treatment or death on followup while on treatment or the minimum of the last dose + 30 days and the last office or phone visit. The following table shows a summary of on-treatment follow-up. 57
86 Table 15: Summary of Follow-Up Time for the Primary Composite Endpoint by Treatment Arm, On-Treatment Population Source: IMPROVE-IT CSR, Table 10-14, pg. 169/793. The median length of follow-up for the primary endpoint in the on-treatment population was 40 months (3.3 years). The median length of time on treatment in the EZ/SV arm was approximately 3 months longer than the SV arm (41.2 and 38.1 months, respectively). 58
87 3.3 Analysis of Primary Endpoint The primary endpoint was the time from randomization to the first occurrence of one of the following: CV death, non-fatal MI, non-fatal stroke, documented unstable angina that requires hospitalization, or coronary revascularization with either PCI or CABG occurring at least 30 days after randomization. Treatment with EZ/SV resulted in a 6.4% relative risk reduction in the primary efficacy endpoint compared to treatment with SV monotherapy (HR=0.936; 95% CI ; p=0.016). Table 16: Primary Efficacy Analysis, ITT Population EZ/SV N=9067 n (%) Primary Composite Endpoint 2572 SV N=9077 n (%) 2742 (28.37) (30.21) Cardiovascular death 342 (3.77) 319 (3.51) Non-fatal MI 782 (8.62) 902 (9.94) Non-fatal Stroke 178 (1.96) 239 (2.63) Documented UA requiring hospitalization 117 (1.29) 107 (1.18) Hazard Ratio (95% CI); p-value (0.887, 0.988), p=0.016 Coronary revascularization with PCI or CABG > days after randomization (12.72) (12.94) If a subject has multiple events only the first event contr buting to the composite endpoint is counted in the component row of the table. Crude number of events (n) and percentage (%) Hazard ratio (EZ/SV vs. SV), confidence interval, and p-value from Cox proportional hazard model with covariates of the stratification factors (EARLY ACS trial, chronic prescription lipid-lowering experience, and high-risk ACS diagnosis) and treatment. N = Number of subjects in protocol-defined ITT population. Source: IMPROVE-IT CSR, Table 11-2, pg Reviewer Comment: Compared to SV arm, there were fewer nonfatal MI and nonfatal stroke in EZ/SV treatment arm, which appear to be responsible for the overall effect observed on the composite. Coronary revascularizations made the largest contribution to the events composing the primary endpoint (approximately 45% of the events in the EZ/SV treatment arm and 43% in the SV treatment arm), although the numbers of these events contributing to the primary composite were very similar between treatment arms. Additionally, there were numerically more cardiovascular deaths and unstable angina occurring as first events in the EZ/SV arm than in SV arm. The following figure shows the Kaplan-Meier plot for the primary endpoint. 59
88 Figure 2: Kaplan-Meier Plot for Primary Endpoint, ITT Population Source: IMPROVE-IT CSR, Figure 11-1, pg. 183/793. The primary endpoint occurred in 2,572 (28.4%) of 9,067 patients in the EZ/SV group and 2,742 (30.2%) of 9,077 patients in the SV monotherapy group in the ITT population. The rate of events was substantially higher in the first year after randomization than subsequent years, perhaps reflecting the high risk of a recent ACS event. The Kaplan- Meier curve separated at approximately 1 year. Risk Difference and Number Needed to Treat The following table shows the risk differences each year, using Kaplan-Meier estimates, for the primary composite endpoint. Table 17: Number Needed to Treat for Primary Efficacy Endpoint Based on Kaplan-Meir Curve, ITT Population Time since Randomization (Year) EZ/SV SV Risk Difference (95% CI) (SV-EZ/SV) NNT (95% CI) KM Std Error KM Std Error (-0.005, ) (-0.003,
89 Time since Randomization (Year) EZ/SV SV Risk Difference (95% CI) (SV-EZ/SV) 0.021) ( 0.005, 0.031) ( 0.007, 0.035) (-0.001, 0.029) ( 0.004, 0.036) NNT (95% CI) 56 (32, 200) 48 (29, 143) (28, 250) KM= Kaplan-Meir Rate Risk differences are based on the differences in the Kaplan-Meier (KM) rates. Derivation of the 95% confidence intervals (CIs) utilizes the standard errors of the KM rates. NNT and 95% CI of NNT are based on the inversion of the risk differences and 95% CI of the risk differences. CIs for NNT were not derived when the CIs for the risk differences included 0. Source: Applicant Submission, Oct. 9, Non-fatal Myocardial Infarctions that Contributed to Primary Composite Endpoint The case report form listed the types of myocadial infarction categorized in the IMPROVE-IT trial: A. Non-procedural B. MI post PCI, no recent MI C. MI post CABG, no recent MI D. Non-procedural MI after a recent MI E. Post PCI MI after a recent MI F. Post CABG MI after a recent MI Since only the initial MI event could have contributed towards the primary composite endpoint, none of the categories that included after a recent MI were relevant. Nonprocedural MIs made up 98.2% of the MIs that contributed to the primary composite endpoint. Table 18: Types of CEC-Adjudicated Non-fatal Myocardial Infarction That Contributed to the Primary Composite Endpoint Type of MI (per CEC) EZ/SV N=9067 n (%) SV N=9077 n (%) All Non-fatal MI that contributed to the primary endpoint 782 (8.62) 902 (9.94) Non-Procedural MI, no recent MI 769 (8.48) 885 (9.75) MI post PCI, no recent MI 11 (0.12) 17 (0.19) MI post CABG, no recent MI 2 (0.02) 0 Source: Applicant submission 14 Oct 2015; confirmed by reviewer using submitted datasets. On the VISIT ecrf form, investigators answered the question, Since last visit, did the Patient experience MI/Unstable Angina/ or chest pain requiring evaluation in an emergency room or hospital setting. If Yes was checked for this response, a dedicated ecrf was generated ( UAMI Unstable Angina MI Assessment) to collect 61
90 additional information about the event. As part of this form, the investigator selected 1 of 5 boxes for the Diagnosis of suspected ischemic event. Choices included: ST Elevation MI, Non-ST Elevation MI, Unstable Angina, Stable Angina, or Non-Ischemic Etiology. Considering only the 1,684 first non-fatal MI events that contributed to the primary composite endpoint, the table below shows the distribution of investigatorreported diagnoses for these events, which were then all adjudicated as non-fatal MI by the CEC. Table 19: Investigator-reported Diagnoses for CEC-adjudicated Non-fatal MIs in Primary Composite EZ/SV SV Non-ST Elevation MI ST Elevation MI Unstable Angina Non-Ischemic 0 1 Etiology Missing 2 0 Total Source: Reviewer-generated using submitted datasets. MIs selected from adtte dataset, where EVENTCD= PRIMARY & COMPOC= MI ; adjudication trigger numbers obtained from TRIGNO (cecmi.xpt merged on date of event), which were then used to retrieve investigator-reported diagnoses from uami.xpt dataset (DIAGNOSC). Reviewer Comment: The majority of events contributing to the primary composite that were adjudicated by the CEC as non-fatal MIs had been reported by the investigators to be non-st elevation MI or unstable angina. The following table summarizes the adjudication criteria met by the non-fatal MIs that contributed to the primary composite endpoint. Table 20: Adjudication Criteria Met for Non-fatal MIs in Primary Composite EZ/SV SV Total Non-fatal MIs in Primary Composite Non-Procedural MIs in Primary Composite New Q-waves in 2 leads Troponin > ULN only confirmed CKMB > ULN only confirmed Troponin & CKMB > ULN both confirmed CK 2xULN only confirmed 2 0 No New Q-waves in 2 leads Troponin > ULN only confirmed CKMB > ULN only confirmed Troponin & CKMB > ULN both confirmed CK 2xULN only confirmed 3 7 MI post PCI in Primary Composite New Q-waves in 2 leads 0 0 No New Q-waves in 2 leads CKMB 3xULN only confirmed CK 3xULN only confirmed
91 EZ/SV SV + Troponin 3xULN only confirmed 4 5 MI 72 hrs post CABG 2 0 CKMB 10xULN or 2 0 * Given the presence of Q-waves in 2 leads, the italicized criteria were not required to be met for a non-procedural MI. Nevertheless, the italicized numbers represent cases in which the adjudicator affirmed laboratory values in addition to specifying that there were new Q-waves in 2 leads. The numbers presented in this table summarize the criterion boxes checked by adjudicators on the MI Adjudication Form cover sheet for non-fatal MIs that contribute to the primary endpoint. Note that only confirmed does not necessarily indicate that other cardiac biomarkers were measured and found to be less than ULN they may not have been measured at all. Source: Reviewer generated from submitted datasets. Non-procedural MIs selected from adtte.xpt, where EVENTCD= PRIMARY & COMPOC= MI & MI= A. Adjudication information retrieved from MIATXT, MIBTXT, and MICTXT variables in cecmi.xpt. Given that the majority of MIs were adjudicated based on troponin criteria, peak troponin values were descriptively examined for these events as a crude assessment of severity. The applicant had submitted CK, CKMB, troponin I, and troponin T values in a dedicated dataset. Out of the 1,448 non-procedural MIs that contributed to the primary endpoint and did not have new Q-waves in 2 leads but did meet troponin criteria, 1,355 had a quantitative troponin assay value within 7 days of the event (bedside/qualitative assays, which were also acceptable for adjudication, were not used in this analysis). The peak troponin T and troponin I values for each such MI were selected; 90% of these peak values occurred within 2 days of the adjudicated date of the MI. This yielded 497 troponin T values and 896 troponin I values (some patients had values for both). The following table shows the median [IQR] values for the peak recorded troponin T and I values for this subset of MIs, as well as the same values categorized by the investigator-reported diagnoses for these events. Table 21: Peak Troponin Values Surrounding Selected Non-procedural MIs (see text) Non-procedural MIs w/o Q-waves that met Troponin Criteria (n=1448) Quantitative value within 7 days of event 0.33 [0.11, 1.40] Peak Troponin T (ng/ml) (n=497) 1.81 [0.41, 9.45] Peak Troponin I (ng/ml) Reported Unstable Angina by Investigator* (n=250 of 1448) Reported NSTEMI by Investigator (n=903 of 1448) Reported STEMI by Investigator (n=293 of 1448) n=1355 n=230 n=848 n= [0.03, 0.32] (n=97) 0.32 [0.13, 0.88] (n=292) 2.28 [0.32, 7.98] (n=107) 0.22 [0.09, 1.07] 1.69 [0.52, 6.14] [3.15, 43.00] (n=896) (n=138) (n=580) (n=177) Since local laboratories were used, the reference ranges varied, but all were measured in ng/ml (ug/l). For troponin T and troponin I, 90% of the reference ranges had ULN (and/or threshold for MI) 0.13 ng/ml and 0.50 ng/ml, respectively, for the values included in this descriptive analysis. * Two patients are not included in the subcategories of investigator-reported diagnoses: one patient with a missing category for investigator-reported diagnosis and one patient reported as non-ischemic etiology by the investigator but adjudicated as a non-fatal MI. Source: Reviewer generated using adtte, cecmi, uami,and cktrp datasets. 63
92 Non-fatal Strokes that Contributed to Primary Composite Endpoint For the 417 non-fatal strokes contributing to the primary composite endpoint, the following table shows the distribution of how investigators responded to the query regarding the resolution of signs and symptoms on the Stroke ecrf. Investigators could select Yes, Complete resolution; Yes, Partial resolution; or No Resolution. These responses were not adjudicated by the CEC. Information regarding stroke-related disability (e.g., modified Rankin scale) was not collected. Table 22: Investigator-reported Resolution of Signs/Symptoms for Non-fatal Strokes in Primary Composite Non-fatal Strokes Contributing to Primary Composite Endpoint EZ/SV SV 178 (100%) 239 (100%) No Resolution 23 (12.9%) 37 (15.5%) Partial Resolution 84 (47.2%) 104 (43.5%) Complete Resolution 69 (38.8%) 95 (39.8%) Missing 2 (1.1%) 3 (1.3%) Source: Reviewer-generated from submitted datasets. Strokes selected from adtte.xpt, where EVENTCD= PRIMARY & COMPOC= STRKE. Resolution information obtained from STRKRES variable in strokefu dataset. Reviewer Comment: Although information regarding stroke-related disability was not collected, approximately 60% of the non-fatal strokes that contributed to the primary composite endpoint led to symptoms that did not completely resolve, per the investigator s report. Investigators also reported the type of event for suspected cerebrovascular events. Options included (1) Periprocedural, (2) Embolic / Ischemic without Hemorrhagic Conversion, (3) Embolic /Ischemic with Hemorrhagic Conversion, (4) Primary Hemorrhagic, or (5) Unknown. Upon adjudication, the CEC assigned the type of event as well, if they determined that an IMPROVE-IT stroke occurred. The following table shows the distribution of types of events of the 417 total non-fatal strokes contributing to the primary endpoint as reported by investigators (rows) and adjudicators (columns). 64
93 Table 23: Investigator-reported Event Types vs. CEC-Adjudicated Stroke Types for Primary Composite Investigator-Reported Type of Event Non- Hemorrhagic Cerebral Infarction CEC-Adjudicated Stroke Type Nonhemorrhagic Infarction with Hemorrhagic Conversion Primary Hemorrhagic Uncertain Embolic/Ischemic without Hemorrhagic Conversion Embolic/Ischemic with Hemorrhagic Conversion Primary Hemorrhagic Periprocedural Periprocedural, Embolic/Ischemic without Total Hemorrhagic Conversion Unknown Missing Total Source: Reviewer-generated from submitted datasets. Strokes selected from adtte.xpt, where EVENTCD= PRIMARY & COMPOC= STRKE. Investigator-reported event type & CEC-adjudicated stroke type obtained from STRKTXT and STRKTYPE variables in strokefu and cecstroke datasets, respectively. Unstable Angina Events that Contributed to Primary Composite Endpoint For the 224 events of unstable angina requiring hospitalization that contributed to the primary composite endpoint, the following table describes the criteria by which the CEC determined that these events met the definitions required for an IMPROVE-IT unstable angina event. Table 24: Adjudication Criteria Met for Unstable Angina Events in Primary Composite All unstable angina events contributing to primary composite endpoint EZ/SV SV 117 (100%) 107 (100%) (All events required a 10 min episode of ischemic discomfort consistent with unstable angina that occurred prior to presenting to the hospital + at least one of the below criteria.) Distinct episode of ischemic discomfort at rest 10 min in hospital attributed to myocardial ischemia by physician New ST/T wave change in 2 contiguous leads consistent with ischemia 62 (53.0%) 59 (55.1%) 49 (41.9%) 32 (40.2%) Both of the above 6 (5.1%) 5 (4.7%) Source: Reviewer-generated from submitted datasets. Unstable angina events selected from adtte dataset where EVENTCD= PRIMARY & COMPOC= UA. Adjudication criteria obtained from UATYPEC variable in cecua dataset. Individual cardiovascular event categories The following tables show analyses for individual cardiovascular events, with the outcome measure being the time from randomization to the first occurrence of that event within the ITT population. Estimates of hazard ratios and 95% confidence intervals used the same Cox proportional hazards model specified for the primary 65
94 composite endpoint analysis. There was no adjustment for multiplicity for these endpoints. The endpoints analyzed were: death from any cause CHD death CV death MI (fatal or non-fatal) Stroke (fatal or non-fatal) Documented unstable angina that requires admission into a hospital All coronary revascularization with either PCI or CABG occurring at least 30 days after randomization Urgent coronary revascularization with either PCI or CABG occurring at least 30 days after randomization All revascularization occurring at least 30 days after randomization (including non-coronary) Any cardiovascular event leading to admission into a hospital CHF that requires hospitalization occurring at least 30 days after randomization. Table 25: Analysis of Individual Endpoints: Death from Any Cause, Myocardial Infarction, Stroke and Subsets of those Endpoints, ITT Population EZ/SV N=9067 n (%) SV N=9077 HR (95% CI) P n (%) Death from any cause 1215 (13.40) 1231 (13.56) (0.914, 1.070) Cardiovascular death 537 (5.92) 538 (5.93) 1.00 (0.887, 1.127) CHD death 440 (4.85) 461 (5.08) (0.839, 1.089) Non-cardiovascular death 511 (5.64) 495 (5.45) (0.914, 1.171) Unknown death 167 (1.84) 198 (2.18) (0.688, 1.038) MI (fatal or non-fatal) 977 (10.78) 1118 (12.32) (0.800, 0.950) Non-fatal MI 945 (10.42) 1083 (11.93) (0.798, 0.950) Fatal MI 41 (0.45) 49 (0.54) (0.554, 1.270) Stroke (fatal or non-fatal) 296 (3.26) 345 (3.80) (0.734, 1.001) Fatal stroke 52 (0.57) 43 (0.47) (0.812, 1.823) Non-hemorrhagic/unknown Hemorrhagic Non-fatal stroke 245 (2.70) 305 (3.36) (0.678, 0.949) Non-hemorrhagic/unknown 242 (2.67) 305 (3.36) (0.670, 0.939) Non-hemorrhagic 236 (2.60) 297 (3.27) (0.670, 0.943) Unknown 6 (0.07) 8 (0.09) (0.261, 2.167) Hemorrhagic 59 (0.65) 43 (0.47) (0.930, 2.040) Crude number of events (n) and percentage (%). Hazard ratio (EZ/Simva vs. Simva), confidence interval, and p-value from Cox proportional hazard model with covariates of treatment and stratification factors EARLY ACS trial, chronic prescription lipid-lowering experience, and high-risk ACS diagnosis. N = Number of subjects in protocol-defined ITT population. Source: IMPROVE-IT CSR, Table 11-7, pg. 204/
95 Reviewer Comment: Cardiovascular deaths (n= 1,075) made up 44% of all deaths in the trial. Of those cardiovasular deaths, 83% (n=901) were attributable to CHD. Individual endpoints of non-fatal MI and non-fatal stroke showed the most favorable results for EZ/SV. There was an imbalance in hemorrhagic stroke against EZ/SV. All first myocardial infarction events (non-fatal and fatal) were further broken down by the type of MI that occurred. Since only the initial MI event would contribute towards the individual efficacy endpoint of all MIs (non-fatal and fatal), there were no occurrences of MI for the following types: Non-procedural MI after a recent MI, Post PCI MI after a recent MI, and Post CABG MI after a recent MI. Table 26: Types of Myocardial Infarction for All First Myocardial Infarction Events (Non-fatal and Fatal), ITT Population Type of MI EZ/SV N=9067 n (%) SV N=9077 n (%) Hazard Ratio (95% CI) All First MI Events (non-fatal and fatal) 977 (10.78) 1118 (12.32) (0.800, 0.950) Non-Procedural MI, no recent MI 956 (10.54) 1090 (12.01) (0.803, 0.955) MI post PCI, no recent MI 18 (0.20) 26 (0.29) MI post CABG, no recent MI 3 (0.03) 2 (0.02) Source: Applicant Submission 14 Oct Reviewer Comment: There were fewer events in all categories of MI in the EZ/SV arm as compared to the SV arm, with non-procedural MI making up 97.7% of the MI events. Hemorrhagic Stroke There was a higher incidence of hemorrhagic stroke with EZ/SV; 59 (0.65%) hemorrhagic strokes in the EZ/SV group compared to 43 (0.47%) in the SV monotherapy group. The difference between treatment arms was not statistically significant (HR=1.377, 95% CI ; p=0.110). Of the 59 hemorrhagic strokes in EZ/SV, 28 (47%) were fatal vs. 11 (26%) of 43 in the SV group. In an analysis with the on-treatment population, which censored events occurring beyond 30 days after the date of permanent study drug discontinuation, there were 32 hemorrhagic stokes in the EZ/SV group and 34 in the SV group. The following table shows the incidence of hemorrhagic stroke by various baseline characteristics for each treatment arm. 67
96 Table 27: Incidence of Hemorrhagic Stroke by Baseline Characteristics, ITT Population Gender Age Group Current Smoker Hypertension EZ/SV N=9067 SV N=9077 Total N=18,144 n/m % n/m % n/m % Male 47/ % 37/ % 84/ % Female 12/ % 6/ % 18/ % < 65 years 20/ % 23/ % 43/ % 65 years 39/ % 20/ % 59/ % Yes 14/ % 13/ % 27/ % No 45/ % 30/ % 75/ % Missing 0/7 0 0/5 0 0/12 0 Yes 58/ % 42/ % 100/ % No 1/ % 1/ % 2/ % Missing 0/4 0 0/5 0 0/9 0 Anti-hypertensive Medications < 2 43/ % 33/ % 76/ % 3 16/ % 10/ % 26/ % Missing 0/5 0 0/7 0 0/12 0 History of Cerebrovascular Disease Yes 10/ % 5/ % 15/ % No 49/ % 38/ % 87/ % Missing 0/4 0 0/6 0 0/10 0 Diabetes Yes 23/ % 10/ % 33/ % No 36/ % 33/ % 69/ % Missing 0/4 0 0/5 0 0/9 0 Baseline Systolic Blood Pressure (mmhg) < / % 35/ % 67/ % / % 7/ % 32/ % Missing 2/ % 1/ % Percentage (%) = [number of events (n) / number of subjects in subgroup (m)] x 100. Hypertension includes medical history of hypertension or anti-hypertensive medications (beta blocker, ACE inh bitor, ARB, calcium channel blocker, diuretic, other anti-hypertensive) being taken at time of randomization. N = Number of subjects in Protocol-defined ITT Population. Adapted from Applicant Submission, 9/22/2014 Reviewer Comment: Given the small number of events of hemorrhagic stroke, it is difficult to make conclusions with regard to whether certain baseline characteristics may place patients at a higher risk for hemorrhagic stroke if they use EZ/SV compared with SV. The most notable risk differences were observed among patients with baseline SBP 140 mmhg (1.3% vs. 0.4% for EZ/SV and SV, respectively), history of cerebrovascular disease (1.6% vs. 0.8%), age 65 years (1.0% vs. 0.5%), and diabetes (0.9% vs. 0.4%). 68
97 The following table enumerates events related to unstable angina and coronary revascularization. Revascularization procedures (CABG, PCI) were an investigator reported event and did not require review or adjudication by the CEC. Investigators reported coronary revascularizations on the CABG and PCI ecrfs. Investigators reported non-coronary revascularizations on the VASC ecrf. When the investigator reported coronary revascularization procedures (CABG, PCI), the investigator also provided their assessment of whether the procedure was unplanned (urgent/ emergent) or elective. However, for the purposes of study endpoint analyses, urgent coronary revascularizations were not defined by this Investigator urgency assessment. All urgent coronary revascularizations for study endpoint analyses used the following definition: Coronary revascularization (PCI or CABG) that occurs at least 30 days after randomization, during a hospitalization prompted by a CEC adjudicated myocardial infarction or recurrent unstable angina AND MI or UA occurred prior to or the same day as revascularization and within 10 days of hospitalization AND Date of revascularization occurred during the time period from hospital admission to hospital discharge date Table 28: Analysis of Individual Endpoints: Unstable Angina, Coronary Revascularization and Subsets of those Endpoints, ITT Population EZ/SV N=9067 n (%) SV N=9077 n (%) Documented UA requiring hospitalization 156 (1.72) 148 (1.63) All Coronary revascularization with PCI or CABG days after randomization (18.64) 1456 PCI 30 days after randomization (16.06) 1793 (19.75) 1569 (17.29) CABG 30 days after randomization 324 (3.57) 338 (3.72) Coronary revascularization with PCI or CABG 2091 after randomization (23.06) 1798 PCI after randomization (19.83) 2199 (24.23) 1910 (21.04) CABG after randomization 400 (4.41) 416 (4.58) HR (95% CI) (0.846, 1.326) (0.886, 1.012) (0.866, 0.999) (0.827, 1.122) (0.899, (0.884, 1.006) (0.841, 1.107) (0.724, 0.914) (0.899, 1.020) Urgent coronary revascularization with PCI or 510 (5.62) 626 (6.90) CABG 30 days after randomization All revascularization (20.64) (21.62) Crude number of events (n) and percentage (%). Hazard ratio (EZ/Simva vs. Simva), confidence interval, and p-value from Cox proportional hazard model with covariates of treatment and stratification factors EARLY ACS trial, chronic prescription lipid-lowering experience, and high-risk ACS diagnosis. Exploratory endpoints. N = Number of subjects in protocol-defined ITT population. P- value
98 Source: IMPROVE-IT CSR, Table 11-7, pg. 204/793. The following table summarizes all coronary revascularization events (including both first and recurrent), by urgency and treatment group. Table 29: Summary of All Coronary Revascularization Events by Urgency and Treatment Group EZ/SV n (%) SV n (%) All coronary revasc. with PCI or CABG 30 days after rand Urgent coronary revasc. with PCI or CABG 30 days after rand. 615 (26.4) 782 (31.5) Other coronary revasc. with PCI or CABG 30 days after rand (73.6) 1704 (68.5) Missing Data For time-to-event type efficacy endpoints, patients that did not experience endpoint events during the study were censored at the time of last available information. Patients who withdrew from the study or who were lost to follow-up were censored at the time of drop-out from the study. Here, the Applicant s approach to assessing the potential impact of missing data is described. Refer to the FDA statistical review for further information and analysis. The Applicant assessed the potential impact of missing data on the primary efficacy endpoint under six assumed senarios. 1. Both treatment groups (ezetimibe/simvastatin and simvastatin monotherapy) have the same hazard rate as the point estimate from observed data in the simvastatin group. 2. The simvastatin monotherapy group has the same hazard rate as the point estimate from observed data in the simvastatin group and ezetimibe/simvastatin has the same hazard rate as the upper bound of the 95% CI estimate from observed data in the simvastatin group. 3. The simvastatin monotherapy group has the same hazard rate as the point estimate from observed data in simvastatin group and ezetimibe/simvastatin has the same hazard rate as the percentile estimate from observed data in simvastatin group. 4. The simvastatin monotherapy group has the same hazard rate as the point estimate from observed data in the simvastatin group and ezetimibe/simvastatin has the hazard rate > percentile estimate from observed data in the simvastatin group. 5. Both treatment groups (ezetimibe/simvastatin and simvastatin monotherapy) have the same hazard rate as the point estimate from observed off-treatment follow-up data (treatment groups pooled). 6. The simvastatin monotherapy group has the same hazard rate as the point estimate from observed off-treatment follow-up data and 70
99 ezetimibe/simvastatin has the same hazard rate as the upper bound of the 95% CI estimate from observed off-treatment follow-up data. The Applicant assumed that the time to the first primary efficacy event has an exponential distribution during missed follow-up time. Under each of the assumptions, 2000 simulation samples were generated and the simulation was stratified by the use of prior lipid-lowering therapy. The primary efficacy analysis was performed using complete follow-up data (simulated+observed) for each simulated sample, and inferences for treatment effect under each of the 6 scenarios were obtained using a multiple imputation approach (see table below). Table 30: Sensitivity Analysis of Primary Composite Endpoint with Multiple Imputation of Missing Follow-up Data Assumed event rate in missing data (# events in 100 patient year) EZ/SV N=9067 SV N=9077 Treatment Comparison n n EZ/SV SV (%) (%) HR (95% CI) p- (n1, n2) (n1, n2) value (0.891, (30.83) (32.53) (2572, 223) (2742, 211) 0.992) (0.894, (30.94) (32.53) (2572, 233) (2742, 211) 0.995) (0.896, (30.98) (32.53) (2572, 237) (2742, 211) 0.997) (0.948, (32.52) (32.53) (2572, 377) (2742, 211) 1.054) (0.894, (31.68) (33.35) (2572, 300) (2742, 285) 0.994) (0.898, (31.82) (33.35) (2572, 313) (2742, 285) 0.999) 1. Point estimate of event rate from observed data in Simvastatin group 2. Upper bound of 95% CI of event rate estimate from observed data in Simvastatin group % percentile of event rate estimate from observed data in Simvastatin group 4. > % percentile of event rate estimate from observed data in Simvastatin group 5. Point estimate of event rate from off-treatment follow-up data (treatment groups pooled) 6. Upper bound of 95% CI of event rate estimate from off-treatment follow-up data (treatment groups pooled) Observed number of events + imputed number of events from missing data n1: observed number of events, n2: imputed number of events (average over 2000 imputations assuming exponential distribution) Estimates and inferences are based on multiple imputation analysis (2000 imputations) of Cox PH regression model with covariate of the stratification factors (Early ACS Trial, chronic prescription lipidlowering experience, and high-risk ACS diagnosis) and treatment. Exponential hazard function is assumed in missed follow up. Source: IMPROVE-IT CSR, Table 11-6, pg. 223/793. According to the Applicant, under various assumptions (scenarios 1,2,3,5 and 6), the results continue to show a treatment effect with a p-value range from to However, under scenario 4, the observed treatment effect is completely negated 71
100 (hazard ratio=1). Scenario 4 investigated what rate assumptions would be required if it was assumed the true HR=1. Sensitivity Analyses The Applicant conducted a few sensitivity analyses of the primary endpoint including: An endpoint that included all coronary revascularization events (i.e., not excluding those that occurred within 30 days of the qualifying event). The hazard ratio point estimate was similar to the primary comopsite endpoint. However the p-value was not as robust. (p=0.036). An endpoint that censored patients at the time of simvastatin uptitration. The p- value was not significant (p=0.077). An endpoint with the on-treatment population, which censored patients at 30 days after the date of permanent study drug discontinuation. The treatment effect was maintained (HR 0.924; 95% CI, ; p=0.012). Table 31: Sensitivity Analysis of the Primary Composite Endpoint, Including All Coronary Revascularization Events, ITT Population EZ/SV N=9067 n (%) Primary Composite Endpoint including all 2892 coronary revascularization SV N=9077 n (%) 3054 (31.90) (33.65) Cardiovascular death 328 (3.62) 306 (3.37) Non-fatal MI 748 (8.25) 864 (9.52) Non-fatal Stroke 168 (1.85) 229 (2.52) Documented UA requiring hospitalization 112 (1.24) 99 (1.09) Hazard Ratio (95% CI); p-value (0.900, 0.996); p=0.036 All Coronary revascularization with PCI or CABG (16.94) (17.14) If a subject has multiple events only the first event contr buting to the composite endpoint is counted in the component row of the table. Includes all coronary revascularization events with PCI or CABG after randomization. Crude number of events (n) and percentage (%) Hazard ratio (EZ/Simva vs. Simva), confidence interval, and p-value from Cox proportional hazard model with covariates of the stratification factors(early ACS trial,chronic prescription lipid-lowering experience, and high-risk ACS diagnosis) and treatment. N = Number of subjects in protocol-defined ITT population. Source: IMPROVE-IT CSR, Table 14-5, pg. 346/793. Table 32: Sensitivity Analysis of Primary Composite Endpoint: Patients Censored at Time of Simvastatin Titration, ITT Population EZ/SV N=9067 n (%) Primary Composite Endpoint 2461 SV N=9077 n (%) 2205 (27.14) (24.29) Cardiovascular death 325 (3.58) 260 (2.86) Non-fatal MI 746 (8.23) 721 (7.94) Non-fatal Stroke 171 (1.89) 185 (2.04) Documented UA requiring hospitalization 111 (1.22) 90 (0.99) All Coronary revascularization with PCI or (10.45) Hazard Ratio (95% CI); p-value (0.896, 1.006), p=
101 EZ/SV N=9067 n (%) SV N=9077 n (%) Hazard Ratio (95% CI); p-value CABG (12.22) If a subject has multiple events only the first event contr buting to the composite endpoint is counted in the component row of the table. Crude number of events (n) and percentage (%) Hazard ratio (EZ/Simva vs. Simva), confidence interval, and p-value from Cox proportional hazard model with covariates of the stratification factors (EARLY ACS trial,chronic prescription lipid-lowering experience, and high-risk ACS diagnosis) and treatment. N = Number of subjects in protocol-defined ITT population. Source: IMPROVE-IT CSR, Table 14-6, pg. 347/793. Reviewer Comment: Censoring patients at the time of titration disproportionately affects the simvastatin monotherapy arm. That is, events in the primary composite endpoint were reduced from 2742 events (without censoring) to 2205 events (with censoring for up-titration) in the simvastatin monotherapy arm. This is compared to 2572 events (without censoring) to 2461 events (with censoring for up-titration) in the EZ/SV arm. Table 33: Sensitivity Analysis of Primary Composite Endpoint, On-Treatment Population with Events Censored at 30 Days of Study Drug Discontinuation EZ/SV N=8851 n (%) Primary Composite Endpoint 1932 SV N=8855 n (%) 2079 (21.83) (23.48) Cardiovascular death 140 (1.58) 150 (1.69) Non-fatal MI 593 (6.70) 683 (7.71) Non-fatal Stroke 130 (1.47) 182 (2.06) Documented UA requiring hospitalization 102 (1.15) 86 (0.97) Hazard Ratio (95% CI); p-value (0.868, 0.983), p=0.012 All Coronary revascularization with PCI or CABG 967 (10.93) 978 (11.04) >30 days If a subject has multiple events only the first event contr buting to the composite endpoint is counted in the component row of the table. Crude number of events (n) and percentage (%) Hazard ratio (EZ/Simva vs. Simva), confidence interval, and p-value from Cox proportional hazard model with covariates of the stratification factors (EARLY ACS trial,chronic prescription lipid-lowering experience, and high-risk ACS diagnosis) and treatment. N = Number of subjects in protocol-defined ITT population. Source: IMPROVE-IT CSR, Table 11-12, pg. 215/793. Reviewer Comment: With the on-treatment population, the cardiovascular relative risk reduction with EZ/SV is approximately 7.6% as compared to an analysis with the ITT population which estimated an approximate 6.4% relative risk reduction. 73
102 Figure 3: Kaplan-Meier Plot of Sensitivity Analysis of Primary Endpoint, On- Treatment with Events Censored 30 Days after Study Drug Discontinuation Source: IMPROVE-IT CSR, Figure 14-1, pg. 694/793. Reviewer Comment: The treatment effect was maintained in the sensitivity analysis with events censored at 30 days after the date of permanent discontinuation of study drug (HR 0.924; , p=0.012). The Kaplan-Meier Curve for this sensitivity analysis is similar to the main analysis, with separation between the treatment arms at approximately 1 year. Results for the primary composite endpoint with events censored at 6 months after the date of permanent study drug discontinuation was consistent with the main analysis (HR= 0.922, 0.868, [95% CI], p=0.007). Similarly, analysis of time to events censored at 12 months after the date of permanent study drug discontinuation was HR=0.919, (0.866, 0.974), p=
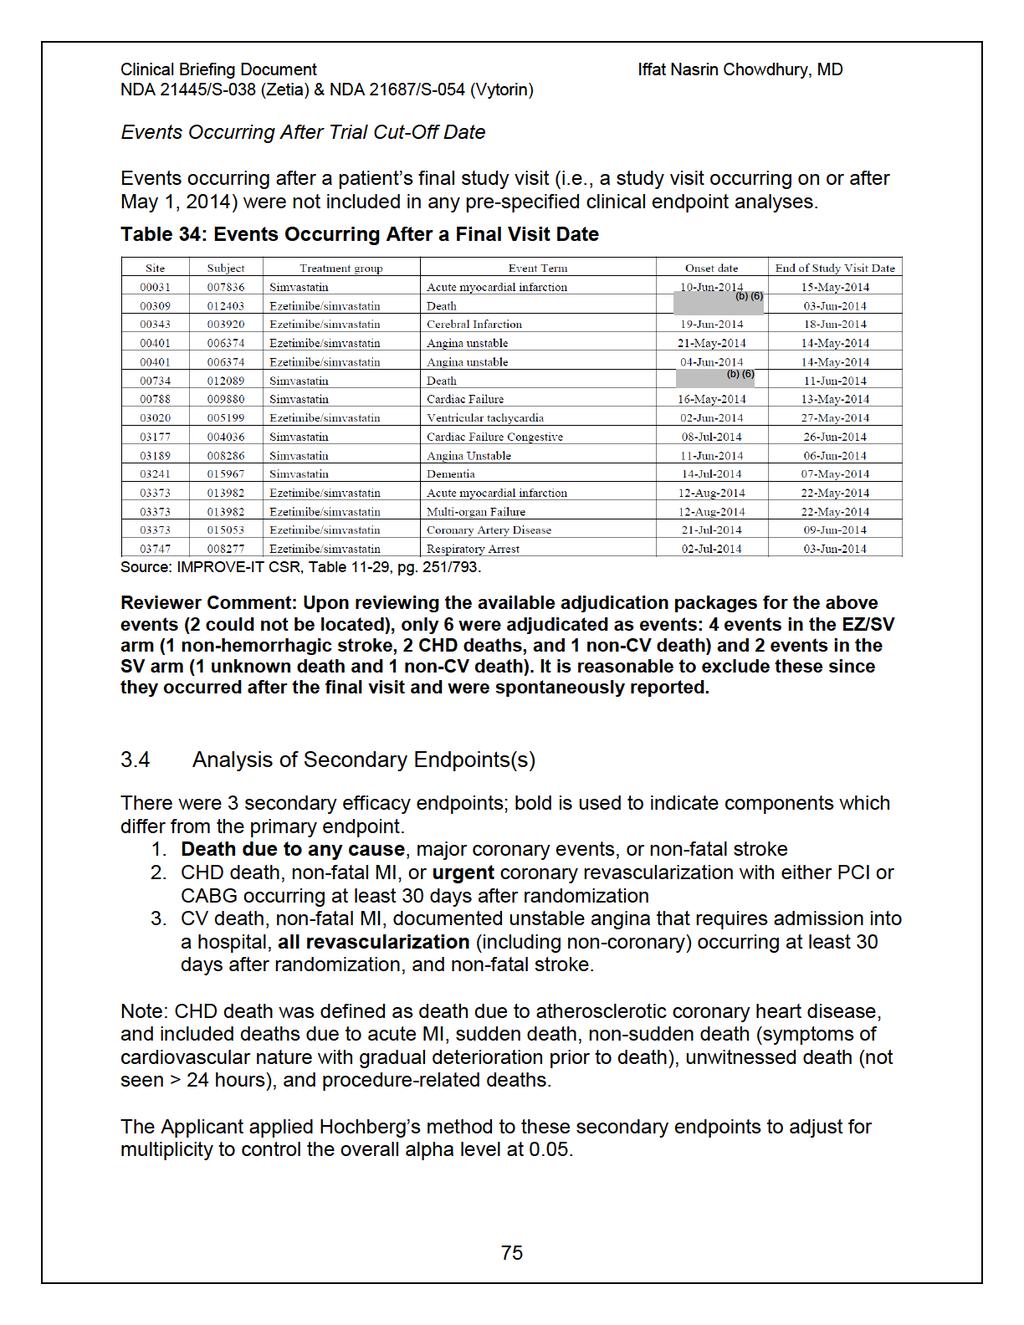
103
104 Secondary Endpoint: Death due to any cause, major coronary events, or non-fatal stroke Patients in the EZ/SV treatment arm had a reduced incidence of the secondary composite endpoint of death due to all causes, major coronary events, and non-fatal stroke (HR=0.948, 95% CI ; p=0.035). Table 35: Secondary Endpoint: Death from Any Cause, Major Coronary Event, or Non-fatal Stroke, ITT Population EZ/SV N=9067 n (%) Secondary Composite Endpoint 3089 SV N=9077 n (%) 3246 (34.07) (35.76) Death from any cause 859 (9.47) 823 (9.07) Non-fatal MI 782 (8.62) 902 (9.94) Non-fatal Stroke 178 (1.96) 239 (2.63) Documented UA requiring hospitalization 117 (1.29) 107 (1.18) Hazard Ratio (95% CI); p-value (0.903, 0.996); p=0.035 All Coronary revascularization with PCI or CABG >30 days (12.72) (12.94) If a subject has multiple events only the first event contr buting to the composite endpoint is counted in the component row of the table. Crude number of events (n) and percentage (%) Hazard ratio (EZ/Simva vs. Simva), confidence interval, and p-value from Cox proportional hazard model with covariates of the stratification factors (EARLY ACS trial,chronic prescription lipid-lowering experience, and high-risk ACS diagnosis) and treatment. N = Number of subjects in protocol-defined ITT population. Source: IMPROVE-IT CSR, Table 11-4, pg, 195/793. Reviewer Comment: Although the nominal p-value was less than 0.05, there were numerically more deaths that occurred as a first event in the EZ/SV arm than the SV arm. 76
105 Figure 4: Kaplan-Meier Curve of Secondary Endpoint: Death from Any Cause, Major Coronary Event, or Non-fatal Stroke, ITT Population Major Coronary Event = Non-fatal MI, documented UA requiring hospitalization, or coronary revascularization with PCI or CABG 30 days after randomization. Source: IMPROVE-IT CSR, Figure 11-3, pg. 199/793. Secondary Endpoint: CHD death, non-fatal MI, or urgent coronary revascularization with either PCI or CABG occurring at least 30 days after randomization Patients in the EZ/SV treatment arm had a reduced incidence of the secondary composite endpoint of death due to CHD, non-fatal MI, and urgent coronary revascularization with either PCI or CABG occurring at least 30 days after randomization(hr 0.912, 95% CI ; p=0.016). Table 36: Secondary Endpoint: CHD Death, Non-fatal MI, or Urgent Coronary Revascularization with PCI or CABG > 30 days after Randomization, ITT Population EZ/SV N=9067 n (%) Secondary Composite Endpoint 1322 SV N=9077 n (%) 1448 (14.58) (15.95) CHD death 333 (3.67) 327 (3.60) Non-fatal MI 935 (10.31) 1076 (11.85) Urgent coronary revascularization with PCI or 54 (0.60) 45 (0.50) Hazard Ratio (95% CI); p-value (0.847, 0.983); p=
106 EZ/SV N=9067 n (%) SV N=9077 n (%) Hazard Ratio (95% CI); p-value CABG > 30 days If a subject has multiple events only the first event contr buting to the composite endpoint is counted in the component row of the table. Crude number of events (n) and percentage (%) Hazard ratio (EZ/Simva vs. Simva), confidence interval, and p-value from Cox proportional hazard model with covariates of the stratification factors (EARLY ACS trial,chronic prescription lipid-lowering experience, and high-risk ACS diagnosis) and treatment. N = Number of subjects in protocol-defined ITT population. Source: IMPROVE-IT CSR, Table 11-5, pg. 196/793. Reviewer Comment: The number of urgent coronary revascularizations is considerably smaller in this secondary endpoint analysis than in the primary composite endpoint. (There were 1153 coronary revascularizations in EZ/SV arm in the primary endpoint analysis compared to 54 in this secondary endpoint analysis. Similarly there were 1175 coronary revascularizations in SV arm in the primary endpoint, compared to 45 revascularizations in this analysis.) This reflects the fact that most urgent coronary revascularizations typically followed a non-fatal MI (see the definition of this endpoint earlier in this review); therefore, the first event contributing to this composite would have already been captured as the MI. Figure 5: Kaplan-Meier Curve of Secondary Endpoint: CHD Death Non-fatal MI, or Urgent Coronary Revascularization with PCI or CABG > 30 days after Randomization, ITT Population Source: IMPROVE-IT CSR, Figure 11-4, pg. 200/
107 Secondary Endpoint: CV death, non-fatal MI, documented unstable angina that requires admission into a hospital, all revascularization, and non-fatal stroke Table 37: Secondary Endpoint: CV Death, Non-fatal MI, Documented UA requiring Hospitalization, All Revascularization, or Non-fatal Stroke, ITT Population EZ/SV N=9067 n (%) Secondary Composite Endpoint 2716 SV N=9077 n (%) 2869 (29.95) (31.61) Cardiovascular death 330 (3.64) 312 (3.44) Non-fatal MI 767 (8.46) 881 (9.71) Non-fatal Stroke 171 (1.89) 233 (2.57) Documented UA requiring hospitalization 116 (1.28) 106 (1.17) All revascularization (coronary and non-coronary, 30 days after randomization) 1332 (14.69) 1337 (14.73) Hazard Ratio (95% CI); p-value (0.897, 0.996); p=0.035 If a subject has multiple events only the first event contr buting to the composite endpoint is counted in the component row of the table. Crude number of events (n) and percentage (%) Hazard ratio (EZ/Simva vs. Simva), confidence interval, and p-value from Cox proportional hazard model with covariates of the stratification factors (EARLY ACS trial,chronic prescription lipid-lowering experience, and high-risk ACS diagnosis) and treatment. N = Number of subjects in protocol-defined ITT population. Source: IMPROVE-IT CSR, Table 11-6, pg. 197/793. Reviewer Comment: This secondary endpoint is very much like the primary endpoint, except that it considers all revascularizations rather than only coronary revascularizations. The HR is similar to the primary endpoint HR and is not surprising given that there were not many more revascularizations over and above coronary revascularizations. Figure 6: Kaplan-Meier Curve Secondary Endpoint: CV Death, Non-fatal MI, Documented UA requiring Hospitalization, All Revascularization, or Non-fatal Stroke, ITT Population 79
108 Source: IMPROVE-IT CSR, Figure 11-5, pg. 201/ Other Endpoints Exploratory Endpoints The following table presents an analysis of the MACE endpoint: cardiovascular death, non-fatal MI, or non-fatal stroke. Table 38: Exploratory Composite Endpoint: Cardiovascular death, Non-fatal MI, Non-fatal Stroke, ITT Population Exploratory Composite Endpoint EZ/SV N=9067 n (%) SV N=9077 n (%) 1544 (17.03) 1704 (18.77) Hazard Ratio (95% CI); p-value (0.841, 0.965); Cardiovascular death 400 (4.41) 373 (4.11) Non-fatal MI 932 (10.28) 1065 (11.73) Non-fatal Stroke 212 (2.34) 266 (2.93) If a subject has multiple events only the first event contr buting to the composite endpoint is counted in the component row of the table. Crude number of events (n) and percentage (%) Hazard ratio (EZ/Simva vs. Simva), confidence interval, and p-value from Cox proportional hazard model with covariates of the stratification factors (EARLY ACS trial,chronic prescription lipid-lowering experience, and high-risk ACS diagnosis) and treatment. N = Number of subjects in protocol-defined ITT population. Source: IMPROVE-IT, CSR, Table 11-8, pg. 209/
109 EZ/SV treatment was associated with a 9.9% reduction in risk for the occurrence of the composite endpoint of CV death, non-fatal MI, and stroke (HR 0.901; , p=0.003). Reviewer Comment: Given that the treatment effect on the primary composite endpoint appeared to be driven by the effect on non-fatal MI and non-fatal stroke, the results of this analysis are consistent. Additional exploratory composite endpoint analyses conducted by the Applicant are shown in the tables below, all of which are variations on the same theme of combining various component endpoints. They are shown for completeness, although do not provide much in the way of new information for interpretation. Table 39: Exploratory Composite Endpoint: CHD death, Non-fatal MI, or Coronary Revascularization with PCI or CABG 30 Days after Revascularization, ITT Population Exploratory Composite Endpoint CHD death Non-fatal MI EZ/SV N=9067 SV N=9077 n (%) KM% (95% CI) n KM% (95% (%) CI) (28.37, (29.97, (25.44) (26.97) 30.52) 32.15) (3.17) (3.15) Treatment Comparison HR (95% CI), p- value (0.892, 0.999); (8.81) (10.25) All coronary revascularizations with PCI or CABG 30 days (13.47) (13.57) If a subject has multiple events only the first event contr buting to the composite endpoint is counted in the component row of the table. Crude number of events (n) and percentage (%). Kaplan-Meier estimate and confidence interval at 7 years. Hazard ratio (EZ/Simva vs. Simva), confidence interval, and p-value from Cox proportional hazard model with covariates of the stratification factors (EARLY ACS trial, chronic prescription lipid-lowering experience, and high-risk ACS diagnosis) and treatment. N = Number of subjects in protocol-defined ITT population. Source: IMPROVE-IT, CSR, Table 11-9, pg. 210/793. Table 40: Exploratory Composite Endpoint: CHD death or Non-fatal MI, ITT Population Exploratory Composite Endpoint n (%) 1281 (14.13) EZ/SV N=9067 SV N=9077 KM% (95% KM% (95% n (%) CI) (16.14, 17.96) 1412 (15.56) Treatment Comparison HR (95% CI), p- CI) value (17.51, 19.36) (0.839, 0.976);
110 EZ/SV SV Treatment N=9067 N=9077 Comparison KM% (95% KM% (95% HR (95% CI) n (%) n, p- (%) CI) CI) value CHD death 336 (3.71) 329 (3.62) Non-fatal MI (10.42) (11.93) If a subject has multiple events only the first event contr buting to the composite endpoint is counted in the component row of the table. Crude number of events (n) and percentage (%). Kaplan-Meier estimate and confidence interval at 7 years. Hazard ratio (EZ/Simva vs. Simva), confidence interval, and p-value from Cox proportional hazard model with covariates of the stratification factors (EARLY ACS trial, chronic prescription lipid-lowering experience, and high-risk ACS diagnosis) and treatment. N = Number of subjects in protocol-defined ITT population. Source: IMPROVE-IT, CSR, Table 11-10, pg. 211/793. Table 41: Exploratory Composite Endpoint: Cardiovascular death or Non-fatal MI, ITT Population Exploratory Composite Endpoint n (%) 1368 (15.09) EZ/SV N=9067 SV N=9077 KM% (95% KM% (95% n (%) CI) (17.20, 19.06) 1475 (16.25) Treatment Comparison HR (95% CI), p- CI) value (18.30, 20.18) (0.860, 0.996); Cardiovascular death 423 (4.67) 392 (4.32) Non-fatal MI (10.42) (11.93) If a subject has multiple events only the first event contr buting to the composite endpoint is counted in the component row of the table. Crude number of events (n) and percentage (%). Kaplan-Meier estimate and confidence interval at 7 years. Hazard ratio (EZ/Simva vs. Simva), confidence interval, and p-value from Cox proportional hazard model with covariates of the stratification factors (EARLY ACS trial, chronic prescription lipid-lowering experience, and high-risk ACS diagnosis) and treatment. N = Number of subjects in protocol-defined ITT population. Source: IMPROVE-IT, CSR, Table 11-11, pg. 212/ Subpopulations The Applicant assessed the consistency of the treatment effect in more than 20 prespecified subgroups for the primary endpoint. There was no adjustment for multiplicity for these subgroup analyses. Demographics Results of the primary efficacy endpoint were consistent across most of the subgroups based on gender, race, and region where patients enrolled. However in Age Group 2 (age < 75 years/ 75 years) patients who were 75 years old had a lower hazard ratio estimate for the primary endpoint (0.797 [0.704, 0.902]) than patients who were < 75 years old (0.971 [0.915, 1.031]), interaction p= The trend for older patients to do better on EZ/SV is also seen in Age Group 1 (< 65/ 65 years), with patients who are 65 HR=0.890 (0.824, 0.961) vs. patients < 65 years HR=0.975 (0.904, 1.051). 82
111 Clinical Briefing Document Figure 7: Subgroup Analysis of Primary Composite Endpoint with Demographic Characteristics, ITT Population Source: IMPROVE-IT CSR, Figure 11-2, pg. 191/793. Further analysis of the older age group(age < 75 years/ 75 years) was conducted in an attempt to understand the subgroup analysis results. In the age 75 years group, the demographic characteristics were similar between the two treatment arms. The mean age was 79.3 years with SD=3.7 years. Approximately 34% of the older age goup was female. Caucasians made up 89% of the older age group, with the next largest race being of Spanish descent (3.6%). Mean BMI was 27 kg/m2 (SD=4.1), with mean waist circumference of 99 cm (SD=12.4). Baseline mean creatinine clearance was 58 ml/min (SD=18.5); approximately 60% of patients in this group had a baseline creatinine clearance < 60 ml/min. Approximately 34% of the older age group was from North America, and 47% were from Western Europe. At study entry approximately 40% of older age group was on prior prescription lipid-lowering therapy. Ninety-four percent of older patients were on aspirin at baseline, 90% on beta-blockers, and 40% on ACE inhibitor/arb. Approximately 29% of older patients were taking diabetic medications. The most common Qualifying Event was NSTE-ACS (81%). 83
112 In the < 75 years group, demographic characteristics were similar between the treatment groups. The mean age was 60.8 years with SD=7.6 years. Approximately 66% were less than 65 years old. There were 23% female in < 75 years group. Caucasians made up 83% of the < 75 years population, with the next largest race being patients of Spanish decent (4.6%) and Asians (4.6%). Mean BMI was 28 kg/m 2 (SD=5.3) with mean waist circumference of 100 cm (SD=13.6). Baseline mean creatinine clearance was 95 ml/min (SD=33.8); approximately 11% of patients in this group had a baseline creatinine clearance < 60 ml/min. Approximately 39% of <75 years were from North America, and 39% were from Western Europe. At study entry approximately 32% of <75 years group were on prior prescription lipid-lowering therapy. Ninety-seven percent of patients < 75 years were on aspirin at baseline, 92% on betablockers, and 87% on ACE inhibitors/arb. Approximately 31% of patients < 75 years were taking anti-diabetic medications.the most common Qualifying Event was NSTE- ACS (70%). Analysis of LDL-C between group differences for age 75 years and age < 75 years (time-weighted average) is summarized in the following tables. These tables provide the absolute LDL-C values as well as the percent change calculated relative to the baseline measured at time of qualifying event and the between group differences. Table 42: Time-weighted Average LDL-C (mg/dl), Age 75 years, ITT Population EZ/SV SV Differences in LS Means (EZ/SV SV) N Mean (SD) N Mean (SD) QE Baseline (19.9) (20.2) Time-weighted Average (23.4) (22.4) Absolute Change (27.7) (27.4) % Change (31.0) (31.2) Laboratory measurements were not routinely collected in subjects who prematurely discontinued study therapy. SD= Standard Deviation; QE= Qualifying Event. Time-weighted average is calculated by weighting each measurement according to the number of days from the prior observation time. Source: Applicant Submission 10/2/2015, Table 3, pg. 12/65. Table 43: Time-weighted Average LDL-C (mg/dl), Age < 75 years, ITT Population EZ/SV SV Differences in LS Means (EZ/SV SV) N Mean (SD) N Mean (SD) QE Baseline (19.9) (20.0) Time-weighted Average (23.7) (21.5) Absolute Change (27.6) (26.1) % Change (27.8) (27.3) Laboratory measurements were not routinely collected in subjects who prematurely discontinued study therapy. SD= Standard Deviation; QE= Qualifying Event. Time-weighted average is calculated by weighting each measurement according to the number of days from the prior observation time. 84
113 Source: Applicant Submission 10/2/2015, Table 3, pg. 12/65. Table 44: Time-weighted Average Triglycerides (mg/dl), Age 75 years, ITT Population EZ/SV SV Differences in LS Means (EZ/SV SV) N Mean (SD) N Mean (SD) QE Baseline (57.8) (58.4) Time-weighted Average (48.5) (54.5) 0.4 Absolute Change (55.0) (53.7) % Change (53.0) (55.0) -8.5 Laboratory measurements were not routinely collected in subjects who prematurely discontinued study therapy. SD= Standard Deviation; QE= Qualifying Event. Time-weighted average is calculated by weighting each measurement according to the number of days from the prior observation time. Table 45: Time-weighted Average Triglycerides (mg/dl), Age < 75 years, ITT Population EZ/SV SV Differences in LS Means (EZ/SV SV) N Mean (SD) N Mean (SD) QE Baseline (75.4) (76.2) Time-weighted Average (66.5) (75.3) Absolute Change (71.2) (72.3) % Change (56.8) (64.8) Laboratory measurements were not routinely collected in subjects who prematurely discontinued study therapy. SD= Standard Deviation; QE= Qualifying Event. Time-weighted average is calculated by weighting each measurement according to the number of days from the prior observation time. Table 46: Time-weighted Average HDL-C (mg/dl), Age > 75 years, ITT Population EZ/SV SV Differences in LS Means (EZ/SV SV) N Mean (SD) N Mean (SD) QE Baseline (13.4) (14.5) Time-weighted Average (12.8) (13.4) 1.1 Absolute Change (10.5) (11.3) 0.8 % Change (45.2) (28.9) 2.4 Laboratory measurements were not routinely collected in subjects who prematurely discontinued study therapy. SD= Standard Deviation; QE= Qualifying Event. Time-weighted average is calculated by weighting each measurement according to the number of days from the prior observation time. Table 47: Time-weighted Average HDL-C (mg/dl), Age < 75 years, ITT Population EZ/SV N Mean (SD) N Mean (SD) QE Baseline (12.8) (13.0) SV Differences in LS Means (EZ/SV SV) 85
114 EZ/SV SV Differences in LS Means (EZ/SV SV) N Mean (SD) N Mean (SD) Time-weighted Average (12.4) (12.8) 0.4 Absolute Change (9.63) (9.70) 0.4 % Change (27.0) (27.4) 1.1 Laboratory measurements were not routinely collected in subjects who prematurely discontinued study therapy. SD= Standard Deviation; QE= Qualifying Event. Time-weighted average is calculated by weighting each measurement according to the number of days from the prior observation time. Reviewer Comment: Patients age > 75 years appeared to have a larger treatment effect from EZ/SV than those <75 years old. Comparison of baseline characteristics between the two groups show that most characteristics were similar between the two groups with the exception of creatinine clearance which was worse in the older group (60% with creatinine clearance < 60 ml/min vs. 11% with creatinine clearance), although CrCl is estimated from the Cockgroft-Gault equation, which is a function of age (as well as sex, weight, and serum creatinine). More patients in the younger age group were on ACE inhibitor/arb than the older group. If older age led to increased drug exposure, one might expect this to have resulted in a larger LDL-C reduction; however, as shown above, the between-group difference in LDL-C was similar in patients 75 years (16%) and < 75 years (15.9%). Changes in other lipid parameters do not provide an explanation, either. Taken together, whether this represents a true interaction between older age and treatment effect vs. the play of chance is unknown. 86
115 Clinical Briefing Document Subgroup Analysis Lipid Lowering Therapy and LDL-C Figure 8: Subgroup Analysis of Primary Endpoint with Lipid Parameters, ITT Population Source: IMPROVE-IT CSR, Figure 11-2, pg. 191/793. Reviewer Comment: There was no difference suggested in the hazard ratio for the primary composite endpoint by baseline median LDL-C, nor by LDL-C quartile. Statin experience also did not have a difference. Medical History Results for the primary efficacy endpoint were generally consistent across subgroups based on medical history, except for patients with diabetes for whom the HR= (95% CI 0.779, 0.936), interaction p=0.023 (see figure below). In this analysis, the diabetic population was defined as those patients with a prior history of diabetes or use of anti-diabetic treatment. Approximately 27% of the overall trial participants were diabetic. Among the 73% of trial participants who were non-diabetic at baseline, the HR was (95% CI 0.915, 1.044). 87
116 Clinical Briefing Document Figure 9: Subgroup Analysis of Primary Composite Endpoint with Medical History, ITT Population Source: IMPROVE-IT CSR, Figure 11-2, pg. 191/793. Further analysis of the diabetic population was conducted in an attempt to understand the subgroup analysis results. In the diabetic population, the demographic characteristics were similar between the two treatment arms. The mean age was 64.8 years with SD=9.2 years. Approximately 51% were less than 65 years old. There were 29% female diabetics. Caucasians made up 78% of the diabetic population, with the next largest race being Asians (7%). Mean BMI was 30 kg/m2, with mean waist circumference of 104 cm. Baseline mean creatinine clearance was 90 ml/min (SD=36.4); approximately 20% of patients in this group had a baseline creatinine clearance < 60 ml/min. Approximately 37% of diabetics were from North America, and 38% were from Western Europe. At study entry approximately 46% of diabetics were on prior prescription lipid-lowering therapy. Fifty-four percent of diabetics were on aspirin at baseline, 44% on betablockers, and 60% on ACE inhibitor/arb. Approximately 24% of diabetics were current smokers. The most common Qualifying Event was NSTE-ACS (79%). In the non-diabetic population, demographic characteristics were similar between the treatment groups. The mean age was 63.2 years with SD=9.9 years. Approximately 58% were less than 65 years old. There were 23% female non-diabetics. Caucasians 88
117 made up 86% of the non-diabetic population, with the next largest race being patients of Spanish decent (4.2%). Mean BMI was 28 kg/m 2 with mean waist circumference of 98 cm. Approximately 39% of non-diabetics were from North America, and 41% were from Western Europe. Baseline mean creatinine clearance was 88 ml/min (SD=33.8); approximately 17% of patients in this group had a baseline creatinine clearance < 60 ml/min. At study entry approximately 29% of non-diabetics were on prior prescription lipidlowering therapy. Thirty-eight percent of non- diabetics were on aspirin at baseline, 31% on beta-blockers, and 34% on ACE inhibitor/arb. Approximately 36% of non-diabetics were current smokers. The most common Qualifying Event was NSTE-ACS (68%). Analysis of LDL-C between group differences for diabetics and non-diabetics (timeweighted average) is summarized in the following tables. These tables provide the absolute LDL-C values as well as the percent change calculated relative to the baseline measured at time of qualifying event and the between group differences. Effects on other lipids follow. Table 48: Time-Weighted Average for LDL-C (mg/dl), Non-Diabetics, ITT Population EZ/SV SV Differences in LS Means (EZ/SV SV) N Mean (SD) N Mean (SD) QE Baseline (19.6) (19.6) Time-weighted (23.3) (21.3) Average Absolute Change (27.7) (25.9) % Change (28.0) (27.1) Laboratory measurements were not routinely collected in subjects who prematurely discontinued study therapy. SD= Standard Deviation; QE= Qualifying Event. Time-weighted average is calculated by weighting each measurement according to the number of days from the prior observation time. Source: Applicant Submission 9/16/2015, Table 5, pg. 12/65. Table 49: Time-Weighted Average for LDL-C (mg/dl), Diabetics, ITT Population EZ/SV SV Differences in LS Means (EZ/SV SV) N Mean (SD) N Mean (SD) QE Baseline (20.2) (20.3) Time-weighted (24.1) (22.6) Average Absolute Change (27.6) (26.9) % Change (29.0) (30.0) Laboratory measurements were not routinely collected in subjects who prematurely discontinued study therapy. SD= Standard Deviation; QE= Qualifying Event. Time-weighted average is calculated by weighting each measurement according to the number of days from the prior observation time. Source: Applicant Submission 9/16/2015, Table 6, pg. 16/65. 89
118 Table 50: Time-weighted average Triglyceride (mg/dl), Diabetics, ITT Population EZ/SV SV Differences in LS Means (EZ/SV SV) N Mean (SD) N Mean (SD) QE Baseline (81.2) (78.9) Time-weighted (70.5) (80.7) Average Absolute Change (76.1) (78.3) % Change (52.3) (65.5) Laboratory measurements were not routinely collected in subjects who prematurely discontinued study therapy. SD= Standard Deviation; QE= Qualifying Event. Time-weighted average is calculated by weighting each measurement according to the number of days from the prior observation time. Source: Applicant Submission 9/16/2015, Table 5, pg. 12/65. Table 51: Time-weighted average Triglyceride (mg/dl), Non-Diabetics, ITT Population EZ/SV SV Differences in LS Means (EZ/SV SV) N Mean (SD) N Mean (SD) QE Baseline (69.8) (71.9) Time-weighted (61.6) (69.0) Average Absolute Change (66.4) (66.5) % Change (57.7) (62.7) -9.3 Laboratory measurements were not routinely collected in subjects who prematurely discontinued study therapy. SD= Standard Deviation; QE= Qualifying Event. Time-weighted average is calculated by weighting each measurement according to the number of days from the prior observation time. Source: Applicant Submission 9/16/2015, Table 5, pg. 12/65. Table 52: Time-weighted average HDL-C in Diabetics, ITT Population EZ/SV SV Differences in LS Means (EZ/SV SV) N Mean (SD) N Mean (SD) QE Baseline (12.2) (12.0) Time-weighted (11.5) (11.4) Average Absolute Change (9.43) (9.27) 0.2 % Change (34.4) (27.0) 0.6 Laboratory measurements were not routinely collected in subjects who prematurely discontinued study therapy. SD= Standard Deviation; QE= Qualifying Event. Time-weighted average is calculated by weighting each measurement according to the number of days from the prior observation time. Source: Applicant Submission 9/16/2015, Table 5, pg. 12/65. 90
119 Table 53: Time-weighted average HDL-C in Non-diabetics, ITT Population EZ/SV SV Differences in LS Means (EZ/SV SV) N Mean (SD) N Mean (SD) QE Baseline (13.2) (13.6) Time-weighted (12.7) (13.3) Average Absolute Change (9.85) (10.2) 0.5 % Change (28.6) (27.9) 1.5 Laboratory measurements were not routinely collected in subjects who prematurely discontinued study therapy. SD= Standard Deviation; QE= Qualifying Event. Time-weighted average is calculated by weighting each measurement according to the number of days from the prior observation time. Source: Applicant Submission 9/16/2015, Table 5, pg. 12/65. Reviewer Comment: At baseline, there were more diabetics on lipid-lowering therapy (46% vs. 29%), aspirin (54% vs. 38%), beta-blockers (44% vs. 31%) and ACE inhibitor/ ARB (60% vs. 34%) than non-diabetics. There were slightly more current smokers in nondiabetics than diabetics. LDL-C at Qualifying Event Baseline was slightly lower in diabetics compared to non-diabetics, but the between-group differences in change in LDL-C were modest (-14.9% for non-diabetics vs % for diabetics); therefore, it seems difficult to explain the difference in observed effect (if a true difference) based on differences in LDL-C reduction. 3.7 Additional Analyses Recurrent Events of the Primary Composite Endpoint The Applicant conducted analyses of total endpoint events (i.e., not only the first event), which they contend explore the potential benefit of EZ/SV compared to SV monotherapy having a sustained effect and preventing multiple occurrences of the primary composite endpoint. In this analysis, total endpoint events from randomization to last visit were compared between the EZ/SV and SV treatment groups. The analysis used up to the 4th event per patient since only a small number of patients had more than 4 events. A total of 5314 patients had at least one primary endpoint event, 2307 patients had at least two events, 965 patients had at least 3 events and 453 patients had at least 4 events. The risk reduction in the primary endpoint of EZ/SV compared to SV was consistent (p=0.682) across the 1st, 2nd, 3rd, and 4th events and was associated with an average risk reduction of 6.6% (HR 0.934; 95% ); p= Table 54: Analysis of Recurrent Events of the Primary Composite Endpoint, ITT Population EZ/SV N=9067 SV N=9077 Hazard Ratio (95% CI) p-value 91
120 EZ/SV SV Hazard Ratio (95% N=9067 N=9077 CI) p-value Number of subjects with 1st event (0.887, 0.987) Number of subjects with 2nd event (0.840, 0.989) Number of subjects with 3rd event (0.811, 1.044) Number of subjects with 4th event (0.719, 1.039) Test of equality of hazard ratio across first 4 events Average hazard ratio across first 4 events (0.885, 0.986) Major Coronary Event = Non-fatal MI, documented UA requiring hospitalization, or coronary revascularization with PCI or CABG 30 days after randomization. Hazard ratio (EZ/Simva vs. Simva), confidence interval, and p-values based on WLW method with covariates of the stratification factors (EARLY ACS trial, prescription lipid-lowering experience, high-risk ACS diagnosis) and treatment. Source: IMPROVE-IT CSR, Table 11-13, pg. 217/793. Landmark Analyses The Applicant pre-specified landmark analyses at 6 months as an estimate of the lag time before an expected benefit of the drug may be observed based upon the CTT meta-analysis. As one could visualize from the Kaplan-Meier curves, an effect on the primary composite was not apparent between randomization to month 6: the observed effect was HR (95% CI ). For patients who had not had an event (or were censored) during the first 6 months, the effect observed from month 6 to last visit was HR (95%CI ). The p-value for treatment by time interaction was Reviewer Comment: The Applicant correctly points out that this landmark analysis (from 6 months to final visit) may be subject to bias since it represents a non-randomized comparison. 92
121 Figure 10: Landmark Analysis of Primary Composite Endpoint, ITT Population Comparison of IMPROVE-IT Results with CTT Meta-Analysis In the 2010 CTT meta-analysis of 26 randomized statin trials (~170,000 patients), a 1 mmol/l absolute reduction in LDL-C (measured at 1 year with baseline LDL-C imputed for missing values) was associated with a reduction in the incidence of major vascular events (MVE) of 22%. MVE were defined as major coronary event (coronary death or non-fatal MI), coronary revascularization (resulting from recurrent ischemia or occurring more than 30 days after randomization, depending on the trial), or stroke. An IMPROVE-IT Statistical Considerations Memo dated February 28, 2013, specified methodology to define and summarize a composite endpoint from IMPROVE-IT that would be as consistent as possible with the CTT s MVE composite and to perform an analysis evaluating the relationship between LDL-C reduction and the treatment effect on this MVE composite (as well as the IMPROVE-IT primary composite) consistent with the CTT algorithm. 93
122 The composite endpoint used from IMPROVE-IT to approximate the CTT s MVE endpoint was CHD death, non-fatal MI, and coronary revascularization that occurred 30 days after randomization, and stroke i.e., the primary composite endpoint excluding unstable angina. The between-group LDL-C difference at 1 year, using the CTT s imputation strategy, was 12.8 mg/dl (0.33 mmol/l). This MVE composite endpoint occurred in 27.6% patients in the EZ/SV group and 29.6% patients in the SV group, yielding an HR (95% CI, ), or HR (95% CI, ) per 1 mmol/l reduction in LDL-C. 3.8 Selected Lipid-related Results According to the protocol, the local laboratory lipid measurement at the time of the qualifying event provided the best reflection of the patients LDL-C status during the period of time leading to the index ACS event. This initial measurement of TC, LDL-C, TG, and HDL-C was to be obtained as early as possible following presentation to a hospital and no later than 24 hours later and was considered Baseline at Qualifying Event. The following table summarizes the descriptive data for the number of days between the qualifying event (QE) LDL-C and randomization for all available patients. Table 55: Time between Qualifying LDL-C Level and Randomization (Days) For All Available Qualifying LDL-C Measurements, ITT Population Applicant Submission, Oct. 9, Reviewer Comment: The mean number of days between the QE LDL-C and randomization was similar between the two treatment arms. If a lipid measurement could not be obtained at the time of presentation, it was also permissible for a LDL-C value that had been obtained within 6 months of presentation with ACS to be used as the baseline at the time of qualifying event for purposes of screening. The Applicant was queried about the number of times this occurred (how often the qualifying LDL-C values were from time periods before the index ACS event). On request, the Applicant submitted the following table. 94
123 Table 56: Time between Qualifying LDL-C Level and Randomization (Days) for Qualifying LDL-C Measurements Obtained Prior to ACS Event Applicant Submission, Oct. 9, Note that the table above required patients to have both an actual QE LDL-C value and a corresponding QE lipid draw date in the database. Reviewer Comment: There were 130 patients in EZ/SV and 134 patients in SV who had a LDL-C value obtained within the previous 6 months of the ACS event used as the QE LDL-C. The median number of days was this value and randomization was 40 days. All other laboratory measurements during regular clinic visits were analyzed by a central laboratory. An abbreviated lipid panel was performed at Month 1, Month 4, Month 8, and Month 16 and included measurements of LDL-C, TC, HDL-C, and TG. Extended Lipid Panel was performed at Screening/Randomization Visit, Annually, at Study Completion in patients continuing on study medication, and at the early discontinuation of study treatment visit in those who discontinued study drug prematurely and included an abbreviated Lipid Panel as described above, apolipoprotein A-I, apolipoprotein B, lipoprotein (a), HDL subfractions (HDL 2 -C and HDL 3 -C), non-hdl-c, and the lipid ratios LDL-C:HDL-C and TC:HDL-C. For the first 6 years of the trial, IMPROVE-IT called for compliant patients in either treatment group who had LDL-C >79 mg/dl on two consecutive measurements to have their dose of simvastatin increased from the initial 40 mg per day to 80 mg per day in a blinded manner. With Amendment 5 to the protocol (see section Simvastatin dose adjustment) patients who had been receiving simvastatin 80 mg for less than a year or who required taking the potentially interacting drugs ranolazine or amlodipine, had their simvastatin dose returned to 40 mg per day. Patients in whom simvastatin dose had already been increased to 80 mg due to LDL-C >79 mg/dl, and was found to have an LDL-C concentration >100 mg/dl on 2 consecutive measurements in the absence of noncompliance with dosing and diet was to be discontinued from study medication. The following table provides the number and percent of patients who were discontinued due to two consecutive LDL-C values 100 mg/dl. 95
124 Table 57: Patients Discontinuing Study Medication Due to Two Consecutive LDL- C Measurements 100 mg/dl Applicant Submission, Oct. 9, Reviewer Comment: There were more discontinuations due to two consecutive LDL-C measurements 100 mg/dl in the simvastatin monotherapy arm, but this occurred infrequently (1% of patients overall). LDL-C during Course of Trial Overall, the least squares (LS) mean LDL-C at the time of the qualifying event was 93.8 mg/dl in both treatment arms. Patients with prior prescription lipid lowering history (n=6390) had a mean LDL-C of 79.5 mg/dl at the time of qualifying event while in patients who were treatment naïve (n=11594) LDL-C was 101 mg/dl. In contrast to the LDL-C at the qualifying event, the mean LDL-C at the time of Randomization was approximately 81 mg/dl in both treatment arms, reflecting varying practices at the time of the acute phase of the qualifying event and effects of the acute event/hospitalization. Treatment between the qualifying ACS event and the time of randomization was not controlled by the protocol. Only 34.4% of patients were taking statin therapy prior to their qualifying event (34.6% in the EZ/SV group and 34.3% in the SV monotherapy group). At the time of randomization, a total of 77% of all patients were treated with statins reflecting the initiation of statin treatment between presentation for qualifying event and randomization. Such treatment, along with the effects of the acute event/hospitalization may have influenced the randomization visit lipids, but such treatment and their effects should have been balanced by randomization. At Month 1, there was LDL-C lowering which was generally sustained over the duration of follow-up. The corresponding LS mean LDL-C levels at 1 year were 55.0 mg/dl in the EZ/SV group vs mg/dl in the SV group, representing a 16.8 mg/dl between group difference (95% CI to 16.0; p<0.001). The between-group difference remained relatively similar at all time-points, as shown in the figure below. Averaged over the course of the trial, the EZ/SV treatment group achieved an additional mean reduction in LDL-C of 14.2 mg/dl or 15.9% (95% CI to 15.2, p<0.001) relative to the SV treatment group. 96
125 Figure 11: LDL-C over Time, ITT Population Source: IMPROVE-IT CSR, Figure 11-7, pg. 231/793. Comparison of LDL-C in Patients On-Study Treatment vs. Off-Study Treatment For study close out, the Applicant attempted to obtain a final clinic visit, including laboratory measurements of lipids of all surviving patients. A total of 8041 patients who were continuing on study drug returned for measurement of LDL-C, along with a total of 2113 patients who had prematurely discontinued study drug at some point before the end-of-study closeout visit. The following table compares the LDL-C values of these two patient populations. 97
126 Table 58: Comparison of LDL-C Values by Study Treatment Status (On-Treatment vs. Off Treatment) and by Treatment Group Source: IMPROVE-IT CSR, Table 11-18, pg. 233/793. For patients off of study treatment, the mean LDL-C was approximately 85.5 mg/dl in both treatment groups. This is higher than the LDL-C for those that stayed in the trial in EZ/SV (50.6 mg/dl) or in SV (66.7 mg/dl). Other Lipid Parameters during Course of Trial The following table shows the changes in TC, HDL-C, non-hdl-c and TG in both treatment groups at 1 year. Compared with SV, there were statistically significant between-group differences with regard to TC, HDL-C, non-hdl-c, and TG. 98
127 Table 59: Analysis of Lipids (mg/dl) at 1 Year, Baseline Measured at Time of Qualifying Event, ITT Population IMPROVE-IT CSR, Table 11-19, pg. 235/793. A time-weighted analysis of lipid parameters and hs-crp is shown in the following table. 99
128 Table 60: Analysis of Lipids (mg/dl) and hs-crp (mg/l) as a Time-Weighted Average, Baseline Measured at Time of Randomization, ITT Population Source: IMPROVE-IT CSR, Table 11-22, pg. 236/ 793. Reviewer Comment: As shown in this time-weighted average table, the difference in least square means between ezetimibe/simvastatin and simvastatin treatment arms was statistically significant for LDL-C, TC, HDL-C, non-hdl-c, TG, Apo B, and hs-crp. 100
129 Tertiary Endpoint: LDL-C and hs-crp Relationship The Applicant evaluated the relationship between the risk of occurrence of the composite primary endpoint event and achievement of both LDL-C < 70 mg/dl and hs- CRP< 2 mg/l at Month 1 and Month 4. Table 61: Analysis of Primary Composite Endpoint Based on LDL-C < 70 mg/l or hs-crp < 2.0 mg/dl at Month 1, Regardless of Treatment Source: IMPROVE-IT CSR, Table 11-25, pg. 241/793. Table 62: Analysis of Primary Composite Endpoint Based on LDL-C < 70 mg/dl or hs-crp < 2.0 mg/l at Month 4, Regardless of Treatment Source: IMPROVE-IT CSR, Table 11-26, pg. 242/
130 Reviewer Comment: At both Month 1 and Month 4, lower event rates for the primary composite endpoint were observed for those patients who achieved either LDL-C < 70 mg/dl or hs-crp < 2 mg/l compared with patients who did not achieve either of these thresholds. However, this is a non-randomized comparison based on postrandomization events. Tertiary Endpoint: CHF requiring hospitalization Congestive heart failure requiring hospitalization occurring at least 30 days after randomization was a tertiary clinical event that was not adjudicated by the CEC. There were 361 (3.98%) CHF events in the EZ/SV arm and 348 (3.83%) in the SV arm, for a HR (95% CI 0.899, 1.207), p= The on-treatment analysis with events censored 30 days after study drug discontinuation was HR (95% CI 0.937, 1.345), p= Review of Safety The clinical safety of EZ/SV was evaluated using the safety data from the ITT population in the IMPROVE-IT trial. The ITT population included all patients who received randomized treatment assignment. However, the protocol did not require reporting of serious or non-serious AEs that occurred more than 30 days after the permanent discontinuation of study drug, unless they were considered AEs of special interest (AESI), including malignancies or benign neoplasms. A total of 8,851patients were exposed to any dose of EZ/SV and 8855 patients were exposed to any dose of SV. The mean duration of exposure was 3.8 years in the EZ/SV group and 3.9 years in the SV group. Women had a lower exposure to study drug compared to men, 3.6 years vs. 4.3 years, respectively. Similarly, patients 65 years old had a lower exposure than those < 65 years, 3.8 years vs. 4.3 years, respectively. Approximately 6% of patients in the EZ/SV treatment arm were uptitrated to EZ/SV 10/80 mg compared to 27% of patients in the SV treatment arm who were uptitrated to SV 80 mg. More patients in the EZ/SV group experienced a hemorrhagic stroke than in the SV group, but the number of hemorrhagic strokes was relatively small in both treatment groups, and the HR for all strokes suggested an overall benefit for the EZ/SV group. The imbalance for hemorrhagic strokes in IMPROVE-IT was not observed in the ontreatment analysis censored 30 days after study drug discontinuation. Hemorrhagic stroke is discussed in Section The incidence of adjudicated new cancers or death due to cancer was monitored in the IMPROVE-IT trial following the observation of an imbalance in the incidence of cancer in the SEAS trial between the EZ/SV arm and placebo. The treatment comparisons were similar for deaths due to malignancy (any death due to malignancy, p=0.711; death due to new malignancy, p=0.817). Treatment comparisons were also similar for 102
131 any new malignancy, whether non-melanotic skin cancer was excluded (p=0.570) or included (p=0.987). Additionally, treatment comparisons between arms were similar for any new, relapsing, or progressing malignancy (whether including or excluding nonmelanotic skin cancer). The HRs for these endpoints are all very close to 1.0 (range ) with the upper bound of the 95% CI between 1.09 and Other than malignancy, other AESI included myopathy/rhabdomyolysis, CPK elevations, liver enzyme elevations, gallbladder-related events, and cholecystectomies. The following table summarizes the between-group comparisons for these AESIs. Table 63: Treatment Differences for Adverse Events of Special Interest, ITT Population EZ/SV m/n (%) SV m/n (%) Difference in % vs. SV group Estimate Diff (95%CI), p- value Myopathy/Rhabdo 27/9067 (0.3) 28/9077 (0.3) ( -0.18, 0.15 ) CK 10xUNL 65/9067 (0.7) 67/9077 (0.7) ( -0.27, 0.23 ) CK 10xULN with symptoms 23/9067 (0.3) 24/9077 (0.3) ( -0.16, 0.14 ) Cholecystectomy hospitalizations 133/ /9077 (1.5) (1.5) ( -0.36, 0.34 ) Gallbladder-related AEs 282/ /9077 (3.1) (3.5) ( -0.95, 0.10 ) Biliary duct disorders SMQ 41/9067 (0.5) 46/9077 (0.5) ( -0.26, 0.15 ) Gallstone disorders SMQ 255/ /9077 (2.8) (3.2) ( -0.92, 0.08 ) Gallstone disorders SMQ 163/ /9077 (1.8) (1.9) ( -0.46, 0.33 ) Gallbladder hospitalizations 199/ /9077 (2.2) (2.4) ( -0.63, 0.24 ) ALT and/or AST 3xULN, 224/ /9077 consecutive (2.5) (2.3) 0.18 ( -0.27, 0.63 ) Confidence intervals and p-values calculated using the Miettinen & Nurminen method. Subjects with AE in biliary duct, gallbladder, or gallstone disorders SMQ. Gallbladder hospitalization was not a protocol-specified AE of special interest. % = m/n x 100 = (number of subjects within the adverse experience category / number of subjects in population) x 100. SMQ = Standard MedDRA Query Source: IMPROVE-IT CSR, Table 12-10, pg. 274/793. Reviewer Comment: The percentages of patients with adverse events of special interest were very similar between treatment arms. Safety analyses were also conducted for new onset diabetes, pancreatitis, acute renal failure, interstitial lung disease, and hypersensitivity reactions. The main findings for these topics are listed below: There were 650 (7.2%) patients with new onset diabetes in the EZ/SV group and 659 (7.3%) in the SV group. 103
132 There were 57 (0.63%) patients with pancreatitis in the EZ/SV group and 58 (0.64%) in the SV group. There were 259 (2.86%) patients in the EZ/SV group with acute renal failure vs. 235 (2.59%) in the SV group. There were 34 (0.37%) patients in the EZ/SV group with interstitial lung disease compared to 40 (0.44%) in the SV group. There were 735 (8.11%) patients in the EZ/SV group with hypersensitivity reaction-related adverse events compared to 748 (8.24%) in the SV group. 4.1 Methods The Applicant s main safety analyses of the IMPROVE-IT study were based on a Protocol-defined ITT population. This population included all patients who received randomized treatment assignment. It should be noted, however, that the protocol did not require reporting of serious or non-serious AEs that occurred more than 30 days after the permanent discontinuation of study drug, unless they were considered AESI (Adverse Events of Special Interest) or malignancies/ benign neoplasms. AESI were identified as: (1) defined increases in AST and/or ALT; (2) defined increases in CPK; (3) all AEs reflective of gallbladder disease; (4) all cholecystectomies; and (5) all occurrences of myopathy and rhabdomyolysis. Cancer and cancer-related deaths were added to the Statistical Analysis Plan due to the interest raised by the findings in the SEAS study. Additionally, other relevant adverse events of interest were reviewed and summarized including new-onset diabetes, pancreatitis, acute renal failure, interstitial lung disease, hypersensitivity reactions, and hemorrhagic stroke. The Applicant also conducted safety analyses with an on-treatment safety population. For this population, all SAEs and AESIs were analyzed excluding patients who never took study drug and limited to the time period when patients were on treatment, up to and including 30 days from the last dose of study drug. In general, AEs were summarized by frequency of occurrence. The Applicant conducted statistical inferential analysis of safety data for myopathy, rhabdomyolysis, cholecystectomy, AEs reflective of gallbladder disease, and ALT and/or AST elevations >3xULN. Cancer and cancer-related death were analyzed using a Cox proportional hazards model with treatment as a covariate. All AE summaries presented include all data through January 23, 2015 (second database lock). Analyses of CEC reviewed selected AESI (myopathy/ rhabdomyolysis and cancer) include all data through Oct 21, 2014 (first database lock). (See Section 2, Reconciliation Process and Database Locks) In all AE tables, an individual is counted only once for each system organ class (SOC) (e.g. gastrointestinal disorders) where he/she reported one or more adverse experiences. However, for each specific adverse experience term (e.g. nausea), the total number of patients reporting that adverse experience was recorded. 104
133 4.1.1 Studies/Clinical Trials Used to Evaluate Safety The IMPROVE-IT trial was the sole focus of this safety review. The database for this trial included a study population of 18,144 subjects, with a median follow-up of 71.4 months (mean 64.7 months) resulting in a total of 97,822 patient-years of follow up. 4.2 Adequacy of Safety Assessments Overall Exposure at Appropriate Doses/Durations and Demographics of Target Populations Drug exposure was defined as the interval from day of randomization (Day 1) through the last day for which trial medication was supplied, assuming all the medication was taken, for each individual patient. The following table summarizes the overall extent of drug exposure. Table 64: Overall Study Drug Exposure (Months), ITT Population EZ/SV (N=9067) n (%) SV (N=9077) n (%) Total n (%) Any Dose of Study Drug n Mean (SD) 49.6 (32.4) 49.0 (32.2) 49.3 (32.3) Median Q1, Q3 16.7, , , 79.4 Simvastatin 40 mg n Mean (SD) 47.6 (32.5) 38.0 (31.4) 42.8 (32.3) Median Q1, Q3 13.9, , , 72.6 Simvastatin 80 mg n Mean (SD) 30.3 (25.7) 39.8 (27.6) 38.0 (27.5) Median Q1, Q3 7.9, , , 62.3 Source: IMPROVE-IT CSR, Table 10-17, pg Reviewer Comment: Overall study drug exposure was similar between the two treatment arms with an average of approximately 49 months (4 years). For the first 6 years of the trial, patients in either treatment group who had LDL-C >79 mg/dl on two consecutive measurements had their dose of simvastatin increased from the initial 40 mg per day to 80 mg per day in a blinded manner. With amendment 5 to the protocol, patients who had been receiving simvastatin 80 mg for less than a year or who required taking the potentially interacting drugs ranolazine or amlodipine, had their simvastatin dose returned to 40 mg per day. 105
134 The following table summarizes the number and percent of patients on the different doses of simvastatin taken during the trial. Table 65: Doses of Simvastatin Taken During IMPROVE-IT, ITT Population EZ/SV N=9067 n (%) SV N=9077 n (%) Total n (%) Dose of Simvastatin taken at any time during the study Patients who received 40 mg only 8290 (91.4) 6409 (70.6) (81.0) Patients who received 40 mg titrated to 80 mg 332 (3.7) 1657 (18.3) 1989 (11.0) Patients who received 40 mg titrated to 80 mg then 229 (2.5) 789 (8.7) 1018 (5.6) down to 40 mg* Patients not treated 216 (2.4) 222 (2.4) 438 (2.4) *Lowering of the simvastatin dose from 80 to 40 mg during the study occurred primarily with the implementation of protocol amendment #5 where it was mandated that patients who had been taking simvastatin 80 mg (in either treatment group) for less than 12 months would have their dose decreased to 40 mg, to be in alignment with FDA-mandated revisions to the simvastatin prescribing information. Similarly, patients who required ongoing concomitant use of amlodipine or ranolazine and were taking simvastatin 80 mg had the dose reduced to 40 mg. Source: IMPROVE-IT CSR, Table 10-17, pg Reviewer Comment: Approximately 91% of patients in the EZ/SV treatment arm received only the simvastatin 40 mg dose, while 71% of patients in the SV treatment arm received the simvastatin 40 mg dose. More patients in the SV monotherapy arm were up titrated from simvastatin 40 mg to simvastatin 80 mg (18.3%) than in the EZ/SV arm (3.7%). Exposure to Study Drug by Baseline Characteristics Table 66: Duration of Study Drug Exposure by Age Category EZ/SV (N=9067) n (%) SV (N=9077) n (%) Total n (%) Overall duration of exposure to study drug (months) Age < 65 Age 65 Age < 65 Age 65 Age < 65 Age 65 Any Dose of Study Drug n Mean (SD) 52.7 (32.5) 45.6 (32.0) 52.0 (31.9) 44.9 (32.3) 52.4 (32.2) 45.3 (32.1) Median Q1, Q3 20.5, , , , , , 74.0 Simvastatin 40 mg n Mean (SD) 50.1 (32.7) 44.6 (31.9) 38.7 (31.5) 37.0 (31.3) 44.3 (32.6) 40.8 (31.8) Median Q1, Q3 16.3, 11.6, 11.6, 8.2, , , 67.3 Simvastatin 80 mg n Mean (SD)
135 EZ/SV (N=9067) n (%) SV (N=9077) n (%) Total n (%) (25.9) (24.9) (27.8) (27.1) (27.7) (27.1) Median Q1, Q3 12.2, 11.7, 11.9, 10.2, 8.2, , Source: Applicant Submission 14 Oct Reviewer Comment: Duration of exposure to any dose of study drug was slightly more in the Age < 65 years (median of 56.4 months) as compared to the age 65 years category (median of 49.3 months). Table 67: Duration of Study Drug Exposure by Gender EZ/SV (N=9067) n (%) SV (N=9077) n (%) Total n (%) Overall duration of exposure to study drug (months) Male Female Male Female Male Female Any Dose of Study Drug n Mean (SD) 51.6 (32.2) 43.2 (32.2) 50.5 (32.1) 44.0 (32.1) 51.1 (32.2) 43.6 (32.2) Median Q1, Q3 20.3, 19.5, 11.6, 20.0, 10.7, 9.3, Simvastatin 40 mg n Mean (SD) 49.7 (32.4) 41.2 (31.2) 39.4 (31.7) 33.4 (30.2) 44.6 (32.4) 37.3 (31.3) Median Q1, Q3 16.5, 8.2, 11.7, 8.1, , , 61.1 Simvastatin 80 mg n Mean (SD) 32.5 (26.5) 25.4 (23.1) 40.5 (27.8) 37.6 (26.9) 39.1 (27.8) 34.9 (26.6) Median Q1, Q3 8.0, 12.1, 11.8, 11.8, 10.6, 7.3, Source: Applicant Submission 14 Oct Reviewer Comment: There were three times as many males as females exposed to study drug, and the mean duration of exposure was less in females (43.6 months) than males (51.1 months). 107
136 Table 68: Duration of Study Drug Exposure by Race Overall duration of exposure to study drug (months) Any Dose of Study Drug EZ/SV (N=9067) n (%) Caucasian Non- Caucasian Caucasian SV (N=9077) n (%) Non- Caucasian Caucasian Total n (%) Non- Caucasian n Mean (SD) (31.2) 46.4 (30.7) (32.6) (32.5) (32.6) 46.1 (30.9) Median Q1, Q3 17.3, , , , , , 71.0 Simvastatin 40 mg n Mean (SD) (31.0) 38.2 (29.4) (32.7) (31.8) (32.7) 41.1 (30.4) Median Q1, Q3 15.5, , , , , , 61.4 Simvastatin 80 mg n Mean (SD) (22.6) 35.0 (27.6) (26.2) (27.6) (27.5) 32.1 (26.8) Median Q1, Q3 8.1, , , , , , 53.9 Source: Applicant Submission 14 Oct Reviewer Comment: Although non-caucasians made up approximately 15% of the trial, their mean duration of study drug exposure was similar to Caucasians Routine Clinical Testing The methods and frequency of monitoring laboratory parameters were adequate (see Appendix for Schedule of Procedures). Laboratory assessments collected at routine study visits were processed by the central laboratory. However, tests completed in relation to the qualifying event were completed in a local laboratory. Note that CPK was originally assessed at baseline and at time of dose titration; amendment 5 to the protocol increased frequency of CPK to every regularly scheduled visit. The list of laboratory tests performed during the study is presented in the following table. Table 69: Routine Laboratory Tests Collected During Study Hematology Chemistry RBC Total Protein Hematocrit Albumin Hemoglobin Calcium Platelets Inorganic Phosphorus WBC Blood Urea Nitrogen 108
137 Hematology Chemistry Eosinophils Total Bilirubin Neutrophils Alkaline Phosphatase Lymphocytes AST Monocytes ALT Basophils GGT LDH Urinalysis Creatinine Glucose Potassium Sodium Chloride Bicarbonate Cholesterol (Total, LDL-C, HDL-C) Lipids and Triglycerides Serum pregnancy test (beta hcg) Uric Acid Creatine Phosphokinase (CPK) Source: IMPROVE-IT CSR, Table 9-4, pg Major Safety Results Deaths All deaths were adjudicated by the CEC and classified as to whether or not they were attributable to cardiovascular disease. Cardiovascular deaths were further categorized as either death due to atherosclerotic coronary heart disease or deaths attributable to atherosclerotic cerebrovascular disease (including stroke) and other. Noncardiovascular deaths were adjudicated into the following categories: accidental, diabetes, malignancy, renal, suicide, or other. Deaths without any additional information were classified as Unknown. Of the 18,144 subjects in the ITT population, 2446 (13.48%) died during the course of the study: 1215 (13.40%) who were assigned EZ/SV and 1231 (13.56%) who were assigned SV. 109
138 Table 70: Summary of All Deaths, ITT Population Source: IMPROVE-IT CSR, Table 12-8, pg Reviewer Comment: There was no concerning safety signal in the incidence of mortality (death from any cause) between EZ/SV and SV. The breakdown of cardiovascular deaths and non-cardiovascular deaths were similar between the two treatment arms. Of note, there were 365 (2%) deaths in which the cause of death was unknown, but the incidence was similar between the two treatment arms. On request, the Applicant organized the table above by SOC and preferred terms. Specifically, 31 atherosclerotic vascular deaths that were categorized attributable to other were further mapped using MedDRA terms in the following table. Table 71: Summary of CEC Adjudicated Cardiovascular Deaths by System Organ Class and Preferred Term EZ/Simva Simva n (%) n (%) Subjects in population Cardiovascular Death 537 (5.92) 538 (5.93) Cardiac disorders 74 (0.82) 86 (0.95) Acute MI (Atherosclerotic CHD)** 52 (0.57) 67 (0.74) Congestive cardiomyopathy 1 (0.01) 0 (0.00) Other cardiovascular disease** 21 (0.23) 19 (0.21) Gastrointestinal disorders 6 (0.07) 5 (0.06) Colitis ischaemic 0 (0.00) 1 (0.01) Intestinal infarction 2 (0.02) 0 (0.00) Intestinal ischaemia 4 (0.04) 4 (0.04) 110
139 EZ/Simva Simva n (%) n (%) General disorders and administration site conditions 371 (4.09) 381 (4.20) Non Sudden Death (Atherosclerotic CHD)** 118 (1.30) 137 (1.51) Sudden Death (Atherosclerotic CHD)** 195 (2.15) 207 (2.28) Unwitnessed (Atherosclerotic CHD)** 58 (0.64) 37 (0.41) Injury, poisoning and procedural complications 18 (0.20) 13 (0.14) Post procedural complication 1 (0.01) 0 (0.00) Procedural (Atherosclerotic CHD)** 17 (0.19) 13 (0.14) Nervous System Disorders 56 (0.62) 47 (0.52) Cerebrovascular disease (Atherosclerotic vascular disease)** 56 (0.62) 47 (0.52) Renal and urinary disorders 0 (0.00) 1 (0.01) Renal failure 0 (0.00) 1 (0.01) Vascular disorders 12 (0.13) 5 (0.06) Aortic aneurysm 4 (0.04) 1 (0.01) Aortic aneurysm rupture 2 (0.02) 3 (0.03) Aortic dissection 1 (0.01) 0 (0.00) Peripheral vascular disorder 5 (0.06) 1 (0.01) *Data Source for Preferred Term designation is the final CEC Death classification, and not Investigator reported data. **Deaths adjudicated to be cardiovascular were further categorized by the CEC as death due to atherosclerotic coronary heart disease (CHD death), atherosclerotic vascular disease excluding coronary disease, or other cardiovascular disease. Deaths classified as atherosclerotic vascular disease included deaths attributable to cerebrovascular disease as well as deaths attr butable to other for which the CEC inserted verbatim text in a comment field. This verbatim text had not been previously encoded. In response to the current request, Merck has encoded these terms using MedDRA version 18.0 In Table above, System Organ Classes (SOC) but no preferred terms have been designated for deaths classified as due to atherosclerotic coronary heart disease, atherosclerotic vascular disease (cerebrovascular disease), or other cardiovascular disease. Reviewer Comment: Review of the 31 atherosclerotic vascular disease deaths previously categorized as other shows those deaths were attributed to vascular disorders (17), renal failure (1), post-procedural complication (1), gastrointestinal infarction/ ischemia (11) and congestive cardiomyopathy (1). On request, the Applicant also organized the other non-cardiovascular deaths by SOC and preferred terms. Specifically, 386 non-cardiovascular deaths were further mapped using MedDRA terms in the following table. Table 72: Summary of CEC Adjudicated Non-Cardiovascular Deaths by System Organ Class and Preferred Term*, ITT Population EZ/Simva Simva n (%) n (%) Subjects in population Non-cardiovascular Death 511 (5.64) 495 (5.45) Congenital, familial and genetic disorders 0 (0.00) 1 (0.01) Myotonic dystrophy 0 (0.00) 1 (0.01) Endocrine Disorders 0 (0.00) 1 (0.01) Diabetes** 0 (0.00) 1 (0.01) Gastrointestinal disorders 14 (0.15) 14 (0.15) Gastric ileus 0 (0.00) 1 (0.01) Gastrointestinal disorder 2 (0.02) 2 (0.02) Gastrointestinal haemorrhage 8 (0.09) 6 (0.07) Intestinal Obstruction 0 (0.00) 1 (0.01) Intestinal strangulation 0 (0.00) 1 (0.01) 111
140 EZ/Simva Simva n (%) n (%) Large intestine perforation 0 (0.00) 1 (0.01) Gastrointestinal perforation 0 (0.00) 1 (0.01) Intestinal perforation 1 (0.01) 0 (0.00) Pancreatitis 3 (0.03) 0 (0.00) Small intestinal obstruction 0 (0.00) 1 (0.01) General disorders and administration site conditions 20 (0.22) 19 (0.21) Accidental** 17 (0.19) 17 (0.19) Death 1 (0.01) 0 (0.00) Euthanasia 1 (0.01) 2 (0.02) Multi-organ failure 1 (0.01) 0 (0.00) Hepatobiliary disorders 9 (0.10) 4 (0.04) Hepatic cirrhosis 2 (0.02) 2 (0.02) Hepatic failure 6 (0.07) 2 (0.02) Hepatorenal syndrome 1 (0.01) 0 (0.00) Infections and infestations 117 (1.29) 105 (1.16) Infection 14 (0.15) 10 (0.11) Pneumonia 42 (0.46) 47 (0.52) Respiratory tract infection 2 (0.02) 0 (0.00) Sepsis 52 (0.57) 44 (0.48) Septic Shock 4 (0.04) 1 (0.01) Tuberculosis 0 (0.00) 1 (0.01) Urosepsis 0 (0.00) 1 (0.01) Peritonitis 3 (0.03) 1 (0.01) Injuries, poisoning and procedural complications 2 (0.02) 1 (0.01) Spinal column injury 0 (0.00) 1 (0.01) Gun shot wound 1 (0.01) 0 (0.00) Hip fracture 1 (0.01) 0 (0.00) Metabolism and nutrition disorders 7 (0.08) 5 (0.06) Dehydration 2 (0.02) 0 (0.00) Failure to thrive 5 (0.06) 5 (0.06) Musculoskeletal and connective tissue disorders 0 (0.00) 1 (0.01) Polymyositis 0 (0.00) 1 (0.01) Neoplasms benign, malignant and unspecified (incl cysts and polyps) 280 (3.09) 273 (3.01) Malignancy** 280 (3.09) 272 (3.00) Myelodysplastic syndrome 0 (0.00) 1 (0.01) Nervous system disorders 6 (0.07) 10 (0.11) Amyotrophic lateral sclerosis 0 (0.00) 1 (0.01) Parkinson's disease 0 (0.00) 1 (0.01) Spinal cord haematoma 0 (0.00) 1 (0.01) Dementia 3 (0.03) 5 (0.06) Dementia Alzheimer's type 2 (0.02) 2 (0.02) Osmotic demyelination syndrome 1 (0.01) 0 (0.00) Psychiatric disorders 2 (0.02) 7 (0.08) Suicide** 2 (0.02) 7 (0.08) Renal and Urinary disorders 15 (0.17) 9 (0.10) Renal** 15 (0.17) 9 (0.10) Respiratory, thoracic and mediastinal disorders 36 (0.40) 45 (0.50) Chronic obstructive pulmonary disease 17 (0.19) 18 (0.20) Interstitial lung disease 0 (0.00) 1 (0.01) Pulmonary fibrosis 3 (0.03) 7 (0.08) Respiratory disorder 1 (0.01) 4 (0.04) Respiratory failure 8 (0.09) 6 (0.07) Aspiration 2 (0.02) 1 (0.01) 112
141 EZ/Simva Simva n (%) n (%) Lung disorder 4 (0.04) 7 (0.08) Mediastinal haemorrhage 1 (0.01) 0 (0.00) Pneumonia aspiration 0 (0.00) 1 (0.01) Vascular disorders 3 (0.03) 0 (0.00) Haemorrhage 1 (0.01) 0 (0.00) Shock haemorrhagic 2 (0.02) 0 (0.00) *Data Source for Preferred Term designation is the final CEC Death classification, and not Investigator reported data. **All deaths adjudicated as non-cardiovascular were further characterized by the CEC in 6 sub-types: Accidental, Diabetes, Malignancy, Renal, Suicide, and other. In Table above, a SOC but no preferred terms have been designated for deaths categorized as Accidental, Diabetes, Malignancy, Renal, or Suicide. The CEC did provide a verbatim term for all non-cardiovascular deaths categorized as other. In response to the current request, Merck has encoded these terms using MedDRA version 18. Reviewer Comment: Review of the 386 non-cardiovascular deaths previously classified as other shows that the majority of deaths were attributable to infections (222 deaths). No meaningful differences are noted between the treatment groups in noncardiovascular death Nonfatal Serious Adverse Events The following table summarizes the subject incidence of SAEs by system organ class (SOC), reported with an incidence greater than or equal to 2.0% in either treatment group. There were 7289 (40.2%) patients who experienced at least one SAE; 3640 (40.1%) in the EZ/SV group and 3649 (40.2%) in the SV group. The only specific SAE that occurred at an incidence 2% (at the preferred term level) was pneumonia (2.81% vs. 2.67% in the EZ/SV and SV groups, respectively). Table 73: Summary of Serious Adverse Events, Incidence 2% in Any Treatment Group, ITT Population EZ/SV n (%) SV n (%) Subjects in Population With One or More Adverse Events 3640 (40.15) 3649 (40.20) With No Adverse Events 5427 (59.85) 5428 (59.80) Cardiac Disorders 373 (4.11) 391 (4.31) Gastrointestinal Disorders 676 (7.46) 683 (7.52) Hepatobiliary Disorders 200 (2.21) 208 (2.29) Infections and Infestations 807 (8.90) 800 (8.81) Injury, Poisoning and Procedural Complications 350 (3.86) 346 (3.81) Musculoskeletal and Connective Tissue Disorders 526 (5.80) 497 (5.48) Neoplasms Benign, Malignant and Unspecified 1072 (11.82) 1088 (11.99) Nervous System Disorders 276 (3.04) 272 (3.00) Renal and Urinary Disorders 262 (2.89) 280 (3.08) Respiratory, Thoracic and Mediastinal Disorders 400 (4.41) 384 (4.23) Vascular Disorders 234 (2.58) 253 (2.79) Every subject is counted a single time for each applicable specific adverse event. A subject with multiple adverse 113
142 EZ/SV SV n (%) n (%) events within a system organ class is counted a single time for that system organ class. A system organ class or specific adverse event appears on this report only if its incidence in one or more of the columns is greater than or equal to the percent incidence specified in the report title, after rounding. Source: IMPROVE-IT CSR, Table 12-7, pg. 268/793. Reviewer Commment: The incidence of SAEs 2% in either group is similar between the two treatment groups Dropouts and/or Discontinuations Adverse Events Leading to Study Drug Discontinuation This section summarizes the adverse events leading to study drug discontinuation. Overall, 1880 (10.36%) patients discontinued study drug due to an adverse experience (962 [10.61%] in the EZ/SV group and 918 [10.11%] in the SV group). The most common type of AE (by SOC) leading to study drug discontinuation in both arms was due to musculoskeletal-related events, and these occurred more frequently in the EZ/SV treatment arm than in the SV arm 4.27% vs. 3.80%, respectively. The second-most commonly reported type of AE (by SOC) leading to study drug discontinuation was Gastrointestinal Disorders, but these events were similar in the two treatment arms (2.12% in EZ/SV vs. 2.15% in SV). The following table summarizes the AEs (by SOC) leading to study drug discontinuation with at least a 10 patient difference between treatment arms. Table 74: Adverse Events (by SOC) Leading to Study Drug Discontinuation with a Difference of 10 Patients between Treatment Groups System Organ Class EZ/SV N= 9067 n (%) SV N=9077 n (%) Total N=18144 n (%) Patients with one or more Adverse Events 962 (10.61%) 918 (10.11%) 1880 (10.36%) Cardiac Disorders 17 (0.19%) 32 (0.35%) 49 (0.27%) Musculoskeletal and Connective Tissue Disorders 387 (4.27%) 345 (3.80%) 732 (4.03%) Neoplasms 80 (0.88%) 67 (0.74%) 147 (0.81%) Nervous System Disorders 69 (0.76%) 79 (0.87%) 148 (0.82%) Respiratory, Thoracic and Mediastinal Disorders 20 (0.22%) 34 (0.37%) 54 (0.30%) Source: IMPROVE-IT Adverse Event Data, Table , 2045/2280. Reviewer Comment: Some study drug discontinuations due to adverse events were more common in the EZ/SV group than in the SV group. Specifically the Musculoskeletal and connective tissue disorders (4.27% vs. 3.80%) and Neoplasms (0.88% vs. 0.74%) were more commonly reported in the EZ/SV group as an AE leading to study drug discontinuation. 114
143 4.3.4 Significant Adverse Events Cancer Cancer occurred more frequently in the EZ/SV vs. SV group in the Simvastatin and Ezetimibe in Aortic Stenosis (SEAS) trial (105 (11.1%) vs. 70 (7.5%), p=0.01). In the SEAS trial, the excess cancers in the EZ/SV group were not clustered at any particular site. The concern regarding cancer raised by the SEAS trial led to changes in the IMPROVE-IT protocol, including adjudication of cancer cases by the CEC and inferential testing on the incidence of cancer and cancer-related deaths. Investigators were required to report (on a specific Malignancy ecrf) detailed information for any malignancy/neoplasm that was newly diagnosed after randomization (regardless of the timing of the last dose of study drug), as well as pre-existing malignancies that worsened, relapsed, or caused a new AE after randomization. All malignancies that were newly diagnosed after randomization or pre-existing malignancies that worsened or relapsed after randomization were reviewed by oncology members of the CEC. The CEC reviewed reports on the pathology of the tissue to determine tumors as either malignant or benign, whenever available. If no pathology was available, the CEC used the following clinical criteria to classify tumors: A malignant tumor is an abnormal mass of tissue that can invade and destroy nearby tissue, and that may spread (metastasize) to other parts of the body. Tumors that cannot invade/destroy nearby tissue or metastasize were classified as benign. The date of the initial clinical appearance (date of the first sign, symptom, or clinical test that identified the presence of a tumor) of the tumor was recorded by the CEC. For tumors that were present prior to randomization, the CEC determined whether the tumor relapsed (i.e., was considered cured prior to randomization, but then after randomization the same tumor recurred), progressed (tumor was in remission or controlled prior to randomization, then after randomization advanced in size/location/stage), or neither relapsed nor progressed (i.e., the tumor remained clinically stable after randomization in terms of stage/location/size). The CEC also reported the location, extent, and relationship to vital status of all tumors (malignant and benign). The findings of the CEC adjudicated cancer cases are summarized in the following table. For Any Death due to Malignancy, there were 280 (3.09%) deaths in EZ/SV treatment arm and 272 (3.00%) in the SV treatment arm, with HR (0.873, 1.219), p= Deaths Due to New Malignancy were also similar between treatment arms: 242 (2.67%) in the EZ/SV treatment arm vs. 238 (2.62%) in the SV arm, HR (0.854, 1.221), p= Treatment comparisons were also similar for any new malignancy, whether nonmelanotic skin cancers were excluded (p=0.570) or included (p=0.987). Additionally, treatment comparisons between arms were similar for any new, relapsing, or progressing malignancy (whether excluding or including non-melanotic skin cancer). The HRs for these endpoints are all very near 1.0 (range ). 115
144 Table 75: Summary of CEC Adjudicated Cancer Cases, ITT Population Any New, Relapsing, or Progressing Malignancy (excluding non-melanotic skin cancer) Any New, Relapsing, or Progressing Malignancy (including non-melanotic skin cancer) Any New Malignancy (excluding non-melanotic skin cancer) Any New Malignancy (including non-melanotic skin cancer) Any Death Due to Malignancy Death Due to New Malignancy n (%) 742 (8.18) 903 (9.96) 692 (7.63) 853 (9.41) 280 (3.09) 242 (2.67) EZ/SV N=9067 Source: IMPROVE-IT CSR, Table 12-26, pg. 311/793. KM% (95% CI) (9.46, 10.94) (11.65, 13.27) 9.55 (8.85, 10.29) (11.05, 12.64) 3.81 (3.37, 4.31) 3.58 (3.13, 4.08) n (%) 725 (7.99) 908 (10.00) 679 (7.48) 863 (9.51) 272 (3.00) 238 (2.62) SV N=9077 KM% (95% CI) (9.46, 10.96) (11.87, 13.52) 9.60 (8.89, 10.36) (11.33, 12.96) 3.62 (3.20, 4.09) 3.43 (3.00, 3.92) Treatment Comparison HR (95% CI) (0.930, 1.141) (0.911, 1.096) (0.922, 1.140) (0.903, 1.091) (0.873, 1.219) (0.854, 1.221) p- value The following table summarizes CEC adjudicated deaths from new cancers by body site. 116
145 Table 76: Patients with CEC Determined Deaths from New Cancers by Site, ITT Population Source: IMPROE-IT CSR, Table , pg. 760/793. Reviewer Comment: Deaths from new lung cancer were most frequently reported, with more occurring in the SV monotherapy arm. There were some new cancers deaths that were numerically greater in the EZ/SV arm than in the SV arm, and vice versa. Overall deaths due to new malignancies were similar in the two treatment arms. 117
146 Figure 12: Cumulative Incidence Rate of Any Death due to Malignancy, CEC Adjudicated, ITT Population Source: IMPROVE-IT CSR, Figure 12-2, pg. 313/793. The incidence of any new, relapsing and progressing malignancy was 10.03% (or 909 events) in the EZ/SV arm vs % (or 915 events) in the SV arm. The following table summarizes all CEC adjudicated new, relapsing, and progressing malignancies by site. 118
147 Clinical Briefing Document Table 77: Patients with CEC Adjudicated New, Relapsing, and Progressing Malignancies by Site, ITT Population Source: IMPROVE-IT CSR, Table , pg. 758/
148 Reviewer Comment: There were a few cancers (breast, colon, and prostate) that occurred in 5 or more persons in the EZ/SV group than in the SV group. However, there were also cancers that occurred more in the SV group than in the EZ/SV group (kidney/ureter, pancreas). Therefore, the occurrence of a few more cancers at some sites more than others in the EZ/SV group is likely due to chance. A Kaplan-Meier plot of any new, relapsing, or progressing cancer incidence is shown below. Figure 13: Cumulative Incidence Rate of Any New, Relapsing, or Progressing Malignancy (Excluding Non-melanotic Skin Cancer) CEC Adjudicated, ITT Population Source: IMPROVE-IT CSR, Figure 12-1, pg. 312/793. Muscle-Related Adverse Events A total of 3,171 cases (1,607 [17.7%] in EZ/SV treatment arm and 1,564 [17.2%] in SV treatment arm) of unexplained myalgia were reported by investigators on the myopathy case report form. This form included a brief narrative of the episode, specifics around exercise, concomitant medications, associated illnesses or renal injury, and CPK and other laboratory values (if obtained). The investigator indicated as well whether the case reflected elevated CPK without associated myalgia symptoms (such cases were not 120

149 considered true myalgia by the Applicant). The criteria for triggering CEC review of myalgia was met for 116 (1.3%) in the EZ/SV group and 125 (1.4%) in the SV group. The trigger criteria for CEC review for myalgia included: Note: Actions regarding Yes to unexplained muscle pain that was not associated with the above was left to the discretion of the site. Advice in the protocol suggested interruption and rechallenge if appropriate or indicated. Regarding definitions used by the CEC, to satisfy the IMPROVE-IT definition of unexplained myalgia, myopathy or rhabdomyolysis, the subject must have had symptoms of myalgias (muscle aches, weakness, or tenderness) without an obvious cause such as skeletal muscle trauma or recent heavy exercise. a. Unexplained Myalgia was defined as new muscle pain, tenderness, or weakness without another obvious cause (e.g., recent heavy exercise, fall). Unexplained myalgia was further sub-classified as either associated with an elevation in the total CK above the upper limit of normal or not associated with a CK elevation (i.e., CK <ULN). NOTE: There should have been no other cause of an elevated CK (e.g., recent MI). b. Myopathy was defined as new muscle pain, tenderness, or weakness without another obvious cause (i.e., myalgia) that was associated with an elevation of total CK that satisfied either of the following two criteria: a. Total CK 10X upper limit of normal on one occasion; b. Total CK 5X upper limit of normal on two consecutive readings. c. Rhabdomyolysis was defined as an episode of new muscle pain, tenderness, or weakness without another obvious cause (i.e., mylagia) with either marked total CK elevation without renal dysfunction (a), or an episode of myopathy with evidence of clinically significant renal dysfunction (b): i) Rhabdomyolysis Without Renal Dysfunction (must satisfy both criteria): (1) New muscle pain, tenderness, or weakness without another obvious cause (i.e., unexplained myalgia); 121
150 (2) Total CK elevation 10,000 IU/L. NOTE: There should be no other cause of an elevated CK (e.g., recent MI) ii) Rhabdomyolysis With Renal Dysfunction (must satisfy all 3 criteria): (1) New muscle pain, tenderness, or weakness without another obvious cause (i.e., unexplained myalgia); (2) Total CK elevation either 10X ULN on one occasion or 5 X ULN, but <10X ULN on two consecutive occasions. NOTE: There should be no other cause of an elevated CK (e.g., recent MI). (3) Associated with evidence of clinically significant renal dysfunction defined as satisfying at least one of the following: (a) Creatinine elevation that is either 0.5 mg/dl absolute or 50% relative to the baseline creatinine (b) Associated with myoglobinuria or dark urine Table 78: Summary of Muscle-Related Events, ITT Population EZ/SV m/n (%) SV m/n (%) Investigator reported unexplained myalgia 1607/ /9077 (17.7) (17.2) Myalgia meeting criteria for CEC review for myopathy/rhabdo 116/9067 (1.3) 125/9077 (1.4) CEC determined myopathy 15/9067 (0.2) 10/9077 (0.1) CEC determined rhabdomyolysis 13/9067 (0.1) 18/9077 (0.2) Difference in % vs. SV group Estimate Diff (95%CI), p-value 0.06 ( -0.06, 0.17 ) ( -0.19, 0.07 ) Rhabdo without renal impairment 3/9067 (0) 9/9077 (0.1) Rhabdo with renal impairment 10/9067 (0.1) 9/9077 (0.1) Other CEC reviewed cases 89/9067 (1.0) 102/ (1.1) ( -0.44, 0.16 ) Myalgia without CK 5XULN 63/9067 (0.7) 72/9077 (0.8) Myalgia with CK 5xULN 26/9067 (0.3) 31/9077 (0.3) CEC determined myalgia with CK 5xULN, /9067 (0.6) 58/9077 (0.6) myopathy, or rhabdo ( -0.29, 0.18 ) Confidence intervals and p-values calculated using the Miettinen & Nurminen method. % = m/n x 100 = (number of subjects within the adverse experience category / number of subjects in population) x 100. Patients could be counted in more than one category if they had different events at different visits. Source: IMPROVE-IT CSR, Table 12-12, pg. 278/ The incidence of myopathy/rhabdomyolysis was similar between the treatment groups (0.3% in the EZ/SV group and 0.3% in the SV group). However, given the known higher risk of myopathy with simvastatin 80 mg, and the higher proportional use of simvastatin 80 mg in patients allocated to treatment with simvastatin monotherapy, the Applicant conducted additional analyses by dose and exposure to examine exposure-adjusted rates of CEC adjudicated myopathy/rhabdomyolysis for the protocol defined ITT population excluding subjects who never took study drug. 122
151 Table 79: Exposure-adjusted Rate of Myopathy and Rhabdomyolysis by Treatment Group (excluding Patients who Never Took Drug) Event Myopathy Simva dose (mg) n/n Exposed (%) 14/8851 (0.16) 1/561 (0.18) EZ/SV n/patient yrs exposed (events per 10,000 pt yrs) 14/34627 (4.0) 1/1398 (7.2) n/n exposed (%) 4/8855 (0.05) 6/2446 (0.25) SV n/patient yrs exposed (events per 10,000 pt yrs) 4/27623 (1.4) 6/7990 (7.5) Rhabdo /8851 (0.14) 1/561 (0.18) 12/34627 (3.5) 1/1398 (7.2) 9/8855 (0.10) 9/2446 (0.37) 9/27623 (3.3) 9/7990 (11.3) Myopathy/ 25/ /34627 (7.2) Rhabdo (0.28) 2/ /1398 (14.3) (0.36) Source: IMPROVE-IT CSR, Table 12-14, pg. 281/ /8855 (0.15) 15/2446 (0.61) 13/27623 (4.7) 15/7990 (18.8) Reviewer Comment: In patients receiving simvastatin 40 mg, the exposure adjusted rate of the combined endpoint of myopathy/rhabdomyolysis is slightly higher in the subjects taking EZ/SV 40 mg compared to those taking simvastatin 40 mg (7.2 per 10,000 patient years compared to 4.7 per 10,000 patient years, respectively). It is difficult to make comparisons between groups with regard to the myopathy/rhabdomyolysis incidence in patients receiving simvastatin 80 mg given the small number (2) of patients with events who were exposed to simvastatin 80 mg in the EZ/SV group. However, it may be reassuring that there is not a consistent signal of higher myopathy/rhabdomyolysis among those patients in the EZ/SV arm. Rhabdomyolysis In the ITT population, there were 13 (0.1%) patients in the EZ/SV group compared to 18 (0.2%) patients in the SV group with CEC adjudicated rhabdomyolysis; the estimated percent difference and 95% CI was (-0.19, 0.07), p= Of the 13 patient in the EZ/SV group with rhabdomyolysis, 10 were categorized as rhabdomyolysis with renal involvement and 3 were categorized as rhabdomyolysis without renal involvement. The mean age of those with rhabdomyolysis in the EZ/SV treatment arm was 67 years, 8 of 13 patients were male, 9 of 13 had a history of hypertension, and 7 of 13 had a history of diabetes mellitus. The mean creatinine clearance was 71 ml/min. Of the 18 patients in the SV group with rhabdomyolysis, 9 were categorized as rhabdomyolysis with renal involvement and 9 were categorized as rhabdomyolysis 123
152 without renal involvement. The mean age of these patients was 67 years, 8 out of 18 were male, 13 out of 18 had a history of hypertension, and 11 out of 18 had diabetes mellitus. The mean baseline creatinine clearance was 75 ml/min. The following table presents a brief summary of the rhabdomyolysis cases seen in IMPROVE-IT. Table 80: CEC-adjudicated cases of Rhabdomyolysis ID Rx Demographic Sex/Age/Race 03511/ / / / / / / / / / / / / / / / / / / / Rhabdo Onset Date Relative Day to Random. Renal Dysfunction (CEC reported) Hospital Y/N SV 40mg M/57/Black 09Jul Yes Yes SV 40mg F/71/Caucasian 06Jun06 27 Yes Yes SV 40mg F/75/Caucasian 21Oct No Yes SV 40mg M/60/Caucasian 04Feb Yes No SV 40mg M/75/Caucasian 05Mar No Yes SV 40mg F/70/Caucasian 23May09 26 No Yes SV 40mg F/69/Caucasian 18Feb10 30 Yes Yes SV 40mg F/69/Asian 22Mar No Yes SV 80mg F/56/Caucasian 16Apr Yes Yes SV 80mg F/65/Caucasian 28Jun No Yes SV 80mg F/69/Caucasian 20Feb No Yes SV 80 mg SV 80mg M/73/Caucasian 01Jan No Yes M/58/Caucasian 05Apr Yes Yes SV 80mg M/53/Caucasian 13Aug07 47 No Yes SV 80mg F/69/Caucasian 02Jul Yes Yes SV 80mg M/58/Black 26Apr Yes Yes (b) (6) SV 80mg M/77/Caucasian 841 Yes Yes SV 80mg F/73/Caucasian 06May No No EZ/SV 10/40mg EZ/SV 10/40mg M/67/Caucasian 27Feb Yes Yes M/62/Caucasian 23Jan07 20 No Yes Peak CK 20,770 IU/L 31,937 IU/L 23,575 IU/L 3,440 IU/L 4,070 IU/L 12,856 IU/L 19,526 U/L 15,000 IU/L 22,473 IU/L 21,760 IU/L 10,116 U/L 7,677 U/L 4,779 IU/L 82,232 IU/L 8,652 U/L 6,044 IU/L 30,852 U/L 28,145 IU/L 46,258 IU/L 228,050 U/L 124
153 ID Rx Demographic Sex/Age/Race Rhabdo Onset Date Relative Day to Random. Renal Dysfunction (CEC reported) Hospital Y/N 00435/ EZ/SV /40mg M/85/Caucasian 31Jul Yes Yes 00563/ EZ/SV /40mg M/75/Caucasian 17Apr Yes Yes 00136/ EZ/SV /40 mg M/71/Caucasian 02Feb08 25 Yes Yes 00245/ EZ/SV /40mg M/58/Caucasian 29Feb08 33 No Yes 03503/ EZ/SV /40mg F/54/Caucasian 15Jan Yes Yes 00627/ EZ/SV /40mg F/70/Caucasian 11Apr09 20 Yes Yes 00321/ EZ/SV /40mg M/54/Other (b) (6) 877 Yes No 00868/ EZ/SV /40 mg F/68/Caucasian 26Jul10 25 Yes No 03555/ EZ/SV /80mg F/79/Caucasian 02Mar Yes Yes 00254/ EZ/SV /40mg M/67/Caucasian 25Mar No No 03533/ EZ/SV /40mg F/59/Caucasian 09Nov Yes No Source: Adverse events data-3, Table Peak CK 27,771 IU/L 4,350 IU/L 383,800 IU/L 35,261 IU/L 11,000 IU/L 41,250 IU/L 6,967 U/L 3,000 IU/L 14,700 U/L 12,793 IU/L 5,720 IU/L Among the nine patients receiving EZ/SV at the time of the event of rhabdomyolysis with renal involvement, one patient was taking EZ/SV 80 mg (AN 00246). According to the Applicant, all but two patients had apparent contributing factors or alternate explanations for the event. In five patients, concomitant therapies possibly contributing to the rhabdomyolysis and renal impairment included amlodipine (AN 00246), clarithromycin (AN 02334, AN 18070), amlodipine and clarithromycin (AN 04325), and amiodarone (AN 08180). In two other subjects, alternate explanations/contributing factors were a fall (AN 10894) and a substantial accidental overdose of study drug (3 x instructed study dose was taken daily for 22 days) (AN 10319). Alternate etiology was less evident in AN , a 71 year old female with onset of muscle pain and rhabdomyolysis within one month of starting study drug. Additionally patient AN , a 55 year old male with diabetic nephropathy, whose event occurred 1 week following the discontinuation of study drug due to worsening elevated creatine kinase also did not have alternative etiology. The subject was not placed on hemodialysis per local Nephrology Department decision. The subject died 15 days later at home due to end stage renal failure. CEC adjudicated cause of death was noncardiovascular disease (Renal). Among the nine patients with an event of rhabdomyolysis associated with renal involvement receiving simvastatin monotherapy, four patients were receiving 40 mg and five subjects were receiving simvastatin 80 mg at the time of the event. In four patients, 125
154 concomitant therapies possibly contributing to the rhabdomyolysis included clarithromycin (AN 00435; simvastatin 80 mg), levofloxacin (AN 00892; simvastatin 40 mg), amlodipine (and hypothyroidism AN 16123; simvastatin 40 mg) and verapamil (AN 08683; simvastatin 80 mg). Patients AN and AN had less well defined alternate etiologies. Patient AN 10761, a 60 year old male with a history of renal stones, was on simvastatin 40mg for 11 months prior to the rhabdomyolysis event. Patient AN 11124, a 78 year old male with newly diagnosed Idiopathic Pulmonary Fibrosis received simvastatin 80mg for 1.6 years prior to the rhabdomyolysis event. A secondary diagnosis made by physicians treating the subject at the time of the rhabdomyolysis event was right lobar pneumonia. This subject was considered recovered from the rhabdomyolysis event approximately 16 days after stopping study drug. However, 12 days later the subject was hospitalized again for asthenia, fever, and lower limb pain. During a prolonged hospitalization he experienced progressive respiratory insufficiency and persistent fever, and later had cardiac and respiratory arrest and died. The CEC adjudicated the cause of death as severe respiratory insufficiency. There were three patients in the EZ/SV arm and nine patients in the simvastatin monotherapy groups who had CEC reported events of rhabdomyolysis without renal involvement. The three patients in the ezetimibe/simvastatin group were both receiving ezetimibe/simvastatin 40 mg at the time of the event. In two of the subjects, the event of rhabdomyolysis occurred within approximately one month from the start of study drug. In these cases, study drug was permanently discontinued and the event resolved. Among the nine patients with the event of rhabdomyolysis without renal involvement in the simvastatin monotherapy arm, four were receiving simvastatin 40 mg and five were receiving simvastatin 80 mg at the time of the event. One patient (AN ) on simvastatin 40 mg and one subject (AN ) on simvastatin 80 mg developed rhabdomyolysis within two months of starting study therapy. The remaining subjects on simvastatin monotherapy who developed this event did so after at least approximately one year of study therapy. All patients permanently discontinued study therapy and recovered from the event. According to the Applicant, among the patients on simvastatin monotherapy, 5 were found to have contributing factors or alternate explanations which might have contributed to these events. AN on simvastatin 80 mg was taking amlodipine as was AN who was randomized to and was receiving blinded simvastatin 40 mg but also receiving open label simvastatin 40 mg. AN (simvastatin 80 mg) had reported diarrhea for over one month at the time of the event and AN (simvastatin 80 mg) had been receiving treatment with ranolazine. AN who had been randomized to and receiving simvastatin 40 mg had also been receiving simvastatin 60 mg open label at the time of the event. 126
155 Myopathy In the ITT population, there were 15 (0.2%) patients on EZ/SV compared to 10 (0.1%) on SV with CEC determined myopathy; the estimated percent difference and 95% CI was 0.06 (-0.06, 0.17), p= Of the 15 patient in the EZ/SV group CEC determined myopathy, the mean age was 65 years, 10 of 15 patients were male, 9 of 15 had a history of hypertension, and 6 of 15 had a history of diabetes mellitus. Baseline mean creatinine clearance was 82 ml/min. Of the 10 patients in SV group with CEC determined myopathy, the mean age was 67 years, 5 out of 10 were male, 5 out of 10 patients had a history of hypertension, and 1 out of 10 had diabetes. Baseline mean creatinine clearance was 68 ml/min, Table 81: Patients with Myopathy but not Rhabdomyolysis on Study Treatment within 30 days period prior to event ID Rx Demographic Sex/Age/Race 03570/ / / / / / / / / / / Myopathy Onset Date Relative Day to Random. Hospital Y/N SV 40mg M/71/Other 28Nov Yes SV 40mg M/74/Asian 28Jun Yes SV 40mg M/46/Caucasian 01May07 78 No SV 40mg F/63/Caucasian 22Jul No SV 80mg F/74/Caucasian 18Sep No SV 80mg M/59/Caucasian 07Nov Yes SV 80mg F/63/Other 25Oct No SV 80mg M/70/Caucasian 26Sep No SV 80mg F/72/Caucasian 24May Yes SV 40mg EZ/SV 10/40mg M/71/Other (Spanish decent) M/67/Caucasian 28 Nov Yes 01Aug10 Also with off-drug rhabdo with pravastatin 1564 No Peak CK 2,499 IU/L 2,867 IU/L 1,072 IU/L 1,234 IU/L 6,614 IU/L 1,389 IU/L 6,541 IU/L 1,390 mu/ml 8,570 IL/L 2,499 IU/L 12,793 IU/L 00331/ EZ/SV 3,690 M/81/Asian 14Sep06 43 No /40mg IU/L 02003/ EZ/SV 1,353 M/68/Caucasian 01May No /40mg IU/L 00331/ EZ/SV 1,394 M/61/Asian 07Dec Yes /40mg IU/L 03326/ EZ/SV M/74/Caucasian 06Mar08 28 Yes 6,
156 ID Rx Demographic Sex/Age/Race Myopathy Onset Date Relative Day to Random. Hospital Y/N Peak CK /40mg IU/L 00762/ EZ/SV 1,305 F/71/Caucasian 01Sept08 95 No /40mg mu/ml 00326/ EZ/SV 4,802 F/72/Asian 29Sept08 32 No /40mg IU/L 02000/ EZ/SV 3,798 M/50/Caucasian 04Mar No /40mg IU/L 00257/ EZ/SV 2,976 M/63/Caucasian 19Jan Yes /40mg mu/ml 01107/ EZ/SV 3,234 F/51/Caucazian 06Feb10 54 Yes /40mg IU/L 01031/ EZ/SV 8,643 F/63/Asian 09Jul10 29 No /40mg IU/L 00957/ EZ/SV 2,335 F/63/Other 02Aug10 26 No /40mg mu/ml 00558/ EZ/SV 5,357 M/68/Caucasian 24Jun No /80mf IU/L Source: Adverse events data-3, Table Myalgia In addition to rhabdomyolysis and myopathy, the CEC reviewed cases of myalgia without CPK elevation > 5XULN as well as myalgia with CPK elevation >5XULN, but below the threshold for myopathy. For myalgia without CPK elevation > 5XULN category, there were 63 (0.7%) patients in the EZ/SV arm compared to 72 (0.8%) in the SV arm. For myalgia with CPK > 5XULN category, there were 26 (0.3%) patients in the EZ/SV arm compared to 31 (0.3%) in the SV arm. Overall, CEC determined myalgia with CPK > 5XULN, myopathy, or rhabdomyolysis occurred in 53/9067 (0.6%) patients in EZ/SV group and 58/9077 (0.6%) patients in SV group. The rate of adverse events with the specific preferred term of myalgia was also similar between the treatment groups (10.68% in the EZ/SV group and 10.08% in the SV group). Additionally, adverse events with the preferred term of myalgia led to discontinuation in 209 (2.31%) subjects in the EZ/SV group and 201 (2.21%) subjects in the SV monotherapy group. However, adverse events in the Musculoskeletal and Connective Tissue Disorder SOC were reported with more frequency in the EZ/SV group (47.05%) than in the SV group (45.16%). Therefore, when all adverse events that map to musculoskeletal disorders 128
157 are considered (and not just the term myalgia), there is a higher incidence of those events in the EZ/SV treatment arm. Additionally, a total of 3,171 cases of investigator reported unexplained myalgia were reported by the investigators on the MYO form during IMPROVE-IT. Excluding the relatively small number (56 [0.3%]) of cases that were adjudicated as meeting the criteria for myopathy or rhabdomyolysis, the remaining cases potentially represent unexplained myalgia of the type reported by some to occur much more commonly than true myopathy/rhabdomyolysis in subjects taking statins. Over the course of the IMPROVE-IT trial, there were 1607 (17.7%) subjects who experienced this type of myalgia in the ezetimibe/simvastatin group compared with 1564 (17.2%) subjects in the simvastatin group, indicating a possible small contribution from ezetimibe. Liver-Related Adverse Events Patients with active liver disease or persistently unexplained serum transaminase elevations > 2XULN were excluded from study participation. During the course of the trial, ALT and AST testing were conducted at screening/randomization, Month 1, Month 4, Month 8, Month 16, annually and at study completion/early discontinuation. Total bilirubin and alkaline phosphatase were evaluated only at the screening/randomization visit, the annual visit, and at the time of study completion/early discontinuation. Study protocol dictated that if a patient was found to have an ALT and/or AST measurement 3 x ULN believed to be related to study drug, then repeat laboratories were performed within 1 week. If the transaminase level was 3 x ULN on two consecutive occasions, the study medication was interrupted. Investigative sites were instructed to repeat laboratory tests approximately every 2 weeks until the transaminase activity decreased to <2 x ULN, at which time study drug could be restarted at the discretion of the investigator. A patient who had a second episode of two consecutive observations of transaminase activity 3 x ULN believed to be related to study drug was to be discontinued from study medication, but was monitored for any clinical endpoint event until the termination of the trial. The evaluation of Hy s Law (which signifies possible drug-induced liver injury, DILI) was not a pre-specified adverse event of special interest (AESI) and cases were not adjudicated. Possible Hy s Law cases were identified as: ALT and/or AST 3 x ULN; AND total bilirubin 2 x ULN; AND alkaline phosphatase <2 x ULN In addition to the biochemical criteria listed above there would need to be no alternate cause for the laboratory abnormalities. The Applicant evaluated all post-baseline laboratory results derived from the same blood sample or from combinations of blood samples collected on the same study day to evaluate the possibility of DILI. 129
158
159
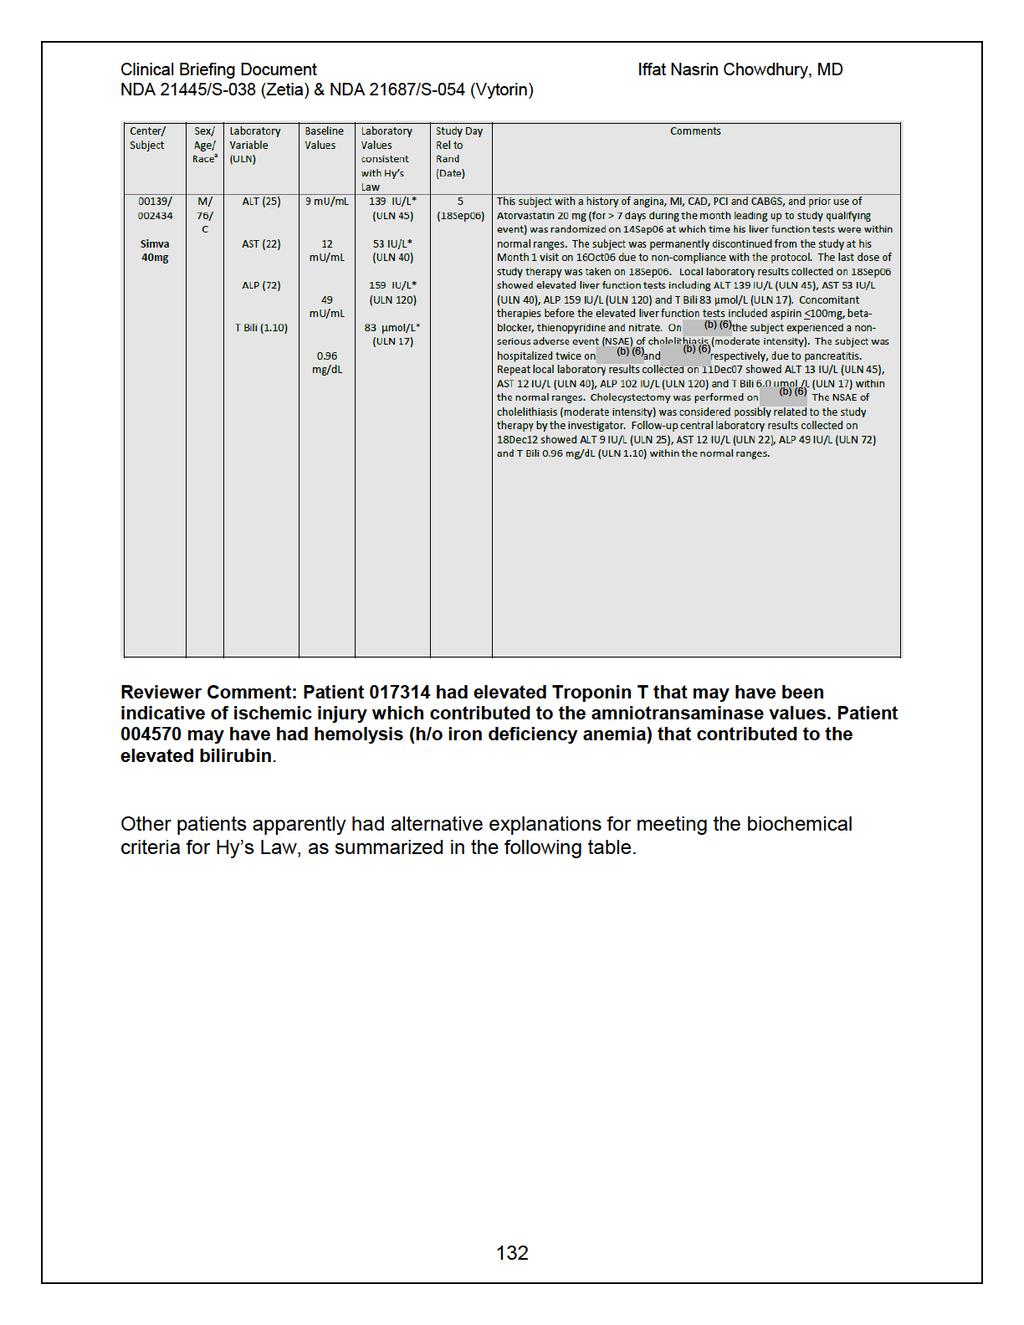
160
161 Clinical Briefing Document Table 82: Patients with Alternate Explanations for Meeting Biochemical Criteria for Drug Induced Liver Injury Sourve: IMPROVE-IT CSR, Table 12-19, pg. 297/793. Reviewer Comment: I agree with the alternative cause of explanation for patients meeting the biochemical criteria Hy s law. 133
 in the EZ/SV arm and 29 (0.3%) in the SV arm with AST >20XULN. The following table summarizes patients with aminotransferase, bilirubin and alkaline phosphatase elevations.")
162 Elevations in ALT and AST There were 19 patients (0.2%) in the EZ/SV treatment arm and 22 (0.3%) in the SV treatment arm who had ALT elevation >20XULN. There were 30 patients (0.3%) in the EZ/SV arm and 29 (0.3%) in the SV arm with AST >20XULN. The following table summarizes patients with aminotransferase, bilirubin and alkaline phosphatase elevations. Table 83: Patients with Aminotransferase, Bilirubin, and Alkaline Phosphatase Elevations, ITT Population Source: IMPROVE-IT CSR, Table 12-20, pg. 301/793. Reviewer Comment: Approximately 6.5% of the population had elevations in ALT or AST 3XULN in the EZ/SV arm as compared to the 5.9% in the SV arm. With regard to the time course of elevations, the largest numbers of elevations occurred during the first 4 months of treatment (data not shown), dropped and remained fairly constant over the rest of the first year and then dropped further in the subsequent years. There was no apparent difference in the time course between treatment groups. 134
163 Consecutive Elevations in ALT/AST Approximately 17% of randomized patients were up-titrated to simvastatin 80mg during the trial (27% in the SV treatment group, and 6% in the EZ/SV treatment group). The Applicant conducted exposure-adjusted analyses for instances of consecutive ALT/AST elevations 3X ULN. In the ITT population (excluding subjects who never took study drug), the exposure adjusted rate of consecutive ALT or AST 3xULN was similar between the treatment groups in patients taking simvastatin at a dose of 40 mg. Comparisons at the 80 mg dose were limited by the lesser use and thus the smaller number of cases in the EZ/SV group, however the risk appeared similar between the treatment groups in both the ITT population excluding subjects who never took study therapy. Table 84: Exposure-adjusted Rate of Elevations in ALT/AST (>3XULN, consecutive) by Treatment Group and Dose, Excluding Patients Who Never Took Study Drug Event ALT/AST 3xULN, consecutive SV dose 40 mg n/ N Exposed (%) 214/8851 (2.42) EZ/SV n/patient yrs exposed (events per 10,000 patient yrs) 214/34627 (61.8) 80 mg 7/561 (1.25) 7/1398 (50.1) Source: IMPROVE-IT CSR, Table 12-23, pg. 306/793. n/ N Exposed (%) 163/8855 (1.84) 42/2446 (1.72) SV n/patient yrs exposed (events per 10,000 patient yrs) 163/27623 (59.0) 42/7990 (52.6) Reviewer Comment: The small number of patients on simvastatin 80 mg in the EZ/SV treatment arm limits comparisons for that group of patients. However, simvastatin 40 mg in EZ/SV treatment arm had similar events per 10,000 patient years as in simvastatin 40 mg monotherapy (61.8 vs. 59.0). Deaths due to Hepatic-Related Event The Applicant found 14 subjects (9 patients in the EZ/SV group and 5 in the SV group) who died due to hepatic or liver related events. These cases were found by searching all deaths adjudicated by the CEC in the category of Other or Unknown. 135
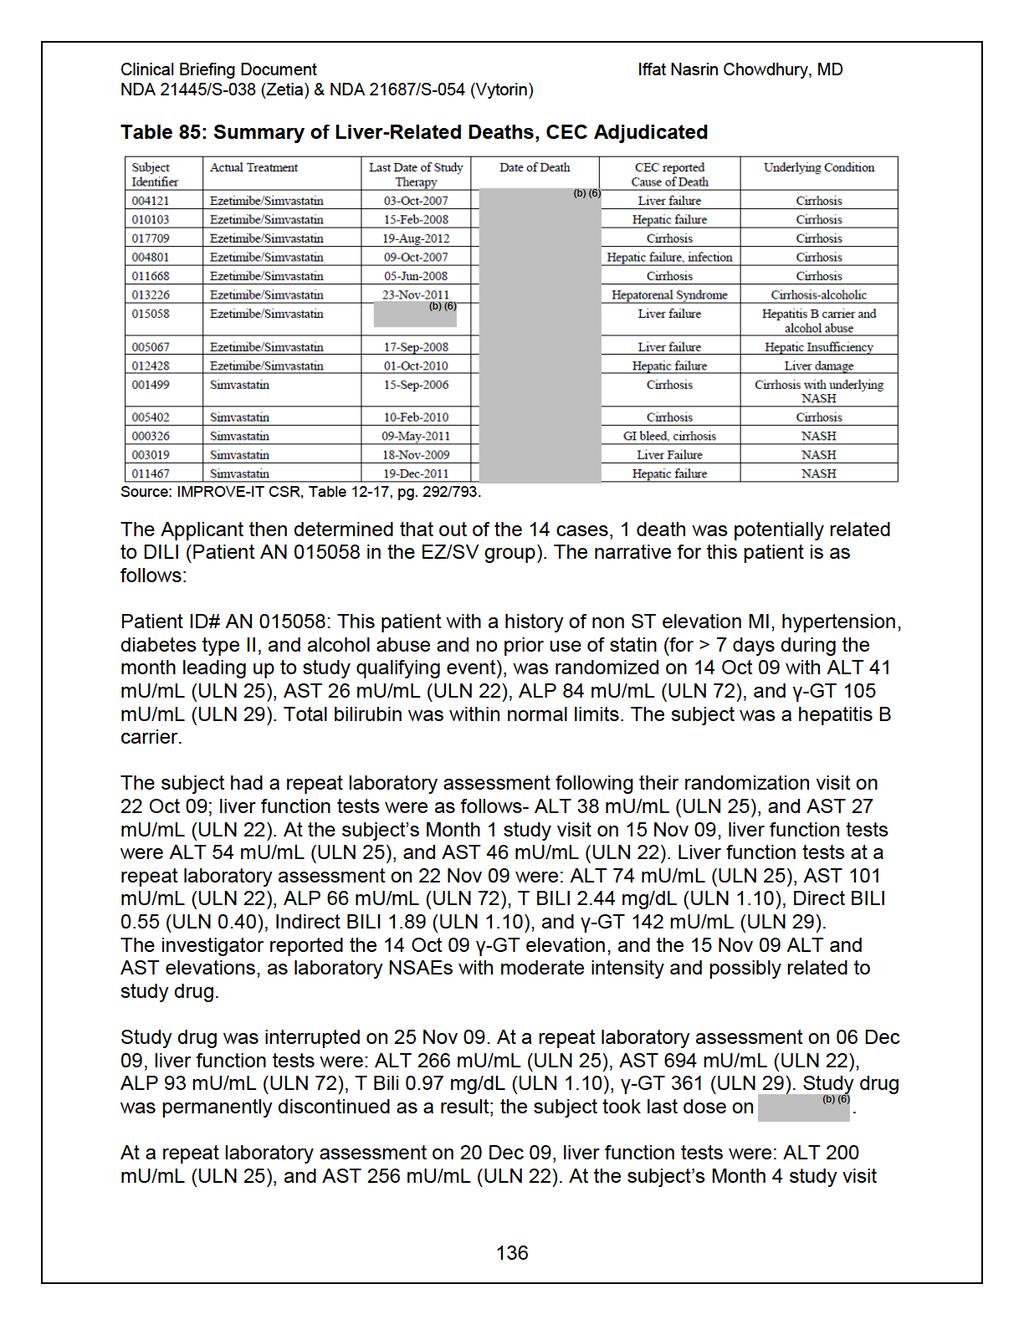
164
165 on 01 Mar 10, liver function tests were: ALT 92 mu/ml (ULN 25), and AST 66 mu/ml (ULN 22). There were no other clinical adverse events reported for this subject during the time period of increased liver function tests (Oct-Dec 2009). (b) (6) On, 1.7 years after discontinuation of study drug, the subject was admitted to the hospital due to confused state, extreme weakness, ascites, and hepatic (b) (6) encephalopathy. The subject had a recent diagnosis of anemia in, and this (b) (6) was ongoing at time of admission. The subject died on, cause of death reported by Investigator was acute respiratory failure. Cause of death as determined by CEC was liver failure. Latest known concomitant medication included deralin (10 mg X 3 a day), furosemide 40 mg daily, controloc (20 mg X 2 a day), calcium + vitamin D (1 tablet daily), and avilac syrup (dosage unknown, X 3 a day). Reviewer Comment: Patient was a hepatitis B carrier and had a history of alcohol abuse. Unlikely death was due to DILI, as permanent drug discontinuation occurred 1.7 years before liver-failure related death. Gallbladder-Related Adverse Events Prior to randomization into the study 8.3% of patients reported a history of gallbladder disease. The applicant used three specific standardized MedDRA queries (SMQs) to identify preferred terms representative of gallbladder related events: Biliary Tract Disorders SMQ Gallbladder Related SMQ Gallstone Related Disorders SMQ Statistical inferential analysis of safety data was planned for gallbladder-related AEs and for cholecystectomies. The following table summarizes the statistical analyses for these AEs. Table 86: Gallbladder Related and Cholecystectomy Analysis, ITT-Population EZ/SV SV Difference in % vs. SV group m/n, % m/n, % Risk Difference p- Estimate value (95% CI) Gallbladder-Related AEs 282/ /9077 (3.1%) (3.5%) (-0.95, 0.10) Biliary duct disorders SMQ 41/9067 (0.5%) 46/9077 (0.5%) (-0.26, 0.15) Gallbladder disorders SMQ 255/ /9077 (2.8%) (3.2%) (-0.92, 0.08) Gallstone disorders SMQ 163/ / 9077 (1.8%) (1.9%) (-0.46, 0.33) Gallbladder hospitalization 199/ / (-0.63, 0.24) Cholecystectomy hospitalization (2.2%) 133/9067 (1.5%) (2.4%) 134/9077 (1.5%) (-0.36, 0.34)
166 Source: IMPROVE-IT CSR, Table 12-10, pg. 274/793. The following table summarizes reported gallbladder-related events. The events were generally similar between the treatment arms. Table 87: Patients with Gallbladder-related Adverse Events, ITT Population Source: IMPROVE-IT CSR, Table 12-25, pg. 309/793. Reviewer Comment: Gallbladder related adverse events concern stems from 1 month studies in dogs given ezetimibe which increased the concentration of cholesterol in gallbladder bile by approximately 2 to 4 fold. The rate of gallbladder-related adverse events was generally similar between EZ/SV and SV treatment arms. 138
167 4.3.5 Submission Specific Primary Safety Concerns The following AEs were not pre-specified as AESI, but were analyzed because they represent potential risks associated with lipid lowering therapies: new onset diabetes, pancreatitis, acute renal failure, interstitial lung disease, and hypersensitivity reactions. New Onset Diabetes Mellitus The Applicant defined new onset of diabetes mellitus (NODM) as any patient with no recorded prior history of diabetes who had a diabetes-related adverse event reported during IMPROVE-IT and/or received antidiabetic medication post-randomization when such medication was not reported at baseline. In this analysis, approximately 7.2% of patients developed diabetes over the course of the trial. There were no differences between the two treatment groups; 650 (7.2%) subjects with NODM in the EZ/SV group and 659 (7.3%) in the SV group. The Applicant submitted a second analysis of new onset diabetes mellitus which defined NODM as 1) initiation of an anti-diabetic medication during trial or 2) two consecutive fasting glucose 126 mg/dl. Patients were excluded from the analysis if they were previously on an anti-diabetic medication or elevated glucose was noted at randomization (fasting 126 mg/dl or 200 mg/dl). Table 88: New Onset Diabetes Mellitus, by Treatment Arm, ITT Population EZ/SV SV HR (95% CI) n/m (%) n/m (%) New Onset Diabetes* 720/5297 (13.6%) 694/5341 (13.0%) 1.04 (0.94, 1.15) *New Onset Diabetes Mellitus= initiation of antidiabetic medications and/or 2 fasting glucoses 126 mg/dl during trial n=number of patients with event m=number of patients in subgroup Source: Applicant Submission 26-Oct Pancreatitis Patients who reported specific pancreatitis-related AE terms are summarized in the following table. There were 57 (0.63%) patients with an AE of pancreatitis in the EZ/SV group and 58 (0.64%) in the SV group. 139
168 Table 89: Patients with Pancreatitis-Related Adverse Events, ITT-Population Source: IMPROVE-IT CSR, Table 12-28, pg. 316/793. Reviewer Comment: Pancreatitis has been reported in post-marketing exposure of ezetimibe; however, it is generally not possible to reliably estimate the frequency or establish a causal relationship to drug exposure from post-marketing reporting. In the IMPROVE-IT trial, there were no clinically meaningful differences between treatment groups in pancreatitis-related adverse events. Hypersensitivity Reactions Hypersensitivity reaction-related adverse events are summarized in the following table. There were 735 (8.11%) patients in the EZ/SV group and 748 (8.24%) in the SV group who had an adverse event related to hypersensitivity reactions. 140

169 Table 90: Patients with Hypersensitivity-Related Adverse Events, ITT Population Source: IMPROVE-IT CSR, Table 12-31, pg. 319/793. Reviewer Comment: There were no meaningful differences between the treatment groups related to hypersensitivity reaction-related adverse events. 141
Clinical Trial Synopsis TL-OPI-518, NCT#
 Clinical Trial Synopsis, NCT# 00225264 Title of Study: A Double-Blind, Randomized, Comparator-Controlled Study in Subjects With Type 2 Diabetes Mellitus Comparing the Effects of Pioglitazone HCl vs Glimepiride
Study 2 ( ) Pivotal Phase 3 Study Top-Line Results. October 29, 2018
 Pivotal Phase 3 Study Top-Line Results. October 29, 2018") Study 2 (1002-047) Pivotal Phase 3 Study Top-Line Results October 29, 2018 Safe Harbor Forward-Looking Statements These slides and the accompanying oral presentation contain forward-looking statements
Study 2 (1002-047) Pivotal Phase 3 Study Top-Line Results October 29, 2018 Safe Harbor Forward-Looking Statements These slides and the accompanying oral presentation contain forward-looking statements
Effect of the PCSK9 Inhibitor Evolocumab on Cardiovascular Outcomes
 Effect of the PCSK9 Inhibitor Evolocumab on Cardiovascular Outcomes MS Sabatine, RP Giugliano, SD Wiviott, FJ Raal, CM Ballantyne, R Somaratne, J Legg, SM Wasserman, R Scott, MJ Koren, and EA Stein for
CARDIOVASCULAR SAFETY OF FEBUXOSTAT OR ALLOPURINOL IN PATIENTS WITH GOUT AND CARDIOVASCULAR DISEASE (The CARES Trial)
") CARDIOVASCULAR SAFETY OF FEBUXOSTAT OR ALLOPURINOL IN PATIENTS WITH GOUT AND CARDIOVASCULAR DISEASE (The CARES Trial) William B. White, MD for the CARES Investigators Calhoun Cardiology Center University
CARDIOVASCULAR SAFETY OF FEBUXOSTAT OR ALLOPURINOL IN PATIENTS WITH GOUT AND CARDIOVASCULAR DISEASE (The CARES Trial) William B. White, MD for the CARES Investigators Calhoun Cardiology Center University
Clinical Trial Synopsis TL-OPI-516, NCT#
 Clinical Trial Synopsis, NCT#00225277 Title of Study: A Double-Blind, Randomized, Comparator-Controlled Study in Subjects With Type 2 Diabetes Mellitus Comparing the Effects of Pioglitazone HCl Versus
Presented by Terje R. Pedersen Oslo Disclosure: Research grants and/or speaker- / consulting fees from Merck, MSP, Astra-Zeneca, Pfizer
 Presented by Terje R. Pedersen Oslo Disclosure: Research grants and/or speaker- / consulting fees from Merck, MSP, Astra-Zeneca, Pfizer Patients Randomized by Country 187 UK n=187 Norway n=425 Finland
How would you manage Ms. Gold
 How would you manage Ms. Gold 32 yo Asian woman with dyslipidemia Current medications: Simvastatin 20mg QD Most recent lipid profile: TC = 246, TG = 100, LDL = 176, HDL = 50 What about Mr. Williams? 56
Does High-Intensity Pitavastatin Therapy Further Improve Clinical Outcomes?
 Late Breaking Clinical Trial Session at AHA 2017 Does High-Intensity Pitavastatin Therapy Further Improve Clinical Outcomes? The REAL-CAD Study in 13,054 Patients With Stable Coronary Artery Disease Takeshi
The clinical trial information provided in this public disclosure synopsis is supplied for informational purposes only.
 The clinical trial information provided in this public disclosure synopsis is supplied for informational purposes only. Please note that the results reported in any single trial may not reflect the overall
CVD risk assessment using risk scores in primary and secondary prevention
 CVD risk assessment using risk scores in primary and secondary prevention Raul D. Santos MD, PhD Heart Institute-InCor University of Sao Paulo Brazil Disclosure Honoraria for consulting and speaker activities
CARDIOVASCULAR SAFETY OF FEBUXOSTAT OR ALLOPURINOL IN PATIENTS WITH GOUT AND CARDIOVASCULAR DISEASE (The CARES Trial)
") CARDIOVASCULAR SAFETY OF FEBUXOSTAT OR ALLOPURINOL IN PATIENTS WITH GOUT AND CARDIOVASCULAR DISEASE (The CARES Trial) William B. White, MD, for the CARES Investigators Calhoun Cardiology Center University
CARDIOVASCULAR SAFETY OF FEBUXOSTAT OR ALLOPURINOL IN PATIENTS WITH GOUT AND CARDIOVASCULAR DISEASE (The CARES Trial) William B. White, MD, for the CARES Investigators Calhoun Cardiology Center University
GSK Medicine: Study Number: Title: Rationale: Phase: Study Period: Study Design: Centres: Indication: Treatment: Objectives:
 The study listed may include approved and non-approved uses, formulations or treatment regimens. The results reported in any single study may not reflect the overall results obtained on studies of a product.
Drug Class Review HMG-CoA Reductase Inhibitors (Statins) and Fixed-dose Combination Products Containing a Statin
 and Fixed-dose Combination Products Containing a Statin") Drug Class Review HMG-CoA Reductase Inhibitors (Statins) and Fixed-dose Combination Products Containing a Statin Final Report Update 5 November 2009 This report reviews information about the comparative
Drug Class Review HMG-CoA Reductase Inhibitors (Statins) and Fixed-dose Combination Products Containing a Statin Final Report Update 5 November 2009 This report reviews information about the comparative
Patient characteristics Intervention Comparison Length of followup
 ISCHAEMIA TESTING CHAPTER TESTING FOR MYCOCARDIAL ISCHAEMIA VERSUS NOT TESTING FOR MYOCARDIAL ISCHAEMIA Ref ID: 4154 Reference Wienbergen H, Kai GA, Schiele R et al. Actual clinical practice exercise ing
(For National Authority Use Only) Name of Study Drug: to Part of Dossier:
 Name of Study Drug: to Part of Dossier:") 2.0 Synopsis Abbott Laboratories Individual Study Table Referring to Part of Dossier: (For National Authority Use Only) Name of Study Drug: Volume: ABT-335 Name of Active Ingredient: Page: ABT-335, A-7770335.115
2.0 Synopsis Abbott Laboratories Individual Study Table Referring to Part of Dossier: (For National Authority Use Only) Name of Study Drug: Volume: ABT-335 Name of Active Ingredient: Page: ABT-335, A-7770335.115
Sponsor Novartis. Generic Drug Name Fluvastatin. Therapeutic Area of Trial Dyslipidemia
 Page 1 Sponsor Novartis Generic Drug Name Fluvastatin Therapeutic Area of Trial Dyslipidemia Approved Indication Therapeutic area and approved indications in Germany: Hypercholesterolemia (HC), combined
Antihypertensive Trial Design ALLHAT
 1 U.S. Department of Health and Human Services Major Outcomes in High Risk Hypertensive Patients Randomized to Angiotensin-Converting Enzyme Inhibitor or Calcium Channel Blocker vs Diuretic National Institutes
2.0 Synopsis. Choline fenofibrate capsules (ABT-335) M Clinical Study Report R&D/06/772. (For National Authority Use Only) Name of Study Drug:
 M Clinical Study Report R&D/06/772. (For National Authority Use Only) Name of Study Drug:") 2.0 Synopsis Abbott Laboratories Individual Study Table Referring to Part of Dossier: (For National Authority Use Only) Name of Study Drug: Volume: Choline Fenofibrate (335) Name of Active Ingredient:
2.0 Synopsis Abbott Laboratories Individual Study Table Referring to Part of Dossier: (For National Authority Use Only) Name of Study Drug: Volume: Choline Fenofibrate (335) Name of Active Ingredient:
PRASUGREL HYDROCHLORIDE (Effient Eli Lilly Canada Inc.) Indication: Acute Coronary Syndrome
 Indication: Acute Coronary Syndrome") CEDAC FINAL RECOMMENDATION PRASUGREL HYDROCHLORIDE (Effient Eli Lilly Canada Inc.) Indication: Acute Coronary Syndrome Recommendation: The Canadian Expert Drug Advisory Committee (CEDAC) recommends that
CEDAC FINAL RECOMMENDATION PRASUGREL HYDROCHLORIDE (Effient Eli Lilly Canada Inc.) Indication: Acute Coronary Syndrome Recommendation: The Canadian Expert Drug Advisory Committee (CEDAC) recommends that
LAMIS (Livalo in AMI Study)
") JCR 2018. 12. 8 LAMIS (Livalo in AMI Study) Young Joon Hong Division of Cardiology, Chonnam National University Hospital Gwangju, Korea Trend of hypercholesterolemia in Korea < Prevalence of hypercholesterolemia
JCR 2018. 12. 8 LAMIS (Livalo in AMI Study) Young Joon Hong Division of Cardiology, Chonnam National University Hospital Gwangju, Korea Trend of hypercholesterolemia in Korea < Prevalence of hypercholesterolemia
Study 1 ( ) Pivotal Phase 3 Long-Term Safety Study Top-Line Results
 Pivotal Phase 3 Long-Term Safety Study Top-Line Results") Study 1 (1002-040) Pivotal Phase 3 Long-Term Safety Study Top-Line Results May 2, 2018 1 COPYRIGHT 2018 ESPERION. ALL RIGHTS RESERVED DO NOT COPY OR DISTRIBUTE Safe Harbor Forward-Looking Statements These
Study 1 (1002-040) Pivotal Phase 3 Long-Term Safety Study Top-Line Results May 2, 2018 1 COPYRIGHT 2018 ESPERION. ALL RIGHTS RESERVED DO NOT COPY OR DISTRIBUTE Safe Harbor Forward-Looking Statements These
The JUPITER trial: What does it tell us? Alice Y.Y. Cheng, MD, FRCPC January 24, 2009
 The JUPITER trial: What does it tell us? Alice Y.Y. Cheng, MD, FRCPC January 24, 2009 Learning Objectives 1. Understand the role of statin therapy in the primary and secondary prevention of stroke 2. Explain
Controversies in Cardiac Pharmacology
 Controversies in Cardiac Pharmacology Thomas D. Conley, MD FACC FSCAI Disclosures I have no relevant relationships with commercial interests to disclose. 1 Doc, do I really need to take all these medicines?
Reflection paper on assessment of cardiovascular safety profile of medicinal products
 25 February 2016 EMA/CHMP/50549/2015 Committee for Medicinal Products for Human Use (CHMP) Reflection paper on assessment of cardiovascular safety profile of medicinal products Draft agreed by Cardiovascular
Clinical Policy: Evolocumab (Repatha) Reference Number: CP.CPA.269 Effective Date: Last Review Date: Line of Business: Commercial
 Reference Number: CP.CPA.269 Effective Date: Last Review Date: Line of Business: Commercial") Clinical Policy: (Repatha) Reference Number: CP.CPA.269 Effective Date: 11.16.16 Last Review Date: 11.17 Line of Business: Commercial Revision Log See Important Reminder at the end of this policy for important
Clinical Policy: (Repatha) Reference Number: CP.CPA.269 Effective Date: 11.16.16 Last Review Date: 11.17 Line of Business: Commercial Revision Log See Important Reminder at the end of this policy for important
Update on Dyslipidemia and Recent Data on Treating the Statin Intolerant Patient
 Update on Dyslipidemia and Recent Data on Treating the Statin Intolerant Patient Steven E. Nissen MD Chairman, Department of Cardiovascular Medicine Cleveland Clinic Disclosure Consulting: Many pharmaceutical
4/7/ The stats on heart disease. + Deaths & Age-Adjusted Death Rates for
 + Update on Lipid Management Stacey Gardiner, MD Assistant Professor Division of Cardiovascular Medicine Medical College of Wisconsin + The stats on heart disease Over the past 10 years for which statistics
In-Ho Chae. Seoul National University College of Medicine
 The Earlier, The Better: Quantum Progress in ACS In-Ho Chae Seoul National University College of Medicine Quantum Leap in Statin Landmark Trials in ACS patients Randomized Controlled Studies of Lipid-Lowering
Drug Class Monograph
 Drug Class Monograph Class: Proprotein Convertase Subtilisin/Kexin Type 9 (PCSK9) Inhibitor Drugs: Praluent (alirocumab), Repatha (evolocumab) Line of Business: Medi-Cal Effective Date: February 17, 2016
Ticagrelor compared with clopidogrel in patients with acute coronary syndromes the PLATO trial
 compared with clopidogrel in patients with acute coronary syndromes the PLATO trial August 30, 2009 at 08.00 CET PLATO background In NSTE-ACS and STEMI, current guidelines recommend 12 months aspirin and
The TNT Trial Is It Time to Shift Our Goals in Clinical
 The TNT Trial Is It Time to Shift Our Goals in Clinical Angioplasty Summit Luncheon Symposium Korea Assoc Prof David Colquhoun 29 April 2005 University of Queensland, Wesley Hospital, Brisbane, Australia
Reflection paper on assessment of cardiovascular risk of medicinal products for the treatment of cardiovascular and metabolic diseases Draft
 1 2 3 21 May 2015 EMA/CHMP/50549/2015 Committee for Medicinal Products for Human Use (CHMP) 4 5 6 7 Reflection paper on assessment of cardiovascular risk of medicinal products for the treatment of cardiovascular
2013 Cholesterol Guidelines. Anna Broz MSN, RN, CNP, AACC Adult Certified Nurse Practitioner North Ohio Heart, Inc.
 2013 Cholesterol Guidelines Anna Broz MSN, RN, CNP, AACC Adult Certified Nurse Practitioner North Ohio Heart, Inc. Disclosures Speaker Gilead Sciences NHLBI Charge to the Expert Panel Evaluate higher quality
Sponsor Novartis. Generic Drug Name Vildagliptin/Metformin. Therapeutic Area of Trial Type 2 diabetes. Approved Indication Type 2 diabetes
 Clinical Trial Results Database Page 1 Sponsor Novartis Generic Drug Name Vildagliptin/Metformin Therapeutic Area of Trial Type 2 diabetes Approved Indication Type 2 diabetes Study Number CLMF237A2309
ESC Geoffrey Rose Lecture on Population Sciences Cholesterol and risk: past, present and future
 ESC Geoffrey Rose Lecture on Population Sciences Cholesterol and risk: past, present and future Rory Collins BHF Professor of Medicine & Epidemiology Clinical Trial Service Unit & Epidemiological Studies
PCSK9 Agents Drug Class Prior Authorization Protocol
 PCSK9 Agents Drug Class Prior Authorization Protocol Line of Business: Medicaid P & T Approval Date: February 21, 2018 Effective Date: April 1, 2018 This policy has been developed through review of medical
Supplemental Online Content 2
 Supplemental Online Content 2 Nissen SE, Stroes E, Dent-Acosta RE, et al; GAUSS-3 Investigators. Efficacy and tolerability of evolocumab vs ezetimibe in patients with muscle-related statin intolerance:
Clinical Efficacy and Safety of Achieving Very Low LDL-C Levels With the PCSK9 Inhibitor Evolocumab in the FOURIER Outcomes Trial
 Clinical Efficacy and Safety of Achieving Very Low LDL-C Levels With the PCSK9 Inhibitor Evolocumab in the FOURIER Outcomes Trial RP Giugliano, TR Pedersen, AC Keech, PS Sever, JG Park, and MS Sabatine,
The clinical trial information provided in this public disclosure synopsis is supplied for informational purposes only.
 The clinical trial information provided in this public disclosure synopsis is supplied for informational purposes only. Please note that the results reported in any single trial may not reflect the overall
This clinical study synopsis is provided in line with Boehringer Ingelheim s Policy on Transparency and Publication of Clinical Study Data.
 abcd Clinical Study Synopsis for Public Disclosure This clinical study synopsis is provided in line with s Policy on Transparency and Publication of Clinical Study Data. The synopsis which is part of the
Summary ID#7029. Clinical Study Summary: Study F1D-MC-HGKQ
 CT Registry ID# 7029 Page 1 Summary ID#7029 Clinical Study Summary: Study F1D-MC-HGKQ Clinical Study Report: Versus Divalproex and Placebo in the Treatment of Mild to Moderate Mania Associated with Bipolar
Weigh the benefit of statin treatment: LDL & Beyond
 Weigh the benefit of statin treatment: LDL & Beyond Duk-Woo Park, MD, PhD Heart Institute, University of Ulsan College of Medicine, Asan Medical, Seoul, Korea FOURIER Further cardiovascular OUtcomes Research
Rimegepant Pivotal Phase 3 Trial Results - Conference Call March 26, Biohaven
 Rimegepant Pivotal Phase 3 Trial Results - Conference Call March 26, 2018 1 Forward-Looking Statement This presentation contains forward-looking statements, including: statements about our plans to develop
The ACCELERATE Trial
 The ACCELERATE Trial Impact of the Cholesteryl Ester Transfer Protein Inhibitor Evacetrapib on Cardiovascular Outcome Stephen J Nicholls for the ACCELERATE investigators Disclosure Research support: AstraZeneca,
Andrew Cohen, MD and Neil S. Skolnik, MD INTRODUCTION
 2 Hyperlipidemia Andrew Cohen, MD and Neil S. Skolnik, MD CONTENTS INTRODUCTION RISK CATEGORIES AND TARGET LDL-CHOLESTEROL TREATMENT OF LDL-CHOLESTEROL SPECIAL CONSIDERATIONS OLDER AND YOUNGER ADULTS ADDITIONAL
Alirocumab Treatment Effect Did Not Differ Between Patients With and Without Low HDL-C or High Triglyceride Levels in Phase 3 trials
 Alirocumab Treatment Effect Did Not Differ Between Patients With and Without Low HDL-C or High Triglyceride Levels in Phase 3 trials G. Kees Hovingh, 1 Richard Ceska, 2 Michael Louie, 3 Pascal Minini,
1. Whether the risks of stent thrombosis (ST) and major adverse cardiovascular and cerebrovascular events (MACCE) differ from BMS and DES
 and major adverse cardiovascular and cerebrovascular events (MACCE) differ from BMS and DES") 1 Comparison of Ischemic and Bleeding Events After Drug- Eluting Stents or Bare Metal Stents in Subjects Receiving Dual Antiplatelet Therapy: Results from the Randomized Dual Antiplatelet Therapy (DAPT)
1 Comparison of Ischemic and Bleeding Events After Drug- Eluting Stents or Bare Metal Stents in Subjects Receiving Dual Antiplatelet Therapy: Results from the Randomized Dual Antiplatelet Therapy (DAPT)
(For National Authority Use Only) Name of Study Drug: to Part of Dossier:
 Name of Study Drug: to Part of Dossier:") 2.0 Synopsis Abbott Laboratories Individual Study Table Referring to Part of Dossier: (For National Authority Use Only) Name of Study Drug: Volume: Niaspan Name of Active Ingredient: Page: Niacin extended-release
2.0 Synopsis Abbott Laboratories Individual Study Table Referring to Part of Dossier: (For National Authority Use Only) Name of Study Drug: Volume: Niaspan Name of Active Ingredient: Page: Niacin extended-release
Lipid Panel Management Refresher Course for the Family Physician
 Lipid Panel Management Refresher Course for the Family Physician Objectives Understand the evidence that was evaluated to develop the 2013 ACC/AHA guidelines Discuss the utility and accuracy of the new
ATP IV: Predicting Guideline Updates
 Disclosures ATP IV: Predicting Guideline Updates Daniel M. Riche, Pharm.D., BCPS, CDE Speaker s Bureau Merck Janssen Boehringer-Ingelheim Learning Objectives Describe at least two evidence-based recommendations
2013 ACC AHA LIPID GUIDELINE JAY S. FONTE, MD
 2013 ACC AHA LIPID GUIDELINE JAY S. FONTE, MD How do you interpret my blood test results? What are our targets for these tests? Before the ACC/AHA Lipid Guidelines A1c:
New Evidence reports on presentations given at EULAR Safety and Efficacy of Tocilizumab as Monotherapy and in Combination with Methotrexate
 New Evidence reports on presentations given at EULAR 2009 Safety and Efficacy of Tocilizumab as Monotherapy and in Combination with Methotrexate Report on EULAR 2009 presentations Tocilizumab inhibits
Supplementary Online Content
 Supplementary Online Content Navarese EP, Robinson JG, Kowalewski M, et al. Association between baseline LDL-C level and total and cardiovascular mortality after LDL-C lowering: a systematic review and
Common Repatha Documentation Requirements for Patients With Primary Hyperlipidemia and Established CVD 1,2
 Established CVD Common Repatha Documentation Requirements for Patients With Primary Hyperlipidemia and Established CVD 1,2 Primary and Secondary Diagnosis Codes Primary Diagnosis: Primary hyperlipidemia
STATINS EVALUATION IN CORONARY PROCEDURES AND REVASCULARIZATION
 STATINS EVALUATION IN CORONARY PROCEDURES AND REVASCULARIZATION Otávio Berwanger, MD, FACS - On behalf of the SECURE Steering Committee and Investigators Trial Organization Trial Steering Committee Dr.
SYNOPSIS. Clinical Study Report CN138002: Addendum 1. Individual Study Table Referring to the Dossier
 Name of Sponsor/Company: Bristol-Myers Squibb Name of Finished Product: Abilify Name of Active Ingredient: aripiprazole Individual Study Table Referring to the Dossier (For National Authority Use Only)
2013 Cholesterol Guidelines. Anna Broz MSN, RN, CNP, AACC Cer=fied Adult Nurse Prac==oner North Ohio Heart, Inc.
 2013 Cholesterol Guidelines Anna Broz MSN, RN, CNP, AACC Cer=fied Adult Nurse Prac==oner North Ohio Heart, Inc. Disclosures Speaker Gilead Sciences NHLBI Charge to the Expert Panel Evaluate higher quality
Characterization of Types and Sizes of Myocardial Infarction Reduced with Evolocumab in FOURIER
 Characterization of Types and Sizes of Myocardial Infarction Reduced with Evolocumab in FOURIER Stephen D Wiviott, Robert P Giugliano, David A Morrow, Gaetano M De Ferrari, Basil S Lewis, Kurt Huber, Julia
Data Analysis Plan for assessing clinical efficacy and safety of ER niacin/laropiprant in the HPS2-THRIVE trial
 Data Analysis Plan for assessing clinical efficacy and safety of ER niacin/laropiprant in the HPS2-THRIVE trial 1 Background This Data Analysis Plan describes the strategy, rationale and statistical methods
Role of Clopidogrel in Acute Coronary Syndromes. Hossam Kandil,, MD. Professor of Cardiology Cairo University
 Role of Clopidogrel in Acute Coronary Syndromes Hossam Kandil,, MD Professor of Cardiology Cairo University ACS Treatment Strategies Reperfusion/Revascularization Therapy Thrombolysis PCI (with/ without
DUKECATHR Dataset Dictionary
 DUKECATHR Dataset Dictionary Version of DUKECATH dataset for educational use that has been modified to be unsuitable for clinical research or publication (Created Date and Time: 28OCT16 14:35) Table of
Supplement materials:
 Supplement materials: Table S1: ICD-9 codes used to define prevalent comorbid conditions and incident conditions Comorbid condition ICD-9 code Hypertension 401-405 Diabetes mellitus 250.x Myocardial infarction
STABILITY Stabilization of Atherosclerotic plaque By Initiation of darapladib TherapY. Harvey D White on behalf of The STABILITY Investigators
 STABILITY Stabilization of Atherosclerotic plaque By Initiation of darapladib TherapY Harvey D White on behalf of The STABILITY Investigators Lipoprotein- associated Phospholipase A 2 (Lp-PLA 2 ) activity:
LEADER Liraglutide and cardiovascular outcomes in type 2 diabetes
 LEADER Liraglutide and cardiovascular outcomes in type 2 diabetes Presented at DSBS seminar on mediation analysis August 18 th Søren Rasmussen, Novo Nordisk. LEADER CV outcome study To determine the effect
Drug Class Review on HMG-CoA Reductase Inhibitors (Statins)
") Drug Class Review on HMG-CoA Reductase Inhibitors () Final Report June 2004 Mark Helfand, MD, MPH Susan Carson, MPH Cathy Kelley, PharmD Oregon Evidence-based Practice Center Oregon Health & Science University
Drug Class Review on HMG-CoA Reductase Inhibitors () Final Report June 2004 Mark Helfand, MD, MPH Susan Carson, MPH Cathy Kelley, PharmD Oregon Evidence-based Practice Center Oregon Health & Science University
Managing Dyslipidemia in Disclosures. Learning Objectives 03/05/2018. Speaker Disclosures
 Managing Dyslipidemia in 2018 Glen J. Pearson, BSc, BScPhm, PharmD, FCSHP, FCCS Professor of Medicine (Cardiology) Co-Director, Cardiac Transplant Clinic; Associate Chair, Health Research Ethics Boards;
Effective Treatment Options With Add-on or Combination Therapy. Christie Ballantyne (USA)
") Effective Treatment Options With Add-on or Combination Therapy Christie Ballantyne (USA) Effective treatment options with add-on or combination therapy Christie M. Ballantyne, MD Center for Cardiovascular
Effective Treatment Options With Add-on or Combination Therapy Christie Ballantyne (USA) Effective treatment options with add-on or combination therapy Christie M. Ballantyne, MD Center for Cardiovascular
PFIZER INC. THERAPEUTIC AREA AND FDA APPROVED INDICATIONS: See USPI.
 PFIZER INC. These results are supplied for informational purposes only. Prescribing decisions should be made based on the approved package insert. For publications based on this study, see associated bibliography.
Case Presentation. Rafael Bitzur The Bert W Strassburger Lipid Center Sheba Medical Center Tel Hashomer
 Case Presentation Rafael Bitzur The Bert W Strassburger Lipid Center Sheba Medical Center Tel Hashomer Case Presentation 50 YO man NSTEMI treated with PCI 1 month ago Medical History: Obesity: BMI 32,
ARMYDA-RECAPTURE (Atorvastatin for Reduction of MYocardial Damage during Angioplasty) trial
 trial") ARMYDA-RECAPTURE ( for Reduction of MYocardial Damage during Angioplasty) trial Prospective, multicenter, randomized, double blind trial investigating efficacy of atorvastatin reload in patients on chronic
ARMYDA-RECAPTURE ( for Reduction of MYocardial Damage during Angioplasty) trial Prospective, multicenter, randomized, double blind trial investigating efficacy of atorvastatin reload in patients on chronic
PRODUCT INFORMATION VYTORIN. (ezetimibe and simvastatin) NAME OF THE MEDICINE
 NAME OF THE MEDICINE") PRODUCT INFORMATION VYTORIN (ezetimibe and simvastatin) NAME OF THE MEDICINE Ezetimibe The chemical name of ezetimibe is 1-(4-fluorophenyl)-3(R)-[3-(4-fluorophenyl)-3(S)- hydroxypropyl]-4(s)-(4-hydroxyphenyl)-2-azetidinone.
PRODUCT INFORMATION VYTORIN (ezetimibe and simvastatin) NAME OF THE MEDICINE Ezetimibe The chemical name of ezetimibe is 1-(4-fluorophenyl)-3(R)-[3-(4-fluorophenyl)-3(S)- hydroxypropyl]-4(s)-(4-hydroxyphenyl)-2-azetidinone.
Chemistry Reference Ranges and Critical Values
 Alanine Aminotransferase (ALT, SGPT) 3-9 years 9-18 years 1-9 years 9-18 years 10-30 U/L 10-30 U/L 10-20 U/L Albumin 0-6 days 6 days - 37 months 37 months - 7 years 7-20 years 2.6-3.6 g/dl 3.4-4.2 g/dl
Chemistry Reference Ranges and Critical Values
 Alanine Aminotransferase (ALT, SGPT) 3-9 years 9-18 years 1-9 years 9-18 years 10-25 U/L 10-35 U/L 10-30 U/L 10-25 U/L 10-30 U/L 10-35 U/L 10-25 U/L 10-35 U/L 10-25 U/L 10-20 U/L 10-35 U/L Albumin 0-6
rosuvastatin, 5mg, 10mg, 20mg, film-coated tablets (Crestor ) SMC No. (725/11) AstraZeneca UK Ltd.
 SMC No. (725/11) AstraZeneca UK Ltd.") rosuvastatin, 5mg, 10mg, 20mg, film-coated tablets (Crestor ) SMC No. (725/11) AstraZeneca UK Ltd. 09 September 2011 The Scottish Medicines Consortium (SMC) has completed its assessment of the above product
rosuvastatin, 5mg, 10mg, 20mg, film-coated tablets (Crestor ) SMC No. (725/11) AstraZeneca UK Ltd. 09 September 2011 The Scottish Medicines Consortium (SMC) has completed its assessment of the above product
JAMA. 2011;305(24): Nora A. Kalagi, MSc
: Nora A. Kalagi, MSc") JAMA. 2011;305(24):2556-2564 By Nora A. Kalagi, MSc Cardiovascular disease (CVD) is the number one cause of mortality and morbidity world wide Reducing high blood cholesterol which is a risk factor for
JAMA. 2011;305(24):2556-2564 By Nora A. Kalagi, MSc Cardiovascular disease (CVD) is the number one cause of mortality and morbidity world wide Reducing high blood cholesterol which is a risk factor for
Cost-effectiveness of evolocumab (Repatha ) for hypercholesterolemia
 for hypercholesterolemia") Cost-effectiveness of evolocumab (Repatha ) for hypercholesterolemia The NCPE has issued a recommendation regarding the cost-effectiveness of evolocumab (Repatha ). Following NCPE assessment of the applicant
Cost-effectiveness of evolocumab (Repatha ) for hypercholesterolemia The NCPE has issued a recommendation regarding the cost-effectiveness of evolocumab (Repatha ). Following NCPE assessment of the applicant
MS Sabatine, RP Giugliano, AC Keech, PS Sever, SA Murphy and TR Pedersen, for the FOURIER Steering Committee & Investigators
 Evolocumab Reduces Cardiovascular Events in Patients with Baseline LDL-C
Supplementary Appendix
 Supplementary Appendix This appendix has been provided by the authors to give readers additional information about their work. Supplement to: Weintraub WS, Grau-Sepulveda MV, Weiss JM, et al. Comparative
Clinical Policy: Alirocumab (Praluent) Reference Number: CP.CPA.268 Effective Date: Last Review Date: 11.17
 Reference Number: CP.CPA.268 Effective Date: Last Review Date: 11.17") Clinical Policy: (Praluent) Reference Number: CP.CPA.268 Effective Date: 11.16.16 Last Review Date: 11.17 Line of Business: Commercial Revision Log See Important Reminder at the end of this policy for
Clinical Policy: (Praluent) Reference Number: CP.CPA.268 Effective Date: 11.16.16 Last Review Date: 11.17 Line of Business: Commercial Revision Log See Important Reminder at the end of this policy for
The legally binding text is the original French version TRANSPARENCY COMMITTEE OPINION. 6 October 2010
 The legally binding text is the original French version TRANSPARENCY COMMITTEE OPINION 6 October 2010 CRESTOR 5 mg, film-coated tablet B/30 (CIP code: 369 853-8) B/90 (CIP code: 391 690-0) CRESTOR 10 mg,
Copyright 2017 by Sea Courses Inc.
 Diabetes and Lipids Copyright 2017 by Sea Courses Inc. All rights reserved. No part of this document may be reproduced, copied, stored, or transmitted in any form or by any means graphic, electronic, or
BRIEFING MATERIAL APRIL 14, 2015
 CENTER FOR DRUG EVALUATION AND RESEARCH FOOD AND DRUG ADMINISTRATION U.S. DEPARTMENT OF HEALTH AND HUMAN SERVICES BRIEFING MATERIAL NDA 22350: SAXAGLIPTIN (ONGLYZA) NDA 200678: SAXAGLIPTIN/METFORMIN (KOMBIGLYZE
Pharmaceutical Help to Control Cholesterol
 Pharmaceutical Help to Control Cholesterol Catherine E. Cooke, PharmD, BCPS, PAHM President, PosiHealth, Inc. Clinical Associate Professor, Univ. of Maryland This program has been brought to you by PharmCon
FOURIER: Enough Evidence to Justify Widespread Use? Did It fulfill Its Expectations?
 FOURIER: Enough Evidence to Justify Widespread Use? Did It fulfill Its Expectations? CVCT Washington, DC November 3, 2017 Marc S. Sabatine, MD, MPH Chairman, TIMI Study Group Lewis Dexter, MD, Distinguished
Supplementary Appendix
 Supplementary Appendix This appendix has been provided by the authors to give readers additional information about their work. Supplement to: Wanner C, Inzucchi SE, Lachin JM, et al. Empagliflozin and
Clinical Trial Synopsis TL-OPI-525, NCT#
 Clinical Trial Synopsis, NCT#00762736 Title of Study: A Phase II, Double-Blind, Randomized, Placebo-Controlled, Proof-of-Concept Study of the Efficacy, Safety, and Tolerability of Pioglitazone HCl (ACTOS
Clinical Policy Title: Statin use in adults and children
 Clinical Policy Title: Statin use in adults and children Clinical Policy Number: 04.02.09 Effective Date: May 1, 2016 Initial Review Date: February 17, 2016 Most Recent Review Date: September 21, 2017
The IMPROVE-IT trial (ezetimibe added to simvastatin for acute coronary syndrome). A critical appraisal. abstract
. A critical appraisal. abstract") drug and therapeutics bulletin of navarre, spain YEAR 2015 VOL 23, No 5 www.dtb.navarra.es @DTB_Navarre.es Muxotepotolobat abstract Objective: To conduct a review of the IMPROVE-IT trial, a study to assess
drug and therapeutics bulletin of navarre, spain YEAR 2015 VOL 23, No 5 www.dtb.navarra.es @DTB_Navarre.es Muxotepotolobat abstract Objective: To conduct a review of the IMPROVE-IT trial, a study to assess
Treatment of Cardiovascular Risk Factors. Kevin M Hayes D.O. F.A.C.C. First Coast Heart and Vascular Center
 Treatment of Cardiovascular Risk Factors Kevin M Hayes D.O. F.A.C.C. First Coast Heart and Vascular Center Disclosures: None Objectives What do risk factors tell us What to check and when Does treatment
Changing lipid-lowering guidelines: whom to treat and how low to go
 European Heart Journal Supplements (2005) 7 (Supplement A), A12 A19 doi:10.1093/eurheartj/sui003 Changing lipid-lowering guidelines: whom to treat and how low to go C.M. Ballantyne Section of Atherosclerosis,
A Randomized Trial Evaluating Clinically Significant Bleeding with Low-Dose Rivaroxaban vs Aspirin, in Addition to P2Y12 inhibition, in ACS
 A Randomized Trial Evaluating Clinically Significant Bleeding with Low-Dose Rivaroxaban vs Aspirin, in Addition to P2Y12 inhibition, in ACS Magnus Ohman MB, on behalf of the GEMINI-ACS-1 Investigators
Randomized Comparison of the Safety, Tolerability, and Efficacy of Long-term Administration of AMG 145: 52-Week Results From the OSLER Study
 Randomized Comparison of the Safety, Tolerability, and Efficacy of Long-term Administration of AMG 145: 52-Week Results From the OSLER Study Michael J Koren 1, Robert P Giugliano 2, Frederick Raal 3, David
Drug Prior Authorization Guideline PCSK9 Inhibitors -
 Drug Prior Authorization Guideline PCSK9 Inhibitors - REPATHA (evolocumab) PRALUENT (alirocumab) PA9911 Covered Service: Yes when meets criteria below Prior Authorization Required: Yes-as shown below Additional
Supplement Table 2. Categorization of Statin Intensity Based on Potential Low-Density Lipoprotein Cholesterol Reduction
 Supplement: Tables Supplement Table 1. Study Eligibility Criteria Supplement Table 2. Categorization of Statin Intensity Based on Potential Low-Density Lipoprotein Cholesterol Reduction Supplement Table
Regulatory Experience in Reviewing CV Safety for Diabetes
 Regulatory Experience in Reviewing CV Safety for Diabetes Drugs Kristina Dunder MD, PhD, Alternate CHMP member MPA, Sweden Disclaimer The views and opinions expressed in the following PowerPoint slides
ClinicalTrials.gov Identifier: NCT Sponsor/company: Sanofi-Aventis. Date: 08/02/ 2008
 These results are supplied for informational purposes only. Prescribing decisions should be made based on the approved package insert in the country of prescription Sponsor/company: Sanofi-Aventis ClinicalTrials.gov
ClinialTrials.gov Identifier: HOE901_4020 Insulin Glargine Date: Study Code: This was a multicenter study that was conducted at 59 US sites
 These results are supplied for informational purposes only. Prescribing decisions should be made based on the approved package insert in the country of prescription Sponsor/company: Generic drug name:
PFIZER INC. These results are supplied for informational purposes only. Prescribing decisions should be made based on the approved package insert.
 PFIZER INC. These results are supplied for informational purposes only. Prescribing decisions should be made based on the approved package insert. PROPRIETARY DRUG NAME / GENERIC DRUG NAME: Caduet / Amlodipine
Making War on Cholesterol with New Weapons: How Low Can We/Should We Go? Shaun Goodman
 Making War on Cholesterol with New Weapons: How Low Can We/Should We Go? Shaun Goodman Disclosures Research grant support, speaker/consulting honoraria: Sanofi and Regeneron Including ODYSSEY Outcomes