Supplementary Figure 1. c Human
|
|
|
- Dora Patrick
- 6 years ago
- Views:
Transcription
 and signal peptide cleavage sites (C-scores) of (a) human MYDGF (C19orf1) and (b) mouse (D17Wsu14e) as predicted by the")
 amino acids are shown. Signal peptides are highlighted in green.")
1 Supplementary Figure 1 a b c Human Mouse d Gapdh Amino acid sequence and baseline expression of MYDGF N-terminal signal peptides (S-scores) and signal peptide cleavage sites (C-scores) of (a) human MYDGF (C19orf1) and (b) mouse (D17Wsu14e) as predicted by the SignalP 4.1 algorithm. (c) Amino acid sequence alignment of human and mouse MYDGF. Identical and highly conserved (+) amino acids are shown. Signal peptides are highlighted in green. (d) Representative immunoblots (of three) showing and Gapdh expression in mouse tissues (LV, left ventricle).
 * ** *** 3 1 3 1 (ng ml -1 ) Endothelial cell network")

 Branching points and (c) closed tubes from 4 independent experiments. (b,c) Data are presented as the means ± s.e.m. *P <.")
2 Supplementary Figure 2 a Control VEGFA b c Branching points (per field) Closed tubes (per field) Control VEGFA Control VEGFA *** *** ** (ng ml -1 ) * ** *** (ng ml -1 ) Endothelial cell network formation We stimulated human coronary artery endothelial cells for 16 h with VEGFA (5 ng ml 1 ) and different concentrations of. We stained the cells with BCECF-AM for quantitative analysis. (a) Representative fluorescent images (1 ng ml 1 ). Scale bar, 2 µm. (b) Branching points and (c) closed tubes from 4 independent experiments. (b,c) Data are presented as the means ± s.e.m. *P <.5, **P <.1, ***P <.1 vs. control (one-way ANOVA with Dunnett s multiple comparison post hoc test).
3 Supplementary Figure 3 (4 pages) a MI 1 d / Gapdh (%) MI 3 d / Gapdh (%) Ly-6C low EC Ly-6C low Ly-6C low Ly-6C low MI 7 d 25 Bone marrow Spleen Peripheral blood / Gapdh (%) Ly-6C low Ly-6C low Ly-6C low Sham 1 d
 b Infarcted region Ly-6C low c Infarcted")
4 Supplementary Figure 3 (cont.) b Infarcted region Ly-6C low c Infarcted region Endothelial cells
5 Supplementary Figure 3 (cont.) d Bone marrow Ly-6C low e Spleen Ly-6C low
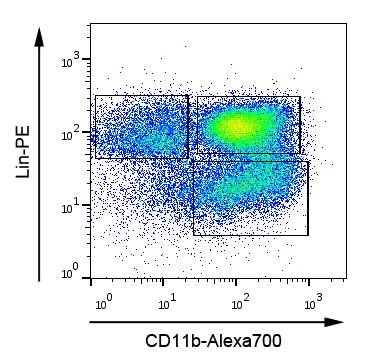
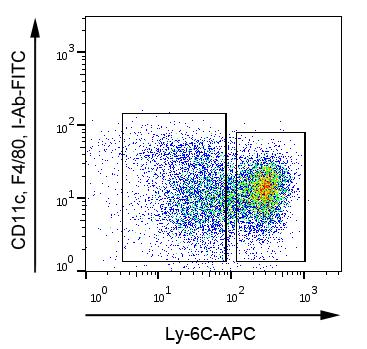
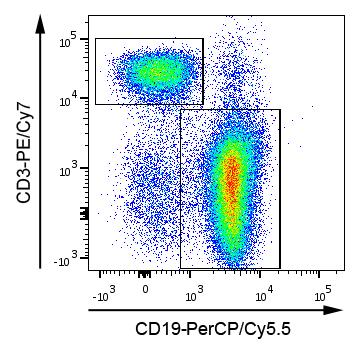
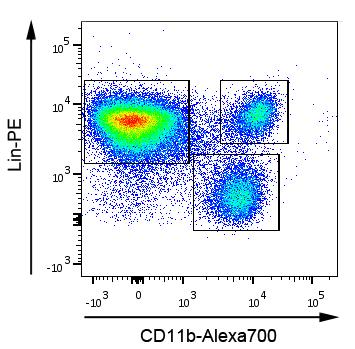
 f Peripheral blood Ly-6Clow expression in inflammatory cells and endothelial cells after MI We induced myocardial infarction (MI) in mice by coronary artery ligation for 1 h followed by reperfusion")
 expression (RT-qPCR, normalized to Gapdh) in monocytes, Ly-6C low monocytes or macrophages, neutrophils,,, and endothelial cells (EC) isolated by FACS from the infarcted region of the left")
6 Supplementary Figure 3 (cont.) f Peripheral blood Ly-6Clow expression in inflammatory cells and endothelial cells after MI We induced myocardial infarction (MI) in mice by coronary artery ligation for 1 h followed by reperfusion for 1, 3, or 7 d. Control mice underwent a sham operation. (a) expression (RT-qPCR, normalized to Gapdh) in monocytes, Ly-6C low monocytes or macrophages, neutrophils,,, and endothelial cells (EC) isolated by FACS from the infarcted region of the left ventricle, bone marrow, spleen, and peripheral blood. Data obtained 3 d after MI are also presented in Fig. 4f. Shown are the means ± s.e.m. from 5 mice (infarcted heart) and 4 mice (bone marrow, spleen, and peripheral blood) 1 d after MI; 4 mice (infarcted heart and spleen), 5 mice (bone marrow), and 3 mice (peripheral blood) 3 d after MI; 4 mice (all organs) 7 d after MI; 5 mice (bone marrow), 3 mice (spleen), and 4 mice (peripheral blood) 1 d after sham surgery. We defined the expression in heart monocytes 3 d after MI as 1%. (b f) Gating strategy. Representative panels 3 d after MI. (b,c) Infarcted region. (d) Bone marrow. (e) Spleen. (f) Peripheral blood.

 KO Neo e 664 bp f M +/ +/ / +/+ +/+ / / +/ WT K 1 2 B 3 4 5 6 X WT (664")
7 Supplementary Figure 4 (4 pages) a WT K 1 2 B X b Sham MI WT KO WT KO Vector Neo Gapdh 5. kb 3.4 kb KO Neo c WT K 11.3 kb 1 2 B X 1.4 kb d +/+ +/+ F6 +/ +/+ +/+ B8 +/ +/+ +/+ E5 +/ WT (11.3 kb) KO (1.4 kb) KO Neo e 664 bp f M +/ +/ / +/+ +/+ / / +/ WT K 1 2 B X WT (664 bp) 153 bp KO (153 bp) KO Neo
8 Supplementary Figure 4 (cont.) g 3 h WT KO 5 WT KO Time (d) Time (d)
 i 1, 1, 1 WT KO 1 j 1 Ly-6C low")
9 Supplementary Figure 4 (cont.) i 1, 1, 1 WT KO 1 j 1 Ly-6C low Ly-6C low
 k WT KO l 6 Coverage N (per field) Junctions (per field) 45 3 15 WT KO Generation and characterization at baseline of -deficient mice (a) Restriction map and intron and exon structure of the")
 We induced myocardial infarction (MI) in WT and KO mice by 1 h coronary artery ligation followed by reperfusion. Control mice underwent a sham operation.")
 Genomic PCR analysis of 9 ES cell clones after electroporation of the targeting construct. We used clone E5 to generate chimeric mice.")
10 Supplementary Figure 4 (cont.) k WT KO l 6 Coverage N (per field) Junctions (per field) WT KO Generation and characterization at baseline of -deficient mice (a) Restriction map and intron and exon structure of the (D17Wsu14e) genomic locus (wild-type, WT), the targeting construct (vector), and the targeted allele (knockout, KO). B, BamHI; K, KpnI; X, XbaI; Neo, neomycin resistance cassette. (b) We induced myocardial infarction (MI) in WT and KO mice by 1 h coronary artery ligation followed by reperfusion. Control mice underwent a sham operation. Immunoblots show and Gapdh expression in the infarcted region of the left ventricle 3 d after reperfusion or sham operation. (c) Primer pair used for whole locus spanning genomic PCR analysis. (d) Genomic PCR analysis of 9 ES cell clones after electroporation of the targeting construct. We used clone E5 to generate chimeric mice. (e) Primer pairs used for PCR genotyping of WT and KO alleles. (f) Representative gel illustrating PCR genotyping results from 8 offspring of a heterozygous mating. M, molecular size marker. (g,h) We monitored postnatal body mass gain in (g) 12 WT and 8 KO male mice and (h) 8 WT and 11 KO female mice. Data are presented as the means ± s.e.m. (i) Number of circulating neutrophils,,, and and Ly-6C low monocytes in WT (n = 5) and KO (n = 5) mice under baseline conditions as assessed by flow cytometry. Data are presented as the means ± s.e.m. (j) Gating strategy. Representative panels are from a WT mouse. (k,l) Postnatal retinal angiogenesis in WT and KO mice. (k) Representative fluorescent images representing retinas from 5 d old WT and KO mice stained with fluorescein-labeled isolectin B4. Scale bar, 1 mm. (l) Number of angiogenic sprouts at the angiogenic front, vascular plexus complexity, and endothelial coverage of the retina. Summary data (means ± s.e.m.) are from 7 WT and 6 KO mice.
11 Supplementary Figure 5 LV pressure (mmhg) WT, sham KO, sham WT, MI KO, MI LV volume (µl) Pressure-volume loops in wild-type and knockout mice We induced myocardial infarction (MI) in wild-type (WT) and knockout (KO) mice by coronary artery ligation for 1 h followed by reperfusion. Control mice underwent a sham operation. Representative left ventricular (LV) pressure-volume loops were recorded 28 d after MI.
12 Supplementary Figure 6 a (per mg) cells (per mg) 5, 4, 3, 2, 1, 1, , WT KO b Time (d) Time (d) Time (d) Inflammatory cell accumulation after MI in wild-type and knockout mice Ly-6C low We induced myocardial infarction (MI) in wild-type (WT) and knockout (KO) mice by coronary artery ligation for 1 h followed by reperfusion. (a) Accumulation of neutrophils, monocytes, Ly-6C low monocytes or macrophages,, and in the infarcted region of the left ventricle as assessed by flow cytometry 1 d (5 WT, 5 KO), 3 d (4 WT, 3 KO), and 7 d (4 WT, 3 KO) after reperfusion. Data are presented as the means ± s.e.m. *P <.5 WT vs. KO, P =.6 WT vs. KO (two independent sample t-test). (b) Gating strategy. Representative panels are from a WT mouse 3 d after MI.
13 Supplementary Figure 7 a b c ** * ** ** KO KO WT KO WT WT KO WT KO KO WT KO WT WT KO WT FAC (%) KO KO * ** WT KO WT WT KO WT Importance of bone marrow cell-derived after MI We transplanted ( ) bone marrow cells from wild-type (WT) and knockout (KO) mice into lethally irradiated WT or KO recipients. After bone marrow reconstitution, we induced myocardial infarction (MI) by coronary artery ligation for 1 h followed by reperfusion. (a) Isolectin B4 (IB4) + endothelial cell density in the infarct border zone 28 d after reperfusion. CM, cardiac myocyte. 1 mice per group. Data are presented as means ± s.e.m. *P <.5, **P <.1 (two independent sample t-test). (b) Scar size 28 d after reperfusion. 1 mice per group. Data are presented as means ± s.e.m. **P <.1 (two independent sample t-test). (c) Fractional area change (FAC) as determined by echocardiography 28 d after reperfusion in 8 KO KO, 13 WT KO, 15 WT WT, and 12 KO WT mice. Scatter plot shows values from individual mice. Horizontal bars are the means. *P <.5, **P <.1 (two independent sample t-test).
14 Supplementary Figure 8 a Plasma (fold increase) Time (min) i.v. bolus b Plasma (fold increase) LV bolus 15 min Time (d) s.c. infusion Control Rec. 1h ischemia c Baseline 15 min Control 15 min Rec. 2 d 6 d 9 d 2 d 6 d 9 d Rec. Gapdh Pharmacokinetics of recombinant (a) plasma levels in 4 non-infarcted FVB/N mice as determined by targeted LC-MS at serial time points after i.v. (tail vein) bolus injection of recombinant (rec.) (1 µg). Data are presented as means ± s.e.m. (fold increase vs. baseline which is indicated by the dashed red line). Elimination of from plasma after 15 min followed a first-order kinetic (R² =.86) with an estimated half-life of 15.3 min (95% confidence interval min). (b,c) We induced myocardial infarction in FVB/N mice by coronary artery ligation for 1 h followed by reperfusion. We injected rec. (1 µg) into the left ventricular (LV) cavity at the time of reperfusion followed by s.c. infusion for 7 d (1µg d 1 ). We treated infarcted control mice with PBS. (b) plasma levels as determined by targeted LC-MS at serial time points. 5 mice per group and time point. Data are presented as means ± s.e.m. (fold increase vs. baseline which is indicated by the dashed red line). (c) Delivery of rec. to the infarcted region of the left ventricle as determined by anti-his-tag immunoblotting. Representative immunoblot (of four) illustrating rec. and Gapdh expression.
 b IB4 DAPI WGA LacZ - SP LacZ d FAC (%) 7 6 5 4 3 2 1 LacZ - SP")
")

 7 d after adenovirus infection, we induced myocardial infarction by coronary artery")
 Fluoresceinlabeled isolectin B4 (IB4) + capillaries in the infarct border zone 28 d")
 are from 7 mice per group.")
 Scar size 28 d after reperfusion.")
 from 16 LacZ, 15, and 9 - SP mice.")

15 Supplementary Figure 9 a c - SP LacZ Gapdh Liver LacZ - SP LacZ Left ventricle - SP Infarct scar (% of LV) b IB4 DAPI WGA LacZ - SP LacZ d FAC (%) LacZ - SP *** - SP IB4 + cells (per CM) LacZ *** *** - SP LacZ - SP MI 6 d MI 28 d Adenoviral gene transfer in vivo (a) Representative immunoblots (of three) showing and Gapdh expression in the liver and left ventricle of FVB/N mice 7 d after i.v. infection with adenoviruses encoding β-galactosidase (lacz), full-length, or lacking the N-terminal signal peptide ( SP). (b d) 7 d after adenovirus infection, we induced myocardial infarction by coronary artery ligation for 1 h followed by reperfusion. (b) Fluoresceinlabeled isolectin B4 (IB4) + capillaries in the infarct border zone 28 d after reperfusion; extracellular matrix and cardiac myocyte (CM) borders are highlighted by WGA staining. Scale bar, 5µm. Summary data (means ± s.e.m.) are from 7 mice per group. ***P <.1 vs. lacz (one-way ANOVA with Dunnett s multiple comparison post hoc test). (c) Scar size 28 d after reperfusion. Representative tissue sections stained with Masson s trichrome. Scale bar, 1 mm. Summary data (means ± s.e.m.) from 16 LacZ, 15, and 9 - SP mice. ***P <.1 vs. lacz (one-way ANOVA with Dunnett s multiple comparison post hoc test). (d) Fractional area change (FAC) as determined by echocardiography 6 and 28 d after reperfusion in 17 LacZ, 15, and 9 - SP mice. Scatter plot shows values from individual mice. Horizontal bars are the means. ***P <.1 vs. lacz (for each time point one-way ANOVA with Dunnett s multiple comparison post hoc test).
16 Supplementary Figure 1 a Control b FAC (%) *** ### Sham MI, control MI, Delayed protein therapy after MI We induced myocardial infarction (MI) in FVB/N mice by coronary artery ligation for 1 h followed by reperfusion. Additional mice underwent a sham operation. We delivered by s.c. infusion for 7 d (1µg d 1 ) starting 6 h after reperfusion. We treated infarcted control mice with diluent only (PBS). (a) Scar size 28 d after reperfusion. Summary data (means ± s.e.m.) from 12 control and 14 -treated mice. **P <.1 (two independent sample t-test). (b) Fractional area change (FAC) as determined by echocardiography 28 d after reperfusion in 14 control mice, 16 -treated mice, and 6 sham-operated mice. Scatter plot shows values from individual mice. Horizontal bars are the means. ***P <.1 vs. both MI groups, ### P <.1 (one-way ANOVA with Tukey s multiple comparison post hoc test).
17 Supplementary Figure 11 (2 pages) a M P b kda M r (Da) M r UV V e (ml) c Anti-MYDGF No antibody Control IgG Input Eluate Beads Input Eluate Beads Input Eluate Beads d BrdU incorporation (%) Control -IP e BrdU incorporation (%) ** *** *** *** *** Control IgG ( g ml -1 ) Anti-MYDGF ( g ml -1 )
18 Supplementary Figure 11 (cont.) Production and validation of recombinant (a) SDS-PAGE analysis of the final recombinant protein preparation. We applied marker proteins (M, Mark12 Novex, Life Technologies) and 5 µl of the final protein preparation (P) to a 4 12% polyacrylamide gel. We stained the proteins with Coomassie Blue after electrophoresis. (b) Analytical size exclusion chromatography of the final protein preparation. The relative protein concentration (UV) and the absolute molecular mass (M r ) from the region of the chromatographic peak, as computed via the basic lightscattering equation, are plotted against the elution volume (V e ). (c) We immunoprecipitated from the final protein preparation using Dynabeads coated with the MYDGF antibody. We analyzed aliquots from the final protein preparation (input), the protein eluted from the beads (eluate), and the beads after protein elution (beads) by immunoblotting. We repeated the experiment using beads coated with no antibody or with control IgG. (d) We stimulated human coronary artery endothelial cells (HCAECs) with recombinant (1 ng ml 1 ) and immunoprecipitated from the final protein preparation (IP, 1 ng ml 1 ). We assessed BrdU incorporation after 16 h. 4 independent experiments. ***P <.1 vs. control (one-way ANOVA with Dunnett s multiple comparison post hoc test). (e) We stimulated HCAECs with recombinant (1 ng ml 1 ) in the presence or absence of various concentrations of the MYDGF antibody or control IgG. We assessed BrdU incorporation after 16 h. Control: 6 independent experiments. IgG alone: 3 independent experiments. Other conditions: 4 independent experiments. **P <.1, ***P <.1 vs. without antibody (one-way ANOVA with Dunnett s multiple comparison post hoc test).
19 Supplementary Table 1. List of candidate proteins Official full name (official symbol) NCBI Reference Sequence D- score Biological activities (% of control) Cardiac myocytes MTS assay NNscore Caspase- 3 and 7 activity Endothelial cells BrdU Closed tubes Candidate proteins possibly secreted via the classical secretory pathway Ly6/neurotoxin 1 (LYNX1) NM_ Chromosome 19 open reading frame 1 (C19orf1) NM_ Chromosome 1 open reading frame 99 (C1orf99) NM_ Podocan-like 1 (PODNL1) NM_ Chitinase domain containing 1 (CHID1) AF ER membrane protein complex subunit 1 (EMC1) NM_ Chromosome 12 open reading frame 39 (C12orf39) NM_ Von Willebrand factor C and EGF domains (VWCE) NM_ Arylsulfatase A (ARSA) NP_478.3 Cysteine-rich with EGF-like domains 2 (CRELD2).957 n.d. 1 ± 6 16 ± ± 8 13 ± 3.88 n.d. 154 ± ± ± ± n.d. 12 ± ± ± ± n.d. 144 ± 1 63 ± 2 19 ± 2 11 ± n.d. 124 ± 8 76 ± ± ± n.d. 11 ± 4 82 ± ± 2 14 ± 7.86 n.d. 135 ± 2 8 ± ± 3 97 ± 5.81 n.d. 19 ± 8 89 ± 8 18 ± 2 12 ± n.d. 85 ± 4 11 ± 2 11 ± 9 11 ± n.d. 94 ± 6 15 ± 6 97 ± 1 48 ± 4 1
20 NM_24324 Prenylcysteine oxidase 1 like (PCYOX1L) NM_ Chromosome X open reading frame 36 (CXorf36) NM_ Chromosome 1 open reading frame 54 (C1orf54) NM_24579 Chromosome 11 open reading frame 94 (C11orf94) NM_ Family with sequence similarity 96, member A (FAM96A) NM_ Family with sequence similarity 131, member A (FAM131A) NM_ Family with sequence similarity 172, member A (FAM172A) NM_ Inositol 1,4,5-trisphosphate receptor interacting protein (ITPRIP) NM_ Uncharacterized protein DKFZp667F711 AL Isoamyl acetate-hydrolyzing esterase 1 homolog (S. cerevisiae) (IAH1) NM_ n.d. 18 ± 2 18 ± ± 4 99 ± 6.75 n.d. 11 ± 6 11 ± ± 2 98 ± n.d. 11 ± 1 95 ± 8 19 ± 6 98 ± n.d. 19 ± 6 99 ± 2 17 ± 3 58 ± n.d. 142 ± 1 7 ± 7 13 ± 7 14 ± n.d. 177 ± 4 82 ± ± 3 17 ± n.d. 13 ± ± ± 2 17 ± 6.61 n.d. 111 ± 5 14 ± 8 63 ± ± n.d. 114 ± ± ± 1 99 ± n.d. 94 ± 2 93 ± 5 12 ± 5 99 ± 7 2
21 Candidate proteins possibly secreted via non-classical secretory pathways Chromosome 2 open reading frame 196 (C2orf196) NM_ Uncharacterized protein PRO2214 AF Chromosome 9 open reading frame 16 (C9orf16) NM_ Chromosome 6 open reading frame 226 (C6orf226) NM_ Methyltransferase like 5 (METTL5) NM_ Chromosome 1 open reading frame 11 (C1orf11) NM_ BRICK1, SCAR/WAVE actinnucleating complex subunit (BRK1) NM_ R3H domain containing 4 (R3HDM4) NM_ Family with sequence similarity 13, member A1 (FAM13A1) NM_ KIAA513 NM_ FANCD2 opposite strand (FANCD2OS) NM_ ± 6 58 ± ± ± ± 2 15 ± ± ± ± 4 9 ± 4 16 ± 3 14 ± ± 4 13 ± ± 2 14 ± ± ± ± ± ± ± ± 8 12 ± ± ± ± ± ± ± ± 3 99 ± ± ± 7 14 ± ± ± 8 98 ± ± 9 97 ± ± 4 96 ± ± ± 5 3
22 LSM12 homolog (S. cerevisiae) (LSM12) NM_ Proline-rich coiled-coil 1 (PRRC1) NM_ Coiled-coil domain containing 43 (CCDC43) NM_ Family with sequence similarity 136, member A (FAM136A) NM_ Migration and invasion enhancer 1 (MIEN1) NM_ Chromosome 1 open reading frame 21 (C1orf21) NM_386.3 Parkinson disease 7 domain containing 1 (PDDC1) NM_ Methyltransferase like 23 (METTL23) NM_ Chromosome 17 open reading frame 72 (C17orf72) NM_ Chromosome 18 open reading frame 54 (C18orf54) NM_ Family with sequence similarity 78, member A (FAM78A) NM_ ± ± 9 14 ± 9 19 ± ± 6 94 ± 7 12 ± 6 1 ± ± ± 6 12 ± ± ± 6 99 ± ± 2 12 ± ± 2 99 ± ± ± ± ± 7 96 ± 4 95 ± ± 7 96 ± ± 3 17 ± ± 6 17 ± ± 5 12 ± ± 1 12 ± 9 11 ± 6 16 ± ± 4 14 ± ± 8 11 ± ± ± ± 5 18 ± 4 4
23 Positive controls Growth differentiation factor 15 (GDF15) NM_ Vascular endothelial growth factor A (VEGFA) NM_ n.d. 148 ± 6 52 ± 3 n.d. n.d..859 n.d. n.d. n.d. 121 ± 3 13 ± 1 List of candidate proteins possibly secreted via the classical secretory pathway (D-score >.45) or via non-classical secretory pathways (D-score <.45; NN-score >.5). Candidate proteins and positive controls (GDF15, VEGFA) were expressed individually in HEK-293 cells to obtain conditioned supernatants for functional screens in serum-starved neonatal rat ventricular myocytes (MTS assay, caspase-3 and -7 activity assay) and human coronary artery endothelial cells (BrdU incorporation, closed tube formation). C19orf1 is highlighted in blue. Data are presented as the means ± s.e.m. from at least 3 independent experiments. 5
24 Supplementary Table 2. PCR genotyping of 431 offspring from heterozygous matings WT +/ KO Total Males 59 (25.8) 19 (47.6) 61 (26.6) 229 (1) Females 47 (23.3) 12 (5.5) 53 (26.2) 22 (1) wild-type (WT), heterozygous (+/ ), and knockout (KO) mice. Data are presented as numbers (percentage).
25 Supplementary Table 3. Baseline phenotype of wild-type and knockout mice WT KO Gravimetry Body mass (g) 25.2 ± ±.8 Lung mass per body mass (mg g 1 ) 7.6 ± ±.6 Liver mass per body mass (mg g 1 ) 56.5 ± ± 6.3 Kidney mass per body mass (mg g 1 ) 6.4 ± ±.8 Spleen mass per body mass (mg g 1 ) 5.1 ± ±.3 LV mass per body mass (mg g 1 ) 4.2 ± ±.1 Echocardiography LVEDA (mm 2 ) 16.6 ± ±.7 LVESA (mm 2 ) 8.1 ± ±.3 Fractional area change (%) 49.8 ± ±.7 Tail-cuff plethysmography Systolic blood pressure (mmhg) 112 ± ± 3.9 Diastolic blood pressure (mmhg) 68 ± ± 5.3 Heart rate (min 1 ) 7 ± 1 71 ± 7 Baseline phenotype of 8 1 weeks old wild-type (WT) and knockout (KO) mice. Gravimetry and echocardiography, 16 mice per genotype; tail-cuff plethysmography, 8 mice per genotype. LV denotes left ventricular; LVEDA, LV end-diastolic area; LVESA, LV endsystolic area.
26 Supplementary Table 4. Left ventricular pressure-volume measurements in wild-type and knockout mice Heart rate (min 1 ) LV end-systolic pressure (mmhg) LV end-diastolic pressure (mmhg) LV end-systolic volume (µl) LV end-diastolic volume (µl) LV ejection fraction (%) dp/dt max (mmhg s 1 ) dp/dt min (mmhg s 1 ) τ (ms) WT sham KO sham WT MI KO MI 451 ± ± ± ± ± ± 8 17 ± 3* 98 ± 2* 14 ± 2 12 ± 1 14 ± 2 15 ± 2 14 ± 2 11 ± 2 3 ± 3* 45 ± 4***, ## 37 ± 2 34 ± 1 46 ± 4 56 ± 4** 71 ± 4 72 ± 4 41 ± 4*** 26 ± 3***, # 1,47 ± 864 1,685 ± 644 8,728 ± 999 6,64 ± 29** -9,57 ± 446-9,82 ± 332-7,41 ± 69* -5,373 ± 176***, # 8.4 ± ± ± ±.5** Myocardial infarction (MI) was induced in wild-type (WT, n = 8) and knockout (KO, n = 7) mice by 1 h coronary artery ligation followed by reperfusion. Control mice underwent a sham operation (5 mice per genotype). We recorded left ventricular (LV) pressure-volume loops after 28 d. Data are presented as the means ± s.e.m. *P <.5, **P <.1, ***P <.1 vs. same genotype sham, # P <.5, ## P <.1 KO MI vs. WT MI (two-way ANOVA with Tukey s multiple comparison post hoc test).
Kidney. Heart. Lung. Sirt1. Gapdh. Mouse IgG DAPI. Rabbit IgG DAPI
 a e Na V 1.5 Ad-LacZ Ad- 110KD b Scn5a/ (relative to Ad-LacZ) f 150 100 50 0 p = 0.65 Ad-LacZ Ad- c Heart Lung Kidney Spleen 110KD d fl/fl c -/- DAPI 20 µm Na v 1.5 250KD fl/fl Rabbit IgG DAPI fl/fl Mouse
SUPPLEMENTARY INFORMATION
 a c e doi:10.1038/nature10407 b d f Supplementary Figure 1. SERCA2a complex analysis. (a) Two-dimensional SDS-PAGE gels of SERCA2a complexes. A silver-stained SDSPAGE gel is shown, which reveals a 12 kda
SUPPLEMENTARY INFORMATION
 SUPPLEMENTARY INFORMATION doi:10.1038/nature11429 S1a 6 7 8 9 Nlrc4 allele S1b Nlrc4 +/+ Nlrc4 +/F Nlrc4 F/F 9 Targeting construct 422 bp 273 bp FRT-neo-gb-PGK-FRT 3x.STOP S1c Nlrc4 +/+ Nlrc4 F/F casp1
Nature Genetics: doi: /ng Supplementary Figure 1. Parameters and consequences of mononuclear cardiomyocyte frequency.
 Supplementary Figure 1 Parameters and consequences of mononuclear cardiomyocyte frequency. (a) Correlation of the frequency of mononuclear cardiomyocytes to the frequency of cardiomyocytes with three or
Supplementary Figure 1. Confocal immunofluorescence showing mitochondrial translocation of Drp1. Cardiomyocytes treated with H 2 O 2 were prestained
 Supplementary Figure 1. Confocal immunofluorescence showing mitochondrial translocation of Drp1. Cardiomyocytes treated with H 2 O 2 were prestained with MitoTracker (red), then were immunostained with
Supporting Information Table of Contents
 Supporting Information Table of Contents Supporting Information Figure 1 Page 2 Supporting Information Figure 2 Page 4 Supporting Information Figure 3 Page 5 Supporting Information Figure 4 Page 6 Supporting
SUPPLEMENTARY INFORMATION
 doi:10.1038/nature10188 Supplementary Figure 1. Embryonic epicardial genes are down-regulated from midgestation stages and barely detectable post-natally. Real time qrt-pcr revealed a significant down-regulation
Supplementary material page 1/10
 Supplementary Figure 1. Metoprolol administration during ongoing AMI reduces MVO in STEMI patients (a, b) Complete representative CMR exams (short-axis covering the entire left ventricle (LV) from base
Supplementary Figure 1. Generation of knockin mice expressing L-selectinN138G. (a) Schematics of the Sellg allele (top), the targeting vector, the
 Schematics of the Sellg allele (top), the targeting vector, the") Supplementary Figure 1. Generation of knockin mice expressing L-selectinN138G. (a) Schematics of the Sellg allele (top), the targeting vector, the targeted allele in ES cells, and the mutant allele in
Supplementary Figure 1. Generation of knockin mice expressing L-selectinN138G. (a) Schematics of the Sellg allele (top), the targeting vector, the targeted allele in ES cells, and the mutant allele in
c Ischemia (30 min) Reperfusion (8 w) Supplementary Figure bp 300 bp Ischemia (30 min) Reperfusion (4 h) Dox 20 mg/kg i.p.
 Reperfusion (8 w) Supplementary Figure bp 300 bp Ischemia (30 min) Reperfusion (4 h) Dox 20 mg/kg i.p.") a Marker Ripk3 +/ 5 bp 3 bp b Ischemia (3 min) Reperfusion (4 h) d 2 mg/kg i.p. 1 w 5 w Sacrifice for IF size A subset for echocardiography and morphological analysis c Ischemia (3 min) Reperfusion (8
a Marker Ripk3 +/ 5 bp 3 bp b Ischemia (3 min) Reperfusion (4 h) d 2 mg/kg i.p. 1 w 5 w Sacrifice for IF size A subset for echocardiography and morphological analysis c Ischemia (3 min) Reperfusion (8
(a) Significant biological processes (upper panel) and disease biomarkers (lower panel)
 Significant biological processes (upper panel) and disease biomarkers (lower panel)") Supplementary Figure 1. Functional enrichment analyses of secretomic proteins. (a) Significant biological processes (upper panel) and disease biomarkers (lower panel) 2 involved by hrab37-mediated secretory
Supplementary Figure 1. Functional enrichment analyses of secretomic proteins. (a) Significant biological processes (upper panel) and disease biomarkers (lower panel) 2 involved by hrab37-mediated secretory
(Stratagene, La Jolla, CA) (Supplemental Fig. 1A). A 5.4-kb EcoRI fragment
 (Supplemental Fig. 1A). A 5.4-kb EcoRI fragment") SUPPLEMENTAL INFORMATION Supplemental Methods Generation of RyR2-S2808D Mice Murine genomic RyR2 clones were isolated from a 129/SvEvTacfBR λ-phage library (Stratagene, La Jolla, CA) (Supplemental Fig.
SUPPLEMENTAL INFORMATION Supplemental Methods Generation of RyR2-S2808D Mice Murine genomic RyR2 clones were isolated from a 129/SvEvTacfBR λ-phage library (Stratagene, La Jolla, CA) (Supplemental Fig.
Supplementary Fig. 1. GPRC5A post-transcriptionally down-regulates EGFR expression. (a) Plot of the changes in steady state mrna levels versus
 Plot of the changes in steady state mrna levels versus") Supplementary Fig. 1. GPRC5A post-transcriptionally down-regulates EGFR expression. (a) Plot of the changes in steady state mrna levels versus changes in corresponding proteins between wild type and Gprc5a-/-
Supplementary Fig. 1. GPRC5A post-transcriptionally down-regulates EGFR expression. (a) Plot of the changes in steady state mrna levels versus changes in corresponding proteins between wild type and Gprc5a-/-
and follicular helper T cells is Egr2-dependent. (a) Diagrammatic representation of the
 Diagrammatic representation of the") Supplementary Figure 1. LAG3 + Treg-mediated regulation of germinal center B cells and follicular helper T cells is Egr2-dependent. (a) Diagrammatic representation of the experimental protocol for the
Supplementary Figure 1. LAG3 + Treg-mediated regulation of germinal center B cells and follicular helper T cells is Egr2-dependent. (a) Diagrammatic representation of the experimental protocol for the
Nature Immunology: doi: /ni Supplementary Figure 1. Huwe1 has high expression in HSCs and is necessary for quiescence.
 Supplementary Figure 1 Huwe1 has high expression in HSCs and is necessary for quiescence. (a) Heat map visualizing expression of genes with a known function in ubiquitin-mediated proteolysis (KEGG: Ubiquitin
Soluble ADAM33 initiates airway remodeling to promote susceptibility for. Elizabeth R. Davies, Joanne F.C. Kelly, Peter H. Howarth, David I Wilson,
 Revised Suppl. Data: Soluble ADAM33 1 Soluble ADAM33 initiates airway remodeling to promote susceptibility for allergic asthma in early life Elizabeth R. Davies, Joanne F.C. Kelly, Peter H. Howarth, David
ECM1 controls T H 2 cell egress from lymph nodes through re-expression of S1P 1
 ZH, Li et al, page 1 ECM1 controls T H 2 cell egress from lymph nodes through re-expression of S1P 1 Zhenhu Li 1,4,Yuan Zhang 1,4, Zhiduo Liu 1, Xiaodong Wu 1, Yuhan Zheng 1, Zhiyun Tao 1, Kairui Mao 1,
Postn MCM Smad2 fl/fl Postn MCM Smad3 fl/fl Postn MCM Smad2/3 fl/fl. Postn MCM. Tgfbr1/2 fl/fl TAC
 A Smad2 fl/fl Smad3 fl/fl Smad2/3 fl/fl Tgfbr1/2 fl/fl 1. mm B Tcf21 MCM Tcf21 MCM Smad3 fl/fl Tcf21 MCM Smad2/3 fl/fl Tcf21 MCM Tgfbr1/2 fl/fl αmhc MCM C 1. mm 1. mm D Smad2 fl/fl Smad3 fl/fl Smad2/3
SUPPLEMENTARY INFORMATION
 Figure S1 Treatment with both Sema6D and Plexin-A1 sirnas induces the phenotype essentially identical to that induced by treatment with Sema6D sirna alone or Plexin-A1 sirna alone. (a,b) The cardiac tube
IL-34 is a tissue-restricted ligand of CSF1R required for the development of Langerhans cells and microglia
 Supplementary Figures IL-34 is a tissue-restricted ligand of CSF1R required for the development of Langerhans cells and microglia Yaming Wang, Kristy J. Szretter, William Vermi, Susan Gilfillan, Cristina
hemodynamic stress. A. Echocardiographic quantification of cardiac dimensions and function in
 SUPPLEMENTAL FIGURE LEGENDS Supplemental Figure 1. Fbn1 C1039G/+ hearts display normal cardiac function in the absence of hemodynamic stress. A. Echocardiographic quantification of cardiac dimensions and
Supplementary Figure 1. Baf60c and baf180 are induced during cardiac regeneration in zebrafish. RNA in situ hybridization was performed on paraffin
 Supplementary Figure 1. Baf60c and baf180 are induced during cardiac regeneration in zebrafish. RNA in situ hybridization was performed on paraffin sections from sham-operated adult hearts (a and i) and
Figure S1. Generation of inducible PTEN deficient mice and the BMMCs (A) B6.129 Pten loxp/loxp mice were mated with B6.
 B6.129 Pten loxp/loxp mice were mated with B6.") Figure S1. Generation of inducible PTEN deficient mice and the BMMCs (A) B6.129 Pten loxp/loxp mice were mated with B6.129-Gt(ROSA)26Sor tm1(cre/ert2)tyj /J mice. To induce deletion of the Pten locus,
Figure S1. Generation of inducible PTEN deficient mice and the BMMCs (A) B6.129 Pten loxp/loxp mice were mated with B6.129-Gt(ROSA)26Sor tm1(cre/ert2)tyj /J mice. To induce deletion of the Pten locus,
Supplementary Figure 1. AdipoR1 silencing and overexpression controls. (a) Representative blots (upper and lower panels) showing the AdipoR1 protein
 Representative blots (upper and lower panels) showing the AdipoR1 protein") Supplementary Figure 1. AdipoR1 silencing and overexpression controls. (a) Representative blots (upper and lower panels) showing the AdipoR1 protein content relative to GAPDH in two independent experiments.
Supplementary Figure 1. AdipoR1 silencing and overexpression controls. (a) Representative blots (upper and lower panels) showing the AdipoR1 protein content relative to GAPDH in two independent experiments.
Type of file: PDF Title of file for HTML: Supplementary Information Description: Supplementary Figures and Supplementary Table.
 Type of file: PDF Title of file for HTML: Supplementary Information Description: Supplementary Figures and Supplementary Tale. Type of file: VI Title of file for HTML: Supplementary Movie 1 Description:
X P. Supplementary Figure 1. Nature Medicine: doi: /nm Nilotinib LSK LT-HSC. Cytoplasm. Cytoplasm. Nucleus. Nucleus
 a b c Supplementary Figure 1 c-kit-apc-eflu780 Lin-FITC Flt3-Linc-Kit-APC-eflu780 LSK Sca-1-PE-Cy7 d e f CD48-APC LT-HSC CD150-PerCP-cy5.5 g h i j Cytoplasm RCC1 X Exp 5 mir 126 SPRED1 SPRED1 RAN P SPRED1
In vivo bromodeoxyuridine (BrdU) incorporation was performed to analyze cell
 incorporation was performed to analyze cell") Supplementary Methods BrdU incorporation in vivo In vivo bromodeoxyuridine (BrdU) incorporation was performed to analyze cell proliferation in the heart. Mice were subjected to LI-TAC, and 5 days later
Supplementary Methods BrdU incorporation in vivo In vivo bromodeoxyuridine (BrdU) incorporation was performed to analyze cell proliferation in the heart. Mice were subjected to LI-TAC, and 5 days later
doi: /nature14508 Rappsilber et al.
 SUPPLEMENTARY INFORMATION doi:1.138/nature1458 Grosso et al. Barbosa et al. 74 72 45 33 47 7 51 Rappsilber et al. Supplementary Figure 1 a, Venn-Diagram of identified splice factors in the work of Barbossa
Control. csarnt -/- Cre, f/f
 ody weight (g) A re,f/f re x f/f f/+ re, f/+ re,f/+ f/f x f/f f/+ cs -/- re, f/f re f/f re, f/f Normal chow Tamoxifen Tamoxifen Tamoxifen W 4W re f/f re, re/ff f/f re f/f re, re/ff f/f Normal chow Tamoxifen
Supplementary Figure 1. EC-specific Deletion of Snail1 Does Not Affect EC Apoptosis. (a,b) Cryo-sections of WT (a) and Snail1 LOF (b) embryos at
 Cryo-sections of WT (a) and Snail1 LOF (b) embryos at") Supplementary Figure 1. EC-specific Deletion of Snail1 Does Not Affect EC Apoptosis. (a,b) Cryo-sections of WT (a) and Snail1 LOF (b) embryos at E10.5 were double-stained for TUNEL (red) and PECAM-1 (green).
Supplementary Figure 1. EC-specific Deletion of Snail1 Does Not Affect EC Apoptosis. (a,b) Cryo-sections of WT (a) and Snail1 LOF (b) embryos at E10.5 were double-stained for TUNEL (red) and PECAM-1 (green).
Supplementary. limb. bars
 Figure 1. CD163 -/- mice exhibit a similar phenotype ass WT mice in the absence of ischemic injury. a, Laser Doppler analysiss with perfusion quantitation at baseline (n= =10 per group). b, Immunostaining
Supplementary Figure 1.
 Supplementary Figure 1. Female Pro-ins2 -/- mice at 5-6 weeks of age were either inoculated i.p. with a single dose of CVB4 (1x10 5 PFU/mouse) or PBS and treated with αgalcer or control vehicle. On day
Mesenchymal Stem Cells to Repair Vascular Damage after Chemotherapy: Past, Present and Future
 Mesenchymal Stem Cells to Repair Vascular Damage after Chemotherapy: Past, Present and Future Cell Therapy 2014 Las Vegas, NV, USA Sulaiman Al-Hashmi, PhD Sultan Qaboos University Oman What are MSCs? Stem
Supplementary Figure 1. Normal T lymphocyte populations in Dapk -/- mice. (a) Normal thymic development in Dapk -/- mice. Thymocytes from WT and Dapk
 Normal thymic development in Dapk -/- mice. Thymocytes from WT and Dapk") Supplementary Figure 1. Normal T lymphocyte populations in Dapk -/- mice. (a) Normal thymic development in Dapk -/- mice. Thymocytes from WT and Dapk -/- mice were stained for expression of CD4 and CD8.
Supplementary Figure 1. Normal T lymphocyte populations in Dapk -/- mice. (a) Normal thymic development in Dapk -/- mice. Thymocytes from WT and Dapk -/- mice were stained for expression of CD4 and CD8.
Alternatively Activated Macrophages Determine the Repair of the Infarcted
 Alternatively Activated Macrophages Determine the Repair of the Infarcted Adult Murine Heart (Shiraishi et al.) List of Supplemental Materials Supplemental Methods Supplemental Figure 1. Cardiac CD206
Probe. Hind III Q,!?R'!! /0!!!!D1"?R'! vector. Homologous recombination
 Supple-Zhang Page 1 Wild-type locus Targeting construct Targeted allele Exon Exon3 Exon Probe P1 P P3 FRT FRT loxp loxp neo vector amh I Homologous recombination neo P1 P P3 FLPe recombination Q,!?R'!!
TRAF6 ubiquitinates TGFβ type I receptor to promote its cleavage and nuclear translocation in cancer
 Supplementary Information TRAF6 ubiquitinates TGFβ type I receptor to promote its cleavage and nuclear translocation in cancer Yabing Mu, Reshma Sundar, Noopur Thakur, Maria Ekman, Shyam Kumar Gudey, Mariya
Nature Immunology: doi: /ni Supplementary Figure 1. Cellularity of leukocytes and their progenitors in naive wild-type and Spp1 / mice.
 Supplementary Figure 1 Cellularity of leukocytes and their progenitors in naive wild-type and Spp1 / mice. (a, b) Gating strategies for differentiated cells including PMN (CD11b + Ly6G hi and CD11b + Ly6G
(a) Schematic diagram of the FS mutation of UVRAG in exon 8 containing the highly instable
 Schematic diagram of the FS mutation of UVRAG in exon 8 containing the highly instable") Supplementary Figure 1. Frameshift (FS) mutation in UVRAG. (a) Schematic diagram of the FS mutation of UVRAG in exon 8 containing the highly instable A 10 DNA repeat, generating a premature stop codon
Supplementary Figure 1. Frameshift (FS) mutation in UVRAG. (a) Schematic diagram of the FS mutation of UVRAG in exon 8 containing the highly instable A 10 DNA repeat, generating a premature stop codon
E10.5 E18.5 P2 10w 83w NF1 HF1. Sham ISO. Bmi1. H3K9me3. Lung weight (g)
") Myociyte cross-sectional Relative mrna levels Relative levels Relative mrna levels Supplementary Figures and Legends a 8 6 4 2 Ezh2 E1.5 E18.5 P2 1w 83w b Ezh2 p16 amhc b-actin P2 43w kd 37 86 16 wt mouse
Myociyte cross-sectional Relative mrna levels Relative levels Relative mrna levels Supplementary Figures and Legends a 8 6 4 2 Ezh2 E1.5 E18.5 P2 1w 83w b Ezh2 p16 amhc b-actin P2 43w kd 37 86 16 wt mouse
Supplementary Figure 1. Supernatants electrophoresis from CD14+ and dendritic cells. Supernatants were resolved by SDS-PAGE and stained with
 Supplementary Figure 1. Supernatants electrophoresis from CD14+ and dendritic cells. Supernatants were resolved by SDS-PAGE and stained with Coomassie brilliant blue. One µg/ml recombinant human (rh) apo-e
Lack of cadherins Celsr2 and Celsr3 impairs ependymal ciliogenesis, leading to fatal
 Lack of cadherins Celsr2 and Celsr3 impairs ependymal ciliogenesis, leading to fatal hydrocephalus Fadel TISSIR, Yibo QU, Mireille MONTCOUQUIOL, Libing ZHOU, Kouji KOMATSU, Dongbo SHI, Toshihiko FUJIMORI,
Suppl Video: Tumor cells (green) and monocytes (white) are seeded on a confluent endothelial
 and monocytes (white) are seeded on a confluent endothelial") Supplementary Information Häuselmann et al. Monocyte induction of E-selectin-mediated endothelial activation releases VE-cadherin junctions to promote tumor cell extravasation in the metastasis cascade
Supplementary Information Häuselmann et al. Monocyte induction of E-selectin-mediated endothelial activation releases VE-cadherin junctions to promote tumor cell extravasation in the metastasis cascade
Tcf21 MCM ; R26 mtmg Sham GFP Col 1/3 TAC 8W TAC 2W. Postn MCM ; R26 mtmg Sham GFP Col 1/3 TAC 8W TAC 2W
 A Tcf21 MCM ; R26 mtmg Sham GFP Col 1/3 Tcf21 MCM ; R26 mtmg TAC 2W Tcf21 MCM ; R26 mtmg TAC 8W B Postn MCM ; R26 mtmg Sham GFP Col 1/3 Postn MCM ; R26 mtmg TAC 2W Postn MCM ; R26 mtmg TAC 8W Supplementary
Nature Immunology: doi: /ni Supplementary Figure 1. Gene expression profile of CD4 + T cells and CTL responses in Bcl6-deficient mice.
 Supplementary Figure 1 Gene expression profile of CD4 + T cells and CTL responses in Bcl6-deficient mice. (a) Gene expression profile in the resting CD4 + T cells were analyzed by an Affymetrix microarray
(a-r) Whole mount X-gal staining on a developmental time-course of hearts from
 Whole mount X-gal staining on a developmental time-course of hearts from") 1 2 3 4 5 6 7 8 9 10 11 12 13 14 15 16 Supplementary Figure 1 (a-r) Whole mount X-gal staining on a developmental time-course of hearts from Sema3d +/- ;Ephb4 LacZ/+ and Sema3d -/- ;Ephb4 LacZ/+ embryos.
1 2 3 4 5 6 7 8 9 10 11 12 13 14 15 16 Supplementary Figure 1 (a-r) Whole mount X-gal staining on a developmental time-course of hearts from Sema3d +/- ;Ephb4 LacZ/+ and Sema3d -/- ;Ephb4 LacZ/+ embryos.
Supplementary Figure 1. Genotyping strategies for Mcm3 +/+, Mcm3 +/Lox and Mcm3 +/- mice and luciferase activity in Mcm3 +/Lox mice. A.
 Supplementary Figure 1. Genotyping strategies for Mcm3 +/+, Mcm3 +/Lox and Mcm3 +/- mice and luciferase activity in Mcm3 +/Lox mice. A. Upper part, three-primer PCR strategy at the Mcm3 locus yielding
The Ufm1-activating enzyme Uba5 is indispensable for erythroid differentiation in mice
 Supplementary information The Ufm1-activating enzyme Uba5 is indispensable for erythroid differentiation in mice Kanako Tatsumi 1, 2, Harumi Yamamoto-Mukai 2, Ritsuko Shimizu 3, Satoshi Waguri 4, Yu-Shin
SUPPLEMENTARY INFORMATION
 doi:10.1038/nature11095 Supplementary Table 1. Summary of the binding between Angptls and various Igdomain containing receptors as determined by flow cytometry analysis. The results were summarized from
SUPPLEMENTARY INFORMATION
 DOI: 10.1038/ncb2607 Figure S1 Elf5 loss promotes EMT in mammary epithelium while Elf5 overexpression inhibits TGFβ induced EMT. (a, c) Different confocal slices through the Z stack image. (b, d) 3D rendering
Supplementary Materials for
 www.sciencesignaling.org/cgi/content/full/8/375/ra41/dc1 Supplementary Materials for Actin cytoskeletal remodeling with protrusion formation is essential for heart regeneration in Hippo-deficient mice
The autoimmune disease-associated PTPN22 variant promotes calpain-mediated Lyp/Pep
 SUPPLEMENTARY INFORMATION The autoimmune disease-associated PTPN22 variant promotes calpain-mediated Lyp/Pep degradation associated with lymphocyte and dendritic cell hyperresponsiveness Jinyi Zhang, Naima
Pearson r = P (one-tailed) = n = 9
 = n = 9") 8F4-Specific Lysis, % 1 UPN1 UPN3 8 UPN7 6 Pearson r =.69 UPN2 UPN5 P (one-tailed) =.192 4 UPN8 n = 9 2 UPN9 UPN4 UPN6 5 1 15 2 25 8 8F4, % Max MFI Supplementary Figure S1. AML samples UPN1-UPN9 show variable
8F4-Specific Lysis, % 1 UPN1 UPN3 8 UPN7 6 Pearson r =.69 UPN2 UPN5 P (one-tailed) =.192 4 UPN8 n = 9 2 UPN9 UPN4 UPN6 5 1 15 2 25 8 8F4, % Max MFI Supplementary Figure S1. AML samples UPN1-UPN9 show variable
Figure S1. Sorting nexin 9 (SNX9) specifically binds psmad3 and not psmad 1/5/8. Lysates from AKR-2B cells untreated (-) or stimulated (+) for 45 min
 specifically binds psmad3 and not psmad 1/5/8. Lysates from AKR-2B cells untreated (-) or stimulated (+) for 45 min") Figure S1. Sorting nexin 9 (SNX9) specifically binds psmad3 and not psmad 1/5/8. Lysates from AKR2B cells untreated () or stimulated () for 45 min with 5 ng/ml TGFβ or 10 ng/ml BMP4 were incubated with
Figure S1. Sorting nexin 9 (SNX9) specifically binds psmad3 and not psmad 1/5/8. Lysates from AKR2B cells untreated () or stimulated () for 45 min with 5 ng/ml TGFβ or 10 ng/ml BMP4 were incubated with
Chronic variable stress activates hematopoietic stem cells
 SUPPLEMENTARY INFORMATION Chronic variable stress activates hematopoietic stem cells Timo Heidt *, Hendrik B. Sager *, Gabriel Courties, Partha Dutta, Yoshiko Iwamoto, Alex Zaltsman, Constantin von zur
well for 2 h at rt. Each dot represents an individual mouse and bar is the mean ±
 Supplementary data: Control DC Blimp-1 ko DC 8 6 4 2-2 IL-1β p=.5 medium 8 6 4 2 IL-2 Medium p=.16 8 6 4 2 IL-6 medium p=.3 5 4 3 2 1-1 medium IL-1 n.s. 25 2 15 1 5 IL-12(p7) p=.15 5 IFNγ p=.65 4 3 2 1
") Supplementary Figure 1 (Mu) SBP (mmhg) 2 18 16 p
Supplementary Figure 1 (Mu) SBP (mmhg) 2 18 16 p (A) PCR primers (arrows) designed to distinguish wild type (P1+P2), targeted (P1+P2) and excised (P1+P3)14-
 PCR primers (arrows) designed to distinguish wild type (P1+P2), targeted (P1+P2) and excised (P1+P3)14-") 1 Supplemental Figure Legends Figure S1. Mammary tumors of ErbB2 KI mice with 14-3-3σ ablation have elevated ErbB2 transcript levels and cell proliferation (A) PCR primers (arrows) designed to distinguish
1 Supplemental Figure Legends Figure S1. Mammary tumors of ErbB2 KI mice with 14-3-3σ ablation have elevated ErbB2 transcript levels and cell proliferation (A) PCR primers (arrows) designed to distinguish
Nature Medicine: doi: /nm.4322
 1 2 3 4 5 6 7 8 9 10 11 Supplementary Figure 1. Predicted RNA structure of 3 UTR and sequence alignment of deleted nucleotides. (a) Predicted RNA secondary structure of ZIKV 3 UTR. The stem-loop structure
Supplementary Figure 1: Expression of NFAT proteins in Nfat2-deleted B cells (a+b) Protein expression of NFAT2 (a) and NFAT1 (b) in isolated splenic
 Protein expression of NFAT2 (a) and NFAT1 (b) in isolated splenic") Supplementary Figure 1: Expression of NFAT proteins in Nfat2-deleted B cells (a+b) Protein expression of NFAT2 (a) and NFAT1 (b) in isolated splenic B cells from WT Nfat2 +/+, TCL1 Nfat2 +/+ and TCL1 Nfat2
Supplementary Figure 1: Expression of NFAT proteins in Nfat2-deleted B cells (a+b) Protein expression of NFAT2 (a) and NFAT1 (b) in isolated splenic B cells from WT Nfat2 +/+, TCL1 Nfat2 +/+ and TCL1 Nfat2
Nature Immunology: doi: /ni.3412
 Supplementary Figure 1 Gata1 expression in heamatopoietic stem and progenitor populations. (a) Unsupervised clustering according to 100 top variable genes across single pre-gm cells. The two main cell
Supplementary Figure S1 Targeted disruption and overexpression of Gpr43 in mice. (a) A targeting vector was constructed by ligation of 3 fragments:
 A targeting vector was constructed by ligation of 3 fragments:") Supplementary Figure S1 Targeted disruption and overexpression of Gpr43 in mice. (a) A targeting vector was constructed by ligation of 3 fragments: the 5' and 3' homology recombination arms and a fragment
Supplementary Figure S1 Targeted disruption and overexpression of Gpr43 in mice. (a) A targeting vector was constructed by ligation of 3 fragments: the 5' and 3' homology recombination arms and a fragment
Supplemental Figure 1. Western blot analysis indicated that MIF was detected in the fractions of
 Supplemental Figure Legends Supplemental Figure 1. Western blot analysis indicated that was detected in the fractions of plasma membrane and cytosol but not in nuclear fraction isolated from Pkd1 null
Supplementary Figure 1. Prevalence of U539C and G540A nucleotide and E172K amino acid substitutions among H9N2 viruses. Full-length H9N2 NS
 Supplementary Figure 1. Prevalence of U539C and G540A nucleotide and E172K amino acid substitutions among H9N2 viruses. Full-length H9N2 NS nucleotide sequences (a, b) or amino acid sequences (c) from
Type of file: PDF Title of file for HTML: Supplementary Information Description: Supplementary Figures
 Type of file: PDF Title of file for HTML: Supplementary Information Description: Supplementary Figures Type of file: MOV Title of file for HTML: Supplementary Movie 1 Description: NLRP3 is moving along
Supplementary Information
 Supplementary Information Supplementary s Supplementary 1 All three types of foods suppress subsequent feeding in both sexes when the same food is used in the pre-feeding test feeding. (a) Adjusted pre-feeding
Fetal gene upregulation by 1-wk TAC is significantly increased in mice lacking RGS2.
 3562-RG-1 Supplementary Figure 1 Fetal gene upregulation by 1-wk is significantly increased in mice lacking RGS2. ANP(Nppa) /BNP(Nppb) A-type and B-type natriuretic peptide; β-mhc (Myh7) beta myosin heavy
Electron micrograph of phosphotungstanic acid-stained exosomes derived from murine
 1 SUPPLEMENTARY INFORMATION SUPPLEMENTARY FIGURES Supplementary Figure 1. Physical properties of murine DC-derived exosomes. a, Electron micrograph of phosphotungstanic acid-stained exosomes derived from
Supplementary Figure 1. PD-L1 is glycosylated in cancer cells. (a) Western blot analysis of PD-L1 in breast cancer cells. (b) Western blot analysis
 Western blot analysis of PD-L1 in breast cancer cells. (b) Western blot analysis") Supplementary Figure 1. PD-L1 is glycosylated in cancer cells. (a) Western blot analysis of PD-L1 in breast cancer cells. (b) Western blot analysis of PD-L1 in ovarian cancer cells. (c) Western blot analysis
Supplementary Figure 1. PD-L1 is glycosylated in cancer cells. (a) Western blot analysis of PD-L1 in breast cancer cells. (b) Western blot analysis of PD-L1 in ovarian cancer cells. (c) Western blot analysis
Supplementary Figure 1
 Supplementary Figure 1 Supplementary Figure 1 Schematic depiction of the tandem Fc GDF15. Supplementary Figure 2 Supplementary Figure 2 Gfral mrna levels in the brains of both wild-type and knockout Gfral
Table S1. Sequence of human and mouse primers used for RT-qPCR measurements.
 Table S1. Sequence of human and mouse primers used for RT-qPCR measurements. Ca9, carbonic anhydrase IX; Ndrg1, N-myc downstream regulated gene 1; L28, ribosomal protein L28; Hif1a, hypoxia inducible factor
pplementary Figur Supplementary Figure 1. a.
 pplementary Figur Supplementary Figure 1. a. Quantification by RT-qPCR of YFV-17D and YFV-17D pol- (+) RNA in the supernatant of cultured Huh7.5 cells following viral RNA electroporation of respective
supplementary information
 DOI:.38/ncb1963 a wild 5.3kb 11.2kb targeting vector stop PCR primer KKpn NNhe targeted allele 5.7kb 6.8kb probe b d (g) 35 3 25 2 genomic Southern blot Kpn I digest Nhe I digest / / / / / / 11.2 kb 5.7
Supplementary Figure 1. Deletion of Smad3 prevents B16F10 melanoma invasion and metastasis in a mouse s.c. tumor model.
 A B16F1 s.c. Lung LN Distant lymph nodes Colon B B16F1 s.c. Supplementary Figure 1. Deletion of Smad3 prevents B16F1 melanoma invasion and metastasis in a mouse s.c. tumor model. Highly invasive growth
Supplementary Figure 1. Dynamic Response of WT and mir-21 -/- mice to caerulein. (a) Representative histological sections of mouse pancreas stained
 Representative histological sections of mouse pancreas stained") Supplementary Figure 1. Dynamic Response of WT and mir-21 -/- mice to caerulein. (a) Representative histological sections of mouse pancreas stained with hematoxylin from caerulein-treated WT and mir-21
Supplementary Figure 1. Dynamic Response of WT and mir-21 -/- mice to caerulein. (a) Representative histological sections of mouse pancreas stained with hematoxylin from caerulein-treated WT and mir-21
Cells and reagents. Synaptopodin knockdown (1) and dynamin knockdown (2)
 and dynamin knockdown (2)") Supplemental Methods Cells and reagents. Synaptopodin knockdown (1) and dynamin knockdown (2) podocytes were cultured as described previously. Staurosporine, angiotensin II and actinomycin D were all obtained
Supplemental Methods Cells and reagents. Synaptopodin knockdown (1) and dynamin knockdown (2) podocytes were cultured as described previously. Staurosporine, angiotensin II and actinomycin D were all obtained
Supplemental Fig. 1. Relative mrna Expression. Relative mrna Expression WT KO WT KO RT 4 0 C
 Supplemental Fig. 1 A 1.5 1..5 Hdac11 (ibat) n=4 n=4 n=4 n=4 n=4 n=4 n=4 n=4 WT KO WT KO WT KO WT KO RT 4 C RT 4 C Supplemental Figure 1. Hdac11 mrna is undetectable in KO adipose tissue. Quantitative
SUPPLEMENTARY INFORMATION
 SUPPLEMENTARY INFORMATION Supplementary Figure 1. Long-term protection studies. 45 minutes of ischemia was induced in wild type (S1pr2 +/+ ) and S1pr2 -/- by MCAO. A) 5 days later brains were harvested
SUPPLEMENTARY INFORMATION
 1. Supplementary Figures and Legends Supplementary Fig. 1. S1P-mediated transcriptional regulation of integrins expressed in OP/monocytoid cells. Real-time quantitative PCR analyses of mrna for two integrins,
S1a S1b S1c. S1d. S1f S1g S1h SUPPLEMENTARY FIGURE 1. - si sc Il17rd Il17ra bp. rig/s IL-17RD (ng) -100 IL-17RD
 -100 IL-17RD") SUPPLEMENTARY FIGURE 1 0 20 50 80 100 IL-17RD (ng) S1a S1b S1c IL-17RD β-actin kda S1d - si sc Il17rd Il17ra rig/s15-574 - 458-361 bp S1f S1g S1h S1i S1j Supplementary Figure 1. Knockdown of IL-17RD enhances
SUPPLEMENTARY FIGURE 1 0 20 50 80 100 IL-17RD (ng) S1a S1b S1c IL-17RD β-actin kda S1d - si sc Il17rd Il17ra rig/s15-574 - 458-361 bp S1f S1g S1h S1i S1j Supplementary Figure 1. Knockdown of IL-17RD enhances
Supplementary information. The proton-sensing G protein-coupled receptor T-cell death-associated gene 8
 1 Supplementary information 2 3 The proton-sensing G protein-coupled receptor T-cell death-associated gene 8 4 (TDAG8) shows cardioprotective effects against myocardial infarction 5 Akiomi Nagasaka 1+,
SUPPLEMENTARY RESULTS
 SUPPLEMENTARY RESULTS Supplementary Table 1. hfpr1- Flpln-CHO hfpr2-flpln-cho pec 50 E max (%) Log( /K A) Log( /K A) N pec 50 E max (%) Log( /K A) Log( /K A) n ERK1/2 phosphorylation fmlp 9.0±0.6 80±7
Supplementary Figure 1. Expression of phospho-sik3 in normal and osteoarthritic articular cartilage in the knee. (a) Semiserial histological sections
 Semiserial histological sections") Supplementary Figure 1. Expression of phospho-sik3 in normal and osteoarthritic articular cartilage in the knee. (a) Semiserial histological sections of normal cartilage were stained with safranin O-fast
Supplementary Figure 1. Expression of phospho-sik3 in normal and osteoarthritic articular cartilage in the knee. (a) Semiserial histological sections of normal cartilage were stained with safranin O-fast
Nature Methods: doi: /nmeth.4257
 Supplementary Figure 1 Screen for polypeptides that affect cellular actin filaments. (a) Table summarizing results from all polypeptides tested. Source shows organism, gene, and amino acid numbers used.
hexahistidine tagged GRP78 devoid of the KDEL motif (GRP78-His) on SDS-PAGE. This
 on SDS-PAGE. This") SUPPLEMENTAL FIGURE LEGEND Fig. S1. Generation and characterization of. (A) Coomassie staining of soluble hexahistidine tagged GRP78 devoid of the KDEL motif (GRP78-His) on SDS-PAGE. This protein was expressed
SUPPLEMENTAL FIGURE LEGEND Fig. S1. Generation and characterization of. (A) Coomassie staining of soluble hexahistidine tagged GRP78 devoid of the KDEL motif (GRP78-His) on SDS-PAGE. This protein was expressed
Figure S1 Generation of γ-gt DTR transgenic mice. (A) Schematic construct of the transgene. (B)
 Schematic construct of the transgene. (B)") Figure S1 Generation of γ-gt DTR transgenic mice. (A) Schematic construct of the transgene. (B) PCR identified expected hhb-egf band (left panel) and HA tag band (right) in kidneys of transgenic (TG) mice
Figure S1 Generation of γ-gt DTR transgenic mice. (A) Schematic construct of the transgene. (B) PCR identified expected hhb-egf band (left panel) and HA tag band (right) in kidneys of transgenic (TG) mice
SUPPLEMENTARY FIGURES
 SUPPLEMENTARY FIGURES 1 Supplementary Figure 1, Adult hippocampal QNPs and TAPs uniformly express REST a-b) Confocal images of adult hippocampal mouse sections showing GFAP (green), Sox2 (red), and REST
Supplementary Fig. 1. The Brown Norway rat has higher coronary flow compared to other rat strains. Publically available data for coronary flow
 Supplementary Fig. 1. The Brown Norway rat has higher coronary flow compared to other rat strains. Publically available data for coronary flow measured ex vivo on Langendorff apparatus under intrinsic
Supplementary Figure 1
 VO (ml kg - min - ) VCO (ml kg - min - ) Respiratory exchange ratio Energy expenditure (cal kg - min - ) Locomotor activity (x count) Body temperature ( C) Relative mrna expression TA Sol EDL PT Heart
SUPPLEMENTARY MATERIALS. IL-4 as a Repurposed Biological Drug for Myocardial Infarction through. Augmentation of Reparative Cardiac Macrophages:
 1 SUPPLEMENTARY MATERIALS IL-4 as a Repurposed Biological Drug for Myocardial Infarction through Augmentation of Reparative Cardiac Macrophages: Proof-of-Concept Data in Mice Yusuke Shintani MD PhD, Tomoya
SUPPLEMENTARY INFORMATION. Rett Syndrome Mutation MeCP2 T158A Disrupts DNA Binding, Protein Stability and ERP Responses
 SUPPLEMENTARY INFORMATION Rett Syndrome Mutation T158A Disrupts DNA Binding, Protein Stability and ERP Responses Darren Goffin, Megan Allen, Le Zhang, Maria Amorim, I-Ting Judy Wang, Arith-Ruth S. Reyes,
m 6 A mrna methylation regulates AKT activity to promote the proliferation and tumorigenicity of endometrial cancer
 SUPPLEMENTARY INFORMATION Articles https://doi.org/10.1038/s41556-018-0174-4 In the format provided by the authors and unedited. m 6 A mrna methylation regulates AKT activity to promote the proliferation
Supplementary Figure (OH) 22 nanoparticles did not affect cell viability and apoposis. MDA-MB-231, MCF-7, MCF-10A and BT549 cells were
 22 nanoparticles did not affect cell viability and apoposis. MDA-MB-231, MCF-7, MCF-10A and BT549 cells were") Supplementary Figure 1. Gd@C 82 (OH) 22 nanoparticles did not affect cell viability and apoposis. MDA-MB-231, MCF-7, MCF-10A and BT549 cells were treated with PBS, Gd@C 82 (OH) 22, C 60 (OH) 22 or GdCl
Supplementary Figure 1. Gd@C 82 (OH) 22 nanoparticles did not affect cell viability and apoposis. MDA-MB-231, MCF-7, MCF-10A and BT549 cells were treated with PBS, Gd@C 82 (OH) 22, C 60 (OH) 22 or GdCl
p = formed with HCI-001 p = Relative # of blood vessels that formed with HCI-002 Control Bevacizumab + 17AAG Bevacizumab 17AAG
 A.. Relative # of ECs associated with HCI-001 1.4 1.2 1.0 0.8 0.6 0.4 0.2 0.0 ol b p < 0.001 Relative # of blood vessels that formed with HCI-001 1.4 1.2 1.0 0.8 0.6 0.4 0.2 0.0 l b p = 0.002 Control IHC:
SUPPLEMENTARY INFORMATION
 DOI: 1.138/ncb3355 a S1A8 + cells/ total.1.8.6.4.2 b S1A8/?-Actin c % T-cell proliferation 3 25 2 15 1 5 T cells Supplementary Figure 1 Inter-tumoral heterogeneity of MDSC accumulation in mammary tumor
SUPPLEMENTARY FIGURES
 SUPPLEMENTARY FIGURES Supplementary Figure 1: Chemokine receptor expression profiles of CCR6 + and CCR6 - CD4 + IL-17A +/ex and Treg cells. Quantitative PCR analysis of chemokine receptor transcript abundance
SUPPLEMENTARY INFORMATION
 SUPPLEMENTARY INFORMATION Pleiotrophin Regulates the Expansion and Regeneration of Hematopoietic Stem Cells Heather A Himburg 1, Garrett G Muramoto 1 *, Pamela Daher 1*, Sarah K Meadows 1, J. Lauren Russell
7SK ChIRP-seq is specifically RNA dependent and conserved between mice and humans.
 Supplementary Figure 1 7SK ChIRP-seq is specifically RNA dependent and conserved between mice and humans. Regions targeted by the Even and Odd ChIRP probes mapped to a secondary structure model 56 of the
Supplementary Figure S1 Enlarged coronary artery branches in Edn1-knockout mice. a-d, Coronary angiography by ink injection in wild-type (a, b) and
 and") Supplementary Figure S1 Enlarged coronary artery branches in Edn1-knockout mice. a-d, Coronary angiography by ink injection in wild-type (a, b) and Edn1-knockout (Edn1-KO) (c, d) hearts. The boxed areas
Supplementary Figure S1 Enlarged coronary artery branches in Edn1-knockout mice. a-d, Coronary angiography by ink injection in wild-type (a, b) and Edn1-knockout (Edn1-KO) (c, d) hearts. The boxed areas
Supplementary Table 1. The primers used for quantitative RT-PCR. Gene name Forward (5 > 3 ) Reverse (5 > 3 )
 Reverse (5 > 3 )") 770 771 Supplementary Table 1. The primers used for quantitative RT-PCR. Gene name Forward (5 > 3 ) Reverse (5 > 3 ) Human CXCL1 GCGCCCAAACCGAAGTCATA ATGGGGGATGCAGGATTGAG PF4 CCCCACTGCCCAACTGATAG TTCTTGTACAGCGGGGCTTG
770 771 Supplementary Table 1. The primers used for quantitative RT-PCR. Gene name Forward (5 > 3 ) Reverse (5 > 3 ) Human CXCL1 GCGCCCAAACCGAAGTCATA ATGGGGGATGCAGGATTGAG PF4 CCCCACTGCCCAACTGATAG TTCTTGTACAGCGGGGCTTG