12-Lead ECG Interpretation. Kathy Kuznar, RN, ANP
|
|
|
- Randell Bell
- 6 years ago
- Views:
Transcription
1 12-Lead ECG Interpretation Kathy Kuznar, RN, ANP
2 The 12-Lead ECG Objectives Identify the normal morphology and features of the 12- lead ECG. Perform systematic analysis of the 12-lead ECG. Recognize abnormalities demonstrated on a 12-lead ECG indicating ischemia and infarction. Discuss various non-ischemic alterations diagnosed through 12-lead EKG and their significance.

3 12-Lead ECG!!!

4 12-Lead ECG One of oldest tools and still vital tool to evaluate the heart Evaluates the electrical activity of the heart Also can reflect the structure of the heart function of the heart blood flow to the heart muscle effects of the heart to electrolyte imbalance response of the heart to medications

5 12-Lead ECG Key to a good tracing: Skin prep Lead placement
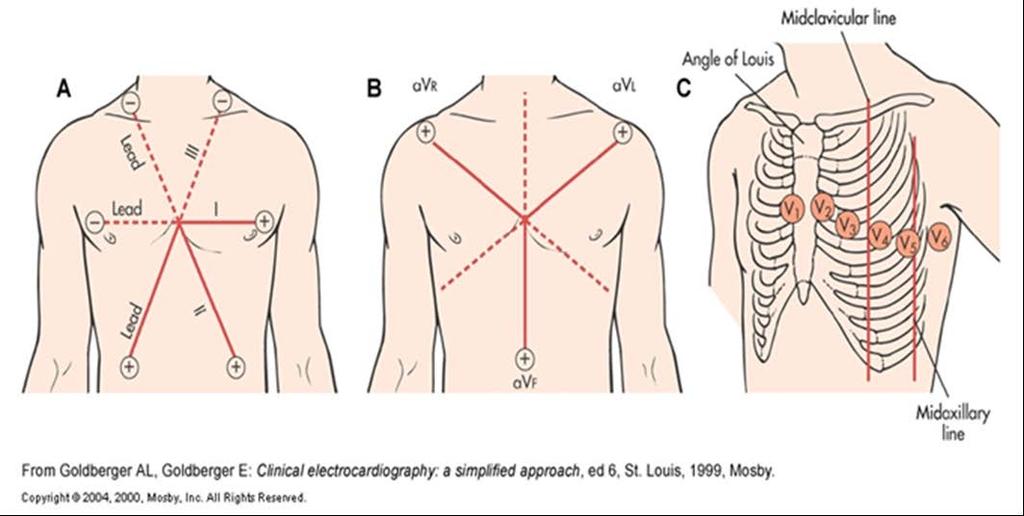
6 Electrode placement 10 electrode placed 12 leads/views obtained
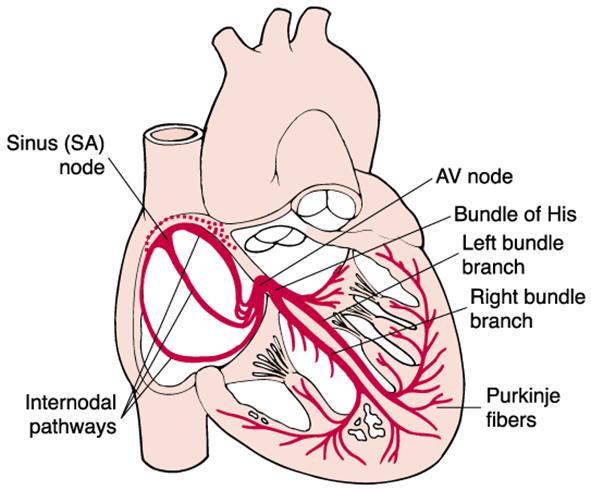
7 Electrophysiology
8
9 ECG Leads Lead = Electrical view of the heart A lead follows the flow of electricity from a negative pole to a positive pole


10 Camera analogy: ECG waves look at the heart from different views or perspectives
11 Current direction and wave deflection
12
13 The 12-Lead Limb leads Augmented limb leads (augmented voltage)
14

15 The 12-Lead ECG
16

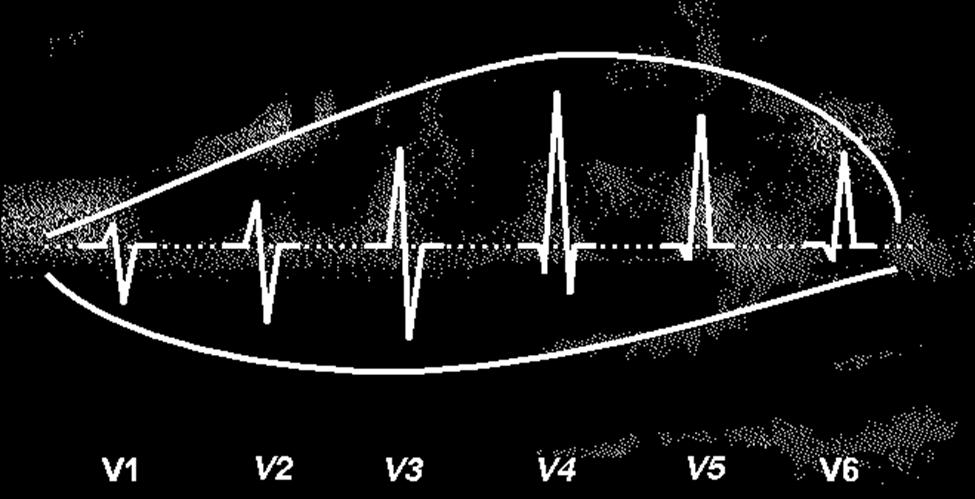
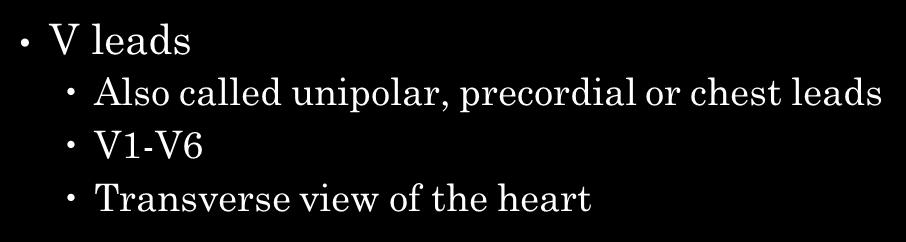
17 V Leads: R wave progression
18 Analyzing the 12-Lead ECG Develop a method to read the 12-lead Helps to avoid missing anything of clinical importance!
 Determine the heart s rhythm (sinus, atrial fib, etc.")
19 Analyzing the 12-Lead Where to start: Regularity Rate Evaluate waves and intervals P wave PR interval QRS T wave U wave QT interval Identify other rhythm events (PVCs, PACs, PJCs, etc.) Determine the heart s rhythm (sinus, atrial fib, etc.)
20 Examples:

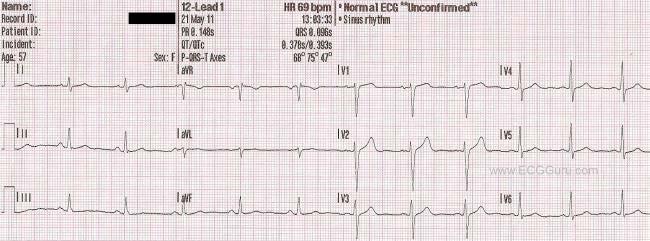
21 The Normal 12-Lead ECG
 R wave progression in the V leads (P waves & QRS complexes are usually upright but may be inverted) The QRS shouldn t have a Q wave ST segments:")
22 Next Analyze Waves and Intervals again by area of the heart: P waves QRS complexes: R wave in lead II should be taller than lead I The waves in lead III should be a smaller version of lead I Note if the QRS is abnormally wide (bundle branch block) R wave progression in the V leads (P waves & QRS complexes are usually upright but may be inverted) The QRS shouldn t have a Q wave ST segments: should be flat, on isoelectric line T waves: peaked or inverted? flattened?
23 Abnormalities to watch for Rate: too fast? too slow? Altered, variable, or absent P waves: sinus or atrial abnormality, AV block P waves not followed by QRS: complete heart block Prolonged or short PR intervals: heart block, junctional, re-entry tachy. Abnormal or widened QRS complexes: bundle branch block, ventricular tach. Premature beats: PAC, PJC, or PVCs Q waves (where there shouldn t be Q waves): completed myocardial infarction Poor R wave progression in the V leads ST segment depression: myocardial ischemia ST segment elevation: myocardial infarction T wave abnormalities: myocardial ischemia, hyperkalemia U waves: electrolyte abnormality, medication

24 Note: Life-threatening rhythms (dysrhythmias) Ventricular tachycardia Ventricular fibrillation Agonal rhythm Extreme tachycardia Sinus tachycardia Supraventricular tachycardia Atrial fibrillation or atrial flutter Ventricular or wide-complex tachycardia Extreme bradycardia Sinus bradycardia Heart block Slow junctional or ventricular rhythms and initiate appropriate emergency protocol
25 12-Lead Interpretation The next step Assessing axis

26 Evaluating the Electrical Axis Axis: The average direction of the heart s electrical activity during ventricular depolarization Determining axis will help in determining ventricular size and function Evaluate using the hexaxial reference system:
27 Axis Normal axis = 0 to 90 degrees (some sources say -30 to 90) Right axis deviation = +90 to +180 degrees Left axis deviation = -0 to -90 degrees Axis between -180 to -90 Indeterminate axis Northwest axis No man s land

28 Determining Axis Two methods: Quadrant method: Look at Lead I and AVF Use your hands Lead I = left hand AVF = right hand
29 Example

30 Normal Axis!
31 Example 2
 2.")

32 Determining Axis Degree method: 1. Select the limb lead with the largest QRS complex (most voltage) 2. Locate the axis on the hexaxial diagram 3. Evaluate that lead: Deflection positive, move to higher number axis line on the diagram Deflection negative, move to the lower number of the axis line on the diagram
33 Example
34 Example 2

35 Reasons for axis deviations RAD: Right ventricular hypertrophy Anterolateral MI Left posterior hemiblock Mechanical shifts Acute pulmonary emboli Severe pulmonary hypertension Dextrocardia A/V septal defects


36 Reasons for Axis Deviation LAD: Inferior MI Cardiac pacing Indeterminate: Ventricular tachycardia Extreme right ventricular hypertrophy Left ventricular hypertrophy Left bundle branch block Ventricular arrhythmias Mechanical shifts Pregnancy, severe obesity
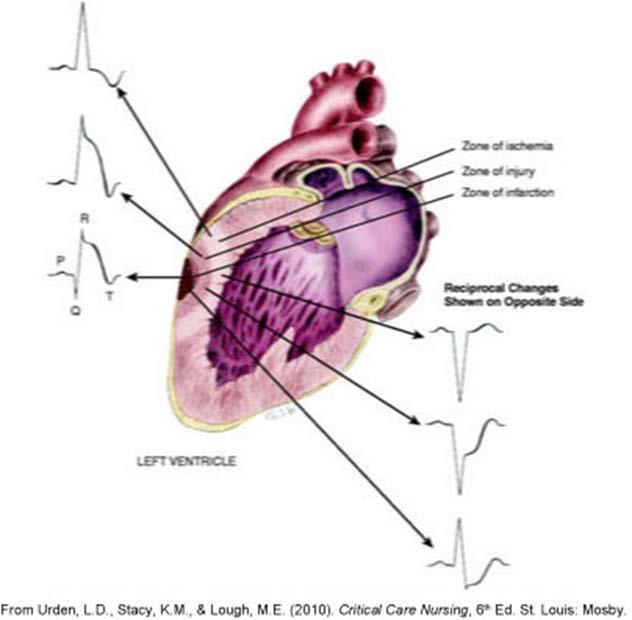
37 Recognizing ischemia and injury

 ST")
38 ST Segment Changes ST depression (Note: T wave inversion, flattening, or peaking also seen) ST elevation
39
40
41

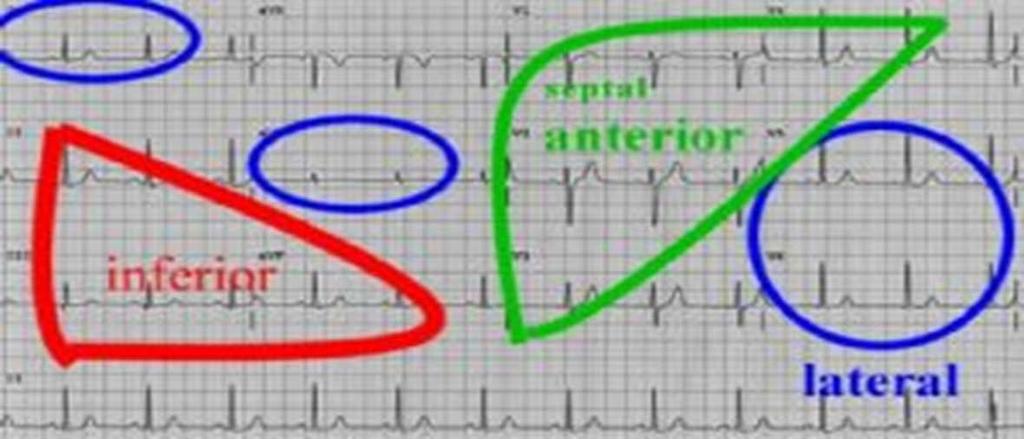
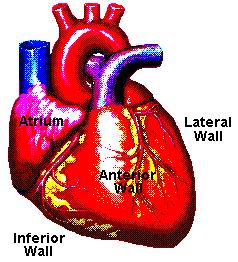
42 Determining area of heart affected:
43 ST Depression

44 T wave flattening and inversions
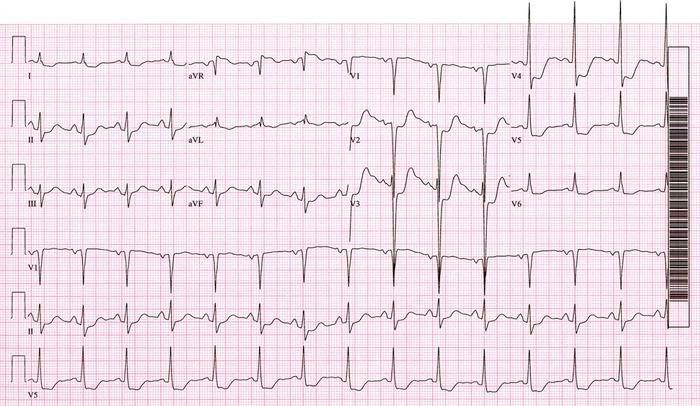
45 ST Elevation (with reciprocal changes)
46 Other Areas of MI Right ventricular MI Evidence of inferior MI Right sided EKG: ST elevation in V3R & V4R Patient may exhibit signs of right ventricular failure Hypotension Posterior MI Tall R wave in V1-V3 With ST segment depression and upright T wave Deep, flat ST depression
47 Right ventricular MI

48 Posterior MI

49 Q waves Indicate infarction has occurred
50 Non-ischemic ECG Changes
 and V1 (> 1.")

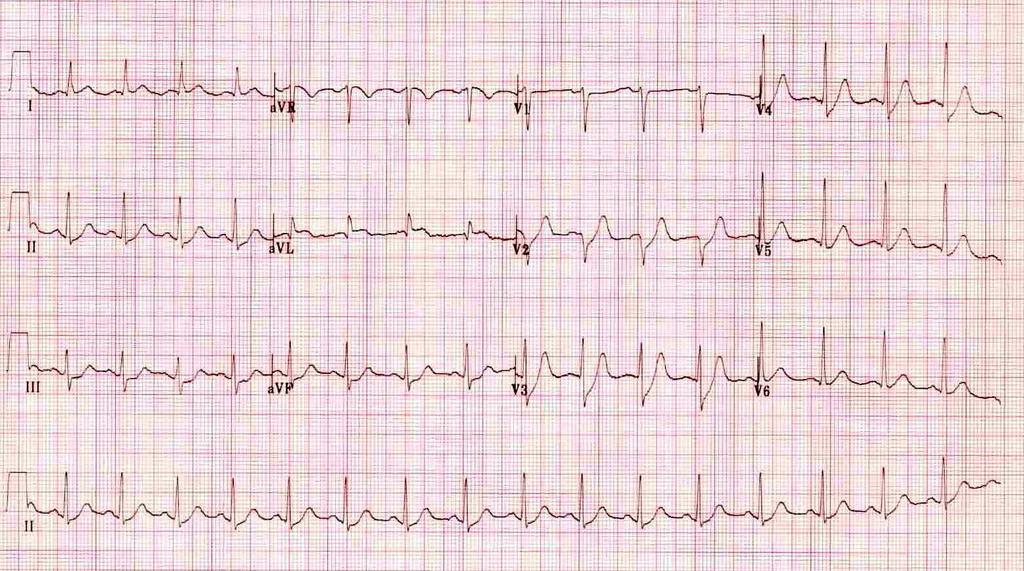
51 P Waves Right atrial enlargement (P pulmonale) Indicating right atrial enlargement Tall peaked P waves in lead II (> 2 small boxes) and V1 (> 1.5 mm) P waves indicating left atrial enlargement (P mitrale) Notched P waves in lead II Biphasic P wave in V1 with terminal P negative wave > 0.4 ms
52 Atrial Enlargement: Causes Right atrial enlargement: Pulmonary hypertension COPD Tricuspid stenosis Primary hypertension Left atrial enlargement: Systemic hypertension Aortic stenosis Mitral incompetence Hypertrophic cardiomyopathy

53 QT Interval

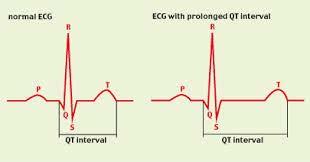
54 Prolonged QT Interval The QT interval reflects the time required for electrical activity to occur within the ventricle Includes both depolarization and repolarization Measure from beginning of QRS to the end of the T wave, normal milliseconds Heart rate can affect QT so a formula used to correct for rate, QTc Prolonged QT intervals increase vulnerabilities to V. Tach Particularly Torsades de Pointes
55


56 Bundle Branch Blocks Impairment or block in conduction in either right or left bundles Right bundle branch Left bundle branch Left anterior fascicle Left posterior fascicle
57 Causes of bundle branch block Right BBB Myocardial Infarction Ischemic heart disease Hypertension Pulmonary embolism Infection of the heart May be congenital and present at birth Left BBB Heart disease acute MI Ischemic heart disease Cardiomyopathy Hypertension Primary disease of the conduction system Infection of the heart


58 Bundle Branch Blocks If blocks occur, electrical conduction is passed slowly throughout the ventricle where the block is present The QRS will be wider than 0.12 seconds Right BBB rsr upright in V1 T wave opposite the V1 QRS V1 and V6 in both upright Left BBB Wider than normal S wave Large, deep QS in V1 or small R then wide S T wave opposite the V1 QRS V1 and V6 opposite
 LAFB Left axis deviation Small R waves in")

59 Hemiblock (Left Anterior or Posterior Fascicular Block) LAFB Left axis deviation Small R waves in inferior leads (II, III, and avf) LPFB Right axis deviation Small R and deep S in I, avl Small Q in lead III


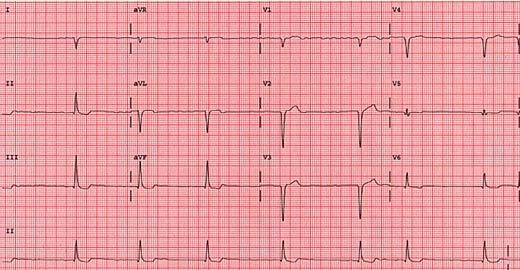
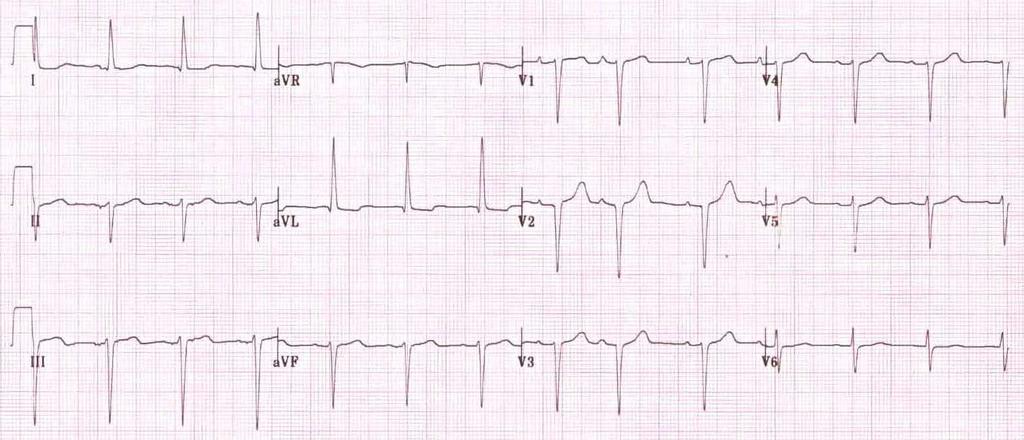
60 Chamber Hypertrophy Results from increases in pressure or volume or both
61 Chamber Hypertrophy Right Ventricle COPD (most common cause) Pulmonary embolism Pulmonary stenosis Pulmonary hypertension Valvular disease Mitral stenosis Tricuspid insufficiency Left Ventricle Hypertension (most common cause) Aortic valve disease Aortic stenosis Aortic regurgitation Hypertrophic cardiomyopathy Congenital heart disease- Coarctation of the aorta Congenital heart disease- Tetralogy of Fallot Transposition of the great vessels
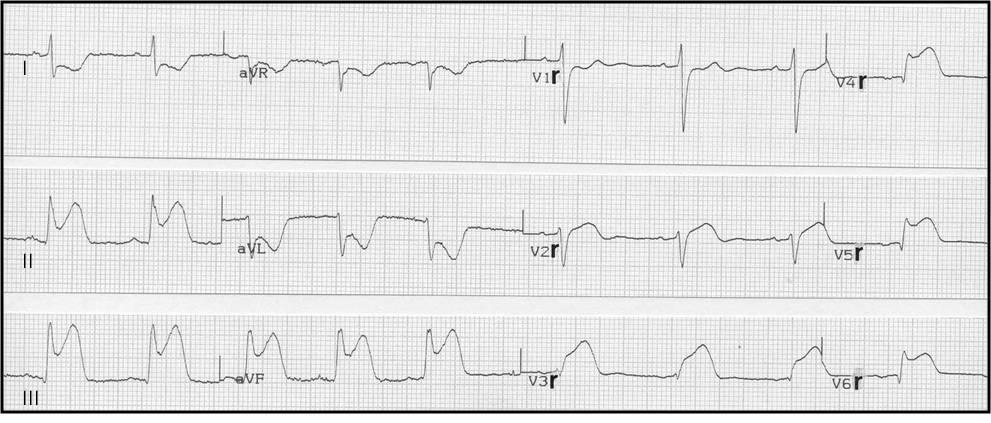
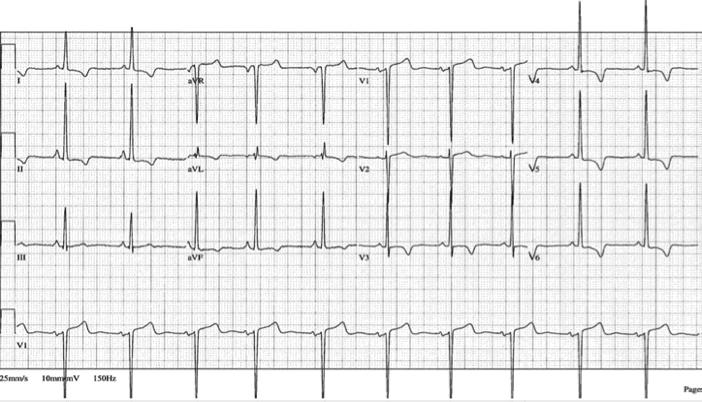
62 Chamber Hypertrophy Right Ventricular Tall R wave in V1 (Right ventricular depolarization) Right axis deviation T wave inversion Left Ventricular R wave in V5 or V6 plus S wave in V1 or V2 35 Left axis deviation may occur ST segment depression and T wave inversion in left leads Repolarization changes (left ventricular strain pattern)-st depression & asymmetrical T waves

63 Right ventricular hypertrophy

64 Left ventricular hypertrophy
65
66 References Davis, D. (2005). 12-Lead ECG Interpretation (4 th edition). Philadelphia: Lippincott, Williams, and Wilkins. Ellis, K. (2017). EKG: Plain and Simple. New York: Pearson. Lippincott (publisher). (2005). ECG Interpretation Made Incredibly Easy. Philadelphia: Lippincott, Williams, and Wilkins. Mayo Clinic, (2007). Advanced ECG Workshop. Rochester, MN: Mayo Clinic.
67 Helpful Websites ECG Learning Center, ECG Library: Healio: Learn the Heart, Life in the Fast Lane:
REtrive. REpeat. RElearn Design by. Test-Enhanced Learning based ECG practice E-book
 Test-Enhanced Learning Test-Enhanced Learning Test-Enhanced Learning Test-Enhanced Learning based ECG practice E-book REtrive REpeat RElearn Design by S I T T I N U N T H A N G J U I P E E R I Y A W A
Appendix D Output Code and Interpretation of Analysis
 Appendix D Output Code and Interpretation of Analysis 8 Arrhythmia Code No. Description 8002 Marked rhythm irregularity 8110 Sinus rhythm 8102 Sinus arrhythmia 8108 Marked sinus arrhythmia 8120 Sinus tachycardia
Family Medicine for English language students of Medical University of Lodz ECG. Jakub Dorożyński
 Family Medicine for English language students of Medical University of Lodz ECG Jakub Dorożyński Parts of an ECG The standard ECG has 12 leads: six of them are considered limb leads because they are placed
12 Lead ECG Skills: Building Confidence for Clinical Practice. Presented By: Cynthia Webner, BSN, RN, CCRN-CMC. Karen Marzlin, BSN, RN,CCRN-CMC
 12 Lead ECG Skills: Building Confidence for Clinical Practice NTI 2009 Preconference Session 803 Presented By: Karen Marzlin, BSN, RN,CCRN-CMC 1 12 Lead ECG Fundamentals: The Starting Place for Linking
Electrocardiography for Healthcare Professionals. Chapter 14 Basic 12-Lead ECG Interpretation
 Electrocardiography for Healthcare Professionals Chapter 14 Basic 12-Lead ECG Interpretation 2012 The Companies, Inc. All rights reserved. Learning Outcomes 14.1 Discuss the anatomic views seen on a 12-lead
If the P wave > 0.12 sec( 3 mm) usually in any lead. Notched P wave usually in lead I,aVl may be lead II Negative terminal portion of P wave in V1, 1
 usually in any lead. Notched P wave usually in lead I,aVl may be lead II Negative terminal portion of P wave in V1, 1") If the P wave > 0.12 sec( 3 mm) usually in any lead. Notched P wave usually in lead I,aVl may be lead II Negative terminal portion of P wave in V1, 1 mm depth and 3 mm width( most specific) Since Mitral
If the P wave > 0.12 sec( 3 mm) usually in any lead. Notched P wave usually in lead I,aVl may be lead II Negative terminal portion of P wave in V1, 1 mm depth and 3 mm width( most specific) Since Mitral
The Electrocardiogram part II. Dr. Adelina Vlad, MD PhD
 The Electrocardiogram part II Dr. Adelina Vlad, MD PhD Basic Interpretation of the ECG 1) Evaluate calibration 2) Calculate rate 3) Determine rhythm 4) Determine QRS axis 5) Measure intervals 6) Analyze
12 Lead ECG. Presented by Rebecca Sevigny BSN, RN Professional Practice & Development Dept.
 12 Lead ECG Presented by Rebecca Sevigny BSN, RN Professional Practice & Development Dept. Two Main Coronary Arteries RCA LCA which branches into Left Anterior Descending Circumflex Artery Two Main Coronary
Ekg pra pr c a tice D.HAMMOUDI.MD
 Ekg practice D.HAMMOUDI.MD Anatomy Revisited RCA (Right Coronary Artery) Right ventricle Inferior wall of LV Posterior wall of LV (75%) SA Node (60%) AV Node (>80%) LCA (Left Coronary Artery) Septal wall
Pennsylvania Academy of Family Physicians Foundation & UPMC 43rd Refresher Course in Family Medicine CME Conference March 10-13, 2016
 Pennsylvania Academy of Family Physicians Foundation & UPMC 43rd Refresher Course in Family Medicine CME Conference March 10-13, 2016 Disclosures: EKG Workshop Louis Mancano, MD Speaker has no disclosures
ECG Interpretation Made Easy
 ECG Interpretation Made Easy Dr. A Tageldien Abdellah, MSc MD EBSC Lecturer of Cardiology- Hull University Hull York Medical School 2007-2008 ECG Interpretation Made Easy Synopsis Benefits Objectives Process
ABCs of ECGs. Shelby L. Durler
 ABCs of ECGs Shelby L. Durler Objectives Review the A&P of the cardiac conduction system Placement and obtaining 4-lead and 12-lead ECGs Overview of the basics of ECG rhythm interpretation Intrinsic
Section V. Objectives
 Section V Landscape of an MI Objectives At the conclusion of this presentation the participant will be able to Outline a systematic approach to 12 lead ECG interpretation Demonstrate the process for determining
Electrical System Overview Electrocardiograms Action Potentials 12-Lead Positioning Values To Memorize Calculating Rates
 Electrocardiograms Electrical System Overview James Lamberg 2/ 74 Action Potentials 12-Lead Positioning 3/ 74 4/ 74 Values To Memorize Inherent Rates SA: 60 to 100 AV: 40 to 60 Ventricles: 20 to 40 Normal
ECG Basics Sonia Samtani 7/2017 UCI Resident Lecture Series
 ECG Basics Sonia Samtani 7/2017 UCI Resident Lecture Series Agenda I. Introduction II.The Conduction System III.ECG Basics IV.Cardiac Emergencies V.Summary The Conduction System Lead Placement avf Precordial
Cardiology Flash Cards
 Cardiology Flash Cards EKG in a nut shell www.brain101.info Conduction System www.brain101.info 2 Analyzing EKG Step by step Steps in Analyzing ECG'S 1. Rhythm: - Regular _ Sinus, Junctional or Ventricular.
Electrocardiography Abnormalities (Arrhythmias) 7. Faisal I. Mohammed, MD, PhD
 7. Faisal I. Mohammed, MD, PhD") Electrocardiography Abnormalities (Arrhythmias) 7 Faisal I. Mohammed, MD, PhD 1 Causes of Cardiac Arrythmias Abnormal rhythmicity of the pacemaker Shift of pacemaker from sinus node Blocks at different
Electrocardiography Abnormalities (Arrhythmias) 7 Faisal I. Mohammed, MD, PhD 1 Causes of Cardiac Arrythmias Abnormal rhythmicity of the pacemaker Shift of pacemaker from sinus node Blocks at different
ECG ABNORMALITIES D R. T AM A R A AL Q U D AH
 ECG ABNORMALITIES D R. T AM A R A AL Q U D AH When we interpret an ECG we compare it instantaneously with the normal ECG and normal variants stored in our memory; these memories are stored visually in
Please check your answers with correct statements in answer pages after the ECG cases.
 ECG Cases ECG Case 1 Springer International Publishing AG, part of Springer Nature 2018 S. Okutucu, A. Oto, Interpreting ECGs in Clinical Practice, In Clinical Practice, https://doi.org/10.1007/978-3-319-90557-0
402 Index. B β-blockers, 4, 5 Bradyarrhythmias, 76 77
 Index A Acquired immunodeficiency syndrome (AIDS), 126, 163 Action potentials, 1, 5, 27 Acute coronary syndromes, 123t, 129 Adenosine, intravenous, 277 Alcohol abuse, as T wave inversion cause, 199 Aneurysm,
Myocardial Infarction. Reading Assignment (p66-78 in Outline )
") Myocardial Infarction Reading Assignment (p66-78 in Outline ) Objectives 1. Why do ST segments go up or down in ischemia? 2. STEMI locations and culprit vessels 3. Why 15-lead ECGs? 4. What s up with avr?
Myocardial Infarction Reading Assignment (p66-78 in Outline ) Objectives 1. Why do ST segments go up or down in ischemia? 2. STEMI locations and culprit vessels 3. Why 15-lead ECGs? 4. What s up with avr?
Abnormalities Caused by Left Bundle Branch Block
 Marquette University e-publications@marquette Physician Assistant Studies Faculty Research and Publications Physician Assistant Studies, Department 12-17-2010 Abnormalities Caused by Left Bundle Branch
2017 EKG Workshop Advanced. Family Medicine Review Course Lou Mancano, MD, FAAFP Reading Health System Family and Community Medicine Reading, PA
 2017 EKG Workshop Advanced Family Medicine Review Course Lou Mancano, MD, FAAFP Reading Health System Family and Community Medicine Reading, PA Part II - Objective Describe a useful approach to interpreting
ECG CONVENTIONS AND INTERVALS
 1 ECG Waveforms and Intervals ECG waveforms labeled alphabetically P wave== represents atrial depolarization QRS complex=ventricular depolarization ST-T-U complex (ST segment, T wave, and U wave)== V repolarization.
ECG (MCQs) In the fundamental rules of the ECG all the following are right EXCEP:
 In the fundamental rules of the ECG all the following are right EXCEP:") ECG (MCQs) 2010 1- In the fundamental rules of the ECG all the following are right EXCEP: a- It is a biphasic record of myocardial action potential fluctuations. b- Deflection record occurs only during
ECG (MCQs) 2010 1- In the fundamental rules of the ECG all the following are right EXCEP: a- It is a biphasic record of myocardial action potential fluctuations. b- Deflection record occurs only during
Chapter 2 Practical Approach
 Chapter 2 Practical Approach There are beginners in electrocardiogram (ECG) analysis who are fascinated by a special pattern (e.g., a bundle-branch block or a striking Q wave) and thereby overlook other
15 16 September Seminar W10O. ECG for General Practice
 15 16 September 2012 Seminar W10O ECG for General Practice Speaker: Ms Natasha Eaton ECG for General Practice Speaker: Natasha Eaton Cardiac CNC Executive Representative Electrocardiography The graphic
, David Stultz, MD.
 http://www.dilbert.com EKG Rounds Handouts available at http://www.drstultz.com January 5, 2004 David Stultz, MD Cardiology Fellow, PGY 4 Overview of Topics How to read an EKG Normal EKG Determination
Introduction to Electrocardiography
 Introduction to Electrocardiography Class Objectives: Introduction to ECG monitoring Discuss principles of interpretation Identify the components and measurements of the ECG ECG analysis ECG Monitoring
General Introduction to ECG. Reading Assignment (p2-16 in PDF Outline )
") General Introduction to ECG Reading Assignment (p2-16 in PDF Outline ) Objectives 1. Practice the 5-step Method 2. Differential Diagnosis: R & L axis deviation 3. Differential Diagnosis: Poor R-wave progression
General Introduction to ECG Reading Assignment (p2-16 in PDF Outline ) Objectives 1. Practice the 5-step Method 2. Differential Diagnosis: R & L axis deviation 3. Differential Diagnosis: Poor R-wave progression
Ben Taylor, PhD, PA-C
 Ben Taylor, PhD, PA-C The patient is a 23-year-old white male with a history of polysubstance abuse who was found unresponsive, last seen the day before. Classic signs of systemic hypothermia with prominent
EKG Competency for Agency
 EKG Competency for Agency Name: Date: Agency: 1. The upper chambers of the heart are known as the: a. Atria b. Ventricles c. Mitral Valve d. Aortic Valve 2. The lower chambers of the heart are known as
ECG Interpretation Cat Williams, DVM DACVIM (Cardiology)
") ECG Interpretation Cat Williams, DVM DACVIM (Cardiology) Providing the best quality care and service for the patient, the client, and the referring veterinarian. GOAL: Reduce Anxiety about ECGs Back to
ECG Interpretation Cat Williams, DVM DACVIM (Cardiology) Providing the best quality care and service for the patient, the client, and the referring veterinarian. GOAL: Reduce Anxiety about ECGs Back to
Relax and Learn At the Farm 2012
 Relax and Learn At the Farm 2012 Session 2: 12 Lead ECG Fundamentals 101 Cynthia Webner DNP, RN, CCNS, CCRN-CMC, CHFN Though for Today Mastery is not something that strikes in an instant, like a thunderbolt,
FLB s What Are Those Funny-Looking Beats?
 FLB s What Are Those Funny-Looking Beats? Reading Assignment (pages 27-45 in Outline ) The 5-Step Method ECG #: Mearurements: Rhythm (s): Conduction: Waveform: Interpretation: A= V= PR= QRS= QT= Axis=
Huseng Vefali MD St. Luke s University Health Network Department of Cardiology
 Huseng Vefali MD St. Luke s University Health Network Department of Cardiology Learning Objectives Establish Consistent Approach to Interpreting ECGs Review Essential Cases for Paramedics and first responders
Case 1. Case 2. Case 3
 Case 1 The correct answer is D. Occasionally, the Brugada syndrome can present similar morphologies to A and also change depending on the lead position but in the Brugada pattern the r is wider and ST
ELECTROCARDIOGRAPH. General. Heart Rate. Starship Children s Health Clinical Guideline
 General Heart Rate QRS Axis T Wave Axis PR Interval according to Heart Rate & Age P Wave Duration and Amplitude QRS Duration according to Age QT Interval R & S voltages according to Lead & Age R/S ratio
ECG Interpretation. Introduction to Cardiac Telemetry. Michael Peters, RN, CCRN, CFRN CALSTAR Air Medical Services
 ECG Interpretation Introduction to Cardiac Telemetry Michael Peters, RN, CCRN, CFRN CALSTAR Air Medical Services Disclosures Nothing to disclose Objectives Describe the electrical conduction pathway in
Study methodology for screening candidates to athletes risk
 1. Periodical Evaluations: each 2 years. Study methodology for screening candidates to athletes risk 2. Personal history: Personal history of murmur in childhood; dizziness, syncope, palpitations, intolerance
Introduction to ECG Gary Martin, M.D.
 Brief review of basic concepts Introduction to ECG Gary Martin, M.D. The electrical activity of the heart is caused by a sequence of rapid ionic movements across cell membranes resulting first in depolarization
1/22/2007 Fernald Medical Monitoring Program Sort Code EKG coding
 1/22/2007 Fernald Medical Monitoring Program Sort Code EKG coding PLEASE NOTE THAT ALL EKG CODES MUST RANGE FROM 500-599 OR FROM 900-999. PLEASE DO NOT ASSIGN NUMBERS OUTSIDE THAT RANGE FOR EKG CODES.
A few new tools for better detection and understanding of STEMIs in the field.
 A few new tools for better detection and understanding of STEMIs in the field. Let s talk, prep and placement. Try to shoot for quality, consistency and no artifact! (looking sometimes for 1 or 2 mm changes)
12 Lead EKG. The Basics
 12 Lead EKG The Basics Objectives Demonstrate proper 12 EKG lead placement Determine electrical axis Identify ST and T wave changes as they relate to myocardial ischemia Describe possible complications
Basic electrocardiography reading. R3 lee wei-chieh
 Basic electrocardiography reading R3 lee wei-chieh The Normal Conduction System Lead Placement avf Limb Leads Precordial Leads Interpretation Rate Rhythm Interval Axis Chamber abnormality QRST change What
Determining Axis and Axis Deviation on an ECG
 Marquette University e-publications@marquette Physician Assistant Studies Faculty Research and Publications Health Sciences, College of 7-15-2010 Determining Axis and Axis Deviation on an ECG Patrick Loftis
Supraventricular Arrhythmias. Reading Assignment. Chapter 5 (p17-30)
") Supraventricular Arrhythmias Reading Assignment Chapter 5 (p17-30) The Supraventricular Rhythms In Our Lives Site of Origin Single Events Slow Rates Intermediate Rates Fast Rates (>100 bpm) Sinus Sinus
Supraventricular Arrhythmias Reading Assignment Chapter 5 (p17-30) The Supraventricular Rhythms In Our Lives Site of Origin Single Events Slow Rates Intermediate Rates Fast Rates (>100 bpm) Sinus Sinus
12 LEAD EKG BASICS. By: Steven Jones, NREMT P CLEMC
 12 LEAD EKG BASICS By: Steven Jones, NREMT P CLEMC ECG Review Waves and Intervals P wave: the sequential activation (depolarization) of the right and left atria QRS complex: right and left ventricular
ECG Practice Strips Discussion part 1:
 ECG Practice Strips Discussion part 1: The first 20 strips are for teaching various abnormalities of the morphology of the waves of the ECG. Strips 21 and following are for teaching some abnormalities
12 LEAD EKG & CXR INTERPRETATION.
 12 LEAD EKG & CXR INTERPRETATION www.cherylherrmann.com cherrmann@frontier.com Audio Product Recording discount for participants $60 Nonparticipants = $190 o Get CEs and manual https://catalog.vyne.com
EKG. Danil Hammoudi.MD
 EKG Danil Hammoudi.MD What is an EKG? The electrocardiogram (EKG) is a representation of the electrical events of the cardiac cycle. Each event has a distinctive waveform, the study of which can lead to
UNDERSTANDING YOUR ECG: A REVIEW
 UNDERSTANDING YOUR ECG: A REVIEW Health professionals use the electrocardiograph (ECG) rhythm strip to systematically analyse the cardiac rhythm. Before the systematic process of ECG analysis is described
Electrocardiogram ECG. Hilal Al Saffar FRCP FACC College of medicine,baghdad University
 Electrocardiogram ECG Hilal Al Saffar FRCP FACC College of medicine,baghdad University Tuesday 29 October 2013 ECG introduction Wednesday 30 October 2013 Abnormal ECG ( ischemia, chamber hypertrophy, heart
ECG Cases and Questions. Ashish Sadhu, MD, FHRS, FACC Electrophysiology/Cardiology
 ECG Cases and Questions Ashish Sadhu, MD, FHRS, FACC Electrophysiology/Cardiology 32 yo female Life Insurance Physical 56 yo male with chest pain Terminology Injury ST elevation Ischemia T wave inversion
DR QAZI IMTIAZ RASOOL OBJECTIVES
 PRACTICAL ELECTROCARDIOGRAPHY DR QAZI IMTIAZ RASOOL OBJECTIVES Recording of electrical events in heart Established electrode pattern results in specific tracing pattern Health of heart i. e. Anatomical
ECGs: Everything a finalist needs to know. Dr Amy Coulden As part of the Simply Finals series
 ECGs: Everything a finalist needs to know Dr Amy Coulden As part of the Simply Finals series Aims and objectives To be able to interpret basic ECG abnormalities To be able to recognise commonly tested
also aid the clinician in recognizing both the obvious and subtle abnormalities that may help guide therapy.
 Karen Lieberman, MS, CRNP f the many diagnostic tools used to screen for and evaluate cardiac abnormalities, the 12-lead electrocardiogram (ECG) is among the most basic. This inexpensive and noninvasive
2017 EKG Workshop Basic. Family Medicine Review Course Lou Mancano, MD, FAAFP Reading Health System Family and Community Medicine Reading, PA
 2017 EKG Workshop Basic Family Medicine Review Course Lou Mancano, MD, FAAFP Reading Health System Family and Community Medicine Reading, PA Part I - Objectives Discuss a systematic approach to EKG interpretation
Rhythm ECG Characteristics Example. Normal Sinus Rhythm (NSR)
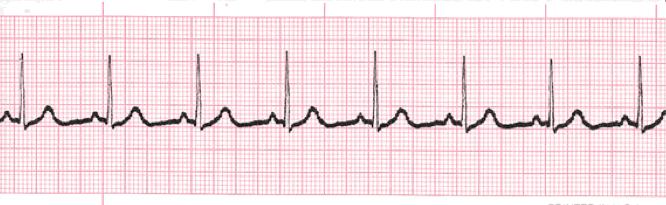
") Normal Sinus Rhythm (NSR) Rate: 60-100 per minute Rhythm: R- R = P waves: Upright, similar P-R: 0.12-0.20 second & consistent P:qRs: 1P:1qRs Sinus Tachycardia Exercise Hypovolemia Medications Fever Substances
Normal Sinus Rhythm (NSR) Rate: 60-100 per minute Rhythm: R- R = P waves: Upright, similar P-R: 0.12-0.20 second & consistent P:qRs: 1P:1qRs Sinus Tachycardia Exercise Hypovolemia Medications Fever Substances
Acute Coronary Syndromes Unstable Angina Non ST segment Elevation MI (NSTEMI) ST segment Elevation MI (STEMI)
 ST segment Elevation MI (STEMI)") Leanna R. Miller, RN, MN, CCRN-CSC, PCCN-CMC, CEN, CNRN, CMSRN, NP Education Specialist LRM Consulting Nashville, TN Objectives Evaluate common abnormalities that mimic myocardial infarction. Identify
Leanna R. Miller, RN, MN, CCRN-CSC, PCCN-CMC, CEN, CNRN, CMSRN, NP Education Specialist LRM Consulting Nashville, TN Objectives Evaluate common abnormalities that mimic myocardial infarction. Identify
Blocks & Dissociations. Reading Assignment (p47-52 in Outline )
") Blocks & Dissociations Reading Assignment (p47-52 in Outline ) Objectives Who are Wenckebach and Mobitz? Review SA and AV Blocks AV Dissociations: learning who s the boss and why 2 nd degree SA Block:
Blocks & Dissociations Reading Assignment (p47-52 in Outline ) Objectives Who are Wenckebach and Mobitz? Review SA and AV Blocks AV Dissociations: learning who s the boss and why 2 nd degree SA Block:
Reading Assignment (p1-91 in Outline ) Objectives What s in an ECG?
 Objectives What s in an ECG?") Reading Assignment (p1-91 in Outline ) Objectives What s in an ECG? The 5-Step Method ECG #: Mearurements: Rhythm (s): Conduction: Waveform: Interpretation: A= V= PR= QRS= QT= Axis= 1. Compute the 5 basic
Reading Assignment (p1-91 in Outline ) Objectives What s in an ECG? The 5-Step Method ECG #: Mearurements: Rhythm (s): Conduction: Waveform: Interpretation: A= V= PR= QRS= QT= Axis= 1. Compute the 5 basic
Other 12-Lead ECG Findings
 Other 12-Lead ECG Findings Left Atrial Enlargement Left atrial enlargement is illustrated by increased P wave duration in lead II, top ECG, and by the prominent negative P terminal force in lead V1, bottom
ECG pre-reading manual. Created for the North West Regional EMET training program
 ECG pre-reading manual Created for the North West Regional EMET training program Author:- Dr Juan Carlos Ascencio-Lane juan.ascencio-lane@ths.tas.gov.au 1 Disclaimer This handbook has been created for
Bundle Branch & Fascicular Blocks. Reading Assignment (p53-58 in Outline )
") Bundle Branch & Fascicular Blocks Reading Assignment (p53-58 in Outline ) Objectives 1. QRS analysis of Right and Left BBB 2. Uncomplicated vs complicated BBB 3. Diagnosis of RBBB with LAFB and LPFB 4.
Bundle Branch & Fascicular Blocks Reading Assignment (p53-58 in Outline ) Objectives 1. QRS analysis of Right and Left BBB 2. Uncomplicated vs complicated BBB 3. Diagnosis of RBBB with LAFB and LPFB 4.
Lab Activity 24 EKG. Portland Community College BI 232
 Lab Activity 24 EKG Reference: Dubin, Dale. Rapid Interpretation of EKG s. 6 th edition. Tampa: Cover Publishing Company, 2000. Portland Community College BI 232 Graph Paper 1 second equals 25 little boxes
ECG Interpretation. Best to have a system to methodically evaluate ECG (from Dubin) * Rate * Rhythm * Axis * Intervals * Hypertrophy * Infarction
 * Rate * Rhythm * Axis * Intervals * Hypertrophy * Infarction") ECG to save Babies ECG Interpretation Best to have a system to methodically evaluate ECG (from Dubin) * Rate * Rhythm * Axis * Intervals * Hypertrophy * Infarction Electrical Activity in the heart 5 events
ECG to save Babies ECG Interpretation Best to have a system to methodically evaluate ECG (from Dubin) * Rate * Rhythm * Axis * Intervals * Hypertrophy * Infarction Electrical Activity in the heart 5 events
Paediatric ECG Interpretation
 Paediatric ECG Interpretation Dr Sanj Fernando (thanks to http://lifeinthefastlane.com/ecg-library/paediatric-ecginterpretation/) 3 yo boy complaining of abdominal pain and chest pain Child ECG vs Adult
Understanding basics of EKG
 Understanding basics of EKG By Alula A.(R III) www.le.ac.uk Topic for discussion Understanding of cellular electrophysiology Basics Rate Rhythm Axis Intervals P wave QRS ST/T wave Abnormal EKGs Understanding
Section 3 and 4. Objectives. Bundle Branches 10/9/2018. LBBB, RBBB Bifascicular, Trifascicular Block
 Section 3 and 4 LBBB, RBBB Bifascicular, Trifascicular Block Objectives At the conclusion of this presentation the participant will be able to Outline a systematic approach to 12 lead ECG interpretation
Acute Coronary Syndromes. Disclosures
 Acute Coronary Syndromes Disclosures I work for Virginia Garcia Memorial Health Center, Beaverton, OR. Jon Tardiff, BS, PA-C OHSU Clinical Assistant Professor And I am a medical editor for Jones & Bartlett
12 Lead EKG Interpretation. Disclosures
 12 Lead EKG Interpretation Louann B. Bailey, DNP, APRN, FAANP ACNP BC I have no disclosures Disclosures 2 1 Objectives At the conclusion of this presentation the participant will be able to Outline a systematic
Return to Basics. ECG Rate and Rhythm. Management of the Hospitalized Patient September 25, 2009
 Management of the Hospitalized Patient September 25, 2009 ECG Refresher and Update 2009 Return to Basics Determine rate and rhythm Determine intervals and axes Define morphology of P-QRS-T-U Compare with
By the end of this lecture, you will be able to: Understand the 12 lead ECG in relation to the coronary circulation and myocardium Perform an ECG
 By the end of this lecture, you will be able to: Understand the 12 lead ECG in relation to the coronary circulation and myocardium Perform an ECG recording Identify the ECG changes that occur in the presence
Ablative Therapy for Ventricular Tachycardia
 Ablative Therapy for Ventricular Tachycardia Nitish Badhwar, MD, FACC, FHRS 2 nd Annual UC Davis Heart and Vascular Center Cardiovascular Nurse / Technologist Symposium May 5, 2012 Disclosures Research
Left posterior hemiblock (LPH)/
/") ECG OF THE MONTH Left Postero-inferior Depolarization Delay Keywords Electrocardiography Intraventricular conduction delay, Inferoposterior hemiblock, Left posterior fascicular block, Left posterior hemiblock
ECG OF THE MONTH Left Postero-inferior Depolarization Delay Keywords Electrocardiography Intraventricular conduction delay, Inferoposterior hemiblock, Left posterior fascicular block, Left posterior hemiblock
Axis. B.G. Petty, Basic Electrocardiography, DOI / _2, Springer Science+Business Media New York 2016
 Axis 2 The electrical axis of any electrocardiogram (EKG) waveform is the average direction of electrical activity. It is not a vector, because by definition a vector has both direction and amplitude,
Diploma in Electrocardiography
 The Society for Cardiological Science and Technology Diploma in Electrocardiography The Society makes this award to candidates who can demonstrate the ability to accurately record a resting 12-lead electrocardiogram
The ECG in healthy people
 The ECG in healthy people The normal cardiac rhythm 3 The heart rate 3 Extrasystoles 7 The P wave 7 The PR interval The QRS complex 3 The ST segment 29 The T wave 33 The QT interval 42 The ECG in athletes
Return to Basics. Normal Intervals & Axes. ECG Rate and Rhythm
 Return to Basics Management of the Hospitalized Patient October 15, 2010 ECG Refresher and Update 2010 Determine rate and rhythm Determine intervals and axes Define morphology of P-QRS-T-U Compare with
Miscellaneous Stuff Keep reading the Outline
 Miscellaneous Stuff Keep reading the Outline Welcome to the 5-Step Method ECG #: Mearurements: Rhythm (s): Conduction: Waveform: Interpretation: A= V= PR= QRS= QT= Axis= 1. Compute the 5 basic measurements:
All About STEMIs. Presented By: Brittney Urvand, RN, BSN, CCCC. Essentia Health Fargo Cardiovascular Program Manager.
 All About STEMIs Presented By: Brittney Urvand, RN, BSN, CCCC Essentia Health Fargo Cardiovascular Program Manager Updated 10/2/2018 None Disclosures Objectives Identify signs and symptoms of a heart attack
BEDSIDE ECG INTERPRETATION
 BEDSIDE ECG INTERPRETATION Presented by: Ryan Dean, RN, MSN, CCRN, CCNS, CFRN Flight Nurse 2017 Based on presentations originally by Gennifer DePaoli, RN Objectives Hospital policies Electrical conduction
The pediatric electrocardiogram Part I: Age-related interpretation
 American Journal of Emergency Medicine (2008) 26, 221 228 www.elsevier.com/locate/ajem Diagnostics The pediatric electrocardiogram Part I: Age-related interpretation Matthew O'Connor MD a, Nancy McDaniel
Relax and Learn at the FARM 2012: Session 8: 12 Lead ECG 401: ECG Variants
 Relax and Learn at the FARM 2012: Session 8: 12 Lead ECG 401: ECG Variants A Ship in the Harbor is Safe But that is not what ships are built for. Karen Marzlin DNP, RN, CCNS, CCRN-CMC, CHFN Cardiovascular
12 Lead ECG Interpretation: The Basics and Beyond
 12 Lead ECG Interpretation: The Basics and Beyond Cindy Weston, DNP, RN, CCRN, CNS-CC, FNP-BC Assistant Professor Texas A&M University College of Nursing cweston@tamhsc.edu Objectives Review the basics
How To Think About Rhythms and Conduction
 How To Think About Rhythms and Conduction Frank Yanowitz, MD Professor of Medicine (Cardiology) University of Utah School of Medicine Medical Director, IHC ECG Services Intermountain Healthcare http://ecg.utah.edu
Cardiovascular Nursing Practice: A Comprehensive Resource Manual and Study Guide for Clinical Nurses 2 nd Edition
 Cardiovascular Nursing Practice: A Comprehensive Resource Manual and Study Guide for Clinical Nurses 2 nd Edition Table of Contents Volume 1 Chapter 1: Cardiovascular Anatomy and Physiology Basic Cardiac
12 Lead ECG Interpretation: Color Coding for MI s
 12 Lead ECG Interpretation: Color Coding for MI s Anna E. Story, RN, MS Director, Continuing Professional Education Critical Care Nurse Online Instructional Designer 2004 Anna Story 1 Objectives review
10 ECGs No Practitioner Can Afford to Miss. Objectives
 10 ECGs No Practitioner Can Afford to Miss Mary L. Dohrmann, MD Professor of Clinical Medicine Division of Cardiovascular Medicine University of Missouri School of Medicine No disclosures Objectives 1.
12 Lead ECG Interpretation
 12 Lead ECG Interpretation Julie Zimmerman, MSN, RN, CNS, CCRN Significant increase in mortality for every 15 minutes of delay! N Engl J Med 2007;357:1631-1638 Who should get a 12-lead ECG? Also include
Conduction Problems / Arrhythmias. Conduction
 Conduction Problems / Arrhythmias Conduction Wolf-Parkinson White Syndrome (WPW) and Lown-Ganong-Levine (LGL): Atrial impulses bypass the AV node through an accessory pathway or bypass tract (bundle of
3/4/2018. March Martina Frost, PA C Desert Cardiology. Electricity moving towards/away from electrode create downward/upward directions of waves
 March 2018 Martina Frost, PA C Desert Cardiology Electricity moving towards/away from electrode create downward/upward directions of waves Frontal view Limb leads: I, II, III, avl, avf, (avr) Horizontal
Office ECG Interpretation
 Office ECG Interpretation Jason Evanchan, DO Assistant Professor of Medicine Division of Cardiovascular Medicine The Ohio State University Wexner Medical Center Outline of topics High risk ischemia T wave
PATIENT S NAME, DATE/TIME,
 ECG and Arrhythmias Dec, 1 st 2014 Doctor Mohammad Jarrah References: - Lecture and Slides - ECG Made Easy - Davidson Principles of Medicine - First Aid Cases for the USMLE Step 1 - Mini-OSCE Archive ECG
Return to Basics. ECG Rate and Rhythm. Management of the Hospitalized Patient October 4, 2007
 Management of the Hospitalized Patient October 4, 2007 ECG Refresher for the Hospitalists Return to Basics Determine rate and rhythm Determine intervals and axes Define morphology of P-QRS-T-U Compare
Cardiac Telemetry Self Study: Part One Cardiovascular Review 2017 THINGS TO REMEMBER
 Please review the above anatomy of the heart. THINGS TO REMEMBER There are 3 electrolytes that affect cardiac function o Sodium, Potassium, and Calcium When any of these electrolytes are out of the normal
ECG Underwriting Puzzler Dr. Regina Rosace AVP & Medical Director
 December 2018 ECG Underwriting Puzzler Dr. Regina Rosace AVP & Medical Director To obtain best results Select Slide Show from the ribbon at the top of your PowerPoint screen Select From Beginning on the
Cardiac Arrhythmia How to approach นพ.พ น จ แกวส วรรณะ หน วยโรคห วใจและหลอดเล อด
 Cardiac Arrhythmia How to approach นพ.พ น จ แกวส วรรณะ หน วยโรคห วใจและหลอดเล อด EKG paper is a grid where time is measured along the horizontal axis. Each small square is 1 mm in length and represents
A Review of Cardiac Pathophysiology and EKG. Jamie Dyson PT, DPT Kathy Swanick PT, DPT, OCS
 A Review of Cardiac Pathophysiology and EKG Jamie Dyson PT, DPT Kathy Swanick PT, DPT, OCS Cardiac Pathophysiology Coronary Artery Disease Congestive Heart Failure Valvular Heart Disease Athletic Heart