12 Lead ECG. Presented by Rebecca Sevigny BSN, RN Professional Practice & Development Dept.
|
|
|
- Kerrie Adams
- 6 years ago
- Views:
Transcription
1 12 Lead ECG Presented by Rebecca Sevigny BSN, RN Professional Practice & Development Dept.
2
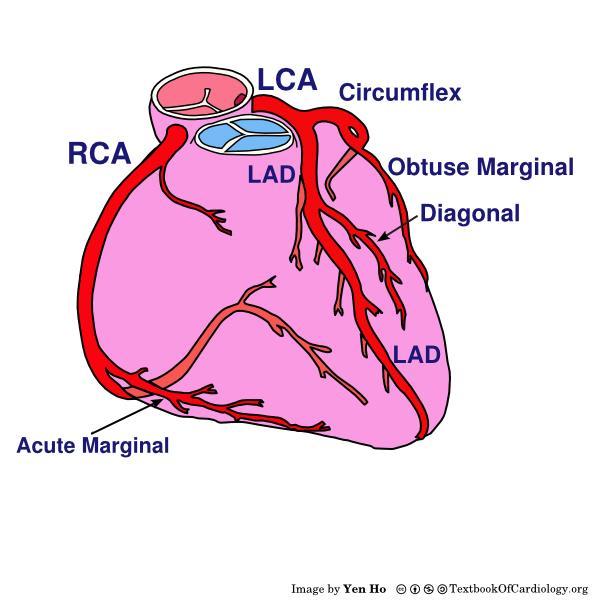
3 Two Main Coronary Arteries RCA LCA which branches into Left Anterior Descending Circumflex Artery Two Main Coronary Arteries
4 Right Coronary Artery Myocardium Supplied: Right atrium/right ventricle Inferior wall of LV Posterior 1/3 of intraventricular septum Conduction Structures Supplied: SA Node (> 50%) AV Node (~80%) Posterior division of left bundle (part)
5 Circumflex Artery Myocardium Supplied: Left Lateral wall of the left ventricle, back side of heart Conduction Structures Supplied: SA Node (~40%)

6 Cardiac Conduction System
7 Conduction: Normal P-QRS-T
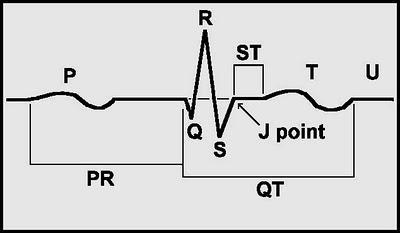
8 Normal P-QRS-T P Wave PR Interval QRS Complex ST Segment Represents Atrial depolarization Atrial depolarization and delay at the AV Node (AV conduction time) Ventricular depolarization Interval between ventricular depolarization and repolarization Duration < 0.12 seconds seconds seconds Measure from end of QRS (J-point) to Height < 2.5 mm Measure start of P wave to start of QRS Shape Smooth Prolonged indicates a conduction block Orientation Positive in Leads I,II,aVF, V4 Negative in avr Shortened indicates accelerated conduction or junctional in origin Q- First negative deflection R- First positive deflection S- Negative deflection after R wave beginning of T wave In relation to isoelectric line: Depression/Negative indicates ischemia Elevation/Positive indicates injury
9
10 = Electrical current flowing toward a positive electrode produces an upward deflection of the QRS
11 Electrical current flowing away from a positive electrode produces a downward deflection of the QRS
12 Electrical current flowing perpendicular to a positive electrode produces a biphasic QRS

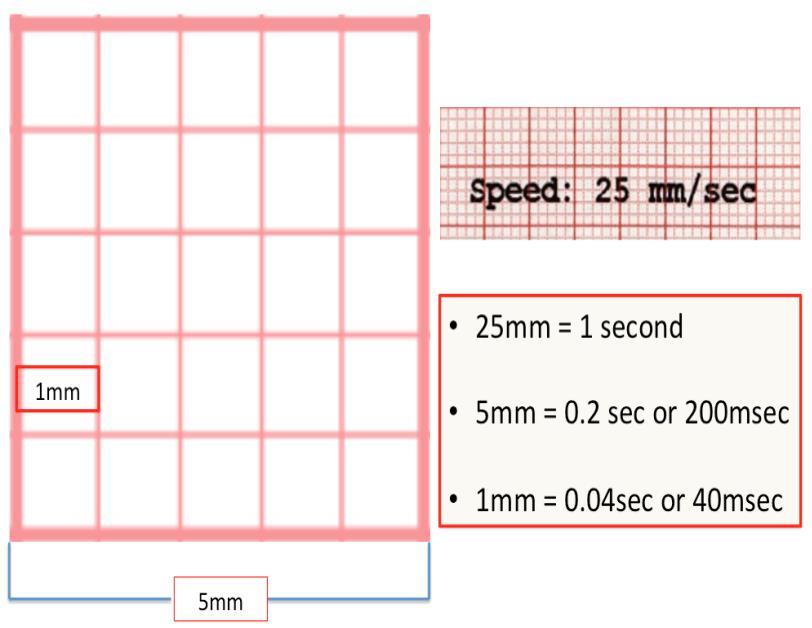

13 ECG Paper Speed Amplitude
14 Systematic Approach to Interpretation General Impression/Anything that sticks out? Rate, intervals & rhythm Axis P waves & QRS complexes Ischemia or infarction Any other unusual findings Putting it all together for the patient
15 Is a diagrammatic way to show strength and direction of electrical impulse Indicates the direction of the depolarization in time They add up when flowing in the same direction If at an angle they add or subtract energy Vector

16 Vectors & Axis
17 Activation of the Ventricle Vector #1 Septum depolarizes Left to Right Successive Vectors Progressive depolarization of the ventricles Begins in endocardium and spreads to epicardium What ventricle produces more force??
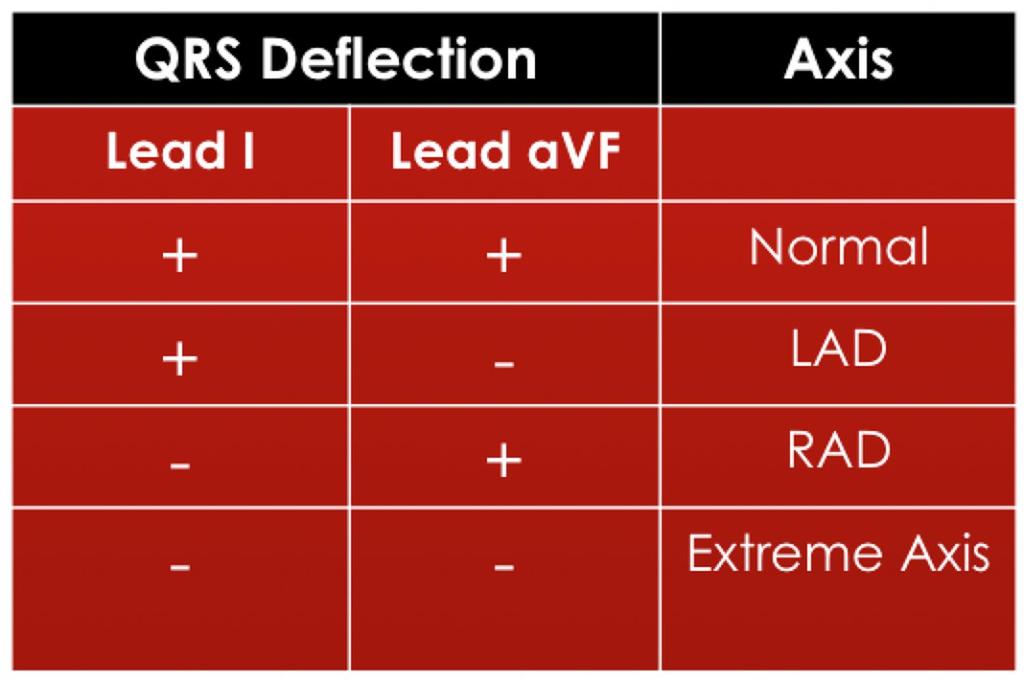
18 Is the mean direction of the cardiac impulse during ventricular depolarization Normal axis is -30 degree to +90 degree. Clinical use of Axis

19 Axis Deviation
20
21

22

23
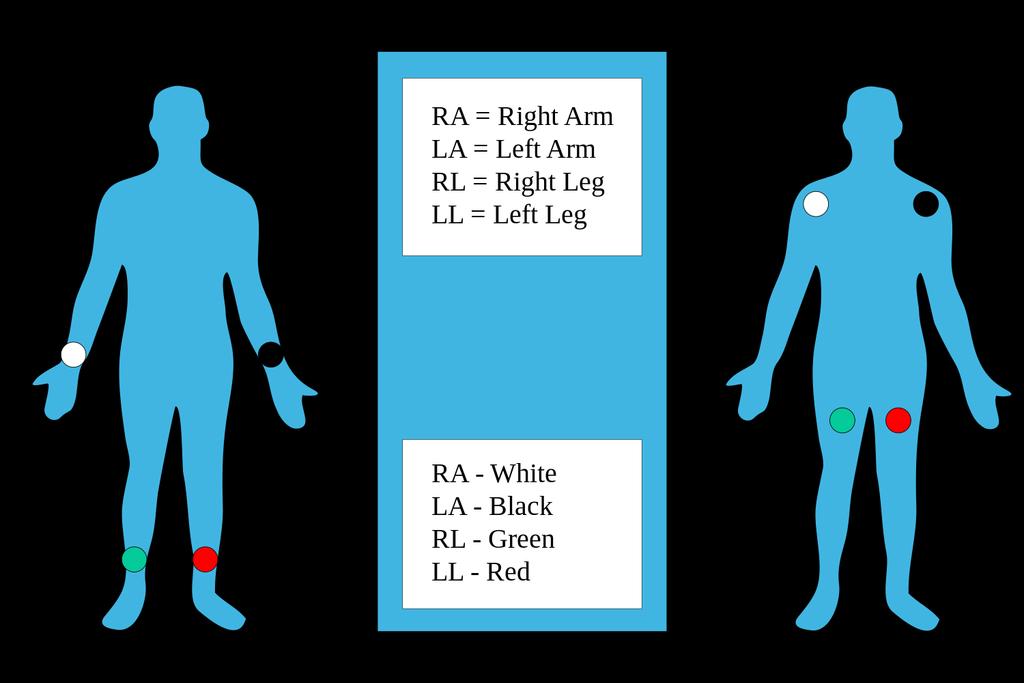
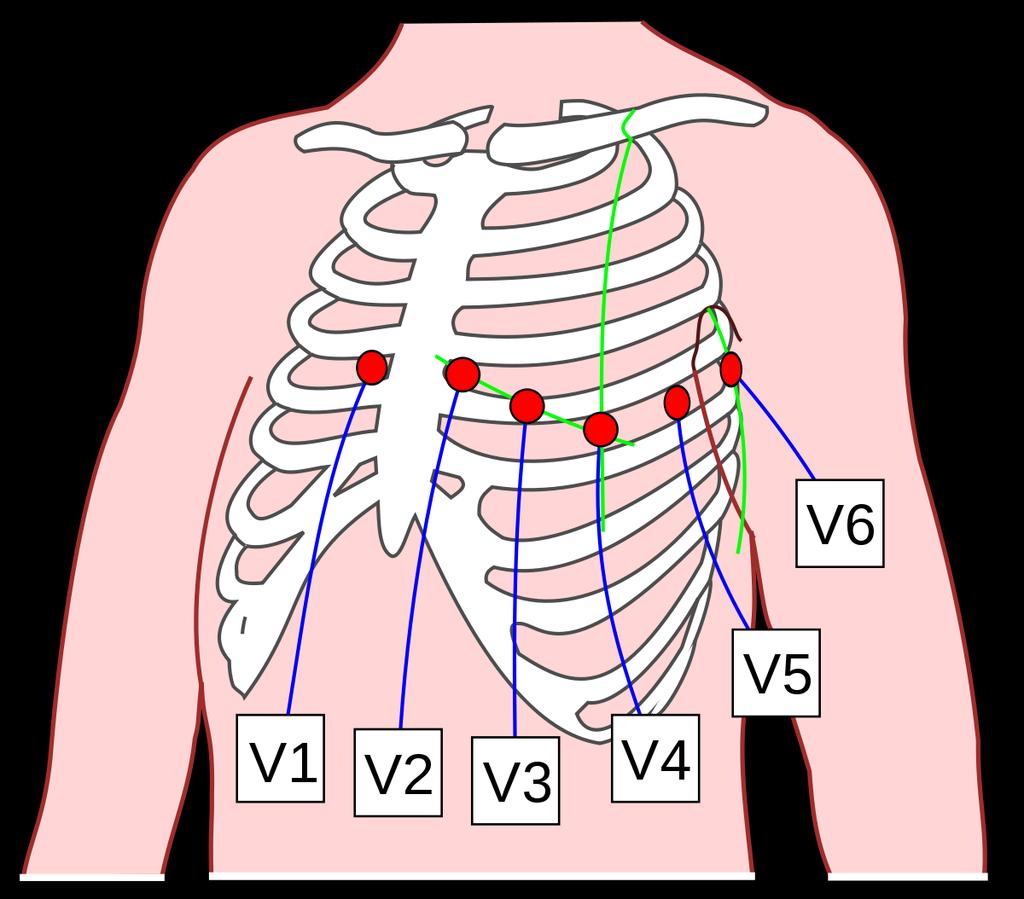
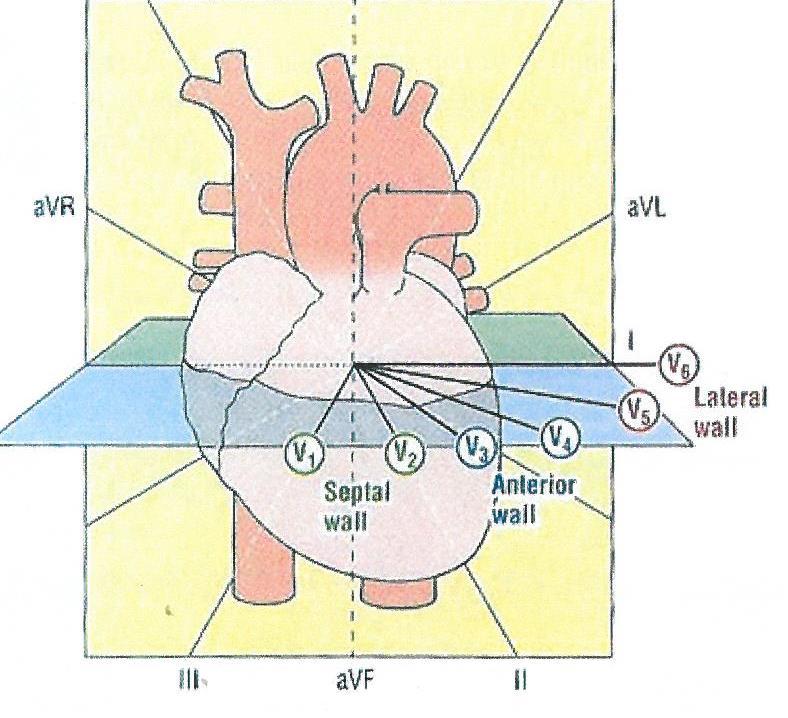
24 The Normal 12 Lead Ten actual leads are placed on the patient: 3 limb leads (Leads I,II,III; AVR,AVL,AVF) 1 ground lead (right leg lead) 6 chest or precordial leads (V 1 V 2, V 3, V 4, V 5, V 6 )

25 Review of Lead Placement & Waveform Production
26 The 12 Lead EKG 12 angles or pictures of the electrical activity of the heart 6 Limb Leads 6 Chest or Pre-cordial Leads I II III AVR AVL AVF V1 V2 V3 V4 V5 V6
27

28 Bipolar and Unipolar Leads Bipolar: LEAD 1 LEAD 2 LEAD 3 -Rt arm & +Lt arm -Rt arm & + Lt leg -Rt arm & + Lt leg Unipolar AVR Rt arm AVL Lt arm AVF Lt leg Chest Leads / V Leads
29 Lead I Energy flows toward the positive electrode of lead I, resulting in an upward deflection of the QRS. Bipolar Limb Lead Camera(+) is on Left shoulder looking toward the Right Shoulder Looks at high lateral wall of LV What coronary artery supplies this area of the heart? Positive/upright P QRS T
30 Lead II Mean vector flows directly at the positive lead II electrode, this lead usually has the most upright QRS complexes and the most prominent P waves of the entire 12-lead ECG. Bipolar Limb Lead Camera(+) is on Left leg looking toward the Right Shoulder Looks at inferior wall of LV What coronary artery supplies this area of the heart? Positive/upright P QRS T
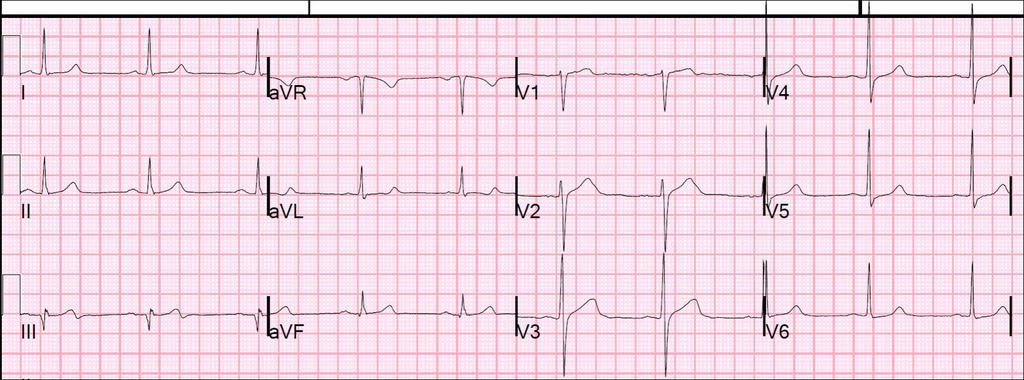
31 Lead III Mean vector flow approaches lead III downward from the right, again producing an upward QRS deflection. Bipolar Limb Lead Camera(+) is on Left leg looking toward the Left Shoulder Views inferior wall of LV Supplied by right coronary artery-rca Positive but usually less positive and can be biphasic Why is the QRS biphasic?
32 Its positive monitoring electrode is located on the right arm and looks downward and to the left. Augmented Voltage Right Arm Camera(+) is on Right Shoulder looking somewhere between the Left Shoulder and Left leg Mean vector moves away from avr. What will the complexes look like? Not typically a diagnostic lead
33 Positive electrode on the left arm and looks to the right and downward toward to the center of the heart Augmented Voltage Left Arm Looks at lateral wall of LV Supplied by circumflex artery - CX All complexes should be positive
34 Positive monitoring lead on the left leg and looks straight up to the center of the chest. Augmented Voltage (left) Foot Looks at inferior wall of LV Supplied by right coronary artery RCA All complexes should be positive
35
36
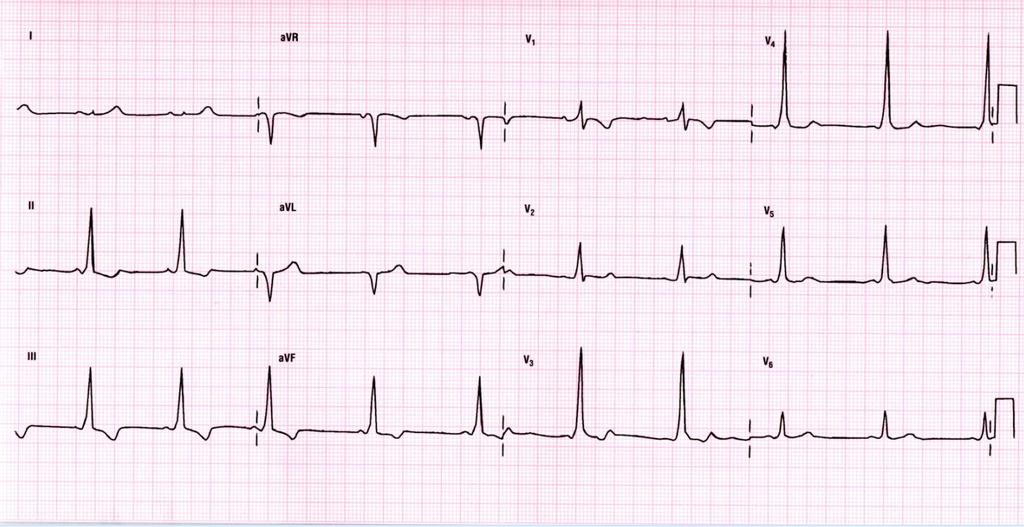
37 R Wave Progression Should see a progression or increase in R wave amplitude from negative to positive in leads V 1 to V 4 - V 1 - R wave is generally smallest or most negative - V 4 - R wave is typically the tallest or most positive Lack of R wave progression may be related to : Disease state, CAD, Septal wall MI, breast tissue, poor lead placement, rotated heart, obesity, COPD

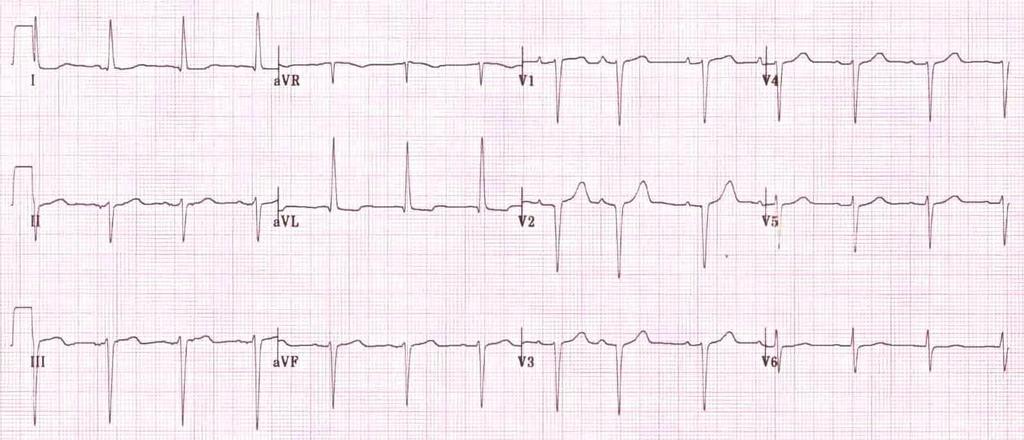
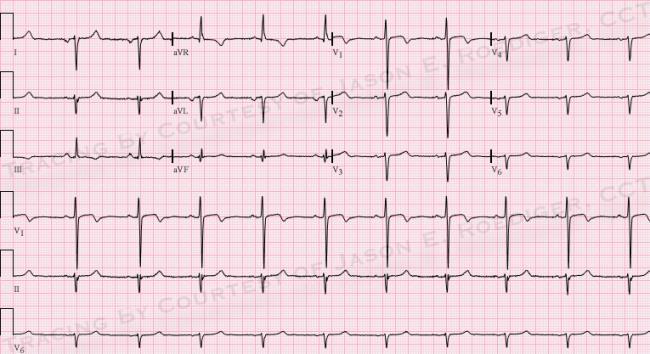
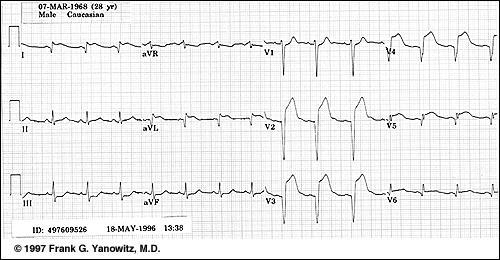
38 Normal EKG
39
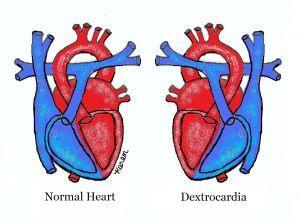
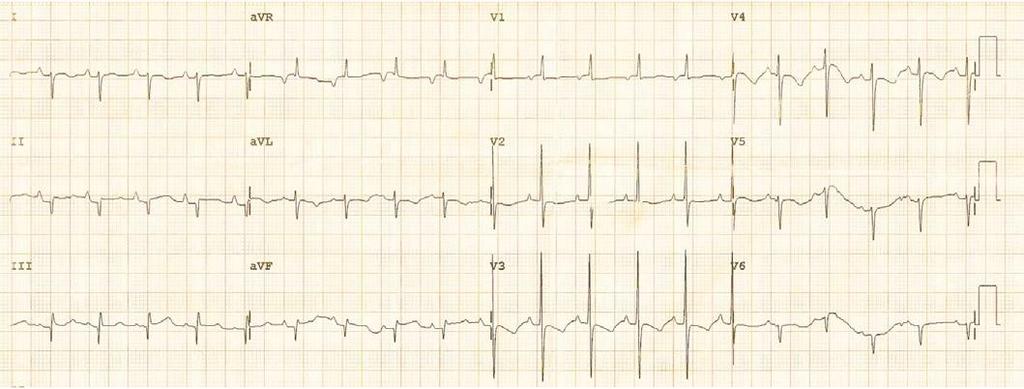
40 Dextrocardia
41 Systematic Approach to Interpretation General Impression/Anything that sticks out? Rate, intervals & rhythm Axis P waves & QRS complexes Ischemia or infarction Any other unusual findings Putting it all together for the patient
42 Smooth Less than 0.12 wide Less than 2.5 tall Positive in what leads Atrial Enlargement
43
44
45 What about that QRS Big ventricles = big vectors = big QRS s Infarcted areas are electrically inert, therefore: see smaller complexes or see unopposed vectors from area opposite the infarct site Pericardial effusion, excess body fat: see smaller complexes
46 QRS Amplitude & Width Limb leads: < 5mm is abnormal Precordial: < 10mm is abnormal QRS width > 0.10 secs is abnormal Causes - ventricular paced, BBB
47
48 Examples of QRS Complexes

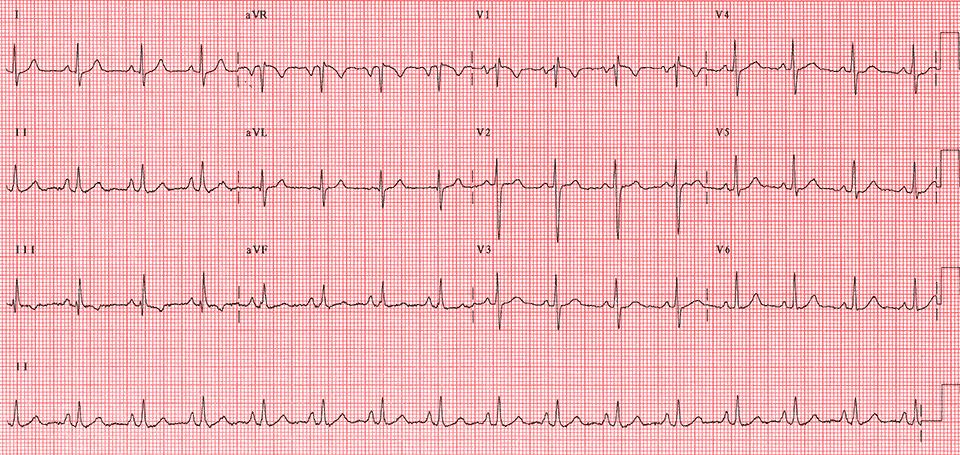
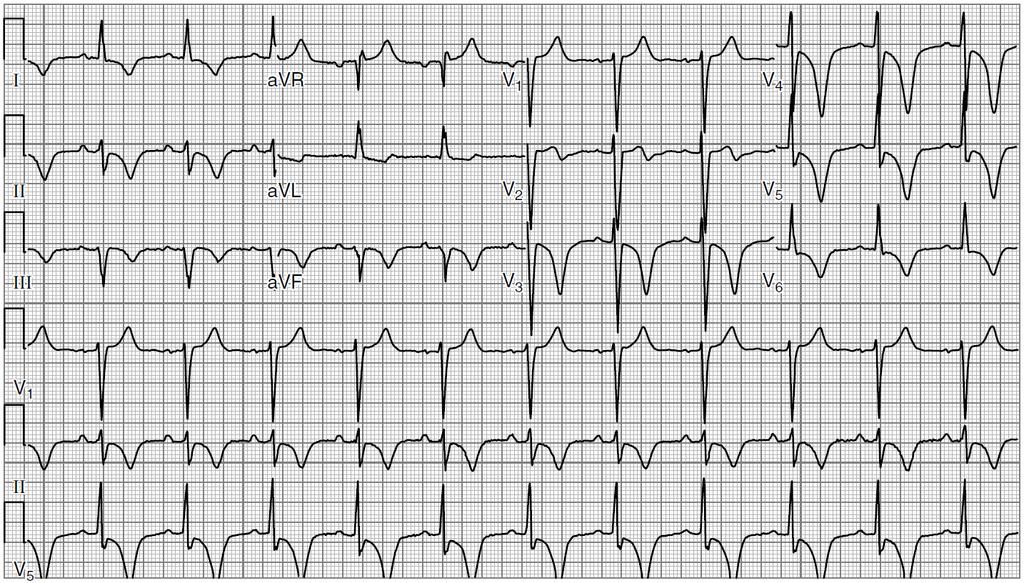
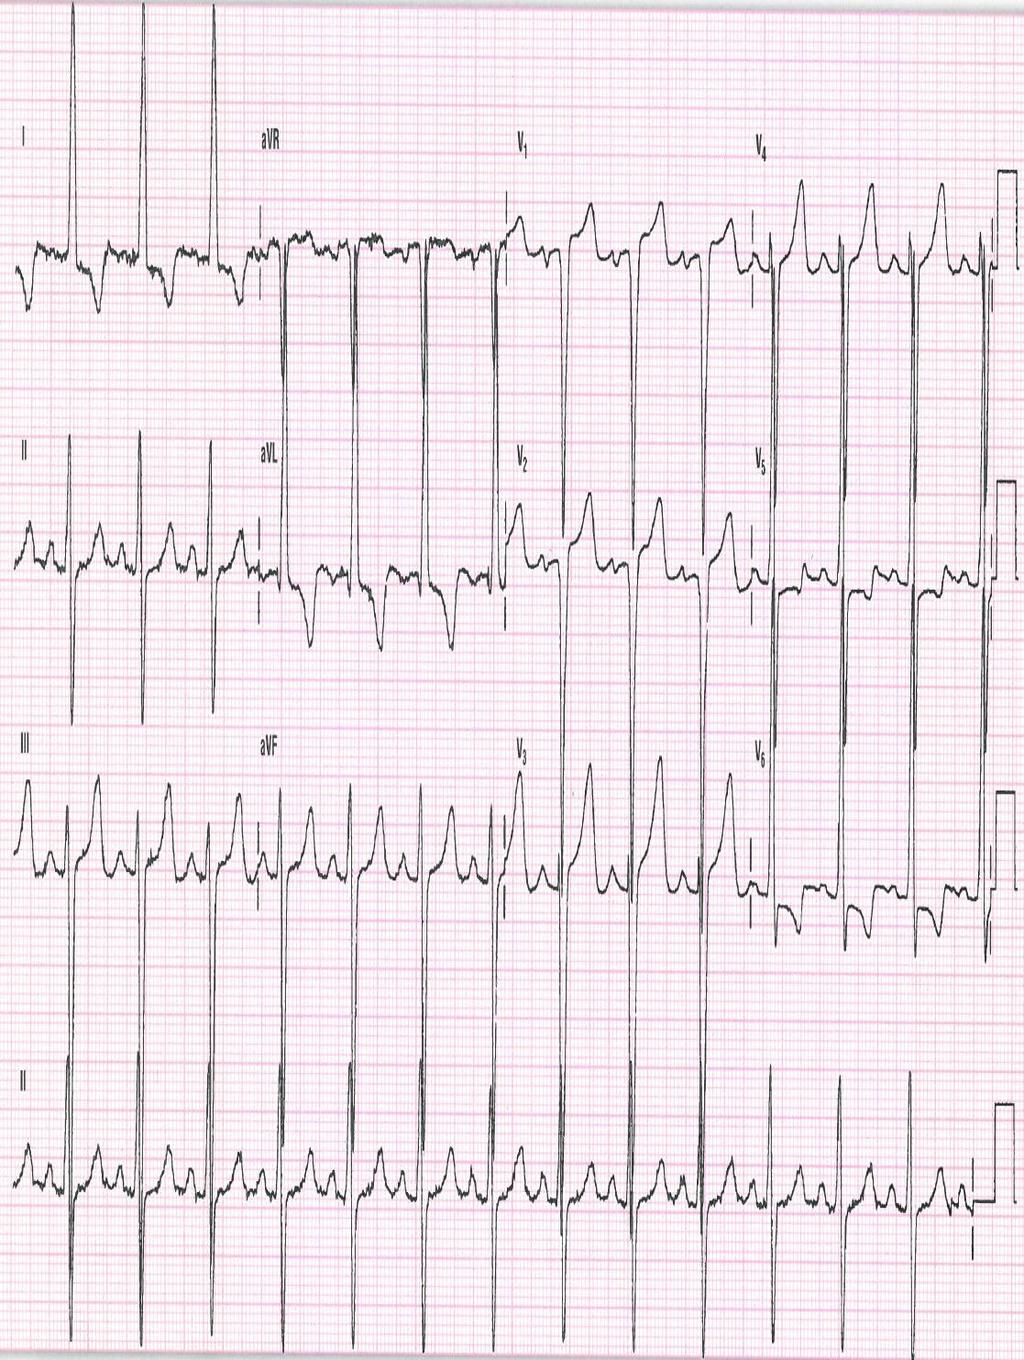
49 Left Ventricular Hypertrophy
50 Ventricular Hypertrophy Depth of S wave in V1 or V2 (whichever is deeper) to R wave in V5 or V6 (tallest) > 35 mm The R wave in lead avf is > 20 mm LVH Any precordial lead > 45 mm The R wave in lead I is > 12mm The R wave in avl is > 11mm
51
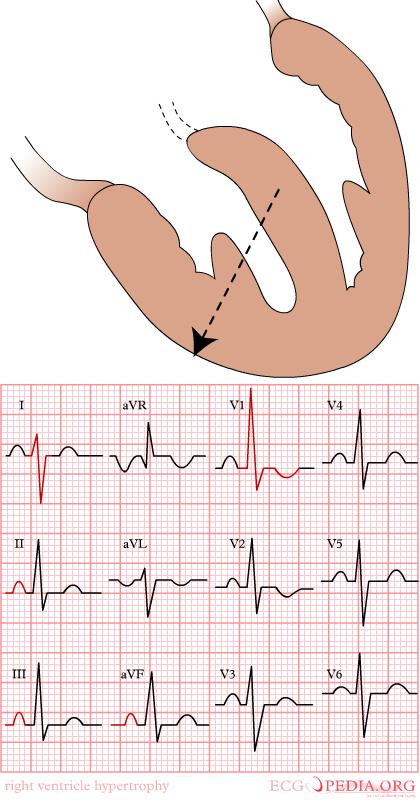
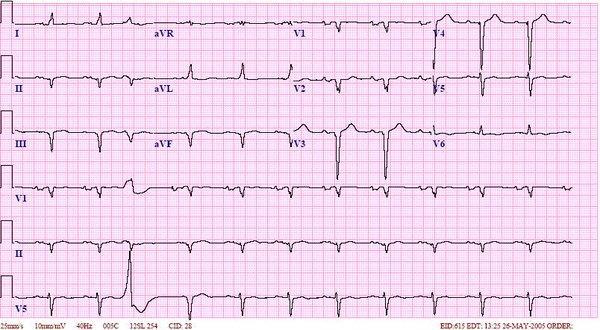
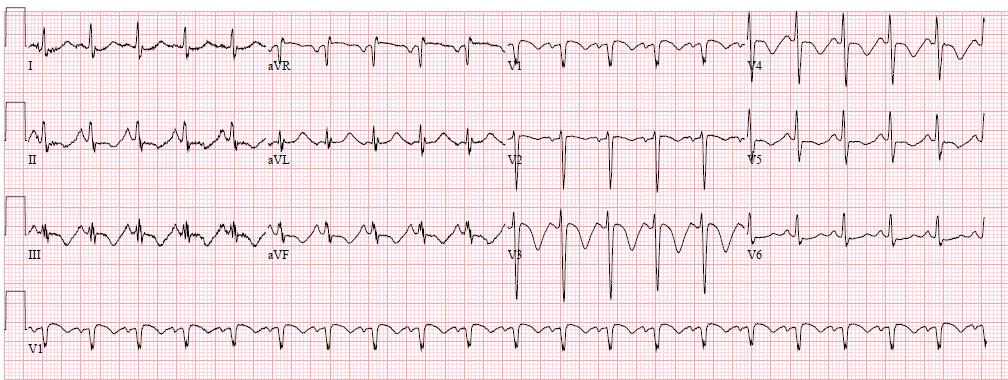
52 RVH


53 Ventricular Hypertrophy R:S ratio is > 10 mm in V1 R V R:S ratio is > 10 mm in V2 H
54
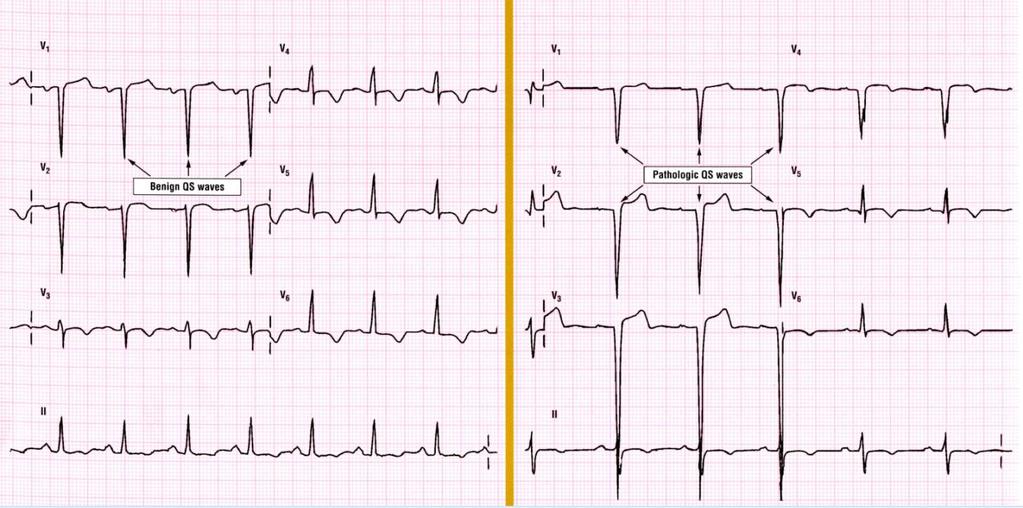
55 Normal <.04 Less than a small box Seen in Leads I, III, AvL, V5 & V6 Septal Q waves in Lead I and avl Physiological Q Wave
56 Pathological Q Wave Height is 1/3 the size of entire QRS complex Width is one square or greater than 0.04 seconds in duration Damage from old infarcts cause Q waves that last a lifetime.
57
58
59
60
61
62
63
64
65

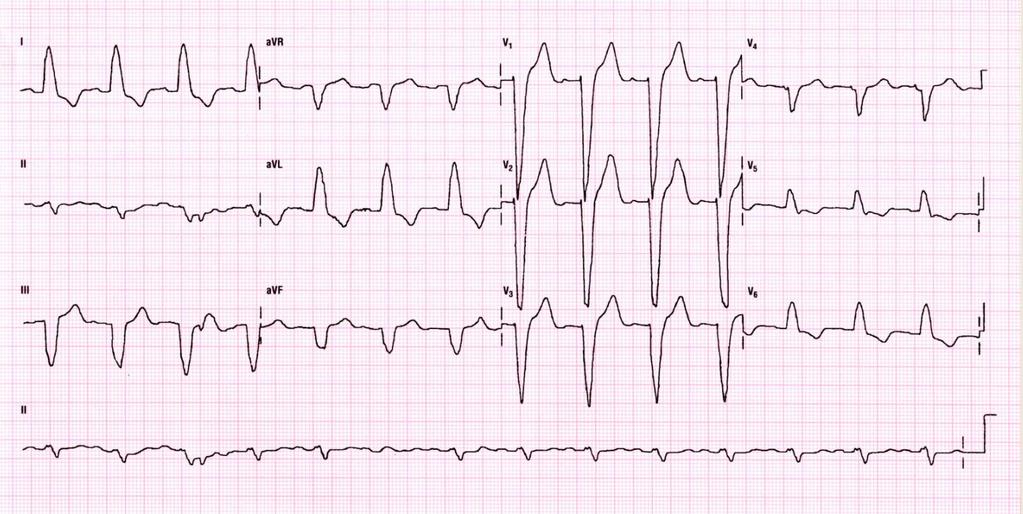
66 This Photo by Unknown Author is licensed under CC BY-NC QRS
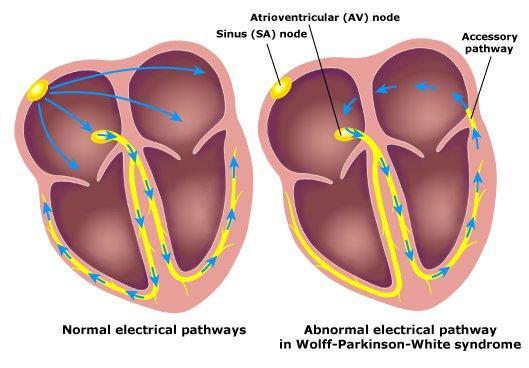
67 WPW
68
69 PR interval <.12 Delta wave QRS >.110 ms
70
71
72
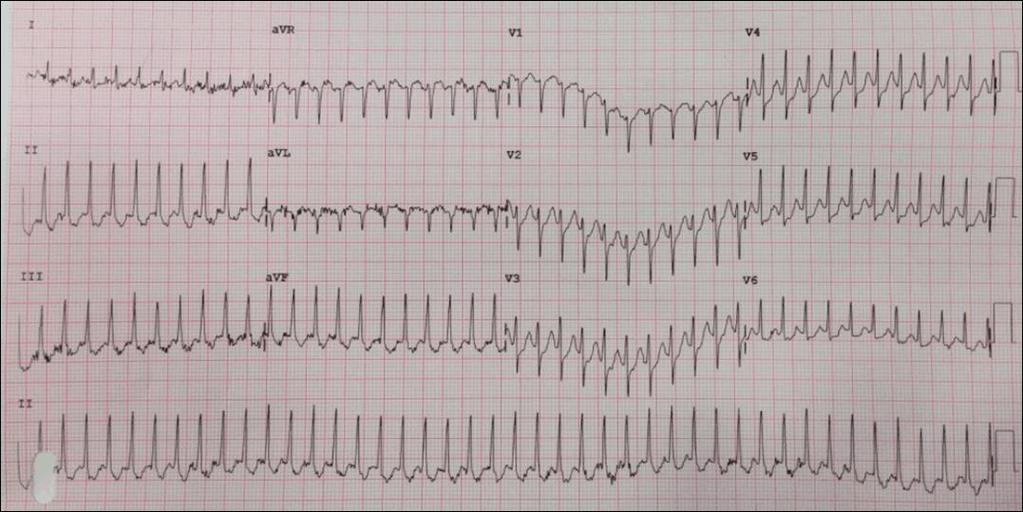
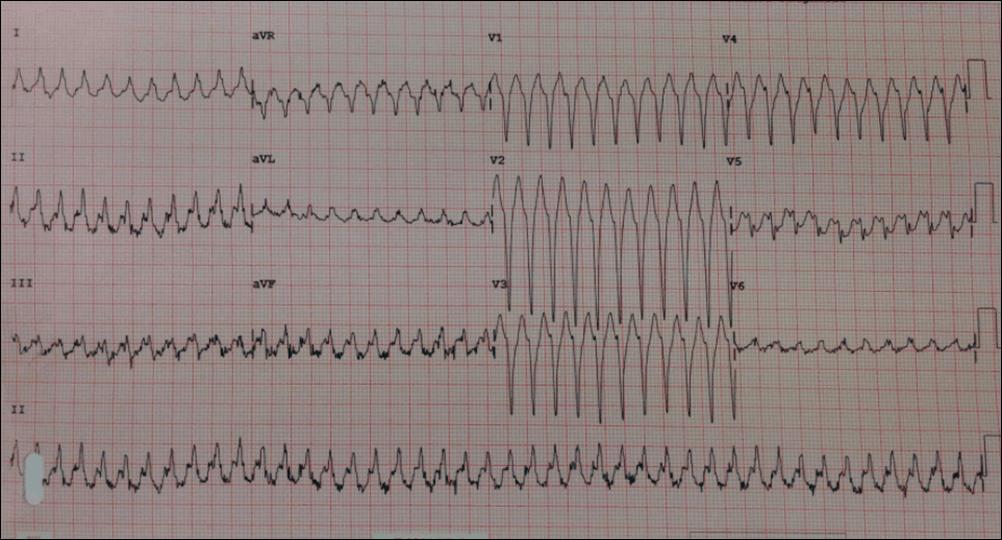
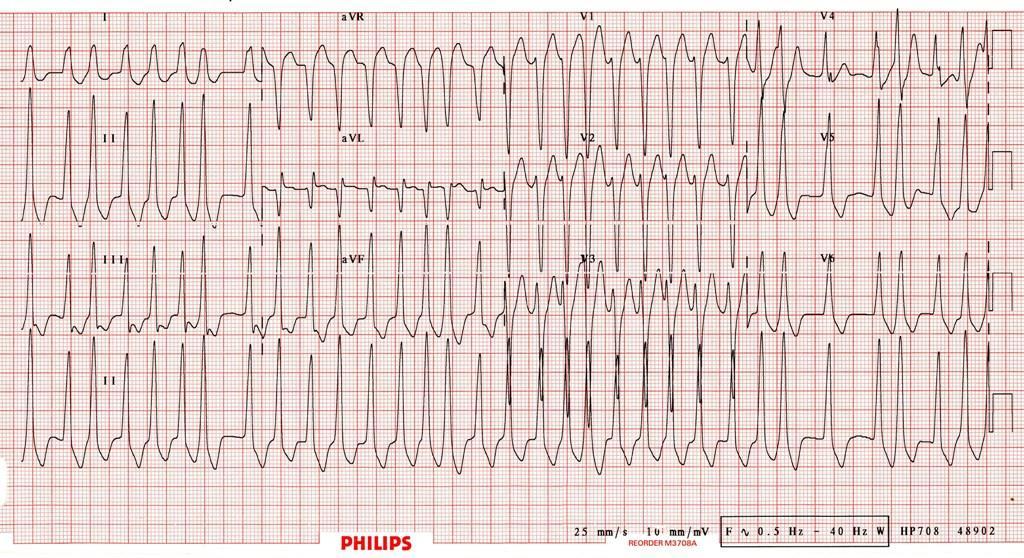
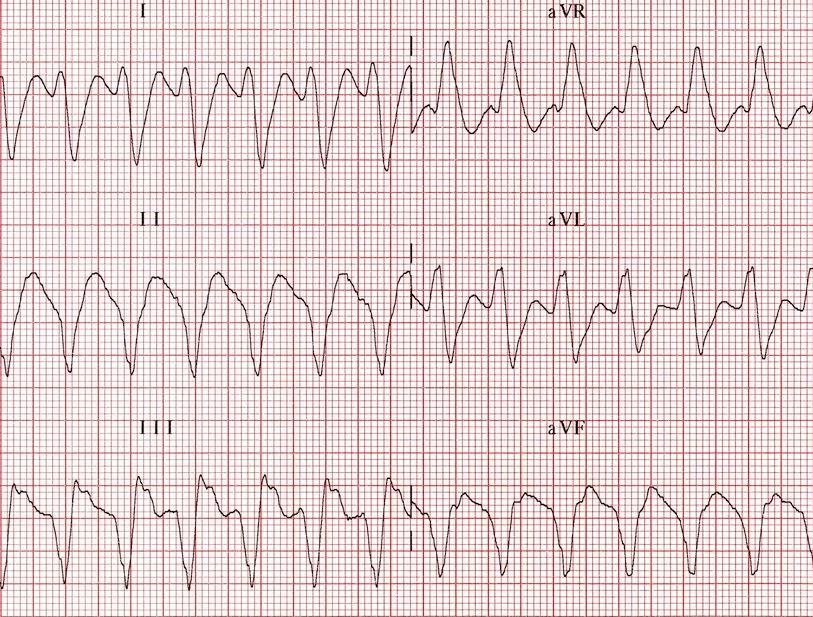
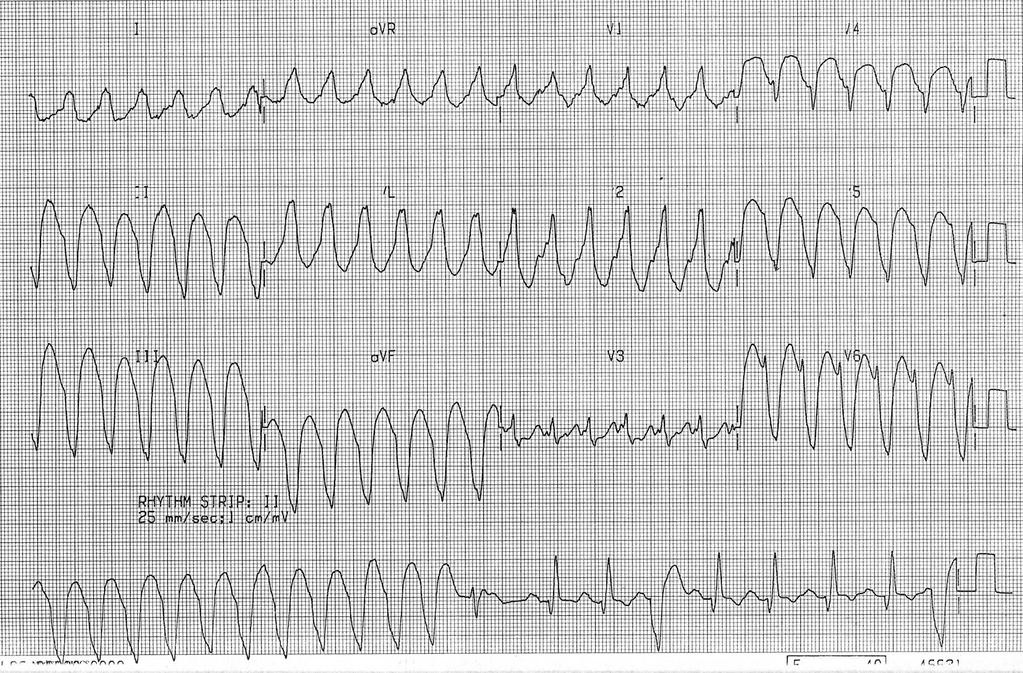
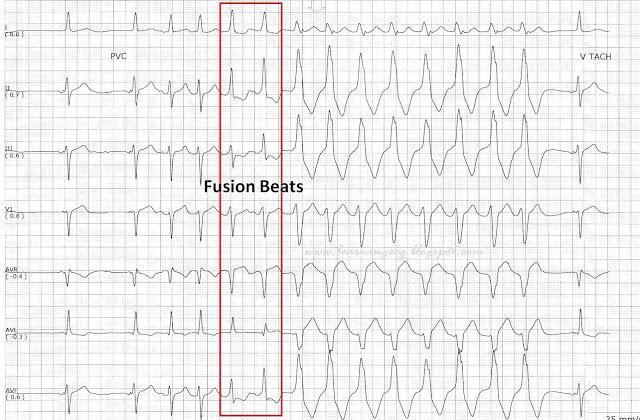
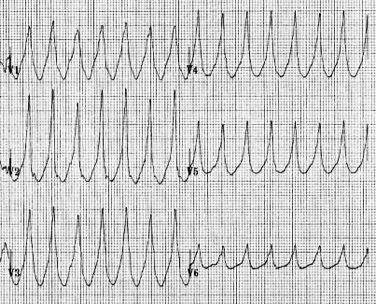
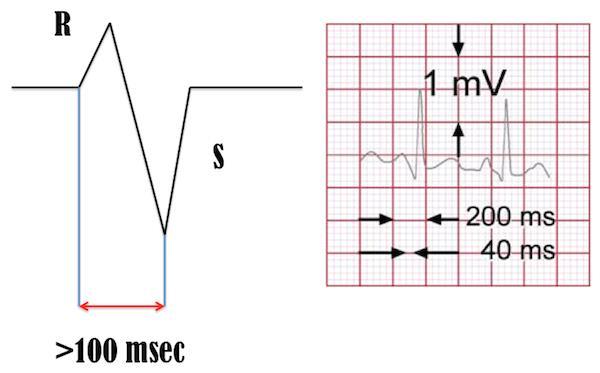
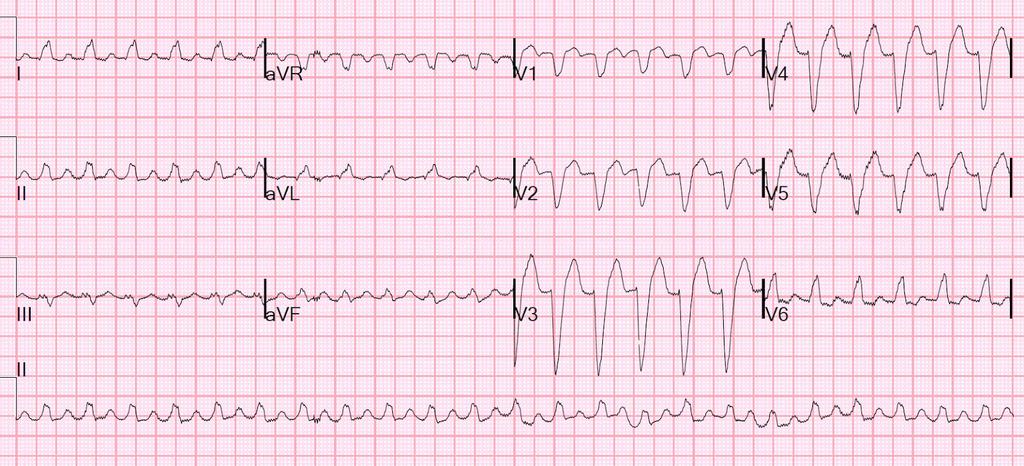
73 Wide Complex Tachycardia vs. V-tach Complexes > 160 ms Absence of RBBB or LBBB morphology Extreme axis deviation: Negative in I + avf AV dissociation Capture beats Fusion beats Positive or negative concordance in precordial leads with no RS seen Brugada s sign- Onset of QRS to nadir of S wave >100ms Josephson s sign Notching near the nadir of the S-wave RSR complexes with a taller left rabbit ear.
74
75
76
77
78
79
80
81
82 Systematic Approach to Interpretation General Impression/Anything that sticks out? Rate, intervals & rhythm Axis P waves & QRS complexes Ischemia or infarction Any other unusual findings Putting it all together for the patient
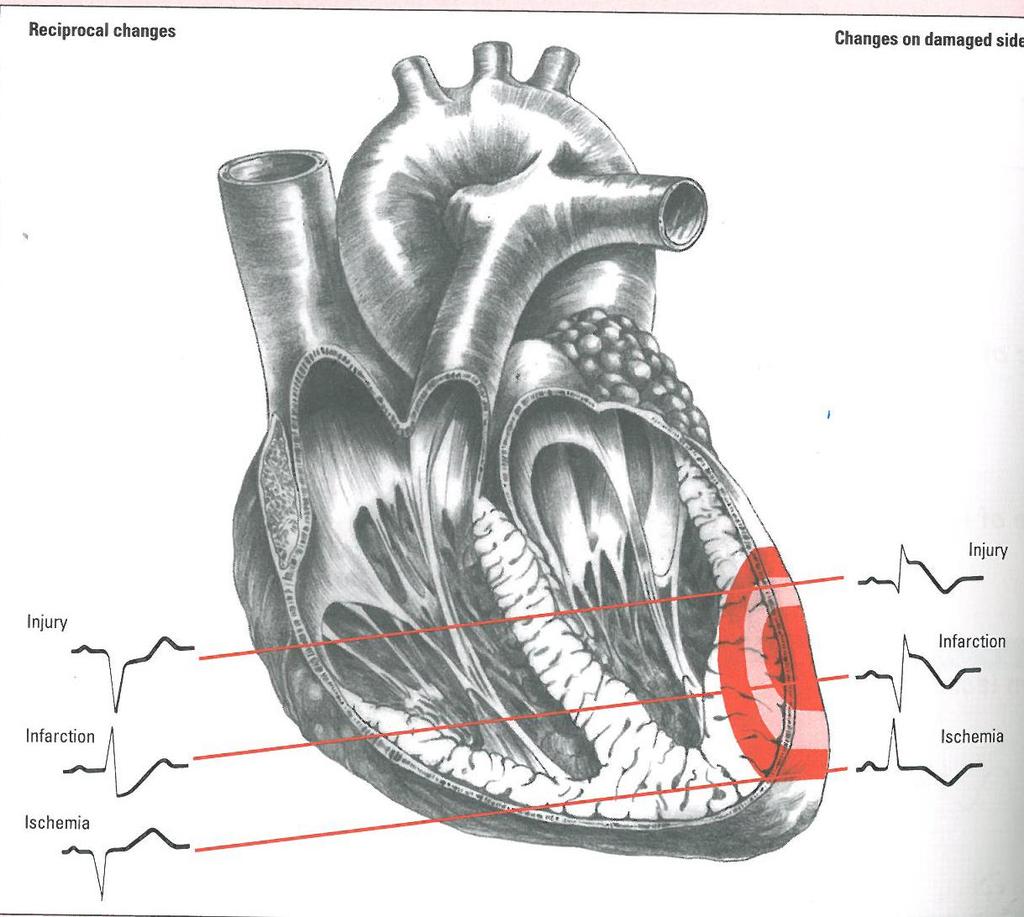
83 ST Segment ST Segment: Measured from the J point to the T wave ST should be isoelectric ST depression & T wave in opposite direction from what is normal, usually indicates myocardial ischemia
84
85 ST Depression = Ischemia St depression 0.5mm in 2 or more contiguous leads Inverted, symmetrical T waves T wave deflection is opposite from QRS T wave inversion is usually in same leads that demonstrates signs of acute infarction
86
87 ST Segment cont d ST Depression can also be related to: Digoxin Toxicity Pulmonary Embolism Ventricular Hypertrophy Left Bundle Branch Block ST elevation with/without T wave changes believe it to be associated with myocardial injury
88 ST Elevation = Current Injury Depicts current myocardial injury If elevated >1mm in two or more contiguous leads suspect acute injury > 2mm of ST elevation in precordial leads Can see reciprocal ST depression in other leads ST elevation with/ without T wave changes believe it to be associated with myocardial injury
.")
89 Sgarbosa s Criteria Concordant ST elevation > 1mm in leads with a positive QRS complex (score 5) Concordant ST depression > 1 mm in V1- V3 (score 3) Sgarbossa s Criteria Excessively discordant ST elevation > 5 mm in leads with a negative QRS complex (score 2). A total score of 3 is reported to have a specificity of 90% for diagnosing myocardial infarction.

90 ST segments with LBBB
91
92
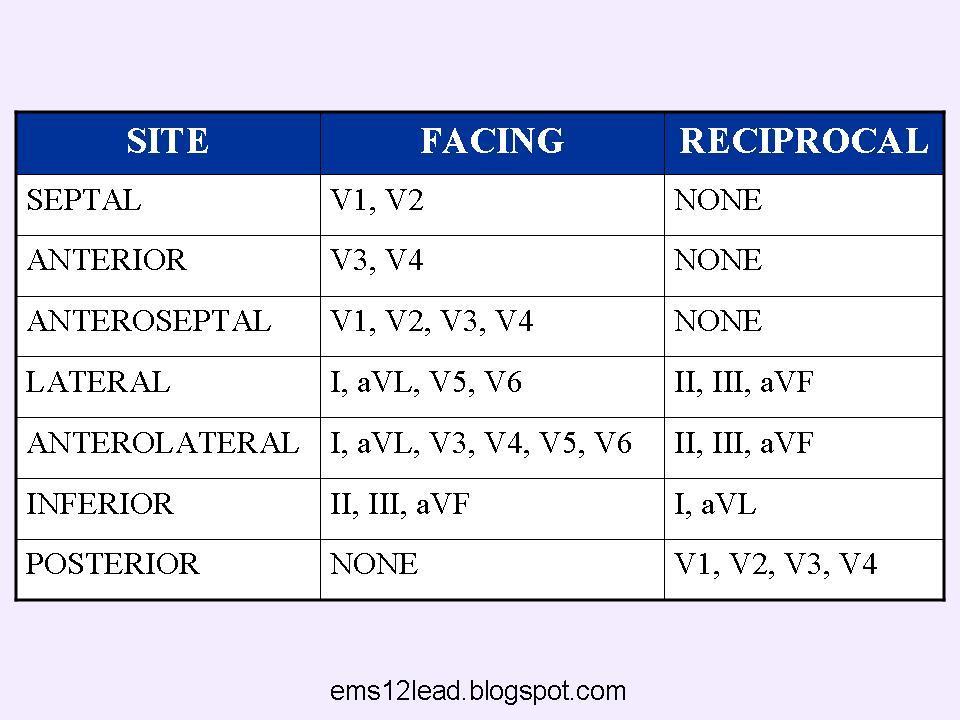
93 Left Ventricle Lead Orientation Wall of LV Leads Artery Inferior II, III,AVF RCA Anterior (extensive) V 1-6, I, AVL LM Anterior-Septal V 1-4 LAD Lateral V 5-6, I, AVL Cx Posterior V 1 & V 2 (mirror image) RCA
94 Causes for ST elevation Pericarditis Coronary Vasospasm LBBB LVH Paced rhythms Ventricular aneurysm Elevated ICP Drug induced Myocardial Infarction


95 AMI Location Correlation I Lateral avr V 1 Septal V 4 Anterior II Inferior avl Lateral V 2 Septal V 5 Lateral III Inferior avf Inferior V 3 Anterior V 6 Lateral
96

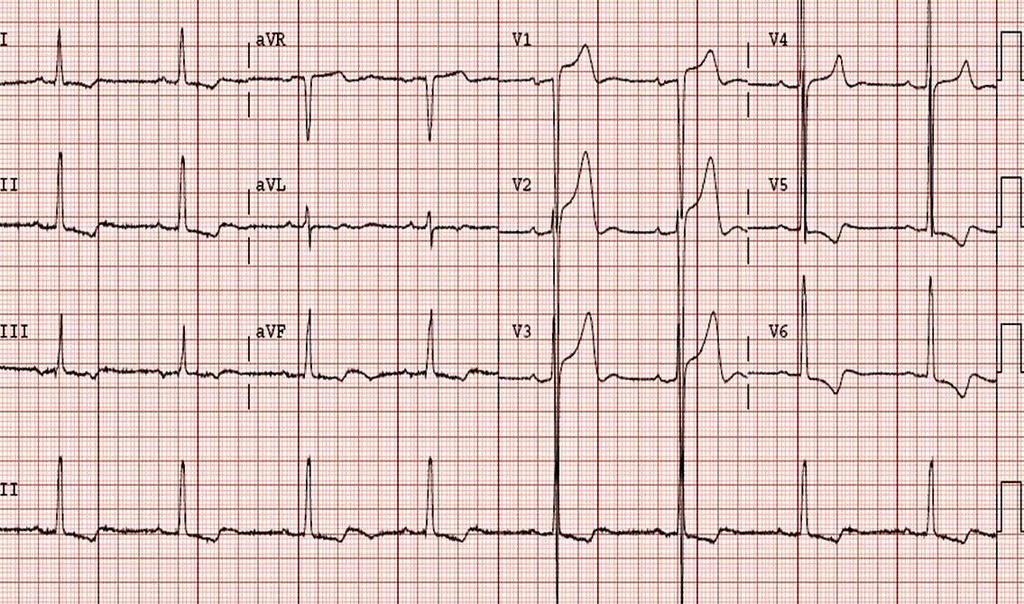
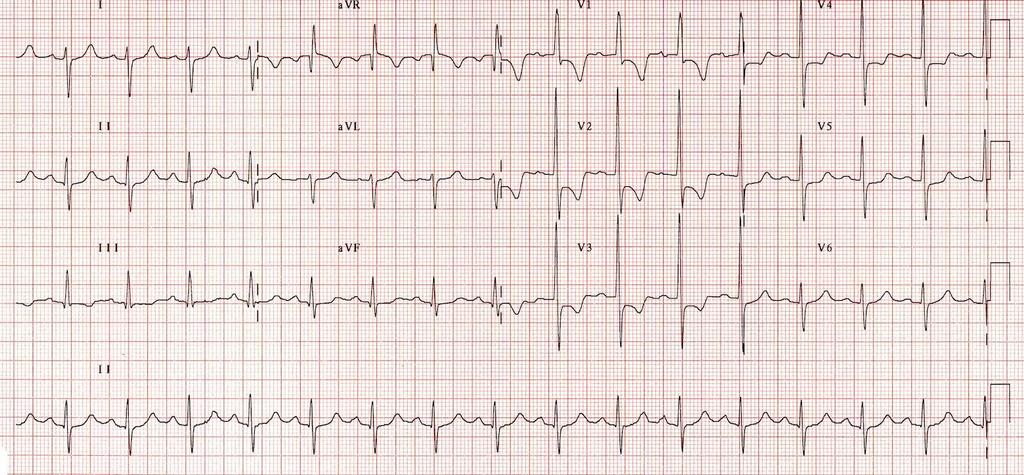
97 Acute Anterior MI
98 Extensive Anterior/Lateral MI

99 Acute Inferoposterior MI with RV Infarct
100 Systematic Approach to Interpretation General Impression/Anything that sticks out? Rate, intervals & rhythm Axis P waves & QRS complexes Ischemia or infarction Any other unusual findings Putting it all together for the patient
101 And those T waves.. Think shape, polarity and amplitude Shape: asymmetry is the norm! Polarity: can be positive, negative or in between. Amplitude: > 5 in Limb leads is abnormal > 10 mm in precordial leads is abnormal
102
103 T Waves Shape Polarity Size
104

105 Shortened down sloping ST segment Long PR interval T wave inversion
106
107
108


109 Electrolytes and the EKG

110 HYPERKALEMIA Peaked T waves Wide bizarre QRS Bradyarrhythmias AV blocks Junctional rhythms

111 HYPOKALEMIA Mild ST depression Decreased T wave amplitude Minimal prolong in QRS U wave

112 HYPOCALCEMIA Prolonged QTc ST segment depression At risk for torsades

113 HYPERCALCEMIA Short QT interval Decrease in ST segment duration Prolonged PR interval Flattened or inverted t waves for some people
114 HYPOMAGNESEMIA Prolonged QT Widening of QRS Peaked T waves

115 HYPERMAGNESEMIA Prolonged PR interval Prolonged QRS duration Prolonged QT interval
116
117
118
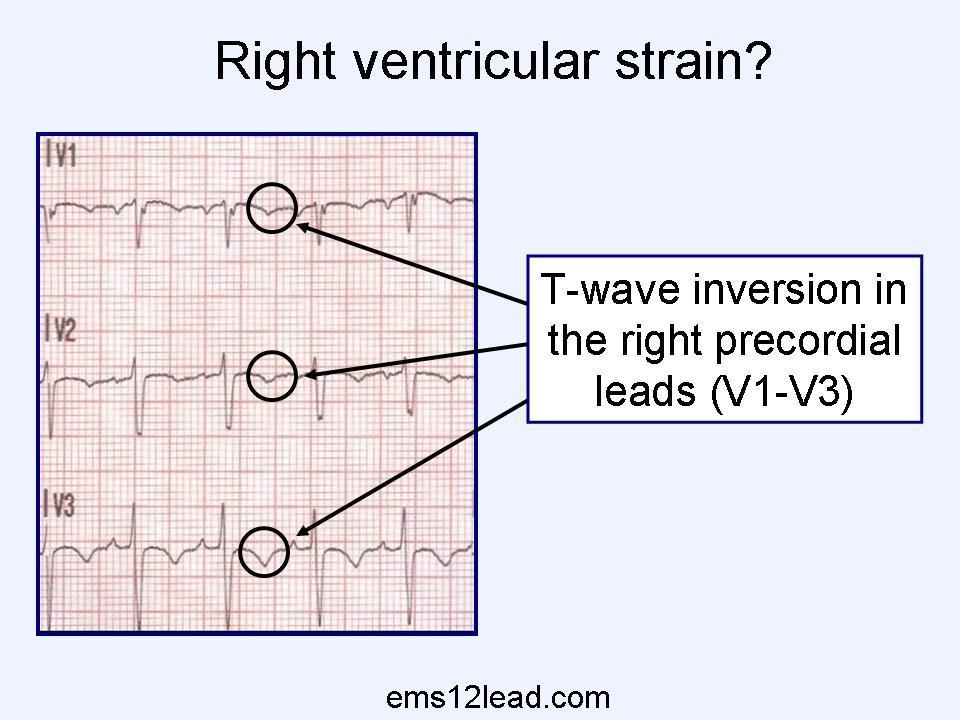
119 LVH with Strain RVH with Strain
120
121
122 Dubin, D. (2000) Rapid Interpretation of EKG s Cover Publishing Company Fort Meyers Florida Garcia, B. (2013). 12-Lead EKG The Art of Interpretation. Jones & Bartlett Burlington, MA. Phalaen, T. (1996) The 12-Lead ECG in Acute Myocardial Infarction Mosby LifelineLearning. Phalen, T., Aehlert, B. (2006) The 12-Lead ECG in Acute Coronary Syndromes Elsevier Mosb St. Louis, Mo Thaler, M. (2012) The Only EKG Book You ll Ever Need Lipincott & Williams & Wilkins Philadelphia, PA Reeder, G.s., Kennedy, H.L Criteria for the diagnosis of Acute Myocardial Infrarction UpToDate References
Electrocardiography for Healthcare Professionals. Chapter 14 Basic 12-Lead ECG Interpretation
 Electrocardiography for Healthcare Professionals Chapter 14 Basic 12-Lead ECG Interpretation 2012 The Companies, Inc. All rights reserved. Learning Outcomes 14.1 Discuss the anatomic views seen on a 12-lead
Relax and Learn At the Farm 2012
 Relax and Learn At the Farm 2012 Session 2: 12 Lead ECG Fundamentals 101 Cynthia Webner DNP, RN, CCNS, CCRN-CMC, CHFN Though for Today Mastery is not something that strikes in an instant, like a thunderbolt,
12 Lead ECG Skills: Building Confidence for Clinical Practice. Presented By: Cynthia Webner, BSN, RN, CCRN-CMC. Karen Marzlin, BSN, RN,CCRN-CMC
 12 Lead ECG Skills: Building Confidence for Clinical Practice NTI 2009 Preconference Session 803 Presented By: Karen Marzlin, BSN, RN,CCRN-CMC 1 12 Lead ECG Fundamentals: The Starting Place for Linking
also aid the clinician in recognizing both the obvious and subtle abnormalities that may help guide therapy.
 Karen Lieberman, MS, CRNP f the many diagnostic tools used to screen for and evaluate cardiac abnormalities, the 12-lead electrocardiogram (ECG) is among the most basic. This inexpensive and noninvasive
12 Lead ECG Interpretation: Color Coding for MI s
 12 Lead ECG Interpretation: Color Coding for MI s Anna E. Story, RN, MS Director, Continuing Professional Education Critical Care Nurse Online Instructional Designer 2004 Anna Story 1 Objectives review
By the end of this lecture, you will be able to: Understand the 12 lead ECG in relation to the coronary circulation and myocardium Perform an ECG
 By the end of this lecture, you will be able to: Understand the 12 lead ECG in relation to the coronary circulation and myocardium Perform an ECG recording Identify the ECG changes that occur in the presence
ECG CONVENTIONS AND INTERVALS
 1 ECG Waveforms and Intervals ECG waveforms labeled alphabetically P wave== represents atrial depolarization QRS complex=ventricular depolarization ST-T-U complex (ST segment, T wave, and U wave)== V repolarization.
12-Lead ECG Interpretation. Kathy Kuznar, RN, ANP
 12-Lead ECG Interpretation Kathy Kuznar, RN, ANP The 12-Lead ECG Objectives Identify the normal morphology and features of the 12- lead ECG. Perform systematic analysis of the 12-lead ECG. Recognize abnormalities
12 LEAD EKG BASICS. By: Steven Jones, NREMT P CLEMC
 12 LEAD EKG BASICS By: Steven Jones, NREMT P CLEMC ECG Review Waves and Intervals P wave: the sequential activation (depolarization) of the right and left atria QRS complex: right and left ventricular
Section V. Objectives
 Section V Landscape of an MI Objectives At the conclusion of this presentation the participant will be able to Outline a systematic approach to 12 lead ECG interpretation Demonstrate the process for determining
Basic electrocardiography reading. R3 lee wei-chieh
 Basic electrocardiography reading R3 lee wei-chieh The Normal Conduction System Lead Placement avf Limb Leads Precordial Leads Interpretation Rate Rhythm Interval Axis Chamber abnormality QRST change What
12 LEAD EKG & CXR INTERPRETATION.
 12 LEAD EKG & CXR INTERPRETATION www.cherylherrmann.com cherrmann@frontier.com Audio Product Recording discount for participants $60 Nonparticipants = $190 o Get CEs and manual https://catalog.vyne.com
Ekg pra pr c a tice D.HAMMOUDI.MD
 Ekg practice D.HAMMOUDI.MD Anatomy Revisited RCA (Right Coronary Artery) Right ventricle Inferior wall of LV Posterior wall of LV (75%) SA Node (60%) AV Node (>80%) LCA (Left Coronary Artery) Septal wall
Family Medicine for English language students of Medical University of Lodz ECG. Jakub Dorożyński
 Family Medicine for English language students of Medical University of Lodz ECG Jakub Dorożyński Parts of an ECG The standard ECG has 12 leads: six of them are considered limb leads because they are placed
All About STEMIs. Presented By: Brittney Urvand, RN, BSN, CCCC. Essentia Health Fargo Cardiovascular Program Manager.
 All About STEMIs Presented By: Brittney Urvand, RN, BSN, CCCC Essentia Health Fargo Cardiovascular Program Manager Updated 10/2/2018 None Disclosures Objectives Identify signs and symptoms of a heart attack
ECG Basics Sonia Samtani 7/2017 UCI Resident Lecture Series
 ECG Basics Sonia Samtani 7/2017 UCI Resident Lecture Series Agenda I. Introduction II.The Conduction System III.ECG Basics IV.Cardiac Emergencies V.Summary The Conduction System Lead Placement avf Precordial
Electrocardiogram ECG. Hilal Al Saffar FRCP FACC College of medicine,baghdad University
 Electrocardiogram ECG Hilal Al Saffar FRCP FACC College of medicine,baghdad University Tuesday 29 October 2013 ECG introduction Wednesday 30 October 2013 Abnormal ECG ( ischemia, chamber hypertrophy, heart
DR QAZI IMTIAZ RASOOL OBJECTIVES
 PRACTICAL ELECTROCARDIOGRAPHY DR QAZI IMTIAZ RASOOL OBJECTIVES Recording of electrical events in heart Established electrode pattern results in specific tracing pattern Health of heart i. e. Anatomical
ECG ABNORMALITIES D R. T AM A R A AL Q U D AH
 ECG ABNORMALITIES D R. T AM A R A AL Q U D AH When we interpret an ECG we compare it instantaneously with the normal ECG and normal variants stored in our memory; these memories are stored visually in
Pennsylvania Academy of Family Physicians Foundation & UPMC 43rd Refresher Course in Family Medicine CME Conference March 10-13, 2016
 Pennsylvania Academy of Family Physicians Foundation & UPMC 43rd Refresher Course in Family Medicine CME Conference March 10-13, 2016 Disclosures: EKG Workshop Louis Mancano, MD Speaker has no disclosures
Please check your answers with correct statements in answer pages after the ECG cases.
 ECG Cases ECG Case 1 Springer International Publishing AG, part of Springer Nature 2018 S. Okutucu, A. Oto, Interpreting ECGs in Clinical Practice, In Clinical Practice, https://doi.org/10.1007/978-3-319-90557-0
Acute Coronary Syndromes Unstable Angina Non ST segment Elevation MI (NSTEMI) ST segment Elevation MI (STEMI)
 ST segment Elevation MI (STEMI)") Leanna R. Miller, RN, MN, CCRN-CSC, PCCN-CMC, CEN, CNRN, CMSRN, NP Education Specialist LRM Consulting Nashville, TN Objectives Evaluate common abnormalities that mimic myocardial infarction. Identify
Leanna R. Miller, RN, MN, CCRN-CSC, PCCN-CMC, CEN, CNRN, CMSRN, NP Education Specialist LRM Consulting Nashville, TN Objectives Evaluate common abnormalities that mimic myocardial infarction. Identify
12 Lead EKG. The Basics
 12 Lead EKG The Basics Objectives Demonstrate proper 12 EKG lead placement Determine electrical axis Identify ST and T wave changes as they relate to myocardial ischemia Describe possible complications
The Fundamentals of 12 Lead EKG. ECG Recording. J Point. Reviewing the Cardiac Conductive System. Dr. E. Joe Sasin, MD Rusty Powers, NRP
 The Fundamentals of 12 Lead EKG Dr. E. Joe Sasin, MD Rusty Powers, NRP SA Node Intranodal Pathways AV Junction AV Fibers Bundle of His Septum Bundle Branches Purkinje System Reviewing the Cardiac Conductive
2017 EKG Workshop Advanced. Family Medicine Review Course Lou Mancano, MD, FAAFP Reading Health System Family and Community Medicine Reading, PA
 2017 EKG Workshop Advanced Family Medicine Review Course Lou Mancano, MD, FAAFP Reading Health System Family and Community Medicine Reading, PA Part II - Objective Describe a useful approach to interpreting
ECG (MCQs) In the fundamental rules of the ECG all the following are right EXCEP:
 In the fundamental rules of the ECG all the following are right EXCEP:") ECG (MCQs) 2010 1- In the fundamental rules of the ECG all the following are right EXCEP: a- It is a biphasic record of myocardial action potential fluctuations. b- Deflection record occurs only during
ECG (MCQs) 2010 1- In the fundamental rules of the ECG all the following are right EXCEP: a- It is a biphasic record of myocardial action potential fluctuations. b- Deflection record occurs only during
Introduction to Electrocardiography
 Introduction to Electrocardiography Class Objectives: Introduction to ECG monitoring Discuss principles of interpretation Identify the components and measurements of the ECG ECG analysis ECG Monitoring
12 Lead ECG Interpretation: The Basics and Beyond
 12 Lead ECG Interpretation: The Basics and Beyond Cindy Weston, DNP, RN, CCRN, CNS-CC, FNP-BC Assistant Professor Texas A&M University College of Nursing cweston@tamhsc.edu Objectives Review the basics
Myocardial Infarction. Reading Assignment (p66-78 in Outline )
") Myocardial Infarction Reading Assignment (p66-78 in Outline ) Objectives 1. Why do ST segments go up or down in ischemia? 2. STEMI locations and culprit vessels 3. Why 15-lead ECGs? 4. What s up with avr?
Myocardial Infarction Reading Assignment (p66-78 in Outline ) Objectives 1. Why do ST segments go up or down in ischemia? 2. STEMI locations and culprit vessels 3. Why 15-lead ECGs? 4. What s up with avr?
REtrive. REpeat. RElearn Design by. Test-Enhanced Learning based ECG practice E-book
 Test-Enhanced Learning Test-Enhanced Learning Test-Enhanced Learning Test-Enhanced Learning based ECG practice E-book REtrive REpeat RElearn Design by S I T T I N U N T H A N G J U I P E E R I Y A W A
ECG INTERPRETATION MANUAL
 Lancashire & South Cumbria Cardiac Network ECG INTERPRETATION MANUAL THE NORMAL ECG Lancashire And South Cumbria Cardiac Physiologist Training Manual THE NORMAL ECG E.C.G CHECKLIST 1) Name, Paper Speed,
3/4/2018. March Martina Frost, PA C Desert Cardiology. Electricity moving towards/away from electrode create downward/upward directions of waves
 March 2018 Martina Frost, PA C Desert Cardiology Electricity moving towards/away from electrode create downward/upward directions of waves Frontal view Limb leads: I, II, III, avl, avf, (avr) Horizontal
A few new tools for better detection and understanding of STEMIs in the field.
 A few new tools for better detection and understanding of STEMIs in the field. Let s talk, prep and placement. Try to shoot for quality, consistency and no artifact! (looking sometimes for 1 or 2 mm changes)
Chapter 2 Practical Approach
 Chapter 2 Practical Approach There are beginners in electrocardiogram (ECG) analysis who are fascinated by a special pattern (e.g., a bundle-branch block or a striking Q wave) and thereby overlook other
The Electrocardiogram part II. Dr. Adelina Vlad, MD PhD
 The Electrocardiogram part II Dr. Adelina Vlad, MD PhD Basic Interpretation of the ECG 1) Evaluate calibration 2) Calculate rate 3) Determine rhythm 4) Determine QRS axis 5) Measure intervals 6) Analyze
ECG Interpretation. Best to have a system to methodically evaluate ECG (from Dubin) * Rate * Rhythm * Axis * Intervals * Hypertrophy * Infarction
 * Rate * Rhythm * Axis * Intervals * Hypertrophy * Infarction") ECG to save Babies ECG Interpretation Best to have a system to methodically evaluate ECG (from Dubin) * Rate * Rhythm * Axis * Intervals * Hypertrophy * Infarction Electrical Activity in the heart 5 events
ECG to save Babies ECG Interpretation Best to have a system to methodically evaluate ECG (from Dubin) * Rate * Rhythm * Axis * Intervals * Hypertrophy * Infarction Electrical Activity in the heart 5 events
Acute Coronary Syndromes. Disclosures
 Acute Coronary Syndromes Disclosures I work for Virginia Garcia Memorial Health Center, Beaverton, OR. Jon Tardiff, BS, PA-C OHSU Clinical Assistant Professor And I am a medical editor for Jones & Bartlett
5- The normal electrocardiogram (ECG)
") 5- The (ECG) Introduction Electrocardiography is a process of recording electrical activities of heart muscle at skin surface. The electrical current spreads into the tissues surrounding the heart, a small
5- The (ECG) Introduction Electrocardiography is a process of recording electrical activities of heart muscle at skin surface. The electrical current spreads into the tissues surrounding the heart, a small
Preface: Wang s Viewpoints
 AHA/ACCF/HRS Recommendations for the Standardization and Interpretation of the Electrocardiogram: Part IV, Ischemia and Infarction Presented by: WANG, TZONG LUEN, MD, PhD, JM, FACC, FESC, FCAPSC Professor,
Electrical System Overview Electrocardiograms Action Potentials 12-Lead Positioning Values To Memorize Calculating Rates
 Electrocardiograms Electrical System Overview James Lamberg 2/ 74 Action Potentials 12-Lead Positioning 3/ 74 4/ 74 Values To Memorize Inherent Rates SA: 60 to 100 AV: 40 to 60 Ventricles: 20 to 40 Normal
This presentation will deal with the basics of ECG description as well as the physiological basics of
 Snímka 1 Electrocardiography basics This presentation will deal with the basics of ECG description as well as the physiological basics of Snímka 2 Lecture overview 1. Cardiac conduction system functional
ECG Interpretation Cat Williams, DVM DACVIM (Cardiology)
") ECG Interpretation Cat Williams, DVM DACVIM (Cardiology) Providing the best quality care and service for the patient, the client, and the referring veterinarian. GOAL: Reduce Anxiety about ECGs Back to
ECG Interpretation Cat Williams, DVM DACVIM (Cardiology) Providing the best quality care and service for the patient, the client, and the referring veterinarian. GOAL: Reduce Anxiety about ECGs Back to
EKG. Danil Hammoudi.MD
 EKG Danil Hammoudi.MD What is an EKG? The electrocardiogram (EKG) is a representation of the electrical events of the cardiac cycle. Each event has a distinctive waveform, the study of which can lead to
ELECTROCARDIOGRAPH. General. Heart Rate. Starship Children s Health Clinical Guideline
 General Heart Rate QRS Axis T Wave Axis PR Interval according to Heart Rate & Age P Wave Duration and Amplitude QRS Duration according to Age QT Interval R & S voltages according to Lead & Age R/S ratio
BASIC CONCEPT OF ECG
 BASIC CONCEPT OF ECG Electrocardiogram The electrocardiogram (ECG) is a recording of cardiac electrical activity. The electrical activity is readily detected by electrodes attached to the skin. After the
Electrocardiography Abnormalities (Arrhythmias) 7. Faisal I. Mohammed, MD, PhD
 7. Faisal I. Mohammed, MD, PhD") Electrocardiography Abnormalities (Arrhythmias) 7 Faisal I. Mohammed, MD, PhD 1 Causes of Cardiac Arrythmias Abnormal rhythmicity of the pacemaker Shift of pacemaker from sinus node Blocks at different
Electrocardiography Abnormalities (Arrhythmias) 7 Faisal I. Mohammed, MD, PhD 1 Causes of Cardiac Arrythmias Abnormal rhythmicity of the pacemaker Shift of pacemaker from sinus node Blocks at different
Conduction Problems / Arrhythmias. Conduction
 Conduction Problems / Arrhythmias Conduction Wolf-Parkinson White Syndrome (WPW) and Lown-Ganong-Levine (LGL): Atrial impulses bypass the AV node through an accessory pathway or bypass tract (bundle of
10 ECGs No Practitioner Can Afford to Miss. Objectives
 10 ECGs No Practitioner Can Afford to Miss Mary L. Dohrmann, MD Professor of Clinical Medicine Division of Cardiovascular Medicine University of Missouri School of Medicine No disclosures Objectives 1.
Determining Axis and Axis Deviation on an ECG
 Marquette University e-publications@marquette Physician Assistant Studies Faculty Research and Publications Health Sciences, College of 7-15-2010 Determining Axis and Axis Deviation on an ECG Patrick Loftis
Disclosures. STEMI:To Call or Not to Call. Disclosures 9/18/2017. Alternate Title: Hey Doc, If you re not doing anything Saturday Night
 STEMI:To Call or Not to Call Disclosures No financial disclosures September, 2017 Frederick James Trip Meine III MD, FACC, FSCAI Cape Fear Heart Associates, Wilmington, NC Disclosures Alternate Title:
General Introduction to ECG. Reading Assignment (p2-16 in PDF Outline )
") General Introduction to ECG Reading Assignment (p2-16 in PDF Outline ) Objectives 1. Practice the 5-step Method 2. Differential Diagnosis: R & L axis deviation 3. Differential Diagnosis: Poor R-wave progression
General Introduction to ECG Reading Assignment (p2-16 in PDF Outline ) Objectives 1. Practice the 5-step Method 2. Differential Diagnosis: R & L axis deviation 3. Differential Diagnosis: Poor R-wave progression
Introduction to ECG Gary Martin, M.D.
 Brief review of basic concepts Introduction to ECG Gary Martin, M.D. The electrical activity of the heart is caused by a sequence of rapid ionic movements across cell membranes resulting first in depolarization
Other 12-Lead ECG Findings
 Other 12-Lead ECG Findings Left Atrial Enlargement Left atrial enlargement is illustrated by increased P wave duration in lead II, top ECG, and by the prominent negative P terminal force in lead V1, bottom
12 Lead ECG Interpretation
 12 Lead ECG Interpretation Julie Zimmerman, MSN, RN, CNS, CCRN Significant increase in mortality for every 15 minutes of delay! N Engl J Med 2007;357:1631-1638 Who should get a 12-lead ECG? Also include
If the P wave > 0.12 sec( 3 mm) usually in any lead. Notched P wave usually in lead I,aVl may be lead II Negative terminal portion of P wave in V1, 1
 usually in any lead. Notched P wave usually in lead I,aVl may be lead II Negative terminal portion of P wave in V1, 1") If the P wave > 0.12 sec( 3 mm) usually in any lead. Notched P wave usually in lead I,aVl may be lead II Negative terminal portion of P wave in V1, 1 mm depth and 3 mm width( most specific) Since Mitral
If the P wave > 0.12 sec( 3 mm) usually in any lead. Notched P wave usually in lead I,aVl may be lead II Negative terminal portion of P wave in V1, 1 mm depth and 3 mm width( most specific) Since Mitral
Appendix D Output Code and Interpretation of Analysis
 Appendix D Output Code and Interpretation of Analysis 8 Arrhythmia Code No. Description 8002 Marked rhythm irregularity 8110 Sinus rhythm 8102 Sinus arrhythmia 8108 Marked sinus arrhythmia 8120 Sinus tachycardia
ECG Cases and Questions. Ashish Sadhu, MD, FHRS, FACC Electrophysiology/Cardiology
 ECG Cases and Questions Ashish Sadhu, MD, FHRS, FACC Electrophysiology/Cardiology 32 yo female Life Insurance Physical 56 yo male with chest pain Terminology Injury ST elevation Ischemia T wave inversion
Understanding the 12-lead ECG, part II
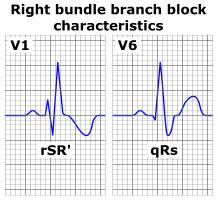
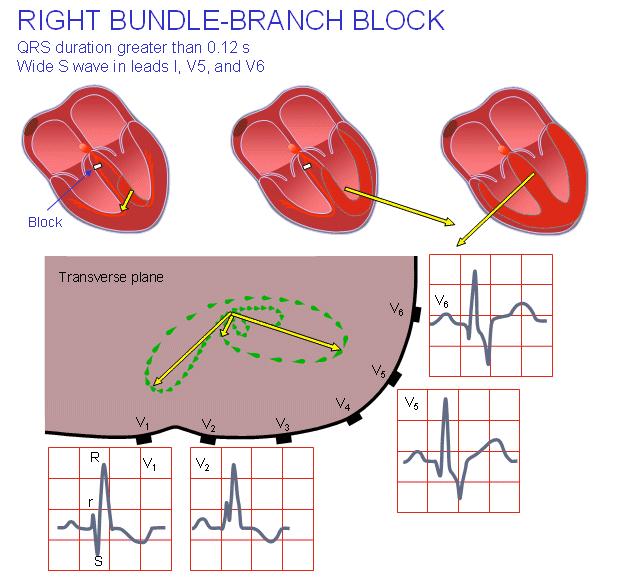
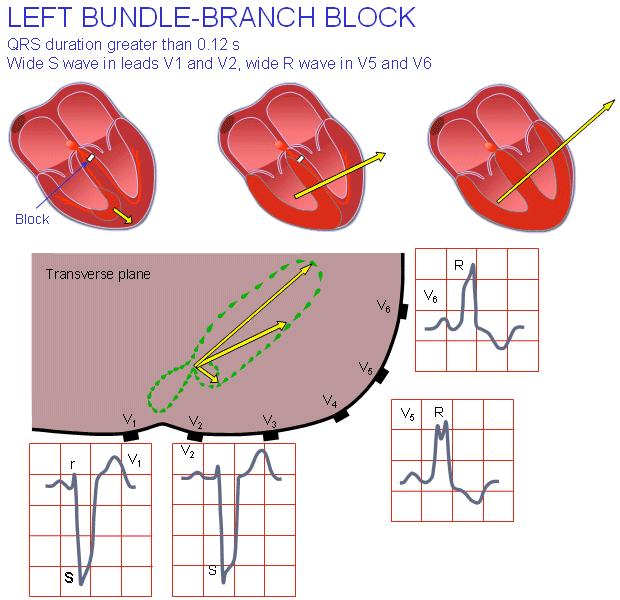
 Bundle-branch blocks Understanding the 12-lead ECG, part II Most common electrocardiogram (ECG) abnormality Appears as a wider than normal S complex Occurs when one of the two bundle branches can t conduct
Section 3 and 4. Objectives. Bundle Branches 10/9/2018. LBBB, RBBB Bifascicular, Trifascicular Block
 Section 3 and 4 LBBB, RBBB Bifascicular, Trifascicular Block Objectives At the conclusion of this presentation the participant will be able to Outline a systematic approach to 12 lead ECG interpretation
12 Lead Electrocardiogram (ECG) PFN: SOMACL17. Terminal Learning Objective. References
 PFN: SOMACL17. Terminal Learning Objective. References") 12 Lead Electrocardiogram (ECG) PFN: SOMACL17 Slide 1 Terminal Learning Objective Action: Communicate knowledge of 12 Lead Electrocardiogram (ECG) Condition: Given a lecture in a classroom environment
12 Lead Electrocardiogram (ECG) PFN: SOMACL17 Slide 1 Terminal Learning Objective Action: Communicate knowledge of 12 Lead Electrocardiogram (ECG) Condition: Given a lecture in a classroom environment
Understanding basics of EKG
 Understanding basics of EKG By Alula A.(R III) www.le.ac.uk Topic for discussion Understanding of cellular electrophysiology Basics Rate Rhythm Axis Intervals P wave QRS ST/T wave Abnormal EKGs Understanding
Relax and Learn at the FARM 2012: Session 8: 12 Lead ECG 401: ECG Variants
 Relax and Learn at the FARM 2012: Session 8: 12 Lead ECG 401: ECG Variants A Ship in the Harbor is Safe But that is not what ships are built for. Karen Marzlin DNP, RN, CCNS, CCRN-CMC, CHFN Cardiovascular
402 Index. B β-blockers, 4, 5 Bradyarrhythmias, 76 77
 Index A Acquired immunodeficiency syndrome (AIDS), 126, 163 Action potentials, 1, 5, 27 Acute coronary syndromes, 123t, 129 Adenosine, intravenous, 277 Alcohol abuse, as T wave inversion cause, 199 Aneurysm,
About T waves
 About T waves - 2014 Dr. Andres R. Pérez Riera The T waves is a positive deflection after each QRS complex. It represents ventricular repolarization The T wave represents the unconcealed potential differences
Electrocardiography Normal 5. Faisal I. Mohammed, MD, PhD
 Electrocardiography Normal 5 Faisal I. Mohammed, MD, PhD 1 Objectives 2 1. Describe the different waves in a normal electrocardiogram. 2. Recall the normal P-R and Q-T interval time of the QRS wave. 3.
Left posterior hemiblock (LPH)/
/") ECG OF THE MONTH Left Postero-inferior Depolarization Delay Keywords Electrocardiography Intraventricular conduction delay, Inferoposterior hemiblock, Left posterior fascicular block, Left posterior hemiblock
ECG OF THE MONTH Left Postero-inferior Depolarization Delay Keywords Electrocardiography Intraventricular conduction delay, Inferoposterior hemiblock, Left posterior fascicular block, Left posterior hemiblock
Paediatric ECG Interpretation
 Paediatric ECG Interpretation Dr Sanj Fernando (thanks to http://lifeinthefastlane.com/ecg-library/paediatric-ecginterpretation/) 3 yo boy complaining of abdominal pain and chest pain Child ECG vs Adult
Cardiology Flash Cards
 Cardiology Flash Cards EKG in a nut shell www.brain101.info Conduction System www.brain101.info 2 Analyzing EKG Step by step Steps in Analyzing ECG'S 1. Rhythm: - Regular _ Sinus, Junctional or Ventricular.
Part One Objectives. Don t Worry About It. All done for you Paper Speed 25 mm/sec Calibration 1 mv charge over 20 ms = 10 mm tall Lincoln Hat
 12-lead and ACS Review North Lyon Refresher Part One Objectives 12 lead ECG Basics Anatomy and Physiology STEMI Diagnosis Types of MI ACS Review STEMI System and Interventional Cardiology Review The Value
ECGs: Everything a finalist needs to know. Dr Amy Coulden As part of the Simply Finals series
 ECGs: Everything a finalist needs to know Dr Amy Coulden As part of the Simply Finals series Aims and objectives To be able to interpret basic ECG abnormalities To be able to recognise commonly tested
MICS OF MYOCARDIAL ISCHEMIA AND INFARCTION REVISED FOR LAS VEGAS
 ECG MIMICS OF MYOCARDIAL ISCHEMIA AND INFARCTION 102.06.05 Tzong-Luen Wang MD, PhD, JM, FESC, FACC Professor. Medical School, Fu-Jen Catholic University Chief, Emergency Department, Shin-Kong Wu Ho-Su
ECG Practice Strips Discussion part 1:
 ECG Practice Strips Discussion part 1: The first 20 strips are for teaching various abnormalities of the morphology of the waves of the ECG. Strips 21 and following are for teaching some abnormalities
Electrocardiography. Hilal Al Saffar College of Medicine,Baghdad University
 Electrocardiography Hilal Al Saffar College of Medicine,Baghdad University Which of the following is True 1. PR interval, represent the time taken for the impulse to travel from SA node to AV nose. 2.
ELECTROCARDIOGRAPHY: A DIAGNOSTIC TOOL IN PANCHAKARMA
 INTERNATIONAL AYURVEDIC MEDICAL JOURNAL International Ayurvedic Medical Journal, (ISSN: 2320 5091) (October, 2017) 5(10) ELECTROCARDIOGRAPHY: A DIAGNOSTIC TOOL IN PANCHAKARMA Rosy Malik 1, Swati S. Deshpande
ECG. Prepared by: Dr.Fatima Daoud Reference: Guyton and Hall Textbook of Medical Physiology,12 th edition Chapters: 11,12,13
 ECG Prepared by: Dr.Fatima Daoud Reference: Guyton and Hall Textbook of Medical Physiology,12 th edition Chapters: 11,12,13 The Concept When the cardiac impulse passes through the heart, electrical current
ECG interpretation basics
 ECG interpretation basics Michał Walczewski, MD Krzysztof Ozierański, MD 21.03.18 Electrical conduction system of the heart Limb leads Precordial leads 21.03.18 Precordial leads Precordial leads 21.03.18
ECG Interpretation Made Easy
 ECG Interpretation Made Easy Dr. A Tageldien Abdellah, MSc MD EBSC Lecturer of Cardiology- Hull University Hull York Medical School 2007-2008 ECG Interpretation Made Easy Synopsis Benefits Objectives Process
1 st Degree Block Prolonged P-R interval caused by first degree heart block (lead II)
") AV Heart Blocks 1 st degree A condition of a rhythm, not a true rhythm Need to always state underlying rhythm 2 nd degree Type I - Wenckebach Type II Classic dangerous to the patient Can be variable (periodic)
AV Heart Blocks 1 st degree A condition of a rhythm, not a true rhythm Need to always state underlying rhythm 2 nd degree Type I - Wenckebach Type II Classic dangerous to the patient Can be variable (periodic)
Lab Activity 24 EKG. Portland Community College BI 232
 Lab Activity 24 EKG Reference: Dubin, Dale. Rapid Interpretation of EKG s. 6 th edition. Tampa: Cover Publishing Company, 2000. Portland Community College BI 232 Graph Paper 1 second equals 25 little boxes
2017 EKG Workshop Basic. Family Medicine Review Course Lou Mancano, MD, FAAFP Reading Health System Family and Community Medicine Reading, PA
 2017 EKG Workshop Basic Family Medicine Review Course Lou Mancano, MD, FAAFP Reading Health System Family and Community Medicine Reading, PA Part I - Objectives Discuss a systematic approach to EKG interpretation
Marcin Dada, MD December 03, 2013
 STEMI Imposters Marcin Dada, MD December 03, 2013 Marcin Dada, MD Associate Director, Chest Pain Center Hartford Hospital, Hartford, CT Member, AHA Mission Lifeline Steering Committee Outline of Topics
INTRODUCTION TO ECG. Dr. Tamara Alqudah
 INTRODUCTION TO ECG Dr. Tamara Alqudah Excitatory & conductive system of the heart + - The ECG The electrocardiogram, or ECG, is a simple & noninvasive diagnostic test which records the electrical
- why the T wave is deflected upwards although it's a repolarization wave?
 Cardiac Electrograph: - why the T wave is deflected upwards although it's a repolarization wave? After depolarization the ventricle contracts but since the heart is a volume conductor (3D not 2D), when
Study methodology for screening candidates to athletes risk
 1. Periodical Evaluations: each 2 years. Study methodology for screening candidates to athletes risk 2. Personal history: Personal history of murmur in childhood; dizziness, syncope, palpitations, intolerance
Foundations EKG I - Unit 1 Summary
 Foundations EKG I - Unit 1 Summary The accurate diagnosis of ST elevation myocardial infarction (STEMI) is one of the most time critical duties in the practice of EM. Diagnosis is not always easy so guidelines
CARDIOVASCULAR PHYSIOLOGY ECG. Dr. Ana-Maria Zagrean
 CARDIOVASCULAR PHYSIOLOGY ECG Dr. Ana-Maria Zagrean Electrocardiogram (ECG) ECG is a non-invasive method to record at the body surface the electrical activity of the heart. - the rate and regularity of
Ben Taylor, PhD, PA-C
 Ben Taylor, PhD, PA-C The patient is a 23-year-old white male with a history of polysubstance abuse who was found unresponsive, last seen the day before. Classic signs of systemic hypothermia with prominent
ELECTROCARDIOGRAPHY (III) THE ANALYSIS OF THE ELECTROCARDIOGRAM
 THE ANALYSIS OF THE ELECTROCARDIOGRAM") ELECTROCARDIOGRAPHY (III) THE ANALYSIS OF THE ELECTROCARDIOGRAM Scridon Alina, Șerban Răzvan Constantin Recording and analysis of the 12-lead ECG is part of the basic medical assessment performed for every
ELECTROCARDIOGRAPHY (III) THE ANALYSIS OF THE ELECTROCARDIOGRAM Scridon Alina, Șerban Răzvan Constantin Recording and analysis of the 12-lead ECG is part of the basic medical assessment performed for every
BEDSIDE ECG INTERPRETATION
 BEDSIDE ECG INTERPRETATION Presented by: Ryan Dean, RN, MSN, CCRN, CCNS, CFRN Flight Nurse 2017 Based on presentations originally by Gennifer DePaoli, RN Objectives Hospital policies Electrical conduction
An ECG Primer. I saw it, but I did not realize it.
 5 An ECG Primer Quick Look Cardiac Monitoring System - p. 72 ECG Paper - p. 81 Lead Polarity and Vectors - p. 85 Basic ECG Components - p. 87 Heart Rate and Pulse Rate - p. 99 Summary - p. 102 Chapter
Bundle Branch & Fascicular Blocks. Reading Assignment (p53-58 in Outline )
") Bundle Branch & Fascicular Blocks Reading Assignment (p53-58 in Outline ) Objectives 1. QRS analysis of Right and Left BBB 2. Uncomplicated vs complicated BBB 3. Diagnosis of RBBB with LAFB and LPFB 4.
Bundle Branch & Fascicular Blocks Reading Assignment (p53-58 in Outline ) Objectives 1. QRS analysis of Right and Left BBB 2. Uncomplicated vs complicated BBB 3. Diagnosis of RBBB with LAFB and LPFB 4.
1/22/2007 Fernald Medical Monitoring Program Sort Code EKG coding
 1/22/2007 Fernald Medical Monitoring Program Sort Code EKG coding PLEASE NOTE THAT ALL EKG CODES MUST RANGE FROM 500-599 OR FROM 900-999. PLEASE DO NOT ASSIGN NUMBERS OUTSIDE THAT RANGE FOR EKG CODES.
CORONARY ARTERIES HEART
 CARDIAC/ECG MODULE THE HEART CORONARY ARTERIES FIBRILLATING HEART CORONARY ARTERIES HEART PRACTICE RHYTHMS PRACTICE RHYTHMS ELECTRICAL CONDUCTION SA Node (60 100) Primary pacemaker AV Node (40 60) ***Creates
, David Stultz, MD.
 http://www.dilbert.com EKG Rounds Handouts available at http://www.drstultz.com January 5, 2004 David Stultz, MD Cardiology Fellow, PGY 4 Overview of Topics How to read an EKG Normal EKG Determination
UNDERSTANDING YOUR ECG: A REVIEW
 UNDERSTANDING YOUR ECG: A REVIEW Health professionals use the electrocardiograph (ECG) rhythm strip to systematically analyse the cardiac rhythm. Before the systematic process of ECG analysis is described
Lect.6 Electrical axis and cardiac vector Cardiac vector: net result Vector that occurs during depolarization of the ventricles Figure:
 Lect.6 Electrical axis and cardiac vector Objectives: 1. State the relationship between the direction of cardiac vector with the direction (-ve, +ve) and amplitude of an ECG waves. 2. Draw diagram indicting
ECG SIGNS OF HYPERTROPHY OF HEART ATRIUMS AND VENTRICLES
 Ministry of Health of Ukraine Kharkiv National Medical University ECG SIGNS OF HYPERTROPHY OF HEART ATRIUMS AND VENTRICLES Methodical instructions for students Рекомендовано Ученым советом ХНМУ Протокол
Masqueraders of STEMI
 Masqueraders of STEMI Steven M. Costa, M.D. Assistant Professor Department of Medicine Division of Cardiology Scott & White Memorial Hospital and Clinic Texas A&M University Health Science Center Disclosures
PATIENT S NAME, DATE/TIME,
 ECG and Arrhythmias Dec, 1 st 2014 Doctor Mohammad Jarrah References: - Lecture and Slides - ECG Made Easy - Davidson Principles of Medicine - First Aid Cases for the USMLE Step 1 - Mini-OSCE Archive ECG
Electrocardiography negative zero LA/VL RA/VR LL/VF recording electrode exploring electrode Wilson right arm right arm, left arm left arm
 Electrocardiography In the previous lecture, we were talking about the unipolar limb leads. We said that to make the unipolar lead, you have to make the negative electrode as zero electrode, this is done