CARDIOVASCULAR PHYSIOLOGY ECG. Dr. Ana-Maria Zagrean
|
|
|
- Erika Day
- 6 years ago
- Views:
Transcription
1 CARDIOVASCULAR PHYSIOLOGY ECG Dr. Ana-Maria Zagrean
2 Electrocardiogram (ECG) ECG is a non-invasive method to record at the body surface the electrical activity of the heart. - the rate and regularity of heartbeats, - the size and position of the chambers, - the presence of any damage to the heart, - the effects of drugs etc.
3 AP-ECG o depolarization - o repolarization

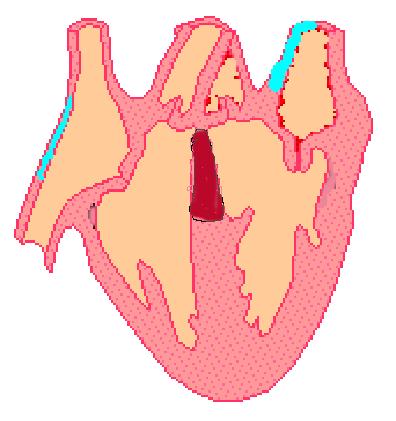
4 Instantaneous potentials develop on the surface of a cardiac muscle mass that has been depolarized in its center.

5 Monophasic action potential from a ventricular muscle fiber during normal cardiac function, showing rapid depolarization and then repolarization Electrocardiogram trace recorded simultaneously. Tissue fluids conduct electricity ECG traces show the sum of all the electrical potentials generated by all the cells of the heart at any moment. -Ventricular AP heart = 110 mv -Ventricular AP skin = 1 mv

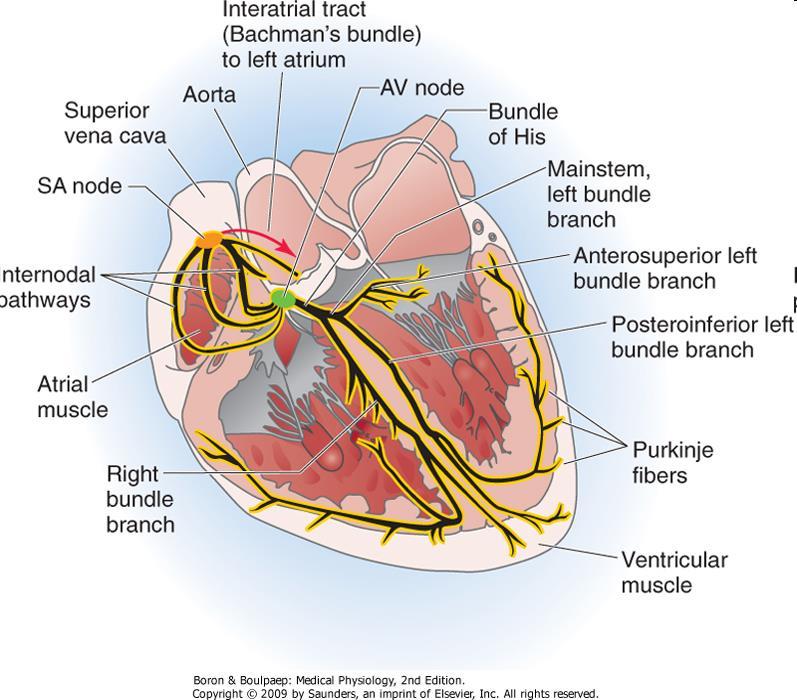
6 Electrical conduction in the heart
7 Action Potentials in the Heart s approx s ECG PR QT Superior vena cava Aortic artery SA SA node Pulmonary veins Pulmonary artery AV node Left atrium Atria AV Atrial muscle Specialized conducting tissue Mitral valve Interventricular septum Purkinje Tricuspid valve Ventricluar muscle Purkinje fibers Ventricle Inferior vena cava Descending aorta

8 The different waveforms for each of the specialized cells found in the heart are shown. The latency shown approximates that normally found in the healthy heart.
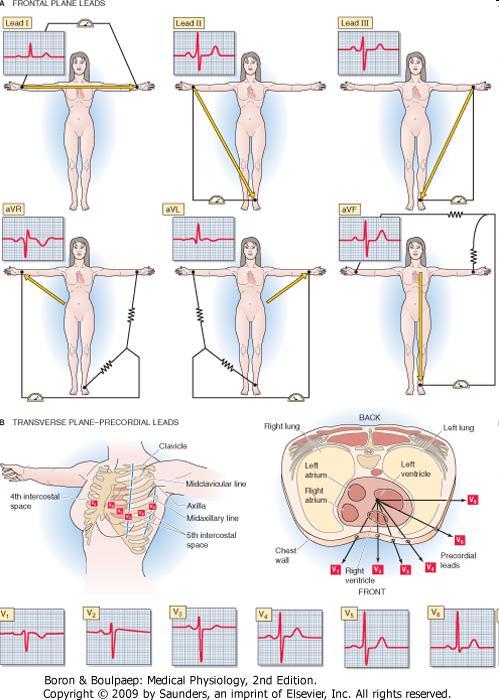
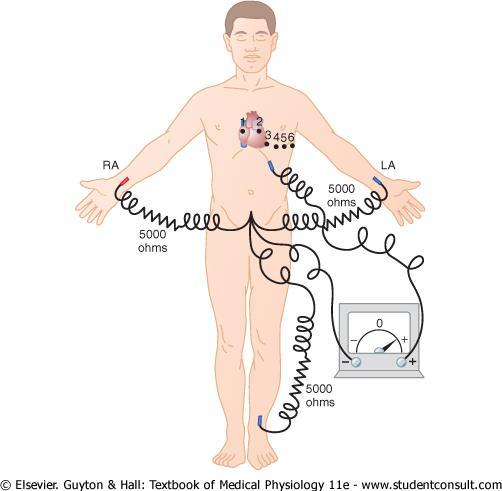
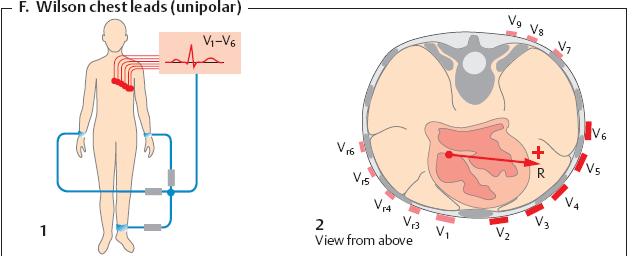
9 Clasification - polarity - direction ECG Leads - bipolar: - 3 Bipolar Limb Leads (Standard Leads): LI, LII, LIII utilize a positive and a negative electrode between which electrical potentials are measured. - unipolar: - 6 Chest Leads (Precordial Leads): V1 V6 the positive recording electrode is placed on the anterior surface of the chest directly over the heart, and the negative electrode (indifferent electrode), is connected through equal electrical resistances to the right arm, left arm, and left leg all at the same time - Augmented Leads (avl, avr, avf) two of the limbs are connected through electrical resistances to the negative terminal of the electrocardiograph, and the third limb is connected to the positive terminal. -frontal plane: standard bipolar leads, augmented leads -horizontal plane: chest leads

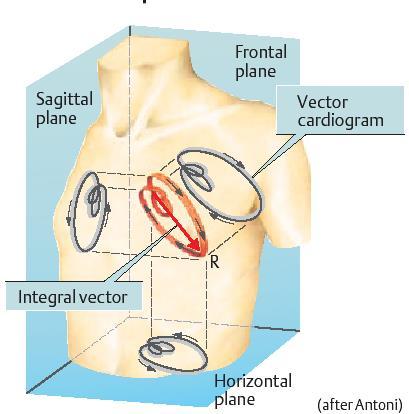
10 ECG Leads The projections of the lead vectors of the 12-lead ECG system in three orthogonal planes when one assumes the volume conductor to be spherical homogeneous and the cardiac source centrally located.
11 Conventions / Rules
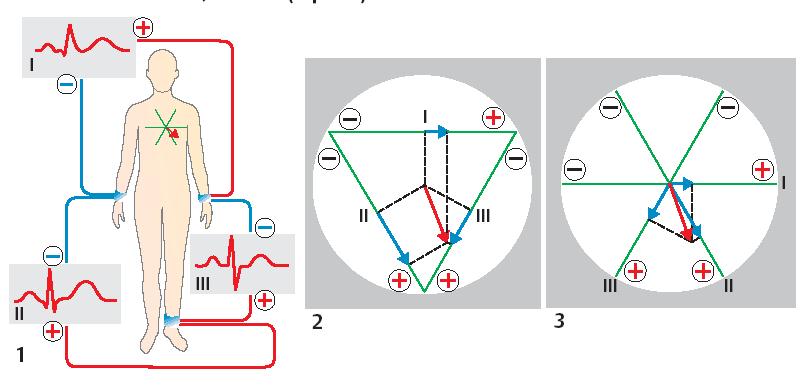
12 Rules: standard bipolar limb leads Right arm - I Left arm + - II III + Left leg


13 Bipolar Standard Leads: Lead I - from the right arm to the left arm Lead II - from the right arm to the left leg Lead III - from the left arm to the left leg
14
15
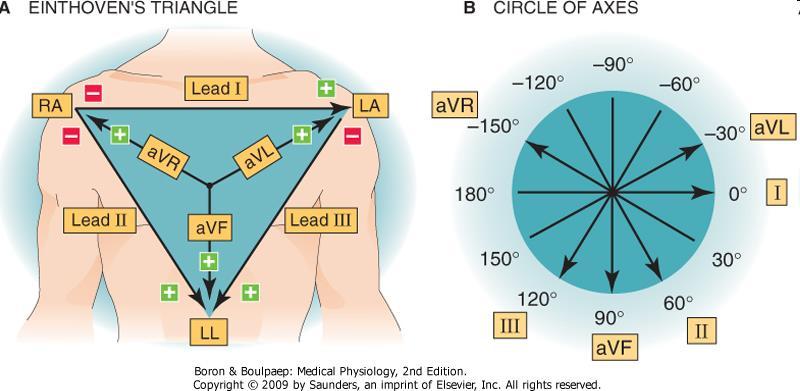
16 + + avf Rules: standard bipolar & augmented unipolar limb leads Einthoven triangle - - I + - II III

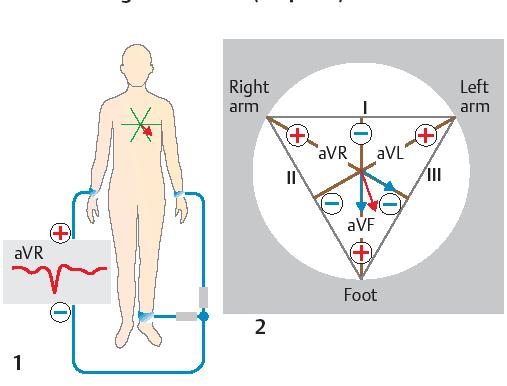
17 Augmented Unipolar Limb Leads: avr lead - the positive terminal is on the right arm; inverted! avl lead - the positive terminal is on the left arm; avf lead - the positive terminal is on the left leg.
 are right left in orientation.")
18 Frontal plane leads Einthoven's Triangle Each of the 6 frontal plane leads has a negative and positive orientation ('+' and '-' signs). Lead I (and to a lesser extent Leads avr and avl) are right left in orientation. Lead avf (and to a lesser extent Leads II and III) are superior inferior in orientation.
19 avf Leads

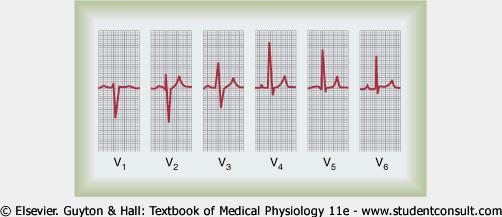
20 Precordial / chest leads (Wilson) Unipolar Precordial Leads: V1-4th intercostal space to the right of sternum V2-4th intercostal space to the left of sternum V3- halfway between V2 and V4 V4-5th intercostal space in the left mid-clavicular line V5-5th intercostal space in the left anterior axillary line V6-5th intercostal space in the left mid axillary line
21

22 The normal electrocardiogram Right Arm Lead II s s PR QT Left Leg R Atrial muscle depolarization P T Q S Ventricular muscle depolarization Ventricular muscle repolarization
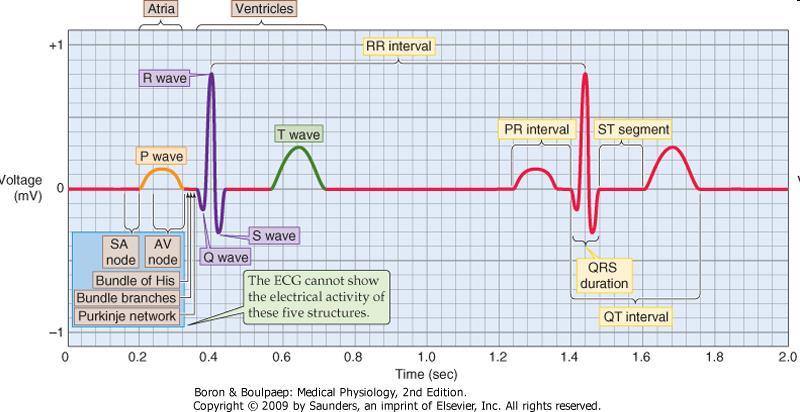
23 ECG normally, consists of 3 waves: P wave = Represents atrial depolarization Atria begin contracting about 0.1 sec after P wave begins QRS complex = Represents ventricular depolarization Why is it a larger signal than the P wave? Ventricular contraction shortly after the peak of the R wave T wave = Indicates ventricular repolarization Why do we not see a wave corresponding to atrial repolarization?

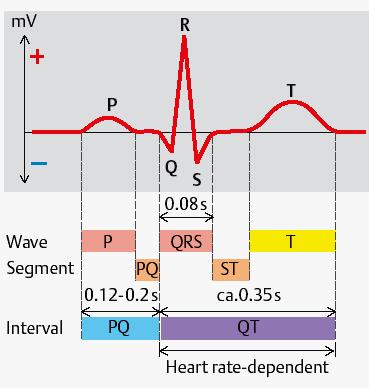
24 The normal electrocardiogram Waves: P wave A depolarization QRS complex V depolarization q or Q first negative wave R or r first positive wave s second negative wave R if second positive wave QS if there is a single large negative wave Segments: PR, ST, TP Intervals: PR, QT, ST
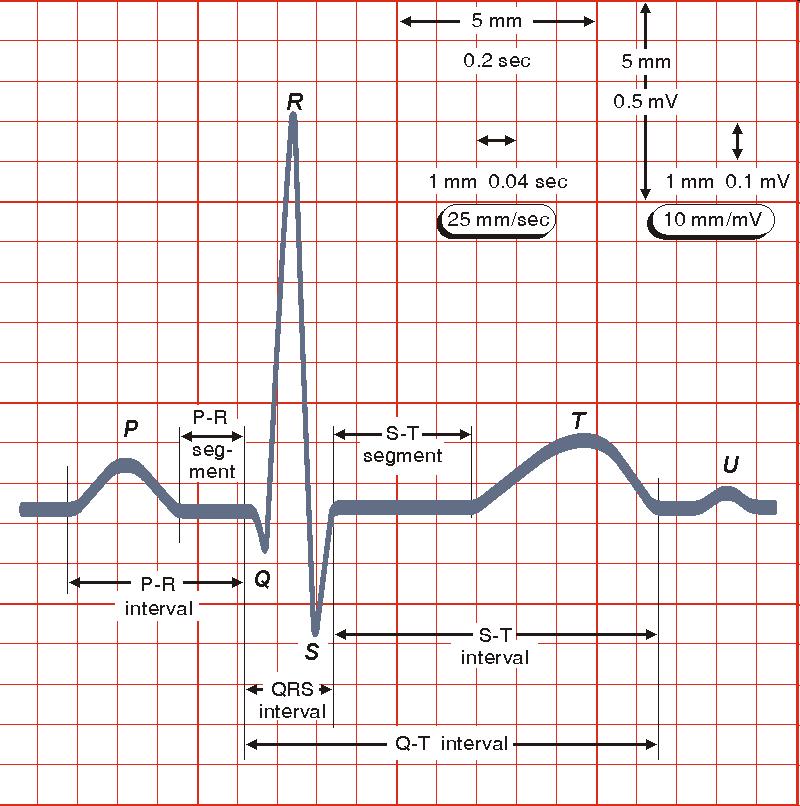
25 Nomenclature and Durations of ECG Waves (Boron & Boulpaep: Medical Physiology) The various waves of the ECG are named P, Q, R, S, T, and U: P wave: a small, usually positive, deflection before the QRS complex QRS complex: a group of waves that may include a Q wave, an R wave, and an S wave; note, however, that not every QRS complex consists of all three waves Q wave: the initial negative wave of the QRS complex R wave: the first positive wave of the QRS complex, or the single wave if the entire complex is positive S wave: the negative wave following the R wave QS wave: the single wave if the entire complex is negative R wave: extra positive wave, if the entire complex contains more than two or three deflections S wave: extra negative wave, if the entire complex contains more than two or three deflections T wave: a deflection that occurs after the QRS complex and the following isoelectric segment (i.e., the ST segment that we define later) U wave: a small deflection sometimes seen after the T wave (usually of same sign as the Twave) In addition to the totally qualitative wave designations defined previously, cardiologists may use upper- and lowercase letters as a gauge of the amplitude of Q, R, and S waves: Capital letters Q, R, S are used for deflections of relatively large amplitude. Lowercase letters q, r, s are used for deflections of relatively small amplitude. For instance: an rs complex indicates a small R wave followed by a large S wave. The various intervals are PR interval: measured from the beginning of the P wave to the beginning of the QRS complex; normal duration is 0.12 and 0.2 s (three to five small boxes on the recording) QRS interval: measured from the beginning to the end of the QRS complex, as defined previously; normal duration is <0.12 s QT interval: measured from the beginning of the QRS complex to the end of the T wave; the QT interval is an index of the length of the overall ventricular action potential; duration depends on heart rate because the action potential shortens with increased heart rate RR interval: the interval between two consecutive QRS complexes; duration is equal to the duration of the cardiac cycle ST segment: from the end of the QRS complex to the beginning of the T wave
26
27 How to record an ECG? Put electrodes on the skin, on arms, legs and chest in order to record in different leads (don t forget the ground electrode) Standardization of the recording: calibration lines on the recording paper: horizontal lines: 10 small divisions upward/downward =+/-1 mv vertical lines: 0.04 sec = 1 smaller interval for a paper speed of 25 mm/sec
28 The two major components of the ECG are waves and segments. Lead I Atrial depolarization Ventricular depolarization Ventricular repolarization HR HR Atrial contraction Ventricles contract
29
30

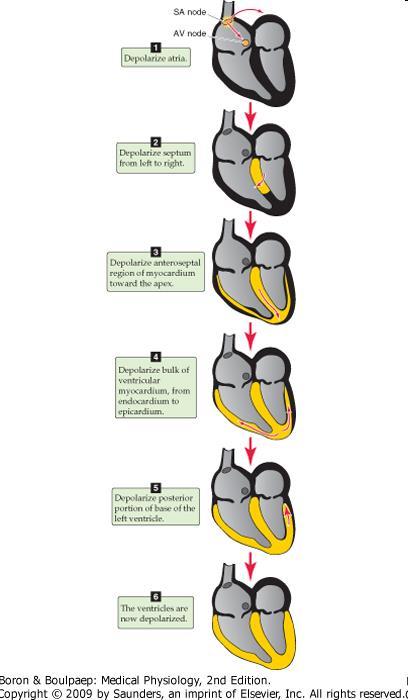
31 Correlation between the ECG and the electrical events in the heart

32 Start of ECG Cycle
33 Early P Wave
34 Later in P Wave
35 Early QRS

36 Later in QRS

37 S-T Segment
38 Early T Wave

39 Later in T-Wave
40 Back to where we started
41 ECG avr D I D II
42 Einthoven's triangle, illustrating the galvanometer connections for standard limb leads I, II, and III. Magnitude and direction of the QRS complexes in limb leads I, II, and III when the mean electrical axis (Q) is 60 degrees (A), 120 degrees (B), and 0 degrees (C).
43 Leads and electrical vectors of the heart The inferior leads (leads II, III and avf) show the electrical activity from the vantage point of the inferior region (wall) of the heart - the apex of the left ventricle. The lateral leads (I, avl, V5 and V6) look at the electrical activity from the vantage point of the lateral wall of the heart. The anterior leads, V1 through V6, and represent the anterior wall of the heart. - The lateral and anterior leads record events from the left wall and front walls of the left ventricle, respectively. - avr is rarely used for diagnostic information, but indicates if the ECG leads were placed correctly on the patient. - The right ventricle has very little muscle mass it leaves only a small imprint on the ECG, making it more difficult to diagnose changes in the right ventricle.
44 ECG R P T Q S
45

46 The generation of the ECG signal in the Einthoven limb leads.

47 The generation of the ECG signal in the Einthoven limb leads.
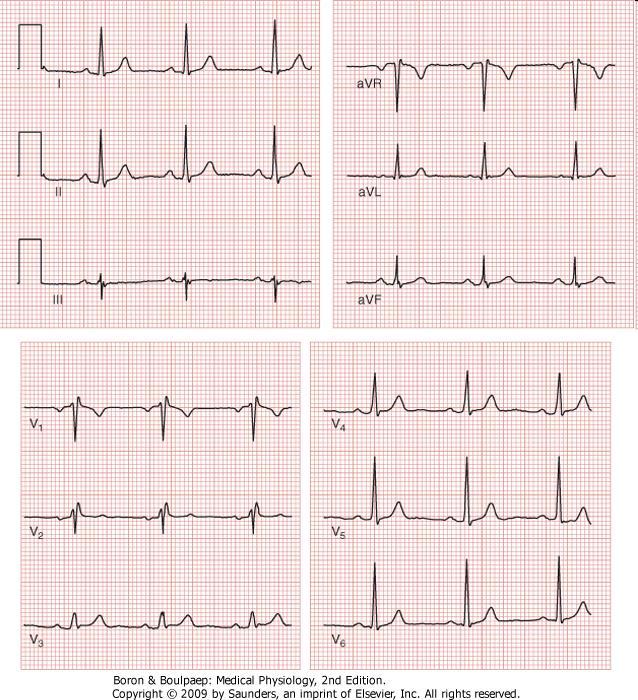
48 Analysis of Normal ECG
49 Analysis of Normal ECG 1. Check ECG calibration 2. Rhythm of the heart: "normal sinus rhythm" 3. Frequency (heart rate) 4. Electrical axis of the heart 5. Measurement of waves, segments, intervals - the sizes of the voltage changes - the duration and temporal relationships of the various components 6. Conduction analysis (PR interval, QRS duration, QT interval)
50 Analysis of Normal ECG 1. Check ECG calibration 2. Rhythm of the heart: "normal sinus rhythm" 3. Frequency (heart rate) 4. Electrical axis of the heart 5. Measurement of waves, segments, intervals - the sizes of the voltage changes - the duration and temporal relationships of the various components 6. Conduction analysis (PR interval, QRS duration, QT interval)
51 1. Calibration
52
53 Analysis of Normal ECG 1. Check ECG calibration 2. Rhythm of the heart: "normal sinus rhythm" 3. Frequency (heart rate) 4. Electrical axis of the heart 5. Measurement of waves, segments, intervals - the sizes of the voltage changes - the duration and temporal relationships of the various components 6. Conduction analysis (PR interval, QRS duration, QT interval)
 4.")
54 2. Heart Rhythm Normal Sinusal Rhythm (SR): Impulses originate at S-A node at normal rate all complexes normal, evenly spaced: 1. P wave (in Lead II: < 2.5 mm; < 0.11 sec) 2. P-R Interval ~ 0,12-0,21s 3. Frequency ~ beats/min, regulated (var.<10%) 4. P wave electrical axis ~ 0º +75º (close to +45º +60º) Nodal rhythm : superior/middle/inferior Ventricular rhythm: A-V dissociation
55
56 Abnormal Sinus Rhythms Tachycardia (fast heart rate, in an adult person >100 beats /min) is determined by increased body temperature (18 beats/ C, up to 40.5 C), stimulation of the heart by the sympathetic nerves etc. Bradycardia (slow heart rate, def. as fewer than 60 beats/minute: - in athletes; after vagal stimulation see carotid sinus syndrome Sinus arrhythmia with respiratory cycle results from cyclic variations in the sympathetic and parasympathetic tone, that influence the SA node - results mainly from "spillover" of signals from the medullary respiratory center into the adjacent vasomotor center during inspiratory and expiratory cycles of respiration alternate increase and decrease in the number of impulses transmitted through the sympathetic and vagus nerves to the heart increased HR during inspiration and decreased HR during expiration: 5% for normal/quiet respiration, up to 30% for deep respiration. - when loss, is a sign of autonomic system dysfunction
57 Analysis of Normal ECG 1. Check ECG calibration 2. Rhythm of the heart: "normal sinus rhythm" 3. Frequency (heart rate) 4. Electrical axis of the heart 5. Measurement of waves, segments, intervals - the sizes of the voltage changes - the duration and temporal relationships of the various components 6. Conduction analysis (PR interval, QRS duration, QT interval)
58 3. Frequency/Heart rate (HR) HR reciprocal of the time interval between 2 successive heartbeats/qrs complexes If the normal interval between 2 successive QRS complexes (RR interval) is 0.83 sec, then HR = 60/0.83=72 beats/min HR ~ beats/min Method of determination
59 Frequency determination Method 1 a) 60 s =? div.of 0,04s 60s = 1500 div 1500 div./ R-R div. no. b) ms/r-r (ms) =60 000/40 x no. of div. for R-R 25mm/s 75 b/m

60 Frequency determination Method 2 R R 0.04 s, for 25 mm/sec
61 Analysis of Normal ECG 1. Check ECG calibration 2. Rhythm of the heart: "normal sinus rhythm" 3. Frequency (heart rate) 4. Electrical axis of the heart 5. Measurement of waves, segments, intervals - the sizes of the voltage changes - the duration and temporal relationships of the various components 6. Conduction analysis (PR interval, QRS duration, QT interval)
62 4. Electrical axis of the heart Electrical axis for a given electrical potential is represented as a vector: vector def: an arrow that points in the direction of the electrical potential generated by the current flow, with the arrowhead in the positive direction. by convention, the length of the arrow is drawn proportional to the voltage of the potential the summated vector of the generated potential at any particular instant is called instantaneous mean vector
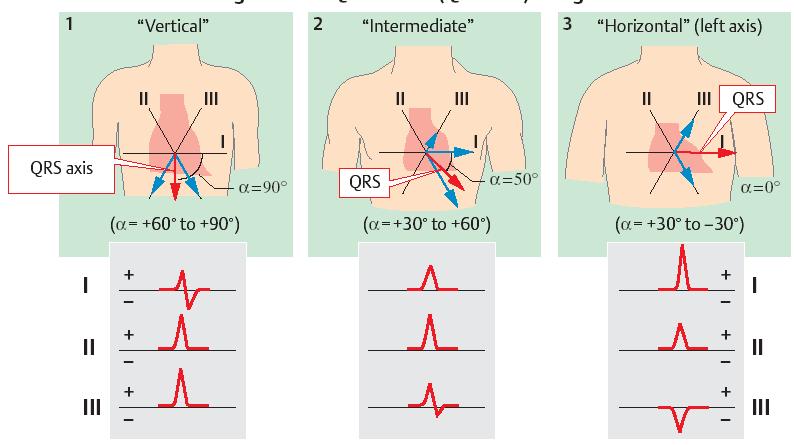
63 4. QRS axis QRS electric axis (mean vector) denotes the average direction of the electric activity throughout ventricular activation: - the direction of the electric axis denote the instantaneous direction of the electric heart vector. The normal range of the electric axis lies between -30 and +110 in the frontal plane and between +30 and -30 in the transverse plane.
64 QRS axis
 Important LAD Extreme RAD Small LAD Right axis deviation (RAD) Normal")
65 Electrical axis in the frontal plane Definition, relation with anatomical axis, deviations Extreme RAD Extreme LAD Left axis deviation (LAD) Important LAD Extreme RAD Small LAD Right axis deviation (RAD) Normal Small RAD
66 QRS Axis The direction of the electric axis may be approximated from the 12-lead ECG by finding the lead in the frontal plane, where the QRScomplex has largest positive deflection. The direction of the electric axis is in the direction of this lead vector. QRS Axis - qualitative inspection method - First find the isoelectric lead if there is one; i.e., the lead with equal forces in the positive and negative direction. Often this is the lead with the smallest QRS. The QRS axis is perpendicular to that lead's orientation. Since there are two perpendiculars to each isoelectric lead, chose the perpendicular that best fits the direction of the other ECG leads. Occasionally each of the 6 frontal plane leads is small and/or isoelectric. The axis cannot be determined and is called indeterminate. This is a normal variant.
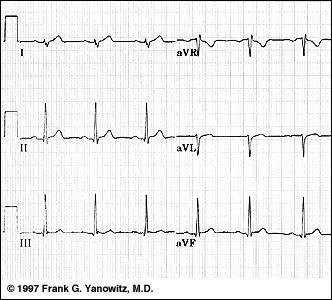
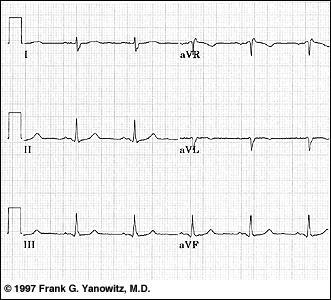
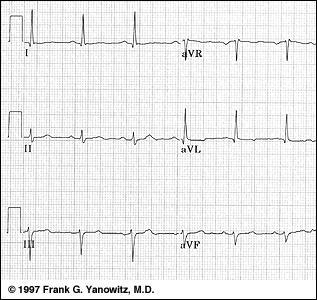
67 Axis in the normal range Lead avf is the isoelectric lead. The two perpendiculars to avf are 0 o and 180 o. Lead I is positive (i.e., oriented to the left). Therefore, the axis has to be 0 o.
68 QRS axis Geometric methods : 1. Einthoven triangle (for the standard leads: I, II, III) 2. Bayley (three axis): parallels to the Einthoven triangle, through the triangle s center, considered the electrical center of the heart 3. Hexagonal reference system: standard and augmented frontal leads Circle of axis: from zero reference point, the scale of vectors rotates clockwise; when the vector extends from above and straight downward +90 degrees; when it extends from the person's left to right, it has a direction of +180 degrees; when it extends straight upward, it has a direction of -90 (or +270) degrees. Axis of lead I is 0 degrees, lead II is +60 degrees, lead III is +120 degrees, lead avr is +210 (-150) degrees, lead avl is -30 degrees.
69 In a normal heart, the average direction of the vector during spread of the depolarization wave through the ventricles (mean QRS vector) is about +59 degrees.

70 To determine how much of the voltage in vector A will be recorded in lead I, a line perpendicular to the axis of lead I is drawn from the tip of vector A to the lead I axis projected vector (B) along the lead I axis, with the arrow toward the positive end of the lead I axis, which means that the record momentarily being recorded in the electrocardiogram of lead I is positive. C projected vector along the L II axis D projected vector along the L III axis
71 Einthoven s law: If the three standard limb leads (I,II,III) are placed correctly, the sum of the voltages in leads I and III equals the voltage in lead II
; 0.05 second after onset of depolarization (D); and after depolarization of the ventricles is complete, 0.")
72 The ventricular vectors and QRS complexes: 0.01 second after onset of ventricular depolarization (A); 0.02 second after onset of depolarization (B); second after onset of depolarization (C); 0.05 second after onset of depolarization (D); and after depolarization of the ventricles is complete, 0.06 second after onset (E).
73 Determining the Electrical Axis from Standard Lead ECG During most of the depolarization wave, the apex of the heart remains positive with respect to the base of the heart mean electrical axis of the ventricles. In standard leads: determine the net potential and polarity of the recordings. Net potential for a lead obtained after subtracting the negative potential from the positive part of the potential. Then each net potential is plotted on the axes of the respective lead, with the base of the potential at the point of intersection of the axes. To determine the vector of the total QRS ventricular mean electrical potential, one draws perpendicular lines from the apices of two standard leads. The point of intersection of these two perpendicular lines represents, by vectorial analysis, the apex of the mean QRS vector in the ventricles, and the point of intersection of the leads axes represents the negative end of the mean vector mean QRS vector is drawn between these two points. The average potential generated by the ventricles during depolarization is represented by the length of the mean QRS vector, and the mean electrical axis is represented by the direction of the mean vector.
74
75
76

77 QRS axis in the horizontal plane
78 T wave axis T wave ventricles repolarization T wave duration ~ 0.15 sec.; axis: +30, +60 degrees)
79 QRS and T vectorcardiograms: - vector increases and decreases in length because of increasing and decreasing voltage of the vector. - vector changes direction because of changes in the average direction of the electrical potential from the heart.
80 P wave axis P wave - depolarization of the atria Spread of depolarization through the atrial muscle is much slower than in the ventricles (atria have no Purkinje system for fast conduction of the depolarization signal). Repolarization begins in SA node atrial repolarization vector is backward to the vector of depolarization, and it is almost always totally obscured by the large ventricular QRS complex.
81 Analysis of Normal ECG 1. Check ECG calibration 2. Rhythm of the heart: "normal sinus rhythm" 3. Frequency (heart rate) 4. Electrical axis of the heart 5. Measurement of waves, segments, intervals - the sizes of the voltage changes - the duration and temporal relationships of the various components 6. Conduction analysis (PR interval, QRS duration, QT interval)
82 Waves: P, QRS, T, U Segments isoelectric lines on ECG: no potentials are recorded when the ventricular muscle is either completely polarized or completely depolarized. PQ(R), ST, TP Intervals segments + waves PQ(R), ST, QT
83 5. ECG Measurement of waves, segments, intervals
84 P wave: atrial depolarization wave - amplitude < 2.5 mm in lead II - duration < 0.11 s in lead II - axis: between (+45 and +60) degrees -morphology: rounded, symmetrical, usually positive wave, except avr - abnormal P waves: right atrial hypertrophy, left atrial hypertrophy
85 QRS Ventricular depolarization wave QRS ~ s q <0.04s, <25% R, reflects normal septal activation in the lateral leads (LI, avl, V5, V6).
86 Intrinsecoid Deflection in precordial leads definition: up to 0,02 sec for V1,2 up to 0,05 sec for V4-6

87 T wave: ventricular repolarization - amplitude: ~ 1/3 R, but it is considered normal within the ¼ R ½ R interval - duration ~ 0.15 s - axis: degrees - morphology: rounded, asymmetrical wave.

88 Wave U Amplitude usually < 1/3 T wave amplitude in same lead direction - the same as T wave direction in the same lead more prominent at slow HR, best seen in the right precordial leads. origin of the U wave - related to afterdepolarizations which interrupt or follow repolarization - also possible due to delayed repolarization of papillary muscles
89 Analysis of Normal ECG 1. Check ECG calibration 2. Rhythm of the heart: "normal sinus rhythm" 3. Frequency (heart rate) 4. Electrical axis of the heart 5. Measurement of waves, segments, intervals - the sizes of the voltage changes - the duration and temporal relationships of the various components 6. Conduction analysis (PR interval, QRS duration, QT interval)
90 Conduction Analysis "Normal" conduction implies normal sino-atrial (SA), atrioventricular (AV), and intraventricular (IV) conduction: PR interval= s QRS complex ~ s QT interval ~ 45% RR 0.33 s 0.46 s depends on HR
91
92
93 +90
94 +75
95 +50
96 +150
97 +90
98 +30
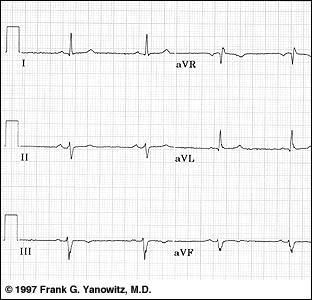
99 +15
100 0
101 -15
102 -45
103 -75
104 +120
105 -45
106 -40
107 Indeterminable!
108 Pathologic ECG Vector analysis - Axis determination Normal axis Left axis deviation Right axis deviation Abnormal Voltages of the QRS complex Increased voltage (att to electrode location) Decreased voltage Prolonged QRS Cardiac rhythms Tachycardia Bradycardia Sinus arrhythmia
109 Deviation of the electric axis to the right = increased electric activity in the RV due to increased RV mass (e.g. severe pulmonary hypertension). to the left = increased electric activity in the LV due to increased LV mass (e.g. hypertension, aortic stenosis, etc.).
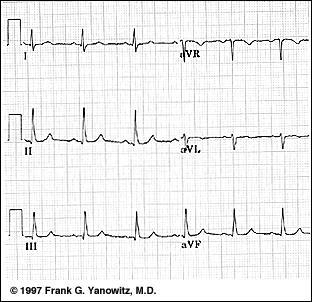
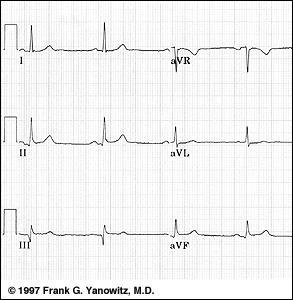
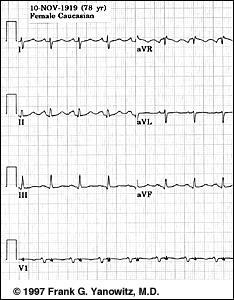
110 Axis in the left axis deviation (LAD) range Lead avr is the smallest and isoelectric lead. The two perpendiculars are - 60 o and +120 o. Leads II and III are mostly negative (i.e., moving away from the + left leg) The axis, therefore, is -60 o.

111 Axis deviation - LVH
.")
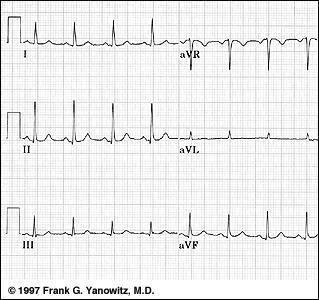
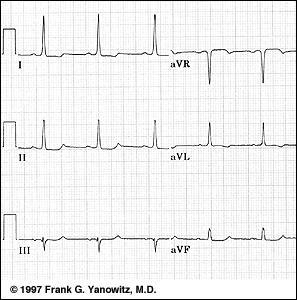
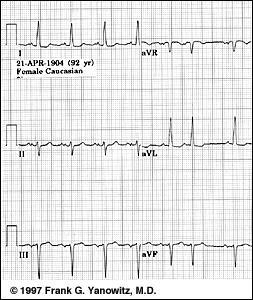
112 Axis in the right axis deviation (RAD) range Lead avr is closest to being isoelectric (slightly more positive than negative) The two perpendiculars are - 60 o and +120 o. Lead I is mostly negative; lead III is mostly positive. Therefore the axis is close to +120 o. Because avr is slightly more positive, the axis is slightly beyond +120 o (i.e., closer to the positive right arm for avr).

113 Axis deviation - RVH
114 Pathologic ECG Vector analysis - Axis determination Normal axis Left axis deviation Right axis deviation Abnormal Voltages of the QRS complex Increased voltage (att to electrode location) Decreased voltage Prolonged QRS Cardiac rhythms Tachycardia Bradycardia Sinus arrhythmia
115 Abnormal Voltages of QRS Increases: - Sum of the voltages of QRS [S-R] of the 3 standard leads > 4 mv high voltage ECG - ex. muscle hypertrophy Decreases: - cardiac myopathies - diminished muscle mass ex. after myocardial infarctions (delay of impulse conduction and reduced voltages) - short-circuits of the heart electrical potentials through pericardial fluid, pleural effusions - pulmonary emphysema
116 Pathologic ECG Vector analysis - Axis determination Normal axis Left axis deviation Right axis deviation Abnormal Voltages of the QRS complex Increased voltage (att to electrode location) Decreased voltage Prolonged QRS Cardiac rhythms Tachycardia Bradycardia Sinus arrhythmia
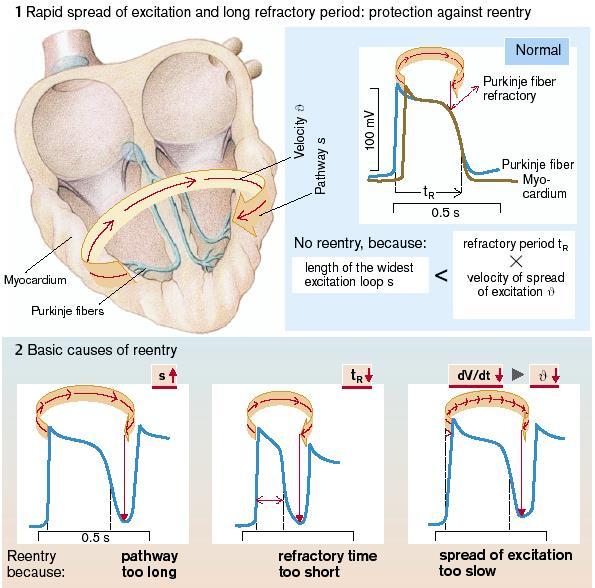
117 Pathologic ECG - Arrhythmias Causes of the cardiac arrhythmias 1. Abnormal rhythmicity of the pacemaker 2. Shift of the pacemaker from the sinus node to another place in the heart 3. Blocks at different points in the spread of the impulse through the heart 4. Abnormal pathways of impulse transmission through the heart 5. Spontaneous generation of impulses in almost any part of the heart
118
119 Cardiac Arrhythmia Re-entry mechanism Deficient conduction aria with unidirectional block A B
120


121 Bundle branch Blocks Right Left

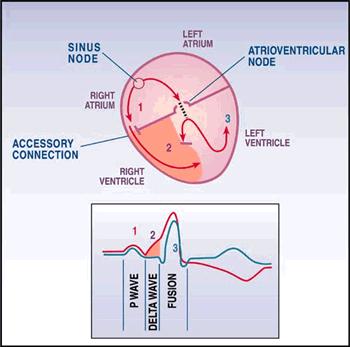
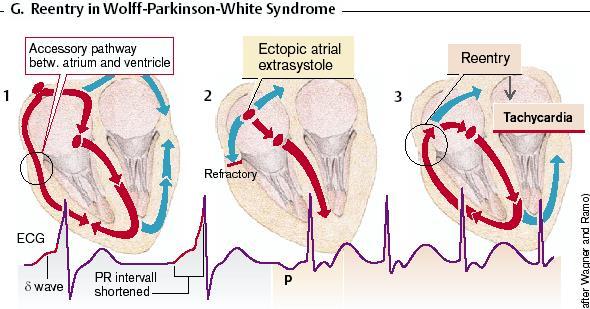
122 Abnormal conduction accessory pathways (Wolff- Parkinson-White) Kent pathway - NSA James pathways - NSA. to the ventricle base to Hiss bundle Mahaim pathway - Hiss b. to the ventricle base
123
124
ECG. Prepared by: Dr.Fatima Daoud Reference: Guyton and Hall Textbook of Medical Physiology,12 th edition Chapters: 11,12,13
 ECG Prepared by: Dr.Fatima Daoud Reference: Guyton and Hall Textbook of Medical Physiology,12 th edition Chapters: 11,12,13 The Concept When the cardiac impulse passes through the heart, electrical current
The Electrocardiogram part II. Dr. Adelina Vlad, MD PhD
 The Electrocardiogram part II Dr. Adelina Vlad, MD PhD Basic Interpretation of the ECG 1) Evaluate calibration 2) Calculate rate 3) Determine rhythm 4) Determine QRS axis 5) Measure intervals 6) Analyze
INTRODUCTION TO ECG. Dr. Tamara Alqudah
 INTRODUCTION TO ECG Dr. Tamara Alqudah Excitatory & conductive system of the heart + - The ECG The electrocardiogram, or ECG, is a simple & noninvasive diagnostic test which records the electrical
Electrocardiography Abnormalities (Arrhythmias) 7. Faisal I. Mohammed, MD, PhD
 7. Faisal I. Mohammed, MD, PhD") Electrocardiography Abnormalities (Arrhythmias) 7 Faisal I. Mohammed, MD, PhD 1 Causes of Cardiac Arrythmias Abnormal rhythmicity of the pacemaker Shift of pacemaker from sinus node Blocks at different
Electrocardiography Abnormalities (Arrhythmias) 7 Faisal I. Mohammed, MD, PhD 1 Causes of Cardiac Arrythmias Abnormal rhythmicity of the pacemaker Shift of pacemaker from sinus node Blocks at different
Electrocardiogram ECG. Hilal Al Saffar FRCP FACC College of medicine,baghdad University
 Electrocardiogram ECG Hilal Al Saffar FRCP FACC College of medicine,baghdad University Tuesday 29 October 2013 ECG introduction Wednesday 30 October 2013 Abnormal ECG ( ischemia, chamber hypertrophy, heart
ELECTROCARDIOGRAPHY (ECG)
") ELECTROCARDIOGRAPHY (ECG) The heart is a muscular organ, which pumps blood through the blood vessels of the circulatory system. Blood provides the body with oxygen and nutrients, as well as assists in
ELECTROCARDIOGRAPHY (ECG) The heart is a muscular organ, which pumps blood through the blood vessels of the circulatory system. Blood provides the body with oxygen and nutrients, as well as assists in
5- The normal electrocardiogram (ECG)
") 5- The (ECG) Introduction Electrocardiography is a process of recording electrical activities of heart muscle at skin surface. The electrical current spreads into the tissues surrounding the heart, a small
5- The (ECG) Introduction Electrocardiography is a process of recording electrical activities of heart muscle at skin surface. The electrical current spreads into the tissues surrounding the heart, a small
ECG CONVENTIONS AND INTERVALS
 1 ECG Waveforms and Intervals ECG waveforms labeled alphabetically P wave== represents atrial depolarization QRS complex=ventricular depolarization ST-T-U complex (ST segment, T wave, and U wave)== V repolarization.
By the end of this lecture, you will be able to: Understand the 12 lead ECG in relation to the coronary circulation and myocardium Perform an ECG
 By the end of this lecture, you will be able to: Understand the 12 lead ECG in relation to the coronary circulation and myocardium Perform an ECG recording Identify the ECG changes that occur in the presence
Introduction to ECG Gary Martin, M.D.
 Brief review of basic concepts Introduction to ECG Gary Martin, M.D. The electrical activity of the heart is caused by a sequence of rapid ionic movements across cell membranes resulting first in depolarization
DR QAZI IMTIAZ RASOOL OBJECTIVES
 PRACTICAL ELECTROCARDIOGRAPHY DR QAZI IMTIAZ RASOOL OBJECTIVES Recording of electrical events in heart Established electrode pattern results in specific tracing pattern Health of heart i. e. Anatomical
The Normal Electrocardiogram
 C H A P T E R 1 1 The Normal Electrocardiogram When the cardiac impulse passes through the heart, electrical current also spreads from the heart into the adjacent tissues surrounding the heart. A small
ECG INTERPRETATION MANUAL
 Lancashire & South Cumbria Cardiac Network ECG INTERPRETATION MANUAL THE NORMAL ECG Lancashire And South Cumbria Cardiac Physiologist Training Manual THE NORMAL ECG E.C.G CHECKLIST 1) Name, Paper Speed,
This presentation will deal with the basics of ECG description as well as the physiological basics of
 Snímka 1 Electrocardiography basics This presentation will deal with the basics of ECG description as well as the physiological basics of Snímka 2 Lecture overview 1. Cardiac conduction system functional
Lect.6 Electrical axis and cardiac vector Cardiac vector: net result Vector that occurs during depolarization of the ventricles Figure:
 Lect.6 Electrical axis and cardiac vector Objectives: 1. State the relationship between the direction of cardiac vector with the direction (-ve, +ve) and amplitude of an ECG waves. 2. Draw diagram indicting
Electrocardiography negative zero LA/VL RA/VR LL/VF recording electrode exploring electrode Wilson right arm right arm, left arm left arm
 Electrocardiography In the previous lecture, we were talking about the unipolar limb leads. We said that to make the unipolar lead, you have to make the negative electrode as zero electrode, this is done
EKG. Danil Hammoudi.MD
 EKG Danil Hammoudi.MD What is an EKG? The electrocardiogram (EKG) is a representation of the electrical events of the cardiac cycle. Each event has a distinctive waveform, the study of which can lead to
Family Medicine for English language students of Medical University of Lodz ECG. Jakub Dorożyński
 Family Medicine for English language students of Medical University of Lodz ECG Jakub Dorożyński Parts of an ECG The standard ECG has 12 leads: six of them are considered limb leads because they are placed
BASIC CONCEPT OF ECG
 BASIC CONCEPT OF ECG Electrocardiogram The electrocardiogram (ECG) is a recording of cardiac electrical activity. The electrical activity is readily detected by electrodes attached to the skin. After the
- why the T wave is deflected upwards although it's a repolarization wave?
 Cardiac Electrograph: - why the T wave is deflected upwards although it's a repolarization wave? After depolarization the ventricle contracts but since the heart is a volume conductor (3D not 2D), when
12 LEAD EKG BASICS. By: Steven Jones, NREMT P CLEMC
 12 LEAD EKG BASICS By: Steven Jones, NREMT P CLEMC ECG Review Waves and Intervals P wave: the sequential activation (depolarization) of the right and left atria QRS complex: right and left ventricular
ECG ABNORMALITIES D R. T AM A R A AL Q U D AH
 ECG ABNORMALITIES D R. T AM A R A AL Q U D AH When we interpret an ECG we compare it instantaneously with the normal ECG and normal variants stored in our memory; these memories are stored visually in
12 Lead ECG Skills: Building Confidence for Clinical Practice. Presented By: Cynthia Webner, BSN, RN, CCRN-CMC. Karen Marzlin, BSN, RN,CCRN-CMC
 12 Lead ECG Skills: Building Confidence for Clinical Practice NTI 2009 Preconference Session 803 Presented By: Karen Marzlin, BSN, RN,CCRN-CMC 1 12 Lead ECG Fundamentals: The Starting Place for Linking
Relax and Learn At the Farm 2012
 Relax and Learn At the Farm 2012 Session 2: 12 Lead ECG Fundamentals 101 Cynthia Webner DNP, RN, CCNS, CCRN-CMC, CHFN Though for Today Mastery is not something that strikes in an instant, like a thunderbolt,
ECG Interpretation Made Easy
 ECG Interpretation Made Easy Dr. A Tageldien Abdellah, MSc MD EBSC Lecturer of Cardiology- Hull University Hull York Medical School 2007-2008 ECG Interpretation Made Easy Synopsis Benefits Objectives Process
CASE 10. What would the ST segment of this ECG look like? On which leads would you see this ST segment change? What does the T wave represent?
 CASE 10 A 57-year-old man presents to the emergency center with complaints of chest pain with radiation to the left arm and jaw. He reports feeling anxious, diaphoretic, and short of breath. His past history
BME 365 Website. Project Directions
 Lecture 17 EKG BME 365 Website Project Directions Heart rate Factors Affecting CO Parasympathetic activity decreases HR Sympathetic activity increases HR Stroke volume Depends on force generated by cardiac
Understanding basics of EKG
 Understanding basics of EKG By Alula A.(R III) www.le.ac.uk Topic for discussion Understanding of cellular electrophysiology Basics Rate Rhythm Axis Intervals P wave QRS ST/T wave Abnormal EKGs Understanding
Electrocardiography Normal 5. Faisal I. Mohammed, MD, PhD
 Electrocardiography Normal 5 Faisal I. Mohammed, MD, PhD 1 Objectives 2 1. Describe the different waves in a normal electrocardiogram. 2. Recall the normal P-R and Q-T interval time of the QRS wave. 3.
The Electrocardiogram
 The Electrocardiogram Chapters 11 and 13 AUTUMN WEDAN AND NATASHA MCDOUGAL The Normal Electrocardiogram P-wave Generated when the atria depolarizes QRS-Complex Ventricles depolarizing before a contraction
Atlantic Health System
 Atlantic Health System Morristown Medical Center Newton Medical Center Overlook Medical Center Basic Dysrhythmia Course Day 1 1 2 Chapter 1 Anatomy and Physiology Learning Objectives 1) Identify electrophysiology
Introduction to Electrocardiography
 Introduction to Electrocardiography Class Objectives: Introduction to ECG monitoring Discuss principles of interpretation Identify the components and measurements of the ECG ECG analysis ECG Monitoring
ECG SIGNS OF HYPERTROPHY OF HEART ATRIUMS AND VENTRICLES
 Ministry of Health of Ukraine Kharkiv National Medical University ECG SIGNS OF HYPERTROPHY OF HEART ATRIUMS AND VENTRICLES Methodical instructions for students Рекомендовано Ученым советом ХНМУ Протокол
ECG Interpretation Cat Williams, DVM DACVIM (Cardiology)
") ECG Interpretation Cat Williams, DVM DACVIM (Cardiology) Providing the best quality care and service for the patient, the client, and the referring veterinarian. GOAL: Reduce Anxiety about ECGs Back to
ECG Interpretation Cat Williams, DVM DACVIM (Cardiology) Providing the best quality care and service for the patient, the client, and the referring veterinarian. GOAL: Reduce Anxiety about ECGs Back to
Electrocardiography I Laboratory
 Introduction The body relies on the heart to circulate blood throughout the body. The heart is responsible for pumping oxygenated blood from the lungs out to the body through the arteries and also circulating
ECG (MCQs) In the fundamental rules of the ECG all the following are right EXCEP:
 In the fundamental rules of the ECG all the following are right EXCEP:") ECG (MCQs) 2010 1- In the fundamental rules of the ECG all the following are right EXCEP: a- It is a biphasic record of myocardial action potential fluctuations. b- Deflection record occurs only during
ECG (MCQs) 2010 1- In the fundamental rules of the ECG all the following are right EXCEP: a- It is a biphasic record of myocardial action potential fluctuations. b- Deflection record occurs only during
ECG WORKBOOK. Rohan Jayasinghe
 ECG WORKBOOK Rohan Jayasinghe Contents Preface vii Foreword viii Acknowledgements ix The author x Reviewers xi Section 1 Basics of the ECG 1 Section 2 ECG-based diagnosis: pathology by ECG 21 Section 3
12 Lead ECG. Presented by Rebecca Sevigny BSN, RN Professional Practice & Development Dept.
 12 Lead ECG Presented by Rebecca Sevigny BSN, RN Professional Practice & Development Dept. Two Main Coronary Arteries RCA LCA which branches into Left Anterior Descending Circumflex Artery Two Main Coronary
Ekg pra pr c a tice D.HAMMOUDI.MD
 Ekg practice D.HAMMOUDI.MD Anatomy Revisited RCA (Right Coronary Artery) Right ventricle Inferior wall of LV Posterior wall of LV (75%) SA Node (60%) AV Node (>80%) LCA (Left Coronary Artery) Septal wall
4. The two inferior chambers of the heart are known as the atria. the superior and inferior vena cava, which empty into the left atrium.
 Answer each statement true or false. If the statement is false, change the underlined word to make it true. 1. The heart is located approximately between the second and fifth ribs and posterior to the
Chapter 20 (2) The Heart
 The Heart") Chapter 20 (2) The Heart ----------------------------------------------------------------------------------------------------------------------------------------- Describe the component and function of
Chapter 20 (2) The Heart ----------------------------------------------------------------------------------------------------------------------------------------- Describe the component and function of
Axis. B.G. Petty, Basic Electrocardiography, DOI / _2, Springer Science+Business Media New York 2016
 Axis 2 The electrical axis of any electrocardiogram (EKG) waveform is the average direction of electrical activity. It is not a vector, because by definition a vector has both direction and amplitude,
ELECTROCARDIOGRAPH. General. Heart Rate. Starship Children s Health Clinical Guideline
 General Heart Rate QRS Axis T Wave Axis PR Interval according to Heart Rate & Age P Wave Duration and Amplitude QRS Duration according to Age QT Interval R & S voltages according to Lead & Age R/S ratio
Sheet 5 physiology Electrocardiography-
 *questions asked by some students Sheet 5 physiology Electrocardiography- -why the ventricles lacking parasympathetic supply? if you cut both sympathetic and parasympathetic supply of the heart the heart
Lab Activity 24 EKG. Portland Community College BI 232
 Lab Activity 24 EKG Reference: Dubin, Dale. Rapid Interpretation of EKG s. 6 th edition. Tampa: Cover Publishing Company, 2000. Portland Community College BI 232 Graph Paper 1 second equals 25 little boxes
CARDIOVASCULAR SYSTEM
 CARDIOVASCULAR SYSTEM Overview Heart and Vessels 2 Major Divisions Pulmonary Circuit Systemic Circuit Closed and Continuous Loop Location Aorta Superior vena cava Right lung Pulmonary trunk Base of heart
12-Lead ECG Interpretation. Kathy Kuznar, RN, ANP
 12-Lead ECG Interpretation Kathy Kuznar, RN, ANP The 12-Lead ECG Objectives Identify the normal morphology and features of the 12- lead ECG. Perform systematic analysis of the 12-lead ECG. Recognize abnormalities
ECG Basics Sonia Samtani 7/2017 UCI Resident Lecture Series
 ECG Basics Sonia Samtani 7/2017 UCI Resident Lecture Series Agenda I. Introduction II.The Conduction System III.ECG Basics IV.Cardiac Emergencies V.Summary The Conduction System Lead Placement avf Precordial
Section V. Objectives
 Section V Landscape of an MI Objectives At the conclusion of this presentation the participant will be able to Outline a systematic approach to 12 lead ECG interpretation Demonstrate the process for determining
Birmingham Regional Emergency Medical Services System
 Birmingham Regional Emergency Medical Services System 2018 ALCTE Summer Conference EKG Basics Brian Gober, MAT, ATC, NRP, CSCS Education Services Manager ECC Training Center Coordinator Birmingham Regional
General Introduction to ECG. Reading Assignment (p2-16 in PDF Outline )
") General Introduction to ECG Reading Assignment (p2-16 in PDF Outline ) Objectives 1. Practice the 5-step Method 2. Differential Diagnosis: R & L axis deviation 3. Differential Diagnosis: Poor R-wave progression
General Introduction to ECG Reading Assignment (p2-16 in PDF Outline ) Objectives 1. Practice the 5-step Method 2. Differential Diagnosis: R & L axis deviation 3. Differential Diagnosis: Poor R-wave progression
37 1 The Circulatory System
 H T H E E A R T 37 1 The Circulatory System The circulatory system and respiratory system work together to supply cells with the nutrients and oxygen they need to stay alive. a) The respiratory system:
also aid the clinician in recognizing both the obvious and subtle abnormalities that may help guide therapy.
 Karen Lieberman, MS, CRNP f the many diagnostic tools used to screen for and evaluate cardiac abnormalities, the 12-lead electrocardiogram (ECG) is among the most basic. This inexpensive and noninvasive
Please check your answers with correct statements in answer pages after the ECG cases.
 ECG Cases ECG Case 1 Springer International Publishing AG, part of Springer Nature 2018 S. Okutucu, A. Oto, Interpreting ECGs in Clinical Practice, In Clinical Practice, https://doi.org/10.1007/978-3-319-90557-0
Pennsylvania Academy of Family Physicians Foundation & UPMC 43rd Refresher Course in Family Medicine CME Conference March 10-13, 2016
 Pennsylvania Academy of Family Physicians Foundation & UPMC 43rd Refresher Course in Family Medicine CME Conference March 10-13, 2016 Disclosures: EKG Workshop Louis Mancano, MD Speaker has no disclosures
Outline. Electrical Activity of the Human Heart. What is the Heart? The Heart as a Pump. Anatomy of the Heart. The Hard Work
 Electrical Activity of the Human Heart Oguz Poroy, PhD Assistant Professor Department of Biomedical Engineering The University of Iowa Outline Basic Facts about the Heart Heart Chambers and Heart s The
Cardiac physiology. b. myocardium -- cardiac muscle and fibrous skeleton of heart
 I. Heart anatomy -- general gross. A. Size/orientation - base/apex B. Coverings D. Chambers 1. parietal pericardium 2. visceral pericardium 3. Layers of heart wall a. epicardium Cardiac physiology b. myocardium
Lab 7. Physiology of Electrocardiography
 7.1 Lab 7. Physiology of Electrocardiography The heart is a muscular pump that circulates blood throughout the body. To efficiently pump the blood, cardiac contractions must be coordinated and are regulated
Cardiovascular System Notes: Heart Disease & Disorders
 Cardiovascular System Notes: Heart Disease & Disorders Interesting Heart Facts The Electrocardiograph (ECG) was invented in 1902 by Willem Einthoven Dutch Physiologist. This test is still used to evaluate
Farah Khreisat. Raghad Abu Jebbeh. Faisal Mohammad. 1 P a g e
 5 Farah Khreisat Raghad Abu Jebbeh Faisal Mohammad 1 P a g e بسم هللا الرحمن الرحيم Hello guys, hope you're doing well, as you've seen in the previous lecture, the Dr started with an extremely important
Case 1. Case 2. Case 3
 Case 1 The correct answer is D. Occasionally, the Brugada syndrome can present similar morphologies to A and also change depending on the lead position but in the Brugada pattern the r is wider and ST
Determining Axis and Axis Deviation on an ECG
 Marquette University e-publications@marquette Physician Assistant Studies Faculty Research and Publications Health Sciences, College of 7-15-2010 Determining Axis and Axis Deviation on an ECG Patrick Loftis
The Fundamentals of 12 Lead EKG. ECG Recording. J Point. Reviewing the Cardiac Conductive System. Dr. E. Joe Sasin, MD Rusty Powers, NRP
 The Fundamentals of 12 Lead EKG Dr. E. Joe Sasin, MD Rusty Powers, NRP SA Node Intranodal Pathways AV Junction AV Fibers Bundle of His Septum Bundle Branches Purkinje System Reviewing the Cardiac Conductive
Proceedings of the World Small Animal Veterinary Association Sydney, Australia 2007
 Proceedings of the World Small Animal Sydney, Australia 2007 Hosted by: Next WSAVA Congress ECG INTERPRETATION Adrian Boswood MA VetMB DVC DECVIM-CA(Cardiology) MRCVS The Royal Veterinary College, Hawkshead
Preface: Wang s Viewpoints
 AHA/ACCF/HRS Recommendations for the Standardization and Interpretation of the Electrocardiogram: Part IV, Ischemia and Infarction Presented by: WANG, TZONG LUEN, MD, PhD, JM, FACC, FESC, FCAPSC Professor,
Electrocardiography Biomedical Engineering Kaj-Åge Henneberg
 Electrocardiography 31650 Biomedical Engineering Kaj-Åge Henneberg Electrocardiography Plan Function of cardiovascular system Electrical activation of the heart Recording the ECG Arrhythmia Heart Rate
12 Lead ECG Interpretation: Color Coding for MI s
 12 Lead ECG Interpretation: Color Coding for MI s Anna E. Story, RN, MS Director, Continuing Professional Education Critical Care Nurse Online Instructional Designer 2004 Anna Story 1 Objectives review
UNDERSTANDING YOUR ECG: A REVIEW
 UNDERSTANDING YOUR ECG: A REVIEW Health professionals use the electrocardiograph (ECG) rhythm strip to systematically analyse the cardiac rhythm. Before the systematic process of ECG analysis is described
12 Lead ECG Interpretation
 12 Lead ECG Interpretation Julie Zimmerman, MSN, RN, CNS, CCRN Significant increase in mortality for every 15 minutes of delay! N Engl J Med 2007;357:1631-1638 Who should get a 12-lead ECG? Also include
Interpreting Electrocardiograms (ECG) Physiology Name: Per:
 Physiology Name: Per:") Interpreting Electrocardiograms (ECG) Physiology Name: Per: Introduction The heart has its own system in place to create nerve impulses and does not actually require the brain to make it beat. This electrical
Interpreting Electrocardiograms (ECG) Physiology Name: Per: Introduction The heart has its own system in place to create nerve impulses and does not actually require the brain to make it beat. This electrical
Conduction Problems / Arrhythmias. Conduction
 Conduction Problems / Arrhythmias Conduction Wolf-Parkinson White Syndrome (WPW) and Lown-Ganong-Levine (LGL): Atrial impulses bypass the AV node through an accessory pathway or bypass tract (bundle of
12 LEAD EKG & CXR INTERPRETATION.
 12 LEAD EKG & CXR INTERPRETATION www.cherylherrmann.com cherrmann@frontier.com Audio Product Recording discount for participants $60 Nonparticipants = $190 o Get CEs and manual https://catalog.vyne.com
Chapter 4. Basic ECG Concepts and the Normal ECG. Brian Coyne, MEd, RCEP / Shel Levine, MS, CES
 Chapter 4 Basic ECG Concepts and the Normal ECG Brian Coyne, MEd, RCEP / Shel Levine, MS, CES Learning Objectives Upon completion of this chapter, the reader will be able to: 1. Identify standardized components
iworx Sample Lab Experiment HH-4: The Six-Lead Electrocardiogram
 Experiment HH-4: The Six-Lead Electrocardiogram Background The cardiac cycle involves a sequential contraction of the atria and the ventricles. These contractions are triggered by the coordinated electrical
Understanding the 12-lead ECG, part II
 Bundle-branch blocks Understanding the 12-lead ECG, part II Most common electrocardiogram (ECG) abnormality Appears as a wider than normal S complex Occurs when one of the two bundle branches can t conduct
Pathologic ECG. Adelina Vlad, MD PhD
 Pathologic ECG Adelina Vlad, MD PhD Basic Interpretation of the ECG 1) Evaluate calibration 2) Calculate rate 3) Determine rhythm 4) Determine QRS axis 5) Measure intervals 6) Analyze the morphology and
Ask Mish. EKG INTERPRETATION part i
 EKG INTERPRETATION part i What is EKG? EKG or ECG= electrocardiogram(~graphy) means the recording of the heart electrical activity from Greek kardio= heart, graphein= to write cardiac cell physiology Cardiac
What the ECG is about
 What to expect from the ECG 00 The electricity of the heart 00 The shape of the ECG 00 The ECG electrical pictures 00 The shape of the QRS complex 00 Making a recording practical points 00 How to report
Cardiology Flash Cards
 Cardiology Flash Cards EKG in a nut shell www.brain101.info Conduction System www.brain101.info 2 Analyzing EKG Step by step Steps in Analyzing ECG'S 1. Rhythm: - Regular _ Sinus, Junctional or Ventricular.
ELECTROCARDIOGRAM (ECG)
") ELECTROCARDIOGM (ECG) Some times it is called EKG from the German electrokardiogram. It is the study of the electrical activity of the heart muscles. ECG is the graphic recording or display of the timevariant
ELECTROCARDIOGM (ECG) Some times it is called EKG from the German electrokardiogram. It is the study of the electrical activity of the heart muscles. ECG is the graphic recording or display of the timevariant
3/26/15 HTEC 91. EKG Sign-in Book. The Cardiac Cycle. Parts of the ECG. Waves. Waves. Review of protocol Review of placement of chest leads (V1, V2)
") EKG Sign-in Book HTEC 91 Review of protocol Review of placement of chest leads (V1, V2) Medical Office Diagnostic Tests Week 2 http://www.cvphysiology.com/arrhythmias/a013c.htm The Cardiac Cycle Represents
EKG Sign-in Book HTEC 91 Review of protocol Review of placement of chest leads (V1, V2) Medical Office Diagnostic Tests Week 2 http://www.cvphysiology.com/arrhythmias/a013c.htm The Cardiac Cycle Represents
Left posterior hemiblock (LPH)/
/") ECG OF THE MONTH Left Postero-inferior Depolarization Delay Keywords Electrocardiography Intraventricular conduction delay, Inferoposterior hemiblock, Left posterior fascicular block, Left posterior hemiblock
ECG OF THE MONTH Left Postero-inferior Depolarization Delay Keywords Electrocardiography Intraventricular conduction delay, Inferoposterior hemiblock, Left posterior fascicular block, Left posterior hemiblock
ECG Interpretation. Best to have a system to methodically evaluate ECG (from Dubin) * Rate * Rhythm * Axis * Intervals * Hypertrophy * Infarction
 * Rate * Rhythm * Axis * Intervals * Hypertrophy * Infarction") ECG to save Babies ECG Interpretation Best to have a system to methodically evaluate ECG (from Dubin) * Rate * Rhythm * Axis * Intervals * Hypertrophy * Infarction Electrical Activity in the heart 5 events
ECG to save Babies ECG Interpretation Best to have a system to methodically evaluate ECG (from Dubin) * Rate * Rhythm * Axis * Intervals * Hypertrophy * Infarction Electrical Activity in the heart 5 events
ECG interpretation basics
 ECG interpretation basics Michał Walczewski, MD Krzysztof Ozierański, MD 21.03.18 Electrical conduction system of the heart Limb leads Precordial leads 21.03.18 Precordial leads Precordial leads 21.03.18
ECG and Cardiac Electrophysiology
 ECG and Cardiac Electrophysiology Simon Some very basic electrophysiology Intracellular fluid: 10 mm Na, 140 mm K, etc. K Na-K ATPase Extracellular fluid: 140mM Na, 4mM K, etc. Na Ion gradient plus selective
CARDIOCOMP Electrocardiography Primer
 TM CARDIOCOMP Electrocardiography Primer Richmond, VA, USA 23230 CARDIOCOMP 1 Version 8 Electrocardiography Primer Revised: June 2015 Copyright 2015. Phipps & Bird, Inc. All Rights Reserved. This is a
The Heart. Happy Friday! #takeoutyournotes #testnotgradedyet
 The Heart Happy Friday! #takeoutyournotes #testnotgradedyet Introduction Cardiovascular system distributes blood Pump (heart) Distribution areas (capillaries) Heart has 4 compartments 2 receive blood (atria)
Ronald J. Kanter, MD Director, Electrophysiology Miami Children s Hospital Professor Emeritus, Duke University Miami, Florida
 S306- Pediatric Electrocardiography: A Potpourri Ronald J. Kanter, MD Director, Electrophysiology Miami Children s Hospital Professor Emeritus, Duke University Miami, Florida Disclosure of Relevant Relationship
REtrive. REpeat. RElearn Design by. Test-Enhanced Learning based ECG practice E-book
 Test-Enhanced Learning Test-Enhanced Learning Test-Enhanced Learning Test-Enhanced Learning based ECG practice E-book REtrive REpeat RElearn Design by S I T T I N U N T H A N G J U I P E E R I Y A W A
BASIC PRINCIPLES OF ECG INTERPRETATION
 Chapter 1 BASIC PRINCIPLES OF ECG INTERPRETATION Cardiac rhythm analysis may be accomplished informally via cardiac monitoring and more diagnostically via a 12-lead electrocardiogram (ECG). An electrocardiogram
Electrical Conduction
 Sinoatrial (SA) node Electrical Conduction Sets the pace of the heartbeat at 70 bpm AV node (50 bpm) and Purkinje fibers (25 40 bpm) can act as pacemakers under some conditions Internodal pathway from
Cardiovascular System Notes: Physiology of the Heart
 Cardiovascular System Notes: Physiology of the Heart Interesting Heart Fact Capillaries are so small it takes ten of them to equal the thickness of a human hair. Review What are the 3 parts of the cardiovascular
The ABC of Pediatric ECG
 The ABC of Pediatric ECG Mohamed Hamdan, MD, FAAP, FACC Assistant Professor of Pediatrics Columbia University College of Physicians and Surgeons, NY, USA Consultant Pediatric Cardiologist & Co-Director
All About STEMIs. Presented By: Brittney Urvand, RN, BSN, CCCC. Essentia Health Fargo Cardiovascular Program Manager.
 All About STEMIs Presented By: Brittney Urvand, RN, BSN, CCCC Essentia Health Fargo Cardiovascular Program Manager Updated 10/2/2018 None Disclosures Objectives Identify signs and symptoms of a heart attack
1 st Degree Block Prolonged P-R interval caused by first degree heart block (lead II)
") AV Heart Blocks 1 st degree A condition of a rhythm, not a true rhythm Need to always state underlying rhythm 2 nd degree Type I - Wenckebach Type II Classic dangerous to the patient Can be variable (periodic)
AV Heart Blocks 1 st degree A condition of a rhythm, not a true rhythm Need to always state underlying rhythm 2 nd degree Type I - Wenckebach Type II Classic dangerous to the patient Can be variable (periodic)
Circulation. Circulation = is a process used for the transport of oxygen, carbon! dioxide, nutrients and wastes through-out the body
 Circulation Circulation = is a process used for the transport of oxygen, carbon! dioxide, nutrients and wastes through-out the body Heart = muscular organ about the size of your fist which pumps blood.
Normal ECG And ECHO Findings in Athletes
 Normal ECG And ECHO Findings in Athletes Dr.Yahya Kiwan Consultant Interventional Cardiologist Head Of Departement Of Cardiology Canadian Specialist Hospital Sinus Bradycardia The normal heartbeat is initiated
Electrocardiogram and Heart Sounds
 Electrocardiogram and Heart Sounds Five physiologic properties of cardiac muscle Automaticity: SA node is the primary pacemaker of the heart, but any cells in the conduction system can initiate their
PART I. Disorders of the Heart Rhythm: Basic Principles
 PART I Disorders of the Heart Rhythm: Basic Principles FET01.indd 1 1/11/06 9:53:05 AM FET01.indd 2 1/11/06 9:53:06 AM CHAPTER 1 The Cardiac Electrical System The heart spontaneously generates electrical
10. Thick deposits of lipids on the walls of blood vessels, called, can lead to serious circulatory issues. A. aneurysm B. atherosclerosis C.
 Heart Student: 1. carry blood away from the heart. A. Arteries B. Veins C. Capillaries 2. What is the leading cause of heart attack and stroke in North America? A. alcohol B. smoking C. arteriosclerosis