DEVELOPMENT OF A CRYO-ANCHORING AND RADIOFREQUENCY ABLATION CATHETER FOR PERCUTANEOUS TREATMENT OF MITRAL VALVE PROLAPSE. Steven Michael Boronyak
|
|
|
- Melinda Maxwell
- 6 years ago
- Views:
Transcription
1 DEVELOPMENT OF A CRYO-ANCHORING AND RADIOFREQUENCY ABLATION CATHETER FOR PERCUTANEOUS TREATMENT OF MITRAL VALVE PROLAPSE By Steven Michael Boronyak Dissertation Submitted to the Faculty of the Graduate School of Vanderbilt University in partial fulfillment of the requirements for the degree of DOCTOR OF PHILOSOPHY in Biomedical Engineering August, 2015 Nashville, Tennessee Approved: W. David Merryman, PhD Brett Byram, PhD Richard Gumina, MD, PhD Michael Miga, PhD Robert Webster, PhD
2 To my grandfather, who gave me a soldering iron and started me on this journey ii
3 ACKNOWLEDGEMENTS This work was funded by the Wallace H. Coulter Foundation and the American Heart Association (13PRE ) iii
4 TABLE OF CONTENTS Page DEDICATION... ii ACKNOWLEDGEMENTS... iii LIST OF TABLES... vii LIST OF FIGURES... viii Chapter 1. Introduction... 1 Motivation... 1 Specific Aims Background and Significance... 4 Mitral Valve Anatomy and Function... 4 Mitral Regurgitation and Mitral Valve Prolapse... 6 Degenerative MV Disease: Common Characteristics... 7 Surgical Repair of the MV Due to Degenerative MR... 9 Clinical Significance of Less Invasive Techniques Percutaneous Application of Radiofrequency Ablation to Treat MVP History of RF Ablation of the MV Cryo-Anchoring for MV Attachment Potential Complications The RFC Catheter as an Alternative to Surgical Leaflet Resection The State of Percutaneous MV Repair Introduction Subtypes of Mitral Valve Disease Leaflet Repair Annuloplasty Devices Conclusion Future Perspective Executive Summary iv
5 4. The RFC Catheter System RFC Catheter Design Considerations Static Bench Prototype for Initial Feasibility Studies RFC Catheter Prototype for In Vivo Studies Aim 1 Part 1: Initial RFC Catheter Development and Feasibility Experiments Introduction Materials and Methods Results Discussion Conclusions Aim 2 Part 2: Biaxial Mechanical Characterization of Non-Uniform Thermal Shrinkage Deformations Introduction Materials and Methods Results Discussion Aim 2: RFC Catheter Assessment in a Physiologic Flow Environment Introduction Materials and Methods Results Discussion Conclusions Aim 3: Two-Dimensional Echocardiographic Indicators of MV Leaflet Shrinkage and Assessment of Treatment Efficacy In Vivo Introduction Materials and Methods Results Discussion Impact and Future Directions Investigational Summary and Impact of Results Future Directions v
6 APPENDIX Appendix A: RFC Catheter Build Instructions Appendix B: RF Electrode Temperature Calibration Appendix C: RFC Catheter System Nitrous Oxide Delivery Hardware Appendix D: RFC Catheter System Control System Code Appendix E: RFC Catheter System Data Acquisition Code Appendix F: RFC Catheter System Control System Electrical Schematic Appendix G: RFC Catheter System Electrical Schematic Appendix H: RFC Catheter System Thermocouple Filters Appendix I: Biaxial Mechanical Testing Analysis Code Appendix J: Aim 2 Supplemental Data Estimated Model Parameters Appendix K: Left Heart Flow Simulator REFERENCES vi
7 LIST OF TABLES Table Page 2.1: General classification of MV repairs for correction of degenerative disease : Assessment of Percutaneous MV Repair Devices: Data from Clinical Trials : Assessment of Percutaneous MV Repair Devices: Data from Animal Studies : Echocardiographic Assessment of Surgical MV Repair with Annuloplasty : Challenges and Limitations in Percutaneous MV Repair Devices : Average Ablation Output and Post-Treatment Morphological Assessment vii
8 LIST OF FIGURES Figure Page 1.1: RFC Catheter Concept : Mitral Valve Anatomy : Mitral Valve Prolapse : Classification of Degenerative MV Disease : Anisotropic Mechanical Response of MV Leaflets : Common Leaflet Resection Incisions : Percutaneous Repair with the MitraClip : Percutaneous Annuloplasty Devices : Evolution of Catheter Prototypes : First RFC Catheter Prototype Static Bench Prototype : Cryo-Anchor Dimensions : RFC Catheter Prototype for In Vivo Use : RFC Catheter System Key Components and Data Transfer Between Systems Time to Cryo-Anchor : RFC Catheter Cryo-Anchoring in a Physiologic Flow Environment : First Prototype Design and Control Scheme : Static Ex Vivo Experimental Set-Ups : Biaxial Mechanical Characterization of RF Ablation-Treated MV Leaflets : Characteristic Thermal Contours of RFC Catheter Treatment viii
9 5.5: Typical Cryo-Anchor Holding Strength : Comparison of Shrinkage Deformations in RF Only and RF+Cryo Treatments : Areal Shrinkage Deformation is Related to Area of Tissue Heating : Experimental Set-Up for 4x4 Marker Tracking : 4x4 Marker Positions for Bicubic Interpolation Scheme : Catheter Induced Shrinkage Deformations Shown in the Unloaded State : Catheter Induced Shrinkage Deformations Shown at Systolic Loads : Catheter-Induced Shrinkage Along Local Coordinate Axes : Average Shrinkage at Varying Preloads : Left Heart Flow Simulator For Simulated Testing : Cyclic Stretch Bioreactor : Hemodynamics of Cryo-Anchoring and Typical Catheter Outputs : Model Fit Results to Treated and Untreated MV Leaflets : Picrosirus Red Staining of RF Ablation-Treated MV Leaflets : Quantification Polarized Light Intensity of PSR-Stained MV Sections : Durability Testing of RF Ablation-Treated MV Leaflets : Ex Vivo Methods : In Vivo Methods : Ex Vivo Leaflet Area Measurements : Ex Vivo Length and Prolapse Measurements : Post-Treatment Echocardiographic AL Assessment : Post-Treatment Morphological, Mechanical, and Histological Assessment ix
10 Chapter 1 INTRODUCTION Motivation Current treatment for moderate and severe mitral regurgitation (MR), due to degenerative mitral valve (MV) disease, is open-chest surgical repair or replacement, as there are no known pharmacologic therapies that directly affect the disease process [1, 2]. Approximately one third of MV replacements are performed in lieu of repair due to lack of expertise and not the complexity of the lesions, indicating a need for MV repair techniques that can be more broadly adopted [3]. Additionally, it is estimated that up to 50% of highrisk patients with severe symptomatic MR are not referred for surgery due to comorbidities that may confer high perioperative risk [4]. As a result, percutaneous approaches to MV repair have received a great deal of interest. Depending on the lesions present, current MV repairs may include annuloplasty, leaflet resection, or chordal transfer or replacement. While there are several percutaneous annuloplasty and chordal repair devices currently in development [5], there are currently no percutaneous techniques to perform leaflet resection, which is used in 70-80% of all surgical MV repairs [6, 7]. Thus, there is a need for a percutaneous leaflet resection technique in the expanding MV repair armamentarium [8]. Radiofrequency (RF) ablation is a well-developed technique that has been used to treat cardiac electrophysiology abnormalities and uses electrical energy to form thermal lesions by resistive heating. The primary structural component of MV leaflets is collagen, which denatures and contracts when heated to >65 C. As a result, RF ablation can be used 1
![to reduce the size of enlarged myxomatous MV leaflets [9, 10], providing a percutaneous alternative to open-chest surgical leaflet resection (Fig. 1.1).](/docs-images/79/79362386/images/11-1.jpg "However, application of RF ablation to MV leaflets in a dynamic hemodynamic environment is difficult without additional catheter stability.")
![To address this, we have developed cryo-anchoring, a technique similar to cryoablation that uses pressurized nitrous oxide to provide cooling of a catheter tip [11].](/docs-images/79/79362386/images/11-2.jpg "The sub-freezing temperatures provide adhesion, allowing stable and reversible attachment of a catheter tip to a moving MV leaflet.")
11 to reduce the size of enlarged myxomatous MV leaflets [9, 10], providing a percutaneous alternative to open-chest surgical leaflet resection (Fig. 1.1). However, application of RF ablation to MV leaflets in a dynamic hemodynamic environment is difficult without additional catheter stability. To address this, we have developed cryo-anchoring, a technique similar to cryoablation that uses pressurized nitrous oxide to provide cooling of a catheter tip [11]. The sub-freezing temperatures provide adhesion, allowing stable and reversible attachment of a catheter tip to a moving MV leaflet. The objective of this work is to translate a combined RF ablation and cryoanchoring (RFC) catheter for treatment of degenerative MV disease from concept to in vivo animal models. The work that follows will describe the design and development of the RFC catheter system and will evaluate the performance of the RFC catheter according to three specific aims. MV Prolapse Normal Closure RF Ablation Cryo-Anchor MR Fig. 1.1: RFC Catheter Concept The combined radiofrequency ablation and cryo-anchoring catheter concept to treat enlarged MV leaflets percutaneously. 2
12 Specific Aims The hypothesis of this investigation is that a combined RF ablation and cryo-anchoring catheter can reversibly adhere to MV leaflets in a beating heart environment without negatively affecting hemodynamics, and that RF ablation can be used to thermally shrink enlarged MV leaflet tissue. 1. Develop an RFC catheter prototype and assess treatment feasibility in static bench experiments. The goals of this aim are (1) to quantify the magnitude of the thermal shrinkage lesions generated by the RFC catheter and (2) to evaluate cryo-anchor effectiveness in the presence of RF ablation 2. Quantify the mechanical and morphological changes of healthy porcine mitral valve leaflets exposed to simultaneous cryo-anchoring and radiofrequency ablation in a physiologic flow environment. The goals of this aim are (1) to identify indicators of MV leaflet thermal alteration and (2) to demonstrate that combined cryo-anchoring and radiofrequency ablation effectively alters mitral valve leaflet morphology and compliance in a hemodynamic environment that mimics in vivo conditions. 3. Develop a 2D echocardiographic technique for clinically-relevant measurement of MV leaflet shrinkage and assess procedural efficacy in a porcine animal model. The goals of this aim are (1) to identify clinically measurable qualitative and quantitative indicators of MV thermal shrinkage and (2) to assess treatment efficacy in vivo. 3
13 Chapter 2 BACKGROUND AND SIGNIFICANCE Mitral Valve Anatomy and Function The mitral valve (MV) is a bi-leaflet heart valve which sits between the left atrium and left ventricle of the heart. The complex anatomy of the MV consists of five primary components: (1) the annulus, a fibrous ring of tissue located at the base of the atrium, (2) two leaflets, consisting of the anterior and posterior leaflets, (3) commissures, which are the sites of separation between the leaflets, (4) chordae tendineae, which act to tether the free edges of the MV leaflets to the ventricular wall, and (5) the papillary muscles, the sites of chordae tendineae attachment (Fig. 2.1). The anterior leaflet is the larger of the two leaflets, and is approximately twice the height of the posterior leaflet [12]. The posterior leaflet consists of three distinct scallops, with the central scallop being the largest in approximately 90% of normal hearts [12]. During normal functioning of the heart, the MV opens during diastole in order to allow passive filling of the left ventricle. During systole, when the heart is pumping blood to the systemic circulation of the body, the MV is closed and must resist large pressures (>120 mmhg) exerted on it to prevent reverse blood flow. Abnormalities of any of the primary components of the MV, as well as problems associated with left atrial or left ventricular dysfunction, can lead to malfunctioning of the MV [13], and the type and severity of the diseased structure determines whether surgical techniques are needed to treat the defect. 4

14 A B anterior posterior Fig. 2.1: Mitral Valve Anatomy A: Anatomy of the mitral valve, indicating the five major structural components: the annulus, leaflets, commissures, chordae tendineae, and papillary muscles. Reproduced with permission from [1], Copyright Massachusetts Medical Society. B: A comparison of the larger, anterior leaflet and the three scallops that form the posterior leaflet. 5
, and severe cases of MR can lead to left ventricular dysfunction and congestive heart failure [14].")
15 Mitral Regurgitation and Mitral Valve Prolapse Problems associated with the MV result in a leaky valve, in which reverse blood flow occurs across the MV during systole. This is termed mitral regurgitation (MR), and severe cases of MR can lead to left ventricular dysfunction and congestive heart failure [14]. Poor leaflet coaptation is the endpoint through which MR occurs, and one specific syndrome that may result in MR is termed mitral valve prolapse (MVP), which is found in approximately 2% of the population [15] and is defined as superior displacement greater than 2 mm of one or both leaflets into the atrium during systole [16] (Fig. 2.2). The severity and underlying cause of MR dictates the type of treatment administered, and open-chest replacement or repair is the current gold standard for treatment of moderate-to-severe and Fig. 2.2: Mitral Valve Prolapse MV prolapse can affect one or both leaflets. Shown above is a MV with enlarged leaflet billowing into the left atrium during systole (top left) and significant MR (top right) and imaged with 2D transesophageal echocardiography. 3D transesophageal echocardiography (bottom left) and the surgical view (bottom right) further demonstrate leaflet billowing. Reproduced with permission from [17], Copyright Nature Publishing Group. 6
16 severe MR in patients with symptoms of left ventricular dysfunction [18]. This represents a significant problem in older patients who are more at-risk when undergoing invasive surgical procedures, a population that is currently growing, as the population of Americans aged 65+ is estimated to more than double from 34 to 79 million over the next 50 years [19]. Degenerative MV Disease: Common Characteristics Dysfunction of the MV is classified into one of two distinct categories: (1) degenerative disease, a primary dysfunction due to abnormalities of the MV itself, and (2) functional disease, dysfunction that is secondary to diseases of the left ventricle or other areas of the heart [20]. While percutaneous MV repair devices are currently being developed to treat lesions arising from each of these sub-types, the RFC catheter is a leaflet repair device, and therefore targets lesions of degenerative disease. Degenerative disease of the MV apparatus occurs across a spectrum of conditions (Fig. 2.3), and the ends of this spectrum are termed Barlow s disease and fibroelastic deficiency. Little is known about the underlying molecular mechanisms of degenerative diseases of the MV, thus no pharmacologic therapies currently exist [2, 21]. Fibroelastic deficiency results from impaired production of connective tissue and typically presents late in life (>60 years) with only a short history of known disease. The primary lesion in fibroelastic deficiency is chordal rupture, due to the frail, thin nature of the chordae and MV leaflets [22]. Additionally, MV leaflets with fibroelastic deficiency often contain a region of thickening with excess tissue in the area of prolapse, most often present in the central segment of the posterior leaflet. Otherwise, MV leaflets with fibroelastic deficiency are typically normal in size. 7

17 Fig. 2.3: Classification of Degenerative MV Disease Degenerative disease of the MV occurs across a spectrum of conditions, with the ends of the spectrum termed fibroelastic deficiency (FD, or FED in above figure) and Barlow s disease. Reproduced with permission from [23]. Copyright Learned Society and Oxford University Press. In contrast to fibroelastic deficiency, Barlow s disease presents earlier in life (<60 years) with myxoid infiltration as the primarily pathology [22]. Patients presenting with Barlow s disease may go many years before symptoms become severe enough to require treatment [24]. On echocardiography, Barlow s leaflets appear thick and voluminous, with multi-segmental prolapse [25, 26]. Surgical lesions may include excess tissue, enlarged leaflets, elongated or ruptured chords, and calcification of the chords, papillary muscles, or annulus. While myxomatous infiltration is not well characterized at the cellular and molecular levels, histological analysis of myxomatous MVs has revealed leaflets with disrupted and compromised collagen architecture and an increase in proteoglycans; chordae can be similarly affected [2]. Previous morphologic analysis of myxomatous MV leaflets demonstrated a two-fold increase in valvular surface area, due to significant increases in both anterior and posterior leaflet surface areas [27]. Additionally, mechanical testing has shown that myxomatous leaflets are twice as extensible as normal MV leaflets [28]. Similar changes in size and extensibility have been shown in MV chordae [29]. Given 8
18 the variety and severity of lesions, surgical repair of Barlow s disease is generally more complex than that of fibroelastic deficiency [30]. Surgical Repair of the MV Due to Degenerative MR The current standard in long-term treatment of MR due to degenerative disease is openchest surgical repair or replacement, depending on the severity and structure affected. Repair of the MV is generally preferred over replacement due to lower rates of thromboembolism, resistance to endocarditis, the avoidance of a prosthetic valve and associated long-term anticoagulation therapy, as well as the excellent durability of repairs as long as 25 years compared to valve replacement [20]. Half of all patients undergoing MV replacement, with either a mechanical or bioprothesis, die within years, with most deaths being valve or cardiac related [31-33]. Further, 20% of all patients receiving a MV replacement require reoperation within 20 years [31]. For comparison, MV repair using Carpentier s techniques offers a mortality rate comparable to that of the general population [34], with 6% incidence of reoperation within the first 20 years [34-36]. One benefit of MV repair is that it preserves the sub-valvular apparatus, consisting of the chords and papillary muscles, as removal of these structures has been associated with detrimental effects on left ventricular shape and performance [37-39]. The differentiation of degenerative MV disease into Barlow s and fibroelastic deficient sub-types when comparing long-term repair outcomes has only recently been made [22, 40]. One reason is that degenerative disease of the MV can frequently present in the middle of the spectrum of disease (Fig. 2.3), with lesions that are characteristic of each sub-type. Thus, when describing MV repair due to degenerative disease, the type of lesion and repair techniques are often reported without regard for disease sub-type [30]. 9
19 There are a variety of surgical repair techniques employed by the cardiac surgeon, and the techniques used depend largely on the individual lesions present. Repairs of degenerative sub-types of MV disease frequently include a combination of leaflet resection and implantation of an annuloplasty ring [41]. Resection of excess leaflet tissue typically involves removal of a triangular or quadrangular section of tissue near the location of prolapse [42], while annuloplasty involves implantation of a rigid or flexible ring around the MV annulus at the base of the atrium. Implantation of annuloplasty rings are frequently used to correct an enlarged MV annulus, but their use in the normal-sized MV annulus has also been associated with improved long-term clinical outcomes [6, 43]. While it us unknown why annuloplasty usage in MVs with a normal-sized annulus improves outcomes, it is believed to be due to the progressive nature of the disease [6, 7]. Only about 70% of patients are free from MR > grade 2 (moderate) 15 years after treatment [7, 35], indicating the need for possible re-treatment in the later stages of life. In addition to leaflet resection and annuloplasty repair techniques, chordal repairs are also commonly performed and can include chordal shortening, chordal transfer, or implantation of synthetic PTFE chords [44, 45]. For an analysis of the frequency of usage for the most common repair techniques used to treat degenerative disease, see Table 2.1. Clinical Significance of Less Invasive Techniques In 2003, 43,000 MV valve procedures were performed in the U.S. alone, with 2,800 deaths due directly and another 6,600 due in part to MV disease [46]. Recently, less-invasive, percutaneous techniques have been in development to treat MV disease. Percutaneous techniques are often preferred over surgical procedures because they have been shown to reduce the need for blood transfusions, decrease rates of infection, and reduce recovery 10
20 time [10, 47]. These benefits have the potential to reduce procedure cost and time dramatically. Additionally, approximately one third of MV replacements are performed in lieu of repair due to lack of expertise and not the complexity of the lesions, indicating a need for MV repair techniques that can be more broadly adopted [3]. Further, it is estimated that up to 50% of high-risk patients with severe symptomatic MR are not referred for surgery due to co-morbidities [4]. As a result, percutaneous approaches to MV repair have received a great deal of interest. Due to the variety of lesions that may be present, and the multitude of techniques that may be used in surgery, attempts to percutaneously repair degenerative MVs may be best served by a combination of different repair devices, each with a specialized function. One example is the sub-optimal repair rates of the MitraClip device. Repair is sufficiently efficacious in some patients, but not in a majority [48]. There will likely be no percutaneous repair strategy that is ideal for all patients, and a combination of approaches with different percutaneous devices may best replicate the combination of repair strategies currently employed by surgeons. While there are several percutaneous annuloplasty and chordal repair devices currently in development [5, 8], there are currently no percutaneous techniques to perform leaflet resection, which is used in 70-80% of all surgical MV repairs[6, 7]. Thus, there is a need for a percutaneous leaflet resection technique in the expanding MV repair armamentarium [8]. 11
21 Table 2.1: General classification of MV repairs for correction of degenerative disease. Flameng [6] David [7] Total repairs Leaflet Repair Segmental resection % % Other leaflet intervention 13 4% 0 0% Chordal Repair Chordal shortening 22 6% 39 6% Chordal transfer 27 8% 40 6% Chordal replacement (PTFE) 48 14% % Annuloplasty Rings Rigid ring % 96 15% Flexible ring 11 3% % Incomplete ring 0 0% % Percutaneous Application of Radiofrequency Ablation to Treat MVP One possible method to replace leaflet resection with a percutaneous technique is radiofrequency ablation (RF), an established technique for treating cardiac arrhythmias that has been around since the mid-1980s. RF ablation utilizes electrical signals at around khz in order to generate resistive heating for ablation of tissue. It is dependent on power, electrode-tissue interface temperature, electrode size, and contact pressure [49]. The target of RF ablation is the collagen architecture of the MV leaflets, which contributes to much of the strength and mechanical properties of the tissue [50]. Previously, the fibrillar structure of collagen has been shown to denature and contract when heated to greater than 65 C [51]. Additionally, transmission electron microscopy has shown an increase in collagen fiber diameter and a loss of cross-striations with increasing application of RF power [52]. The goal of using RF ablation to treat enlarged MV leaflets is to induce permanent changes in leaflet geometry via resistive heating of collagen and subsequent shortening. 12

22 In MV leaflets, collagen is preferentially aligned with the circumference of the MV annulus, which causes an anisotropic loading response in normal leaflets (Fig. 2.4A-B). This collagen alignment can affect the response of MV tissue to application of RF energy. Following treatment with RF ablation, collagenous tissues undergo shortening primarily in the direction of collagen alignment. Prior treatment of porcine MV leaflets with RF ablation in vitro has demonstrated directional length changes that are dependent on RF power, with the circumferential direction shortening much more than the radial direction [9]. History of RF Ablation of the MV The history of utilizing percutaneous application of RF ablation to alter the MV apparatus is brief and began with two animal studies published in The first of these studies used the QuantumCor device, which uses a circular RF ablation probe to reduce the MV annulus diameter and is intended as a treatment for functional MR [53]. Use of the QuantumCor device in 16 sheep reduced the anterior-posterior dimension of the MV annulus by more than 20%, and these changes remained durable for the duration of the 180-day study, with A Circ Membrane Tension (N/m) B Circumferential Radial Stretch Ratio Fig. 2.4: Anisotropic Mechanical Response of MV Leaflets A: Collagen is preferentially aligned with the circumferential (circ) direction in MV leaflets. B: Due to this collagen alignment, MV leaflets are more stiff in the circumferential direction than the radial direction. 13
23 tissue fibrosis and necrosis present at the endpoint [54]. This study was performed in normal sheep, with little to no traces of MR at the beginning of the study. The second study used a standard RF ablation catheter to apply RF energy directly to MV leaflets in order to reduce leaflet size and alter biomechanical properties and was performed on two separate treatment groups [10]. The first was an acute procedure performed on n=3 canines with severe MR in which RF ablation was applied under openchest surgery. An average of 4 ablations at a power of 16 W for 40 seconds produced anywhere from 44% to 60% reduction in MR, as measured by echocardiography. An additional chronic study was performed on n=3 healthy canines, and RF ablation was applied percutaneously until structural and/or functional alteration of the MV was demonstrated by echocardiography. It took an average of 20 ablations for 60 seconds at a power of W to induce noticeable changes, due largely to the difficulty in maintaining adequate contact between the RF ablation catheter tip and the MV leaflets. While openchest application of RF ablation demonstrated significant reductions in post-ablation MR, the number of ablations required in the percutaneous procedure indicates that a method to stabilize catheter contact with the moving MV apparatus is clearly warranted. Further, while leaflets experience small areas of coagulation necrosis and areas of fibroblast proliferation, leaflets remained durable over 6 weeks. Cryo-Anchoring for MV Attachment In order to enable more reliable application of RF energy to MV leaflets, the RF electrode on the catheter device must remain in direct contact with the target tissue area. The requirements for an anchoring device are to enable reversible attachment to either the posterior or anterior MV leaflet, depending on the desired ablation target. Anchoring to the 14
24 chords for RF ablation represents another potential target. Cryoablation is one technology that has been used to percutaneously treat cardiac arrhythmias since 1999 [55], which uses pressurized liquid nitrogen to cool a catheter tip to temperatures as low as -80 C. A technique termed cryo-mapping was developed for use with these cryoablation catheters, which cools the catheter tip to temperatures as low as -30 C to temporarily induce electrophysiological changes in cardiac tissues [49]. This is performed with minimal cellular damage and little effect on the structural properties of the tissue [56]. Given the negligible amount of tissue damage induced at temperatures as low as -30 C, and the temporary, reversible tissue attachment that can be created, this cryo-anchoring technique represents one potential strategy to maintain attachment to moving MV leaflets. Potential Complications In designing the RFC catheter treatment strategy and studying the effects of RFC catheter treatment on the MV, it is important to consider the potential complications that may arise as a result of the procedure. Potential complications of percutaneous treatment of the MV with the RFC catheter can be classified according to one of three categories, which are discussed further below: 1) complications arising as a result of RF ablation and cryoanchoring delivery, or catheter manipulation, within the heart and vasculature generally, 2) complications arising from ablation of the MV structure specifically, and 3) complications that compromise long-term treatment efficacy, or re-dilation of the MV leaflet after treatment. General Complications of RF Ablation and Catheter Manipulation in the Heart. Complications that may result due to administration of RF energy, cryo-anchoring, or 15
25 general manipulation of a catheter within the vasculature and heart are well-known. RF ablation and cryoablation catheters have been used safely and successfully since the 1980s and 1990s [49, 55], respectively, to treat a variety of arrhythmias in the heart. A primary concern of RF ablation is tissue charring and thrombus formation due to the high temperatures produced during treatment, and the associated risk of embolization [57-59]. When ablation is performed within a cardiac chamber, thromboembolic risk is as high as 2% [57, 58]; however, the risk of cerebral embolization is much lower, around 0.1% [57]. Thromboembolic risk can be minimized by limiting RF ablation temperatures to minimize excessive charring, the use of heparin protocols, and post-procedure antithrombotic protocols [58-60]. An additional risk of RF ablation is damage to the surrounding structures, especially as thermal alterations due to RF ablation are permanent [61]. Pulmonary vein stenosis [62], coronary sinus injury or thrombus formation [63], coronary artery stenosis [64], and arrhythmogenicity of ablating critical electricity-conducting structures such as the AV node are all risks that must be considered. Cryo-anchoring was developed partly in response to this risk: the significant catheter stability provided by cryoachoring combined with echocardiographic visualization of the RFC catheter tip minimizes the risk of off-target ablations. Additionally, cryoablation and cryo-anchoring are associated with minimal thrombus formation compared to RF ablation [65]. Specific Complications Involving the MV Following RF Ablation. A second subset of possible complications resulting from RFC catheter treatment of the MV leaflets is undesired structural damage secondary to leaflet shrinkage. MV leaflet perforation or ruptured chords are a possible concern, which may arise due to excessive heat generation (>100 C) or due to the possible frail nature of diseased tissue. There is a small body of 16
26 literature on valvular lesions occurring following RF ablation of accessory atrioventricular conduction pathways in the left ventricle. These ablations are performed using a retrograde, transaortic catheter approach. A few studies have used transthoracic echocardiography to assess the incidence of valvular regurgitation following ablation of these accessory conduction pathways and found that mild MR developed in 6.7%, 5.4%, and 0.01% of cases within 24 hours in studies of 59 [66], 355 [67], and 179 patients [68], respectively. When followed long-term, findings were unchanged over months. It is still unclear if MR results from RF energy delivery or catheter manipulation, or both [66, 67]. Two case studies of young patients undergoing routine RF ablation for treatment of Wolff-Parkinson-White syndrome provide evidence for both causes. In one, a 14 year old male developed a 3 mm by 5 mm perforation in the center of the posterior leaflet, discovered 20 months post-procedure after presentation with sudden chest pain with no other abnormal findings, suggesting catheter manipulation as the cause [69]. In another case, a 39 year old female developed severe MR 2 weeks post-procedure and was found to present with a ruptured anterior leaflet chord with surrounding reddened and thickened areas with partially necrotic tissue, suggesting excessive RF energy delivery [70]. Given the transaortic approach, any ablations near the MV annulus within the ventricle, where convective heat transfer away from the RF electrode is reduced, must be carefully monitored to avoid excessive heat generation. Given the possibility of leaflet or chordal structural damage, RF energy delivery will have to be carefully titrated during RFC catheter treatment in order to avoid excessive tissue temperatures. Further, the proposed atrial access route of the RFC catheter, as opposed to the retrograde approach used in the ventricular ablations described above, will 17
27 likely avoid many of the possible complications of ventricular access such as chordal entanglement or excessive ablation of the ventricular side of the annulus. Long-Term Thermal Shrinkage Efficacy. A third subset of potential complications of RFC catheter treatment is the possibility of leaflet re-dilation post-treatment, which would compromise the efficacy of the procedure. The potential for thermal shrinkage lesions to redilate has been assessed in other tissues previously. For example, RF ablation to reduce the size of infarct area to improve left ventricular volumes found that tissue re-dilated back to baseline after 30 days [71]. However, the QuantumCor device, with is designed to thermally shrink the MV annular diameter, has been shown to produce reductions in annular diameter that remain durable 6 months post-treatment [54]. Given the disparity in the literature, the potential for MV leaflet re-dilation following RF ablation will be studied in Chapter 6 and Chapter 7. The RFC Catheter as an Alternative to Surgical Leaflet Resection Surgical resection of the MV leaflets is commonly used to address lesions in both fibroelastic deficiency and Barlow s disease and is a mainstay of the most commonly used methodology of degenerative MV repair: the methodology described by Carpentier [42]. Leaflet resection is just one of the repair techniques described by Carpentier, but as several of the other repair techniques were discussed earlier in this chapter and the RFC catheter is intended as a leaflet resection device, only leaflet resection will be discussed here. The goal of the so-called French correction, which is still the most commonly used repair framework and has been shown to be highly successful [23], is to restore the MV structure to as close to normal anatomy as possible. In fibroelastic deficient valves, this 18
.")
28 often means resection of the P2 leaflet segment, since this segment is often enlarged, or contains ruptured chords, or both (Fig. 2.3, left side). In Barlow s valves, resection could be required in any of the MV segments, as leaflets are generally much enlarged with lots of billowing into the atrium (Fig. 2.3, right side). Leaflet resection, when used to treat either of these subtypes, can be carried out to varying degrees. The resection takes place in the area of leaflet enlargement, or if present, on the portion of the leaflet segment containing a ruptured chord (as on the chordal rupture and prolapsing segments seen in Fig. 2.3). Depending on the lesion and severity, leaflet resection may be triangular, quadrangular, or could be a sliding-plasty or butterfly resection (Fig. 2.5) [42, 72]. In the case of quadrangular resection, up to 30% of the leaflet area is often cut out and removed [73]. The opposing leaflet edges on either side of the resection are then sutured together using an interrupted stitch, and any cuts through the annulus are often sutured with a mattress stitch to plicate the annulus in an effort to reduce valve circumference in the case of enlarged valves. Triangular Quadrangular Sliding-Plasty Butterfly Fig. 2.5: Common Leaflet Resection Incisions Geometric differences between the common leaflet resection techniques shown on a healthy porcine posterior leaflet. 19
29 The goal of the RFC catheter is to approximate surgical leaflet resection by thermally shrinking the prolapsing leaflet segments. Instead of physically cutting excess tissue or removing segments with detached chords, the goal is to shrink enough of the enlarged leaflet and surrounding area to replicate the results of leaflet resection. The work presented in the following chapters will show that RFC catheter treatment has to ability to reduce leaflet area by up to 40%, which is within the range of leaflet areas commonly resected surgically [73]. 20
30 Chapter 3 THE STATE OF PERCUTANEOUS MV REPAIR Text and figures for Chapter 3 taken from: Boronyak SM, Merryman WD: The once and future state of percutaneous mitral valve repair. Future Cardiology, Vol. 8, Issue 5, , Introduction Many surgical techniques exist to repair the MV and reduce MR. In any given surgical repair, a combination of techniques may be used, and thus, percutaneous MV repair is not one size fits all. In this chapter, percutaneous MV repair devices currently in use or in development will be discussed, with a focus on those through human or animal trials. Several devices have been in development for percutaneous repair of the MV in the past decade [5]. These percutaneous techniques offer potential improvement over current, conventional surgical procedures in that they have been shown to reduce the need for blood transfusions, decrease rates of infection, and reduce hospital and recovery time significantly [10, 47]. As demonstrated by the recent enrollment in clinical trials for new percutaneous repair devices, patients are taking an interest despite the fact that long-term durability remains to be proven. Additionally, these new percutaneous approaches have the potential to greatly benefit the growing elderly population, who are more at-risk when undergoing invasive surgical procedures. While some percutaneous techniques in development involve replicating repairs that have previously been performed surgically, such as the MitraClip edge-to-edge repair, many percutaneous devices in development alter the MV apparatus using entirely new approaches, such as direct leaflet ablation and coronary sinus (CS) annuloplasty. As a 21
31 result, the long-term efficacy and durability of these repairs is unknown. Evaluation of how these devices affect the mechanics of the MV, either in vitro or in animal models, might offer the possibility to predict long-term efficacy. For example, analysis of the effect of various annuloplasty devices on MV leaflet strains could predict repair durability or indicate that some devices may be more suited for certain types of MV disease [74, 75]. With many leaflet repairs currently being performed in combination with annuloplasty, in the future, multiple percutaneous approaches may be combined to generate a more efficacious repair. In this review, we report on several percutaneous annuloplasty and leaflet repair devices with prior clinical or animal data, and place the results in context with hemodynamic data from in vitro studies. Subtypes of Mitral Valve Disease MV disease can be due to dysfunction of any of the components of the MV apparatus, including the annulus, leaflets, chordae, and papillary muscles, but MR can also result due to abnormalities of the left ventricle (LV) or left atrium. Most causes of MR can be classified into one of two distinct categories, degenerative (primary) and functional (secondary), and most current repair techniques target one of these subtypes [20]. In order to understand how percutaneous repairs will be required to alter the MV apparatus, degenerative MR and functional MR must first be understood in terms of how MV function and morphology is affected. For a comphrensive description of degenerative MR (DMR), see Chapter 2. Functional MR. Another common cause of MR is functional disease due to ischemic left ventricular dysfunction or dilated cardiomyopathy. MV leaflets and chordae frequently appear normal in hearts with functional MR (FMR), but dysfunction of other components 22
32 of the heart affect MV function. FMR is therefore secondary to other disease processes in the heart, frequently those that result in increased LV size. Left ventricular chamber enlargement, regional LV wall motion abnormalities, dilation of the MV annulus, and changes in LV shape may all significantly contribute to FMR [76]. Quantitative echocardiography has demonstrated an increase in the size of the MV annulus, in addition to increased papillary muscle tethering distance as a result of increased LV volume, which may contribute to MR [77]. Additionally, dyssynchrony in papillary muscle activation has also been shown to be a possible contributor to FMR [78, 79], and recently, it was found that it is the impairment of lateral shortening between the papillary muscles during systole, and not passive ventricular size, that impairs systolic valve closure in ischemic MR [80]. Annuloplasty is the dominate mode of repair for FMR, in which implantation of either a flexible or rigid ring sutured to the MV annulus reduces the MV orifice and enhances leaflet coaptation by bringing the leaflets closer together. Recently, cause-specific annuloplasty rings have been developed in order to account for morphologic differences in ischemic and dilated cardiomyopathy. Previous studies have shown that even with similar severity of MR, less enlargement of the LV and mitral annulus occurs in patients with ischemic than with dilated cardiomyopathy. Moreover, leaflet tethering tends to be symmetrical in dilated cardiomyopathy, while leaflet tethering occurs primarily on one side of the valve in ischemic cases [81]. Due to these morphologic differences between dilated and ischemic cardiomyopathy, it may be necessary to develop specialized percutaneous annuloplasty devices capable of correcting the different pathologies. 23
33 Leaflet Repair MitraClip Edge-to-Edge Repair. The Alfieri edge-to-edge repair is one alternative surgical technique, which creates a double-orifice MV by suturing together the anterior and posterior leaflets in the central portion of the valve [82-84]. The suture point of the doubleorifice MV forms a fixed coaptation point, facilitating coaptation of the remainder of the leaflet segments. The MitraClip (Abbott Vascular) was developed in order to replicate this procedure via a percutaneous approach and is currently the most tested percutaneous MV repair technique available [18, 48, 85]. The MitraClip has been used for treatment of DMR and FMR, with reduced MR demonstrated in both subtypes. In place of the sutures used for forced leaflet coaptation, a 4-mm wide implantable, cobalt-chromium clip secures the leaflets together (Fig. 3.1A). The MitraClip system utilizes a 24-F steerable guide catheter that is introduced via transseptal access. A clip delivery catheter then passes through the guide catheter, which can be steered to the delivery site, with the MitraClip attached to the distal end. Several barbs on the center portion of the clip facilitate tissue attachment upon clip closure. One important benefit of the MitraClip device is that the clip can be opened and closed several times during delivery, in order to assess if MR is reduced and that clip attachment is secure. If the procedure cannot be completed, or MR not reduced, the MitraClip can be fully retracted and removed from the body. However, acute assessment of MitraClip efficacy can sometimes be difficult; despite device implantation, 17% of patients in a high risk study were discharged without a significant reduction in MR [48]. Further, it may be difficult to differentiate the effects of general anesthesia from the effects of MitraClip placement on MR during the procedure [85], an issue that may be common to other percutaneous devices as well. 24
![Fig. 3.1: Percutaneous Repair with the MitraClip Detailed drawing of the MitraClip implant, showing the cobalt-chromium clip with barbs to enhance tissue attachment. Reprinted from [86].](/docs-images/79/79362386/images/34-0.jpg "Also depicted is MitraClip placement at the position of the A2-P2 segments of the MV. Reprinted from [87].")

34 Fig. 3.1: Percutaneous Repair with the MitraClip Detailed drawing of the MitraClip implant, showing the cobalt-chromium clip with barbs to enhance tissue attachment. Reprinted from [86]. Also depicted is MitraClip placement at the position of the A2-P2 segments of the MV. Reprinted from [87]. More clinical data exists for the MitraClip than other percutaneous leaflet repair or annuloplasty devices, and two important studies have recently been published from the EVEREST II clinical trial. Results from 12-month assessment of a randomized study comparing percutaneous MitraClip repair with conventional valve replacement or surgery identified a 55% primary end point efficacy for the MitraClip repair group and a 73% efficacy in the conventional surgery group [18]. Primary end point efficacy included freedom from death, freedom from MV surgery, and 3+ or 4+ MR at 12-months. While the MitraClip repair produced less desirable results in terms of efficacy compared with conventional surgery, the MitraClip repair was associated with enhanced safety. The rate of major adverse clinical events at 30 days was found to be 15% in those receiving the MitraClip, compared with 48% in the conventional surgery group. The superior safety results of the MitraClip and sub-optimal efficacy indicate that MitraClip treatment may be most appropriate in high-risk patients who fail to qualify for conventional surgical repair or replacement procedures. 25
35 In the EVEREST II high-risk study, 12-month survival was found to be 76% in those receiving the MitraClip device, compared with 55% of the comparator group, who either did not enroll or were anatomically ineligible for MitraClip placement [48]. Additionally, 78% of patients receiving the MitraClip with matched baseline and 12-month data had MR 2+. However, only 54% of all patients who received the MitraClip had MR of 2+ at 12- months. More recently published results from the German transcatheter mitral valve interventions registry demonstrated similar device efficacy, as 313 out of 471 (66%) patients who received MitraClip treatment had MR grade 1 or lower upon follow-up [88]. Inhospital mortality was found to be 2.5%, and post-discharge mortality was 12.5%. Results from echocardiographic assessment of patients with MitraClip implantation in the highrisk study, as well as a study involving 104 patients not amenable for surgery, are included in Table 3.1 [48, 89]. Mechanical Studies of Edge-to-Edge Repair. Several in vitro studies have previously been performed to analyze the effects of the edge-to-edge repair on MV mechanics and functionality, and while they have all used the conventional form of edge-to-edge repair with sutures, the results of these studies can be used to aid in prediction of long-term MitraClip efficacy. Many of these in vitro studies, with a focus on valve mechanics and hemodynamics, have provided insight into the use of edge-to-edge repair without annuloplasty, as prior data has suggested sub-optimal mid-term results from edge-to-edge repair alone [90]. Jimenez et al used in vitro testing in a left heart flow simulator to decouple the effects of MV annular area, transmitral pressure, and mitral flow rate on the force exerted on the suture (stitch force) in the edge-to-edge repair [91]. Results indicated that annular dilation negatively impacted the efficacy of edge-to-edge repair, as peak systolic 26
36 stitch force increased linearly with increasing annular area, and this could lead to a reduction in long-term durability of edge-to-edge repair. Additionally, peak diastolic stitch force increased with decreasing mitral annular area. These results indicate that combined annuloplasty may be necessary in many patients to increase durability of the edge-to-edge repair by reducing annular dilation. Further study by Croft et al demonstrated that edge-toedge repair alone can reduce, but not completely eliminate, MR due to annular dilation [92]. It was also found that edge-to-edge repair alone is ineffective at reducing MR due to papillary muscle displacement, providing evidence that in many cases, edge-to-edge repair may be secondary to annuloplasty in reduction of MR. A more recent in vitro study by Bhattacharya et al demonstrated that the tension generated by the MV on the annulus is not completely restored following edge-to-edge repair in a chordal elongation model, leading to an imbalance between the inward annular tension generated by the MV apparatus and the outward force generated by the left ventricular myocardium [93]. This force imbalance at the mitral annulus could be a possible mechanism for annular dilation to occur following treatment of MR due to MV prolapse, and recurrent MR due to progressive annular dilation is a possibility that must be examined. Interestingly, echocardiographic analysis of the patients enrolled in the MitraClip EVEREST II high-risk study at 12-months showed decreases in the LV endsystolic (-10.0%) and end-diastolic volumes (-15.7%), in addition to a decrease in the septallateral diameter (-6.3%) of the mitral annulus (Table 3.1) [48]. These reductions are contrary to the results suggested by the in vitro annular tension study and suggest that MitraClip treatment may actually result in favorable remodeling of the LV following the first 12- months after treatment. Favorable LV remodeling was reported to occur in patients with FMR, as well as DMR. 27
37 Table 3.1: Assessment of Percutaneous MV Repair Devices: Data from Clinical Trials Acute Treatment Study Repair Type Ref n Pre Post %Δ n Pre Post %Δ n Pre Post %Δ n Pre Post %Δ n Pre Post %Δ 1-month 6-month Regurgitant Volume (ml) LVESV (ml) LVEDV (ml) S-L Diameter Diastole (ml) S-L Diameter Systole (ml) MitraClip EVEREST II Leaflet Repair [85] Monarc EVOLUTION I Annuloplasty * [94] MitraClip EVEREST II Leaflet Repair [48] Monarc EVOLUTION I Annuloplasty * [94] Carillon AMADEUS EU Annuloplasty * [96] MitraClip EVEREST II Leaflet Repair [48] Monarc EVOLUTION I Annuloplasty * [94] Carillon AMADEUS EU Annuloplasty * [96] 12-month MitraClip EVEREST II Leaflet Repair [48] MitraClip Leaflet Repair [89] Monarc EVOLUTION I Annuloplasty * [94] * indicates distinction between diastolic and systolic S-L diameter was not made LVESV, left-ventricular end-systolic volume; LVEDV, left-ventricular end-diastolic volume; S-L Diameter, septal-lateral diameter All data are from transthoracic echocardiography 28
38 One possible explanation that might account for some of the reduction in LV endsystolic volume, LV end-diastolic volume, and the septal-lateral diameter seen in this study is that the number of patients with matched data decreased from baseline (n = 72) to 12- months (n = 56) in the high-risk study. Additionally, when the difference between MitraClip repair and surgery was analyzed for FMR and DMR, it was found that surgery produced significantly better outcomes for DMR, while there was little difference in outcome between MitraClip repair and surgery for FMR. Therefore, while annular dilation following treatment of DMR with the MitraClip should be considered a possibility in longterm outcomes, current clinical data suggests that remodeling of the MV annulus and LV due to MitraClip therapy is favorable. Longer follow-up studies will be necessary to confirm the effects of MitraClip treatment on LV remodeling. Annuloplasty Devices Coronary Sinus Annuloplasty. Annuloplasty rings have been essential for surgical repair of MR due to both functional and degenerative etiologies, and several percutaneous annuloplasty approaches are currently in development. Coronary sinus (CS) annuloplasty approaches, in particular, have received a great deal of interest, due to ease of access and prior history of device implantation in the coronary vessels. As the CS sits within close proximity to the MV annulus, shortening of the CS effectively reduces the septal-lateral diameter of the annulus by forcing the posterior annulus in the anterior direction. The Monarc device (Edwards Lifesciences) is one percutaneous approach that utilizes a nitinol implant consisting of distal and proximal self-expanding, stented anchors with an interconnecting, spring-like bridge segment that provides shortening tension (Fig. 3.2A) [94, 95]. Both distal and proximal anchors are held in place by using an anchor 2 mm 29
39 to 4 mm larger in diameter than the CS. The delivery system of the Monarc device includes a 12-F guide catheter and dilator, and a 9-F delivery catheter with access via the internal jugular vein. The Monarc also contains a biodegradable element incorporated within the spring-like bridge segment, preventing complete spring tension at initial device implantation. As the biodegradable element absorbs over the first month, shortening of the device continues until full spring tension is achieved. Safety and efficacy of the Monarc device were recently reported in the EVOLUTION I study, where device implantation was successful in 82% of patients with FMR [94]. Implantation of the device could not be completed in the remainder of study patients due to tortuosity of the CS or lack of correctly sized devices, indicating that CS devices may not be appropriate for all patients. Additionally, 81% of patients experienced a reduction in MR grade of 1, and average regurgitant volume was reduced by >20% and maintained for 12- months (Table 3.1). Monarc implantation also seemed to provoke favorable MV and LV remodeling, with septal-lateral diameter, LV end-systolic volume, and LV end-diastolic volume all decreasing over the 12-month study period. Despite demonstrating safety and efficacy, further study of the Monarc device has stopped due to slow patient enrollment. The Carillon Mitral Contour System (Cardiac Dimension, Inc.) is another CS annuloplasty device that operates on a similar principle [96-98]. The implant is constructed out of nitinol wire consisting of expandable distal and proximal anchors, connected by a tensioning bridge (Fig. 3.2B). A 9-F delivery catheter is used to place the distal anchor. The delivery catheter is retracted to allow expansion of the anchor and then advanced to complete anchor expansion. Manual traction on the delivery catheter is used to provide tension on the CS and MV annulus, and the proximal anchor is then released and expanded. The result of placement of the Carillon device is that the septal-lateral diameter 30
40 is reduced. Unlike the Monarc device, this septal-lateral diameter reduction occurs immediately, and no further changes in bridge tension are designed to occur. The benefit of this design is that changes in MR can be immediately assessed, and the device can be removed if no improvement occurs. Assessment of the Carillon device in the AMADEUS EU trial resulted in successful device placement in 30 of 48 patients with FMR, with failed placement in 18 due to a combination of CS access complications, slipping of the distal anchor, vessel perforation, and insufficient reduction in FMR [96]. By 30-day follow-up, 13% of patients had experienced a major adverse event. Echocardiographic assessment of the Carillon device indicated favorable changes at 1-month and 6-month time points: regurgitant volume decreased by over 30%, and reductions in LV end-systolic volume and LV end-diastolic volume, along with a significant decrease in septal-lateral diameter, were also observed (Table 3.1). Further clinical trials are currently underway. A percutaneous CS annuloplasty device that uses a different approach to reduce the septallateral diameter is the cerclage annuloplasty technique [99]. The cerclage technology uses a guide-wire that is looped around the MV annulus and LV outflow tract, which is then replaced by a suture (Fig. 3.2C). Tension exerted on the suture constricts the MV annulus, reducing the septal-lateral diameter and the annulus circumference. The guide-wire is introduced via a 9-F introducer sheath into the right jugular vein. The guide-wire then crosses through the CS, enters the proximal great cardiac vein, and then proceeds into the first septal perforator vein, where it crosses the myocardium into either the right atrium or ventricle. The guide-wire is then ensnared in the right side of the heart and exchanged for a suture and tension-fixation device. The resulting implant is a suture, tensioned to approximately 400 grams, that encircles both the MV annulus and LV outflow tract. Early 31
41 results from the cerclage technology in a porcine model demonstrated septal-lateral shortening of the MV annulus without introduction of a pressure gradient across the LV outflow tract. In order to prevent compression of entrapped coronary arteries located between the CS and MV annulus, a rigid-arch protection device was developed to direct compressive forces away from the entrapped artery. The rigid-arch protection device is a nitinol implant, 1.5 mm in outer diameter, and is placed under coronary angiography. Testing of the coronary artery protection device verified that no vessel compression or significant pressure gradient was present following implantation and tensioning of the Cerlage. Successful implantation of the cerclage occurred in 14 out of 16 consecutive swine in an initial feasibility study [99]. The cerclage technology also demonstrated acute reductions in septal-lateral diameter, LV end-systolic volume, and LV end-diastolic volume in a model of ischemic cardiomyopathy (Table 3.2). The cerclage technology addresses two common issues with CS annuloplasty devices: variable vessel anatomy, which can prevent placement of a large device in thecs, and coronary artery entrapment, in which vessels between the CS and MV are compressed due to the forces generated by the annuloplasty device. While CS annuloplasty has been shown to reduce MR, induce favorable LV remodeling, and reduce the septal-lateral diameter of the MV annulus (Table 3.1), the changes in these values are much less than those recorded with surgical annuloplasty. Surgical treatment of MR using leaflet, chordal, or papillary muscle repair in combination with an annuloplasty ring has produced reductions in the septal-lateral diameter by as much as 40-50% and reduced LV end-diastolic and end-systolic volumes by 20-30% (Table 3.3) [100]. While CS annuloplasty has yet to be used in combination with any other repair, a comparison of these results demonstrates that CS annuloplasty may not be as effective as 32
42 Table 3.2: Assessment of Percutaneous MV Repair Devices: Data from Animal Studies Acute Regurgitant Volume (ml) LVESV (ml) LVEDV (ml) Treatment Animal Repair Type Method Ref n Pre Post %Δ n Pre Post %Δ n Pre Post %Δ n Pre Post %Δ n Pre Post %Δ Cerclage Porcine Annuloplasty MRI [99] Direct Leaflet Ablation Canine Leaflet Repair TTE [10] QuantumCor Ovine Annuloplasty ICE * [53] 6-month QuantumCor Ovine Annuloplasty ICE [53] * indicates distinction between diastolic and systolic S-L diameter was not made LVESV, left-ventricular end-systolic volume; LVEDV, left-ventricular end-diastolic volume; S-L Diameter, septal-lateral diameter TTE, transthoracic echocardiography; MRI, magnetic resonance imaging; ICE, intracardiac echocardiography S-L Diameter Diastole (ml) S-L Diameter Systole (ml) 33
43 surgically-implanted annuloplasty rings. Challenges and limitations of the various percutaneous CS annuloplasty and MV repair techniques are summarized in Table 3.4. Anatomical and Mechanical Studies of the Coronary Sinus. One of the challenges that must be addressed in development of percutaneous CS annuloplasty devices is the variable anatomic relationship of the CS and MV annulus between patients. Prior study using multislice computed tomography (CT) has indicated that the CS ostium the location of the proximal anchor in the Monarc and Carillon devices lies at the same level as the atrioventricular groove in only 54.5% of patients at end-systole [101]. This number drops to less than 10% for locations midway between the great cardiac vein (GCV) and CS ostium. Other studies using cadaveric hearts have indicated that the CS is superior to the MV annulus in normal hearts by a mean distance of approximately 9.7 mm from the P2 scallop [102]. For maximum effectiveness, the CS should lie within the same plane as the MV annulus. As the CS is used to displace the posterior section of the MV annulus, these results indicate that efficacy of percutaneous CS annuloplasty devices could be compromised in a large group of patients. Moreover, relative positioning of the CS and MV annulus has been shown to vary based on the degree of annular dilation, LV and left atrial enlargement, and severity of MR. Multi-slice CT has shown that a shift of the CS towards the MV annulus occurs with left atrial and LV enlargement [103]. However, some studies indirectly contradict these results, indicating that increased MR severity and annular dilation leads to an increase in the CS to MV annulus distance [104, 105]. Differences in measurement techniques and the longitudinal position along the CS in which the measurement was taken could account for these differences. Assessment of CS anatomy of each patient will be important in the future to determine eligibility for device placement. 34

![coronary sinus. Reprinted from [94].](/docs-images/79/79362386/images/44-1.jpg "The device consists of two stent-like anchors placed in the CS/GCV and CS")


44 A B C D Fig. 3.2: Percutaneous Annuloplasty Devices A: The Monarc implant located in the coronary sinus. Reprinted from [94]. The device consists of two stent-like anchors placed in the CS/GCV and CS ostium and a connecting bridge segment. B: The Carillon device operates on a similar principle, with two expandable anchors connected by a nitinol bridge. C: The cerclage system uses a wire, placed percutaneously, to encircle the MV apparatus and LV outflow tract. Reprinted from [99]. D: The QuantumCor device utilizes RF ablation to directly reduce the MV annulus circumference, without leaving an implant behind. Reprinted from [106]. 35
45 Table 3.3: Echocardiographic Assessment of Surgical MV Repair with Annuloplasty Treatment LVESV (ml) LVEDV (ml) Avg S-L Diameter (ml) n Pre Post %Δ n Pre Post %Δ n Pre Post %Δ 3 months Carpentier-Edwards Physio ring Cosgrove-Edwards band months Carpentier-Edwards Physio ring Cosgrove-Edwards band Data were acquired using real-time 3D echocardiograpy. LVESV, left-ventricular end-systolic volume; LVEDV, left-ventricular end-diastolic volume; S-L diameter, septal-lateral diameter Data taken from [100] Another anatomical consideration in design of percutaneous CS annuloplasty devices is the possibility of coronary arteries traversing between the CS and MV annulus. Estimates vary, but coronary arteries have been determined to traverse between the CS and MV annulus in as many as 68-86% of patients [101, 103, 105]. Additionally, when only patients with severe MR were analyzed, the number of coronary arteries traversing the CS and MV annulus was 97% [103]. Compression of the coronary arteries due to percutaneous CS annuloplasty devices could lead to heart failure if severe enough and may exclude many patients from being eligible for device placement. The design of the cerclage device introduced a rigid-arch protection device that re-distributes the compressive forces exerted by the device on the CS, reducing coronary artery compression [99]. Future CS annuloplasty approaches may include a similar device. As percutaneous CS annuloplasty devices exert considerable force on and around the MV apparatus, analysis of how these devices alter MV geometry and mechanics may be essential in prediction of the long-term efficacy and durability of repairs. Devices that increase leaflet strains, increase chordal elongation, or prevent annular dynamic motion may compromise long-term durability. Previous studies have tracked MV annular and/or 36
46 leaflet motion in animal models using several methods, including: radiopaque, tantalum markers sutured to the annulus or leaflet surface and imaged using videofluoroscopy [107, 108], sonomicrometry using piezoelectric markers sutured to the MV annulus [109, 110], and 3-dimensional echocardiography [111, 112]. These studies have been used to determine that traditional, rigid annuloplasty rings unfavorably reduce MV annular dynamics by reducing the natural, sphincteric motion of the MV [108] and also increase excursion of the anterior leaflet, leading to higher bending stresses on the leaflet and possibly reduced repair durability [107]. Future assessment of percutaneous CS annuloplasty approaches could use these methods to enhance device design and predict long-term outcomes. Additionally, use of a technique for non-invasive assessment of MV annular dynamic motion using 3-D echocardiography was reported in an ovine model of ischemic cardiomyopathy [111]. Results demonstrated that percutaneous CS annuloplasty can reduce MV annular area without significantly reducing annular excursion, or its superiorinferior motion. The use of 3-D echocardiography to assess MV annular dynamic motion may play an important role in future assessment of percutaneous annuloplasty devices undergoing clinical trials. In addition to the forces exerted by CS annuloplasty devices on the left heart, the CS/GCV undergoes a significant amount of motion over the course of the cardiac cycle. The dynamic motion of the CS/GCV imparts bending stresses on CS annuloplasty implants, and this may lead to degradation over time. In initial human trials with an early iteration of the Monarc device, separation of the nitinol bridge segment occurred in 3 out of 4 patients, necessitating a re-design of the device [95]. In order to better understand interactions between percutaneous CS annuloplasty devices and the CS vessel, prior study has analyzed the mechanical properties of the porcine and human CS. Pressure-inflation testing of the 37
47 porcine CS demonstrated that the CS exhibited an S-shaped pressure-radius response the CS is very distensible at low pressures (10-30 mmhg) and much stiffer at high pressures (40-80 mmhg) [113]. The CS was also found to dilate up to 88% at a pressure of 80 mmhg, and model fitting generated material parameters that can potentially be used for finite element simulations of device-tissue interactions. The biaxial mechanical properties of the CS were also quantified to compare differences between aged human, porcine, and ovine tissues, and the aged human CS was found to be significantly stiffer in both the circumferential and longitudinal directions than the porcine or ovine CS [114]. As it is generally older individuals who will receive percutaneous MV repairs, these results could have important implications in moving from animal to human clinical trials. Previously, the dynamics of the CS/GCV have been studied using CT angiography and indicated that the distance between the CS/GCV and the MV annulus can change by as much as several millimeters over the cardiac cycle, with the greatest distance occurring during end-systole [101]. The diameter of the CS/GCV also changes considerably over the cardiac cycle, and changes over 2 mm occur near the CS ostium. While motion of the CS/GCV relative to the MV annulus can be recorded, no estimates currently exist for the amount of force that may be exerted on devices within the CS. Further analysis of the dynamics between the CS/GCV and MV annulus may lead to more durable percutaneous CS annuloplasty approaches. Direct Annuloplasty. In addition to approaches that re-shape the MV annulus via CS implants, several devices are currently in development that more directly alter the geometry of the MV annulus. These devices place an implant directly into the MV annulus in order to cinch the annulus and reduce the septal-lateral diameter. Two devices are of note, as they have demonstrated first-in-man results, although these results are yet to be 38
48 published. The first of these is the Mitralign technology (Mitralign, Inc.), which places a pair of pledgets, via LV access, near each of the commissures that are then plicated and locked to reduce the septal-lateral diameter. The procedure had been performed in at least 12 patients thus far. The second device is the Accucinch Annuloplasty System (Guided Delivery Systems), also with first-in-man results. The Accucinch system uses an implant that encircles the MV annulus from one trigone to the other and uses a circumferential cinching force to restrict the annular size. Mechanical analysis of the effects of these devices on the MV structure is limited, and further study will be necessary to assess the utility of these devices in treating MR. QuantumCor Direct Annular Ablation. One potential application for RF ablation in treatment of MR is direct annular ablation. The QuantumCor device (QuantumCor, Inc.) utilizes a circular probe that incorporates 7 RF electrodes around its radius [53, 54, 106]. The QuantumCor probe conforms to the annulus shape (Fig. 3.2D), and application of RF energy is applied directly to the annulus in order to reach electrode-tissue interface temperatures of at least 65 C. Like the MV leaflets, the annulus structure is supported by collagen, and application of RF energy to the MV annulus reduces the annulus circumference, with the intention of improving leaflet coaptation. Acute study of the effects of RF ablation on annular size in an ovine model demonstrated a 23.8% reduction in septal-lateral diameter, with no thrombosis or damage to nearby coronary arteries, CS, or MV leaflets [53]. However, this study was performed in 16 healthy sheep with no or natural occurring MR, and the procedure was performed under cardiopulmonary bypass via access through the left atrial appendage. A 6-month follow-up study of 7 animals demonstrated that the reduction in septal-lateral diameter 39
49 was durable, with a 26.4% reduction from baseline [54]. The QuantumCor device generated the largest percent reduction in septal-lateral diameter of any percutaneous device; however, the effect of this change on moderate to severe MR has not been assessed. Further study will be needed to determine device efficacy in a model of MR. Conclusion Percutaneous MV repair devices have received a great deal of interest in recent years, and several devices have been tested in animal models and clinical trials. Many of these devices attempt to mimic repairs that are currently performed surgically, including the MitraClip edge-to-edge repair and various percutaneous annuloplasty devices. As several of these devices alter the MV apparatus in new ways, including RF ablation treatment and CS annuloplasty, knowledge of the long-term efficacy and durability of these repairs is unknown. While it is still vitally important to analyze the effect of each device on acute MR reduction, MR recurrence rate, and mortality, engineering analysis of these devices can serve a role as a predictor of long-term outcomes. In vitro studies and animal testing have already led to insights into the changes that various percutaneous MV repair devices effect on the MV apparatus, but the amount of published studies in this area is still limited. Percutaneous MV repair devices have been demonstrated to be less efficacious than surgical repair; in general, current percutaneous techniques have only been able to reduce mitral regurgitant volumes by approximately 20-40% and reduce MR by about 1 grade. Further mechanical analysis of percutaneous MV repair may be able to reveal the reasons for these sub-optimal results. For now, percutaneous MV repair devices are most suitable for high-risk patients who are ineligible for open-chest surgery. However, this is still a significantly sized group of potential patients, as a 2007 survey found that 49% of patients 40
50 with severe symptomatic MR were not operated on due to old age, impaired LV function, or multiple co-morbidities [4]. Prior data has suggested that treatment with percutaneous repair produces superior outcomes in high-risk patients, and when all patients are considered, percutaneous treatment reduces the complication rate compared with openchest repair or replacement. With safety rates in mind, several percutaneous MV repair devices may be used to treat high-risk patients in the near future; however, efficacy of these devices must be improved before widespread usage can begin. Finally, current percutaneous treatments for MR have been shown to be limited in their usage based on variability in patient anatomy and the type of lesion present. Some of these limitations are summarized in Table 3.4. As a result, no one percutaneous approach will be correct for all patients or causes of MR. Table 3.4: Challenges and Limitations in Percutaneous MV Repair Devices Edge-to-Edge Repair Limited to treatment of regurgitant jets originating from malcoaptation of the middle scallops of the anterior and posterior leaflets [48] Can introduce moderate stenosis in MVs with an annular area <4.0 cm 2 [48] Leaflet geometry must meet several requirements: coaptation length 2 mm, coaptation depth <11 mm, flail gap <10 mm, flail width <15 mm [18, 48] RF Ablation (Leaflet, Chordae, and Annulus) Procedure cannot be reversed if too much RF energy is applied or MR is not reduced Introduces the potential for permanent damage to surrounding structures Mechanical strength of ablated tissues may be temporarily reduced [54] Creates detectable regions of coagulation necrosis [10, 54] CS Annuloplasty Variable position and size of the CS in relation to the MV annulus between patients limits the number of patients who are anatomically eligible for device placement [ ] The superior position of the CS in relation to the MV annulus reduces the cinching effect of percutaneous CS devices on the posterior annulus [102, 103] The CS undergoes significant motion relative to the MV annulus during the cardiac cycle, imparting strain on devices implanted in the CS [101] Coronary arteries frequently traverse between the CS and MV annulus and can be compressed and restricted by percutaneous CS devices [101, 103, 105] 41
51 Future Perspective Many forms of MV repair currently utilize multiple techniques to reduce MR, especially in treatment of DMR. Leaflet resection or edge-to-edge repair is often used in combination with an annuloplasty ring in order to enhance leaflet coaptation and prevent annular dilation. Future use of percutaneous MV repair devices, several years from now, may take a similar approach by combining multiple devices to enhance the efficacy of MR reduction. As most published results of percutaneous MV repair devices typically report MR reduction by approximately 1 grade, combining multiple devices for enhanced efficacy may be likely in the future. Most percutaneous MV repair devices have gone through their first published testing in animal models, but the development of in vitro flow loops and other methods of bench-top analysis can permit assessment of many percutaneous repair devices before undergoing costly animal testing. In vitro mechanical testing and marker tracking in animal models can provide quantitative information about how current and future percutaneous repair devices alter MV mechanics and geometry, leading to insights into the durability and long-term efficacy of repairs. Additionally, more advanced quantitative imaging techniques, including multi-slice CT and 3-D echocardiography will enable better clinical assessment of patient eligibility and device function, both acutely and long-term. As it is difficult to duplicate the complex surgical repairs that are currently performed under open-heart surgery, development of future percutaneous repair devices may be very specific to the MV structure affected including the MV annulus, leaflets, chordae, papillary muscles, and the LV. In terms of the capability of treating each of these structures, the field of percutaneous MV repair devices is relatively new, but recent developments may have the ability to treat many of these structures in the coming years. 42
52 Executive Summary Introduction Current percutaneous devices have the ability to reduce MR by approximately 1 grade, which is less than that typically achieved by surgical repair or replacement of moderate-severe and severe MR Due to reduced rates of efficacy and increased safety compared with open-heart Leaflet Repair surgical repair and replacement, current percutaneous approaches are most suitable for high-risk patients who are ineligible for current treatments The MitraClip facilitates leaflet coaptation by creating a double-orifice MV, and the EVEREST II trial has demonstrated a 55% end-point efficacy at 12-months RF ablation, combined with cryo-anchoring for catheter stability, can reduce leaflet size with the application of thermal energy. In vivo results are limited, and further study is needed Annuloplasty Devices The Carillon and Monarc CS annuloplasty devices create septal-lateral shortening via placement of a metal implant in the CS; however, variations in patient-to-patient anatomy, including the height of the CS relative to the MV annulus and coronary arteries that may traverse between the CS and MV will limit the use of this technology The cerclage technology uses a suture, threaded around the MV annulus and LV outflow tract, to generate cinching, and features a rigid-arch protection device to protect against coronary artery compression 43
53 The QuantumCor device uses RF ablation to reduce the MV annular circumference, demonstrating a >20% reduction in an initial feasibility study Future Perspective In the future, percutaneous annuloplasty approaches may be used in combination with percutaneous leaflet repair techniques to increase overall efficacy and durability Analysis of how novel percutaneous approaches affect MV mechanics may provide insight into the long-term efficacy of repairs 44
54 Chapter 4 THE RFC CATHETER SYSTEM RFC Catheter Design Considerations The focal point of this work is the design and performance of the RFC catheter for thermal shrinkage of MV leaflet tissue. Throughout the development process, it has been necessary to design and build several different RFC catheter prototypes in order to execute different experiments and to iteratively improve thermal shrinkage performance. These prototypes have been designed for static bench testing (Fig. 4.1A), for bench testing in a dynamic left heart flow simulator (Fig. 4.1B), and for in vivo animal studies (Fig. 4.1C). As described in previous chapters, the RFC catheter uses an RF ablation element to produce tissue temperatures greater than 65 C for tissue shrinkage. To provide constant contact with the MV leaflets in a beating heart environment, a cryo-anchoring element is used and cooled to temperatures between -20 C and -50 C. The novelty of the RFC catheter is the combination of these two elements resistive heating of the RF electrode and sub-freezing temperatures of the cryo-anchor into one therapeutic device. The design goal is to place these two opposing elements on a catheter such that 1) RF electrode contact with the leaflet tissue is maximized and 2) the RF ablation and cryo-anchoring elements do not interfere with each other. As the RFC catheter is intended as a percutaneous repair device, the final design must be optimized for vascular access and maneuverability in the heart. Thus, catheter outer diameter must remain small (10 Fr or less) and the distal catheter tip segment must be steerable in at least one direction. The prototype for in vivo use described below was designed with these considerations in mind. When used percutaneously, the RFC catheter 45


55 A B Cryo-Anchor RF Electrode RF Electrode D Cryo Anchor Insulating Spacer RF Element LN 2 To Vacuum C E Cryo-Anchors RF Electrode Cryo-Anchors Fig. 4.1: Evolution of Catheter Prototypes A: RFC catheter prototype for static bench experiments. B: RFC catheter prototype for bench studies in a left heart flow simulator. C: Close view of the RFC catheter prototype for non-survival animal studies. D: CAD drawing of the static bench prototype with liquid nitrogen or nitrous oxide delivery. E: CAD drawing of a prototype for non-survival animal studies showing the positions of the cryo-anchors and RF electrode. 46
56 is intended for use with a bi-directional steerable sheath via femoral access. The steerable sheath is guided up through the vena cava and into the right atrium, where a Brockenbrough needle is used to puncture the interatrial septum to pass the sheath into the left atrium. The RFC catheter is then passed through the sheath and into the left atrium, where it can be guided to the leaflets by transesophageal echocardiography and/or fluoroscopy. Static Bench Prototype for Initial Feasibility Studies In order to first demonstrate the feasibility of using cryo-anchoring and RF ablation together on a catheter, and to determine the geometrical and mechanical effects of RF ablation and cryo-anchoring treatment of MV leaflets, a simple prototype for static bench top experiments was developed (Fig. 4.2A). This prototype uses liquid nitrogen to cool the catheter tip, delivered through a large (0.05 inner diameter) polyimide tube housed inside the main catheter body of Nylon 12. The 1.9 mm long cryo-anchor of the static prototype is located at the most distal point on the catheter shaft, with a 1.9 mm long RF electrode located just proximal. The outer diameters of the RF electrode and cryo-anchor are 4 mm (12 Fr). A thermocouple is used to monitor the cryo-anchor temperature and liquid nitrogen is removed from inside the catheter under vacuum. A commercially available RF generator (Osypka) is used to deliver RF energy to the catheter (Fig. 4.2B). The cryo canister is electrically controlled in a binary fashion using an attached servo motor. Cryogen and RF energy delivery protocols were programmed on an Arduino microcontroller for repeatability. This was the first RFC catheter prototype, and it enabled the first tests of treatment feasibility to be performed on the lab bench. These experiments are described in Aim 1. 47


57 To Liquid Nitrogen Canister To Vacuum RF Wire Cryo Anchor RF Electrode Thermocouple A Cryo Canister RF Generator Servo Motor B Control System Catheter Prototype Solenoid Valve Fig. 4.2: First RFC Catheter Prototype Static Bench Prototype A: The RFC catheter static bench prototype. B: Complete static bench prototype including the RF energy and cryogen delivery systems. The compact design of the static bench prototype enables quick and easy experiments to be performed on the lab bench when steerability or extended reach are not needed. 48
58 RFC Catheter Prototype for In Vivo Studies The current iteration of the RFC catheter is a custom device built on a steerable Freezer MAX Cardiac Cryoablation catheter (Medtronic, Minneapolis, MN). The rationale for using the Freezer MAX catheter is that components for a steerable catheter are not readily available off the shelf, and using existing components reduces cost and development time. Additionally, all cryo components are already integrated into the Freezer MAX catheter. Several non-trivial modifications were made to the Freezer MAX catheter, and a comprehensive guide to fabricating the RFC catheter can be found in the Appendix. The modifications begin with machining of the cryo applicator to provide space for the RF electrode by removing a void of material in the middle of the cryo applicator with an end mill (Fig. 4.3). The void in the cryo-anchor is then filled with epoxy to provide insulation, and a mm (10 Fr) diameter RF electrode is placed over it. This configuration results in one cryo-anchor on either side of the RF electrode, providing maximum leaflet contact between the RF electrode and MV leaflet (Fig. 4.4A). It has been found through trial and error that cryo-anchor size does not need to be significant in comparison to the RF electrode. Cryo-anchors with outer diameter 2.3 mm (7 Fr) and 1 mm long on either side of the RF electrode are sufficient for robust leaflet cryo-anchoring. The completed catheter tip consists of an RF electrode placed between two cryoanchors, and the RF electrode is kept electrically insulated (Fig. 4.4A). Liquid nitrous oxide delivery to the inside of the catheter tip, which is kept under vacuum, provides the cooling power for the cryo-anchors. The catheter steering system, cryo thermocouple, and cryogen delivery tubes were retained, largely unmodified. The RF electrode wire and RF thermocouple are run outside the Freezer MAX catheter shaft and secured with clear FEP shrink tubing. All inputs and outputs to the catheter can be seen in Fig. 4.4B. 49


59 Void for RF Electrode Cryo-Anchors Fig. 4.3: Cryo-Anchor Dimensions Dimensions of the cryo-anchor of the RFC catheter for in vivo use. A RF Electrode B Vacuum Out N 2 0 In Cryo-Anchor Thermocouple Cryo-Anchor Ice Ball Formation Catheter Handle RF Electrode Thermocouple RF Delivery Wire C Fig. 4.4: RFC Catheter Prototype for In Vivo Use A: RFC catheter tip showing the orientation of the RF electrode and cryo-anchors, with ice ball formation. B: Modified Freezer MAX catheter handle with new inputs and outputs for cryogen delivery, temperature measurement, and RF ablation. C: Complete RFC catheter control system with RF generator, cryogen delivery system and nitrous oxide tank, and control electronics. 50
60 To control and measure the outputs to the RFC catheter, control software and electronics were developed using LabView and the open-source Arduino platform (Fig. 4.5). The software controls nitrous oxide delivery to the catheter tip by regulating the duty cycle to a cryogenic solenoid based on the temperature desired. Once the nitrous oxide delivery lines have been primed, cryo-anchoring temperatures are achieved within 1 second after the user initiates the cryo-anchor (Fig. 4.6). RF power output to the catheter electrode is set on a commercial RF generator (EPT-1000, Boston Scientific). The control software records temperature data from the RFC catheter and uses this information to regulate the cryogenic solenoid duty cycle to modulate cryo-anchor temperature. During ablation treatment, ablation temperature is monitored and RF power is manually throttled to maintain ablation temperature within a pre-determined range. For maximum ablation effectiveness, it is desirable to use the highest ablation power that does not result in excessive tissue charring or coagulum formation [49]. As the RF electrode is in very close proximity to the cryo-anchors on the RFC catheter, RF electrode temperature, and the measurement junction, are significantly affected by the cryo-anchors. Thus, the ideal RF electrode temperature is actually many degrees cooler than the desired tissue temperature. Calibration of the desired RF electrode temperature is described in the Appendix. Control software, cryo delivery hardware, and control system electrical schematics can also be found in the Appendix. Key to the RFC catheter treatment strategy is its ability to selectively cryo-anchor to the MV leaflets, depending on the location of leaflet enlargement or chordal rupture. In a simulated flow environment, leaflet attachment is possible to one (Fig. 4.7A-B) or both leaflets (Fig. 4.7C) at a time, depending on the placement of the catheter in relation to the leaflet free edge. Cryo-anchoring to regions closer to the free edge are more likely to result 51

61 Liquid Phase Air Phase in bi-leaflet attachment, while cryo-anchoring in the leafelt belly region or closer to the annulus results in single leaflet attachment. The positions of the cryo-anchors on either side of the RF electrode encourage direct contact with the leaflets for enhanced tissue heating. The studies that follow in the remaining chapters will report RFC catheter performance according to the three specific aims discussed in Chapter 1. RF Generator Footswitch RF & cryo temperatures RF power and resistance data Cryo Control System Cryo duty cycle Temperatures Footswitch LabView Data Capture Thermocouple Amplifier Thermocouple Filter Catheter Cryogenic Solenoid Valve To Vacuum Pressure Regulator N 2 0 Tank Dip Tube Ground Fig. 4.5: RFC Catheter System Key Components and Data Transfer Between Systems Schematic representation of RFC catheter system key components. Pads A Cryo-Anchor Formation B Cryo Temperature Temperature ( C) Time: 0.0 s Time: 1.0 s Time (s) Fig Time to Cryo-Anchor A: Time to cryo-anchor onset with catheter shown in a left heart flow simulator flowing at 5 L/min. Left panel: nitrous oxide flow off. Right panel: cryo-anchor temperatures have been achieved. B: Typical cryo-anchoring temperature measurements during in vivo use


")


62 A: Anterior Leaflet Attachment B: Posterior Attachment C: Bi-Leaflet Attachment Fig. 4.7: RFC Catheter Cryo-Anchoring in a Physiologic Flow Environment Various RFC catheter cryo-anchoring placements shown in a left heart flow simulator at physiologic flow rates and pressure. A: Anterior leaflet attachment in systole (left) and diastole (right). B: Posterior leaflet attachment in diastole. C: Bi-leaflet attachment, with the catheter cryo-anchors placed close to the leaflet free edge. Bi-leaflet cryo-anchoring forms a double-oriface valve, similar to that produced by an edge-to-edge repair. 53
63 Chapter 5 AIM 1 PART 1: INITIAL RFC CATHETER DEVELOPMENT AND FEASIBILITY EXPERIMENTS Text and figures for Chapter 5 taken from: Boronyak SM, Merryman WD: Development of a Simulataneous Cryo-Anchoring and Radiofrequency Ablation Catheter for Percutaneous Treatment of Mitral Valve Prolapse. Annals of Biomedical Engineering Vol. 40. Issue 9, , Introduction The purpose of this study was to determine the feasibility of using cryo-anchoring and RF ablation on the same catheter tip and to quantify the geometrical, biomechanical and thermodynamic effects of RF ablation on porcine MV leaflets. We hypothesized that an RF ablation catheter that utilizes a cryo-anchor will effectively adhere to and alter MV leaflet geometry and compliance, reducing MV leaflet size at maximum systolic load. To test this hypothesis, we developed a catheter prototype containing both a cryo-anchor for attachment and stability and an RF electrode for ablation. To investigate the effects of using cryogenic temperatures and resistive heating in close proximity, we quantified changes in biaxial mechanical compliance of MV leaflets and used infrared (IR) thermal imaging to discern distinct thermal regions within the tissue. We also quantified the anchor strength of the cryo-anchor both with and without RF ablation. These data support our hypothesis that simultaneous cryo-anchoring and RF ablation effectively reduces MV leaflet size, while further demonstrating that cryo-anchoring and RF ablation can function effectively in close proximity on a single catheter tip. 54
64 Materials and Methods Catheter Prototype. A 4 mm (12 French) diameter catheter prototype was developed containing both a cryogenically cooled anchor (cryo-anchor) and an RF ablation electrode (Fig. 5.1A and Fig. 5.1B). The cryo-anchor and RF electrode reside in-line on the catheter shaft and are separated by a 1 mm spacer, with the cryo-anchor on the most distal point of the catheter. Both the cryo-anchor and RF electrode are constructed out of hollow copper rod and are approximately 1.9 mm in length. The cryo-anchor is thermally connected via a solder joint to an inner copper rod containing a lumen which allows liquid nitrogen delivery. Teflon is used to insulate the RF electrode from the cryo-anchor and inner copper rod, and a thermocouple attached to the outer surface of the cryo-anchor records the temperature at the anchor-tissue interface. RF ablation is performed with an Osypka HAT 300 generator, capable of delivering a 500 khz electrical signal at powers of up to 50 W to the RF electrode on the catheter tip. Liquid nitrogen is contained inside a handheld canister (Cry-Ac, Brymill Cryogenic Systems) and delivered to the catheter tip under vacuum by an inner lumen housed inside the catheter. Control of RF ablation and liquid nitrogen delivery is performed via custom built control electronics for synchronization and repeatability (Fig. 5.1C). Liquid nitrogen flow control is binary, and a servo motor is used to switch flow on and off. The sequence used for liquid nitrogen flow was developed to anchor the catheter tip to the tissue sample prior to RF ablation and to maintain anchoring throughout the ablation (Fig. 5.1D). Control of the RF generator was performed by interfacing with the footswitch port on the generator, with air flow controlled by a solenoid valve and control electronics. For each ablation, one of three RF protocols was utilized at 25, 45, or 50 W of power for 15, 20, or 30 s, respectively (Fig. 5.1D). Due to the time required for the RF generator to increase the power to the 55
65 desired set-point (~3 s), the total energy output was lower than that produced by the product of time and power (Joules = W s). The final energy delivery to the tissue, as recorded by the generator for each of the 25, 45 and 50 W ablations, was 350, 850, and 1250 Joules (J), respectively. Tissue Preparation. Healthy porcine MV leaflets were obtained from a local abattoir (Hampton Meat Processing, Hopkinsville, KY), excised on-site, and frozen in phosphate buffered saline (PBS) at -20 C until testing. Anterior leaflets were chosen for the biomechanical and thermal imaging studies due to their larger and more continuous surface area compared to posterior leaflets, although it is noted that posterior leaflets are more often affected by MVP [20]. The center portion of the leaflets were used and trimmed into rectangular sections (Fig. 5.2A) approximately 12 mm in the radial direction and 15 mm in the circumferential direction. The center portion was used as it experiences the most homogenous strains during MV closure [115]. For the anchor strength study, posterior leaflets were used for testing. Biaxial Mechanical Testing. Biomechanical analysis was performed using a customdesigned biaxial mechanical testing device (Fig. 5.2A) [9]. Samples were loaded in each direction up to a membrane tension comparable to that experienced by the leaflet during systole (120 mmhg 90 N/m of membrane tension), and all testing was performed with samples fully submerged in PBS at 37 C. Prior to testing, each sample was pre-conditioned over ten loading cycles to 90 N/m with a 15 s rise time. Following pre-conditioning, a marker reference was recorded and used as the unloaded state. Samples were then tested for ten cycles with a 15 s rise time to 90 N/m in order to determine untreated compliance. 56

 Fig. 5.")
66 A B Cryo-Anchor Insulating Spacer RF Electrode LN 2 To Vacuum RF Electrode Spacer Cryo-Anchor C Servo Cryo Canister LN 2 to Cryo-anchor Control Electronics Thermocouple Simultaneous Cryo-anchoring & RF Ablation Solenoid Valve RF Generator RF Electrode D Cryo Setting ON 350 J 850 J Cryo RF 1250 J RF Power (W) OFF Time (s) Fig. 5.1: First Prototype Design and Control Scheme A: Solid model cut-away of the catheter prototype design, indicating the relative positions of the cryo-anchor, insulating spacer, and RF electrode. B: Catheter prototype tip used for all treatments of tissue (scale bar = 1/8 ). C: Flow chart representation of the control system used to integrate and synchronize cryo-anchoring with RF ablation for treatment of tissue. D: Sequence programmed into the controller for performing RF ablation treatments with cryo-anchoring. Note that liquid nitrogen delivery to the catheter tip begins prior to RF ablation in order to first anchor the catheter tip to the tissue surface. RF power is represented as being applied instantaneously; however, it took ~3 s for RF power to reach target power. Final RF energy delivery (J=Joules) is indicated on the plot and represents total energy delivery of each treatment. 57
67 Stress-strain behavior has been found to be independent of loading rate for cycles with rise times of up to 15 s, thus tissues were not loaded at physiologic rates [116]. After determining leaflet biomechanical properties, samples were loaded to 10 N/m and subjected to one of the following four treatments with the catheter prototype. In order to determine the biomechanical effects of the cryo-anchor alone, samples were kept in contact with the cryo-anchor for 30 s at approximately -20 to -30 C (n = 3). To test the combined effects of cryo-anchoring and RF ablation, tissues were subjected to one of three treatment groups (n = 5) as described earlier and shown in Fig. 5.1D. During treatment, the fluid level in the bath was lowered to just below the surface of the sample in order to ensure that maximal energy transfer was through the tissue. By performing treatment such that all RF energy must pass through the sample, the amount of RF energy required to invoke the recorded biomechanical changes can be determined. The alternative is to completely submerge leaflets during treatment, but this provides a very low resistive path to ground, which bypasses the target tissue via direct conduction through the PBS bath. Four ground electrodes were placed in the bath, approximately 13 cm away from the tissue, to complete the electrical circuit for RF ablation. Following treatment, samples were returned to their unloaded state, a new marker reference was recorded to determine changes in unloaded geometry, and samples were loaded for ten cycles to 90 N/m. All data reported is from the tenth loading cycle of each experiment. All analysis of biaxial mechanical data was performed using MATLAB (Mathworks). Marker positions recorded just prior to loading were used to determine geometric changes of the unloaded tissues due to treatment with the catheter prototype. Unloaded marker area was calculated as the area enclosed by the polygon connecting the four markers. Additionally, the percent change in the determinant of the deformation 58
68 gradient tensor, F (% change in det(f)) was used to provide a quantitative assessment of the biomechanical changes of the tissue at maximum systolic load. The determinant of F is the ratio of the deformed marker area to the marker area of the reference state, where: F = [ F 11 κ 1 κ 2 F 22 ] F11 and F22 represent the stretch ratios in the circumferential and radial directions, respectively, and κ1 and κ2 provide a measure of shear. det(f) was determined at 90 N/m before and after treatment, and the unloaded marker reference state recorded just after preconditioning was used for all calculations. Because the same marker reference state is used to determine F in both the untreated and treated conditions, % change in det(f) provides a direct comparison of systolic leaflet deformation before and after treatment. Therefore, we refer to % change in det(f) at 90 N/m as % change in areal systolic deformation. In addition to reporting changes in det(f) due to treatment, we also report % change in axial systolic deformations which are changes in F11 and F22 at 90 N/m. For a more complete description of the calculation of F from biaxial mechanical testing, see Humphrey [117]. Infrared Thermal Imaging. Thermal imaging of simultaneous cryo-anchoring and RF ablation was performed using an IR camera (ThermoVision A20M, FLIR Systems) with a measurement range of -20 C to 250 C and accuracy of ±2 C. Previous studies have used IR imaging to identify the lethal isotherm of RF lesions [118, 119]. Leaflets were imaged in a custom built bath, and the camera was placed below the bath for imaging of full thickness changes in temperature distribution (Fig. 5.2B). An IR window (IR Material Window, Edmund Optics Inc.) was placed at the bottom of the bath to allow imaging through the bottom surface by allowing transmission of IR wavelengths. Prior to treatment, an image 59


69 radial A anterior posterior B RF C Cryo Cryo RF circumferential MV Leaflet IR Window MV Leaflet Clamps Fig. 5.2: Static Ex Vivo Experimental Set-Ups A: Mitral valve anatomy with marker placement and biaxial testing device with leaflet tissue in place. B: Set-up for full thickness thermal imaging. The IR camera is placed below in order to measure the temperature distribution throughout the entire surface of the tissue. An IR window allows transmission of IR wavelengths for unimpeded temperature measurement. C: Set-up for measurement of anchor strength of the cryo-anchor. Leaflets are clamped into the load cell assembly, and the maximum load is recorded. was taken of a calibration phantom to determine the x and y distance scales. Testing was performed in PBS at room temperature, and the fluid level was lowered to just below the top surface of the tissue to allow maximal energy transfer through the leaflet. Four ground electrodes were placed in the bath in a circular pattern, each approximately 13 cm from the center of the leaflet. During ablation, a non-conductive plate was placed over the leaflet in order to maintain contact of the entire leaflet surface with the IR window. This was done to ensure that the temperatures measured were of the leaflet itself and not the fluid between the leaflet and IR window. All samples were then treated using one of the ablation sequences in Fig. 5.1D (n = 3 for each of the 350, 850, and 1250 J sequences), and images of the treatment were recorded at 1 Hz beginning at the onset of RF ablation using ThermaCAM Researcher software and synchronized with the ablation sequence using the control electronics. Images were then analyzed in MATLAB to produce thermal contour 60
70 plots of the tissue. Additionally, the area of tissue heated to > 65 C was quantified in order to provide a measure of the extent of thermal contracture of the extracellular matrix collagen, and the tissue area < 0 C was also quantified to provide an estimate of the attachment area of the catheter prototype. Anchor Strength. In order to assess the anchor strength of the cryo-anchor both with and without RF ablation, a submersible load cell was used (Model 31 Mid, Honeywell). Posterior MV leaflets were clamped onto the load cell assembly and completely submersed in PBS at 37 C (Fig. 5.2). Leaflets were completely submersed during treatment in order to test the anchor strength of the cryo-anchor in an environment that more closely mimics the in vivo case. The output from the load cell was amplified using a custom built amplifier circuit and read into LabView using a data acquisition card (NI 9205, National Instruments). Anchor strength was tested at one of two protocols (n = 5 for each protocol). For the Cryo Only protocol, liquid nitrogen was pumped under vacuum to the catheter tip continuously for 10 s, and the catheter was then immediately pulled from the leaflet surface until separation. To determine the loss of anchor strength resulting from application of RF energy, the RF + Cryo protocol consisted of 5 s of continuous liquid nitrogen delivery, followed by 10 s of RF ablation at 50 W with continuous liquid nitrogen delivery. The catheter was then pulled away from the leaflet surface until separation. In both cases, the maximum load during separation was recorded. Maximum load was converted to anchor strength by dividing the load by 0.12 cm 2, the approximate area of the cryo-anchor in contact with the tissue. 61
71 Statistics. Data are presented as mean ± SE. To analyze significance of changes due to combined RF ablation and cryo-anchoring for the biomechanical and anchor strength studies, data were analyzed using a one way ANOVA (α = 0.05) for multiple pair wise comparison (Holm-Sidak method). Results Tissue Geometry and Compliance. Prior to treatment, leaflets displayed a typical, anisotropic mechanical response to loading [50], with the radial direction much more compliant than the circumferential direction (Fig. 5.3A and Fig. 5.3B). This is due to collagen fibers being preferentially aligned in the circumferential direction. Following 30 s of cryo-anchoring, MV leaflets experienced negligible changes in geometry and mechanical response (Fig. 5.3A). However, after 1250 J of RF ablation with cryo-anchoring, leaflets underwent significant changes. In the circumferential direction, changes in systolic deformation were attributable primarily to shrinkage of the tissue, as indicated by a large shift in stretch ratio in the unloaded state (membrane tension = 0 N/m), while the radial direction underwent a decrease in systolic deformation with little geometric changes. There was a consistent trend of decreasing marker area with increasing RF energy (Fig. 5.3C), due primarily to decreases in length in the circumferential direction (Fig. 5.3D). Change in systolic deformation was analyzed at maximum load, 90 N/m (Fig. 5.3E and Fig. 5.3F), with all deformations referenced to the marker reference state recorded just after preconditioning. Similarly to geometric changes, the areal systolic deformation decreased with increasing RF energy (Fig. 5.3E), due primarily to shrinkage in the circumferential direction. Additionally, there was a consistent trend of decreasing axial systolic 62
72 Membrane Tension (N/m) % change in unloaded marker lengths Applied RF Energy (J) Circ Radial Circ + Cryo Radial + Cryo Circ Radial ** A Stretch Ratio C Membrane Tension (N/m) % change in unloaded marker area Circ Radial Circ + Cryo + RF Radial + Cryo + RF Applied RF Energy (J) B Stretch Ratio D 0 0 % change in axial systolic deformation Circ Radial Applied RF Energy (J) ** E % change in areal systolic deformation ** Applied RF Energy (J) F Fig. 5.3: Biaxial Mechanical Characterization of RF Ablation-Treated MV Leaflets Biaxial, membrane tension vs. stretch ratio following 30 s of cryo-anchoring without RF ablation (A) and with 1250 J of RF ablation (B). C: % Change in unloaded marker area for each treatment group (0 J represents cryo-anchoring without RF ablation). % Change in unloaded marker lengths (D), areal systolic deformation (E), and axial systolic deformation (F) for each treatment group. + Significant decrease vs. 0 J (p<0.001) and ** significant decrease vs. 850 J (p<0.05). 63
73 deformation in both the circumferential and radial directions with increasing RF energy (Fig. 5.3F), although the changes in the radial direction were not significant. Temperature Distribution. Leaflet tissue > 65 C was quantified to identify the area of the leaflet exposed to temperatures that cause thermal damage to collagen. The area > 65 C was found to increase with increasing RF energy, from 0.51 ± 0.13 cm 2 to 1.9 ± 0.13 cm 2 at energies of 350 J and 1250 J, respectively (Fig. 5.4A). The tissue area below 0 C was used to determine the degree of cryo-anchoring present during ablation and was approximately 0.14 ± 0.05 cm 2 at the end of the 1250 J ablations. For comparison, the area of the cryoanchor in contact with the leaflet during the procedure is approximately 0.12 cm 2. Thermal contours at the end of each treatment indicate distinct regions of cryo-anchoring and tissue ablation (Fig. 5.4B). The thermal contour plots at the end of the 350 J treatment shows minimal tissue > 65 C, while the majority of the leaflet tissue is > 65 C in the 1250 J treatment. Anchor Strength. Following cryo-anchoring for 10 s, anchor strength was found to be 1020 ± 23 kpa (Fig. 5.5). As expected, application of RF ablation at 50 W for 10 s with cryoanchoring reduced the anchor strength significantly (p<0.005) to 668 ± 79 kpa; however, the adherence is still robust. Discussion We have previously shown that RF ablation directionally alters MV leaflet geometry and compliance [9]. The therapeutic effect of our percutaneous treatment strategy is to restore competence to diseased or prolapsed MV leaflets by reducing leaflet size, and therefore, 64
 and cooled to < 0 C by cryoanchoring, as measured at the end of treatment.")
 1000 800 600 400 200 0 Cryo Only RF + Cryo Fig. 5.")
74 Tissue Area (cm 2 ) Tissue Area > 65 o C Tissue Area < 0 o C ** A B Applied RF Energy (J) Fig. 5.4: Characteristic Thermal Contours of RFC Catheter Treatment A: Tissue areas heated to > 65 C by RF ablation (red bars) and cooled to < 0 C by cryoanchoring, as measured at the end of treatment. + Significant increase vs. 350 J (p<0.005) and ** significant increase vs. 850 J (p<0.05). B: Infrared thermal contour images prior to (time = 0) and following RF ablations of 350 J, 850 J, and 1250 J RF, with simultaneous cryoanchoring Anchor Strength (kpa) Cryo Only RF + Cryo Fig. 5.5: Typical Cryo-Anchor Holding Strength Cryo-anchor strength following 10 s of attachment (blue bar) and 10 s of cryo-anchoring with 50 W of RF ablation (red bar). + Significant decrease vs. cryo only (p<0.005). 65
75 displacement of leaflets into the atrium during systole. However, any device that aims to percutaneously treat MVP must do so in a highly dynamic mechanical environment. Additionally, due to the high rate of blood flow across the MV and the resulting potential for heat convection, application of RF energy must be performed with the RF electrode in direct contact with the target tissue. Thus, we have introduced cryo-anchoring as a means to potentially maintain direct catheter contact with a moving MV leaflet and to enhance stability during the procedure. During cryo-anchoring, tissue is cooled to < 0 C, which interferes with the resistive heating that is the therapeutic mechanism behind RF ablation. However, due to the small size of MV leaflets, cryo-anchoring must be utilized in close proximity to the RF electrode. In this study, we demonstrate the effects of using two competing energy modalities and the feasibility of RF ablation performed with cryoanchoring. More RF Energy Required with Cryo-Anchoring. Biaxial mechanical data following treatment with the catheter prototype demonstrates that RF ablation remains a valid therapy, even with sub-freezing temperatures on the cryo-anchor in close proximity on the MV leaflet (Fig. 5.3). To determine the extent to which cryo-anchoring reduces the biomechanical effects of RF ablation, we re-analyzed previous biaxial data from treatment with a commercially available RF catheter (7F, Blazer II, Boston Scientific) without cryoanchoring [9], plotting the % change in areal systolic deformation alongside our data presented here (Fig. 5.6). While RF ablation with cryo-anchoring altered unloaded MV leaflet geometry and deformation at systolic loading, it took significantly more energy versus RF ablation alone to produce the same effect. Previous treatments using the commercially available RF catheter reduced areal systolic deformation by approximately 66
76 % change in areal systolic deformation RF Only RF + Cryo 145 J 220 J 350 J 350 J 850 J 1250 J n = 5 n = 6 n = 5 n = 6 n = 5 n = 6-30 Fig. 5.6: Comparison of Shrinkage Deformations in RF Only and RF+Cryo Treatments % change in areal systolic deformation with RF ablation alone (black bars) [9] and RF + cryo-anchoring (gray bars), demonstrating that more RF energy is needed when cryoanchoring is utilized to produce the same therapeutic effect as RF ablation alone. 25% when 350 J of energy was applied at a power of 25 W [9]. In treatments utilizing cryoanchoring, areal systolic deformation decreased by only 2.8 ± 0.6% under the same RF conditions. However, when 1250 J of energy was applied at a power of 50 W, our catheter prototype was able to produce changes similar to the commercially available catheter at 350 J. These results indicate that even though RF power must be increased significantly when cryo-anchoring is used, the catheter prototype can still achieve the same therapeutic effect. Thermally-Related Collagen Contracture. RF ablation introduces both geometric and biomechanical changes in MV leaflets; specifically, changes in areal systolic deformation are primarily due to length changes in the circumferential direction (Fig. 5.3D). This shortening of the collagen fibers in the circumferential direction is due to thermal rupture of heat-sensitive bonds and uncoiling of the collagen triple helix. This uncoiling of collagen fibers and transition from a crystalline state to a random coil is responsible for collagen 67
77 shortening, and transmission electron microscopy of collagenous tissues treated with RF ablation show collagen fibrils that increase in average diameter with increasing RF power [120]. Additionally, aligned collagen fibers fuse together in the orthogonal directions after treatment with RF ablation [120, 121], leading to modest changes seen in the radial direction here (Fig. 5.3D). Therefore, the use of a cryo-anchor for stability during the RF ablation procedure reduces the therapeutic effect of RF energy, but this effect can be mitigated by increasing RF power. Heat Distribution of RF Ablation with Cryo-Anchoring. In addition to determining biomechanical changes induced by RF ablation, we have analyzed the temperature distribution resulting from combined RF ablation with cryo-anchoring. Estimates for the onset of unwinding of the collagen triple helix vary and have been determined to be approximately 60 C in the bovine joint capsule [122] and 67.1 C in the bovine mitral valve [123]. Thus, we used 65 C as a threshold for permanent collagen denaturation and determined the area of tissue heated above this temperature. IR imaging reveals that while there is a distinct region of cryo-anchoring present through the full thickness of the leaflet, which stays relatively consistent across all RF energies, heating due to RF ablation dominates the leaflet temperature distribution. As a result, full thickness temperatures < 0 C are confined to an area slightly larger than the cryo-anchor attachment area. Because thermal damage to the collagen matrix forms the basis of mechanical damage, we hypothesized that the tissue area heated above 65 C would correlate with changes in areal systolic deformation (Fig. 5.7). Indeed, this correlation is evident when % change in areal systolic deformation is plotted against tissue area above 65 C, demonstrating that biomechanical changes may be directly related to the amount of thermal tissue damage. 68
78 Tissue Area > 65 o C (cm 2 ) % change in areal systolic deformation Fig. 5.7: Areal Shrinkage Deformation is Related to Area of Tissue Heating % change in areal systolic deformation vs. tissue area > 65 C, as determined by processing of IR thermal images at the end of ablation. Model fit: % change in areal systolic deformation = e 0.60 * tissue area Cryo-Anchor Attachment to MV Leaflets. Testing of the anchor strength of the cryo-anchor revealed that this attachment is sufficient to maintain contact, even with RF ablation, with stationary MV leaflets. While there are currently no direct estimates for the anchor strength required to maintain attachment to the MV during the cardiac cycle, one estimate can be made based on the atrial pressure during MV opening. Because the proposed catheter treatment involves access to the MV via the left atrium, and the peak atrial pressure is a representation of the force required to open the MV, this is an estimate for the minimum attachment force required to maintain adherence. Peak atrial pressure in normally functioning hearts is typically below 20 mmhg [12], or about 2.7 kpa. Thus, even if a much higher estimate for the atrial pressure is chosen, this value is considerably lower than the approximately 668 kpa of anchor strength recorded at 10 s of the 50 W RF ablation. Additionally, we speculate that cryo-anchoring and ablation of MV leaflets will occur with the MV kept partially open, with one leaflet kept anchored and the other moving freely. This may further reduce the force required to maintain cryo-anchoring. 69
79 Study Limitations. The data presented here indicate that RF ablation performed with cryoanchoring alters MV leaflet geometry and deformation in vitro; however, there are several limitations to this study. First, all treatments were performed on stationary leaflets in vitro. While this ensures robust delivery of RF energy, it is not realistic, particularly with regards to the anchor strength studies. Further work must be performed to verify the feasibility of cryo-anchoring on moving MV leaflets, both in vitro and in vivo. Additionally, ablations in the biomechanical and thermal imaging studies were performed on leaflets with the saline bath lowered, such that the maximum amount of RF energy would penetrate the leaflets. This provides a much more accurate measurement of the total energy delivered to the leaflet, but the in vivo environment is much more dynamic. Due to convective blood flow, in vivo treatments will require additional or prolonged RF energy delivery in order to produce the same biomechanical alterations, as demonstrated in a feasibility study utilizing a canine model [10]. Finally, these studies were performed on healthy porcine MV leaflets. It is unknown how leaflets with MVP might respond to RF ablation, due to their disorganized collagen architecture. Design Considerations for In Vivo Translation. In light of the results from this study, and what is previously known regarding RF ablation, we have identified several design considerations for in vivo translation of our combined RF ablation and cryo-anchoring catheter. First, we demonstrated in vitro that RF energy must be increased when used in conjunction with cryo-anchoring in order to achieve a similar therapeutic effect of RF alone. Because our biaxial mechanical analysis was performed on leaflets treated while only partially submerged, heat dissipation will likely increase when treatment is performed in 70
80 vivo, due to the surrounding hemodynamic environment. Thus, RF energy delivery will likely need to be increased in a similar manner and this will likely be accomplished by increasing either RF power or application time. Similarly, through placement in a dynamic hemodynamic environment and increases in application of RF energy, cryo-anchor strength may be reduced at the current liquid nitrogen delivery protocol, and liquid nitrogen delivery may need to be increased by increasing vacuum pressure and delivery time to compensate. Also, in order to decrease the amount of RF energy lost to the blood stream, RF electrode placement can be re-designed to allow for more direct delivery to the leaflets. One possible improvement is to replace the current, singular RF electrode, which encircles the entire 360º outer circumference of the catheter shaft, with three separate RF electrodes that are approximately 120º of the circumference and are insulated from each other. By having three separate electrodes, RF energy can be delivered to the electrode in direct contact with the leaflet, ensuring that the majority of RF energy enters the leaflet, as opposed to the bloodstream. These, and other potential modifications, will likely be necessary to translate this strategy into an integrated catheter that will be successful in vivo. Conclusions In this study, we demonstrate that RF ablation with a cryo-anchor may provide an alternative percutaneous treatment strategy for MVP. While it was previously shown that RF ablation alone reduces MV leaflet size, we have demonstrated the feasibility of cryoanchoring as a stability technique for secure attachment of a catheter to a MV leaflet. Additionally, cryo-anchoring may have possible uses in other applications involving RF ablation or in more general percutaneous catheters as a mechanism to enhance stability and 71
81 improve catheter contact in complex anatomies or hard-to-reach sites. Cryo-anchoring may be a particularly effective strategy in improving catheter stability during treatment of cardiac arrhythmias, given the dynamic environment of the heart. While we found here that cryo-anchoring reduces the effect of RF ablation, these effects can be mitigated by increasing RF power and duration. These in vitro results indicate that RF ablation with simultaneous cryo-anchoring reduces MV leaflet size and may be a viable clinical strategy for percutaneous treatment of myxomatous MVP. 72
82 Chapter 6 AIM 2 PART 2: BIAXIAL MECHANICAL CHARACTERIZATION OF NON- UNIFORM THERMAL SHRINKAGE DEFORMATIONS Introduction We have shown in the previous chapter that RF ablation introduces thermal shrinkage and biomechanical changes to MV leaflets, and that thermal shrinkage of MV leaflets primarily occurs in the circumferential direction due to collagen fiber alignment. Further, cryoanchoring was shown to significantly reduce the amount of thermal shrinkage at a given RF power. However, this study was limited in that the experimental set-up was incapable of quantifying spatial variations in leaflet shrinkage. MV leaflet tissue does not uniformly deform in response to heat. Rather, the magnitude of thermal shrinkage varies throughout the treatment zone. One reason to quantify spatially-varying shrinkage of MV leaflet tissue in response to RFC catheter treatment is to generate data to develop patient-specific computational models of the MV, which are currently in development to aid in preoperative surgical and interventional planning [ ]. Computational modeling of heart valves can offer the opportunity to interactively explore a repair strategy, allowing assessment of proposed structural changes to the valve [127]. Characterization of the tissue- and device-specific thermal shrinkage deformations resulting from the RFC catheter is an important first step in developing a computational model of the treatment strategy and for optimizing procedural planning. Previous studies on thermal shrinkage of collagenous tissues have used uniaxial and biaxial testing devices to characterize shrinkage deformations under a 73
83 variety of loading and temperature conditions [ ]. Moreover, previous biaxial characterization of thermally-induced deformations have used a standard 2x2 marker tracking array, which is unable to characterize non-uniform shrinkage deformations that may arise due to ablation device configuration and tissue anisotropy. The objective of the work in this chapter was (1) to develop a biaxial mechanical testing method that more completely characterizes non-uniform tissue deformations that arise in thermal shrinkage of collagenous tissues and (2) to apply this method to characterize the shrinkage response resulting from RFC catheter treatment of MV leaflet tissue. Additionally, as mechanical loading conditions have been found to affect the thermal shrinkage response of collagenous tissues [130], we sought (3) to investigate the effect of varying preload on thermal shrinkage. Finally, pericardial tissue that has been treated with heat has been shown to dilate slightly within the first hour after treatment [128], thus we sought (4) to investigate the magnitude of post-treatment re-dilation of MV tissue. We hypothesize that tracking 16 markers on the MV leaflet surface will provide enhanced fidelity in measuring spatially-varying leaflet shrinkage induced by treatment with the RFC catheter and further, that increasing the applied preload on the MV leaflets prior to RFC catheter treatment will reduce the magnitude of thermal shrinkage. Materials and Methods Sample Preparation. Healthy porcine MV anterior leaflets were obtained from the local abattoir (Hampton Meats, Hopkinsville, KY). Anterior leaflets were chosen for this study due to their large and continuous surface area. The center portions of the leaflets were cut into rectangular sections and 16 markers were fixed to the atrial side of the tissue samples to allow optical tracking for strain calculations during mechanical loading. Four hooks 74

84 A radial circ B s=0 RF Electrode Fig. 6.1: Experimental Set-Up for 4x4 Marker Tracking A: Relative positioning of the 4x4 marker array on the surface of a MV anterior leaflet. B: 4x4 marker array shown with catheter orientation and the relative sizes and positions of the RF electrode and cryo-anchors with respect to the sample. Also shown are the local coordinate axes, r=0 and s=0. C: Representative RFC catheter temperatures during ablation treatment in the biaxial mechanical tester showing RF electrode temperature (red dash) and cryo-anchor temperature (blue solid). r=0 Cryo- Anchors C Temperature ( C) Cryo Temp RF Temp Time (s) where inserted into each side of a tissue sample and attached to sutures for mechanical loading. The circumferential (direction of collagen fiber alignment) and radial leaflet directions were aligned with the loading axes (Fig. 6.1A). Samples were tested in load control mode to equibiaxial membrane tension comparable to that experienced by healthy MV leaflets during systole (120 mmhg 90 N/m). All testing and treatment was performed with samples and catheter fully submerged in phosphate buffered saline at 37 C. For more details on the biaxial mechanical testing setup, see [9]. Mechanical Testing and Catheter Treatment. Samples were initially loaded 10 times to 90 N/m of equibiaxial tension to pre-condition the tissue. Load was removed from the samples, the marker reference configuration, X, was acquired, and samples were again loaded 10 times to 90 N/m of equibiaxial tension to acquire the untreated loading curves. Following acquisition of untreated mechanical loading curves, samples were treated with the RFC catheter on the ventricular side according to one of four protocols (n=5 per group) 75
85 while submerged in phosphate buffered saline at a power of 50 W for 60 s (Fig. 6.1B-C). Either the samples were treated with 1) RF ablation without cryo-anchoring and no loading constraints (RF Only, No Preload), 2) RF ablation with cryo-anchoring with no loading constraints (RFC, No Preload), 3) RF ablation with cryo-anchoring with 1 N/m of equibiaxial preload (RFC, 1 N/m Preload), or 4) RF ablation with cryo-anchoring with 5 N/m of equibiaxial preload (RFC, 5 N/m Preload). For treatments with no loading constraints, it was ensured that no load was applied to the sample edges during catheter treatment. For treatments with applied preload, samples were first loaded to the specified equibiaxial preload, the loading motors were held fixed in place, and no attempt was made to control or alter the applied load during catheter treatment. Following catheter treatment, samples were pre-conditioned by loading 2-3 times to 90 N/m of equibiaxial tension, load was removed, and the treated unloaded configuration was acquired. Samples were again loaded 10 times to 90 N/m of membrane tension to acquire the treated mechanical loading curves. Pre-conditioning, unloaded marker position acquisition, and mechanical loading to 90 N/m was repeated again after one hour, during which the samples sat traction-free, to examine any possible re-dilation effects. Deformation Characterization. Prior to analysis, the marker locations of all samples within each group were averaged together to form one average dataset per group. Additionally, radial symmetry was employed such that markers on either side of the local r = 0 axis were mirrored and averaged together (Fig. 6.1B). Bilinear interpolation schemes are traditionally used to determine the deformation gradient from 2x2 marker arrays in biaxial mechanical testing of planar tissues [117, 133]. We sought a method to better characterize the non-uniform shrinkage deformations 76
86 induced by catheter treatment and used 16 tracking markers in a 4x4 marker array. Briefly, bicubic interpolation, with basis functions reported from [134], was used to form an isoparametric, curved-sided quadrilateral element from the 16 marker locations, from which, a 50x50 node grid was interpolated. Bicubic interpolation has the advantage of being C 1 continuous to avoid discontinuities when determining the displacement and deformation gradients, and the curved sides enhance interpolation fidelity. The deformation gradient, F, was interpolated at each nodal location within the enclosed 4x4 marker region, and directional deformations (circumferential F11, radial F22) and areal deformations (determinant of the deformation gradient tensor) are reported with respect to the pre-treatment, unloaded reference condition, X: F = I + u X Where u is the displacement gradient. In order to interpolate F everywhere between each of the markers, it is necessary to introduce a local coordinate system (r, s) that is centered about the origin and spans from -1 to 1 in each direction Fig The position within the element is then described in terms of the local coordinates r and s, where i is the marker number: 16 X(r, s) = φ i (r, s)x i i=1 16 Y(r, s) = φ i (r, s)y i i=1 77
87 Radial The displacements, u and v, can be interpolated similarly: 16 u(r, s) = φ i (r, s)u i i=1 16 v(r, s) = φ i (r, s)v i i=1 Given the marker positions (Fig. 6.2), the basis functions, φ i, are: φ 1,2,3,4 = (9r2 1)(r L r + 1)(9s 2 1)(s L s + 1), {r L = ±1, s L = ±1} φ 5,6,9,10 = (9s2 1)(s L s + 1)(1 r 2 )(1 + 9r L r), {r L = ± 1 3, s L = ±1} φ 7,8,11,12 = (9r2 1)(r L r + 1)(1 s 2 )(1 + 9s L s), {r L = ±1, s L = ± 1 3 } φ 13,14,15,16 = (1 r2 )(1 + 9r L r)(1 s 2 )(1 + 9s L s), {r L = ± 1 3, s L = ± 1 3 } Circ s = +1 r = s 15 8 r r = s = -1 Fig. 6.2: 4x4 Marker Positions for Bicubic Interpolation Scheme 78
88 However, we re looking to find the displacement gradient, which requires finding the derivatives of the basis functions: u u X = [ X v X u Y ] v Y Since the displacements are now written as functions of r and s, the chain rule is needed to determine the gradient. For example: u X = u r r X + u s s X In matrix form, the displacement gradient is: u [ X v X u u Y ] = [ r v v Y r u r s ] [ X v s s X r Y ] s Y As r and s are not explicit functions of X and Y, the last term must be inverted: r [ X s X r X Y ] = [ r s Y Y r X s ] Y s 1 = 1 J H Where: u Y H = [ r s u Y s r v Y r s v Y s r u X r s + u X s r v X r s + v ] X s r J = X Y r s X Y s r 79
89 The terms that compose H and J can be determined by differentiating the basis function, such as: 16 X r = φ i r X i i=1 16 X s = φ i s X i i=1 The derivatives of the basis functions with respect to r: φ 1,2,3,4 r φ 5,6,9,10 r φ 7,8,11,12 r φ 13,14,15,16 r = (27r2 r + 18r r L )(9s 2 1)(s L s + 1), {r L = ±1, s L = ±1} = (9s2 1)(s L s + 1)( 27r 2 r + 18r r L ), {r L = ± 1 3, s L = ±1} = (27r2 r + 18r r L )(1 s 2 )(1 + 9s L s), {r L = ±1, s L = ± 1 3 } = ( 27r2 r + 18r r L )(1 s 2 )(1 + 9s L s), {r L = ± 1 3, s L = ± 1 3 } The derivatives of the basis functions with respect to s: φ 1,2,3,4 r φ 5,6,9,10 r φ 7,8,11,12 r φ 13,14,15,16 r = (27s2 s + 18s s L )(9r 2 1)(r L r + 1), {r L = ±1, s L = ±1} = (27s2 s + 18s s L )(1 r 2 )(1 + 9r L r), {r L = ±1, s L = ± 1 3 } = (9r2 1)(r L r + 1)( 27s 2 s + 18s s L ), {r L = ± 1 3, s L = ±1} = ( 27s2 s + 18s s L )(1 r 2 )(1 + 9r L r), {r L = ± 1 3, s L = ± 1 3 } And substituting into H and J produces: F = I + 1 J H 80
90 To analyze differences between treatment groups on the magnitude of thermal shrinkage deformation, the areal, circumferential, and radial deformations were averaged for each sample over all interpolated nodes in the unloaded state and at systolic loads. Differences between groups were assessed with one way ANOVA with a follow-up Holm- Sidak method for multiple pairwise t-tests at significance level α=0.05. Results Averaged shrinkage deformations produced by RF ablation only (left column) and RFC catheter treatment at varying levels of preload are shown in the unloaded configuration (Fig. 6.3) and at systolic loads (Fig. 6.4). The approximate center of the RF ablation electrode in this study is at position (r, s) = (0,0). In general, areal shrinkage deformations are greatest in the central RF ablation treatment region and on either side along the circumferential axis, leading to an hourglass-shaped shrinkage deformation. Cryo-anchor placement inhibits the formation of large shrinkage deformations along the border zones in the top and bottom of the radial axis. Whereas areal shrinkage deformations vary relatively uniformly around the circumference of the ablation electrode in the RF only group, cryoanchors act to confine thermal shrinkage to the central region of the leaflet in the RFC catheter treatment groups. Interestingly, radial shrinkage magnitude is greatest in the tissue adjacent to the ablation electrode near the leaflet edges and not the leaflet tissue in direct contact with the ablation electrode. Further, as applied preload before treatment increases, the magnitude of areal shrinkage decreases and trends in directional differences between circumferential and radial deformation can be more fully appreciated. Areal and directional shrinkages are shown plotted along the local coordinate axes r = 0 (Fig. 6.5A) and s = 0 for RFC catheter treatment at 1 N/m of preload (Fig. 6.5B). As 81


 deformations, in the unloaded state,")
91 Radial Circumferential Areal Radial Circ. RF Only No Preload RFC No Preload RFC 1 N/m Preload RFC 5 N/m Preload Fig. 6.3: Catheter Induced Shrinkage Deformations Shown in the Unloaded State Shown are areal (top row), circumferential (middle row), and radial (bottom row) deformations, in the unloaded state, induced by catheter treatment and averaged over n=5 samples with radial symmetry. 82
, circumferential (middle row), and radial (bottom row) deformations, shown at 90 N/m of equibiaxial load,")
92 Radial Circumferential Areal Radial Circ. RF Only No Preload RFC No Preload RFC 1 N/m Preload RFC 5 N/m Preload Fig. 6.4: Catheter Induced Shrinkage Deformations Shown at Systolic Loads Shown are areal (top row), circumferential (middle row), and radial (bottom row) deformations, shown at 90 N/m of equibiaxial load, induced by catheter treatment and averaged over n=5 samples with radial symmetry. 83
93 expected, areal and circumferential shrinkage deformation magnitude becomes smaller at locations further away from the RF ablation electrode along the circumferential and radial axes (Fig. 6.5A-B). However, radial shrinkage deformation is larger towards the edges of the leaflet than in the immediate ablation zone when plotted along the circumferential axis (Fig. 6.5A). Thermal shrinkage deformation magnitudes were averaged over the 4x4 marker domain of each sample (Fig. 6.6). Differences in thermal shrinkage magnitude between RF ablation only and RFC catheter treatment groups with no preload were not significant. In general, preload on the MV leaflet samples significantly reduced the magnitude of shrinkage deformations. A preload of 5 N/m of membrane tension reduced shrinkage magnitude by approximately 50% compared to 1 N/m of preload (Fig. 6.6C). Additionally, shrinkage magnitude measured at systolic loading conditions was substantially lower than the shrinkage magnitude in the unloaded condition. Areal re-dilation was also measured 1 hour after treatment, with maximum re-dilation of 8.53 ± 1.99% following RFC catheter treatment at no load (Fig. 6.6D). MV leaflet samples treated in combination with preload demonstrated no significant re-dilation. Discussion Characteristic Shape of RFC Catheter Thermal Shrinkage Lesions. The objective of this study was to quantify spatially-varying shrinkage deformations in collagenous tissues. A 4x4 marker tracking grid on the atrial surface of the MV anterior leaflet captured the variations in tissue shrinkage that occur as a result of tissue anisotropy and ablation device geometry. The RFC catheter is a specialized tissue shrinkage device that uses two cryoanchoring elements placed on each side of an RF electrode to enable direct electrode-tissue 84
94 A B Area Circ - F11 Radial - F22 Deformation Deformation X11 Position (cm) X22 Position (cm) Fig. 6.5: Catheter-Induced Shrinkage Along Local Coordinate Axes Areal, circumferential, and radial shrinkage plotted along the local coordinate axes, r=0 (A) and s=0 (B), following catheter treatment at 1 N/m of preload. Local coordinate axes are shown plotted in Fig. 6.1 and Fig. 6.2 for reference. Circ. Shrinkage (%) A RF RFC RF RFC 0 N/m 0 N/m 1 N/m 5 N/m * * * Radial Shrinkage (%) B N/m 0 N/m 1 N/m 5 N/m * ǂ Areal Shrinkage (%) C RF RFC 0 N/m 0 N/m 1 N/m 5 N/m * * * Unloaded Systolic Load Fig. 6.6: Average Shrinkage at Varying Preloads Circumferential (A) and radial (B) shrinkage deformation induced by catheter treatment shown in the unloaded (black) and systolic (gray) loading conditions. C: Areal shrinkage. * significant different than all other groups, + significantly different than RF only, 0 N/m and RF+Cryo 5 N/m, significantly different than RF only, 0 N/m (p<0.05). D: Measured areal deformation taken in the unloaded state (black) and systolic loading condition (gray) 1 hour post-treatment. + significantly different than both 0 N/m preload groups, (p<0.05). D Areal Re-Dilation (%) Unloaded Systolic Load N/m 0 N/m 1 N/m 5 N/m 85
95 contact. The result of treatment with the RFC catheter is a thermal shrinkage lesion that is affected by the cryogenic temperatures of the cryo-anchors. These sub-freezing temperatures appear to exist only on the ventricular surface, since marker positions on the atrial surface still experience shrinkage deformations with RF ablation, albeit reduced, in the areas of cryo-anchoring. Thus, cryo-anchoring reduces, but does not completely inhibit, thermal shrinkage in the vicinity. The characteristic hourglass shape of RFC catheter treatment can be fully appreciated in the no preload condition (Fig. 6.3) and is a result of collagen fiber alignment with the circumferential direction, as well as placement of the cryo-anchors relative to the RF ablation electrode. Preload Decreases the Magnitude of Thermal Shrinkage. A further aim of this study was to examine the variation in shrinkage magnitude and directionality as a result of increased preload on the leaflet. The native MV leaflet can be thought of as a membranous tissue that is constantly in some form of tension from both the fibrous, relatively rigid trigones around the annulus and the compliant chords that connect the leaflet free edge to the papillary muscles. Recent studies have demonstrated that the native MV is always under some amount of prestrain [75, 135, 136], and the belly region of MV leaflets has been found to contract by 18% and 30% in the circumferential and radial directions, respectively, following excision [75]. While no measurements for the corresponding preload exist, the measured prestrains likely fall within the toe region of the loading curves and implies that preload likely does not exceed 5-10 N/m of tension. Thus, to simulate prestrain in this study, 1 N/m or 5 N/m of preload was applied before the start of RFC catheter treatment. At 5 N/m of preload, the shrinkage lesion was fully contained within the 4x4 marker region, unlike the shrinkage lesions of the other groups (Fig. 6.3 and Fig. 6.4). Greater 86
96 applied preload seems to reduce the coverage of thermal shrinkage lesions, implying that a larger ablation electrode or more ablations are needed to thermally shrink an equivalent amount of tissue. Acute Re-Dilation of Thermal Shrinkage Lesions is Minimal. Re-dilation of thermal shrinkage lesions in pericardial tissue is known to occur over the first hour after treatment [130, 132], thus we sought to investigate this effect in MV leaflet tissue. In treatment groups with no preload, MV leaflet tissue was found to re-dilate slightly over one hour (Fig. 6.6D). However, when RFC catheter treatment was applied with 1 or 5 N/m of preload, no redilation was measured. The absence of re-dilation following RFC catheter treatment with applied preload could be due to the reduced shrinkage magnitudes compared to those of the no preload groups. Regardless, the absence of re-dilation following RFC catheter treatment is beneficial to the MV repair strategy, as re-dilation will not need to be accounted for during treatment. Study Limitations. In this study, thermal shrinkage deformations were measured and quantified in the unloaded condition and at systolic loads (90 N/m of equibiaxial tension). Future work will examine how post-treatment leaflet mechanics are affected by examining the post-treatment mechanical loading curves and determining the spatial variation of parameter estimates of a Fung-type hyperelastic constitutive model [137]. In order to cover a maximal amount of leaflet area, tracking markers were often placed near the sample edges. A further limitation of this study is occasional appearance of edge effects along the border of the 16 marker area due to the inhomogeneous strains in the vicinity of the loading attachments. 87
97 Conclusions. In this study, we developed a bicubic interpolation method to more fully characterize the non-uniform deformation response that results from the RFC catheter a specialized ablation device that consists of an RF electrode surrounded on two sides by cryo-anchoring elements that inhibit thermal shrinkage. We found deformations that varied strongly depending on the direction of collagen fiber alignment and device alignment with the tissue. This analysis can be used to generate mechanical data for computational models to guide treatment therapy and to better understand spatially-varying tissue shrinkage dynamics. 88
98 Chapter 7 AIM 2: RFC CATHETER ASSESSMENT IN A PHYSIOLOGIC FLOW ENVIRONMENT Text and figures for Chapter 7 taken from: Boronyak SM, Merryman WD: In vitro assessment of a combined radiofrequency ablation and cryoanchoring catheter for treatment of mitral valve prolapse. Journal of Biomechanics. Vol. 47. Issue 5, , Introduction We have previously shown that when RF energy is applied to MV leaflets in a static environment with cryo-anchoring, leaflet size becomes significantly reduced, and infrared thermal imaging revealed that the cryo-anchor can be placed in close proximity to the RF electrode [11]. However, the effectiveness of this combined RF ablation and cryo-anchoring approach has yet to be tested in a physiologic flow environment. In particular, it is unknown whether a cryo-anchor can adhere to a moving MV leaflet and if this process negatively affects the flow and pressure across the MV. The purpose of this study was to develop and evaluate a combined RF ablation and cryo-anchoring catheter in a left heart flow simulation environment in order to optimize catheter performance and to determine procedure feasibility. We hypothesized that our combined RF ablation and cryo-anchoring catheter would adhere to moving porcine MV leaflets in a dynamic flow environment and effectively ablate the leaflet tissue with RF energy, mimicking surgical leaflet resection. To test this hypothesis, we constructed a left heart flow loop, similar to others [138, 139], in order to simulate the flow and pressure across healthy, excised porcine MVs. The data that follow support our hypothesis that the combined catheter prototype effectively adheres to and ablates MV leaflets in a physiologic 89
99 flow environment without negatively altering flow or pressure during the procedure, and that the changes induced by RF ablation remain durable over four weeks. Materials and Methods Left Heart Flow Loop. A left heart flow loop was developed in order to reproduce physiologic pressure and flow waveforms (Fig. 7.1A). Others have used similar flow simulators in an effort to study MV disease states and the effects of various repair strategies on MV mechanics [92, 140]. MVs were obtained from healthy pigs from a local abattoir (Hampton Meats, Hopkinsville, KY), and the entire MV apparatus was excised and kept intact. The MV annulus was sewn onto a silicone membrane, and the papillary muscles were sewn onto adjustable papillary muscle holders (Fig. 7.1B). LabView software (National Instruments, Austin, TX) was used to control the output pressure to a pump connected to the left ventricle, and an adjustable flow resistor and vessel compliance chamber were used to independently control the flow rate. Transmitral pressure and flow waveforms (Transonic Systems Inc., Ithaca, NY) were captured to assess the effect of catheter placement and cryo-anchoring on hemodynamics. RF Ablation and Cryo-Anchoring Catheter. A steerable catheter prototype was constructed utilizing components from a Freezer MAX Cardiac Cryoablation catheter (Medtronic, Minneapolis, MN). A RF electrode was placed in between two cryo-anchors on the tip of the catheter and was electrically insulated from the cryo-anchors (Fig. 7.1C). Liquid nitrous oxide delivery to the inside of the catheter tip, which is kept under vacuum, provides the cooling power for the cryo-anchor. A deflection wire was attached to a custom steering device to allow the catheter tip to be maneuvered. A viewing window on the left heart flow 90
 used to test catheter performance consisting of, a: ventricle, b: atrium, c: Thoratec VAD bladder pump, d: compliance")


100 A g B f e d i c a h b C RF Electrode Cryo-Anchor Fig. 7.1: Left Heart Flow Simulator For Simulated Testing Left heart flow loop (A) used to test catheter performance consisting of, a: ventricle, b: atrium, c: Thoratec VAD bladder pump, d: compliance chamber, e: flow resistor, f: media reservoir for catheter access, g: catheter prototype, h: Transonic flow probe, and i: LabView input/output controller. B: A healthy MV mounted in the left heart flow loop with the catheter prototype placed on the anterior leaflet. Dotted lines represent regions targeted for cryo-anchoring and RF ablation. C: Catheter prototype with cryo-anchoring elements and RF electrode. loop allowed for precise spatial localization of the catheter tip to the desired areas of the MV. The cryo-anchor temperature was controlled automatically by monitoring the temperature of the cryo-anchor and varying the duty cycle of a cryogenic solenoid. Flow Loop Treatments. Two different treatments were tested on MVs placed in the left heart flow loop while under physiologic flow conditions. To determine the hemodynamic changes induced by cryo-anchoring, the cryo-anchoring procedure was performed without RF ablation on several locations of each MV leaflet for a total of 15 applications for 90 seconds each at a temperature of approximately -30 to -35 C. The cryo-anchoring procedure 91
101 targeted the central portion of the anterior and posterior leaflets, as demonstrated in Fig. 1B. In order to assess the ability to ablate the MV leaflets, RF ablation was performed during cryo-anchoring, also in the central portion of the anterior and posterior leaflets. RF ablation was applied while cryo-anchored to the MV at a power of 50 W for 90 seconds, with 15 applications. Parameter Fitting. Strain energy density was used to provide a quantitative measure of the extent of RF ablation, which allows post-treatment mechanical assessment of leaflets without any pre-treatment information. The strain energy density was determined by fitting post-treatment mechanical data to a three-parameter strain energy model using nonlinear regression [141]. After treatment in the left heart flow loop, MV anterior leaflets were excised, tracking markers were placed on the surface of the leaflet for strain tracking, and samples were placed into a biaxial mechanical test device and loaded to 90 N/m of membrane tension in each direction. For more details, see [9, 11]. Following mechanical testing, the strain energy density was determined by fitting the membrane tension and strain data to a three-parameter strain energy model [142], in order to determine the strain energy density (W): Where: T ij = W E ij W = c[e Q 1] Q = A 1 E A 2 E 22 In which c, A1, and A2, are the parameters to be fit, Eij is the Green-Lagrange strain tensor, W is a strain energy density function, and Tij is a membrane tension representation 92
102 of the 2nd Piola-Kirchhoff stress tensor. Tij is a relation of membrane tension in the reference configuration to areas in the reference configuration and is defined as: and: T 11 = P 1 L 2 λ 11 T 22 = P 2 L 1 λ 22 Where P is the load in Newtons, L is the original length of the sample, and λ is the principal stretch ratio. Directions 1 and 2 correspond with the circumferential and radial directions of the MV leaflet, respectively. Experimental data was fit to the three parameter strain energy model using non-linear least squares regression with a trust-region-reflexive algorithm [143]. Boundary conditions were imposed such that all three parameters, c, A1, and A2, must be greater than zero. The results from mechanical testing, including the three parameter fits and the strain energy density, are displayed in the supplementary tables. In order to provide a control group for comparison, biaxial mechanical data that had previously been collected on untreated MV anterior leaflets (n=100) was fit to the above three parameter model. As the distribution of the residuals from model fitting was nonnormal, we used the results from parameter fitting these 100 samples to directly determine a 95% untreated confidence interval: the range that contained the middle 95 values. For additional control groups, we fit biaxial mechanical data from MV anterior leaflets treated in a static environment with 350 J, 850 J, and 1250 J of RF energy in combination with cryoanchoring [11]. n=5 anterior leaflets were used per control group. 93
103 Picrosirius Red Staining. Collagen morphology and birefringence were assessed with picrosirius red (PSR) staining, which is specific for collagen when viewed under polarized light [144]. Leaflets were sectioned along the circumferential direction at 7 µm, stained with sirius red 0.1% in saturated picric acid (Electron Microscopy Science, Hatfield, PA) for 1 hour, and viewed between crossed polarizers at 200x magnification for morphological assessment (Eclipse E800, Nikon, Tokyo, Japan). Collagen birefringence is an indicator of thermal damage [145], so a relative measure of birefringence was obtained by determining the average image intensity [146]. MV sections were placed between crossed polarizers and images were taken with the longaxis of each sample at 0, 45, and 90 relative to the polarizing axis. Average image intensity was calculated for a 250 µm x 250 µm area using images from each of the three orientations and normalized to the background light intensity. This process was repeated twice more for a total of 3 regions per MV leaflet. Durability Study. In order to test the durability of RF ablation treatment, MV anterior leaflets were excised from porcine hearts immediately after slaughter. Leaflets were then placed in the biaxial mechanical test device, mechanically tested to 90 N/m of membrane tension, and then either treated with 1250 J of RF energy with cryo-anchoring or were left untreated (n=6 per group). After treatments, leaflets were mechanically tested, placed in a tension bioreactor (Fig. 7.2) inside of a standard incubator (37 C, 5% CO2) and stretched to 10% strain at 1 Hz. During conditioning in the stretch bioreactor, samples were submerged in DMEM containing 10% FBS and 5% antibiotic/antimicotic (ABAM) for 3 days. ABAM was then reduced to 2% following the first three days of conditioning, and all samples were stretched continuously for four weeks. After four weeks of conditioning, mechanical testing 94

104 radial anterior posterior Excised tissue circumferential Fig. 7.2: Cyclic Stretch Bioreactor Cyclic stretch bioreactor used for the four week durability study. with parameter fitting and PSR staining were used to assess the state of the leaflets following four weeks of conditioning and to determine if leaflet size changes induced by RF ablation remained durable. Statistical Methods. For analysis of average image intensity of PSR-stained sections and leaflet size in the durability study, statistical significance was determined using a student s t-test with α = All error bars shown indicate standard error. For comparison of the parameters determined by non-linear regression, all data was compared to the 95% confidence interval determined directly from n=100 untreated MV anterior leaflets. Results Hemodynamics of Cryo-Anchoring. Fluid flow and pressure across the MV were monitored before (baseline) and during the cryo-anchoring procedure, and waveforms remain largely unaltered during cryo-anchoring (Fig. 7.3A and Fig. 7.3B). When the forward cardiac output was compared between baseline and during the cryo-anchoring procedure, no significant differences were observed (inset, Fig. 7.3B). Fig. 7.3C displays typical outputs to the catheter prototype s cryo-anchor and RF ablation electrode during a combined RF 95
105 Baseline During Cryo-Anchoring Time (s) B C RF Impedance ( ) 5 5 CO (L/min) TM Flow (L/min) Cryo-Anchor Temperatuure ( C) A 100 RF Power (W) TM Pressure (mmhg) Base Cryo Time (s) Time (s) Fig. 7.3: Hemodynamics of Cryo-Anchoring and Typical Catheter Outputs Representative transmitral pressure (A) and flow (B) waveforms for a baseline flow condition (closed diamonds) and during cryo-anchoring (open circles). Inset: average forward cardiac output during baseline and cryo-anchoring flow conditions. No significant differences between groups. C: Catheter outputs for one representative ablation procedure performed in the left heart flow loop
106 ablation procedure with cryo-anchoring. Videos of the cryo-anchoring procedure can be found in the supplemental data (Videos S1 and S2, not shown). Parameter Fitting. Fig. 7.4 shows a representative model fit to the biaxial mechanical data from both of the flow loop treatment groups. MV anterior leaflets treated with cryoanchoring alone produced mechanical responses similar to those that have been reported for native, untreated MV anterior leaflets (Fig. 7.4A) [11, 50]. Qualitative differences in the shape of the loading curves can be observed between the RF ablation with cryo-anchoring group and the cryo-anchoring only group. MV leaflets treated with RF ablation lack the toe region often seen in healthy, untreated MVs, and the absence of the toe region can be seen in Fig. 4B. The shaded regions of Figs. 4A and 4B are a graphical representation of the strain energy density. The strain energy density resulting from parameter fitting after treatment in the left heart flow loop is shown plotted alongside static controls treated with RF energy with cryoanchoring (Fig. 7.4C). The 0 J static control group is the average of 100 untreated MV anterior leaflets that were used to determine the 95% untreated confidence interval and was found to be 4.36 N/m with a 95% confidence interval of (2.67, 7.11 N/m). The 350 J, 850 J, and 1250 J static control groups are a re-analysis of mechanical data previously presented for comparison purposes [11]. All MVs treated with RF ablation with cryo-anchoring in the flow loop have fitted parameters that fall well outside the 95% untreated confidence interval. All cryo-anchoring only MV leaflets have strain energy density similar to untreated controls, indicating that cryo-anchoring alone does not alter leaflet size or mechanical response. 97
107 A Membrane Tension (N/m) C Cryo-Anchoring Only 1250 J Stretch Ratio 20 B Membrane Tension (N/m) RF with Cryo-Anchoring Circumferential Radial Model Fits Stretch Ratio J 15 W (N/m) 10 Untreated CI W (N/m) J 350J 850J 1250J Static Controls Cryo Only RF + Cryo Flow Loop Treatments Fig. 7.4: Model Fit Results to Treated and Untreated MV Leaflets Representative model fits to experimental mechanical data following treatment in the flow simulator following application of cryo-anchoring without RF energy (A) and following treatment with RF energy with cryo-anchoring (B). Circumferential direction, solid triangles. Radial direction, open circles. Model fits, dotted line. C: Strain energy density for static control leaflets and flow loop treated leaflets, an indicator of the extent of RF energy delivery. The shaded region represents the 95% untreated (0 J) confidence interval, determined from n=100 MV anterior leaflets not treated with the catheter prototype. Each of the static control leaflets (350, 850 and 1250 J) were treated with the amount of RF energy indicated combined with cryo-anchoring (n=5 per group). 98
.")
; however, treatment with RF ablation denatures the collagen fibrils, and a distinct loss of collagen crimp occurs (Fig. 7.5C).")
 demonstrates morphologies similar to untreated valves.")
 reveal regions of thermal damage indicated by a loss of collagen crimp. Fig. 7.")

108 FLOW LOOP TREATMENTS STATIC CONTROLS Picrosirius Red Staining. Morphological analysis of MVs stained with PSR reveals the collagen crimp pattern typical of healthy MV leaflets (Fig. 7.5A). Cryo-anchoring alone does not modify collagen morphology (Fig. 7.5B); however, treatment with RF ablation denatures the collagen fibrils, and a distinct loss of collagen crimp occurs (Fig. 7.5C). Representative images of MVs treated in the left heart flow loop are also displayed in Fig. 7.5, and PSR-stained sections of flow loop treatment with cryo-anchoring only (Fig. 7.5D) demonstrates morphologies similar to untreated valves. MVs treated in the flow loop with RF ablation with cryo-anchoring (Fig. 7.5E) reveal regions of thermal damage indicated by a loss of collagen crimp. Fig. 7.5E features a distinct border between ablated tissue and normal, untreated tissue. Untreated Cryo Only RF + Cryo A B C Cryo Only RF + Cryo D E Fig. 7.5: Picrosirus Red Staining of RF Ablation-Treated MV Leaflets Representative images of PSR-stained sections sliced with the circumferential direction and viewed between crossed polarizers. Scale bars = 100 µm. A: Untreated, normal MV. B: Statically treated with cryo-anchoring only. C: Statically treated with RF ablation with cryo-anchoring. D: Flow loop treatment with cryo-anchoring only. E: Flow loop treatment with RF ablation with cryo-anchoring. Note the sharp demarcation between ablated and normal tissue. 99
109 Normalized Intensity Normalized Intensity Untreated RF + Cryo Static Controls Cryo Only RF+Cryo Flow Loop Treatments Fig. 7.6: Quantification Polarized Light Intensity of PSR-Stained MV Sections Average normalized light intensity of PSR-stained sections viewed between crossed polarizers, a relative assessment of collagen birefringence. Average of n=3 MV anterior leaflets per group. + indicates a significant decrease (p < 0.05) from the static, untreated control leaflets. Average normalized light intensity is shown for static control valves and flow loop treated MVs in Fig Treatment with RF ablation results in a significant reduction in average light intensity (p < 0.05). Consistent with morphological image analysis and parameter fitting, MVs treated with cryo-anchoring alone have a collagen birefringence similar to normal, healthy MVs, and MVs treated with RF ablation with cryo-anchoring demonstrate a significant reduction in birefringence. Durability Study. Following static treatment of RF ablation with cryo-anchoring and four weeks in a stretch bioreactor, MV leaflets were reduced in size at all points in the loading cycle (Fig. 7.7A), similar to a typical acute post-treatment response [11]. Fig. 7.7B shows leaflet size changes, as measured at mechanical loading that mimics the systolic condition, immediately post-treatment and after four weeks of conditioning. Leaflets demonstrated size reductions in both the circumferential and radial directions that were maintained over 100
.")
. A Membrane Tension (N/m) C W (N/m) 100 Circ - Untreated Radial - Untreated Circ - Week 4 Radial - Week 4 80 60 40 20 0 0.6 0.8 1.0 1.2 1.")
110 four weeks, with no significant difference between groups. Parameter fitting indicated that strain energy density for the RF ablation-treated MV leaflets remained outside the 95% untreated confidence interval over 4 weeks (Fig. 7.7C). Untreated and treated MV leaflets stained with PSR after four weeks of conditioning in a stretch bioreactor expressed similar morphologies to healthy and RF-treated leaflets, respectively (Fig. 7.7D and Fig. 7.7E). A Membrane Tension (N/m) C W (N/m) 100 Circ - Untreated Radial - Untreated Circ - Week 4 Radial - Week Stretch Ratio Acute Week 4 Untreated CI Untreated Circ Treated Radial B % change in systolic deformation Untreated D Circ Radial Areal Acute Week 4 Treated E Fig. 7.7: Durability Testing of RF Ablation-Treated MV Leaflets Representative membrane tension vs. stretch ratio for one MV leaflet treated with 1250 J of RF energy with cryo-anchoring (A). Shown are the pre-treatment (circles) and four week post-treatment (squares) mechanical responses with all stretch ratios referenced to the untreated, unloaded configuration. B: % change in areal systolic deformation (leaflet size at 90 N/m of membrane tension) immediately after treatment with 1250 J of RF energy with cryo-anchoring (black bars) and four weeks post-treatment (gray bars). No significant changes between groups (p > 0.05), n=6 for each group. C: Strain energy density for mechanical test data immediately after treatment (black bars) and four weeks posttreatment (gray bars). n=6 for each group. D-E: Representative images of PSR-stained sections following four weeks in a stretch bioreactor. Scale bars = 100 µm. 101
111 Discussion Cryo-Anchoring Hemodynamics. As Video S1 (not shown) demonstrates, a steerable catheter can freely maneuver around the circumference of the MV apparatus, and placement of the catheter on or across the MV leaflet does not restrict motion. Cryoanchoring of the catheter to the surface of the MV apparatus can be performed in a variety of locations, allowing RF energy to be distributed where desired. Video S1 demonstrates a cryo-anchoring procedure in which both the anterior and posterior leaflets are anchored simultaneously, producing leaflet movement comparable to that of an edge-to-edge repair [84]. As demonstrated, cryo-anchoring provides robust attachment to both leaflets when each of the approximately 1.75 mm long cryo-anchors of the 7 French catheter are maintained at -30 to -35 C. Cryo-anchoring can also be confined to a single leaflet, such as that shown in Video S2, in which the anterior leaflet is anchored near the MV annulus and leaflet motion is largely unaltered. Thus, cryo-anchoring can be used to target specific regions of the MV apparatus for delivery of RF energy, and cryo-anchoring can be maintained over long periods of time (90 seconds or more) at temperatures around -30 C to allow for therapeutically meaningful doses of RF energy to be delivered (Fig. 7.3C). Importantly, the cryo-anchoring procedure does not significantly alter the hemodynamics of the left side of the heart (Fig. 7.3A-B). Assessment of RF Energy Delivery I: Strain Energy Density. As these experiments were performed on healthy MVs, flow measurements such as regurgitant volume, or geometric measurements such as the degree of leaflet prolapse, were not suitable indicators for treatment efficacy and an alternative method was necessary. In prior studies, we used biaxial mechanical testing to determine leaflet size and mechanical changes using pre- and 102
112 post-treatment mechanical data and demonstrated that changes in leaflet mechanics accompanied size changes [11]. However, pre-treatment mechanical data was unattainable in this study due to the need to use the intact MV apparatus in the left heart flow loop. Thus, our strain energy density approach permits quantitative assessment of mechanical changes induced by RF energy by comparing the results from model fitting to those of untreated and treated control valves. The robustness of strain energy density to predict alterations due to RF energy can be seen in the large differences between groups (Fig. 7.4C). The mechanical response and strain energy density of MV leaflets following cryo-anchoring are similar to the native, untreated response, confirming that cryo-anchoring does not affect leaflet mechanics. MVs treated in the flow loop with RF ablation were characterized by strain energy densities that fell well outside the 95% confidence interval, indicating that RF energy delivery to MV leaflets is still feasible in the presence of convective blood flow. As large (> 10 x 10 mm) sections of tissue are used for mechanical testing, strain energy density identifies large scale changes in the mechanics of the MV leaflets. A possible future application of this approach is for use with in vivo animal testing of the catheter prototype to verify RF energy delivery. As in vivo animal models of MV prolapse can be difficult to find, this will provide one method of testing successful delivery of RF energy in studies using healthy animals. Assessment of RF Energy Delivery II: PSR Staining. PSR staining is another method of assessing RF energy delivery, since the primary target of both our ablation treatment and PSR is collagen. The collagen structure of normal, healthy MV leaflets is characterized by a regular crimp pattern, shown in both the untreated and cryo-anchoring only treatments (Fig. 7.5A-B and Fig. 7.5D). Studies with cryoablation on the myocardium have concluded 103
113 that cryogenic temperatures, at least as low as -80 C, can be performed without structural damage to tissues [56]. MV leaflets that have been treated with RF ablation lose the collagen crimp pattern as they contract due to heat, and when stained with PSR, these same leaflets also demonstrate a significant reduction in collagen birefringence in areas of thermal damage (Fig. 7.6). In this study, we use the average light intensity of the sample as a relative measure of birefringence. The loss of birefringence manifests itself as regions of darkened tissue when viewed between crossed polarizing filters, and the difference in light intensity between ablated and untreated regions can be seen in Fig. 7.5E and Fig Durability of RF Energy-Induced Changes. The in vitro durability study was performed to determine whether size changes induced by RF ablation may be temporary and whether RF-treated leaflets become mechanically compromised over time, either of which would be detrimental to this treatment strategy. Previous studies have examined the use of RF ablation to reduce left ventricular volume size in patients with congestive heart failure and found that myocardium treated with RF energy re-dilated within four weeks [51]. In this study, after static treatment with an RF ablation and cryo-anchoring catheter prototype and four weeks of conditioning in a stretch bioreactor, MV leaflets remained durable (Fig. 7.7A). Following the four weeks of bioreactor conditioning, MV leaflet size actually reduced further in each direction when measured at systolic loads (Fig. 7.7B), albeit not significantly. The mechanism for this further reduction in leaflet size is unknown, but one possible explanation is that scarring causes stiffening of the tissue and further contraction. Others have reported that the first 2-3 months following ablation is a period of remodeling in which tissue mechanics and size may be altered [147, 148]. Additionally, in vivo studies using RF ablation to shrink the MV annulus have reported that the annulus contracts to 104
114 diameters below the initial shrinkage at 3- and 6-months [54], following a trend similar to our durability results. While this study on the durability of RF ablation treatment of MVs is limited in that it was performed entirely in vitro, the results are promising in that leaflet size changes are maintained. Study Limitations. This study was somewhat limited in that healthy MVs were used, as there was not a reliable in vitro model for MV prolapse. A more precise determination of the efficacy of this percutaneous approach will be required using in vivo disease models. The procedure was also performed by direct visualization, which made accessing and treating the MV significantly easier than through echocardiographic image guidance. Lastly, ablation of the MV was confined to the leaflets, although the MV annulus and chords may also be ablated. Chordal elongation is often another target of MV repair, and further work may include ablation of the chords. However, there may be added risk of chordal rupture or of inducing arrhythmias, due to their location in the ventricle. Conclusions In this study, we have demonstrated that a combined RF ablation and cryo-anchoring catheter can reliably adhere to and ablate the MV in a dynamic hemodynamic environment. Cryo-anchoring provides robust, reversible attachment to the MV apparatus while RF ablation reduces MV leaflet size, effectively providing a percutaneous alternative for surgical leaflet resection. While in vitro results are promising, further study will be required to assess in vivo safety and efficacy. 105
115 Chapter 8 AIM 3: TWO-DIMENSIONAL ECHOCARDIOGRAPHIC INDICATORS OF MV LEAFLET SHRINKAGE AND ASSESSMENT OF TREATMENT EFFICACY IN VIVO Introduction The objective of the present work is to evaluate the efficacy of the RFC catheter to approximate surgical leaflet resection using a non-survival porcine animal model. Initially, RFC catheter treatment efficacy criteria was identified using ex vivo testing of excised porcine MVs placed in a left heart flow simulation device. The primary goal of the ex vivo study was to use quantitative leaflet length measurements, obtained on echocardiographic views of the A2-P2 imaging plane, as a predictive imaging correlate for total leaflet area reductions. Leaflet area reductions of MVs in the left heart flow simulator were measured by tracking the positions of four suture markers placed on the MV anterior leaflet (AL) surface with echocardiography in an intercommissural imaging plane to capture all markers on 2-dimensional (2D) views. Corresponding leaflet length reductions were captured in the A2-P2 imaging plane and compared to directional and areal measurements obtained in the intercommissural plane. Following the establishment of efficacy criteria, five consecutive in vivo studies in healthy pigs were performed open-chest to test the efficacy of the RFC catheter to resect leaflet tissue. The data that follow demonstrate that RFC catheter treatment, guided by echocardiography, produces significant resection of MV leaflets without compromising hemodynamic function during treatment. Post-treatment echocardiographic images, quantification of leaflet length, as well as gross morphological, histological, and mechanical 106
116 analyses provide evidence that RF ablation can produce significant reductions in MV leaflet area. Materials and Methods Ex Vivo Establishment of Efficacy Criteria. Intact porcine MVs were excised from hearts obtained from the local abattoir (Hampton Meats, Hopkinsville, KY) within one hour of slaughter, including the annulus, leaflets, chords, and papillary muscles (PMs). Four tracking markers (3-0 braided polyester suture with 3-4 square knot throws) were sutured to the central region of the AL on the atrial surface with approximately 1 cm spacing to track leaflet size with echocardiography. Additionally, the outer margin of the AL was marked by staining with trypan blue to provide an estimate of leaflet area pre- and posttreatment. The intact valves were then placed in a left heart flow simulator (Fig. 1A) capable of reproducing physiologic pressure and flow waveforms (average flow rate of 5 L/min, heart rate of 70 beats/min, transmitral pressure of mmhg), as described previously [149]. Mock circulatory flow loops have been used to create models of MR and to study the hemodynamic response of MVs to various surgical treatments [150]. In this study, after a normal, baseline PM configuration was established, both PMs were displaced towards the MV annulus until significant leaflet billowing (greater than 4 mm beyond the annular line) was seen on echocardiography (Fig. 8.1). This provided an approximate simulation of bileaflet prolapse to more easily visualize leaflet morphologic changes following treatment with the RFC catheter. 107
 Image BASELINE PROLAPSE TREATED 100 Annular Line")


.")


117 radial A B PM Displacement First (Reference) Image Second (Deformed) Image BASELINE PROLAPSE TREATED 100 Annular Line Atrium Prolapse C Papillary Muscle Ventricle A2-P2 PLANE 400 D REFERENCE TREATED Annular Line 500 circ INTERCOMMISSURAL PLANE 1 cm Leaflet Length E A2-P2 PLANE 600 Fig. 8.1: Ex Vivo Methods A: MV positioned into the left heart flow simulator with adjustable PM attachments (arrows). B: Echocardiographic imaging planes used in the ex vivo study, surgical view. C: Change in MV morphology following treatment with the RFC catheter, shown in the A2- P2 plane. Note the reduction of leaflet prolapse following treatment. D: Markers placed on the AL were tracked in the intercommissural imaging plane. E: Echocardiographic image of a porcine MV in the left heart flow simulator imaged in the A2-P2 plane with leaflet length measurements denoted in red. 108
118 To provide a clinically relevant assessment of RFC catheter treatment efficacy, twodimensional (2D) echocardiography (Acuson Antares, Siemens) was used to image MVs in the left heart flow simulator. Views of the MV apparatus were captured in two imaging planes: an intercommissural plane to track the four suture markers on the surface of the AL, and an A2-P2 plane to record leaflet morphology, length, and prolapse (Fig. 8.1B). Baseline echocardiographic recordings were captured, the PMs were displaced towards the annulus, and the prolapse condition was recorded (Fig. 8.1C). The AL was then treated several times with the RFC catheter with a cryo-anchor temperature of approximately -50 C and RF ablation power of 65W for 90 seconds each. The first five ablations were performed within the area constrained by the four tracking markers, and marker positions were recorded during mid-diastole after each ablation in the intercommissural plane (Fig. 8.1D). To determine reductions in marker area, circumferential length, and radial length, the deformation gradient tensor was calculated from the four marker positions and averaged over three repeated measurements (MATLAB, MathWorks, Inc.) [11, 117]. After the first five ablations, each AL and posterior leaflet (PL) was ablated up to 10 times, and posttreatment echocardiographic recordings were captured. AL and PL lengths were measured during mid-diastole, from the base of the annulus to the leaflet free edge, and averaged over three measurements (MATLAB) (Fig. 8.1E), while corresponding leaflet prolapse measurements were taken during mid-systole (Showcase Premier, Trillium Technology) (Fig. 8.1C). In Vivo Investigational Protocol. Five consecutive studies in healthy pigs ranging in weight from 47 to 51 kg were carried out with a Vanderbilt University approved institutional animal care and use committee protocol to evaluate RFC catheter efficacy in 109
119 vivo. On the day of surgery, anesthesia was induced with ketamine (2.2 mg/kg), telazol (4.4 mg/kg), xylazine (2.2 mg/kg), and atropine (0.04 mg/kg) via intramuscular injection, and isoflurane (1-3%) with O2 was administered under endotracheal intubation for maintenance. To prevent arrhythmias, animals were treated with an intravenous bolus loading dose of 2 mg/kg of amiodarone prior to the start of surgery and 1.2 mg/kg/hr via intravenous drip for maintenance thereafter. Heart rate, rhythm, and blood pressures were monitored throughout the procedures. A median sternotomy was performed and intervening fascial layers dissected to optimize visualization of the pericardium, heart and major blood vessels. An 18 gauge needle was utilized to cannulate the mid-to-distal anterior wall of the left ventricle through which a inch J-wire was inserted for ventricular access. A 12 Fr short modified sheath was placed in the left ventricle (Fig. 8.2A-B) via an over-the-wire modified Seldinger technique followed by tandem removal of the wire and dilator. Sheath position on the left ventricular free wall and alignment with the MV apparatus was confirmed by direct echocardiographic guidance using an epicardial probe positioned superior to the access site on the pericardial-epicardial surface in an epicardial long-axis configuration. Fluoroscopy was available, if necessary, for sheath and catheter guidance but was used in only one animal in this study. The RFC catheter (10 Fr) was directed through the sheath and across the MV orifice under direct echocardiographic visualization. Once the RFC catheter tip was located in the vicinity of the AL, cryo-anchoring was obtained by intra-luminal delivery of nitrous oxide to securely cryo-anchor the catheter to the leaflet surface with a temperature of -50 C (Fig. 8.2C-D). Once cryo-anchoring was achieved, RF energy was delivered to the AL for 60 seconds (Fig. 8.2E-F). RF power output was regulated to maintain the RF electrode 110
 70 60 50 40 30 20 10 F RF Power RF Impedance 300 250 200 150 100 50 Impedance (Ohms) -60 0 20 40 60 80 Time (s)")
 Fig. 8.")
.")
, while the systolic view demonstrates that leaflet mobility is maintained, allowing")
120 A RV LV B LV Freewall AL Apex DIASTOLE SYSTOLE LV AL LV AL PL LA Catheter PL LA C D Temperature ( C) Cryo Temp RF Temp E Power (Watts) F RF Power RF Impedance Impedance (Ohms) Time (s) Time (s) Fig. 8.2: In Vivo Methods A: Access to the MV was gained by placing a sheath midway up the left ventricular free wall, enabling direct access to the AL, shown post-mortem (B). Epicardial long-axis view of the RFC catheter cryo-anchored to the AL, while the PL moves freely. The diastolic view demonstrates the free PL (C), while the systolic view demonstrates that leaflet mobility is maintained, allowing valve closure (D). Dotted yellow line indicates the catheter shaft. E: Representative temperatures at the RF electrode (red, dash) and cryo-anchor (blue, solid) during one ablation. F: Representative ablation power output (black, solid) and measured impedance (red, dashed) corresponding to temperatures measured in E. LV: left ventricle. RV: right ventricle. 111
121 temperature within a calibrated range that was demonstrated to produce leaflet resection without significant impedance rise. Cryo-anchoring was then ceased after 60 seconds of ablation, the RFC catheter tip was re-positioned, and the cryo-anchoring and ablation process was repeated up to 20 times for each animal. In Vivo Study Evaluation Protocol. Echocardiographic examination of the MV and surrounding area was performed before and after RFC catheter treatment in long- and short-axis views of the heart. All echocardiographic imaging was performed epicardially using a custom-built scanner (Cephasonics, Santa Clara, CA) in B-mode with a 10 MHz linear array probe. Following catheter treatment and completion of the echocardiographic examination, each animal was euthanized according to protocol, and the heart was excised. At post-mortem, the entirety of the left heart, including the MV, ventricle, atrium and left ventricular outflow tract, was examined for signs of ablation. Gross leaflet morphology, as well as any off-target ablations, were noted. The belly region of each MV was then excised and mechanically tested to equibiaxial loads of 90 N/m in a biaxial mechanical testing device to assay for evidence of thermal alteration by fitting the mechanical loading curves to a Fung-type strain-energy model. Strain-energy measurements have previously been shown to provide a measure of thermal alteration and an estimate of resected leaflet area [130, 149]. Afterwards, leaflets were fixed in 10% formalin before histological staining with picrosirus red to assess collagen structure for characteristic markers of thermal alteration [145, 149]. Echocardiographic images of the AL in the long-axis view from pre- and posttreatment were analyzed offline to measure leaflet length (MATLAB). Leaflet length measurements were repeated three times per image frame over 3-6 different frames for a total of 9-18 measurements per leaflet and were averaged together. 112
122 Statistical Analysis. All measurements are reported as mean ± standard error. One way ANOVA was conducted to examine statistical differences between groups with a follow-up Holm-Sidak method for multiple pairwise t-tests at significance level α=0.05. Results Ex Vivo Assessment. Maximum areal shrinkage within the marker region of interest was achieved after 4 ablations of 50W for 90 seconds (Fig. 8.3A-B) and shrinkage was greatest in the circumferential leaflet direction (Fig. 8.3C). After 15 ablations, spread over the entirety of the AL, areal leaflet shrinkage was 38 ± 2.7%, circumferential shrinkage was 30 ± 2.3%, and radial was 12 ± 2.2% (Fig. 8.3D). For comparison, leaflet area, as measured by the area enclosed by tissue dye markers before and after experiments, was found to have shrunk by 32 ± 3.3% and 37 ± 5.9% in the AL and PL, respectively. Corresponding leaflet length reduction (9.2 ± 1.8%), measured on echocardiography in the A2-P2 imaging plane, was comparable to radial shrinkage. Overall, when leaflet length has been reduced by 9.2%, total leaflet area has decreased by 38%, which provides a quantitative target for determining leaflet resection efficacy in the in vivo study (Fig. 8.3D). PL length decreased by 12 ± 3%, and average leaflet lengths measured in the baseline, prolapse, and treated conditions are shown plotted in Fig. 8.4A-B. Leaflet prolapse decreased by 62 ± 17% and 50 ± 30% in the AL and PL, respectively (Fig. 8.4C-D). In Vivo Efficacy. The RFC catheter was able to selectively adhere to the AL, and valve closure was minimally inhibited during cryo-anchor formation. The maximum difference in heart rate during RFC catheter treatment from baseline averaged -2 ± 3.3 beats per minute, suggesting no adverse effects on cardiac function. Cryo-anchoring was successfully 113
 and radial directions. B: Areal leaflet shrinkage over the course of 5 ablations within the 2x2 marker area, n=6.")
123 Radial Circ A % areal shrinkage B # of ablations % shrinkage Circ Radial C # of ablations % change Area Circ Rad AL Length D Fig. 8.3: Ex Vivo Leaflet Area Measurements A: MV leaflet circumferential (circ) and radial directions. B: Areal leaflet shrinkage over the course of 5 ablations within the 2x2 marker area, n=6. C: Corresponding directional shrinkage measurements in the circumferential (blue circles) and radial (red triangles) directions, n=6. D: Average final marker size reductions recorded in the intercommissural imaging plane (black bars) and corresponding leaflet length reduction measured in the A2- P2 imaging plane (gray bar), n= A B AL Length (cm) PL Length (cm) Baseline Prolapse Treated 0.0 Baseline Prolapse Treated AL Prolapse (cm) All significant C PL Prolapse (cm) D 0.0 Baseline Prolapse Treated 0.0 Baseline Prolapse Treated Fig. 8.4: Ex Vivo Length and Prolapse Measurements A-B: AL and PL length measured in the baseline and prolapse configurations and following treatment with the RFC catheter. C-D: Corresponding reduction in prolapse of the AL (C) and PL (D) post-treatment. Lines above bars represent significant changes between groups (p<0.05). n=9 per group. 114
124 maintained throughout each ablation, and between ablations were attempted on each animal for a target time of 60 seconds (Table 8.1). One animal (Animal #5) developed atrial fibrillation after 15 ablation attempts and was successfully cardioverted to normal rhythm. Echocardiographic images taken of the AL post-treatment demonstrated apparent leaflet thickening, shortening of leaflet length (Fig. 8.5A-B), and altered leaflet motion throughout the cardiac cycle when compared to pre-treatment images. Measurements of leaflet length on echocardiographic long-axis views indicated an average 13.3 ± 4.6% reduction in AL length following RFC catheter treatment (Fig. 8.5C). Table 8.1: Average Ablation Output and Post-Treatment Morphological Assessment Animal # Ablations Attempted Average Duration (s) Average Power (W) Average RF Temp. ( C) Off-Target Ablations Morphologic Changes ± ± ± Near posteromedial commissure on ventricular wall Significant char in belly region Coagulum along annulus Thickening throughout ± ± ± Near posteromedial commissure in atrium above annulus Small amounts of char Apparent thickening within 3-4 mm of free edge ± ± ± None could be identified ± ± ± None could be identified ± ± ± Near posteromedial commissure on ventricular wall Significant char in A2 segment from annulus to leaflet free edge Coagulum along annulus Thickening throughout Moderate char, primarily in A2 segment from leaflet belly region to free edge Apparent thickening in leaflet central area Localized areas of leaflet thickening and light char on leaflet Coagulum along annulus near both commissures 115
125 ALs treated with the RFC catheter demonstrated varying levels of char formation on the leaflet surface, coagulum formation around the annulus, and apparent leaflet thickening (Fig. 8.6A; Table 8.1). Most off-target ablations were located around the posteromedial commissure in either the ventricle or atrium Ablations located on the annulus immediately above the AL were not considered off-target. Strain energy values obtained for the n=5 ALs treated in the pig study are shown plotted alongside estimates for resected leaflet area (Fig. 8.6B). Resected leaflet area estimates were obtained from previously published findings in leaflets treated in a static bench environment, and strain energy values greater than 10 N/m have been found to correlate with significant resected leaflet areas [149]. Three out of five of the leaflets positively tested for strain energy values that indicate significant leaflet resection. Additionally, picrosirius red staining confirmed that the collagen structure of the ALs had been thermally altered in four of five leaflets (Fig. 8.6C). Discussion Establishment of Leaflet Resection Efficacy Criteria. As healthy animals without MR were used for this study, a quantitative measurement was needed to appropriately evaluate the ability of the RFC catheter to shrink or resect MV leaflet tissue. Thus, we used a twopart study to identify a measurement than can be used to assess the acute success of RFC catheter treatment in healthy animals: leaflet length measured on echocardiography. First, leaflet area and directional length measurements were taken in a physiologic ex vivo environment. These measurements were recorded in the intercommissural imaging plane (Fig. 8.1B), which cannot be sufficiently visualized without the placement of markers on the leaflet surface. Next, corresponding leaflet length measurements in the A2-P2 116
 and after (B) treatment with the RFC catheter.")
 as measured on epicardial echocardiography following treatment with the RFC catheter. Dashed line indicates efficacy criteria established in the ex vivo study.")
 and radial marker length (intercommissural plane) were found to agree and because the relationship between radial and circumferential shrinkage was found to remain the same")
126 No Change PRE-TREATMENT POST-TREATMENT AL LV AL LV A LA B LA C 0 Animal #1 #2 #3 #4 #5 D % leaflet length reduction AL Length: 1.88 cm Fig. 8.5: Post-Treatment Echocardiographic AL Assessment Long-axis view of the AL before (A) and after (B) treatment with the RFC catheter. The post-treatment AL exhibits a characteristic increase in thickness and a decrease in radial length. C: AL length reduction (% decrease) as measured on epicardial echocardiography following treatment with the RFC catheter. Dashed line indicates efficacy criteria established in the ex vivo study. D: One representative leaflet length measurement (Animal #1). imaging plane, which is an easily obtainable measurement in vivo, were taken for comparison. As AL length (A2-P2 plane) and radial marker length (intercommissural plane) were found to agree and because the relationship between radial and circumferential shrinkage was found to remain the same across samples, leaflet length reductions measured on clinical 2D echocardiograms can be used to estimate total leaflet area shrinkage in healthy animals. Based on the ex vivo data, the target for in vivo RFC catheter treatment efficacy is approximately 10% reduction in leaflet length, which would indicate a total leaflet area reduction of approximately 40% (Fig. 8.3D). This is comparable to the average resected area of a typical PL quadrangular resection, which is 30% [73]. 117

. The PL has been left untreated and is shown for comparison.")

127 A AL PL B Strain Energy (N/m) Estimated Resected Area 43% 36% 3.8% Treated (Animal #1) Untreated Control 0 #1 #2 #3 #4 #5 Animal C 200 µm Fig. 8.6: Post-Treatment Morphological, Mechanical, and Histological Assessment A: MV leaflets post-mortem. The AL is shown partially excised on the left and exhibits significant char and coagulum on the leaflet surface and at the base of the annulus (black arrows). Off-target ablations were seen in the posteromedial commissure (white arrows). The PL has been left untreated and is shown for comparison. B: Strain energy estimate on excised ALs following treatment with the RFC catheter. Values shown to the right are the corresponding estimates of resected leaflet area based on treated and untreated controls in a static bench environment [11, 149]. C: Representative picrosirius red stained section demonstrating the typical loss of collagen crimp following thermal shrinkage (Animal #1). An untreated control is shown on the right. Scale bar = 200µm. Ex vivo testing suggests that the MV leaflet shrinks relatively linearly with the number of 65W ablations, and it takes 4 ablations to maximally shrink a 1 cm square region of tissue by approximately 40% (Fig. 8.3B). Consistent with previous studies, the majority of leaflet shrinkage occurs in the circumferential direction, the primary direction of collagen fiber alignment (Fig. 8.3A). Thus, the total leaflet length, which is aligned radially, shrinks minimally (about 10%), while the leaflet shrinks approximately 30% in the circumferential 118
128 direction. The directional shrinkage response of diseased and myxomatous MV leaflets is currently unknown and warrants investigation. A secondary component of the ex vivo study was treatment of the prolapse model, enabling large changes to MV morphology to be more easily appreciated (Fig. 8.1C). One hallmark of Barlow s disease is large, thickened, and billowing leaflets that prolapse significantly into the atrium during systole. In our ex vivo prolapse model, leaflet prolapse was reduced, on average, by over 50%. The large standard errors associated with the prolapse measurements (Fig. 8.4C-D) are likely an artifact of sample preparation (suturing of MV annulus). In some cases, leaflet prolapse was reduced by over 100% back to baseline. RFC Catheter Treatment is Acutely Efficacious In Vivo. RFC catheter leaflet resection was acutely successful in 4 of 5 animals according to the efficacy criteria established in the ex vivo study. Additionally, minor evidence of leaflet ablation was found in the unsuccessful animal, including small amounts of char formation on the leaflet surface and collagen thermal alteration visible on histology. This is the first study to demonstrate that MV leaflet area can be significantly reduced using a catheter-based strategy in vivo. Selective administration of thermal shrinkage to each MV leaflet is essential in the RFC catheter treatment strategy. Depending on the severity and presentation of degenerative MV disease, enlarged and myxomatous leaflet tissue could be confined to a single segment of a single leaflet or be present throughout both leaflets [20]. The AL was specifically targeted in this study due to the access route, and the AL was successfully adhered to independently of free motion of the un-targeted PL. An alternative access route, closer to the apex, was originally attempted, and it was found that the PL could be similarly targeted for cryo-anchoring (data not shown). 119
129 The ex vivo study indicates that leaflet length reductions of greater than 10% of the original length correlated with a resected area of ~40%. This benchmark was achieved in 4 of 5 animals in the present study. Echocardiographic findings showed thickened and shortened leaflets post-treatment, characteristic of thermal alteration. Gross inspection of ALs post-mortem, picrosirius red staining, and mechanical testing, each verified successful RFC catheter treatment. Off-target ablations occurred in 3 of 5 animals. Epicardial echocardiography provides some guidance of catheter position, but probe maneuverability is limited and difficult to achieve reliably, which may have led to some of the off-target ablations observed here. Future studies will employ transesophageal echocardiography to more consistently and reliably guide catheter placement and transmitral positioning for ablation. Additionally, the catheter access route used in this study was advantageous in that it allowed direct access to the MV leaflets with little need for catheter steering, but the RFC catheter is intended to be used percutaneously, and thus approach the MV atrially through a trans-septal course. Future percutaneous studies will use the trans-septal approach with a steerable sheath and transesophageal echocardiography to more precisely target specific leaflets, which will likely reduce off-target ablations as a result Conclusion. This study demonstrates in vivo success of a catheter-based alternative to surgical leaflet resection for repair of degenerative MV disease. RF ablation with cryoanchoring stability can resect up to 40% of MV leaflet area. The RFC catheter cryo-anchor can selectively target each leaflet individually under echocardiographic guidance, allowing for RF delivery to specific leaflet segments. Efficacy criteria established ex vivo was used to confirm that RFC catheter treatment can be monitored on 2D echo and to confirm that 120
130 treatment was efficacious in healthy pigs. While further testing of safety and efficacy remain, short-term in vivo results indicate that the RFC catheter is a potential percutaneous alternative to surgical leaflet resection. 121
131 Chapter 9 IMPACT AND FUTURE DIRECTIONS Investigational Summary and Impact of Results The overall goal of this research was to develop and refine a percutaneous MV repair device to provide an alternative to surgical leaflet resection and to investigate its effectiveness in reducing MV leaflet size. Several RFC catheter prototypes were designed and built throughout this investigation, and by the end of Aim 2 studies, a completed RFC catheter prototype was built for in vivo use. The current iteration of the RFC catheter is capable of controllably cryo-anchoring to MV leaflets in the beating heart, without cardiopulmonary bypass, at temperatures of -50 C, and RF ablation has been successfully delivered at powers of up to 70W in vivo. The RFC catheter interfaces with a commercially available RF generator, a custom-built nitrous oxide delivery system, and Arduino and LabView control and data acquisition software, providing a complete RFC catheter system that is ready for percutaneous studies. We began our investigation of RFC catheter efficacy in Aim 1 by examining the thermal and mechanical effects of RF ablation and cryo-anchoring within close proximity on a catheter in a static ex vivo setup. We found that MV leaflet area could be reduced by approximately 40% or more during cryo-anchoring and demonstrated that cryo-anchoring remains robust during RF ablation, as measured on IR imaging and anchor strength testing. We also found that leaflet shrinkage magnitude varies spatially in relation to RF electrode and cryo-anchor location, and not simply according to the radial distance from the 122
132 electrode, with the greatest leaflet shrinkage occurring in the direction of the circumferential axis. In Aim 2, the RFC catheter was tested in a physiologic flow environment and it was shown that cryo-anchoring can independently adhere to moving MV leaflets while transmitral flow and pressure remain unchanged during cryo-anchoring. Additionally, we identified two techniques to assess successful delivery of RF energy to MV leaflets: mechanical model fitting and picrosirus red staining. Importantly, it was also shown that MV shrinkage deformations induced by the RFC catheter remain durable and do not redilate over 4 weeks. Finally, in Aim 3, we developed echocardiographic efficacy criteria to assess RFC catheter treatment in vivo by directly measuring leaflet shrinkage before and after RFC catheter treatment and by comparing areal shrinkage measurements to measurements of leaflet length. The effectiveness of the RFC catheter to thermally shrink MV leaflets was then demonstrated in a large animal model, open-chest without cardiopulmonary bypass, by using echocardiographic efficacy criteria leaflet length measurements developed in the left heart flow simulator. The RFC catheter successfully reduced anterior leaflet size in four out of five animals with no compromising procedural complications. These promising results imply that the RFC catheter is a possible percutaneous alternative to surgical MV leaflet resection. With efficacy demonstrated in a small cohort of animals using an openchest approach, further testing using a percutaneous approach is clearly justified. The RFC catheter is not intended as a universal MV repair device. Instead, the RFC catheter is intended to be used as part of an armamentarium of percutaneous MV repair devices, with specific devices chosen to target specific lesions. Currently, percutaneous or minimally invasive approaches are in development to perform annuloplasty and chordal 123
133 replacement. However, there are no devices, other than the RFC catheter, that are able to perform MV leaflet resection. In the future, the interventional cardiologist may have the tools to perform an effective MV repair without the need for cardiopulmonary bypass or general anesthesia, which will improve post-operative recovery times, decrease procedural cost, and significantly increase the percentage of patients amenable to repair [4]. Future Directions While we have developed the RFC catheter system from concept to functioning prototype and have demonstrated its effectiveness to adhere to and resect MV leaflet tissue, there is still much testing to be done before this approach can be used in the clinic. The first step is to refine the RFC catheter treatment strategy for percutaneous delivery. The proposed percutaneous access route is to enter the right heart through the vena cava and use trans-septal puncture to access the left atrium. Trans-septal puncture is relatively common and is used in a variety of procedures such as ablation of left-sided arrhythmias and in MitraClip placement [151, 152]. Thus, there are already commercially available steerable sheaths that would enable our current RFC catheter prototypes to be used in the trans-septal approach. Transesophageal echocardiography will be needed to provide percutaneous guidance of the RFC catheter and will be available for these studies shortly. Additionally, 3D echocardiography has the potential to more completely visualize the MV leaflets and to provide a quantitative measurement of MV leaflet area, which would provide a significant improvement over 2D measurements. 3D echocardiography may also be crucial to the RFC catheter treatment strategy in the future, as it can more readily identify prolapsing leaflet segments. 124
134 Once the RFC catheter treatment strategy has been refined for percutaneous delivery and shrinkage of MV leaflets in a non-survival porcine animal model, the next step will be to treat MR in a diseased animal model and to follow the animal status for several months after treatment. Middle to small size canines commonly develop degenerative MR as they age, and thus, are an ideal pre-clinical model to test RFC catheter effectiveness [10]. With successful treatment of MR in a canine survival model, the RFC catheter will be poised for first-in-man studies of RF ablation to treat enlarged MV leaflets. By using the RFC catheter to resect prolapsing segments in degenerative MR, and by combining one of the several percutaneous annuloplasty approaches in development, a fully percutaneous and efficacious repair for degenerative MR may someday be realized. 125
135 APPENDIX 126


136 APPENDIX A: RFC CATHETER BUILD INSTRUCTIONS A. Machine a groove in the catheter cryogen applicator: The purpose of this part is to remove as much material as possible from the cryo applicator tip underneath where the RF electrode will sit in order to provide insulation between the cryo applicator and RF electrode. With a felt marker, mark the middle portion of the cryogen applicator where the groove will be cut. Place the catheter, wrapped in something to protect it, in a vise. Use a 1/16 end mill to cut the groove, rotating the tip every so often and moving the catheter tip forward and back as needed to widen the groove. Place a 1/32 end mill in a Dremel and hand cut the groove deeper, taking care to make the edges as square as possible. Use a small file to cut the edges deeper and smooth inconsistencies. Use the Dremel steel brush tool to remove sharp edges, if necessary. Approximate groove diameter at smallest point: 1.75 mm Approximate length of groove: 2.75 mm Fig. A.1 Left: Catheter in vise for machining of cryo tip. Right: Finished cryo tip with insulating groove for RF electrode. B. Remove the coaxial cryogen/vacuum connector: Trim the connector where it meets the blue tubing, being careful to preserve as much of the tubing coming out of the catheter handle as possible. Carefully cut away the outer blue tubing lining. Near the location where the coaxial connector meets the clear vacuum tubing, there will be a strong adhesive bond between the flexible clear tubing with the outer blue tube lining. 127

. Slide a slightly larger polyimide tube (0.0159 ID/0.0179 OD) of several inches of length over the cryogen delivery tube and set with epoxy.")
137 Fig. A.2 Catheter with coaxial connector removed, prior to removal of blue lining. C. Extend the cryogen delivery tube: First, trim some of the clear vacuum line that attaches to the catheter handle in order to expose some of the cryogen delivery tube (this is the orange, polyimide tubing). Slide a slightly larger polyimide tube ( ID/ OD) of several inches of length over the cryogen delivery tube and set with epoxy. Care should be taken to ensure there is epoxy within the inner mating surface of the larger and smaller diameter polyimide tubes, as well as a layer encapsulating the junction along the outside. Keep a diameter wire inside the cryogen delivery tube to ensure no epoxy blocks the tube. Let this set for at least 4 hours, until it sets and is workable. Polyimide tube: Amazon, 26 AWG, B00212Q0FY Nitinol wire: Amazonsupply, nitinol, B001385FJE Epoxy: McMaster, Loctite 1C, 1813A221 Fig. A.3 Large cryogen delivery tube extension epoxied to smaller cryogen delivery tube. D. Remove the cryo applicator tip and trim the cryogen delivery tube: Carefully remove the cryo applicator tip from the catheter tubing by grabbing the tip with pliers and rocking back and forth. Pull the cryo applicator out just enough to expose the polyimide tube for grasping. Pull a length (6-10 cm) of the polyimide tube out of the catheter body. Some force will be needed here, and the polyimide tube may stretch significantly, especially near the distal tip. Thread the diameter wire all the way down the cryogen delivery tube to check for any blockages. Trim the cryogen delivery tube to remove any damaged sections and to remove any blockages, leaving approximately 1 cm of tubing hanging outside of the catheter body. Carefully apply cyanoacrylate to the outside of the cryogen delivery tube, just inside of the catheter body, in order to 128


138 glue it to the translucent plastic linear inside the catheter body. This helps to prevent it sliding away from the distal end of the catheter tip. Cyanoacrylate adhesive: McMaster, Permabond 910, 7580A52 Fig. A.4 Cryo tip detached from catheter body with polyimide cryogen delivery tube exposed. E. Add a vacuum/cryogen connection to the catheter handle: A corner barb to quick-disconnect adapter was placed in the flexible vacuum line tubing, with the polyimide tube sticking out of a hole that was 1/16 hole that was drilled in the connector. A 1/16 OD stainless steel tube was placed over the polyimide tube and slid into the connector for additional support. The stainless steel tube was glued with epoxy at the location where it entered the connector and where the polyimide lumen leaves the stainless steel tube. After epoxy sets, carefully trim excess polyimide tubing so that the end of the polyimide tube is approximately flush with the stainless steel tube. Add 1/16 compression fitting components to this stainless steel tube when ready to use catheter. Epoxy: McMaster, Loctite 1C, 1813A221 Stainless steel tube: McMaster, OD, ID, 8988K36 Quick-disconnect adapter: McMaster, polypropylene, 51545K82 Compression fitting nut: McMaster, stainless steel, 5182K672 Compression fitting front sleeve: McMaster, stainless steel, 5182K65 Compression fitting back sleeve: McMaster, stainless steel, 5182K66 Fig. A.5 New cryo delivery tube and vacuum connector completed with compression fitting components. 129


139 F. Return cryo applicator tip to catheter: Trim polyimide tube at distal end of the catheter such that approximately 4-5 mm of length remains outside of the catheter body. Carefully place polyimide tube into the cryo applicator with tweezers or other tool. Apply cyanoacrylate adhesive to the circumference of the cryo applicator the portion that will return to the main part of the catheter. Return the cryo applicator tip to the blue catheter body. If necessary, pull back on the deflection mechanism to guide the tip back into the tube. Gently twist back and forth slightly to spread the adhesive. Let tip set overnight. Cyanoacrylate adhesive: McMaster, Permabond 910, 7580A52 Fig. A.6 Catheter tip prior to being glued to the distal catheter body. G. Place a layer of epoxy on the cryo applicator were the metal material was machined: Place epoxy in the space of the cryo applicator to provide additional insulation. Let set for 24 hours, at least, and remove excess with a Dremel brush or fine metal file. Epoxy: McMaster, Loctite 1C, 1813A221 Fig. A.7 Thermally and electrically insulating epoxy placed on cryo applicator tip to separate RF electrode and cryoanchor. H. Protect electrodes: Drip cyanoacrylate adhesive over each of the three ring electrodes found near the distal tip of the catheter. Allow to sit for several seconds, and then remove excess with a brush or similar tool. Repeat 2-3 times. These steps are to plug any small holes which may otherwise allow nitrous oxide gas to escape during catheter operation. 130
, to create a makeshift lathe. Better yet, use a lathe if available.")
.")


140 Cyanoacrylate adhesive: McMaster, Permabond 910, 7580A52 Fig. A.8 Sealing ring electrodes near tip with cyanoacrylate adhesive to prevent nitrous oxide gas leakage. I. Fabricate the copper RF electrode: Place a few inch length of 4 mm OD copper tube in the drill (as one would a drill bit), to create a makeshift lathe. Better yet, use a lathe if available. Turn the drill on at a moderate speed, and using a cutting blade on the Dremel, carefully thin the copper tube until the thickness of the tube is small, but great enough so as not to break under light-moderate finger pressure. Cut the copper tube into lengths that roughly match the length of the groove cut on the cryo applicator tip (approximately 2.75 mm). Use a file and/or smooth grinding wheel to remove burrs and smooth and thin the electrode. Cut the copper ring once, lengthwise, so that it can be bent open. Size the open copper ring using the cryo applicator tip. Trim any excess copper ring with wire cutters. Solder a thin enamel-coated wire (approximately two meters long, for trimming later) to the inside of the copper ring. The enamel-coated wire can be stripped by placing in a flame and then by removing the charred enamel with sandpaper. Copper tubing: McMaster, 5/32 x 0.014, Cutting blade: McMaster, 15/16 dia, 0.04 thick, 1257A75 Enamel-coated wire: McMaster, 32 gauge, 7588K89 Fig. A.9 Left: Drill-Dremel lathe setup for reducing the OD of 4mm diameter hollow copper rod. Center: Completed RF electrodes. Right: RF electrode cut lengthwise with RF wire soldered. 131

.")
141 J. Assemble the RF thermocouple: Use either (a) a thermocouple wire taken from the inside of another cryo catheter or (b) a small thermocouple (40 gauge wire). Strip the end, wrap wires together and solder, then place thin layer of quickset epoxy over the exposed wire leads. If using a thermocouple wire taken from the inside of a second cryo catheter, it will have to be extended. Strip both wires from the other end of the catheter thermocouple wire, as well as the two wires from the extension wire and solder to extend. Insulate with epoxy (1C). Place a thermocouple connector on the other end of the wire and check for functionality using thermocouple thermometer, Type K. Thermocouple wires taken from another cryo catheter can be stripped using sandpaper. 40 gauge thermocouple wires can be stripped with a razor blade. +: copper colored wire (if taken from another catheter), yellow insulation (Omega 40 gauge) -: silver colored wire (if taken from another catheter), red insulation (Omega 40 gauge) Thermocouple wire: Omega Engineering, Type-K, TT-K-40-SLE Epoxy: McMaster, general purpose 3-6 min, 7541A76 Epoxy: McMaster, Loctite 1C, 1813A221 Thermocouple connector: McMaster, Type-K flat-pin, 3869K35 Fig. A.10 Left: Thermocouple tip with insulating epoxy at the measurement junction. Right: Thermocouple wire taken from a CryoCath catheter extended with a 40 gauge thermocouple extension wire. K. Assembly of RF components with cryo catheter: Trim a length of heat shrink tubing that runs from the base of the catheter to just before the deflectable portion of the catheter tip. Heat shrink tubing should not cover the deflectable portion of the catheter body, as it will inhibit motion. Place RF thermocouple wire all the way down the heat shrink tubing, and leave both ends hanging out of the heat shrink tube. Place a several inch length of polyimide tube over the thermocouple wire, on the end with the measurement junction Slide RF electrode wire through the polyimide tube and through the heat shrink tubing towards the base of the catheter handle. Slide catheter down the heat shrink tube. Glue the RF thermocouple wire, with cyanoacrylate adhesive, to the inside of the RF electrode, near the RF wire solder point. Place a layer of epoxy over the dried epoxy layer already on the cryo applicator. Place RF electrode, with superglued-thermocouple wire over the epoxy layer and use pliers to secure tightly around the cryo applicator. Use a multimeter to ensure that current will not flow between the RF eletrode and cryo applicator tip. Remove any excess epoxy from the cryo applicator. Wait overnight to proceed further. Use a lighter to shrink the heat shrink tubing along the length of the catheter shaft. Once heat shrink tubing is set, use high viscosity cyanoacrylate to seal the end of the heat shrink tubing closest to the catheter tip. 132
: McMaster, Permabond 240, 7580A85 Fig. A.")
 RF electrode with RF wire and RF thermocouple wire attached and ready for attachment to cryo applicator, (4) Polyimide tubing containing RF")


142 Shrink wrap: McMaster, FEP, 8703K117 Polyimide tube: AmazonSupply, ID, B00212GAYU Cyanoacrylate adhesive: McMaster, Permabond 910, 7580A52 Cyanoacrylate adhesive (high viscosity): McMaster, Permabond 240, 7580A85 Fig. A.11 Top, from left: (1) RF wire and RF thermocouple wire within heat shrink tubing, (2) Catheter body with RF electrode wire, RF thermocouple wire, and heat shrink tubing in place, (3) RF electrode with RF wire and RF thermocouple wire attached and ready for attachment to cryo applicator, (4) Polyimide tubing containing RF electrode and thermocouple wires, along with completed catheter tip. Bottom: Catheter with heat shrink tubing ready for RF electrode attachment. L. Assembly of Cryo Delivery Tube Umbilical: Cut two 4 cm lengths of OD stainless steel tubing. Trim polyimide tube to desired length. Bond one stainless steel tube to each end of the polyimide tubing with epoxy. Let set over night. Slide polyimide with stainless steel ends through a length of nylon tubing to protect the polyimide from kinks. Epoxy stainless steel sections to nylon tube. Add compression nut and sleeves to each stainless steel tube and a compression coupler to one. Polyimide tube: AmazonSupply, ID, B00212GAYU Epoxy: McMaster, Loctite 1C, 1813A221 Stainless steel tube: McMaster, OD, ID, 8988K36 Compression fitting nut: McMaster, stainless steel, 5182K672 Compression fitting front sleeve: McMaster, stainless steel, 5182K65 Compression fitting back sleeve: McMaster, stainless steel, 5182K66 Compression fitting coupler: McMaster, stainless steel, 5182K716 Tube protector: McMaster, nylon tubing, 5112K42 133


143 Fig. A.12 Left: Stainless steel tube bonded to polyimide tube end. Right: Nylon tubing added and bonded to stainless steel tube for protection of polyimide tube. 134
144 APPENDIX B: RF ELECTRODE TEMPERATURE CALIBRATION RF Ablation Temperature Range During RF ablation, it is important to maintain ablation power such that tissue temperatures are raised sufficiently to induce shrinkage (>65 C). On the other hand, charring around the RF electrode from very high ablation temperatures (>100 C) leads to a rapid impedance rise and a significant reduction in RF power delivery to the tissue. Thus, RF electrode power output must be throttled to maintain tissue temperatures between 65 C-100 C to generate significant thermal shrinkage. Rationale for RFC Catheter Temperature Calibration The RFC catheter contains an RF electrode that sits over cryo-anchors, and the RF electrode is separated from the cryo-anchors by only a thin layer of insulation. A thermocouple measures the RF electrode temperature and sits between the RF electrode and thin insulating layer. Thus, the measured RF electrode temperature is many degrees cooler than the RF electrode-tissue interface temperature and many degrees cooler than the surrounding tissue temperature (assuming RF ablation is currently raising the tissue temperature). This is not a significant problem when using the RFC catheter ex vivo in a flow simulator filled with saline, as there are no proteins in saline to coagulate that will char and raise the impedance (significant char of the tissue itself can occur ex vivo, but given the large heat convection due to fluid flow, the threshold of tissue charring is rarely reached). However, in vivo, blood can coagulate, char, and disrupt RF energy delivery. Therefore, the RFC catheter electrode temperature must be calibrated such that tissue temperatures of between 65 C-100 C can be generated without charring. RFC Catheter Temperature Calibration Experiment 1: Myocardial Measurements Calibration of the RF electrode has been performed with two different experiments. In the first experiment, small sections (very roughly: 2 cm x 2cm x 1 cm thick) of myocardium were excised from a heart and sutured to a plastic bracket (metal materials are not used as they will affect current distribution) fixed to the atrial-ventricular wall of the left heart flow simulator. A mechanical valve was placed in the atrial-ventricular wall, and the myocardial tissue was placed directly in the flow path, on the atrial side, to simulate MV flow rates. Myocardial tissue was used as the stationary nature of the tissue permits tissue temperature measurements, which is not easily performed on moving MV leaflets. A thermocouple was carefully placed approximately 1-2 mm below the myocardial surface. The left heart flow simulator was run at 5 L/min and transmitral pressures of 120 mmhg. The RFC catheter was placed on the surface of the myocardium, directly above the myocardial thermocouple placement (Fig. B.1). An indifferent electrode (wire attached to aluminum foil) was placed between the atrium and fluid reservoir of the left heart flow simulator, and its position relative to the catheter was varied to vary impedance. Three different treatments were then performed to hone in on the ideal RF electrode temperature range: Test 1: Cryo-anchoring on, RF power of 50W, impedance high ( Ω) Test 2: Cryo-anchoring on, RF power of 50W, impedance low (50-75Ω) Test 3: Cryo-anchoring on, RF power of 80W, impedance low (50-75Ω) 135
145 Test 1 was used to demonstrate that no or minimal temperature increases may occur at high ablation powers. Test 2 and Test 3 were used to generate significant tissue temperature rises to determine the matching RF electrode temperature. Results from testing Catheter Prototype #07 on are shown below (Fig. B2). Atrial-Ventricular Wall MV Orifice RFC Catheter Tissue Thermocouple Myocardial Tissue Clamps Fig. B.1. Myocardial RF Electrode Temperature Calibration Test Experimental Set-Up Test 1 Power: 50W Impedance: HIGH Test 2 Power: 50W Impedance: LOW Test 3 Power: 80W Impedance: LOW Temperature ( C) RF Electrode Temperature Test 1 Test 2 Test Time (s) Impedance (Ohms) RF Impedance Test 1 Test 2 Test Time (s) CONCLUSION: small increases in RF electrode temperature correspond to large increases in tissue temperature Test 1 Test 2 Test 3 Tissue Temperature RF Power Test 1 Test 2 Test 3 Temperature ( C) Power (Watts) Time (s) Time (s) Small differences in RF power output may also indicate whether ablation is occurring Fig. B.2: Results from Myocardial Temperature Calibration Test RF electrode calibration on Catheter Prototype #07. Recorded on During Test 3, popping of the tissue occurred, which indicated rapid boiling/expansion of the fluid contained within the myocardium. 136
146 Myocardial Temperature Calibration Test Conclusions We conclude from the above results that RF electrode temperatures, on Catheter Prototype #07 specifically, of between 5-10 C are sufficient to generate tissue temperatures that will create tissue shrinkage. However, we can also conclude that there is a fine line between significant (tissue shrinkage causing) and insignificant (no tissue shrinkage causing) temperatures measured on the RF electrode, as temperatures below 0 C do not cause thermal shrinkage lesions. Further, RF electrode temperature must be carefully throttled to avoid excessive (>10 C) tissue temperature in this catheter prototype, as conditions were favorable for char to occur past this point. RFC Catheter Temperature Calibration Experiment 2: Excised MV Test The myocardial temperature calibration test above confirmed that low measured RF electrode temperatures do not necessary imply low tissue temperatures, and the test above can be used to calibrate the desired RF electrode temperature range. However, the test above takes significant time to execute. A simpler test can be performed that takes much less time, if a sewn excised MV is already available. An excised porcine MV can be placed in the left heart flow simulator with flow and pressure conditions as described above. An indifferent electrode (wire attached to aluminum foil) can be placed in the left heart flow simulator on the atrial chamber floor, which results in impedances of around 60Ω during ablation of the MV leaflets. RF electrode temperature is then measured in two different testing conditions: Test A: Cryo-anchoring on, RF ablation at 50W, catheter positioned just in front of MV leaflets (in atrium) with no leaflet attachment Test B: Cryo-anchoring on, RF ablation at 50W, catheter attached to MV leaflets 60 CATH07: RF Temperature Temperature ( C) Leaflet Attachment No Attachment Time (s) Fig. B.3. RF Electrode Calibration Test Using an Excised Porcine MV RF electrode temperatures measured during cryo-anchoring and ablation with no leaflet attachment (black, dotted) and with direct leaflet attachment of cryo-anchor and RF electrode (red, solid). Catheter Prototype #07. Recorded on
147 Excised MV Calibration Test Conclusions Assuming that MV tissue temperatures that correspond with thermal leaflet shrinkage are being generated in Test B, this test can be used to determine the RF electrode temperature target for in vivo ablations. Test A is a control test, demonstrating temperature that can be expected when RF ablation is on, but no thermal shrinkage is being produced. The difference in measured RF electrode temperature between these two tests is small (Fig. B.3): with no leaflet attachment, the averaged measured RF electrode temperature was 4.5 C and with leaflet attachment, the averaged measured RF electrode temperature was 8 C. The 8 C measured RF electrode temperature corresponds with the calibrated range in the myocardial temperature calibration test. The excised MV calibration test provides the target RF electrode temperature during RF ablation in vivo in this case the target RF electrode temperature is 8 C however, the excised MV calibration test will likely not provide the upper limit of RF electrode temperatures that produce charring in vivo. Additional Conclusion The above calibration test(s) should be performed frequently. It was found after several months during an in vivo procedure that the calibrated range for the Catheter Prototype #07 RF electrode had shifted upwards by about 10 C, to 10 C-20 C from 0 C-10 C. RF Electrode Temperature Calibrations as of Catheter Prototype #06: -5 C to 5 C Catheter Prototype #07: 10 C to 20 C 138

148 APPENDIX C: RFC CATHETER SYSTEM NITROUS OXIDE DELIVERY HARDWARE The nitrous oxide delivery system (Fig. C.1) provides the cooling power for the RFC catheter. Liquid nitrous oxide is pulled out of a nitrous oxide tank with dip tube. A pressure regulator is available to regulate the nitrous oxide pressure, if necessary, but full tank pressure ( psi, depending on room temperature) is used with the current iteration of the RFC catheter prototype. A solenoid valve compatible with cryogenic liquids is used to turn cryogen flow on and off. The solenoid valve is switched on when supplied with 120VAC and switched off when current is removed. The combined weight of the nitrous oxide tank and nitrous oxide is 47lbs when full. After the tank plus nitrous oxide weight measures 35lbs or below, cryo-anchor cooling power is inconsistent and a new tank is needed. A: Nitrous Oxide Tank C: Pressure Regulator G: Cryo Solenoid H: Yor-Lok Adapter B: Regulator Fitting D: Pressure Gauge Fig. C.1: Nitrous Oxide Delivery System Hardware Nitrous oxide delivery system hardware. Letters correspond to parts list below. F: Adapter E: Hex Nipple Table C.1. Nitrous Oxide Delivery System Parts List ITEM ITEM DESCRIPTION SUPPLIER PART NUMBER A Nitrous Oxide, 20 lbs., with Dip Tube A-L Compressed B Regulator Fitting Inlet Nipple, 1/4" NPT Male, CGA #326, 2.5" McMaster 79215A673 Length B Regulator Fitting Female Thread Inlet Nut, CGA #326, 0.952" McMaster 79215A672 Length C Pressure Regulator, Tescom BB-1 Series Tescom BB-13AH2KVA4 D Pressure Gauge, psi Tescom N E F G H Hex Nipple,Precision Extreme-Pressure 316 Stainless Steel McMaster Pipe Fitting, 1/4 x 1/4 Pipe Size, 1-7/16" Length Adapter, Precision Extreme-Pressure 316 Stainless Steel Pipe McMaster Fitting, 1/4 x 1/8 Pipe Size, Female x Male Cryo Solenoid, Clean & Bagged Cryogenic Brass Solenoid McMaster Valve 1/8 NPT Female, 120 VAC Yor-Lok Adapter, Type 316 Stainless Steel, Straight Adapter for McMaster 1/16" Tube OD x 1/8 NPT Male Precision Extreme-Pressure 316 Stainless Steel Pipe Fitting, McMaster 1/4 Pipe Size, Hex Head Solid Plug 48805K K K K K28 139
149 APPENDIX D: RFC CATHETER SYSTEM CONTROL SYSTEM CODE The following code was developed to control the RFC catheter system using an Arduino Uno. This code reads in the temperatures of the catheter cryo-anchor and RF electrode from a serial connection to a commericially available thermocouple measurement device (EA15, Extech Instruments, Nashua, NH), and then the code throttles a cryo solenoid based upon the measured cryo-anchor temperature. If the cryo-anchor temperature is above -20 C, the cryo solenoid is set to full on. If the cryo-anchor temperature is below -20 C, the cryo-anchor is switched on/off with a duty cycle controlled by the user (default is 0.2) and a cycle period of 2 seconds. The cryo-anchor temperature, RF electrode temperature, cryo solenoid duty cycle, and cryo solenoid on/off state are then passed to LabView for data acquisition. // Steve Boronyak // July 02, 2014 /* This program also the user to manually control the duty cycle of the cryo solenoid for controlling the cryo cath temperature */ // DOES NOT measure RESISTANCE or RF POWER OUTPUT // DOES NOT include temperature compensation for filter induced offsets (this is done in LabView) /* USB Host to PL2303-based USB Thermocouple Thermometer */ /* Extech EasyView 15 */ /* USB Host Libraries and associated code from Oleg */ /* */ // DEFINE PINS //////////////////////////////////////////////////////////////// #define cryoinput 2 // Cryo input switch #define cryoind 3 // Cryo indicator LED line #define RFinput 4 // RF input switch #define cryooutput 5 // Cryo output line, to 5V SSR #define RFoutput 6 // RF output line, to TIP120 and solenoid valve #define RFind A0 // RF indicator LED line #define buttup A1 #define buttdown A2 // ADD LIBRARIES ////////////////////////////////////////////////////////////// /* USB support */ #include <avrpins.h> #include <max3421e.h> #include <usbhost.h> #include <usb_ch9.h> #include <Usb.h> #include <usbhub.h> #include <avr/pgmspace.h> #include <address.h> 140
150 /* CDC support */ #include <cdcacm.h> #include <cdcprolific.h> /* Debug support */ #include <printhex.h> #include <message.h> #include <hexdump.h> #include <parsetools.h> // INITILIZE VARIABLES ///////////////////////////////////////////////////////////////////////// int count = 0; // Count of total bytes received to the buffer int buffer[9]; // Storage buffer for thermocouple data int tempbuffer[9]; int sign = LOW; // LOW means + sign, HIGH means - sign int connection = LOW; // HIGH means open line; int value_cryo = 0; // Digital input from cryoinput int PWMod = 0; // Indicator variable: 1 if PWM pedal is active int CRYOout = 0; // Indicator variable: 1 if cryo solenoid out is on int RFstate = LOW; // Current state of the RF input switch float cycledelay = 400; // Used for switching between on and off timing float cycleperiod = 2000; // Cycle period float DUTY = 0.2; // Duty cycle of PWM signal to cryo solenoid float deltaduty = 0; // Duty cycle of PWM signal to cryo solenoid float Tcryo = 25; // Cryo temperature float TcryoLAST = 25; // Previously measured cryo temperature float timestamp; // Time of temperature measurement float deltat = 0; // Absolute value of change in temperature between measurements byte STATE = B ; // Indicates the state of the cryo solenoid/rf output boolean REC = false; // When TRUE, thermocouple data ready to analyze unsigned long timezero; // Time of first received byte of thermocouple data unsigned long timef; // Time of last received byte of thermocouple data unsigned long OFFtime; // Millisecond time, last time switch was off unsigned long readtime = 0; unsigned long PWtimer = 0; // Timer value: the last time the cryo solenoid was switched on or off unsigned long RFoff = 0; // millisecond timer, last time RF switch was off int valueup = LOW; int valuedown = LOW; unsigned long buttlast; int duty1 = 4; // INITLIZE USB HOST DEVICE ////////////////////////////////////////////////// class PLAsyncOper : public CDCAsyncOper { public: virtual uint8_t OnInit(ACM *pacm); }; // Continue to initilize USB Host device, I guess uint8_t PLAsyncOper::OnInit(ACM *pacm) { uint8_t rcode; // Set DTR = 1 - I don't know what this means rcode = pacm->setcontrollinestate(1); 141
151 if (rcode) // Still don't know { ErrorMessage<uint8_t>(PSTR("SetControlLineState"), rcode); return rcode; } LINE_CODING lc; lc.dwdterate = 9600; lc.bcharformat = 0; lc.bparitytype = 0; lc.bdatabits = 8; // default serial speed of unit // i have no idea what this means // default parity of the unit // number of data bits rcode = pacm->setlinecoding(&lc); // Don't know if (rcode) // Still don't know ErrorMessage<uint8_t>(PSTR("SetLineCoding"), rcode); } return rcode; // I have no idea what this does, I guess start communicating??? USB Usb; PLAsyncOper AsyncOper; PL2303 Pl(&Usb, &AsyncOper); // SET UP CODE //////////////////////////////////////////////////////////// void setup() { // Set pin 7 HIGH for serial communication to work: pinmode(7, OUTPUT); // Pin 7 must be set HIGH, active low reset digitalwrite(7, HIGH); // So set Pin 7 dammit // Cryo and RF I/O: pinmode(cryoinput, INPUT); pinmode(cryoind, OUTPUT); pinmode(cryooutput, OUTPUT); pinmode(rfinput, INPUT); pinmode(rfind, OUTPUT); pinmode(rfoutput, OUTPUT); pinmode(buttup, INPUT); pinmode(buttdown, INPUT); // Set pin 2, as cryo input // Cryo LED output indicator // Cryo output line to SSR // RF input switch // RF LED output indicator // RF output line to TIP120 and solenoid // Button high increases duty cycle // Button high decreases duty cycle digitalwrite(cryoind, LOW); digitalwrite(cryooutput, LOW); digitalwrite(rfind, LOW); digitalwrite(rfoutput, LOW); tempbuffer[0] = 0; tempbuffer[1] = 0; tempbuffer[2] = 0; tempbuffer[3] = 0; tempbuffer[4] = 0; tempbuffer[5] = 0; tempbuffer[6] = 0; tempbuffer[7] = 0; tempbuffer[8] = 0; Serial.begin(9600); must match LabView program // Set baud rate of Arduino serial monitor, 142
152 if (Usb.Init() == -1) // Error message, if USB Host fails to initilize Serial.println("OSCOKIRQ failed to assert"); } delay(200); void loop() { ////////////////////////////////////////////////////////////////////////////////// ///////// // READ THERMOCOUPLE TEMPERATURE ////////////////////////////////////////////////////////// ////////////////////////////////////////////////////////////////////////////////// ///////// // INITLIZE SOME MORE VARIABLES //////////////////////////// REC = false; uint8_t rcode; // what does the rcode do??? uint8_t buf[9]; // serial buffer equals Max.packet size of thermocouple output uint16_t rcvd = 9; // same as line above Usb.Task(); if( Pl.isReady()) { /* reading the thermometer */ rcode = Pl.RcvData(&rcvd, buf); if (rcode && rcode!= hrnak) ErrorMessage<uint8_t>(PSTR("Ret"), rcode); if( rcvd ) { //more than zero bytes received // Time stamps to check if it takes an unexpected amount of time to get all 9 bytes if (count == 0){ timezero = millis(); } if (count == 8){ timef = millis(); } for (uint16_t i=0; i < rcvd; i++) { the buffer buffer[count] = buf[i]; // For every byte received, write to count++; // Increment byte count if (count >= 9){ count = 0; // Return byte count to zero; if (timef - timezero > 100){ // Check for timeout error Serial.println("Timeout ERROR"); } if (timef - timezero <= 100){ // If no timeout error, everything is good REC = true; }//if (timef - timezero <= 100 }//if (count >=
153 }//for( uint16_t i=0; i < rcvd; i++... }//if( rcvd.. tempbuffer[1] = buffer[1]; tempbuffer[2] = buffer[2]; tempbuffer[3] = buffer[3]; tempbuffer[4] = buffer[4]; tempbuffer[5] = buffer[5]; tempbuffer[6] = buffer[6]; }//if( Pl.isReady()).. ///////////////////////////////////////////////////////////////////////////////// ///////////////////////////////////////////////////////////////////////////////// // DETERMINE/THROTTLE CRYO SOLENOID OUTPUT ////////////////////////////////////// ///////////////////////////////////////////////////////////////////////////////// value_cryo = digitalread(cryoinput); valueup = digitalread(buttup); valuedown = digitalread(buttdown); if (valueup == HIGH && millis() - buttlast > 200){ DUTY = DUTY ; buttlast = millis(); } if (valuedown == HIGH && millis() - buttlast > 200){ DUTY = DUTY ; buttlast = millis(); } if (DUTY > 0.9){ DUTY = 1; } if (DUTY < 0.1){ DUTY = 0; } if (value_cryo == HIGH && Tcryo < -15){ if (DUTY == 1){ if (millis() - OFFtime > 200){ CRYOout = HIGH; digitalwrite(cryoind, HIGH); digitalwrite(cryooutput, HIGH); } } if (DUTY == 0){ CRYOout = LOW; digitalwrite(cryoind, LOW); digitalwrite(cryooutput, LOW); } if (DUTY < 1 && DUTY > 0){ if (CRYOout == LOW){ cycledelay = (1 - DUTY)*cyclePERIOD; }//if (CRYOout == LOW... if (CRYOout == HIGH){ cycledelay = DUTY*cyclePERIOD; }//if (CR if (millis() - PWtimer > cycledelay){ CRYOout =!CRYOout; 144
154 digitalwrite(cryoind, CRYOout); digitalwrite(cryooutput, CRYOout); PWtimer = millis(); }//if (millis() - PWtimer... } } else if (value_cryo == HIGH && Tcryo >= -15){ CRYOout = HIGH; digitalwrite(cryoind, CRYOout); digitalwrite(cryooutput, CRYOout); } else { OFFtime = millis(); digitalwrite(cryoind, LOW); digitalwrite(cryooutput, LOW); CRYOout = LOW; } if (DUTY == 1){ DUTY = 0.9; } if (DUTY == 0){ DUTY = 0.1; } /////////////////////////////////////////////////////////////////////////// /////////////////////////////////////////////////////////////////////////// // RECORD DATA: TEMPERATURE & SOLENOID OUTPUT STATE /////////////////////// /////////////////////////////////////////////////////////////////////////// if (REC == true){ TcryoLAST = Tcryo; // Thermocouple CH1 - CRYO // // Byte 2: CH1 Status Byte // Bytes 3 and 4: CH1 Temperature Bytes connection = bitread(buffer[1],6); // Byte 2, bit 6: OL determination if (connection == HIGH){ Serial.write(255); }//if (connection == HIGH... if (connection == LOW){ sign = bitread(buffer[1],7); // Byte 2, bit 7: negative sign determination if (sign == LOW){ // If byte 2, bit 7 LOW: + sign Tcryo = (((float)buffer[2]*256) + (float)buffer[3])/10; }//if (sign == LOW... if (sign == HIGH){ // If byte 2, bit 7 HIGH: - sign Tcryo = -(((float)buffer[2]*256) + (float)buffer[3])/10; }//if (sign == HIGH... deltat = Tcryo - TcryoLAST; timestamp = (float)timef/1000; bitwrite(state,0,value_cryo); bitwrite(state,1,rfstate); duty1 = int(duty*100); 145
155 //This order must stay the same for the LabView program to process correctly Serial.write(128); Serial.write(buffer[1]); Serial.write(buffer[2]); Serial.write(buffer[3]); Serial.write(buffer[4]); Serial.write(buffer[5]); Serial.write(buffer[6]); Serial.write(STATE); Serial.write(duty1); Serial.write(255); }//if (connection == LOW... // END CH1 - Cryo // }//if (REC == true... if (REC == false){ if (millis() - readtime > 200){ Serial.write(128); Serial.write(tempbuffer[1]); Serial.write(tempbuffer[2]); Serial.write(tempbuffer[3]); Serial.write(tempbuffer[4]); Serial.write(tempbuffer[5]); Serial.write(tempbuffer[6]); Serial.write(STATE); Serial.write(duty1); Serial.write(255); } } readtime = millis(); /////////////////////////////////////////////////////////////////////////////// } 146

156 APPENDIX E: RFC CATHETER SYSTEM DATA ACQUISITION CODE All data acquisition from the RFC catheter system is done in LabView. Data is read in from the RF generator directly to a National Instruments DAQ and the catheter control system via the Arduino program in Appendix D. The front panel shown below is used to display catheter temperature, impedance, and power information during the procedure. The corresponding wire diagram is shown on the next page. 147
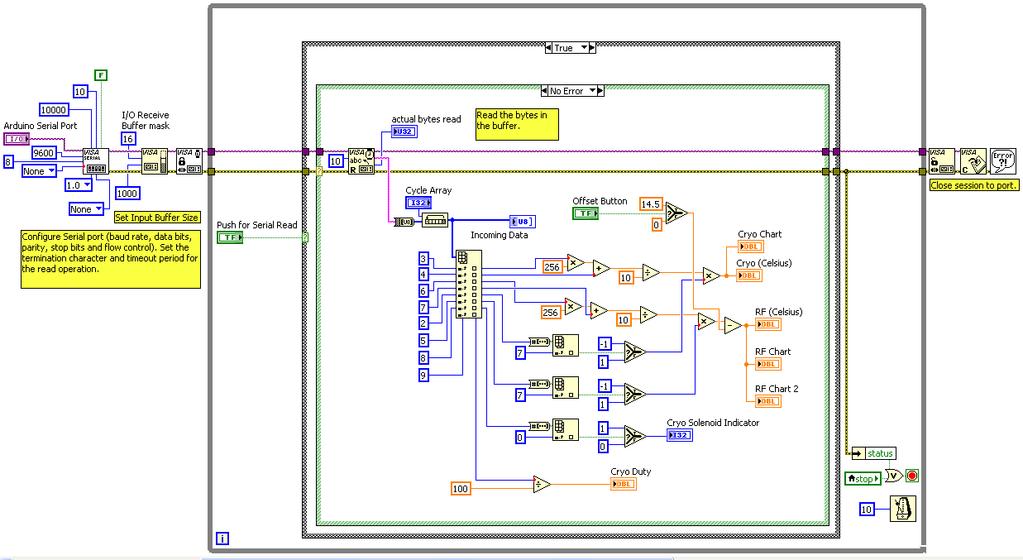
157 148
158 APPENDIX F: RFC CATHETER SYSTEM CONTROL SYSTEM ELECTRICAL SCHEMATIC The essential components for constructing the RFC catheter electrical control system are shown on the next page. Also of note, not indicated on the drawings, are the USB connections: 1) from the USB host shield to the EA15 thermocouple measurement device, and 2) from the Arduino Uno to the computer running the LabView data acquisition software. Non-trivial components are listed in the table below. Table F.1. Non-Trivial Components of the RFC Catheter Control System Description Supplier Cat No USB Host Shield Sparkfun DEV Foot Switch with Front Pivot Steel, Maintained, SPST-NO, 6' Cord McMaster 7717K22 Long-Life Relay 5 DC Control Voltage, V AC, G3NE- 205T-US McMaster 8192K211 ProtoBoard - Wombat (PTH) Sparkfun PRT Arduino Uno Sparkfun DEV-1102 IC REG LDO 9V 2A TO-220 DigiKey ND BOX ABS 9.84X7.09X1.97" GREY DigiKey HM1099-ND 149
159 150
160 APPENDIX G: RFC CATHETER SYSTEM ELECTRICAL SCHEMATIC The RF generator (EPT-1000, Boston Scientific) measurement lines were connected to a LabView DAQ to record RF power and RF impedance during the procedure. A ground line must also be connected from the rear of the RF generator to the LabView DAQ. 151
.")
161 APPENDIX H: RFC CATHETER SYSTEM THERMOCOUPLE FILTERS Significant noise is present on the RFC catheter thermocouple measurements when RF power is actively being delivered. In order to reduce noise and obtain accurate temperature measurements, a passive low-pass filter was employed on each thermocouple (Fig. H.1 and Fig. H.2). The low-pass filters were placed just prior to the thermocouple measurement device. Ground, indicated below, is the thermocouple measurement device ground accessed in the battery compartment. R R C C C D + _ R 4.7 kω C D 1 µf C C 0.1 µf C C f DIFF f CD 16.1 Hz 339 Hz Fig. H.1. RFC Catheter Thermocouple Filter Design Circuit shown is adapted from the datasheet for the AD8494 instrumentation amplifier. Values selected for R, C C, and C D, along with the cut-off frequencies, are shown to the right. Values for R, C C, and C D were selected to obtain a low cut-off frequency for differential voltage, f diff, and a relatively high cut-off frequency for common mode voltage, f CM : f diff = 1 2πR(2C D + C C ) f CM = 1 2πRC C Fig. H.2. RFC Catheter Thermocouple Filter 152
162 APPENDIX I: BIAXIAL MECHANICAL TESTING ANALYSIS CODE Basic Biaxial Mechanical Testing (2x2 Marker Grid) Analysis The following MATLAB code was used to perform all mechanical and geometrical data analysis in Aim 1 and in the durability study in Aim 2. The program reads in data files output from the biaxial mechanical tester, which includes marker position data used to determine the deformation gradient tensor with a bilinear interpolation. The input data files for this program must be formatted as follows, where X1q and X2q refer to marker positions in the axis 1 and axis 2 directions and q refers to the marker number: Column # Value 1 Time (s) 2 Load 1 3 Load 2 4 F11 5 F12 6 F21 7 F22 8 E11 9 E12 10 E22 11 X11 12 X12 13 X13 14 X14 15 X21 16 X22 17 X23 18 X24 % Biax Data Processing % Steve Boronyak % clear clc %% User Input %%%%%%%%%%%%%%%%%%%%%%%%%%%%%%%%%%%%%%%%%%%%%%%%%%%%%%%%%%%%% % Sample Number sample = 'Sample 149'; % Sample Test Date: % Sample dimensions radial = 11.1; % mm circ = 11.3; % mm % Reference Marker Files untreated_ref = load('treated-4wk_ref.txt'); 153
163 cryo_ref = load('treated-4wk_ref.txt'); treated_ref = load('treated-4wk_ref.txt'); % Load Test Data untreated = importdata('treated-4wk(10).txt','\t',1); cryo = importdata('treated-4wk(10).txt','\t',1); treated = importdata('treated-4wk(10).txt','\t',1); %%%%%%%%%%%%%%%%%%%%%%%%%%%%%%%%%%%%%%%%%%%%%%%%%%%%%%%%%%%%%%%%%%%%%%%%%%% %% Extract Data %%%%%%%%%%%%%%%%%%%%%%%%%%%%%%%%%%%%%%%%%%%%%%%%%%%%%%%%%%% % Convert to membrane tension - units of N/m: C_load_untreated = untreated.data(:,2).*(9.81/radial); R_load_untreated = untreated.data(:,3).*(9.81/circ); C_load_cryo = cryo.data(:,2).*(9.81/radial); R_load_cryo = cryo.data(:,3).*(9.81/circ); C_load_treated = treated.data(:,2).*(9.81/radial); R_load_treated = treated.data(:,3).*(9.81/circ); % Shift first data point to equal 1: C_stretch_untreated = untreated.data(:,4) - (untreated.data(1,4)-1); R_stretch_untreated = untreated.data(:,7) - (untreated.data(1,7)-1); C_stretch_cryo = cryo.data(:,4) - (cryo.data(1,4)-1); R_stretch_cryo = cryo.data(:,7) - (cryo.data(1,7)-1); C_stretch_treated = treated.data(:,4) - (treated.data(1,4)-1); R_stretch_treated = treated.data(:,7) - (treated.data(1,7)-1); % Find the max load: [n1,m1] = max(c_load_untreated); [n2,m2] = max(r_load_untreated); [n3,m3] = max(c_load_cryo); [n4,m4] = max(r_load_cryo); [n5,m5] = max(c_load_treated); [n6,m6] = max(r_load_treated); %% Determine Strain Differences %%%%%%%%%%%%%%%%%%%%%%%%%%%%%%%%%%%%%%%%%%% % After data has been trimmed to include only the loading curve, find the % data point closet to 90 N/m of membrane tension (because sometimes the % biax overshoots this target): [~,r1] = min( abs(90 - C_load_untreated(1:m1) ) ); max_load(1) = C_load_untreated(r1); max_stretch(1) = C_stretch_untreated(r1); [~,r2] = min( abs(90 - R_load_untreated(1:m2) ) ); max_load(2) = R_load_untreated(r2); max_stretch(2) = R_stretch_untreated(r2); [~,r3] = min( abs(90 - C_load_cryo(1:m3) ) ); max_load(3) = C_load_cryo(r3); max_stretch(3) = C_stretch_cryo(r3); 154
164 [~,r4] = min( abs(90 - R_load_cryo(1:m4) ) ); max_load(4) = R_load_cryo(r4); max_stretch(4) = R_stretch_cryo(r4); [~,r5] = min( abs(90 - C_load_treated(1:m5) ) ); max_load(5) = C_load_treated(r5); max_stretch(5) = C_stretch_treated(r5); [~,r6] = min( abs(90 - R_load_treated(1:m6) ) ); max_load(6) = R_load_treated(r6); max_stretch(6) = R_stretch_treated(r6); max_strain = max_stretch - 1; % Determine areal strain: areal_strain_untreated = max_stretch(1)*max_stretch(2); areal_strain_cryo = max_stretch(3)*max_stretch(4); areal_strain_treated = max_stretch(5)*max_stretch(6); % All change in strain data compiled into one matrix: change_in_strain = [ (max_strain(3)-max_strain(1))/max_strain(1)* (max_strain(5)-max_strain(1))/max_strain(1)* (max_strain(5)-max_strain(3))/max_strain(3)*100;... (max_strain(4)-max_strain(2))/max_strain(2)* (max_strain(6)-max_strain(2))/max_strain(2)* (max_strain(6)-max_strain(4))/max_strain(4)*100;... (areal_strain_cryo - areal_strain_untreated)/areal_strain_untreated* (areal_strain_treated - areal_strain_untreated)/areal_strain_untreated* (areal_strain_treated - areal_strain_cryo)/areal_strain_cryo*100]; % Determine % change in stretch, RFA to Untreated: change_circ_stretch_rfa = ((max_stretch(5) - max_stretch(1))/max_stretch(1))*100; change_rad_stretch_rfa = ((max_stretch(6) - max_stretch(2))/max_stretch(2))*100; % Determine % change in stretch, Cryo Only to Untreated: change_circ_stretch_cryo = ((max_stretch(3) - max_stretch(1))/max_stretch(1))*100; change_rad_stretch_cryo = ((max_stretch(4) - max_stretch(2))/max_stretch(2))*100; % Determine % change in stretch, RFA to Cryo Only: change_circ_stretch_rfacryo = ((max_stretch(5) - max_stretch(3))/max_stretch(3))*100; change_rad_stretch_rfacryo = ((max_stretch(6) - max_stretch(4))/max_stretch(4))*100; disp(' ') disp(' COMPLIANCE CHANGES ') disp(' ') fprintf('\n') disp('percent CHANGE IN STRETCH:') fprintf('\n') disp(' Cryo to Untreated RFA to Untreated RFA to Cryo') 155
165 fprintf('circ \t%+7.2f \t\t\t\t %+6.2f \t\t\t %+7.2f',change_circ_stretch_cryo,change_circ_stretch_RFA,change_circ_stretch_RFAcr yo) fprintf('\n') fprintf('radial \t%+7.2f \t\t\t\t %+6.2f \t\t\t %+7.2f ',change_rad_stretch_cryo,change_rad_stretch_rfa,change_rad_stretch_rfacryo) fprintf('\n') fprintf('areal %+7.2f \t\t\t %+7.2f \t\t\t %+7.2f ',change_in_strain(3,1),change_in_strain(3,2),change_in_strain(3,3)) fprintf('\n') fprintf('\n') fprintf('\n') disp('percent CHANGE IN STRAIN:') fprintf('\n') disp(' Cryo to Untreated RFA to Untreated RFA to Cryo') fprintf('circ \t%+7.2f \t\t\t\t %+6.2f \t\t\t %+7.2f',change_in_strain(1,1),change_in_strain(1,2),change_in_strain(1,3)) fprintf('\n') fprintf('radial \t%+7.2f \t\t\t\t %+6.2f \t\t\t %+7.2f ',change_in_strain(2,1),change_in_strain(2,2),change_in_strain(2,3)) fprintf('\n') fprintf('\n') fprintf('\n') COMPLIANCE = [change_circ_stretch_cryo change_rad_stretch_cryo change_in_strain(3,1) 0 change_in_strain(1,1) change_in_strain(2,1);... change_circ_stretch_rfa change_rad_stretch_rfa change_in_strain(3,2) 0 change_in_strain(1,2) change_in_strain(2,2);... change_circ_stretch_rfacryo change_rad_stretch_rfacryo change_in_strain(3,3) 0 change_in_strain(1,3) change_in_strain(2,3)]; %% Plot Membrance Tension v Stretch %%%%%%%%%%%%%%%%%%%%%%%%%%%%%%%%%%%%%%% % Determine max stretch, of all samples: total_stretch = [C_stretch_untreated(1:r1); R_stretch_untreated(1:r2); C_stretch_cryo(1:r3);... R_stretch_cryo(1:r4); C_stretch_treated(1:r5); R_stretch_treated(1:r6)]; maximum_s = max(total_stretch); % Set the maximum x-axis stretch on plot to 1.5 if, stretch is less than % 1.5: if (maximum_s > 1.5) % DO NOTHING else maximum_s = 1.5; end fig1 = figure(1); % Plot UNTREATED, CIRC and RADIAL: plot(c_stretch_untreated(1:r1),c_load_untreated(1:r1),'ko','markersize',6) hold on plot(r_stretch_untreated(1:r2),r_load_untreated(1:r2),'kv','markersize',6) % Plot CRYO ONLY, CIRC and RADIAL: plot(c_stretch_cryo(1:r3),c_load_cryo(1:r3),'bo','markersize',6) plot(r_stretch_cryo(1:r4),r_load_cryo(1:r4),'bv','markersize',6) % Plot TREATED, CIRC and RADIAL: plot(c_stretch_treated(1:r5),c_load_treated(1:r5),'ro','markersize',6) plot(r_stretch_treated(1:r6),r_load_treated(1:r6),'rv','markersize',6) grid on 156
166 axis([1 maximum_s 0 95]) xlabel('stretch Ratio') ylabel('membrane Tension (N/m)') ptitle1 = [sample,' - Membrane Tension vs. Stretch']; title(ptitle1,'fontweight','bold') legend('circ: Untreated','Radial: Untreated','Circ: Cryo','Radial: Cryo','Circ: Cryo + RFA','Radial: Cryo + RFA') hold off filename = [sample,' - Membrane Tension vs Stretch.jpg']; saveas(fig1,filename) %% Stretch Data Referenced to Original Untreated Marker Reference %%%%%%%%% % REFERENCE STATE, UNTREATED marker data: X1 = untreated_ref(1,:); X2 = untreated_ref(2,:); % dx/ds: dx1_ds1 = (1/4)*( X1(1) - X1(2) - X1(3) + X1(4) ); dx1_ds2 = (1/4)*( X1(1) + X1(2) - X1(3) - X1(4) ); dx2_ds1 = (1/4)*( X2(1) - X2(2) - X2(3) + X2(4) ); dx2_ds2 = (1/4)*( X2(1) + X2(2) - X2(3) - X2(4) ); % Determine which frame to use, closest to 90 N/m if r1 > r2 L1 = r2; elseif r2 > r1 L1 = r1; else L1 = r2; end if r3 > r4 L2 = r4; elseif r4 > r3 L2 = r3; else L2 = r3; end if r5 > r6 L3 = r6; elseif r6 > r5 L3 = r5; else L3 = r5; end untreated_f11 = untreated.data(1:l1,4); untreated_f22 = untreated.data(1:l1,7); untreated_k1 = untreated.data(1:l1,5); untreated_k2 = untreated.data(1:l1,6); cryo_f11 = zeros(l2,1); cryo_f22 = zeros(l2,1); cryo_k1 = zeros(l2,1); cryo_k2 = zeros(l2,1); treated_f11 = zeros(l3,1); treated_f22 = zeros(l3,1); treated_k1 = zeros(l3,1); treated_k2 = zeros(l3,1); 157
167 % CRYO ONLY F11 and F22, wrt to UNTREATED REFERENCE LOCATIONS: for i = 1:L2 end % DEFORMED MARKER POSITIONS, frame 'i': xx1_treated = cryo.data(i,11:14); xx2_treated = cryo.data(i,15:18); % Displacement Field: u1 = xx1_treated - X1; u2 = xx2_treated - X2; % du/ds: du1_ds1 = (1/4)*( u1(1) - u1(2) - u1(3) + u1(4) ); du1_ds2 = (1/4)*( u1(1) + u1(2) - u1(3) - u1(4) ); du2_ds1 = (1/4)*( u2(1) - u2(2) - u2(3) + u2(4) ); du2_ds2 = (1/4)*( u2(1) + u2(2) - u2(3) - u2(4) ); % Matrix for H: comph = zeros(2,2); comph(1,1) = du1_ds1 * dx2_ds2 - du1_ds2 * dx2_ds1; comph(1,2) = -du1_ds1 * dx1_ds2 + du1_ds2 * dx1_ds1; comph(2,1) = du2_ds1 * dx2_ds2 - du2_ds2 * dx2_ds1; comph(2,2) = -du2_ds1 * dx1_ds2 + du2_ds2 * dx1_ds1; % Jacobian: J = dx1_ds1 * dx2_ds2 - dx1_ds2 * dx2_ds1; % Deformation Gradient Tensor: F = eye(2,2) + (1/J)*compH; cryo_f11(i) = F(1,1); cryo_f22(i) = F(2,2); cryo_k1(i) = F(1,2); cryo_k2(i) = F(2,1); % TREATED F11 and F22, wrt to UNTREATED REFERENCE LOCATIONS: for i = 1:L3 % DEFORMED MARKER POSITIONS, frame 'i': xx1_treated = treated.data(i,11:14); xx2_treated = treated.data(i,15:18); % Displacement Field: u1 = xx1_treated - X1; u2 = xx2_treated - X2; % du/ds: du1_ds1 = (1/4)*( u1(1) - u1(2) - u1(3) + u1(4) ); du1_ds2 = (1/4)*( u1(1) + u1(2) - u1(3) - u1(4) ); du2_ds1 = (1/4)*( u2(1) - u2(2) - u2(3) + u2(4) ); du2_ds2 = (1/4)*( u2(1) + u2(2) - u2(3) - u2(4) ); % Matrix for H: comph = zeros(2,2); comph(1,1) = du1_ds1 * dx2_ds2 - du1_ds2 * dx2_ds1; comph(1,2) = -du1_ds1 * dx1_ds2 + du1_ds2 * dx1_ds1; comph(2,1) = du2_ds1 * dx2_ds2 - du2_ds2 * dx2_ds1; comph(2,2) = -du2_ds1 * dx1_ds2 + du2_ds2 * dx1_ds1; % Jacobian: 158
168 J = dx1_ds1 * dx2_ds2 - dx1_ds2 * dx2_ds1; % Deformation Gradient Tensor: F = eye(2,2) + (1/J)*compH; treated_f11(i) = F(1,1); treated_f22(i) = F(2,2); treated_k1(i) = F(1,2); treated_k2(i) = F(2,1); end Jacobian_cryo = cryo_f11(l2) * cryo_f22(l2) - cryo_k1(l2 )* cryo_k2(l2); Jacobian_RFA = treated_f11(l3) * treated_f22(l3) - treated_k1(l3) * treated_k2(l3); Jacobian_untreated = untreated_f11(l1) * untreated_f22(l1) - untreated_k1(l1) * untreated_k2(l1); % Percent change in the Jacobian (area): Change_J_cryo = ( (Jacobian_cryo - Jacobian_untreated)/Jacobian_untreated)*100; Change_J_RFA = ( (Jacobian_RFA - Jacobian_untreated)/Jacobian_untreated)*100; Change_J_RFA_cryo = ( (Jacobian_RFA - Jacobian_cryo)/Jacobian_cryo)*100; % Change in F11: Change_F11_cryo = ( (cryo_f11(l2) - untreated_f11(l1))/untreated_f11(l1))*100; Change_F11_RFA = ( (treated_f11(l3) - untreated_f11(l1))/untreated_f11(l1))*100; Change_F11_RFA_cryo = ( (treated_f11(l3) - cryo_f11(l2))/cryo_f11(l2))*100; % Change in F22: Change_F22_cryo = ( (cryo_f22(l2) - untreated_f22(l1))/untreated_f22(l1))*100; Change_F22_RFA = ( (treated_f22(l3) - untreated_f22(l1))/untreated_f22(l1))*100; Change_F22_RFA_cryo = ( (treated_f22(l3) - cryo_f22(l2))/cryo_f22(l2))*100; disp(' ') disp(' DEFORMATION CHANGES ') disp(' ') fprintf('\n') disp('percent CHANGE:') fprintf('\n') disp(' Cryo to Untreated RFA to Untreated RFA to Cryo') fprintf('circ \t%+7.2f \t\t\t\t %+6.2f \t\t\t %+7.2f',Change_F11_cryo,Change_F11_RFA,Change_F11_RFA_cryo) fprintf('\n') fprintf('radial \t%+7.2f \t\t\t\t %+6.2f \t\t\t %+7.2f ',Change_F22_cryo,Change_F22_RFA,Change_F22_RFA_cryo) fprintf('\n') fprintf('areal %+7.2f \t\t\t %+7.2f \t\t\t %+7.2f ',Change_J_cryo,Change_J_RFA,Change_J_RFA_cryo) fprintf('\n') fprintf('\n') fprintf('\n') DEFORMATION = [Change_F11_cryo Change_F22_cryo Change_J_cryo;... Change_F11_RFA Change_F22_RFA Change_J_RFA;... Change_F11_RFA_cryo Change_F22_RFA_cryo Change_J_RFA_cryo]; %% Plot Membrane Tension v Stretch %%%%%%%%%%%%%%%%%%%%%%%%%%%%%%%%%%%%%%% 159
169 % Of treated data referenced to the original untreated marker reference % Determine MAX & MIN stretch, of all samples: total_stretch = [untreated_f11; untreated_f22; cryo_f11;... cryo_f22; treated_f11; treated_f22]; maximum_s = max(total_stretch); minimum_s = min(total_stretch); % Set the maximum x-axis stretch on plot to 1.5 if, stretch is less than % 1.5: if (maximum_s > 1.5) % DO NOTHING else maximum_s = 1.5; end % Set the minimum x-axis stretch on plot to 1 if, stretch is greater than % 1: if (minimum_s < 1) % DO NOTHING else minimum_s = 1; end fig2 = figure(2); % Plot UNTREATED, CIRC and RADIAL: plot(untreated_f11,c_load_untreated(1:l1),'ko','markersize',6) hold on plot(untreated_f22,r_load_untreated(1:l1),'kv','markersize',6) % Plot CRYO ONLY, CIRC and RADIAL: plot(cryo_f11,c_load_cryo(1:l2),'bo','markersize',6) plot(cryo_f22,r_load_cryo(1:l2),'bv','markersize',6) % Plot TREATED, CIRC and RADIAL: plot(treated_f11,c_load_treated(1:l3),'ro','markersize',6) plot(treated_f22,r_load_treated(1:l3),'rv','markersize',6) grid on axis([minimum_s maximum_s 0 95]) xlabel('stretch Ratio') ylabel('membrane Tension (N/m)') ptitle4 = [sample,' - Tenson v Stretch - Original Reference']; title(ptitle4,'fontweight','bold') legend('circ: Untreated','Radial: Untreated','Circ: Cryo','Radial: Cryo','Circ: Cryo + RFA','Radial: Cryo + RFA') hold off filename = [sample,' - Tenson v Stretch - Orig Reference.jpg']; saveas(fig2,filename) %% Determine GEOMETRY Changes %%%%%%%%%%%%%%%%%%%%%%%%%%%%%%%%%%%%%%%%%%%%% untreated_ref_t = transpose(untreated_ref); untreated_ref_t(5,1) = untreated_ref_t(1,1); untreated_ref_t(5,2) = untreated_ref_t(1,2); cryo_ref_t = transpose(cryo_ref); cryo_ref_t(5,1) = cryo_ref_t(1,1); cryo_ref_t(5,2) = cryo_ref_t(1,2); 160
170 treated_ref_t = transpose(treated_ref); treated_ref_t(5,1) = treated_ref_t(1,1); treated_ref_t(5,2) = treated_ref_t(1,2); % Areal Changes: untreated_area = polyarea(untreated_ref_t(:,1),untreated_ref_t(:,2)); cryo_area = polyarea(cryo_ref_t(:,1),cryo_ref_t(:,2)); treated_area = polyarea(treated_ref_t(:,1),treated_ref_t(:,2)); % Percent Change - Areal: cryo_area_change = ((cryo_area - untreated_area)/untreated_area)*100; treated_area_change = ((treated_area - untreated_area)/untreated_area)*100; treated_cryo_area = ((treated_area - cryo_area)/cryo_area)*100; % Circumferential & Radial Directions: C_untreated = 0.5*(sqrt( (untreated_ref(1,1)-untreated_ref(1,2))^2 + (untreated_ref(2,1)-untreated_ref(2,2))^2 )... + sqrt( (untreated_ref(1,4)-untreated_ref(1,3))^2 + (untreated_ref(2,4)- untreated_ref(2,3))^2 ) ); R_untreated = 0.5*(sqrt( (untreated_ref(1,1)-untreated_ref(1,4))^2 + (untreated_ref(2,1)-untreated_ref(2,4))^2 )... + sqrt( (untreated_ref(1,2)-untreated_ref(1,3))^2 + (untreated_ref(2,2)- untreated_ref(2,3))^2 ) ); C_cryo = 0.5*(sqrt( (cryo_ref(1,1)-cryo_ref(1,2))^2 + (cryo_ref(2,1)- cryo_ref(2,2))^2 )... + sqrt( (cryo_ref(1,4)-cryo_ref(1,3))^2 + (cryo_ref(2,4)-cryo_ref(2,3))^2 ) ); R_cryo = 0.5*(sqrt( (cryo_ref(1,1)-cryo_ref(1,4))^2 + (cryo_ref(2,1)- cryo_ref(2,4))^2 )... + sqrt( (cryo_ref(1,2)-cryo_ref(1,3))^2 + (cryo_ref(2,2)-cryo_ref(2,3))^2 ) ); C_treated = 0.5*(sqrt( (treated_ref(1,1)-treated_ref(1,2))^2 + (treated_ref(2,1)- treated_ref(2,2))^2 )... + sqrt( (treated_ref(1,4)-treated_ref(1,3))^2 + (treated_ref(2,4)- treated_ref(2,3))^2 ) ); R_treated = 0.5*(sqrt( (treated_ref(1,1)-treated_ref(1,4))^2 + (treated_ref(2,1)- treated_ref(2,4))^2 )... + sqrt( (treated_ref(1,2)-treated_ref(1,3))^2 + (treated_ref(2,2)- treated_ref(2,3))^2 ) ); % Percent Change - Circ and Radial: cryo_circ_change = (C_cryo-C_untreated)/C_untreated*100; cryo_radial_change = (R_cryo-R_untreated)/R_untreated*100; treated_circ_change = (C_treated-C_untreated)/C_untreated*100; treated_radial_change = (R_treated-R_untreated)/R_untreated*100; treated_cryo_c = (C_treated-C_cryo)/C_cryo*100; treated_cryo_r = (R_treated-R_cryo)/R_cryo*100; change_in_geom = [cryo_circ_change treated_circ_change treated_cryo_c;... cryo_radial_change treated_radial_change treated_cryo_r;... cryo_area_change treated_area_change treated_cryo_area]; disp(' ') disp(' GEOMETRY CHANGES ') disp(' ') fprintf('\n') 161
171 disp('percent CHANGE:') fprintf('\n') disp(' Cryo to Untreated RFA to Untreated RFA to Cryo') fprintf('circ \t%+7.2f \t\t\t\t %+6.2f \t\t\t %+7.2f',change_in_geom(1,1),change_in_geom(1,2),change_in_geom(1,3)) fprintf('\n') fprintf('radial \t%+7.2f \t\t\t\t %+6.2f \t\t\t %+7.2f ',change_in_geom(2,1),change_in_geom(2,2),change_in_geom(2,3)) fprintf('\n') fprintf('areal %+7.2f \t\t\t %+7.2f \t\t\t %+7.2f ',change_in_geom(3,1),change_in_geom(3,2),change_in_geom(3,3)) fprintf('\n') fprintf('\n') fprintf('\n') fprintf('\n') GEOMETRY = [cryo_circ_change cryo_radial_change cryo_area_change;... treated_circ_change treated_radial_change treated_area_change;... treated_cryo_c treated_cryo_r treated_cryo_area]; %% Marker Geometry Plot - UNSTRAINED %%%%%%%%%%%%%%%%%%%%%%%%%%%%%%%%%%%%%% Xdet(1:5) = untreated_ref_t(:,1); Xdet(6:10) = treated_ref_t(:,1); Ydet(1:5) = untreated_ref_t(:,2); Ydet(6:10) = treated_ref_t(:,2); min_markerx = min(xdet); min_markery = min(ydet); max_markerx = max(xdet); max_markery = max(ydet); figure(3) plot(untreated_ref_t(:,1),untreated_ref_t(:,2),'ko-- ','LineWidth',1,'MarkerSize',5,'MarkerFaceColor','k') hold on plot(cryo_ref_t(:,1),cryo_ref_t(:,2),'bo-- ','LineWidth',1,'MarkerSize',5,'MarkerFaceColor','b') plot(treated_ref_t(:,1),treated_ref_t(:,2),'ro-- ','LineWidth',1,'MarkerSize',5,'MarkerFaceColor','r') ptitle4 = [sample,' - Marker Locations - UNSTRAINED']; title(ptitle4,'fontweight','bold') legend('untreated','cryo Only','RFA + Cryo') axis([min_markerx-25 max_markerx+25 min_markery-25 max_markery+25]) hold off %% Marker Geometry Plot - STRAINED %%%%%%%%%%%%%%%%%%%%%%%%%%%%%%%%%%%%%%%% untreated_strained = [untreated.data(r1,11) untreated.data(r1,15);... untreated.data(r1,12) untreated.data(r1,16);... untreated.data(r1,13) untreated.data(r1,17);... untreated.data(r1,14) untreated.data(r1,18);... untreated.data(r1,11) untreated.data(r1,15)]; cryo_strained = [cryo.data(r3,11) cryo.data(r3,15);... cryo.data(r3,12) cryo.data(r3,16);... cryo.data(r3,13) cryo.data(r3,17);... cryo.data(r3,14) cryo.data(r3,18);... cryo.data(r3,11) cryo.data(r3,15)]; treated_strained = [treated.data(r5,11) treated.data(r5,15);... treated.data(r5,12) treated.data(r5,16);... treated.data(r5,13) treated.data(r5,17);
172 Xdet(1:5) = untreated_strained(:,1); Xdet(6:10) = treated_strained(:,1); Ydet(1:5) = untreated_strained(:,2); Ydet(6:10) = treated_strained(:,2); min_markerx = min(xdet); min_markery = min(ydet); max_markerx = max(xdet); max_markery = max(ydet); treated.data(r5,14) treated.data(r5,18);... treated.data(r5,11) treated.data(r5,15)]; figure(4) plot(untreated_strained(:,1),untreated_strained(:,2),'ko-- ','LineWidth',1,'MarkerSize',5,'MarkerFaceColor','k') hold on plot(cryo_strained(:,1),cryo_strained(:,2),'bo-- ','LineWidth',1,'MarkerSize',5,'MarkerFaceColor','b') plot(treated_strained(:,1),treated_strained(:,2),'ro-- ','LineWidth',1,'MarkerSize',5,'MarkerFaceColor','r') ptitle5 = [sample,' - Marker Locations - STRAINED']; title(ptitle5,'fontweight','bold') legend('untreated','cryo Only','RFA + Cryo') axis([min_markerx-25 max_markerx+25 min_markery-25 max_markery+25]) hold off Biaxial Mechanical Testing Analysis: Fung-Type Strain Energy Model The following MATLAB code was used to perform the fits of mechanical data to the Fung-type hyperelastic strain energy model presented in Aim 2. % Parameter fitting for model of biaxial test data % Steve Boronyak % April 17, 2013 clear clc close all %% LOAD TEST DATA %%%%%%%%%%%%%%%%%%%%%%%%%%%%%%%%%%%%%%%%%%%%%%%%%%%%%%%%% % SAMPLE DIMENSIONS L1 = 15; % mm - circ L2 = 12; % mm - radial test_data = importdata('treated(10).txt','\t',1); LOAD1 = test_data.data(:,2); LOAD2 = test_data.data(:,3); % grams % grams % MAX LOAD [n1,m1] = max(load1); [n2,m2] = max(load2); if m1 > m2 length = m2; % Determine the length of the dataset 163
173 else length = m1; end E11 = test_data.data(1:length,8); E22 = test_data.data(1:length,10); F11 = test_data.data(1:length,4); F22 = test_data.data(1:length,7); % From Green-Lagrangian Strain Tensor % From deformation gradient tensor LOAD1 = LOAD1(1:length); LOAD2 = LOAD2(1:length); %% CALCULATE S %%%%%%%%%%%%%%%%%%%%%%%%%%%%%%%%%%%%%%%%%%%%%%%%%%%%%%%%%%%% S11 = (LOAD1.*9.81)./(L2.*F11); % 2nd Piola-Kirchhoff Stress, without S22 = (LOAD2.*9.81)./(L1.*F22); % thickness %% MODEL FITTING %%%%%%%%%%%%%%%%%%%%%%%%%%%%%%%%%%%%%%%%%%%%%%%%%%%%%%%%%% % INITIAL GUESSES c = 0.1; A1 = 100; A2 = 10; beta = [c;a1;a2]; Nfit = 3; % N/m % Unitless % Unitless % Number of parameters to fit % LOWER BOUNDS LB = [0;0;0]; % Model makes no sense of coeffs below 0 fop = optimset('algorithm','levenberg-marquardt'); % Doesn't use Marquardt due to lower bounds [betae,resnorm,residuals,exflag,outp,lambda,jacobian] = lsqnonlin(@biax_function_4,beta,lb,[],fop,s11,s22,e11,e22); beta_ci = nlparci(betae,residuals,'jacobian',jacobian); %% GENERATE FUNCTION FROM CALCULATED PARAMETERS %%%%%%%%%%%%%%%%%%%%%%%%%%% S11_CALC = betae(1).*( 2.*betaE(2).*E11 ).*exp( betae(2).*e11.^2 + betae(3).*e22.^2 ); S22_CALC = betae(1).*( 2.*betaE(3).*E22 ).*exp( betae(2).*e11.^2 + betae(3).*e22.^2 ); W = betae(1).*(exp( betae(2).*e11.^2 + betae(3).*e22.^2 ) - 1); % Strain-energy function W_loading = betae(1)*(exp( betae(2)*e11(length)^2 + betae(3)*e22(length)^2 ) - 1); SStot = sum((s11 - mean(s11)).^2); SSerr = sum((s11 - S11_CALC).^2); R_Squared_11 = 1 - SSerr/SStot; SStot = sum((s22 - mean(s22)).^2); SSerr = sum((s22 - S22_CALC).^2); R_Squared_22 = 1 - SSerr/SStot; % R^2 of circ fit % R^2 of radial fit % PLOT RESIDUALS HISTOGRAM figure(1) hist(residuals) 164
174 % PLOT THE MODEL FIT figure(2) plot(f11,s11.*f11,'bo') hold on plot(f22,s22.*f22,'rd') plot(f11,s11_calc.*f11,'k-','linewidth',2) plot(f22,s22_calc.*f22,'k-','linewidth',2) xlabel('stretch Ratio') ylabel('membrane Tension (N/m)') legend('circ','radial') title('model Fits') hold off %% ERROR ANALYSIS %%%%%%%%%%%%%%%%%%%%%%%%%%%%%%%%%%%%%%%%%%%%%%%%%%%%%%%%% JACOBIAN = full(jacobian); % Sigma^2: weight_sq = (residuals'*residuals)/(length-nfit+1); % Curvature matrix: alphas = JACOBIAN'*JACOBIAN./weight_sq; % Covariance matrix: covariance = inv(alphas); % SigmaP sigmap = diag(sqrt(covariance)); % Correlation matrix: correlation = covariance./ (sigmap*sigmap'); CORRELATE = det(correlation); % Chi^2 statistic: chisq2 = 1/weight_sq*sum(residuals.^2); chi_critical = chi2inv(0.95,length-nfit); %% COMPILE DATA FOR EASY EXPORT %%%%%%%%%%%%%%%%%%%%%%%%%%%%%%%%%%%%%%%%%%% ALL_DATA = [betae(1);betae(2);betae(3);r_squared_11;r_squared_22;... W_loading;outp.iterations;chisq2;chi_critical;CORRELATE]; PLOT_DATA = [F11 S11.*F11 F22 S22.*F22 F11 S11_CALC.*F11 F22 S22_CALC.*F22]; function F = biax_function_4(beta,s11,s22,e11,e22) F = [ S11 - beta(1).*( 2.*beta(2).*E11 ).*exp( beta(2).*e11.^2 + beta(3).*e22.^2 ) S22 - beta(1).*( 2.*beta(3).*E22 ).*exp( beta(2).*e11.^2 + beta(3).*e22.^2 )]; 165
175 Basic Biaxial Mechanical Testing 16 Marker Analysis The following MATLAB code was used to perform the Aim 1 Part 2 studies in Chapter 6. The data is input from a.mat file, which contains four variables: X1, X2, xx1, and xx2. X1 and X2 are the marker reference positions and xx1 and xx2 are the deformed marker positions, where 1 and 2 correspond to axis 1 and axis 2. Each variable is arranged as a 1x16 matrix, with the column number corresponding to the marker numbers shown in the code below. %% BIAX 16 MARKER DEFORMATION GRADIENT AND ANALYSIS % Steve Boronyak % Department of Biomedical Engineering % Vanderbilt University % January 5, 2015 % This code only works with the AVERAGE marker positions obtained after % using "biax_16_average_markers.m" or "biax_16_average_markersrf.m". The % file loads in the X1, X2, xx1, and xx2 marker positions in units of cm. % This code performs a bicubic interpolation in order to calculate the % displacement gradient and deformation gradient within a 4x4 bicubic % element. The spatially varying deformation gradient and maximum principal % strain are plotted on the reference and deformed grids. The grids were % determined using the bicubic interpolation of the 16 tracking markers. % Marker numbering for this implementation of the bicubic interpolation % (for X1 and X2 below): % % % % % % % % This program loads the marker positions assuming the following % configuration (this is the marker order of X1uo and X2uo): % % % % % % % %%%%%%%%%%%%%%%%%%%%%%%%%%%%%%%%%%%%%%%%%%%%%%%%%%%%%%%%%%%%%%%%%%%%%%%%%%% clear close all clc colordef white % Set figures for black background %% USER INPUT %%%%%%%%%%%%%%%%%%%%%%%%%%%%%%%%%%%%%%%%%%%%%%%%%%%%%%%%%%%%% % REFERENCE and DEFORMED Marker File disp('select DATA file'); [datafile,imagefolder,~] = uigetfile('*.mat'); xxx = [ImageFolder datafile]; load(xxx) 166
176 %% EXTRACT DATA %%%%%%%%%%%%%%%%%%%%%%%%%%%%%%%%%%%%%%%%%%%%%%%%%%%%%%%%%%% % Displacement Field: u1 = xx1 - X1; u2 = xx2 - X2; % Rearrange X1/2 and xx1/2 arrays for marker outline: jj = [1,5,6,2,7,8,3,9,10,4,11,12,1]; for i = 1:13 X1_outline(i) = X1(jj(i)); X2_outline(i) = X2(jj(i)); xx1_outline(i) = xx1(jj(i)); xx2_outline(i) = xx2(jj(i)); end %% CALCULATE DEFORMED GRADIENT AT r=0, s=0 %%%%%%%%%%%%%%%%%%%%%%%%%%%%%%%%%%% r = 0; s = 0; % Marker locations in the local (r,s) coordinate system: rl = [-1,1,1,-1,-1/3,1/3,1,1,1/3,-1/3,-1,-1,-1/3,1/3,1/3,-1/3]; sl = [-1,-1,1,1,-1,-1,-1/3,1/3,1,1,1/3,-1/3,-1/3,-1/3,1/3,1/3]; % dx/ds: dx1_ds1 = bicubic_derivative_r(r,s,rl,sl,x1); dx1_ds2 = bicubic_derivative_s(r,s,rl,sl,x1); dx2_ds1 = bicubic_derivative_r(r,s,rl,sl,x2); dx2_ds2 = bicubic_derivative_s(r,s,rl,sl,x2); % du/ds: du1_ds1 = bicubic_derivative_r(r,s,rl,sl,u1); du1_ds2 = bicubic_derivative_s(r,s,rl,sl,u1); du2_ds1 = bicubic_derivative_r(r,s,rl,sl,u2); du2_ds2 = bicubic_derivative_s(r,s,rl,sl,u2); % Matrix for H: comph = zeros(2,2); comph(1,1) = du1_ds1*dx2_ds2 - du1_ds2*dx2_ds1; comph(1,2) = -du1_ds1*dx1_ds2 + du1_ds2*dx1_ds1; comph(2,1) = du2_ds1*dx2_ds2 - du2_ds2*dx2_ds1; comph(2,2) = -du2_ds1*dx1_ds2 + du2_ds2*dx1_ds1; % Jacobian: J = dx1_ds1*dx2_ds2 - dx1_ds2*dx2_ds1; % Deformation Gradient Tensor: F = eye(2,2) + (1/J)*compH; F11 = F(1,1); F22 = F(2,2); k1 = F(1,2); k2 = F(2,1); %% GENERATE MESH GRID - DEFORMED AND UNDEFORMED %%%%%%%%%%%%%%%%%%%%%%%%%%%%%%% node_width = 50; r = linspace(-1,1,node_width); s = linspace(-1,1,node_width); % Number of nodes in each direction % Generate vector of points in r-space % Generate vector of points in s-space [rr,ss] = meshgrid(r,s); 167
177 % Generate REFERENCE and DEFORMED grids for i = 1:node_width for j = 1:node_width X_grid(i,j) = bicubic_basis(rr(i,j),ss(i,j),rl,sl,x1); Y_grid(i,j) = bicubic_basis(rr(i,j),ss(i,j),rl,sl,x2); u_grid(i,j) = bicubic_basis(rr(i,j),ss(i,j),rl,sl,u1); v_grid(i,j) = bicubic_basis(rr(i,j),ss(i,j),rl,sl,u2); xx_grid(i,j) = X_grid(i,j) + u_grid(i,j); yy_grid(i,j) = Y_grid(i,j) + v_grid(i,j); end end %% CALCULATE DEFORMATION GRADIENT EVERYWHERE %%%%%%%%%%%%%%%%%%%%%%%%%%%%%%%%%%%%% for i = 1:node_width for j = 1:node_width % dx/ds: dx1_ds1 = bicubic_derivative_r(rr(i,j),ss(i,j),rl,sl,x1); dx1_ds2 = bicubic_derivative_s(rr(i,j),ss(i,j),rl,sl,x1); dx2_ds1 = bicubic_derivative_r(rr(i,j),ss(i,j),rl,sl,x2); dx2_ds2 = bicubic_derivative_s(rr(i,j),ss(i,j),rl,sl,x2); % du/ds: du1_ds1 = bicubic_derivative_r(rr(i,j),ss(i,j),rl,sl,u1); du1_ds2 = bicubic_derivative_s(rr(i,j),ss(i,j),rl,sl,u1); du2_ds1 = bicubic_derivative_r(rr(i,j),ss(i,j),rl,sl,u2); du2_ds2 = bicubic_derivative_s(rr(i,j),ss(i,j),rl,sl,u2); % Matrix for H: comph = zeros(2,2); comph(1,1) = du1_ds1*dx2_ds2 - du1_ds2*dx2_ds1; comph(1,2) = -du1_ds1*dx1_ds2 + du1_ds2*dx1_ds1; comph(2,1) = du2_ds1*dx2_ds2 - du2_ds2*dx2_ds1; comph(2,2) = -du2_ds1*dx1_ds2 + du2_ds2*dx1_ds1; % Jacobian: J = dx1_ds1*dx2_ds2 - dx1_ds2*dx2_ds1; % Deformation Gradient Tensor: zf = eye(2,2) + (1/J)*compH; zf11(i,j) = zf(1,1); zf22(i,j) = zf(2,2); zfdet(i,j) = det(zf); % Axis 1 deformation % Axis 2 deformation % Areal deformation E_star = 0.5*(transpose(zF)*zF - eye(2,2)); [v,d] = eig(e_star); zmaxp(i,j) = min(min(d)); % Minimum principal strain % zmaxp(i,j) = max(max(d)); % Minimum principal strain zinv1(i,j) = sum(sum(d)); % 1st Invariant end end for i = 1:node_width % dx/ds: dx1_ds1 = bicubic_derivative_r(r(i),0,rl,sl,x1); dx1_ds2 = bicubic_derivative_s(r(i),0,rl,sl,x1); dx2_ds1 = bicubic_derivative_r(r(i),0,rl,sl,x2); dx2_ds2 = bicubic_derivative_s(r(i),0,rl,sl,x2); % du/ds: du1_ds1 = bicubic_derivative_r(r(i),0,rl,sl,u1); 168
178 du1_ds2 = bicubic_derivative_s(r(i),0,rl,sl,u1); du2_ds1 = bicubic_derivative_r(r(i),0,rl,sl,u2); du2_ds2 = bicubic_derivative_s(r(i),0,rl,sl,u2); % Matrix for H: comph = zeros(2,2); comph(1,1) = du1_ds1*dx2_ds2 - du1_ds2*dx2_ds1; comph(1,2) = -du1_ds1*dx1_ds2 + du1_ds2*dx1_ds1; comph(2,1) = du2_ds1*dx2_ds2 - du2_ds2*dx2_ds1; comph(2,2) = -du2_ds1*dx1_ds2 + du2_ds2*dx1_ds1; % Jacobian: J = dx1_ds1*dx2_ds2 - dx1_ds2*dx2_ds1; % Deformation Gradient Tensor: zf = eye(2,2) + (1/J)*compH; F11s0(i) = zf(1,1); F22s0(i) = zf(2,2); Fdets0(i) = det(zf); % Axis 1 deformation % Axis 2 deformation % Areal deformation end XposS0(i) = bicubic_basis(r(i),0,rl,sl,x1); YposS0(i) = bicubic_basis(r(i),0,rl,sl,x2); u_grid0(i) = bicubic_basis(r(i),0,rl,sl,u1); v_grid0(i) = bicubic_basis(r(i),0,rl,sl,u2); xx_poss0(i) = XposS0(i) + u_grid0(i); yy_poss0(i) = YposS0(i) + v_grid0(i); for i = 1:node_width % dx/ds: dx1_ds1 = bicubic_derivative_r(0,s(i),rl,sl,x1); dx1_ds2 = bicubic_derivative_s(0,s(i),rl,sl,x1); dx2_ds1 = bicubic_derivative_r(0,s(i),rl,sl,x2); dx2_ds2 = bicubic_derivative_s(0,s(i),rl,sl,x2); % du/ds: du1_ds1 = bicubic_derivative_r(0,s(i),rl,sl,u1); du1_ds2 = bicubic_derivative_s(0,s(i),rl,sl,u1); du2_ds1 = bicubic_derivative_r(0,s(i),rl,sl,u2); du2_ds2 = bicubic_derivative_s(0,s(i),rl,sl,u2); % Matrix for H: comph = zeros(2,2); comph(1,1) = du1_ds1*dx2_ds2 - du1_ds2*dx2_ds1; comph(1,2) = -du1_ds1*dx1_ds2 + du1_ds2*dx1_ds1; comph(2,1) = du2_ds1*dx2_ds2 - du2_ds2*dx2_ds1; comph(2,2) = -du2_ds1*dx1_ds2 + du2_ds2*dx1_ds1; % Jacobian: J = dx1_ds1*dx2_ds2 - dx1_ds2*dx2_ds1; % Deformation Gradient Tensor: zf = eye(2,2) + (1/J)*compH; F11r0(i) = zf(1,1); F22r0(i) = zf(2,2); Fdetr0(i) = det(zf); % Axis 1 deformation % Axis 2 deformation % Areal deformation % YposR0(i) = bicubic_basis(0,s(i),rl,sl,x2); XposR0(i) = bicubic_basis(0,s(i),rl,sl,x1); YposR0(i) = bicubic_basis(0,s(i),rl,sl,x2); 169
179 end u_grid0(i) = bicubic_basis(0,s(i),rl,sl,u1); v_grid0(i) = bicubic_basis(0,s(i),rl,sl,u2); xx_posr0(i) = XposR0(i) + u_grid0(i); yy_posr0(i) = YposR0(i) + v_grid0(i); %% PLOT MARKERS % Determine boundaries of plots, so all are uniform xmin = min([min(min(x_grid)) min(min(xx_grid))]); xmax = max([max(max(x_grid)) max(max(xx_grid))]); ymin = min([min(min(y_grid)) min(min(yy_grid))]); ymax = max([max(max(y_grid)) max(max(yy_grid))]); %% PLOTS OF DEFORMATION GRADIENT %%%%%%%%%%%%%%%%%%%%%%%%%%%%%%%%%%%%%%%%%%%%%%% % Determine boundaries of plots, so all are uniform xmin = min([min(min(x_grid)) min(min(xx_grid))]); xmax = max([max(max(x_grid)) max(max(xx_grid))]); ymin = min([min(min(y_grid)) min(min(yy_grid))]); ymax = max([max(max(y_grid)) max(max(yy_grid))]); fig5 = figure(5); pcolor(xx_grid,yy_grid,zfdet) hold on plot(xx1,xx2,'ko','markersize',5,'markerfacecolor','k') % title('areal Deformation - DEFORMED Configuration','FontSize',14) xlim([xmin-0.05 xmax+0.05]) ylim([ymin-0.05 ymax+0.05]) colorbar set(colorbar,'fontsize',14); % set(gcf, 'Color', [0,0,0]); set(gcf, 'Color', [1,1,1]); set(gca,'fontsize',14) % caxis([fmin2 FMAX2]) xlabel('(cm)') ylabel('(cm)') hold off fig5 = figure(8); pcolor(xx_grid,yy_grid,zf11) hold on plot(xx1,xx2,'ko','markersize',5,'markerfacecolor','k') % title('f11 - DEFORMED Configuration','FontSize',14) % plot(xx_poss0,yy_poss0,'k-','linewidth',2) % plot(xx_posr0,yy_posr0,'k-','linewidth',2) xlim([xmin-0.05 xmax+0.05]) ylim([ymin-0.05 ymax+0.05]) % caxis([fmin FMAX]) colorbar set(colorbar,'fontsize',14); % set(gcf, 'Color', [0,0,0]); set(gcf, 'Color', [1,1,1]); set(gca,'fontsize',14) xlabel('(cm)') ylabel('(cm)') hold off figure(9) pcolor(x_grid,y_grid,zf22) hold on 170
180 plot(x1,x2,'ko','markersize',5,'markerfacecolor','k') plot(xposs0,yposs0,'k-','linewidth',2) plot(xposr0,yposr0,'k-','linewidth',2) % title('f22 - REFERENCE Configuration','FontSize',14) % caxis([fmin FMAX]) colorbar set(colorbar,'fontsize',14); % set(gcf, 'Color', [0,0,0]); set(gcf, 'Color', [1,1,1]); set(gca,'fontsize',14) xlabel('(cm)') ylabel('(cm)') hold off fig5 = figure(10); pcolor(xx_grid,yy_grid,zf22) hold on plot(xx1,xx2,'ko','markersize',5,'markerfacecolor','k') % title('f22 - DEFORMED Configuration','FontSize',14) xlim([xmin-0.05 xmax+0.05]) ylim([ymin-0.05 ymax+0.05]) % plot(xx_poss0,yy_poss0,'k-','linewidth',2) % plot(xx_posr0,yy_posr0,'k-','linewidth',2) % caxis([fmin FMAX]) colorbar set(colorbar,'fontsize',14); % set(gcf, 'Color', [0,0,0]); set(gcf, 'Color', [1,1,1]); set(gca,'fontsize',14) xlabel('(cm)') ylabel('(cm)') hold off figure(13) plot(xposs0,fdets0,'k-.','linewidth',2) hold on set(gca,'linewidth',2); plot(xposs0,f11s0,'b-','linewidth',2) set(gca,'fontsize',14) plot(xposs0,f22s0,'r--','linewidth',2) xlabel('x11 Position (cm)') ylabel('deformation') legend('areal','circ - F11','Radial - F22') xlim([-.7.7]) % ylim([ ]) hold off 171
181 APPENDIX J: AIM 2 SUPPLEMENTAL DATA ESTIMATED MODEL PARAMETERS This section of the Appendix contains the estimated model parameters for all samples analyzed in the Aim 2 study of strain energy model fits. Table J.1. Parameter fitting results for untreated MV anterior leaflets. Sample Number c (N/m) A1 A2 W (N/m) R 2 circ R 2 rad
182
183
184 Table J.2. Parameter fitting results from static control, RF-treated leaflets. STATICALLY TREATED: 350 J Sample Number c (N/m) A1 A2 W (N/m) R 2 circ R 2 rad STATICALLY TREATED: 850 J Sample Number c (N/m) A1 A2 W (N/m) R 2 circ R 2 rad STATICALLY TREATED: 1250 J Sample Number c (N/m) A1 A2 W (N/m) R 2 circ R 2 rad
185 Table J.3. Parameter fitting results from flow loop treated MV leaflets. FLOW LOOP TREATED: CRYO ONLY Sample Number c (N/m) A1 A2 W (N/m) R 2 circ R 2 rad FLOW LOOP TREATED: RF ONLY Sample Number c (N/m) A1 A2 W (N/m) R 2 circ R 2 rad FLOW LOOP TREATED: RF+CRYO Sample Number c (N/m) A1 A2 W (N/m) R 2 circ R 2 rad
186 Table J.4. Parameter fitting results from durability study leaflets. UNTREATED: ACUTE Sample Number c (N/m) A1 A2 W (N/m) R 2 circ R 2 rad UNTREATED: WEEK 4 Sample Number c (N/m) A1 A2 W (N/m) R 2 circ R 2 rad TREATED: ACUTE Sample Number c (N/m) A1 A2 W (N/m) R 2 circ R 2 rad TREATED: WEEK 4 Sample Number c (N/m) A1 A2 W (N/m) R 2 circ R 2 rad
187 APPENDIX K: LEFT HEART FLOW SIMULATOR Essential accessory components for the left heart flow simulator, pinout diagrams for the LabView DAQ cards, pressure sensor calibrations, and the pneumatic system schematic are shown below. CAD drawings to reproduce the left heart flow simulator follow on the remaining pages. Essential Components, Left Heart Flow Simulator PART PART NUMBER MANUFACTURER Proportional Pressure Regulator PS Hoerbiger Pressure Sensors 19C003PG1L Honeywell Flow Meter 400 Series Transonic Solenoid Valve 3-Way, 8003G/H, 8202 G/H Asco DAQ Chassis NI-cDAQ 9178 National Instruments DAQ: Analog In NI-9205 National Instruments DAQ: Analog Out NI-9263 National Instruments Pinouts for DAQ Cards NI 9205 ACH0+ Pressure Sensor, Ventricle, OUT+ ACH0- Pressure Sensor, Ventricle, OUT- ACH1+ Pressure Sensor, Atrium, OUT+ ACH1- Pressure Sensor, Atrium, OUT- ACH3+ Flow Meter, Slot 1, Pin 1 ACH3- GND ACH4+ Flow Meter, Slot 1, Pin 2 ACH4- GND ACH5+ RF Generator, RF Power Measurement, + ACH5- RF Generator, RF Power Measurement, - ACH6+ RF Generator, RF Impedance Measurement, + ACH6- RF Generator, RF Impedance Measurement, - NI 9263 AO0 Proportional Regulator, Set Value COM GND AO1 Transistor to Solenoid Valve COM GND 178
188 Pressure (cmh2o) Pressure (cmh2o) Pressure Sensor Calibration: Ventricle 100 Pressure Sensor Calibration - Red y = x R² = Output (mv) Pressure Sensor Calibration: Atrium 100 Pressure Sensor Calibration - Black y = x R² = Output (mv) 179
189 Left Heart Flow Simulator Pneumatic System Diagram 30 psi in out in out PROPORTIONAL REGULATOR SOLENOID VALVE in exhaust house vac VAD/ PUMP 180
190 181
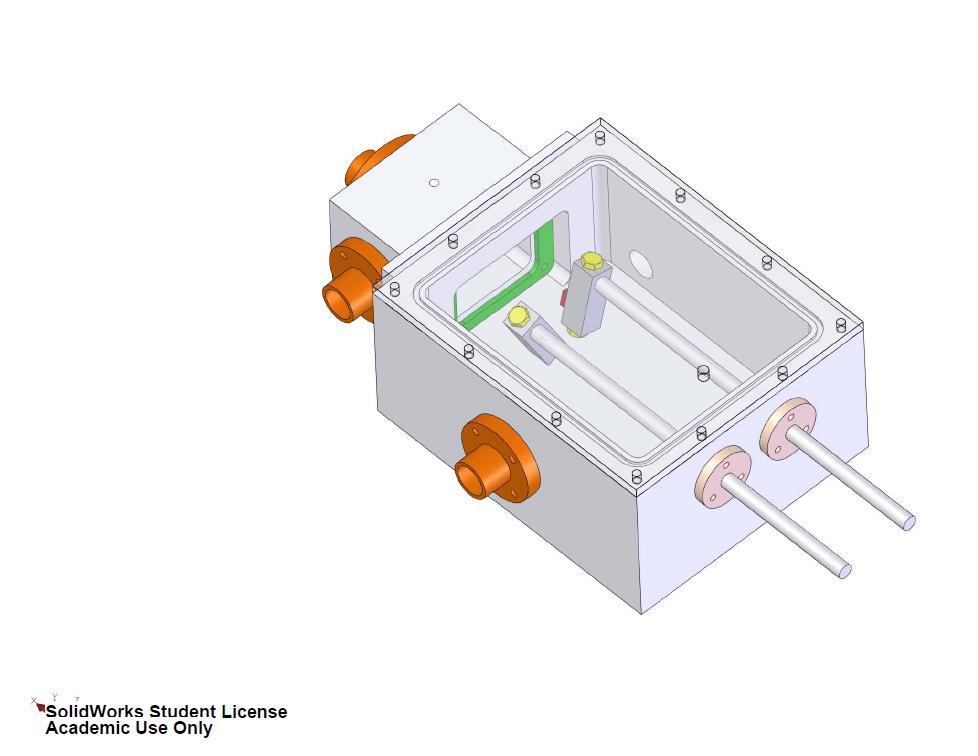
191 182
Outcomes of Mitral Valve Repair for Mitral Regurgitation Due to Degenerative Disease
 Outcomes of Mitral Valve Repair for Mitral Regurgitation Due to Degenerative Disease TIRONE E. DAVID, MD ; SEMIN THORAC CARDIOVASC SURG 19:116-120c 2007 ELSEVIER INC. PRESENTED BY INTERN 許士盟 Mitral valve
Chapter 24: Diagnostic workup and evaluation: eligibility, risk assessment, FDA guidelines Ashwin Nathan, MD, Saif Anwaruddin, MD, FACC Penn Medicine
 Chapter 24: Diagnostic workup and evaluation: eligibility, risk assessment, FDA guidelines Ashwin Nathan, MD, Saif Anwaruddin, MD, FACC Penn Medicine Mitral regurgitation, regurgitant flow between the
8/31/2016. Mitraclip in Matthew Johnson, MD
 Mitraclip in 2016 Matthew Johnson, MD 1 Abnormal Valve Function Valve Stenosis Obstruction to valve flow during that phase of the cardiac cycle when the valve is normally open. Hemodynamic hallmark - pressure
Percutaneous Mitral Valve Repair
 Indiana Chapter of ACC November 15 th,2008 Percutaneous Mitral Valve Repair James B Hermiller, MD, FACC The Care Group, LLC St Vincent Hospital Indianapolis, IN Mechanisms of Mitral Regurgitation Mitral
Percutaneous Mitral Valve Repair
 Percutaneous Mitral Valve Repair MitraClip: Procedure, Data, Patient Selection Chad Rammohan, MD FACC Director, Cardiac Cath Lab El Camino Hospital Mountain View, California Mitral Regurgitation MitraClip
Posterior leaflet prolapse is the most common lesion seen
 Techniques for Repairing Posterior Leaflet Prolapse of the Mitral Valve Robin Varghese, MD, MS, and David H. Adams, MD Posterior leaflet prolapse is the most common lesion seen in degenerative mitral valve
Historical perspective R1 黃維立
 Degenerative mitral valve disease refers to a spectrum of conditions in which morphologic changes in the connective tissue of the mitral valve cause structural lesions that prevent normal function of the
Eulogio Garcia MD Hospital Clínico San Carlos Madrid - Spain
 Eulogio Garcia MD Hospital Clínico San Carlos Madrid - Spain Device Landscape 2010 PERCUTANEOUS TECHNIQUES Percutaneous indirect annuloplasty Percutaneous direct annuloplasty Edge to Edge ( E-Valve ) Non
Disclosure Statement of Financial Interest Saibal Kar, MD, FACC
 MitraClip Therapy Saibal Kar, MD, FACC, FAHA, FSCAI Director of Interventional Cardiac Research Program Director, Interventional Cardiology Heart Institute, Cedars-Sinai Medical Center, Los Angeles, CA
Index. B B-type natriuretic peptide (BNP), 76
, 76") Index A ACCESS-EU registry, 158 159 Acute kidney injury (AKI), 76, 88 Annular enlargement, RV, 177 178 Annuloplasty chordal cutting, 113 complete ring, 99 etiology-specific ring, 100 evolution, 98 flexible
Index A ACCESS-EU registry, 158 159 Acute kidney injury (AKI), 76, 88 Annular enlargement, RV, 177 178 Annuloplasty chordal cutting, 113 complete ring, 99 etiology-specific ring, 100 evolution, 98 flexible
Percutaneous Mitral Valve Intervention: QuantumCor Device
 Percutaneous Mitral Valve Intervention: QuantumCor Device RICHARD R. HEUSER, MD, FACC, FACP, FESC Director Of Cardiology, St. Luke s Medical Center, Phoenix, Arizona Medical Director, Phoenix Heart Center,
Percutaneous mitral valve repair/replacement. Jan Van der Heyden MD, PhD St.Antonius Hospital Nieuwegein
 Percutaneous mitral valve repair/replacement Jan Van der Heyden MD, PhD St.Antonius Hospital Nieuwegein Mitral Valve anatomy Difference between AoV and MV Aortic Valve Mitral Valve Transcatheter Mitral
Valve Analysis and Pathoanatomy: THE MITRAL VALVE
 : THE MITRAL VALVE Marc R. Moon, M.D. John M. Shoenberg Chair in CV Disease Chief, Cardiac Surgery Washington University School of Medicine, St. Louis, MO Secretary, American Association for Thoracic Surgery
Direct Annuloplasty with QuantumCor: Device Evolution, Techniques and First-in-Man Results
 Direct Annuloplasty with QuantumCor: Device Evolution, Techniques and First-in-Man Results RICHARD R. HEUSER, MD, FACC, FACP, FESC, FSCAI Chief of Cardiology, St. Luke s Medical Center, Phoenix, Arizona
CLIP ΜΙΤΡΟΕΙ ΟΥΣ: ΠΟΥ ΒΡΙΣΚΟΜΑΣΤΕ;
 CLIP ΜΙΤΡΟΕΙ ΟΥΣ: ΠΟΥ ΒΡΙΣΚΟΜΑΣΤΕ; Επιµορφωτικά Σεµινάρια Ειδικευοµένων Καρδιολογίας 7 Απριλίου 2012 M Chrissoheris MD FACC THV Department HYGEIA Hospital Degenerative MR (DMR) Usually refers to an anatomic
Overview of Surgical Approach to Mitral Valve Disease : Why Repair? Steven F. Bolling, MD Cardiac Surgery University of Michigan
 Overview of Surgical Approach to Mitral Valve Disease : Why Repair? Steven F. Bolling, MD Cardiac Surgery University of Michigan Degenerative MR is not Functional MR 2o - Functional MR : Ventricular Problem!!
Surgical Repair of the Mitral Valve Presenter: Graham McCrystal Cardiothoracic Surgeon Christchurch Public Hospital
 Mitral Valve Surgical intervention Graham McCrystal Chairs: Rajesh Nair & Gerard Wilkins Surgical Repair of the Mitral Valve Presenter: Graham McCrystal Cardiothoracic Surgeon Christchurch Public Hospital
The Edge-to-Edge Technique f For Barlow's Disease
 The Edge-to-Edge Technique f For Barlow's Disease Ottavio Alfieri, Michele De Bonis, Elisabetta Lapenna, Francesco Maisano, Lucia Torracca, Giovanni La Canna. Department of Cardiac Surgery, San Raffaele
Mitral Valve Disease, When to Intervene
 Mitral Valve Disease, When to Intervene Swedish Heart and Vascular Institute Ming Zhang MD PhD Interventional Cardiology Structure Heart Disease Conflict of Interest None Current ACC/AHA guideline Stages
Χειρουργική Αντιμετώπιση της Ανεπάρκειας της Μιτροειδούς Βαλβίδας
 Χειρουργική Αντιμετώπιση της Ανεπάρκειας της Μιτροειδούς Βαλβίδας Dr Χρήστος ΑΛΕΞΙΟΥ MD, PhD, FRCS(Glasgow), FRCS(CTh), CCST(UK) Consultant Cardiothoracic Surgeon Normal Mitral Valve Function Mitral Regurgitation
Degenerative Mitral Regurgitation: Etiology and Natural History of Disease and Triggers for Intervention
 Degenerative Mitral Regurgitation: Etiology and Natural History of Disease and Triggers for Intervention John N. Hamaty D.O. FACC, FACOI November 17 th 2017 I have no financial disclosures Primary Mitral
Echocardiographic Evaluation of Primary Mitral Regurgitation
 Echocardiographic Evaluation of Primary Mitral Regurgitation Roberto M Lang, MD 0-10 o ME 4CH Med A2 P2 50-70 o Commissural P3 P1 A2 80-100 o ME 2CH P3 A2 A1 A1 125-135 o - ME Long axis P2 A2 P3 A3 P2
Percutaneous Mitral Valve Repair
 Percutaneous Mitral Valve Repair Policy Number: Original Effective Date: MM.06.027 08/01/2015 Line(s) of Business: Current Effective Date: HMO; PPO; QUEST Integration 08/01/2017 Section: Surgery Place(s)
Repair or Replacement
 Surgical intervention post MitraClip Device: Repair or Replacement Saudi Heart Association, February 21-24 Rüdiger Lange, MD, PhD Nicolo Piazza, MD, FRCPC, FESC German Heart Center, Munich, Germany Division
Current status: Percutaneous mitral valve therapy
 Current status: Percutaneous mitral valve therapy Ted Feldman, M.D., FSCAI FACC FESC Evanston Hospital ESC Stockholm 2010 Disclosures Research Grants Abbott, Edwards Consultant Abbott, Edwards 2 Percutaneous
Who will Benefit from Percutaneous Management of Mitral Regurgitation? An Imaging Guide to Management
 Who will Benefit from Percutaneous Management of Mitral Regurgitation? An Imaging Guide to Management James D. Thomas, M.D., F.A.C.C. Department of Cardiovascular Medicine Heart and Vascular Institute
Organic mitral regurgitation
 The best in heart valve disease Organic mitral regurgitation Ewa Szymczyk Department of Cardiology Medical University of Lodz, Poland I have nothing to declare Organic mitral regurgitation leaflet abnormality
Percutaneous mitral valve repair: current techniques and results
 Percutaneous mitral valve repair: current techniques and results Ted Feldman, M.D., FSCAI, FACC Angioplasty Summit April 25-27 th th 2007 Seoul, Korea Ted Feldman MD, FACC, FSCAI Disclosure Information
Index. interventional.theclinics.com. Note: Page numbers of article titles are in boldface type.
 Index Note: Page numbers of article titles are in boldface type. A Ablation, of mitral leaflets, 80 Accucinch Annuloplasty system, for mitral regurgitation, 79, 94 95 Accutrak delivery system, for CoreValve
The Key Questions in Mitral Valve Interventions. Where Are We in 2018?
 The Key Questions in Mitral Valve Interventions Where Are We in 2018? Gilles D. DREYFUS, MD, FRCS, FESC Professor of Cardiothoracic Surgery 30 GIORNATE CARDIOLOGICHE TORINESI - OCT 2018 Are guidelines
PERCUTANEOUS MITRAL VALVE THERAPIES 13 TH ANNUAL CARDIAC, VASCULAR AND STROKE CARE CONFERENCE PIEDMONT ATHENS REGIONAL
 PERCUTANEOUS MITRAL VALVE THERAPIES 13 TH ANNUAL CARDIAC, VASCULAR AND STROKE CARE CONFERENCE PIEDMONT ATHENS REGIONAL DISCLOSURES I WILL BE DISCUSSING OFF-LABEL USAGE OF DEVICES RELATED TO TMVR OBJECTIVES
Percutaneous Mitral Valve Repair: What Can We Treat and What Should We Treat
 Percutaneous Mitral Valve Repair: What Can We Treat and What Should We Treat Innovative Procedures, Devices & State of the Art Care for Arrhythmias, Heart Failure & Structural Heart Disease October 8-10,
Cases of mitral valve causing mitral regurgitation: the MV prolapse spectrum CASE
 Cases of mitral valve causing mitral regurgitation: the MV prolapse spectrum Judy Hung, MD Cardiology Division Massachusetts General Hospital Boston, MA CASE Mr. M; 50 Year male presents to internist for
Outline 9/17/2016. Advances in Percutaneous Mitral Valve Repair and Replacement. Scope of the Problem and Guidelines
 Advances in Percutaneous Mitral Valve Repair and Replacement Scott M Lilly MD PhD, Interventional Cardiology The Ohio State University Contemporary Multidisciplinary Cardiovascular Conference Orlando,
Routine MitraClip. Image Guidance Step by Step
 Routine MitraClip Image Guidance Step by Step Douglas C. Shook, MD, FASE Director, Cardiothoracic Anesthesia Fellowship Director, Cardiac Interventional Anesthesia Department of Anesthesiology BRIGHAM
The clinical problem of atrioventricular valve regurgitation
 Mitral Regurgitation in Congenital Heart Defects: Surgical Techniques for Reconstruction Richard G. Ohye Mitral valve regurgitation (MR) is an important source of morbidity and mortality worldwide. While
MitraClip in the ICCU: Which Patient will Benefit?
 MitraClip in the ICCU: Which Patient will Benefit? DAVID MEERKIN STRUCTURAL A ND CONGENITAL HEART DISEASE UNIT SHAARE ZEDEK MEDICAL CENTER JERUSALEM Conflict of Interest No relevant disclosures Complex
JOINT MEETING 2 Tricuspid club Chairpersons: G. Athanassopoulos, A. Avgeropoulou, M. Khoury, G. Stavridis
 JOINT MEETING 2 Tricuspid club Chairpersons: G. Athanassopoulos, A. Avgeropoulou, M. Khoury, G. Stavridis Similarities and differences in Tricuspid vs. Mitral Valve Anatomy and Imaging. Echo evaluation
Despite advances in our understanding of the pathophysiology
 Suture Relocation of the Posterior Papillary Muscle in Ischemic Mitral Regurgitation Benjamin B. Peeler MD,* and Irving L. Kron MD,*, *Department of Cardiovascular Surgery, University of Virginia, Charlottesville,
Percutaneous Therapy for Mitral Regurgitation: Current and Future Options: Could we do better today?
 Percutaneous Therapy for Mitral Regurgitation: Current and Future Options: Could we do better today? Peter S. Fail, MD, FACC, FACP, FSCAI Director of the Cardiac Catheterization Laboratories and Interventional
Atrioventricular valve repair: The limits of operability
 Atrioventricular valve repair: The limits of operability Francis Fynn-Thompson, MD Co-Director, Center for Airway Disorders Surgical Director, Pediatric Mechanical Support Program Surgical Director, Heart
What echo measurements are key prior to MitraClip?
 APHP CHU Bichat - Claude Bernard What echo measurements are key prior to MitraClip? Eric Brochet,MD Cardiology Department Hopital Bichat Paris France No disclosure Conflict of interest Case 69 y.o man
Ο ΡΟΛΟΣ ΤΩΝ ΚΟΛΠΩΝ ΣΤΗ ΛΕΙΤΟΥΡΓΙΚΗ ΑΝΕΠΑΡΚΕΙΑ ΤΩΝ ΚΟΛΠΟΚΟΙΛΙΑΚΩΝ ΒΑΛΒΙΔΩΝ
 Ο ΡΟΛΟΣ ΤΩΝ ΚΟΛΠΩΝ ΣΤΗ ΛΕΙΤΟΥΡΓΙΚΗ ΑΝΕΠΑΡΚΕΙΑ ΤΩΝ ΚΟΛΠΟΚΟΙΛΙΑΚΩΝ ΒΑΛΒΙΔΩΝ Ανδρέας Κατσαρός Καρδιολόγος Επιµ. Α Καρδιοχειρ/κών Τµηµάτων Γ.Ν.Α. Ιπποκράτειο ΚΑΜΙΑ ΣΥΓΚΡΟΥΣΗ ΣΥΜΦΕΡΟΝΤΩΝ ΑΝΑΦΟΡΙΚΑ ΜΕ ΤΗΝ ΠΑΡΟΥΣΙΑΣΗ
Prognostic Impact of FMR
 Secondary Mitral Valve Regurgitation in Heart Failure, Age 60 Years From Medical Therapy to Surgical Repair to Transcatheter Intervention The Interventionalist s View Samin K Sharma, MD, FACC, FSCAI Director
Percutaneous mitral annuloplasty. Francesco Maisano MD, FESC San Raffaele Hospital Milano, Italy
 Percutaneous mitral annuloplasty Francesco Maisano MD, FESC San Raffaele Hospital Milano, Italy Disclosure Consultant for Abbott, Medtronic, St Jude, Edwards, ValtechCardio Founder of 4Tech Surgical techniques
Advanced Mitral Valve Therapies
 Advanced Mitral Valve Therapies Mahesh Ramchandani MD, FRCS Chief, Section of Cardiac Surgery A Largely Untreated Patient Population Mitral Regurgitation 2009 U.S. Prevalence Total MR Patients 1,2 4,100,000
Annular Stabilization Techniques in the Context of Aortic Valve Repair
 Annular Stabilization Techniques in the Context of Aortic Valve Repair Prashanth Vallabhajosyula, MD MS University of Pennsylvania, Philadelphia, Pennsylvania 2 nd North American Aortic Valve Repair Symposium
Σεμινάρια Ομάδων Εργασίας 2017 Ανεπάρκεια μιτροειδούς μυξωματώδους αιτιολογίας
 Σεμινάρια Ομάδων Εργασίας 2017 Ανεπάρκεια μιτροειδούς μυξωματώδους αιτιολογίας Μυτάς Δημήτρης MD, PhD Επιμ Α ΕΣΥ Σισμανόγλειο Γενικό Νοσοκομείο Αττικής Δηλώνω υπεύθυνα ότι η παρούσα ομιλία δεν επιχορηγείται
Transcatheter Mitral Innovations, Part II. Michael Mack, M.D. Baylor Scott & White Health
 Transcatheter Mitral Innovations, Part II Michael Mack, M.D. Baylor Scott & White Health Conflict of Interest Disclosure Co-PI of the COAPT Trial of MitraClip sponsored by Abbott Vascular Uncompensated
Imaging MV. Jeroen J. Bax Leiden University Medical Center The Netherlands Davos, feb 2015
 Imaging MV Jeroen J. Bax Leiden University Medical Center The Netherlands Davos, feb 2015 MV/MR: information needed on.. 1. MV anatomy 2. MR etiology - primary vs secondary 3. MR severity quantification
The production of murmurs is due to 3 main factors:
 Heart murmurs The production of murmurs is due to 3 main factors: high blood flow rate through normal or abnormal orifices forward flow through a narrowed or irregular orifice into a dilated vessel or
MEMO 3D. The true reflection of the mitral annulus. Natural physiological 3D motion
 MEMO 3D TM The true reflection of the mitral annulus Natural physiological 3D motion Imagine... if there was one annuloplasty ring that provided an optimal solution across the entire spectrum of mitral
Surgical repair techniques for IMR: future percutaneous options?
 Surgical repair techniques for IMR: can this teach us about future percutaneous options? Genk - Belgium Prof. Dr. R. Dion KULeu Disclosure slide Robert A. Dion I disclose the following financial relationships:
ΔΙΑΔΕΡΜΙΚΗ ΑΝΤΙΜΕΤΩΠΙΣΗ ΔΟΜΙΚΩΝ ΠΑΘΗΣΕΩΝ: Ο ΡΟΛΟΣ ΤΗΣ ΑΠΕΙΚΟΝΙΣΗΣ ΣΤΟ ΑΙΜΟΔΥΝΑΜΙΚΟ ΕΡΓΑΣΤΗΡΙΟ ΣΤΗΝ ΤΟΠΟΘΕΤΗΣΗ MITRACLIP
 ΔΙΑΔΕΡΜΙΚΗ ΑΝΤΙΜΕΤΩΠΙΣΗ ΔΟΜΙΚΩΝ ΠΑΘΗΣΕΩΝ: Ο ΡΟΛΟΣ ΤΗΣ ΑΠΕΙΚΟΝΙΣΗΣ ΣΤΟ ΑΙΜΟΔΥΝΑΜΙΚΟ ΕΡΓΑΣΤΗΡΙΟ ΣΤΗΝ ΤΟΠΟΘΕΤΗΣΗ MITRACLIP ΒΛΑΣΗΣ ΝΙΝΙΟΣ MD MRCP ΚΛΙΝΙΚΗ ΑΓΙΟΣ ΛΟΥΚΑΣ ΘΕΣΣΑΛΟΝΙΚΗ CONFLICT OF INTEREST PROCTOR
Basic principles of Rheumatic mitral valve Repair
 Basic principles of Rheumatic mitral valve Repair Prof. Gebrine El Khoury, MD DEPARTMENT OF CARDIOVASCULAR AND THORACIC SURGERY ST. LUC HOSPITAL - BRUSSELS, BELGIUM 1 Rheumatic MV disease MV repair confers
Percutaneous Valve Interventions. Percutaneous Valve Interventions
 Percutaneous Valve Interventions Stanton J. Rowe President, Percutaneous Valve Interventions Edwards is Best Positioned to Capitalize on Percutaneous Valve Opportunities #1 global valve replacement and
Finite Element Modeling of the Mitral Valve and Mitral Valve Repair
 Finite Element Modeling of the Mitral Valve and Mitral Valve Repair Iain Baxter A thesis submitted to the Faculty of Graduate and Postdoctoral Studies in partial fulfillment of the requirements for the
Introduction. Aortic Valve. Outflow Tract and Aortic Valve Annulus
 Chapter 1: Surgical anatomy of the aortic and mitral valves Jordan RH Hoffman MD, David A. Fullerton MD, FACC University of Colorado School of Medicine, Department of Surgery, Division of Cardiothoracic
MITRAL REGURGITATION ECHO PARAMETERS TOOL
 Comprehensive assessment of qualitative and quantitative parameters, along with the use of standardized nomenclature when reporting echocardiographic findings, helps to better define a patient s MR and
Valvular Heart Disease in Clinical Practice
 Valvular Heart Disease in Clinical Practice Michael Y. Henein Editor Valvular Heart Disease in Clinical Practice 123 Editor Michael Y. Henein Consultant Cardiologist Umea Heart Centre Umea University
Mitral Regurgitation
 Mitral Regurgitation Focus on Percutaneous Repair Steven J. Yakubov, MD FACC FSCAI System Chief, Structural Heart Diseaese, OhioHealth John H. McConnell Chair of Advanced Structural Heart Disease Medical
MitraClip World Wide Commercial Experience
 MitraClip World Wide Commercial Experience Valves Repaired. Lives Improved. Carlos G. Hernandez, MBA Sr. Product Manager, Strategic Planning Abbott Vascular October, 2014 MitraClip Transcatheter Mitral
Percutaneous mitral valve repair: The MitraClip device
 OPEN ACCESS 1 St Mary Medical Center, Community HealthCare Network, Hobart, IN 2 Rush Center for Structural Heart Disease, Rush University Medical Center, Chicago, IL 3 Sidra Cardiovascular Center of Excellence,
Professor and Chief, Division of Cardiac Surgery Chief Medical Officer, Harpoon Medical. The Houston Aortic Symposium February 23-25, 2017
 James S. Gammie, MD Professor and Chief, Division of Cardiac Surgery Chief Medical Officer, Harpoon Medical The Houston Aortic Symposium February 2-25, 2017 Disclosure Statement of Financial Interest Within
When should we intervene surgically in pediatric patient with MR?
 When should we intervene surgically in pediatric patient with MR? DR.SAUD A. BAHAIDARAH CONSULTANT, PEDIATRIC CARDIOLOGY ASSISTANT PROFESSOR OF PEDIATRICS HEAD OF CARDIOLOGY AND CARDIAC SURGERY UNIT KAUH
Mitral regurgitation (MR) is the second most
 is the second most") Current Options for Mitral Annuloplasty and Leaflet Repair The benefits and limitations of today s FDA- and CE Mark approved mitral repair technologies. BY ROBERT SCHUELER, MD, AND JAN-MALTE SINNING, MD,
Current Options for Mitral Annuloplasty and Leaflet Repair The benefits and limitations of today s FDA- and CE Mark approved mitral repair technologies. BY ROBERT SCHUELER, MD, AND JAN-MALTE SINNING, MD,
Rheumatic fever and rheumatic heart disease still remain a. The Rheumatic Mitral Valve and Repair Techniques in Children. Afksendiyos Kalangos
 The Rheumatic Mitral Valve and Repair Techniques in Children Afksendiyos Kalangos The mitral valve is the most commonly affected valve in acute and chronic rheumatic heart disease in the first and second
Transcatheter Mitral Valve Replacement How Close Are We?
 Transcatheter Mitral Valve Replacement How Close Are We? Gregory Pavlides, MD, PhD, FACC, FESC Professor of Medicine Miscia Chair of Interventional Cardiology Director, Cardiac Catheterization Laboratories,
Two semilunar valves. Two atrioventricular valves. Valves of the heart. Left atrioventricular or bicuspid valve Mitral valve
 The Heart 3 Valves of the heart Two atrioventricular valves Two semilunar valves Right atrioventricular or tricuspid valve Left atrioventricular or bicuspid valve Mitral valve Aortic valve Pulmonary valve
SURGICAL AND TRANSCATHETER MITRAL VALVE REPLACEMENT VS. REPAIR: COMPETITION OR SYNERGY
 SURGICAL AND TRANSCATHETER MITRAL VALVE REPLACEMENT VS. REPAIR: COMPETITION OR SYNERGY Michael J. Reardon, M.D. Professor of Cardiothoracic Surgery Allison Family Distinguish Chair of Cardiovascular Research
MITRAL STENOSIS. Joanne Cusack
 MITRAL STENOSIS Joanne Cusack BSE Breakdown Recognition of rheumatic mitral stenosis Qualitative description of valve and sub-valve calcification and fibrosis Measurement of orifice area by planimetry
Choosing the Right Treatment for Primary Mitral Regurgitation ΓΡΗΓΟΡΙΟΣ ΠΑΤΤΑΚΟΣ, MD, MS Καρδιοχειρουργός Β Κ/Χ Κλινικής Αναπλ. Διευθ.
 Choosing the Right Treatment for Primary Mitral Regurgitation ΓΡΗΓΟΡΙΟΣ ΠΑΤΤΑΚΟΣ, MD, MS Καρδιοχειρουργός Β Κ/Χ Κλινικής Αναπλ. Διευθ. Διαδερμικών Βαλβίδων Δ.Θ.Κ.Α. «ΥΓΕΙΑ» Mitral Regurgitation Very common
Transcatheter Mitral & Tricuspid Therapies. Bernard J. Zovighian Corporate Vice President
 Transcatheter Mitral & Tricuspid Therapies Bernard J. Zovighian Corporate Vice President We Will Lead and Transform Treatment for Patients with Mitral and Tricuspid Diseases Mitral and Tricuspid Diseases
LV FUNCTION ASSESSMENT: WHAT IS BEYOND EJECTION FRACTION
 LV FUNCTION ASSESSMENT: WHAT IS BEYOND EJECTION FRACTION Jamilah S AlRahimi Assistant Professor, KSU-HS Consultant Noninvasive Cardiology KFCC, MNGHA-WR Introduction LV function assessment in Heart Failure:
THE FOLDING LEAFLET. Rafael García Fuster. Cardiac Surgery Department University General Hospital of Valencia
 THE FOLDING LEAFLET Rafael García Fuster Cardiac Surgery Department University General Hospital of Valencia School of Medicine Catholic University of Valencia San Vicente Mártir SPAIN Carpentier s principles
The production of murmurs is due to 3 main factors:
 Heart murmurs The production of murmurs is due to 3 main factors: high blood flow rate through normal or abnormal orifices forward flow through a narrowed or irregular orifice into a dilated vessel or
Really Less-Invasive Trans-apical Beating Heart Mitral Valve Repair: Which Patients?
 Really Less-Invasive Trans-apical Beating Heart Mitral Valve Repair: Which Patients? David H. Adams, MD Cardiac Surgeon-in-Chief Mount Sinai Health System Marie Josée and Henry R. Kravis Professor and
NATIONAL INSTITUTE FOR HEALTH AND CLINICAL EXCELLENCE
 NATIONAL INSTITUTE FOR HEALTH AND CLINICAL EXCELLENCE INTERVENTIONAL PROCEDURES PROGRAMME Interventional procedure overview of percutaneous mitral valve leaflet repair for mitral regurgitation Mitral regurgitation
HOW IMPORTANT ARE THESE ECHO MEASUREMENTS ANYWAY?
 HOW IMPORTANT ARE THESE ECHO MEASUREMENTS ANYWAY? John D. Carroll, MD Professor, Director of Interventional Cardiology and Co-Medical Director of the Cardiac and Vascular Center, University of Colorado
3D Printing & Echocardiography
 ASE SOTA Feb 19, 2018 3D Printing & Echocardiography Stephen H. Little, MD John S. Dunn Chair in Cardiovascular Research and Education, Associate professor, Weill Cornell Medicine Disclosures Personal
Echocardiographic Evaluation of the Cardiomyopathies. Stephanie Coulter, MD, FACC, FASE April, 2016
 Echocardiographic Evaluation of the Cardiomyopathies Stephanie Coulter, MD, FACC, FASE April, 2016 Cardiomyopathies (CMP) primary disease intrinsic to cardiac muscle Dilated CMP Hypertrophic CMP Infiltrative
Catheter-based mitral valve repair MitraClip System
 Percutaneous Mitral Valve Repair: Results of the EVEREST II Trial William A. Gray MD Director of Endovascular Services Associate Professor of Clinical Medicine Columbia University Medical Center The Cardiovascular
I (312) Mitral Regurgitation What Should You Know?
 Mitral Regurgitation What Should You Know?") Mitral Regurgitation What Should You Know? Table of Contents What is Mitral Regurgitation? 3 What are the Symptoms? 4 What are the risks? 5 Who Gets Mitral Regurgitation? 6 Diagnosing Mitral Regurgitation
Mitral Regurgitation What Should You Know? Table of Contents What is Mitral Regurgitation? 3 What are the Symptoms? 4 What are the risks? 5 Who Gets Mitral Regurgitation? 6 Diagnosing Mitral Regurgitation
Primary Mitral Valve Disease: Natural History & Triggers for Intervention ACC Latin American Conference 2017
 Disclosures: GE stock, Primary Mitral Valve Disease: Natural History & Triggers for Intervention ACC Latin American Conference 2017 Athena Poppas, MD FACC Past ACC Scientific Sessions Chair, ACC Board
Use of MitraClip Beyond Everest Criteria
 Use of MitraClip Beyond Everest Criteria Takashi Matsumoto, MD Sendai Kousei Hospital Sendai, Japan No Disclosure of Financial Interest Introduction The efficacy and safety of the MitraClip therapy was
There is increasing acceptance of the value of reconstructing
 Fleur de Lys Repair of Posterior Mitral Valve Leaflet Richard A. Hopkins, MD There is increasing acceptance of the value of reconstructing mitral valves and retaining the various components of the mitral
My Choice For Percutaneous Mitral Valve Replacement. Jose Luis Navia, MD.
 My Choice For Percutaneous Mitral Valve Replacement Jose Luis Navia, MD. Disclosure Edwards Lifescienses St. Jude Medical MAQUET NaviGate Consultant, Investigator Consultant, Investigator Consultant, Investigator
Surgery For Ebstein Anomaly
 Surgery For Ebstein Anomaly Christian Pizarro, MD Chief, Pediatric Cardiothoracic Surgery Director, Nemours Cardiac Center Alfred I. dupont Hospital for Children Professor of Surgery and Pediatrics Sidney
A new era in cardiac valve surgery has begun...
 THE CENTER FOR VALVE SURGERY A new era in cardiac valve surgery has begun... Good Help to Those in Need Rawn Salenger, MD, FACS, Director, The Center for Valve Surgery Edward F. Lundy, MD, PhD, Chief of
Mitral Valve Repair for Functional Mitral Regurgitation- Description of A New Technique and Classification System
 Case Report Mitral Valve Repair for Functional Mitral Regurgitation- Description of A New Technique and Classification System Antonio Chiricolo 1*, Leonard Y Lee 2 1 Department of Anesthesiology, Rutgers
Iatrogenic pathology of the heart:
 Iatrogenic pathology of the heart: Complications of mitral valve plasty and replacement Patrick Bruneval D pt of Pathology Hôpital Européen Georges Pompidou Enterprise Interest None Mitral valve surgery
Update on Percutaneous Therapies for Structural Heart Disease. William Thomas MD Director of Structural Heart Program Tucson Medical Center
 Update on Percutaneous Therapies for Structural Heart Disease William Thomas MD Director of Structural Heart Program Tucson Medical Center NCVH 2014- Tucson Disclosure of Financial Interest Research: Stock
the Cardiovascular System I
 the Cardiovascular System I By: Dr. Nabil A Khouri MD, MsC, Ph.D MEDIASTINUM 1. Superior Mediastinum 2. inferior Mediastinum Anterior mediastinum. Middle mediastinum. Posterior mediastinum Anatomy of
Indications and Late Results of Aortic Valve Repair
 Indications and Late Results of Aortic Valve Repair Prof. Gebrine El Khoury Department of Cardiovascular and Thoracic Surgery Cliniques St. Luc Brussels, Belgium Aortic Valve Repair Question # 1 Can the
ΓΙΩΡΓΟΣ ΜΑΚΑΒΟΣ, MD, PhD ΚΑΡΔΙΟΛΟΓΟΣ, ΕΠΙΜΕΛΗΤΗΣ Β Γ ΠΑΝΕΠΙΣΤΗΜΙΑΚΗ ΚΑΡΔΙΟΛΟΓΙΚΗ ΚΛΙΝΙΚΗ Γ.Ν.Ν.Θ.Α. ΣΩΤΗΡΙΑ
 ΓΙΩΡΓΟΣ ΜΑΚΑΒΟΣ, MD, PhD ΚΑΡΔΙΟΛΟΓΟΣ, ΕΠΙΜΕΛΗΤΗΣ Β Γ ΠΑΝΕΠΙΣΤΗΜΙΑΚΗ ΚΑΡΔΙΟΛΟΓΙΚΗ ΚΛΙΝΙΚΗ Γ.Ν.Ν.Θ.Α. ΣΩΤΗΡΙΑ Causes of TR Primary-Organic Secondary-Functional Rheumatic LV,valvular dysfunction I.Endocarditis
Ischemic Mitral Regurgitation
 Ischemic Mitral Regurgitation Jean-Louis J. Vanoverschelde, MD, PhD Université catholique de Louvain Brussels, Belgium Definition Ischemic mitral regurgitation is mitral regurgitation due to complications
Tricuspid Valve Repair for Ebstein's Anomaly
 Tricuspid Valve Repair for Ebstein's Anomaly Joseph A. Dearani, MD, and Gordon K. Danielson, MD E bstein's anomaly is a malformation of the tricuspid valve and right ventricle that is characterized by
Transcatheter Mitral Valve for fmr: The Era of Too Many Options
 Transcatheter Mitral Valve for fmr: The Era of Too Many Options Isaac George, M.D. Surgical Director, Structural Heart & Valve Center Assistant Professor of Surgery Columbia University Medical Center Disclosure
Transcatheter mitral valve repair is considered investigational in all situations.
 2.02.30 Transcatheter Mitral Valve Repair Section 2.0 Medicine Subsection 2.02 Cardiology Description Effective Date September 30, 20114 Original Policy Date September 30, 2014 Next Review Date September