The Electrocardiogram part II. Dr. Adelina Vlad, MD PhD
|
|
|
- Dorthy Webb
- 5 years ago
- Views:
Transcription
1 The Electrocardiogram part II Dr. Adelina Vlad, MD PhD
2 Basic Interpretation of the ECG 1) Evaluate calibration 2) Calculate rate 3) Determine rhythm 4) Determine QRS axis 5) Measure intervals 6) Analyze the morphology and interrelation of ECG elements (P, P-Q, Q, QRS, ST, T, QT) in frontal and in precordial leads OR 6) Asses for Hypertrophy 7) Look for evidence of Infarction


3 1) Voltage and Time Calibration Vertically One small box mv Two large boxes 1mV Horizontally One small box s One large box s
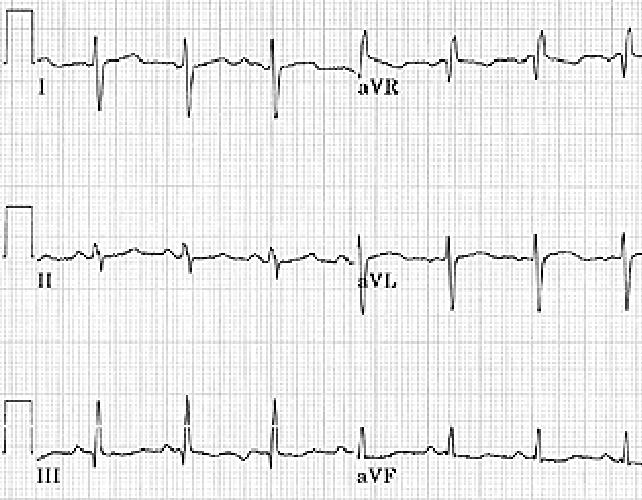
4 The direct method 2) Calculate Rate Heart rate = nr. heart beats / min = 60 s/ duration of cardiac cycle One cardiac cycle measures the number of seconds between waves of the same type, for example, the R-R interval R R = 16 x 0.04 = 0.64 Rate = 60/ 0.64 = 94 beats/min

5 Calculate Rate R wave The quick method Find a R wave that lands on a bold line Count the number of large boxes to the next R wave. If the second R wave is 1 large box away the rate is 300, 2 boxes - 150, 3 boxes - 100, 4 boxes - 75, etc. (cont) A bit less than 100 beats/min 94 beats/min
6 3) Rhythm Analysis Questions to be answered for assessing the heart rhythm: Where is the heart s pacemaker? What is the conduction path from the pacemaker to the last cell in the ventricles? Is the pacemaker functioning regularly and at the correct rate?
7 Step 1: Step 2: Step 3: Step 4: Step 5: Calculate rate Determine regularity Assess the P waves Determine PR interval Determine QRS duration
8 Step 2: Determine regularity R R Look at the R-R distances (using a caliper or markings on a pen or paper) Regular (are they equidistant apart)? Occasionally irregular? Regularly irregular? Irregularly irregular? Interpretation? Regular
9 Step 3: Assess the P waves Are there P waves? Do the P waves all look alike and have the normal polarity? Do the P waves occur at a regular rate? Is there one P wave before each QRS? Interpretation? Normal P waves with 1 P wave for every QRS
10 Step 4: Determine PR interval Normal: seconds. (3-5 boxes) Interpretation? 0.12 seconds
11 Step 5: QRS duration Normal: seconds (1-3 boxes) Interpretation? 0.08 seconds
12 Rhythm Summary Rate Regularity P waves PR interval QRS duration bpm regular normal 0.12 s 0.08 s Interpretation? Normal Sinus Rhythm
13 NSR Parameters Rate Regularity P waves PR interval QRS duration bpm regular normal s s Any deviation from above is sinus tachycardia, sinus bradycardia or an arrhythmia

14 4) Determine QRS Axis (The Electrical Axis of the Heart) Is the axis of the mean force during ventricular activation, measured in the frontal plane = mean QRS vector in the frontal plane Equals the sum of instantaneous activation vectors (corresponding to septum, apex, free walls and base activation)
15 It is estimated by analyzing QRS complexes in two leads of the frontal plane Two approaches can be used The geometric method, accurate but more elaborate The inspection method, quicker and easier, sufficiently accurate for clinical purposes
16 1 Measure magnitude of QRS 5 Estimate axis of yellow arrow (about 95 ) Geometric Method
17 Each wave of the QRS complex in a lead represents the projection of a momentum ventricular activation vector on that lead The algebraic sum of the amplitudes of QRS waves in a limb lead represents the projection of the mean ventricular activation vector (mean QRS vector or QRS axis) on the axis of that specific lead Perpendiculars raised from the peak of mean QRS projections on the axis of two limb leads (draw as part of the hexaxial reference system) will cross each other in a point that marks the peak of the mean QRS vector By connecting the center of the hexaxial reference system (tail of vector) to the intersection of the two perpendicular lines (head of vector) it will result the image of the QRS axis, with its orientation; normal values: between -30 and +90 degrees
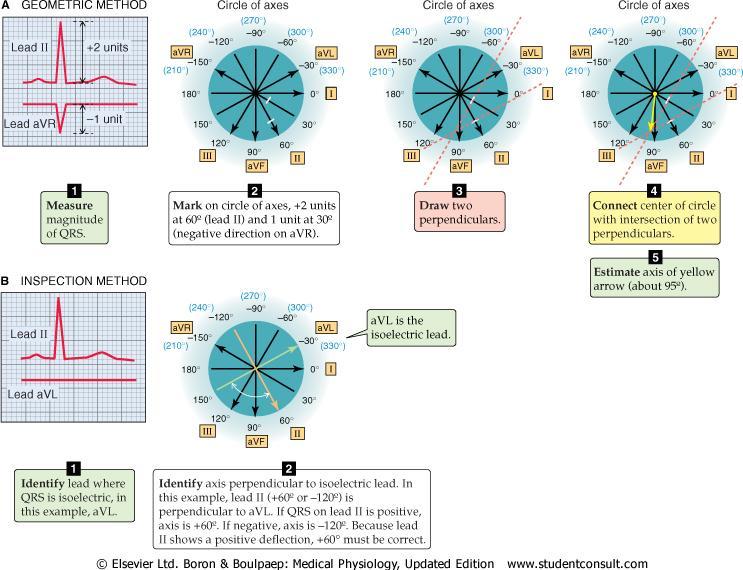
18 Inspection Method
19 The QRS axis is perpendicular to the limb lead with a null or very small QRS net amplitude; an equidiphasic complex has the net amplitude 0, no matter how large the RS waves are The QRS axis is parallel to the limb lead with the highest QRS net amplitude The two limb leads mentioned above should be perpendicular to one another
20 +50
21 +30

22 If there is no lead with a QRS net amplitude zero or close to zero, find two leads separated by a 30 angle, onto which the QRS are of maximal and similar magnitude The QRS axis is oriented half way between those two leads +15
23 0
24 +120
25 Normal and Abnormal QRS Axis The normal QRS axis lies between -30 o and +90 o. A QRS axis that falls between -30 o and -90 o is abnormal and called left axis deviation o -120 o o -90 o -60 o -30 o A QRS axis that falls between +90 o and +150 o is abnormal and called right axis deviation. 180 o 150 o 30 o 0 o A QRS axis that falls between +150 o and -90 o is abnormal and called superior right axis deviation. 120 o o 90 o 60 o
.")

26 Left Axis Deviation Left axis deviation in a hypertensive heart (hypertrophic left ventricle). Note the slightly prolonged QRS complex as well. Left axis deviation caused by left bundle branch block. Note also the greatly prolonged QRS complex.


27 Right Axis Deviation High-voltage electrocardiogram in congenital pulmonary valve stenosis with right ventricular hypertrophy. Superior right axis deviation and a slightly prolonged QRS complex also are seen. Right axis deviation caused by right bundle branch block. Note also the greatly prolonged QRS complex.
28 5) Calculate Intervals Intervals refers to the length of the PR and QT intervals and the width of the QRS complexes PR interval < 0.12 s s > 0.20 s High catecholamine states Wolff-Parkinson-White Normal AV nodal blocks Wolff-Parkinson-White 1st Degree AV Block
29 QRS complex < 0.10 s s > 0.12 s Normal Incomplete bundle branch block Bundle branch block PVC Ventricular rhythm Incomplete bundle branch block 3 rd degree AV block with ventricular escape rhythm

30 QTc interval < 0.44 s > 0.44 s Long QT Normal Long QT Torsades de Pointes A prolonged QT can be very dangerous. It may predispose an individual to a type of ventricular tachycardia called Torsades de Pointes. Causes include drugs, electrolyte abnormalities, CNS disease, post-mi, and congenital heart disease.

31 QT = 0.40 s RR = 0.68 s Square root of RR = 0.82 QTc = 0.40/0.82 = 0.49 s PR interval? QRS width? QTc interval? 0.16 seconds 0.08 seconds 0.49 seconds Interpretation of intervals? Normal PR and QRS, long QT


32 RR 23 boxes 17 boxes 10 boxes QT 13 boxes Normal QT Long QT QTc = QT/ RR Tip: Instead of calculating the QTc, a quick way to estimate if the QT interval long is to use the following rule: A QT > half of the RR interval is probably long
33 6) Hypertrophy The ECG can reveal enlargement or hypertrophy of the four chambers of the heart: Right atrial enlargement (RAE) Left atrial enlargement (LAE) Right ventricular hypertrophy (RVH) Left ventricular hypertrophy (LVH)
34 Ventricular Hypertrophy Due to a pressure or volume load ECG abnormalities High voltage R, S waves QRS axis deviation Increased intrinsecoid deflection T-wave inversions
35 7) Look for Evidence of Infarction When analyzing a 12-lead ECG for evidence of an infarction one looks for the following: Abnormal Q waves ST elevation or depression Peaked, flat or inverted T waves ST elevation (or depression) in at least two leads is the earliest and most consistent ECG finding during AMI There are ST elevation (Q-wave) and non-st elevation (non-q wave) MIs

36 ST Elevation Elevation of the ST segment in at least 2 leads is consistent with a myocardial infarction Because blood flow is regional, the area of infarction are also regional specific ECG leads can provide the best view of the infarcted area

37 Views of the Heart Some leads get a good view of the: Anterior portion of the heart Leads V1 V4 Lateral portion of the heart Leads I, avl, V5, V6 Inferior portion of the heart Leads II, III, avf

38 Anterior Wall MI Can be recognized if there are changes in leads V 1 - V 4 that are consistent with a myocardial infarction

39 Inferior Wall MI ST segment is elevated in leads II, III and avf
 and the lateral wall (V 5 -V 6, I, and avl)!")
40 Anterolateral MI This person s MI involves both the anterior wall (V 2 -V 4 ) and the lateral wall (V 5 -V 6, I, and avl)!
41 8) Others Drug effects (digitalis, class 1 and 3 antiarrhythmic agents, psychotropic drugs etc.) Electrolyte and metabolic abnormalities (Ca, K, Mg, ph etc.) Etc
42 Specialized ECG Tests Additional precordial leads help diagnose right ventricular and posterior wall MI (V1R V6R; V8, V9) Esophageal lead for better recording atrial activity or to monitor intraoperative myocardial ischemia Holter monitoring continuous monitoring and recording of the ECG, blood pressure or both for h; ECG evaluates intermittent arrhythmias Event recordings up to 30 days, can detect infrequent rhythm disturbances that a Holter monitoring may miss; the recorder is activated by the patient when symptoms occur Continuous ST-segment monitoring early detection of ischemia and serious arrhythmias (emergency unit, intraoperative monitoring, postoperative care)
Pathologic ECG. Adelina Vlad, MD PhD
 Pathologic ECG Adelina Vlad, MD PhD Basic Interpretation of the ECG 1) Evaluate calibration 2) Calculate rate 3) Determine rhythm 4) Determine QRS axis 5) Measure intervals 6) Analyze the morphology and
ECG INTERPRETATION MANUAL
 Lancashire & South Cumbria Cardiac Network ECG INTERPRETATION MANUAL THE NORMAL ECG Lancashire And South Cumbria Cardiac Physiologist Training Manual THE NORMAL ECG E.C.G CHECKLIST 1) Name, Paper Speed,
ECG ABNORMALITIES D R. T AM A R A AL Q U D AH
 ECG ABNORMALITIES D R. T AM A R A AL Q U D AH When we interpret an ECG we compare it instantaneously with the normal ECG and normal variants stored in our memory; these memories are stored visually in
Introduction to ECG Gary Martin, M.D.
 Brief review of basic concepts Introduction to ECG Gary Martin, M.D. The electrical activity of the heart is caused by a sequence of rapid ionic movements across cell membranes resulting first in depolarization
ELECTROCARDIOGRAPH. General. Heart Rate. Starship Children s Health Clinical Guideline
 General Heart Rate QRS Axis T Wave Axis PR Interval according to Heart Rate & Age P Wave Duration and Amplitude QRS Duration according to Age QT Interval R & S voltages according to Lead & Age R/S ratio
12-Lead ECG Interpretation. Kathy Kuznar, RN, ANP
 12-Lead ECG Interpretation Kathy Kuznar, RN, ANP The 12-Lead ECG Objectives Identify the normal morphology and features of the 12- lead ECG. Perform systematic analysis of the 12-lead ECG. Recognize abnormalities
General Introduction to ECG. Reading Assignment (p2-16 in PDF Outline )
") General Introduction to ECG Reading Assignment (p2-16 in PDF Outline ) Objectives 1. Practice the 5-step Method 2. Differential Diagnosis: R & L axis deviation 3. Differential Diagnosis: Poor R-wave progression
General Introduction to ECG Reading Assignment (p2-16 in PDF Outline ) Objectives 1. Practice the 5-step Method 2. Differential Diagnosis: R & L axis deviation 3. Differential Diagnosis: Poor R-wave progression
REtrive. REpeat. RElearn Design by. Test-Enhanced Learning based ECG practice E-book
 Test-Enhanced Learning Test-Enhanced Learning Test-Enhanced Learning Test-Enhanced Learning based ECG practice E-book REtrive REpeat RElearn Design by S I T T I N U N T H A N G J U I P E E R I Y A W A
Pennsylvania Academy of Family Physicians Foundation & UPMC 43rd Refresher Course in Family Medicine CME Conference March 10-13, 2016
 Pennsylvania Academy of Family Physicians Foundation & UPMC 43rd Refresher Course in Family Medicine CME Conference March 10-13, 2016 Disclosures: EKG Workshop Louis Mancano, MD Speaker has no disclosures
ECG Interpretation Made Easy
 ECG Interpretation Made Easy Dr. A Tageldien Abdellah, MSc MD EBSC Lecturer of Cardiology- Hull University Hull York Medical School 2007-2008 ECG Interpretation Made Easy Synopsis Benefits Objectives Process
Ekg pra pr c a tice D.HAMMOUDI.MD
 Ekg practice D.HAMMOUDI.MD Anatomy Revisited RCA (Right Coronary Artery) Right ventricle Inferior wall of LV Posterior wall of LV (75%) SA Node (60%) AV Node (>80%) LCA (Left Coronary Artery) Septal wall
Electrocardiography Abnormalities (Arrhythmias) 7. Faisal I. Mohammed, MD, PhD
 7. Faisal I. Mohammed, MD, PhD") Electrocardiography Abnormalities (Arrhythmias) 7 Faisal I. Mohammed, MD, PhD 1 Causes of Cardiac Arrythmias Abnormal rhythmicity of the pacemaker Shift of pacemaker from sinus node Blocks at different
Electrocardiography Abnormalities (Arrhythmias) 7 Faisal I. Mohammed, MD, PhD 1 Causes of Cardiac Arrythmias Abnormal rhythmicity of the pacemaker Shift of pacemaker from sinus node Blocks at different
Section V. Objectives
 Section V Landscape of an MI Objectives At the conclusion of this presentation the participant will be able to Outline a systematic approach to 12 lead ECG interpretation Demonstrate the process for determining
Please check your answers with correct statements in answer pages after the ECG cases.
 ECG Cases ECG Case 1 Springer International Publishing AG, part of Springer Nature 2018 S. Okutucu, A. Oto, Interpreting ECGs in Clinical Practice, In Clinical Practice, https://doi.org/10.1007/978-3-319-90557-0
ECG interpretation basics
 ECG interpretation basics Michał Walczewski, MD Krzysztof Ozierański, MD 21.03.18 Electrical conduction system of the heart Limb leads Precordial leads 21.03.18 Precordial leads Precordial leads 21.03.18
Appendix D Output Code and Interpretation of Analysis
 Appendix D Output Code and Interpretation of Analysis 8 Arrhythmia Code No. Description 8002 Marked rhythm irregularity 8110 Sinus rhythm 8102 Sinus arrhythmia 8108 Marked sinus arrhythmia 8120 Sinus tachycardia
Paediatric ECG Interpretation
 Paediatric ECG Interpretation Dr Sanj Fernando (thanks to http://lifeinthefastlane.com/ecg-library/paediatric-ecginterpretation/) 3 yo boy complaining of abdominal pain and chest pain Child ECG vs Adult
DR QAZI IMTIAZ RASOOL OBJECTIVES
 PRACTICAL ELECTROCARDIOGRAPHY DR QAZI IMTIAZ RASOOL OBJECTIVES Recording of electrical events in heart Established electrode pattern results in specific tracing pattern Health of heart i. e. Anatomical
Electrical System Overview Electrocardiograms Action Potentials 12-Lead Positioning Values To Memorize Calculating Rates
 Electrocardiograms Electrical System Overview James Lamberg 2/ 74 Action Potentials 12-Lead Positioning 3/ 74 4/ 74 Values To Memorize Inherent Rates SA: 60 to 100 AV: 40 to 60 Ventricles: 20 to 40 Normal
UNDERSTANDING YOUR ECG: A REVIEW
 UNDERSTANDING YOUR ECG: A REVIEW Health professionals use the electrocardiograph (ECG) rhythm strip to systematically analyse the cardiac rhythm. Before the systematic process of ECG analysis is described
Proceedings of the World Small Animal Veterinary Association Sydney, Australia 2007
 Proceedings of the World Small Animal Sydney, Australia 2007 Hosted by: Next WSAVA Congress ECG INTERPRETATION Adrian Boswood MA VetMB DVC DECVIM-CA(Cardiology) MRCVS The Royal Veterinary College, Hawkshead
Introduction to Electrocardiography
 Introduction to Electrocardiography Class Objectives: Introduction to ECG monitoring Discuss principles of interpretation Identify the components and measurements of the ECG ECG analysis ECG Monitoring
ECG CONVENTIONS AND INTERVALS
 1 ECG Waveforms and Intervals ECG waveforms labeled alphabetically P wave== represents atrial depolarization QRS complex=ventricular depolarization ST-T-U complex (ST segment, T wave, and U wave)== V repolarization.
Family Medicine for English language students of Medical University of Lodz ECG. Jakub Dorożyński
 Family Medicine for English language students of Medical University of Lodz ECG Jakub Dorożyński Parts of an ECG The standard ECG has 12 leads: six of them are considered limb leads because they are placed
ECG. Prepared by: Dr.Fatima Daoud Reference: Guyton and Hall Textbook of Medical Physiology,12 th edition Chapters: 11,12,13
 ECG Prepared by: Dr.Fatima Daoud Reference: Guyton and Hall Textbook of Medical Physiology,12 th edition Chapters: 11,12,13 The Concept When the cardiac impulse passes through the heart, electrical current
EKG. Danil Hammoudi.MD
 EKG Danil Hammoudi.MD What is an EKG? The electrocardiogram (EKG) is a representation of the electrical events of the cardiac cycle. Each event has a distinctive waveform, the study of which can lead to
Electrocardiogram ECG. Hilal Al Saffar FRCP FACC College of medicine,baghdad University
 Electrocardiogram ECG Hilal Al Saffar FRCP FACC College of medicine,baghdad University Tuesday 29 October 2013 ECG introduction Wednesday 30 October 2013 Abnormal ECG ( ischemia, chamber hypertrophy, heart
ECG Interpretation Cat Williams, DVM DACVIM (Cardiology)
") ECG Interpretation Cat Williams, DVM DACVIM (Cardiology) Providing the best quality care and service for the patient, the client, and the referring veterinarian. GOAL: Reduce Anxiety about ECGs Back to
ECG Interpretation Cat Williams, DVM DACVIM (Cardiology) Providing the best quality care and service for the patient, the client, and the referring veterinarian. GOAL: Reduce Anxiety about ECGs Back to
Understanding basics of EKG
 Understanding basics of EKG By Alula A.(R III) www.le.ac.uk Topic for discussion Understanding of cellular electrophysiology Basics Rate Rhythm Axis Intervals P wave QRS ST/T wave Abnormal EKGs Understanding
CARDIOVASCULAR PHYSIOLOGY ECG. Dr. Ana-Maria Zagrean
 CARDIOVASCULAR PHYSIOLOGY ECG Dr. Ana-Maria Zagrean Electrocardiogram (ECG) ECG is a non-invasive method to record at the body surface the electrical activity of the heart. - the rate and regularity of
ECGs: Everything a finalist needs to know. Dr Amy Coulden As part of the Simply Finals series
 ECGs: Everything a finalist needs to know Dr Amy Coulden As part of the Simply Finals series Aims and objectives To be able to interpret basic ECG abnormalities To be able to recognise commonly tested
Basic electrocardiography reading. R3 lee wei-chieh
 Basic electrocardiography reading R3 lee wei-chieh The Normal Conduction System Lead Placement avf Limb Leads Precordial Leads Interpretation Rate Rhythm Interval Axis Chamber abnormality QRST change What
Lect.6 Electrical axis and cardiac vector Cardiac vector: net result Vector that occurs during depolarization of the ventricles Figure:
 Lect.6 Electrical axis and cardiac vector Objectives: 1. State the relationship between the direction of cardiac vector with the direction (-ve, +ve) and amplitude of an ECG waves. 2. Draw diagram indicting
Supraventricular Arrhythmias. Reading Assignment. Chapter 5 (p17-30)
") Supraventricular Arrhythmias Reading Assignment Chapter 5 (p17-30) The Supraventricular Rhythms In Our Lives Site of Origin Single Events Slow Rates Intermediate Rates Fast Rates (>100 bpm) Sinus Sinus
Supraventricular Arrhythmias Reading Assignment Chapter 5 (p17-30) The Supraventricular Rhythms In Our Lives Site of Origin Single Events Slow Rates Intermediate Rates Fast Rates (>100 bpm) Sinus Sinus
5- The normal electrocardiogram (ECG)
") 5- The (ECG) Introduction Electrocardiography is a process of recording electrical activities of heart muscle at skin surface. The electrical current spreads into the tissues surrounding the heart, a small
5- The (ECG) Introduction Electrocardiography is a process of recording electrical activities of heart muscle at skin surface. The electrical current spreads into the tissues surrounding the heart, a small
also aid the clinician in recognizing both the obvious and subtle abnormalities that may help guide therapy.
 Karen Lieberman, MS, CRNP f the many diagnostic tools used to screen for and evaluate cardiac abnormalities, the 12-lead electrocardiogram (ECG) is among the most basic. This inexpensive and noninvasive
Other 12-Lead ECG Findings
 Other 12-Lead ECG Findings Left Atrial Enlargement Left atrial enlargement is illustrated by increased P wave duration in lead II, top ECG, and by the prominent negative P terminal force in lead V1, bottom
12 Lead ECG Skills: Building Confidence for Clinical Practice. Presented By: Cynthia Webner, BSN, RN, CCRN-CMC. Karen Marzlin, BSN, RN,CCRN-CMC
 12 Lead ECG Skills: Building Confidence for Clinical Practice NTI 2009 Preconference Session 803 Presented By: Karen Marzlin, BSN, RN,CCRN-CMC 1 12 Lead ECG Fundamentals: The Starting Place for Linking
Electrocardiography for Healthcare Professionals. Chapter 14 Basic 12-Lead ECG Interpretation
 Electrocardiography for Healthcare Professionals Chapter 14 Basic 12-Lead ECG Interpretation 2012 The Companies, Inc. All rights reserved. Learning Outcomes 14.1 Discuss the anatomic views seen on a 12-lead
CASE 10. What would the ST segment of this ECG look like? On which leads would you see this ST segment change? What does the T wave represent?
 CASE 10 A 57-year-old man presents to the emergency center with complaints of chest pain with radiation to the left arm and jaw. He reports feeling anxious, diaphoretic, and short of breath. His past history
6/19/2018. Background Athlete s heart. Ultimate question. Applying the International Criteria for ECG
 Applying the International Criteria for ECG Interpretation in Athletes to a preparticipation screening program DAVE SIEBERT, MD, CAQSM ASSISTANT PROFESSOR DEPARTMENT OF FAMILY MEDICINE UNIVERSITY OF WASHINGTON
This presentation will deal with the basics of ECG description as well as the physiological basics of
 Snímka 1 Electrocardiography basics This presentation will deal with the basics of ECG description as well as the physiological basics of Snímka 2 Lecture overview 1. Cardiac conduction system functional
Determining Axis and Axis Deviation on an ECG
 Marquette University e-publications@marquette Physician Assistant Studies Faculty Research and Publications Health Sciences, College of 7-15-2010 Determining Axis and Axis Deviation on an ECG Patrick Loftis
Relax and Learn At the Farm 2012
 Relax and Learn At the Farm 2012 Session 2: 12 Lead ECG Fundamentals 101 Cynthia Webner DNP, RN, CCNS, CCRN-CMC, CHFN Though for Today Mastery is not something that strikes in an instant, like a thunderbolt,
- why the T wave is deflected upwards although it's a repolarization wave?
 Cardiac Electrograph: - why the T wave is deflected upwards although it's a repolarization wave? After depolarization the ventricle contracts but since the heart is a volume conductor (3D not 2D), when
ECG SIGNS OF HYPERTROPHY OF HEART ATRIUMS AND VENTRICLES
 Ministry of Health of Ukraine Kharkiv National Medical University ECG SIGNS OF HYPERTROPHY OF HEART ATRIUMS AND VENTRICLES Methodical instructions for students Рекомендовано Ученым советом ХНМУ Протокол
Axis. B.G. Petty, Basic Electrocardiography, DOI / _2, Springer Science+Business Media New York 2016
 Axis 2 The electrical axis of any electrocardiogram (EKG) waveform is the average direction of electrical activity. It is not a vector, because by definition a vector has both direction and amplitude,
Study methodology for screening candidates to athletes risk
 1. Periodical Evaluations: each 2 years. Study methodology for screening candidates to athletes risk 2. Personal history: Personal history of murmur in childhood; dizziness, syncope, palpitations, intolerance
Conduction Problems / Arrhythmias. Conduction
 Conduction Problems / Arrhythmias Conduction Wolf-Parkinson White Syndrome (WPW) and Lown-Ganong-Levine (LGL): Atrial impulses bypass the AV node through an accessory pathway or bypass tract (bundle of
1 st Degree Block Prolonged P-R interval caused by first degree heart block (lead II)
") AV Heart Blocks 1 st degree A condition of a rhythm, not a true rhythm Need to always state underlying rhythm 2 nd degree Type I - Wenckebach Type II Classic dangerous to the patient Can be variable (periodic)
AV Heart Blocks 1 st degree A condition of a rhythm, not a true rhythm Need to always state underlying rhythm 2 nd degree Type I - Wenckebach Type II Classic dangerous to the patient Can be variable (periodic)
ECG Interpretation. Best to have a system to methodically evaluate ECG (from Dubin) * Rate * Rhythm * Axis * Intervals * Hypertrophy * Infarction
 * Rate * Rhythm * Axis * Intervals * Hypertrophy * Infarction") ECG to save Babies ECG Interpretation Best to have a system to methodically evaluate ECG (from Dubin) * Rate * Rhythm * Axis * Intervals * Hypertrophy * Infarction Electrical Activity in the heart 5 events
ECG to save Babies ECG Interpretation Best to have a system to methodically evaluate ECG (from Dubin) * Rate * Rhythm * Axis * Intervals * Hypertrophy * Infarction Electrical Activity in the heart 5 events
If the P wave > 0.12 sec( 3 mm) usually in any lead. Notched P wave usually in lead I,aVl may be lead II Negative terminal portion of P wave in V1, 1
 usually in any lead. Notched P wave usually in lead I,aVl may be lead II Negative terminal portion of P wave in V1, 1") If the P wave > 0.12 sec( 3 mm) usually in any lead. Notched P wave usually in lead I,aVl may be lead II Negative terminal portion of P wave in V1, 1 mm depth and 3 mm width( most specific) Since Mitral
If the P wave > 0.12 sec( 3 mm) usually in any lead. Notched P wave usually in lead I,aVl may be lead II Negative terminal portion of P wave in V1, 1 mm depth and 3 mm width( most specific) Since Mitral
ABCs of ECGs. Shelby L. Durler
 ABCs of ECGs Shelby L. Durler Objectives Review the A&P of the cardiac conduction system Placement and obtaining 4-lead and 12-lead ECGs Overview of the basics of ECG rhythm interpretation Intrinsic
The ABC of Pediatric ECG
 The ABC of Pediatric ECG Mohamed Hamdan, MD, FAAP, FACC Assistant Professor of Pediatrics Columbia University College of Physicians and Surgeons, NY, USA Consultant Pediatric Cardiologist & Co-Director
12 LEAD EKG BASICS. By: Steven Jones, NREMT P CLEMC
 12 LEAD EKG BASICS By: Steven Jones, NREMT P CLEMC ECG Review Waves and Intervals P wave: the sequential activation (depolarization) of the right and left atria QRS complex: right and left ventricular
Reading Assignment (p1-91 in Outline ) Objectives What s in an ECG?
 Objectives What s in an ECG?") Reading Assignment (p1-91 in Outline ) Objectives What s in an ECG? The 5-Step Method ECG #: Mearurements: Rhythm (s): Conduction: Waveform: Interpretation: A= V= PR= QRS= QT= Axis= 1. Compute the 5 basic
Reading Assignment (p1-91 in Outline ) Objectives What s in an ECG? The 5-Step Method ECG #: Mearurements: Rhythm (s): Conduction: Waveform: Interpretation: A= V= PR= QRS= QT= Axis= 1. Compute the 5 basic
Blocks & Dissociations. Reading Assignment (p47-52 in Outline )
") Blocks & Dissociations Reading Assignment (p47-52 in Outline ) Objectives Who are Wenckebach and Mobitz? Review SA and AV Blocks AV Dissociations: learning who s the boss and why 2 nd degree SA Block:
Blocks & Dissociations Reading Assignment (p47-52 in Outline ) Objectives Who are Wenckebach and Mobitz? Review SA and AV Blocks AV Dissociations: learning who s the boss and why 2 nd degree SA Block:
ECG (MCQs) In the fundamental rules of the ECG all the following are right EXCEP:
 In the fundamental rules of the ECG all the following are right EXCEP:") ECG (MCQs) 2010 1- In the fundamental rules of the ECG all the following are right EXCEP: a- It is a biphasic record of myocardial action potential fluctuations. b- Deflection record occurs only during
ECG (MCQs) 2010 1- In the fundamental rules of the ECG all the following are right EXCEP: a- It is a biphasic record of myocardial action potential fluctuations. b- Deflection record occurs only during
12 Lead ECG. Presented by Rebecca Sevigny BSN, RN Professional Practice & Development Dept.
 12 Lead ECG Presented by Rebecca Sevigny BSN, RN Professional Practice & Development Dept. Two Main Coronary Arteries RCA LCA which branches into Left Anterior Descending Circumflex Artery Two Main Coronary
Chapter 2 Practical Approach
 Chapter 2 Practical Approach There are beginners in electrocardiogram (ECG) analysis who are fascinated by a special pattern (e.g., a bundle-branch block or a striking Q wave) and thereby overlook other
Electrocardiography negative zero LA/VL RA/VR LL/VF recording electrode exploring electrode Wilson right arm right arm, left arm left arm
 Electrocardiography In the previous lecture, we were talking about the unipolar limb leads. We said that to make the unipolar lead, you have to make the negative electrode as zero electrode, this is done
ECG Practice Strips Discussion part 1:
 ECG Practice Strips Discussion part 1: The first 20 strips are for teaching various abnormalities of the morphology of the waves of the ECG. Strips 21 and following are for teaching some abnormalities
2017 EKG Workshop Advanced. Family Medicine Review Course Lou Mancano, MD, FAAFP Reading Health System Family and Community Medicine Reading, PA
 2017 EKG Workshop Advanced Family Medicine Review Course Lou Mancano, MD, FAAFP Reading Health System Family and Community Medicine Reading, PA Part II - Objective Describe a useful approach to interpreting
BME 365 Website. Project Directions
 Lecture 17 EKG BME 365 Website Project Directions Heart rate Factors Affecting CO Parasympathetic activity decreases HR Sympathetic activity increases HR Stroke volume Depends on force generated by cardiac
12 Lead ECG Interpretation: The Basics and Beyond
 12 Lead ECG Interpretation: The Basics and Beyond Cindy Weston, DNP, RN, CCRN, CNS-CC, FNP-BC Assistant Professor Texas A&M University College of Nursing cweston@tamhsc.edu Objectives Review the basics
12 Lead ECG Interpretation: Color Coding for MI s
 12 Lead ECG Interpretation: Color Coding for MI s Anna E. Story, RN, MS Director, Continuing Professional Education Critical Care Nurse Online Instructional Designer 2004 Anna Story 1 Objectives review
ECG Basics Sonia Samtani 7/2017 UCI Resident Lecture Series
 ECG Basics Sonia Samtani 7/2017 UCI Resident Lecture Series Agenda I. Introduction II.The Conduction System III.ECG Basics IV.Cardiac Emergencies V.Summary The Conduction System Lead Placement avf Precordial
Cardiology Flash Cards
 Cardiology Flash Cards EKG in a nut shell www.brain101.info Conduction System www.brain101.info 2 Analyzing EKG Step by step Steps in Analyzing ECG'S 1. Rhythm: - Regular _ Sinus, Junctional or Ventricular.
HR: 50 bpm (Sinus) PR: 280 ms QRS: 120 ms QT: 490 ms Axis: -70. Sinus bradycardia with one ventricular escape (*)
 PR: 280 ms QRS: 120 ms QT: 490 ms Axis: -70. Sinus bradycardia with one ventricular escape (*)") 1? HR: 50 bpm (Sinus) PR: 280 ms QRS: 120 ms QT: 490 ms Axis: -70 1 Sinus P waves? 2 sinus cycles The pause (2 sinus cycles) suggests that the sinus fired (?) but did not conduct to the atria (i.e., missing
1? HR: 50 bpm (Sinus) PR: 280 ms QRS: 120 ms QT: 490 ms Axis: -70 1 Sinus P waves? 2 sinus cycles The pause (2 sinus cycles) suggests that the sinus fired (?) but did not conduct to the atria (i.e., missing
Miscellaneous Stuff Keep reading the Outline
 Miscellaneous Stuff Keep reading the Outline Welcome to the 5-Step Method ECG #: Mearurements: Rhythm (s): Conduction: Waveform: Interpretation: A= V= PR= QRS= QT= Axis= 1. Compute the 5 basic measurements:
Lab Activity 24 EKG. Portland Community College BI 232
 Lab Activity 24 EKG Reference: Dubin, Dale. Rapid Interpretation of EKG s. 6 th edition. Tampa: Cover Publishing Company, 2000. Portland Community College BI 232 Graph Paper 1 second equals 25 little boxes
Bundle Branch & Fascicular Blocks. Reading Assignment (p53-58 in Outline )
") Bundle Branch & Fascicular Blocks Reading Assignment (p53-58 in Outline ) Objectives 1. QRS analysis of Right and Left BBB 2. Uncomplicated vs complicated BBB 3. Diagnosis of RBBB with LAFB and LPFB 4.
Bundle Branch & Fascicular Blocks Reading Assignment (p53-58 in Outline ) Objectives 1. QRS analysis of Right and Left BBB 2. Uncomplicated vs complicated BBB 3. Diagnosis of RBBB with LAFB and LPFB 4.
ELECTROCARDIOGRAPHY KEVIN REBECK PA-C. For more presentations
 ELECTROCARDIOGRAPHY KEVIN REBECK PA-C For more presentations www.medicalppt.blogspot.com Objectives ECG History Pathophysiology Basics Case Historys Electrical activation of the heart In the heart
10 ECGs No Practitioner Can Afford to Miss. Objectives
 10 ECGs No Practitioner Can Afford to Miss Mary L. Dohrmann, MD Professor of Clinical Medicine Division of Cardiovascular Medicine University of Missouri School of Medicine No disclosures Objectives 1.
How to Read an Athlete s ECG. Sanjay Sharma BSc (Hons), MD, FRCP, FESC
, MD, FRCP, FESC") How to Read an Athlete s ECG Sanjay Sharma BSc (Hons), MD, FRCP, FESC Athlete s EKG Vagotonia Sinus bradycardia Sinus arrhythmia First degree AVB ST-elevation Tall T waves Increased chamber size Left ventricular
How to Read an Athlete s ECG Sanjay Sharma BSc (Hons), MD, FRCP, FESC Athlete s EKG Vagotonia Sinus bradycardia Sinus arrhythmia First degree AVB ST-elevation Tall T waves Increased chamber size Left ventricular
Right ECG. Contents. RAE vs. P Pulmonale: Are they the same? 12 Lead ECGs of Patient with COPD Exacerbation Before and After Treatment
 Contents Right ECG Wang, Tzong-Luen MD, PhD, JM, FESC, FACC, FCAPSC Professor, Medical College, Fu-Jen Catholic University Chief, ED, Shin-Kong Wu Ho-Su Memorial Hospital CEO, National Resuscitation Council,
BASIC CONCEPT OF ECG
 BASIC CONCEPT OF ECG Electrocardiogram The electrocardiogram (ECG) is a recording of cardiac electrical activity. The electrical activity is readily detected by electrodes attached to the skin. After the
Acute Coronary Syndromes. Disclosures
 Acute Coronary Syndromes Disclosures I work for Virginia Garcia Memorial Health Center, Beaverton, OR. Jon Tardiff, BS, PA-C OHSU Clinical Assistant Professor And I am a medical editor for Jones & Bartlett
December 2018 Tracings
 Tracings Tracing 1 Tracing 4 Tracing 1 Answer Tracing 4 Answer Tracing 2 Tracing 5 Tracing 2 Answer Tracing 5 Answer Tracing 3 Tracing 6 Tracing 3 Answer Tracing 6 Answer Questions? Contact Dr. Nelson
Dr. Schroeder has no financial relationships to disclose
 Valerie A Schroeder MD MS Assistant Professor University of Kansas Medical Center READING THE WAVES- THE HEART S ELECTRICAL MESSAGE FINANCIAL DISCLOSURE Dr. Schroeder has no financial relationships to
ELECTROCARDIOGRAPHY (ECG)
") ELECTROCARDIOGRAPHY (ECG) The heart is a muscular organ, which pumps blood through the blood vessels of the circulatory system. Blood provides the body with oxygen and nutrients, as well as assists in
ELECTROCARDIOGRAPHY (ECG) The heart is a muscular organ, which pumps blood through the blood vessels of the circulatory system. Blood provides the body with oxygen and nutrients, as well as assists in
Course Objectives. Proper Lead Placements. Review the ECG print paper. Review the mechanics of the Myocardium. Review basics of ECG Rhythms
 ECG Interpretations Course Objectives Proper Lead Placements Review the ECG print paper Review the mechanics of the Myocardium Review basics of ECG Rhythms How Leads Work The ECG Leads we use are Bipolar
FLB s What Are Those Funny-Looking Beats?
 FLB s What Are Those Funny-Looking Beats? Reading Assignment (pages 27-45 in Outline ) The 5-Step Method ECG #: Mearurements: Rhythm (s): Conduction: Waveform: Interpretation: A= V= PR= QRS= QT= Axis=
Diploma in Electrocardiography
 The Society for Cardiological Science and Technology Diploma in Electrocardiography The Society makes this award to candidates who can demonstrate the ability to accurately record a resting 12-lead electrocardiogram
ECG pre-reading manual. Created for the North West Regional EMET training program
 ECG pre-reading manual Created for the North West Regional EMET training program Author:- Dr Juan Carlos Ascencio-Lane juan.ascencio-lane@ths.tas.gov.au 1 Disclaimer This handbook has been created for
ECG Underwriting Puzzler Dr. Regina Rosace AVP & Medical Director
 December 2018 ECG Underwriting Puzzler Dr. Regina Rosace AVP & Medical Director To obtain best results Select Slide Show from the ribbon at the top of your PowerPoint screen Select From Beginning on the
Ronald J. Kanter, MD Director, Electrophysiology Miami Children s Hospital Professor Emeritus, Duke University Miami, Florida
 S306- Pediatric Electrocardiography: A Potpourri Ronald J. Kanter, MD Director, Electrophysiology Miami Children s Hospital Professor Emeritus, Duke University Miami, Florida Disclosure of Relevant Relationship
4/14/15. The Electrocardiogram. In jeopardy more than a century after its introduction by Willem Einthoven? Time for a revival. by Hein J.
 The Electrocardiogram. In jeopardy more than a century after its introduction by Willem Einthoven? Time for a revival. by Hein J. Wellens MD 1 Einthoven, 1905 The ECG! Everywhere available! Easy and rapid
By the end of this lecture, you will be able to: Understand the 12 lead ECG in relation to the coronary circulation and myocardium Perform an ECG
 By the end of this lecture, you will be able to: Understand the 12 lead ECG in relation to the coronary circulation and myocardium Perform an ECG recording Identify the ECG changes that occur in the presence
ECG WORKBOOK. Rohan Jayasinghe
 ECG WORKBOOK Rohan Jayasinghe Contents Preface vii Foreword viii Acknowledgements ix The author x Reviewers xi Section 1 Basics of the ECG 1 Section 2 ECG-based diagnosis: pathology by ECG 21 Section 3
at least 4 8 hours per week
 ECG IN ATHLETS An athlete is defined as an individual who engages in regular exercise or training for sport or general fitness, typically with a premium on performance, and often engaged in individual
Myocardial Infarction. Reading Assignment (p66-78 in Outline )
") Myocardial Infarction Reading Assignment (p66-78 in Outline ) Objectives 1. Why do ST segments go up or down in ischemia? 2. STEMI locations and culprit vessels 3. Why 15-lead ECGs? 4. What s up with avr?
Myocardial Infarction Reading Assignment (p66-78 in Outline ) Objectives 1. Why do ST segments go up or down in ischemia? 2. STEMI locations and culprit vessels 3. Why 15-lead ECGs? 4. What s up with avr?
Left posterior hemiblock (LPH)/
/") ECG OF THE MONTH Left Postero-inferior Depolarization Delay Keywords Electrocardiography Intraventricular conduction delay, Inferoposterior hemiblock, Left posterior fascicular block, Left posterior hemiblock
ECG OF THE MONTH Left Postero-inferior Depolarization Delay Keywords Electrocardiography Intraventricular conduction delay, Inferoposterior hemiblock, Left posterior fascicular block, Left posterior hemiblock
Understanding the 12-lead ECG, part II
 Bundle-branch blocks Understanding the 12-lead ECG, part II Most common electrocardiogram (ECG) abnormality Appears as a wider than normal S complex Occurs when one of the two bundle branches can t conduct
About T waves
 About T waves - 2014 Dr. Andres R. Pérez Riera The T waves is a positive deflection after each QRS complex. It represents ventricular repolarization The T wave represents the unconcealed potential differences
Case 1. Case 2. Case 3
 Case 1 The correct answer is D. Occasionally, the Brugada syndrome can present similar morphologies to A and also change depending on the lead position but in the Brugada pattern the r is wider and ST
The Fundamentals of 12 Lead EKG. ECG Recording. J Point. Reviewing the Cardiac Conductive System. Dr. E. Joe Sasin, MD Rusty Powers, NRP
 The Fundamentals of 12 Lead EKG Dr. E. Joe Sasin, MD Rusty Powers, NRP SA Node Intranodal Pathways AV Junction AV Fibers Bundle of His Septum Bundle Branches Purkinje System Reviewing the Cardiac Conductive
REF ENG Rev F1. Physician s. Guide to VERITAS WITH ADULT AND PEDIATRIC RESTING ECG INTERPRETATION
 REF 9515-001-50-ENG Rev F1 Physician s Guide to VERITAS WITH ADULT AND PEDIATRIC RESTING ECG INTERPRETATION Copyright 2015 by Mortara Instrument, Inc. 7865 N. 86th Street Milwaukee, Wisconsin 53224 This
SIMPLY ECGs. Dr William Dooley
 SIMPLY ECGs Dr William Dooley Content Basic ECG interpretation pattern Some common (examined) abnormalities Presenting ECGs in context Setting up an ECG Setting up an ECG 1 V1-4 th Right intercostal space
, David Stultz, MD.
 http://www.dilbert.com EKG Rounds Handouts available at http://www.drstultz.com January 5, 2004 David Stultz, MD Cardiology Fellow, PGY 4 Overview of Topics How to read an EKG Normal EKG Determination