In vivo bromodeoxyuridine (BrdU) incorporation was performed to analyze cell
|
|
|
- Daisy Greer
- 5 years ago
- Views:
Transcription
1 Supplementary Methods BrdU incorporation in vivo In vivo bromodeoxyuridine (BrdU) incorporation was performed to analyze cell proliferation in the heart. Mice were subjected to LI-TAC, and 5 days later BrdU (100 mg/kg) was intraperitoneally administrated 2 h before sacrifice. Heart sections were then stained with anti-brdu monoclonal antibody (Sigma). Coculture of neonatal cardiomyocytes and adult cardiac fibroblasts Thy1 + cells were sorted from nonmyocyte-enriched cells isolated from adult mice. Neonatal cardiomyocytes were cultured in serum-free DMEM for 24 h in 3.5-cm culture dishes, after which the culture medium was replaced with fresh serum-free DMEM containing Thy1-positive adult cardiac fibroblasts (2.0x10 5 cells/dish). The ratio of fibroblasts to cardiomyocytes in the coculture was 50%, and the cells were cultured for an additional 24 h. Migration assay Cell migration was analyzed using Boyden chambers containing fluorescence-blocking filters with 8- m pores (HTS fluoroblock, Falcon). Cardiac fibroblasts were cultured in serum-free DMEM for 24 h, after which they were harvested and resuspended in serum-free DMEM to a density of 1x10 6 /ml. The cells were then stained with calcein acetoxymethyl ester, and 3x10 5 cells were added to the upper well of each Boyden chamber. To the lower well was added 1 ml of serum-free DMEM containing vehicle, IGF-1 or PDGF-A. The cells were allowed to migrate for 24 h at 37 C and then visualized by fluorescence microscopy. 1
2 BrdU incorporation in vitro To analyze cell proliferation, in vitro bromodeoxyuridine (BrdU) incorporation was measured using a BrdU labeling and detection kit III (Roche). Cardiac fibroblasts were cultured in serum-free DMEM for 24 h, and then stimulated with vehicle, IGF-1 or PDGF-A. After incubation for 18 h at 37 C, the media were supplemented with 10 M BrdU and incubated for an additional 6 h. The cells were then stained with a peroxidase-labeled antibody against BrdU. The absorbance of the samples at 405 nm with a reference wavelength of 490 nm was measured using a microplate reader (Bio-Rad, Model 680). The 405 nm/490 nm absorbance ratios were normalized to the ratios obtained with untreated cardiac fibroblasts. 2
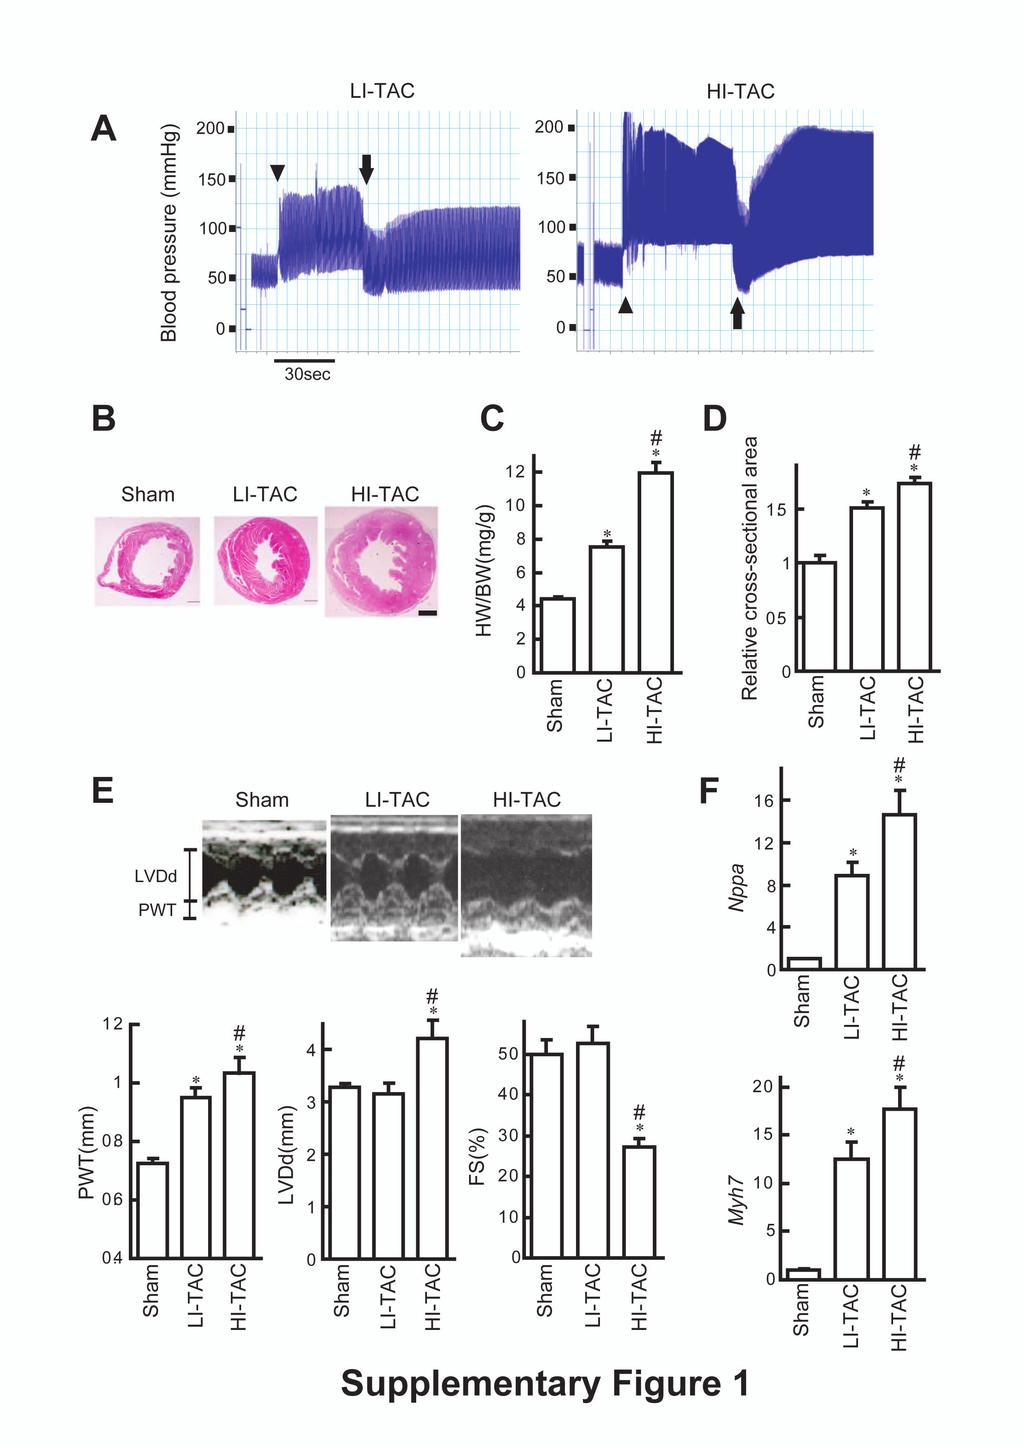
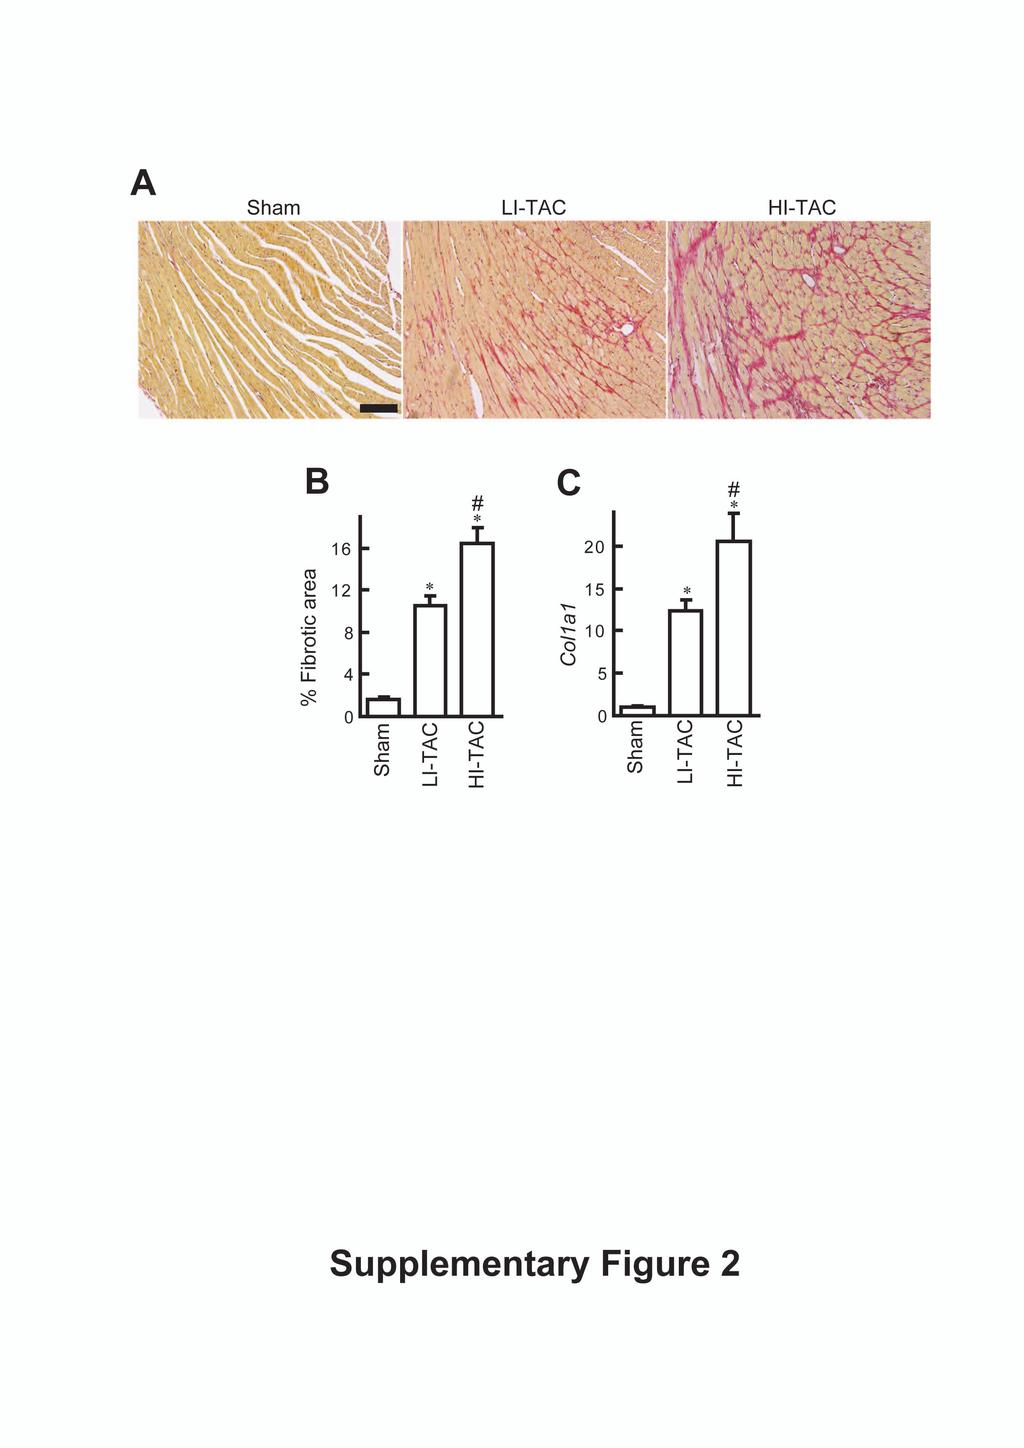
3 Supplementary Figure Legends Supplementary Figure 1 Pressure overload-induced cardiac hypertrophy after transverse aortic constriction. Low-intensity (LI) and high-intensity (HI) TAC were accomplished by ligating the aorta against 25-gauge and 27-gauge needles, respectively. (A) Representative intraoperative pressure recordings measured in the right carotid artery. The aortas were tied firmly against the needles at the point shown by the arrowhead, after which the needles were removed (arrow). LI-TAC and HI-TAC produced different levels of pressure overload. (B) Representative low-magnification views of hematoxylin/eosin-stained heart sections 2 weeks after the sham operation or TAC. Scale bar, 1 mm. (C-D) Heart weight/body weight (HW/BW) ratios (C) and relative cross-sectional areas of left ventricular (LV) cardiomyocytes (D) 2 weeks after the sham operation or TAC. (E) Echocardiographic analysis of hearts 2 weeks after the operation: PWT, LV diastolic posterior wall thickness; LVDd, LV diastolic diameter; FS, fractional shortening. (F) Real-time PCR analysis of two cardiac hypertrophic marker genes, Nppa and Myh7. Expression levels of each gene were normalized to those of 18s ribosomal RNA and then further normalized to the levels in mice subjected to sham operations. Nppa encodes atrial natriuretic peptide; Myh7 encodes cardiac myosin heavy chain. * P<0.01 vs. sham, # P<0.05 vs. LI-TAC. n = 5. Supplementary Figure 2 Cardiac fibrosis induced by TAC. (A) Representative low-magnification views of elastic picro sirius red-stained sections 3
4 of the left ventricles 2 weeks after the operations. Scale bar, 100 m. (B) Fibrotic areas determined by elastic picro sirius red staining of cross-sections of hearts at the level of the papillary muscle. n=5 mice in each group. (C) Real-time PCR analysis of Col1a1 expression. Expression levels were normalized to those of 18s ribosomal RNA and then further normalized to the levels in mice subjected to sham operations. * P<0.01 vs. sham, # P<0.01 vs. LI-TAC. n = 5. Supplementary Figure 3 Cardiac expression of Klf5. (A-B) Expression of Klf5 mrna (A) and KLF5 protein (B) in hearts 3 days after the sham operation or LI-TAC. Expression levels were normalized to those of 18s ribosomal RNA and then further normalized to the levels in the mice subjected to sham operations (A). n = 3. CBB, Coomassie Brilliant Blue staining of the gel. (C) Relative expression levels of Klf5 in cultured neonatal cardiomyocytes and cardiac fibroblasts prepared from neonatal mice. Expression levels of Klf5 mrna were analyzed by real-time PCR and normalized to those of 18s rrna and then further normalized to the levels in cardiomyocytes. Supplementary Figure 4 Pressure overload-induced cardiac hypertrophy and fibrosis are attenuated in Klf5 +/- mice. Klf5 +/- and wild-type (WT) mice were subjected to LI-TAC or sham operation as shown in Figure 1. (A) Echocardiographic analysis 2 weeks after the operations: PWT, LV diastolic posterior wall thickness; LVDd, LV diastolic diameter; FS, fractional shortening. (B) Real-time PCR analysis of marker genes for cardiac hypertrophy and 4
5 fibrosis in the hearts 14 days after the operations. Expression levels of each gene were normalized to those of 18s ribosomal RNA and then further normalized to the levels in mice subjected to sham operations. Nppa encodes atrial natriuretic peptide; Myh7, cardiac myosin heavy chain; Ctgf, connective tissue growth factor; Spp1, secreted phosphoprotein 1; Fn1, fibronectin 1. * P<0.01 vs. the sham control for the same genotype. # P<0.05 vs. WT subjected to TAC. n = 7. Supplementary Figure 5 Generation of a Klf5 conditional mouse line. (A) Schematic representation of the targeting vector and expected gene replacement at the Klf5 locus: H, HindIII; black triangles, loxp sequences; white triangles, FRT sequences. (B) Southern blot analysis of wild-type (WT), heterozygous floxed (Fl/+) and homozygous floxed (Fl/Fl) mice. Genomic DNA was digested with HindIII and subjected to hybridization with the probe indicated in A. The WT and floxed alleles produced 3.8 kb and 2.9 kb bands, respectively. Supplementary Figure 6 Cardiomyocyte-specific Klf5 deletion. (A) Schematic representation of the floxed and floxed-out alleles and the primers used for genotyping. (B) Competitive PCR analysis of the floxed Klf5 loci in cardiomyocytes isolated from adult Klf5 fl/fl and Klf5 fl/fl ; MHC-Cre mice using the Langendorf isolation method. The primer set of A and B produced a 331-bp band for the floxed Klf5 allele, while the primer set of B and C produced a 250-bp band for the floxed-out Klf5 allele. (C) Real-time PCR analysis of Klf5 expression in 5
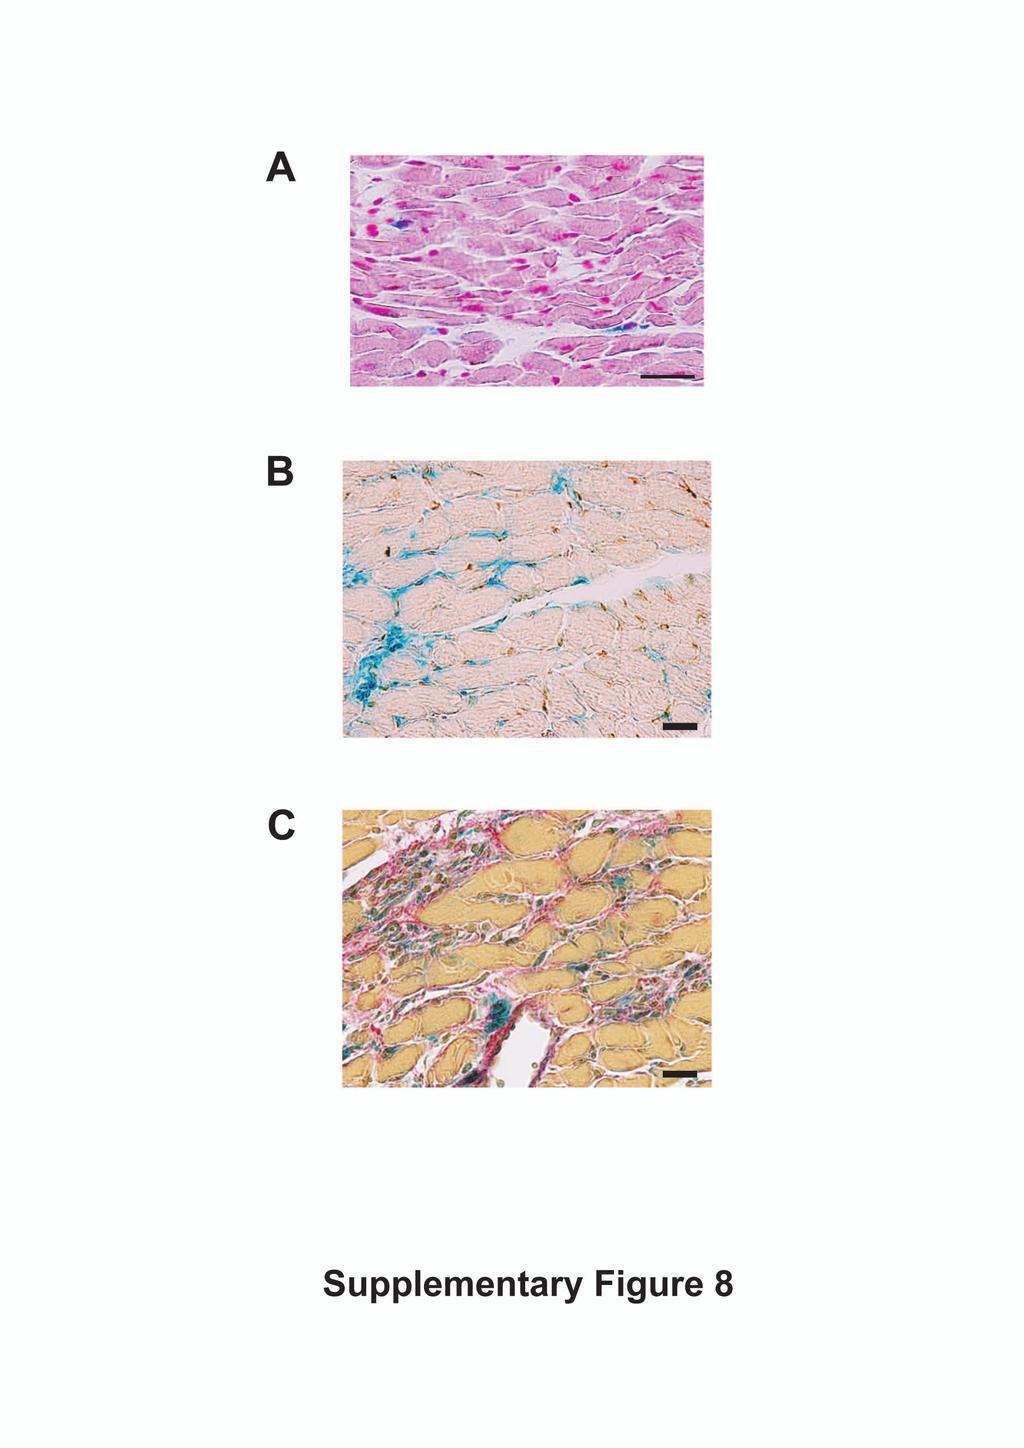
6 cardiomyocytes isolated from Klf5 fl/fl and Klf5 fl/fl ; MHC-Cre mice. * P<0.01 vs. Klf5 fl/fl mice. n = 4. Supplementary Figure 7 Cardiomyocyte-specific deletion of Klf5 does not alter pressure overload-induced cardiac hypertrophy and fibrosis. Klf5 fl/fl and Klf5 fl/fl ; MHC-Cre mice were subjected to LI-TAC or sham operation, as shown in Figure 2. (A) Echocardiographic analysis 2 weeks after the operations: PWT, LV diastolic posterior wall thickness; LVDd, LV diastolic diameter; FS, fractional shortening. (B) Real-time PCR analysis of cardiac hypertrophic and fibrotic marker genes. Expression levels of each gene were normalized to 18s ribosomal RNA levels. * P<0.01 vs. the sham control for the same genotype. n = 7. Supplementary Figure 8 Fibroblast-specific recombination by Postn-Cre transgenic mice. (A) LacZ expression was visualized using X-gal in the heart from R26RstoplacZ;Postn-Cre mice subjected to sham operations as shown in Figure 3A. (B-C) Double-staining for -galactosidase and isolectin B4 (brown) (B) or elastic picro sirius red staining (C) of LI-TAC hearts. Note that lacz reporter gene expression was confined to fibroblasts. LacZ expression was detected throughout the fibrotic tissues, but was not observed in endothelial cells. Scale bars, 20 m. Supplementary Figure 9 Fibroblast-specific expression of -galactosidase in Klf5 fl/fl ;Postn-Cre hearts. (A) Expression of -galactosidase in cell populations enriched in either cardiomyocytes 6
7 or nonmyocytes isolated from R26RstoplacZ;Postn-Cre mice subjected to LI-TAC for 2 weeks. -galactosidase activity was detected using the fluorescent substrate FDG. Note that addition of FDG did not alter the fluorescence in the myocyte population, while -galactosidase + cells were clearly detected in the nonmyocyte population. (B) Expression of cell-lineage markers in -galactosidase + cells sorted from the nonmyocyte population. Levels of mrna expression of Ddr2, Myh6 and Cdh5 in -galactosidase + cells (LacZ + ) normalized to those in adult Thy1 + cardiac fibroblasts, cardiomyocytes (CM) and CD31 + ECs. The expression levels in the control cells are the same as shown in Figure 3C. Supplementary Figure 10 Fibroblast-specific Cre expression in Postn-Cre mice. Relative levels of mrna expression of Cre (A) and endogenous Postn (B) were assessed by real-time PCR in adult cardiomyocytes (CM), Thy1 + fibroblasts and CD31 + ECs isolated from Klf5 fl/fl and Klf5 fl/fl ;Postn-Cre mice 2 weeks after either the sham or LI-TAC operation. Cells were isolated as shown in Figure 3. control for the same genotype in the same cell lineage group. * P<0.01 vs. sham # P<0.01 vs. Klf5 fl/fl mice subjected to LI-TAC in the same cell lineage group. Supplementary Figure 11 Suppression of fibrosis and fibroblast proliferation in Klf5 fl/fl ;Postn-Cre mice. Klf5 fl/fl and Klf5 fl/fl ;Postn-Cre mice were subjected to LI-TAC or sham operation, as shown in Figure 4. (A) Quantitative analysis of the expression of cardiac fibrosis-related marker genes: Ctgf, connective tissue growth factor; Spp1, secreted phosphoprotein 1; Fn1, fibronectin 1. The expression levels of each gene were 7
8 normalized to 18s ribosomal RNA levels and then further normalized to the levels in Klf5 fl/fl mice subjected to the sham operation. n=7 mice for each group. (B) In vivo BrdU incorporation in hearts from Klf5 fl/fl and Klf5 fl/fl ;Postn-Cre mice subjected to LI-TAC or sham operation. BrdU was administered 2 h prior to sacrifice 5 days after the operations. Scale bar, 100 m. * P<0.01 vs. the sham control for the same genotype. # P<0.05 vs. Klf5 fl/fl TAC. n =5 mice for each group. Supplementary Figure 12 KLF5 is important for cardiomyocyte hypertrophy induced by coculture with adult cardiac fibroblasts. Cultured neonatal cardiomyocytes were cocultured with Thy1 + cardiac fibroblasts isolated as shown in Figure 3B from Klf5 fl/fl and Klf5 fl/fl ;Postn-Cre mice subjected to LI-TAC for 2 weeks. Cardiomyocytes cultured without fibroblasts served as a control (CM). (A) Representative cardiomyocytes are shown stained for sarcomeric -actinin (green). Nuclei were counterstained with Hoechst (blue). Scale bar, 10 m. (B) Cell surface areas of 100 cells from each group. * P<0.05 vs. cardiomyocytes alone. # P<0.05 vs. cells isolated from Klf5 fl/fl mice subjected to LI-TAC. Supplementary Figure 13 KLF5 knockdown does not alter Postn and Tgfb3 expression in cultured cardiac fibroblasts. KLF5 was knocked down using a specific sirna as described in Figure 5A. Expression levels were normalized to those in cells transfected with the control sirna (sicntrl). 8
9 Supplementary Figure 14 Differential effects of IGF-1 and PDGF-A on cardiomyocyte hypertrophy, and fibroblast proliferation and migration. (A) Cultured cardiomyocytes were treated with the indicated concentrations of IGF-1 and PDGF-A for 24 h. Cell surface areas of 100 cardiomyocytes from each group are shown. (B) BrdU incorporation in cardiac fibroblasts treated with the indicated concentrations of IGF-1 and PDGF-A. * P<0.05 vs. control. (C) Boyden chamber assays of the effects of IGF-1 and PDGF-A on migration of cardiac fibroblasts. The numbers of cells that migrated through porous membranes are shown. * P<0.01 vs. cells migrated in SFM. n=4 wells each. Data are representative of 4 independent experiments. Supplementary Figure 15 Myh6 mrna expression in nonmyocyte-enriched cell populations isolated from adult hearts. Levels of Myh6 mrna expression in nonmyocyte-enriched cell samples and in normal whole hearts. Expression levels were normalized to those of 18s rrna, and then further normalized to that in whole hearts. * P<0.01 vs. whole hearts. Supplementary Figure 16 Levels of mrna expression of KLF family members in Klf5-knockdown cardiac fibroblasts. Mouse cardiac fibroblasts were transfected with either the sirna for Klf5 (siklf5) or control sirna (sicntrl) as described in Figure 5A. Expression levels of Klf2, Klf4, 9
10 Klf10, Klf13 and Klf15 were analyzed by real-time PCR, and were normalized to those in cells transfected with the control sirna. Supplementary Figure 17 Igf1 mrna variant containing exon 2 is preferentially expressed in cardiac fibroblasts. Numbers of Igf1 transcripts containing exons 1 (class 1) or 2 (class 2) in cultured mouse cardiomyocytes and cardiac fibroblasts (A), or in hearts before and 4 days after LI-TAC (B), were analyzed using real-time PCR with external controls. The number of class 2 transcripts was normalized to that of class 1. As shown, class 2 transcripts are the major Igf1 mrna in the heart. * P<0.01 vs. class 1. n = 3. 10
11 Supplementary Table 1 Real-time PCR analysis of secreted protein genes. Genome-wide gene expression profiles in hearts 5 days after LI-TAC were analyzed using Affymetrix GeneChips. Genes encoding secreted proteins exhibiting significantly different expression levels in sham and LI-TAC hearts were selected. Genes encoding secreted proteins that did not show significantly different expression levels after the operations, but were previously suggested to be involved in cardiac hypertrophy were also analyzed. Changes in gene expression were analyzed by real-time PCR. Compared was gene expression in sham-operated and LI-TAC hearts, and in Klf5 fl/fl and Klf5 fl/fl ;Postn-Cre hearts subjected to LI-TAC. n=3, each group. *P<0.05 vs. sham. # P<0.05 vs. Klf5 fl/fl. Expression levels in cultured cardiomyocytes and cardiac fibroblasts were also analyzed. n=5. $ significantly enriched in fibroblasts, as compared to cardiomyocytes (P<0.05). Genes whose expression was significantly increased by LI-TAC, reduced in Klf5 fl/fl ;Postn-Cre, or enriched in fibroblasts are shown in bold. 11
12 GenBank Gene name Gene symbol TAC / Sham Fold difference Klf5 fl/fl ;Postn-Cre / Klf5 fl/fl fibroblast / myocyte NM secreted phosphoprotein 1 Spp * NM periostin Postn * # $ NM interleukin 6 Il * NM natriuretic peptide precursor type B Nppb * NM chemokine (C-C motif) ligand 2 Ccl * NM matrix metallopeptidase 3 Mmp * NM leukemia inhibitory factor Lif 6.384* BC fibronectin 1 Fn * # $ BG insulin-like growth factor 1 Igf * # $ NM connective tissue growth factor Ctgf 5.798* $ NM collagen, type III, alpha 1 Col3a * $ NM collagen, type I, alpha 1 Col1a * # $ NM heparin-binding EGF-like growth factor Hbegf 4.770* NM natriuretic peptide precursor type A Nppa 4.709* # NM tumor necrosis factor Tnf 4.336* NM transforming growth factor, beta 2 Tgfb * # NM fibrillin 1 Fbn * # $ NM interleukin 1 beta Il1b 2.938* NM matrix metallopeptidase 9 Mmp * NM interleukin 33 Il * # NM transforming growth factor, beta 3 Tgfb * # $ NM hepatocyte growth factor Hgf 1.850* # NM transforming growth factor, beta 1 Tgfb * # NM endothelin 1 Edn * NM macrophage migration inhibitory factor Mif NM platelet derived growth factor, alpha Pdgfa BC vascular endothelial growth factor A Vegfa BC platelet derived growth factor, B polypeptide Pdgfb # $ NM matrix metallopeptidase 2 Mmp NM fibroblast growth factor 2 Fgf $ NM insulin-like growth factor 2 Igf NM cardiotrophin 1 Ctf
13 Supplementary Table 2 PCR primers. Gene Product Forward primer Reverse primer symbol size (bp) Spp1 CTCAGAAGCAGAATCTC ATGGTCTCCATCGTCATCAT 149 Postn AACCAAGGACCTGAAACACG GTGTCAGGACACGGTCAATG 170 Il6 AGTTGCCTTCTTGGGACTGA TCCACGATTTCCCAGAGAAC 159 Nppb CTGAAGGTGCTGTCCCAGAT CCTTGGTCCTTCAAGAGCTG 185 Ccl2 AGGTCCCTGTCATGCTTCTG TCTGGACCCATTCCTTCTTG 249 Mmp3 GGGATGATGATGCTGGTATGG GCTTCACATCTTTTGCAAGGC 75 Lif CGCCTAACATGACAGACTTCCCAT AGGCCCCTCATGACGTCTATAGTA 193 Fn1 ACAGAAATGACCATTGAAGG TGTCTGGAGAAAGGTTGATT 538 Ctgf CCTGGTCCAGACCACAGAGT GACAGGCTTGGCGATTTTAG 216 Col3a1 CCCAGAACATTACATACCA GATTAAAACAAGATGAACAC 371 Col1a1 GCCAAGAAGACATCCCTGAAG TCATTGCATTGCACGTCATC 139 Hbegf GAAAGCAGGATCGAGTGAGC CTTGCGGCTACTTGAACACA 221 Nppa CCTAAGCCCTTGTGGTGTGT CAGAGTGGGAGAGGCAAGAC 153 Tnf AGCCCCCAGTCTGTATCCTT CTCCCTTTGCAGAACTCAGG 213 Tgfb2 AAGTTTACACTGCCCCTGCTG GGTGCCATCAATACCTGCAAA 103 Fbn1 CCCTGCGAGATGTGTCCTGC TGTGTCCAGCGGGGCATTTG 175 Il1b GCCCATCCTCTGTGACTCAT AGGCCACAGGTATTTTGTCG 231 Mmp9 TGAATCAGCTGGCTTTTGTG GTGGATAGCTCGGTGGTGTT 242 Il33 GGCTGCTTGCTTTCCTTATG CCGTTACGGATATGGTGGTC 122 Tgfb3 GGAAGGCTGCACTCAGGAGA CGGCCAGTTCATTGTGCTC 101 Hgf TTCCCAGCTGGTCTATGGTC TGGTGCTGACTGCATTTCTC 237 Tgfb1 AGGGCTACCATGCCAACTTCT CCGGGTTGTGTTGGTTGTACA 102 Edn1 TTCCCGTGATCTTCTCTCTGCT TCTGCTTGGCAGAAATTCCA 369 Mif CCATGCCTATGTTCATCGTG AGGCCACACAGCAGCTTACT 270 Pdgfa CAGCATCCGGGACCTCCAGCGACTC TCGTAAATGACCGTCCTGGTCTTGC 195 Vegfa AACAAAGCCAGAAAATCACTGTGA CGGATCTTGGACAAACAAATGC 67 Pdgfb CCCACAGTGGCTTTTCATTT GTGGAGGAGCAGACTGAAGG 206 Mmp2 ATCGCTCAGATCCGTGGTG TGTCACGTGGTGTCACTGTCC 73 Fgf2 GACCCCAAGCGGCTCTACTGC GTGCCACATACCAACTGGAGT 307 Igf2 CAGCGGCCTCCTTACCCAACT GAGGTAGACACGTCCCTCTCG
14 Ctf1 GAGGGATACGTGCAGCAACA GGCCAGCACTGTCTCCAC 288 Myh6 CCAATGAGTACCGCGTGAA ACAGTCATGCCGGGATGAT 236 Myh7 ATGTGCCGGACCTTGGAA CCTCGGGTTAGCTGAGAGATCA 148 Klf2 ACCAAGAGCTCGCACCTAAA GTGGCACTGAAAGGGTCTGT 156 Klf4 CTGAACAGCAGGGACTGTCA GTGTGGGTGGCTGTTCTTTT 218 Klf5 TGGTTGCACAAAAGTTTATAC GGCTTGGCGCCCGTGTGCTTCC 162 Klf10 AGCAAGGGTCACTCCTCAGA ACATGGGACAGGCAAACTTC 239 Klf13 GGAAATCTTCGCACCTCAAG GGCAGCTGAACTTCTTCTCG 153 Klf15 TCATGGAGGAGAGCCTCTGT TCTCCCAGCAGACTCTGGAT 249 Ddr2 CCTATGTCCTTGGGCACTGT CTGCCAGCCTACTCAAGTCC 196 Cdh5 ATTGAGACAGACCCCAAACG TTCTGGTTTTCTGGCAGCTT 239 Cre CGATGCAACGAGTGATGAGG GCATTGCTGTCACTTGGTCGT
15
16
17
18
19
20
21
22
23
24
25
26
27
28
29
30
31
Postn MCM Smad2 fl/fl Postn MCM Smad3 fl/fl Postn MCM Smad2/3 fl/fl. Postn MCM. Tgfbr1/2 fl/fl TAC
 A Smad2 fl/fl Smad3 fl/fl Smad2/3 fl/fl Tgfbr1/2 fl/fl 1. mm B Tcf21 MCM Tcf21 MCM Smad3 fl/fl Tcf21 MCM Smad2/3 fl/fl Tcf21 MCM Tgfbr1/2 fl/fl αmhc MCM C 1. mm 1. mm D Smad2 fl/fl Smad3 fl/fl Smad2/3
hemodynamic stress. A. Echocardiographic quantification of cardiac dimensions and function in
 SUPPLEMENTAL FIGURE LEGENDS Supplemental Figure 1. Fbn1 C1039G/+ hearts display normal cardiac function in the absence of hemodynamic stress. A. Echocardiographic quantification of cardiac dimensions and
Probe. Hind III Q,!?R'!! /0!!!!D1"?R'! vector. Homologous recombination
 Supple-Zhang Page 1 Wild-type locus Targeting construct Targeted allele Exon Exon3 Exon Probe P1 P P3 FRT FRT loxp loxp neo vector amh I Homologous recombination neo P1 P P3 FLPe recombination Q,!?R'!!
Tcf21 MCM ; R26 mtmg Sham GFP Col 1/3 TAC 8W TAC 2W. Postn MCM ; R26 mtmg Sham GFP Col 1/3 TAC 8W TAC 2W
 A Tcf21 MCM ; R26 mtmg Sham GFP Col 1/3 Tcf21 MCM ; R26 mtmg TAC 2W Tcf21 MCM ; R26 mtmg TAC 8W B Postn MCM ; R26 mtmg Sham GFP Col 1/3 Postn MCM ; R26 mtmg TAC 2W Postn MCM ; R26 mtmg TAC 8W Supplementary
c Ischemia (30 min) Reperfusion (8 w) Supplementary Figure bp 300 bp Ischemia (30 min) Reperfusion (4 h) Dox 20 mg/kg i.p.
 Reperfusion (8 w) Supplementary Figure bp 300 bp Ischemia (30 min) Reperfusion (4 h) Dox 20 mg/kg i.p.") a Marker Ripk3 +/ 5 bp 3 bp b Ischemia (3 min) Reperfusion (4 h) d 2 mg/kg i.p. 1 w 5 w Sacrifice for IF size A subset for echocardiography and morphological analysis c Ischemia (3 min) Reperfusion (8
a Marker Ripk3 +/ 5 bp 3 bp b Ischemia (3 min) Reperfusion (4 h) d 2 mg/kg i.p. 1 w 5 w Sacrifice for IF size A subset for echocardiography and morphological analysis c Ischemia (3 min) Reperfusion (8
E10.5 E18.5 P2 10w 83w NF1 HF1. Sham ISO. Bmi1. H3K9me3. Lung weight (g)
") Myociyte cross-sectional Relative mrna levels Relative levels Relative mrna levels Supplementary Figures and Legends a 8 6 4 2 Ezh2 E1.5 E18.5 P2 1w 83w b Ezh2 p16 amhc b-actin P2 43w kd 37 86 16 wt mouse
Myociyte cross-sectional Relative mrna levels Relative levels Relative mrna levels Supplementary Figures and Legends a 8 6 4 2 Ezh2 E1.5 E18.5 P2 1w 83w b Ezh2 p16 amhc b-actin P2 43w kd 37 86 16 wt mouse
BNP mrna expression in DR and DS rat left ventricles (n = 5). (C) Plasma norepinephrine
. (C) Plasma norepinephrine") Kanazawa, et al. Supplementary figure legends Supplementary Figure 1 DS rats had congestive heart failure. (A) DR and DS rat hearts. (B) QRT-PCR analysis of BNP mrna expression in DR and DS rat left ventricles
Kanazawa, et al. Supplementary figure legends Supplementary Figure 1 DS rats had congestive heart failure. (A) DR and DS rat hearts. (B) QRT-PCR analysis of BNP mrna expression in DR and DS rat left ventricles
Protection against doxorubicin-induced myocardial dysfunction in mice by cardiac-specific expression of carboxyl terminus of hsp70-interacting protein
 Protection against doxorubicin-induced myocardial dysfunction in mice by cardiac-specific expression of carboxyl terminus of hsp70-interacting protein Lei Wang 1, Tian-Peng Zhang 1, Yuan Zhang 2, Hai-Lian
Gallic acid prevents isoproterenol-induced cardiac hypertrophy and fibrosis through regulation of JNK2 signaling and Smad3 binding activity
 Gallic acid prevents isoproterenol-induced cardiac hypertrophy and fibrosis through regulation of JNK2 signaling and Smad3 binding activity Yuhee Ryu 1,+, Li Jin 1,2+, Hae Jin Kee 1,, Zhe Hao Piao 3, Jae
doi: /nature14508 Rappsilber et al.
 SUPPLEMENTARY INFORMATION doi:1.138/nature1458 Grosso et al. Barbosa et al. 74 72 45 33 47 7 51 Rappsilber et al. Supplementary Figure 1 a, Venn-Diagram of identified splice factors in the work of Barbossa
Supplementary Figure 1. Baf60c and baf180 are induced during cardiac regeneration in zebrafish. RNA in situ hybridization was performed on paraffin
 Supplementary Figure 1. Baf60c and baf180 are induced during cardiac regeneration in zebrafish. RNA in situ hybridization was performed on paraffin sections from sham-operated adult hearts (a and i) and
Supplementary Table 1. Genes analysed for expression by angiogenesis gene-array.
 Supplementary Table 1. Genes analysed for expression by angiogenesis gene-array. Gene symbol Gene name TaqMan Assay ID UniGene ID 18S rrna 18S ribosomal RNA Hs99999901_s1 Actb actin, beta Mm00607939_s1
Figure S1. Generation of inducible PTEN deficient mice and the BMMCs (A) B6.129 Pten loxp/loxp mice were mated with B6.
 B6.129 Pten loxp/loxp mice were mated with B6.") Figure S1. Generation of inducible PTEN deficient mice and the BMMCs (A) B6.129 Pten loxp/loxp mice were mated with B6.129-Gt(ROSA)26Sor tm1(cre/ert2)tyj /J mice. To induce deletion of the Pten locus,
Figure S1. Generation of inducible PTEN deficient mice and the BMMCs (A) B6.129 Pten loxp/loxp mice were mated with B6.129-Gt(ROSA)26Sor tm1(cre/ert2)tyj /J mice. To induce deletion of the Pten locus,
SUPPLEMENTARY INFORMATION
 SUPPLEMENTARY INFORMATION Supplementary Figure 1. Generation of a conditional allele of the Kindlin-2 gene. (A) A restriction map of the relevant genomic region of Kindlin-2 (top), the targeting construct
SUPPLEMENTARY INFORMATION
 DOI: 10.1038/ncb2610 Figure S1 FSMCs derived from MSLN CLN transgenic mice express smooth muscle-specific proteins. Beta-galactosidase is ubiquitously expressed within cultured FSMCs derived from MSLN
Supplementary Materials for
 www.sciencesignaling.org/cgi/content/full/8/375/ra41/dc1 Supplementary Materials for Actin cytoskeletal remodeling with protrusion formation is essential for heart regeneration in Hippo-deficient mice
Fetal gene upregulation by 1-wk TAC is significantly increased in mice lacking RGS2.
 3562-RG-1 Supplementary Figure 1 Fetal gene upregulation by 1-wk is significantly increased in mice lacking RGS2. ANP(Nppa) /BNP(Nppb) A-type and B-type natriuretic peptide; β-mhc (Myh7) beta myosin heavy
Supplemental Figure 1. Western blot analysis indicated that MIF was detected in the fractions of
 Supplemental Figure Legends Supplemental Figure 1. Western blot analysis indicated that was detected in the fractions of plasma membrane and cytosol but not in nuclear fraction isolated from Pkd1 null
Supplementary Figure 1. Confocal immunofluorescence showing mitochondrial translocation of Drp1. Cardiomyocytes treated with H 2 O 2 were prestained
 Supplementary Figure 1. Confocal immunofluorescence showing mitochondrial translocation of Drp1. Cardiomyocytes treated with H 2 O 2 were prestained with MitoTracker (red), then were immunostained with
SUPPLEMENTARY INFORMATION
 a c e doi:10.1038/nature10407 b d f Supplementary Figure 1. SERCA2a complex analysis. (a) Two-dimensional SDS-PAGE gels of SERCA2a complexes. A silver-stained SDSPAGE gel is shown, which reveals a 12 kda
Supplementary Figure 1
 VO (ml kg - min - ) VCO (ml kg - min - ) Respiratory exchange ratio Energy expenditure (cal kg - min - ) Locomotor activity (x count) Body temperature ( C) Relative mrna expression TA Sol EDL PT Heart
Supplementary Figure 1. Expression of phospho-sik3 in normal and osteoarthritic articular cartilage in the knee. (a) Semiserial histological sections
 Semiserial histological sections") Supplementary Figure 1. Expression of phospho-sik3 in normal and osteoarthritic articular cartilage in the knee. (a) Semiserial histological sections of normal cartilage were stained with safranin O-fast
Supplementary Figure 1. Expression of phospho-sik3 in normal and osteoarthritic articular cartilage in the knee. (a) Semiserial histological sections of normal cartilage were stained with safranin O-fast
SOPten flox/flox (KO) Pten flox/flox (WT) flox allele 6.0 kb. Pten. Actin. ! allele 2.3 kb. Supplementary Figure S1. Yanagi, et al.
 Pten flox/flox (WT) flox allele 6.0 kb. Pten. Actin. ! allele 2.3 kb. Supplementary Figure S1. Yanagi, et al.") s1 A Pten flox/flox () SOPten flox/flox () flox allele 6. kb B Pten flox/flox () SOPten flox/flox () Pten Actin! allele 2.3 kb Supplementary Figure S1. Yanagi, et al. A B BrdU BrdU positive cells ( ) 3
s1 A Pten flox/flox () SOPten flox/flox () flox allele 6. kb B Pten flox/flox () SOPten flox/flox () Pten Actin! allele 2.3 kb Supplementary Figure S1. Yanagi, et al. A B BrdU BrdU positive cells ( ) 3
Uncovering the mechanisms of wound healing and fibrosis
 Any Questions??? Ask now or contact support support@sabiosciences.com 1-888-503-3187 International customers: SABio@Qiagen.com Uncovering the mechanisms of wound healing and fibrosis Webinar related questions:
(Stratagene, La Jolla, CA) (Supplemental Fig. 1A). A 5.4-kb EcoRI fragment
 (Supplemental Fig. 1A). A 5.4-kb EcoRI fragment") SUPPLEMENTAL INFORMATION Supplemental Methods Generation of RyR2-S2808D Mice Murine genomic RyR2 clones were isolated from a 129/SvEvTacfBR λ-phage library (Stratagene, La Jolla, CA) (Supplemental Fig.
SUPPLEMENTAL INFORMATION Supplemental Methods Generation of RyR2-S2808D Mice Murine genomic RyR2 clones were isolated from a 129/SvEvTacfBR λ-phage library (Stratagene, La Jolla, CA) (Supplemental Fig.
SUPPLEMENTARY FIGURES
 SUPPLEMENTARY FIGURES 1 Supplementary Figure 1, Adult hippocampal QNPs and TAPs uniformly express REST a-b) Confocal images of adult hippocampal mouse sections showing GFAP (green), Sox2 (red), and REST
(A) PCR primers (arrows) designed to distinguish wild type (P1+P2), targeted (P1+P2) and excised (P1+P3)14-
 PCR primers (arrows) designed to distinguish wild type (P1+P2), targeted (P1+P2) and excised (P1+P3)14-") 1 Supplemental Figure Legends Figure S1. Mammary tumors of ErbB2 KI mice with 14-3-3σ ablation have elevated ErbB2 transcript levels and cell proliferation (A) PCR primers (arrows) designed to distinguish
1 Supplemental Figure Legends Figure S1. Mammary tumors of ErbB2 KI mice with 14-3-3σ ablation have elevated ErbB2 transcript levels and cell proliferation (A) PCR primers (arrows) designed to distinguish
Supplemental Figure 1. Egr1 expression in adult Achilles tendons. (A,B) Achilles tendons were isolated from 2 month-old Egr1 +/- mice and stained for
 Achilles tendons were isolated from 2 month-old Egr1 +/- mice and stained for") Supplemental Figure 1. Egr1 expression in adult Achilles tendons. (A,B) Achilles tendons were isolated from 2 month-old Egr1 +/- mice and stained for LacZ activity, which reflects Egr1 expression. (A)
Supplemental Figure 1. Egr1 expression in adult Achilles tendons. (A,B) Achilles tendons were isolated from 2 month-old Egr1 +/- mice and stained for LacZ activity, which reflects Egr1 expression. (A)
SUPPLEMENTARY INFORMATION
 doi:10.1038/nature10188 Supplementary Figure 1. Embryonic epicardial genes are down-regulated from midgestation stages and barely detectable post-natally. Real time qrt-pcr revealed a significant down-regulation
Supplementary Information
 Supplementary Information Supplementary Figure 1! a! b! Nfatc1!! Nfatc1"! P1! P2! pa1! pa2! ex1! ex2! exons 3-9! ex1! ex11!!" #" Nfatc1A!!" Nfatc1B! #"!" Nfatc1C! #" DN1! DN2! DN1!!A! #A!!B! #B!!C! #C!!A!
B16F1 B16F10 Supplemental Figure S1
 B16F1 B16F1 Supplemental Figure S1 Representative microangiography images of B16F1 and B16F1 tumors grown in the cranial windows. FITC-dextran (2 million MW) was injected systemically to visualize blood
Supplemental Table 1. Primer sequences for transcript analysis
 Supplemental Table 1. Primer sequences for transcript analysis Primer Sequence (5 3 ) Primer Sequence (5 3 ) Mmp2 Forward CCCGTGTGGCCCTC Mmp15 Forward CGGGGCTGGCT Reverse GCTCTCCCGGTTTC Reverse CCTGGTGTGCCTGCTC
Supplementary Figure 1. Efficiency of Mll4 deletion and its effect on T cell populations in the periphery. Nature Immunology: doi: /ni.
 Supplementary Figure 1 Efficiency of Mll4 deletion and its effect on T cell populations in the periphery. Expression of Mll4 floxed alleles (16-19) in naive CD4 + T cells isolated from lymph nodes and
Supplemental Information. Myocardial Polyploidization Creates a Barrier. to Heart Regeneration in Zebrafish
 Developmental Cell, Volume 44 Supplemental Information Myocardial Polyploidization Creates a Barrier to Heart Regeneration in Zebrafish Juan Manuel González-Rosa, Michka Sharpe, Dorothy Field, Mark H.
Supporting Information
 Supporting Information Muraski et al. 10.1073/pnas.0709135105 SI Text Generation of Transgenic Animals. Pim-WT and Pim-DN cdnas were subcloned NheI/SmaI from pegfp-c1 Pim-1 and pegfp-c1 Pim-DN plasmids
Supplementary Figure 1. c Human
 Supplementary Figure 1 a b c Human Mouse d Gapdh Amino acid sequence and baseline expression of MYDGF N-terminal signal peptides (S-scores) and signal peptide cleavage sites (C-scores) of (a) human MYDGF
Supplementary Figure 1 IMQ-Induced Mouse Model of Psoriasis. IMQ cream was
 Supplementary Figure 1 IMQ-Induced Mouse Model of Psoriasis. IMQ cream was painted on the shaved back skin of CBL/J and BALB/c mice for consecutive days. (a, b) Phenotypic presentation of mouse back skin
Supplementary Figure S1 Enlarged coronary artery branches in Edn1-knockout mice. a-d, Coronary angiography by ink injection in wild-type (a, b) and
 and") Supplementary Figure S1 Enlarged coronary artery branches in Edn1-knockout mice. a-d, Coronary angiography by ink injection in wild-type (a, b) and Edn1-knockout (Edn1-KO) (c, d) hearts. The boxed areas
Supplementary Figure S1 Enlarged coronary artery branches in Edn1-knockout mice. a-d, Coronary angiography by ink injection in wild-type (a, b) and Edn1-knockout (Edn1-KO) (c, d) hearts. The boxed areas
Supporting Information
 Supporting Information M1 macrophage-derived nanovesicles potentiate the anticancer efficacy of immune checkpoint inhibitors Yeon Woong Choo, 1, Mikyung Kang, 2, Han Young Kim, 1 Jin Han, 1 Seokyung Kang,
EPIGENETIC RE-EXPRESSION OF HIF-2α SUPPRESSES SOFT TISSUE SARCOMA GROWTH
 EPIGENETIC RE-EXPRESSION OF HIF-2α SUPPRESSES SOFT TISSUE SARCOMA GROWTH Supplementary Figure 1. Supplementary Figure 1. Characterization of KP and KPH2 autochthonous UPS tumors. a) Genotyping of KPH2
Supplementary Figure 1. Repression of hepcidin expression in the liver of mice treated with
 Supplementary Figure 1. Repression of hepcidin expression in the liver of mice treated with DMN Immunohistochemistry for hepcidin and H&E staining (left). qrt-pcr assays for hepcidin in the liver (right).
Supplementary Materials and Methods
 Supplementary Materials and Methods Hepatocyte toxicity assay. Freshly isolated hepatocytes were incubated for overnight with varying concentrations (-25 µm) of sodium glycochenodeoxycholate (GCDC) or
Supporting Information
 Supporting Information Franco et al. 10.1073/pnas.1015557108 SI Materials and Methods Drug Administration. PD352901 was dissolved in 0.5% (wt/vol) hydroxyl-propyl-methylcellulose, 0.2% (vol/vol) Tween
SUPPLEMENTAL MATERIAL. Supplementary Methods
 SUPPLEMENTAL MATERIAL Supplementary Methods Culture of cardiomyocytes, fibroblasts and cardiac microvascular endothelial cells The isolation and culturing of neonatal rat ventricular cardiomyocytes was
A Hepatocyte Growth Factor Receptor (Met) Insulin Receptor hybrid governs hepatic glucose metabolism SUPPLEMENTARY FIGURES, LEGENDS AND METHODS
 Insulin Receptor hybrid governs hepatic glucose metabolism SUPPLEMENTARY FIGURES, LEGENDS AND METHODS") A Hepatocyte Growth Factor Receptor (Met) Insulin Receptor hybrid governs hepatic glucose metabolism Arlee Fafalios, Jihong Ma, Xinping Tan, John Stoops, Jianhua Luo, Marie C. DeFrances and Reza Zarnegar
A Hepatocyte Growth Factor Receptor (Met) Insulin Receptor hybrid governs hepatic glucose metabolism Arlee Fafalios, Jihong Ma, Xinping Tan, John Stoops, Jianhua Luo, Marie C. DeFrances and Reza Zarnegar
Supplemental Figures:
 Supplemental Figures: Figure 1: Intracellular distribution of VWF by electron microscopy in human endothelial cells. a) Immunogold labeling of LC3 demonstrating an LC3-positive autophagosome (white arrow)
SUPPLEMENTARY INFORMATION
 doi:10.1038/nature12652 Supplementary Figure 1. PRDM16 interacts with endogenous EHMT1 in brown adipocytes. Immunoprecipitation of PRDM16 complex by flag antibody (M2) followed by Western blot analysis
Supplementary information. The proton-sensing G protein-coupled receptor T-cell death-associated gene 8
 1 Supplementary information 2 3 The proton-sensing G protein-coupled receptor T-cell death-associated gene 8 4 (TDAG8) shows cardioprotective effects against myocardial infarction 5 Akiomi Nagasaka 1+,
Supplemental Figure 1. Intracranial transduction of a modified ptomo lentiviral vector in the mouse
 Supplemental figure legends Supplemental Figure 1. Intracranial transduction of a modified ptomo lentiviral vector in the mouse hippocampus targets GFAP-positive but not NeuN-positive cells. (A) Stereotaxic
(a-r) Whole mount X-gal staining on a developmental time-course of hearts from
 Whole mount X-gal staining on a developmental time-course of hearts from") 1 2 3 4 5 6 7 8 9 10 11 12 13 14 15 16 Supplementary Figure 1 (a-r) Whole mount X-gal staining on a developmental time-course of hearts from Sema3d +/- ;Ephb4 LacZ/+ and Sema3d -/- ;Ephb4 LacZ/+ embryos.
1 2 3 4 5 6 7 8 9 10 11 12 13 14 15 16 Supplementary Figure 1 (a-r) Whole mount X-gal staining on a developmental time-course of hearts from Sema3d +/- ;Ephb4 LacZ/+ and Sema3d -/- ;Ephb4 LacZ/+ embryos.
Lack of cadherins Celsr2 and Celsr3 impairs ependymal ciliogenesis, leading to fatal
 Lack of cadherins Celsr2 and Celsr3 impairs ependymal ciliogenesis, leading to fatal hydrocephalus Fadel TISSIR, Yibo QU, Mireille MONTCOUQUIOL, Libing ZHOU, Kouji KOMATSU, Dongbo SHI, Toshihiko FUJIMORI,
p = formed with HCI-001 p = Relative # of blood vessels that formed with HCI-002 Control Bevacizumab + 17AAG Bevacizumab 17AAG
 A.. Relative # of ECs associated with HCI-001 1.4 1.2 1.0 0.8 0.6 0.4 0.2 0.0 ol b p < 0.001 Relative # of blood vessels that formed with HCI-001 1.4 1.2 1.0 0.8 0.6 0.4 0.2 0.0 l b p = 0.002 Control IHC:
Supplementary Information
 Supplementary Information Overexpression of Fto leads to increased food intake and results in obesity Chris Church, Lee Moir, Fiona McMurray, Christophe Girard, Gareth T Banks, Lydia Teboul, Sara Wells,
Moore-Morris et al. Supplemental Table 1.
 Moore-Morris et al. Supplemental Table. In vivo echocardiographic assessment of cardiac size and function following transaortic constriction (T) at 7d and 8d. SHM 7d N=6 T 7d N=5 SHM 8d N= T 8d N=6 W,
Supplementary Figure 1. Generation of knockin mice expressing L-selectinN138G. (a) Schematics of the Sellg allele (top), the targeting vector, the
 Schematics of the Sellg allele (top), the targeting vector, the") Supplementary Figure 1. Generation of knockin mice expressing L-selectinN138G. (a) Schematics of the Sellg allele (top), the targeting vector, the targeted allele in ES cells, and the mutant allele in
Supplementary Figure 1. Generation of knockin mice expressing L-selectinN138G. (a) Schematics of the Sellg allele (top), the targeting vector, the targeted allele in ES cells, and the mutant allele in
Supporting Information Table of Contents
 Supporting Information Table of Contents Supporting Information Figure 1 Page 2 Supporting Information Figure 2 Page 4 Supporting Information Figure 3 Page 5 Supporting Information Figure 4 Page 6 Supporting
Figure S1. (A) Schematic diagram of dnrar transgene allele. (B) X-Gal staining of testis from
 Schematic diagram of dnrar transgene allele. (B) X-Gal staining of testis from") Figure S1. (A) Schematic diagram of dnrar transgene allele. (B) X-Gal staining of testis from germ cell mutants (dnrar flox/flox, Stra8-Cre +, RARElacZ) (A ), controls (dnrar flox/flox, RARElacZ) (B ),
Figure S1. (A) Schematic diagram of dnrar transgene allele. (B) X-Gal staining of testis from germ cell mutants (dnrar flox/flox, Stra8-Cre +, RARElacZ) (A ), controls (dnrar flox/flox, RARElacZ) (B ),
Supplementary Figure 1 Maladaptive response to TAC in CD-Klf5KO mice
 Supplementary Figure Legends Supplementary Figure 1 Maladaptive response to TAC in CD-Klf5KO mice a, Echocardiography was performed with the mice 3 days after TAC or sham operation. Representative echocardiograms
Control. csarnt -/- Cre, f/f
 ody weight (g) A re,f/f re x f/f f/+ re, f/+ re,f/+ f/f x f/f f/+ cs -/- re, f/f re f/f re, f/f Normal chow Tamoxifen Tamoxifen Tamoxifen W 4W re f/f re, re/ff f/f re f/f re, re/ff f/f Normal chow Tamoxifen
stability and tumor suppression
 Supplementary information The stress kinase MKK7 couples oncogenic stress to p53 stability and tumor suppression Daniel Schramek 1, Athanassios Kotsinas 2, Arabella Meixner 1, Teiji Wada 1, Ulrich Elling
AP VP DLP H&E. p-akt DLP
 A B AP VP DLP H&E AP AP VP DLP p-akt wild-type prostate PTEN-null prostate Supplementary Fig. 1. Targeted deletion of PTEN in prostate epithelium resulted in HG-PIN in all three lobes. (A) The anatomy
Qualifying Examination (Part I)
") Department of Pharmacology Qualifying Examination (Part I) December 12 & 13, 2006 Please remember that this is a closed-book examination. You must be prepared to answer 4 of the 7 questions. Although not
Department of Pharmacology Qualifying Examination (Part I) December 12 & 13, 2006 Please remember that this is a closed-book examination. You must be prepared to answer 4 of the 7 questions. Although not
Supplementary methods:
 Supplementary methods: Primers sequences used in real-time PCR analyses: β-actin F: GACCTCTATGCCAACACAGT β-actin [11] R: AGTACTTGCGCTCAGGAGGA MMP13 F: TTCTGGTCTTCTGGCACACGCTTT MMP13 R: CCAAGCTCATGGGCAGCAACAATA
Supplementary Fig. 1. The Brown Norway rat has higher coronary flow compared to other rat strains. Publically available data for coronary flow
 Supplementary Fig. 1. The Brown Norway rat has higher coronary flow compared to other rat strains. Publically available data for coronary flow measured ex vivo on Langendorff apparatus under intrinsic
Supplementary Figure 1. AdipoR1 silencing and overexpression controls. (a) Representative blots (upper and lower panels) showing the AdipoR1 protein
 Representative blots (upper and lower panels) showing the AdipoR1 protein") Supplementary Figure 1. AdipoR1 silencing and overexpression controls. (a) Representative blots (upper and lower panels) showing the AdipoR1 protein content relative to GAPDH in two independent experiments.
Supplementary Figure 1. AdipoR1 silencing and overexpression controls. (a) Representative blots (upper and lower panels) showing the AdipoR1 protein content relative to GAPDH in two independent experiments.
Supplementary Figure 1. Spatial distribution of LRP5 and β-catenin in intact cardiomyocytes. (a) and (b) Immunofluorescence staining of endogenous
 and (b) Immunofluorescence staining of endogenous") Supplementary Figure 1. Spatial distribution of LRP5 and β-catenin in intact cardiomyocytes. (a) and (b) Immunofluorescence staining of endogenous LRP5 in intact adult mouse ventricular myocytes (AMVMs)
Supplementary Figure 1. Spatial distribution of LRP5 and β-catenin in intact cardiomyocytes. (a) and (b) Immunofluorescence staining of endogenous LRP5 in intact adult mouse ventricular myocytes (AMVMs)
SUPPLEMENTARY INFORMATION
 1. Supplementary Figures and Legends Supplementary Fig. 1. S1P-mediated transcriptional regulation of integrins expressed in OP/monocytoid cells. Real-time quantitative PCR analyses of mrna for two integrins,
Supplemental Figure I
 Supplemental Figure I Kl ( mmol/l)-induced Force orta M (mn) 1 (mn) 1 Supplemental Figure I. Kl-induced contractions. and, Kl ( mmol/l)-induced contractions of the aorta () and those of mesenteric arteries
Kidney. Heart. Lung. Sirt1. Gapdh. Mouse IgG DAPI. Rabbit IgG DAPI
 a e Na V 1.5 Ad-LacZ Ad- 110KD b Scn5a/ (relative to Ad-LacZ) f 150 100 50 0 p = 0.65 Ad-LacZ Ad- c Heart Lung Kidney Spleen 110KD d fl/fl c -/- DAPI 20 µm Na v 1.5 250KD fl/fl Rabbit IgG DAPI fl/fl Mouse
Supplemental Table 1. Plasma NEFA and liver triglyceride levels in ap2-hif1ako and ap2-hif2ako mice under control and high fat diets.
 Supplemental Table 1. Plasma NEFA and liver triglyceride levels in Hif1aKO and Hif2aKO mice under control and high fat diets. Hif1a (n=6) Hif1aK O (n=6) Hif2a Hif2aK O Hif1a (n=5) Hif1aKO (n=5) Hif2a Hif2aK
SUPPLEMENTARY FIGURE LEGENDS. atypical adenomatous hyperplasias (AAH); Grade II: adenomas; Grade III: adenocarcinomas;
; Grade II: adenomas; Grade III: adenocarcinomas;") SUPPLEMENTARY FIGURE LEGENDS Supplementary Figure S1: Tumor grades in Ras G12D ; p53 / lung tumors. Representative histology (H&E) of K-Ras G12D ; p53 / lung tumors 13 weeks after tumor initiation. Grade
SUPPLEMENTARY FIGURE LEGENDS Supplementary Figure S1: Tumor grades in Ras G12D ; p53 / lung tumors. Representative histology (H&E) of K-Ras G12D ; p53 / lung tumors 13 weeks after tumor initiation. Grade
(a) Significant biological processes (upper panel) and disease biomarkers (lower panel)
 Significant biological processes (upper panel) and disease biomarkers (lower panel)") Supplementary Figure 1. Functional enrichment analyses of secretomic proteins. (a) Significant biological processes (upper panel) and disease biomarkers (lower panel) 2 involved by hrab37-mediated secretory
Supplementary Figure 1. Functional enrichment analyses of secretomic proteins. (a) Significant biological processes (upper panel) and disease biomarkers (lower panel) 2 involved by hrab37-mediated secretory
Supplemental Figure 1: Leydig cells are reduced at multiple stages in both male sterile mutants
 SUPPLEMENTAL FIGURE LEGENDS: Supplemental Figure 1: Leydig cells are reduced at multiple stages in both male sterile mutants (Sgpl1 -/- and Plekha1 -/- ). Using an antibody against CYP11a1 to label Leydig
Supplementary Figure 1:
 Supplementary Figure 1: (A) Whole aortic cross-sections stained with Hematoxylin and Eosin (H&E), 7 days after porcine-pancreatic-elastase (PPE)-induced AAA compared to untreated, healthy control aortas
Zhu et al, page 1. Supplementary Figures
 Zhu et al, page 1 Supplementary Figures Supplementary Figure 1: Visual behavior and avoidance behavioral response in EPM trials. (a) Measures of visual behavior that performed the light avoidance behavior
(A) RT-PCR for components of the Shh/Gli pathway in normal fetus cell (MRC-5) and a
 RT-PCR for components of the Shh/Gli pathway in normal fetus cell (MRC-5) and a") Supplementary figure legends Supplementary Figure 1. Expression of Shh signaling components in a panel of gastric cancer. (A) RT-PCR for components of the Shh/Gli pathway in normal fetus cell (MRC-5) and
Supplementary figure legends Supplementary Figure 1. Expression of Shh signaling components in a panel of gastric cancer. (A) RT-PCR for components of the Shh/Gli pathway in normal fetus cell (MRC-5) and
Supplementary Figure 1
 Supplementary Figure 1 YAP negatively regulates IFN- signaling. (a) Immunoblot analysis of Yap knockdown efficiency with sh-yap (#1 to #4 independent constructs) in Raw264.7 cells. (b) IFN- -Luc and PRDs
Supplemental Figure 1
 Supplemental Figure 1 A S100A4: SFLGKRTDEAAFQKLMSNLDSNRDNEVDFQEYCVFLSCIAMMCNEFFEGFPDK Overlap: SF G DE KLM LD N D VDFQEY VFL I M N FF G PD S100A2: SFVGEKVDEEGLKKLMGSLDENSDQQVDFQEYAVFLALITVMCNDFFQGCPDR
Islet viability assay and Glucose Stimulated Insulin Secretion assay RT-PCR and Western Blot
 Islet viability assay and Glucose Stimulated Insulin Secretion assay Islet cell viability was determined by colorimetric (3-(4,5-dimethylthiazol-2-yl)-2,5- diphenyltetrazolium bromide assay using CellTiter
In Vivo Animal Models of Heart Disease. Why Animal Models of Disease? Timothy A Hacker, PhD Department of Medicine University of Wisconsin-Madison
 In Vivo Animal Models of Heart Disease Timothy A Hacker, PhD Department of Medicine University of Wisconsin-Madison Why Animal Models of Disease? Heart Failure (HF) Leading cause of morbidity and mortality
Nature Immunology: doi: /ni Supplementary Figure 1. Huwe1 has high expression in HSCs and is necessary for quiescence.
 Supplementary Figure 1 Huwe1 has high expression in HSCs and is necessary for quiescence. (a) Heat map visualizing expression of genes with a known function in ubiquitin-mediated proteolysis (KEGG: Ubiquitin
Nature Immunology: doi: /ni Supplementary Figure 1. Gene expression profile of CD4 + T cells and CTL responses in Bcl6-deficient mice.
 Supplementary Figure 1 Gene expression profile of CD4 + T cells and CTL responses in Bcl6-deficient mice. (a) Gene expression profile in the resting CD4 + T cells were analyzed by an Affymetrix microarray
SUPPLEMENTARY INFORMATION
 DOI:.38/ncb3399 a b c d FSP DAPI 5mm mm 5mm 5mm e Correspond to melanoma in-situ Figure a DCT FSP- f MITF mm mm MlanaA melanoma in-situ DCT 5mm FSP- mm mm mm mm mm g melanoma in-situ MITF MlanaA mm mm
GFP/Iba1/GFAP. Brain. Liver. Kidney. Lung. Hoechst/Iba1/TLR9!
 Supplementary information a +KA Relative expression d! Tlr9 5!! 5! NSC Neuron Astrocyte Microglia! 5! Tlr7!!!! NSC Neuron Astrocyte! GFP/Sβ/! Iba/Hoechst Microglia e Hoechst/Iba/TLR9! GFP/Iba/GFAP f Brain
To compare the relative amount of of selected gene expression between sham and
 Supplementary Materials and Methods Gene Expression Analysis To compare the relative amount of of selected gene expression between sham and mice given renal ischemia-reperfusion injury (IRI), ncounter
Supplementary information
 Supplementary information Human Cytomegalovirus MicroRNA mir-us4-1 Inhibits CD8 + T Cell Response by Targeting ERAP1 Sungchul Kim, Sanghyun Lee, Jinwook Shin, Youngkyun Kim, Irini Evnouchidou, Donghyun
Target Protein Antibody name Product number Manufacturer Species Epitope Dilution Aggrecan Anti-aggrecan AB1031 EMD Millipore Corp Rabbit
 Family history Hypertension/ Maximum Degree of aortic Bicuspid Disease Age/Sex Diagnosed CTD of aortic disease Treated aortic insufficiency/stenosis aortic Aneurysm 63/M No Yes Yes/Yes diameter 59mm 1-2+/None
SUPPLEMENTARY INFORMATION
 Suppl. Fig. 1 in vivo expression of ISL1 in the human fetal heart. a, Hematoxylin eosin staining showing structures of left atrium and left atrium appendage (*) of a human fetal heart at 11 weeks of gestation.
MEK-ERK pathway modulation ameliorates disease phenotypes in a mouse model of Noonan syndrome associated with the Raf1 L613V mutation
 Related Commentary, page 844 Research article MEK-ERK pathway modulation ameliorates disease phenotypes in a mouse model of Noonan syndrome associated with the Raf1 L613V mutation Xue Wu, 1,2 Jeremy Simpson,
BIOL2005 WORKSHEET 2008
 BIOL2005 WORKSHEET 2008 Answer all 6 questions in the space provided using additional sheets where necessary. Hand your completed answers in to the Biology office by 3 p.m. Friday 8th February. 1. Your
Soft Agar Assay. For each cell pool, 100,000 cells were resuspended in 0.35% (w/v)
") SUPPLEMENTARY MATERIAL AND METHODS Soft Agar Assay. For each cell pool, 100,000 cells were resuspended in 0.35% (w/v) top agar (LONZA, SeaKem LE Agarose cat.5004) and plated onto 0.5% (w/v) basal agar.
SUPPLEMENTARY MATERIAL AND METHODS Soft Agar Assay. For each cell pool, 100,000 cells were resuspended in 0.35% (w/v) top agar (LONZA, SeaKem LE Agarose cat.5004) and plated onto 0.5% (w/v) basal agar.
Title: Smooth muscle cell-specific Tgfbr1 deficiency promotes aortic aneurysm formation by stimulating multiple signaling events
 Title: Smooth muscle cell-specific Tgfbr1 deficiency promotes aortic aneurysm formation by stimulating multiple signaling events Pu Yang 1, 3, radley M. Schmit 1, Chunhua Fu 1, Kenneth DeSart 1, S. Paul
Figure S1. Sorting nexin 9 (SNX9) specifically binds psmad3 and not psmad 1/5/8. Lysates from AKR-2B cells untreated (-) or stimulated (+) for 45 min
 specifically binds psmad3 and not psmad 1/5/8. Lysates from AKR-2B cells untreated (-) or stimulated (+) for 45 min") Figure S1. Sorting nexin 9 (SNX9) specifically binds psmad3 and not psmad 1/5/8. Lysates from AKR2B cells untreated () or stimulated () for 45 min with 5 ng/ml TGFβ or 10 ng/ml BMP4 were incubated with
Figure S1. Sorting nexin 9 (SNX9) specifically binds psmad3 and not psmad 1/5/8. Lysates from AKR2B cells untreated () or stimulated () for 45 min with 5 ng/ml TGFβ or 10 ng/ml BMP4 were incubated with
Cells and reagents. Synaptopodin knockdown (1) and dynamin knockdown (2)
 and dynamin knockdown (2)") Supplemental Methods Cells and reagents. Synaptopodin knockdown (1) and dynamin knockdown (2) podocytes were cultured as described previously. Staurosporine, angiotensin II and actinomycin D were all obtained
Supplemental Methods Cells and reagents. Synaptopodin knockdown (1) and dynamin knockdown (2) podocytes were cultured as described previously. Staurosporine, angiotensin II and actinomycin D were all obtained
Supplementary Figures
 Supplementary Figures Supplementary Figure 1. Confirmation of Dnmt1 conditional knockout out mice. a, Representative images of sorted stem (Lin - CD49f high CD24 + ), luminal (Lin - CD49f low CD24 + )
Electron micrograph of phosphotungstanic acid-stained exosomes derived from murine
 1 SUPPLEMENTARY INFORMATION SUPPLEMENTARY FIGURES Supplementary Figure 1. Physical properties of murine DC-derived exosomes. a, Electron micrograph of phosphotungstanic acid-stained exosomes derived from
Supplementary Figures
 Supplementary Figures Supplementary Figure 1 Correlation between LKB1 and YAP expression in human lung cancer samples. (a) Representative photos showing LKB1 and YAP immunohistochemical staining in human
SUPPLEMENTARY INFORMATION
 Figure S1 Treatment with both Sema6D and Plexin-A1 sirnas induces the phenotype essentially identical to that induced by treatment with Sema6D sirna alone or Plexin-A1 sirna alone. (a,b) The cardiac tube
Supporting Information
 Supporting Information Kuroda et al. 10.1073/pnas.1002178107 SI Methods Monoclonal Antibodies Against Nox4. Generation of the anti-nox4 mouse monoclonal antibody (3D2), which detects Nox4 and does not
AAV-TBGp-Cre treatment resulted in hepatocyte-specific GH receptor gene recombination
 AAV-TBGp-Cre treatment resulted in hepatocyte-specific GH receptor gene recombination Supplementary Figure 1. Generation of the adult-onset, liver-specific GH receptor knock-down (alivghrkd, Kd) mouse