Basic ECG Rhythm Interpretation
|
|
|
- Louisa Harrell
- 5 years ago
- Views:
Transcription
1 Basic ECG Rhythm Interpretation Textbook for OSU Medical Center Basic ECG Dysrhythmia Course Published by: Department of Educational Development & Resources The Ohio State University Medical Center OSU revised May 2007
2 The Department of Educational Development and Resources at the Ohio State University Medical Center would like to acknowledge Sandra Walden MS, RN for her original creation of the Basic ECG Course and manual (1988; Revised 2002). This manual is intended to be used as a reference only-it does not supersede OSUMC policy or physician orders. Applicable Policies: 1. Pain and Symptom Management 2. ECG Monitoring, Continuous 3. Defibrillation, AED and Emergency Response 4. Pacemakers 5. Telemetry Beds, Adult Divisional Standards of Practice 2
3 Basic ECG Rhythm Interpretation Objectives At the completion of this course the learner will be able to: 1. Identify the sequence of normal electrical activation of the heart. 2. Describe the physiology of cardiac muscle contraction. 3. Given a rhythm strip, identify Sinus, Atrial, Junctional and Ventricular dysrhythmias, and Atrioventricular Blocks. 4. Identify the appropriate nursing and medical interventions, and first line medications for ECG rhythms. 5. Score at least 85% competency on the posttest. 3
4 GLOSSARY Aberrant Conduction - Term applied to abnormal (slowed) intraventricular conduction of supraventricular (above the ventricles) impulses caused by a transient functional delay or block (slowed conduction) in one or more of the conducting fascicles (conduction system) causing a wide QRS. Arrhythmia - Absence of heart rhythm Artifact - Man-made disturbance in the EKG tracing; due to poor electrode contact or muscle activity originating outside the heart. Dysrhythmia - A disturbance in the heart rhythm (abnormality) Ectopic Focus - A site that initiates an electrical impulse other than the SA Node (usually prematurely due to irritability of the part of the myocardium) Escape Pacemaker - (Backup) An alternate site capable of initiating an electrical impulse to ultimately stimulate a heart beat when the SA Node fails to do so. Electrodes -Sensing devices placed on the chest (or extremities) for the purpose of detecting electrical impulses traveling through the heart. Focus - Site of impulse formation Infranodal - Adjective referring to focus below the AV Node. Isoelectric Line - The imaginary line on which the ECG waves are drawn; also called the baseline or PR Line. Multifocal - Adjective describing ectopic foci that originates from multiple sites, thereby causing configurations (shapes) different from each other. Multiformed Adjective describing multiple morphology (shape) of the qrs in a rhythm. The shapes vary therefore the likelihood is increased that the ectopic foci originate from multiple sites. (Multiformed is preferred over multifocal). Retrograde Conduction - An electrical impulse travels the opposite direction from normal. It is usually associated with an ectopic focus that occurs in the Junction, forming a retrograde P wave. The P wave will be inverted and either is seen before or after the QRS or is not seen at all. Supraventricular - Adjective referring to a dysrhythmia originating above the ventricles (SA Node or Atria), usually characterized by a qrs complex of normal width. Unifocal - Adjective describing an ectopic focus that originates from one focus. The complexes seen are uniform. Uniform Adjective describing the uniform shape of the qrs complexes in a rhythm Frequently Used Abbreviations AV Atrioventricular PAC Premature Atrial Contraction (APC) ECG Electrocardiogram PJC Premature Junctional Contraction (JPC) EKG Electrocardiogram PVC Premature Ventricular Contraction (VPC) NSR Normal Sinus Rhythm SVT Supraventricular Tachycardia PAT Paroxysmal Atrial Tachycardia SA Sinoatrial 4
5 Contents Chapter Content Pages Chapter One Basic Principles 5-27 Chapter Two Sinus Rhythms Chapter Three Atrial & SVT Rhythms Chapter Four Junctional Rhythms Chapter Five Ventricular Rhythms Chapter Six Pulseless Electrical Activity Chapter Seven AV Blocks Chapter Eight Temporary Ventricular Pacers Appendix Appendix Practice Strips Integrated Practice 5
6 Chapter One Basic Principles Published by: Department of Educational Development & Resources The Ohio State University Medical Center OSU revised May
7 Chapter One BASIC PRINCIPLES OBJECTIVES 1. Review anatomy of the heart. 2. Describe two myocardial cell types. 3. Describe four properties of cardiac cells. 4. Discuss the process of depolarization and repolarization. 5. Describe the sequence of electrical activation of the heart. 6. Correctly label the ECG complex. 7. Demonstrate computation of the heart rate on a rhythm strip, using two different methods. 8. Identify four potential pacemakers in the heart. 9. Analyze a rhythm strip in a systematic fashion. 7
8 BASIC CARDIAC ANATOMY AND PHYSIOLOGY CARDIAC ANATOMY: The heart is a muscular pump. The left side of the heart is the larger and thicker side. It does more work because it pumps oxygenated blood into the aorta and then throughout the entire body. The thinner, right side of the heart pumps the same amount of blood, but only has to send it a short distance into the lungs via the pulmonary arteries. Each side of the heart consists of two chambers, an atrium and a ventricle. The thick walled ventricles are the larger pumping chambers that expel blood from the heart with each beat (contraction or systole.) The relatively thin-walled atria function as collecting and loading chambers. The atria hold blood being returned to the heart during ventricular systole. In between contractions, the ventricles are relaxed (diastole). During diastole, blood flows into the ventricles from the atria, at first passively, and then propelled by atrial contraction (atrial systole). Strategically located valves prevent backflow of blood. The mitral valve is between the left atrium and ventricle, the aortic valve between the aorta and left ventricle, the tricuspid valve between the right ventricle and right atrium and the pulmonary valve between the main pulmonary artery and the right ventricle. The endocardium is a layer of smooth lining cells. These cells are found not only in the heart but also on the inside of all the blood vessels of the body, where they are called endothelium. The myocardium is the mass of heart muscle cells whose coordinated contraction causes the chambers of the heart to contract and pump blood. The myocardium is thin in the atria, thicker in the right ventricle and thickest in the left ventricle. The epicardium is a fatty layer on the outer surface of the myocardium. The major coronary blood vessels, the vessels that supply blood to the heart itself, run through the epicardium. The outermost layer is the pericardium, actually two layers with a small amount of lubricating fluid between them, forming the pericardial sac, which encloses the entire heart. Coronary Vein Coronary Artery Pericardium Epicardium Myocardium Endocardium
9 CORONARY CIRCULATION The heart is always in continuous action. In order to maintain aerobic metabolism and contractile activity, the heart must be able receive oxygen and nutrients and have carbon dioxide and other wastes removed. This is accomplished through coronary circulation. The heart is supplied by 2 major coronary arteries: the right coronary artery (RCA) and the left coronary artery (LCA). These arteries arise from the aorta immediately distal to the aortic valve. Coronary perfusion occurs during diastole. The RCA supplies the right atrium, right ventricle, and a portion of the posterior and inferior surfaces of the left ventricle. The RCA supplies the AV node and bundle of His in 90% of hearts and the sinus node in 55% of hearts. The LCA is the main coronary artery that passes between the left atrial appendage and the pulmonary artery and then divides into two major branches, the left anterior descending artery (LAD) and the left circumflex artery (LCA). The LAD is responsible for supplying portions of the left and right ventricular myocardium and the majority of the interventricular septum. The (LCA) supplies the lateral wall and posterior wall of the left ventricle, SA node (45%), AV node (10%), and posterior inferior portion of the LBB. With knowledge of coronary anatomy, we can anticipate complications of various coronary artery blockages. Since the RCA supplies the SA Node in 55% of hearts and the AV Node in 90% of hearts, we can anticipate problems that would arise with a compromise of these primary pacemakers such as sinus bradycardia, sinus arrest, junctional rhythms and AV Block rhythms. Since the LCA perfuses the anterior wall of the heart, we can anticipate problems that would result from a lack of pump function, such as congestive heart failure, cardiogenic shock, and ventricular irritability. It is important to understand which areas of the heart are perfused by which coronary artery, and to anticipate the possible complications of an occlusion. CARDIAC CYCLE Blood is propelled to the body by the sequential activation of the cardiac chambers through electrical and mechanical factors. The cardiac cycle is divided into two major phases, ventricular systole and diastole. Ventricular Systole: Ventricular contraction follows the ventricular depolarization reflected by the electrocardiographic QRS wave. Ventricular pressure increases rapidly. This results in the opening of the pulmonic and aortic valves. At the onset of this period, pressures in the atrium and ventricle are approximately equal, but atrial pressure decreases with atrial muscle relaxation and repolarization. The tricuspid and mitral valves are closed as the atria fill with blood. Ventricular Diastole: Ventricular muscle relaxation begins, pressure decreases, ventricular filling occurs as the tricuspid and mitral valves open and blood flows from the atria into the relaxed ventricles. During diastole, approximately 75% of blood flows passively from the atria through the open tricuspid and mitral valves into the ventricles even before the atria contract. Atrial contraction (atrial kick) contributes an additional 25% to ventricular filling. 9
10 CARDIC OUTPUT Cardiac output is the amount of blood the left ventricle pumps into the aorta per minute. This is a systolic event. The stroke volume times the number of cardiac cycles per minute (heart rate) equals the cardiac output. The ejection fraction (EF) is the percentage of total ventricular volume injected during each contraction. Normally it is greater than 55% and usually is approximately 65%. Three factors affect or determine stroke volume: Preload: is the degree of stretch, or tension, on the muscle fibers when they begin to contract. Afterload: is the load or amount of pressure the left ventricle must work against to eject blood during systole and corresponds to the systolic pressure. The greater the resistance is, the greater the heart s workload. Afterload is sometimes called systemic vascular resistance. Contractility: is the ventricles ability to contract, which is determined by the degree of muscle fiber stretch at the end of diastole. The more the muscle fibers stretch during ventricular filling, up to an optimal length, the more forceful the contraction. Frank-Starling law of the heart This law defines the fundamental principle of cardiac behavior which states that the force of contraction of the cardiac muscle is proportional to its initial length. The energy set free at each contraction is a simple function of cardiac filling. When the diastolic filling of the heart is increased or decreased with a given volume, the displacement of the heart increases or decreases with this volume. BASIC ANATOMY OF THE CONDUCTION SYSTEM Stimulation of the heart originates in the Sympathetic and Parasympathetic branches of the Autonomic Nervous System. The impulse travels first to the Sinoatrial Node (SA Node) located in the posterior wall of the right atrium. The SA Node is the main cardiac pacemaker from which wave-like impulses are sent through the atria stimulating first the Right and then the Left Atrium. The SA Node is richly supplied with both Vagal and Sympathetic nerve fibers and the former are derived mainly from the right Vagus Nerve. Under normal circumstances the SA Node will initiate electrical impulses at the rate of 60 to 100 times per min. Physiologic and Anatomic studies indicate that the Sinus impulse spreads in the Atria and to the AV Node through the three (3) Atrial internodal tracts. 10
11 1. The anterior internodal tract divides into two parts, one going to the left atrium and known as Bachman's Bundle, the other descending to the upper margin of the A-V node. 2. The middle internodal tract, or Wenckebach Bundle, which descends within the interatrial septum to enter the upper part of the A-V node. 3. The Posterior Internodal Tract--or Thorel's tract reaches the interatrial septum and enters the posterior margin of the AV node. As soon as the Atria have been stimulated, the impulse slows as it passes through the Atrioventricular (AV) Node, which lies in the inferior posterior portion of the Right Atrium. The AV node has two vital functions in serving the heart. 1. The AV Node has the ability to protect the ventricles from excessively fast rates that may originate in the atria. 2. The area just above and just below the AV Node (AV Junction) like the SA node, may also serve as the pacemaker for the heart, should the SA node or atrial tissue fail to initiate impulses or should the impulse fail to reach the AV node. The AV Junction will normally initiate impulses at 40 to 60 times per minute when functioning as the pacemaker. (AV Junction includes the A-N region, the AV Node and the N-H region- see AV Junction figure on Page 11). The AV node itself is totally devoid of pacemaking cells. The wave of excitation then spreads to the Bundle of HIS (common bundle) which is continuous with the AV node and reaches the interventricular septum where it divides into the right and left bundle branches. The right bundle branch runs along the right side of the interventricular septum, and reaches the base of the anterior papillary muscle of the right ventricle where it divides into a network supplying the right ventricular myocardium. The left bundle branch runs along the left side of the interventricular septum and divides almost immediately into an anterior (superior) division and an inferior (posterior) division. The anterior division, a relatively long and thin pathway reaches the base of the anterior papillary muscle and supplies the anterior superior part of the left ventricle. The posterior division, a relatively short and thick structure, passes to the base of the posterior papillary muscle and supplies the inferior posterior aspect of the left ventricle. The intraventricular conduction system is therefore composed of three conduction pathways, also called fascicles; the right bundle branch, the anterior division of the left bundle branch, and the posterior division of the left bundle branch. The right bundle branch and both the anterior and posterior divisions of the left bundle branch divide into a complex network of fibers, called the Purkinje fibers, which is distributed to the ventricular myocardium. The fibers are more abundant in the subendocardial layers and are longer than the common myocardial fibers. The Purkinje fibers in the human heart are believed to lack nerve supply entirely. 11
12 The ventricles also have the ability to function as a backup pacemaker (escape mechanism), should they not receive impulses from the S-A node, atrial tissue or AV node. The ventricles may be considered a much less efficient backup system, for the rate at which they normally initiate impulses (inherent rate) is times per minute. Electrical Conduction System SA Node Atrial Tracts Bundle of HIS AV Node Left Bundle Branch Right Bundle Branch Purkinje Fibers AV Junction A-N Region Pacemaker Inherent Rate SA Node AV Node N-H Region HIS Bundle Atrial Tissue 75 AV Junction Ventricles
13 ELECTROPHYSIOLOGICAL PROPERTIES PROPERTIES of CARDIAC CELLS Cardiac cells have three electrical properties: 1. Automaticity 2. Excitability 3. Conductivity AUTOMATICITY: The heart has the property of initiating and maintaining rhythmic activity without the help of its neurological supply. The myocardial cells that possess the property of automaticity are called pacemaking cells. Under normal circumstances the pacemaking cells with the highest degree of automaticity and more rapid discharge rate are located in the Sinus Node, the primary pacemaking focus of the heart. Pacemaking cells with a lesser degree of Automaticity and slower inherent or natural discharge rate are present in the atria, in the AV Junction and in the ventricles; forming auxiliary ectopic pacemaking foci (sites). The more peripheral the site of the pacemaking focus from the SA Node, the slower its automaticity and inherent discharge rate. EXCITABILITY: Both pacemaking and non-pacemaking myocardial cells have the property of responding to a natural or artificial electrical stimulus. This ability to respond to an impulse or stimulus is called excitability. CONDUCTIVITY: Conductivity is the property that allows the myocardial cell to propagate an impulse to a neighboring cell. An impulse of adequate strength originating in any area of the heart during its resting period creates a wave of excitation that is propagated over the whole tissue. The cardiac cells also have one mechanical property: 1. Contractility CONTRACTILITY: Contractility is the ability of the cardiac muscle to respond to an electrical impulse with pump action. (the ability of the muscle to shorten and contract). DYSRHYTHMIAS The terms dysrhythmia and arrhythmia are used interchangeably in the literature. Since dysrhythmia means an abnormality in rhythm, whereas arrhythmia indicates an absence of rhythm, the former term will be used in this text. Cardiac dysrhythmias may result from one of the following mechanisms: Disturbances in automaticity Disturbances in conductivity Combinations of altered automaticity and conductivity. 13
14 ELECTRICAL ACTIVITY OF THE HEART In order to better understand disturbances in the electrical activity of the heart, it is important to have a basic knowledge of the electrical properties of the working and electrical system cells. MYOCARDIAL CELL TYPES: There are two basic groups of cells within the myocardium which are important for cardiac function: 1. Working Myocardial Cells - possess the property of contractility, or the ability to shorten and then return to their original length. 2. Electrical System Cells - Cells belonging to the electrical system that are responsible for conduction of the electrical stimulus to the working cells of the myocardium. Working Cells (Contraction of the Myocardial Cells) - Cardiac muscle cells are polarized during the resting state. During resting the cells have a negative charge inside the cell membrane and a positive charge outside the cell membrane. When the cell membrane is electrically stimulated a process called depolarization occurs. Electrical stimulation of the cell results in a change in the electrical properties of the cell (depolarization) by causing the flux of positive ions into the cell and negative ions outside the cell membrane. Once depolarized, the cell shortens and contracts. Next the cell repolarizes returning the negative ions inside the cell membrane and positive ions outside the cell. Once repolarized, the cell returns to the resting state ready for depolarization and repolarization to occur again. SA Node Cell at Rest Depolarized Cell Shortens & Contracts 14
15 Electrical System Cells The electrical wave is propagated from cardiac cell to cell and fiber to fiber through the heart via the electrical system. The rate at which the impulse travels (conduction velocity) varies. The conduction velocity is the slowest through the AV Node; Ventricular muscle conducts 6 times the speed of the AV Node; Atrial muscle at 20 times the speed of the AV Node velocity; and the Bundle Branches and Purkinje Fibers conduct at 40 times the rate of the AV Node. This rapid conduction through the entire electrical system occurs normally and contributes toward an organized and efficient contraction. Should a site outside the electrical system initiate an impulse (for example, a ventricular site), a different mechanism of depolarization occurs. Because the impulse occurs outside the specialized electrical system cells, asynchronous activation of the right and left ventricle occurs and in addition the conduction velocity is slowed through the myocardial cells. This results in a wide bizarre qrs. THE ELECTROCARDIOGRAM An electrocardiogram is a graphic tracing of voltage produced by depolarization and repolarization of the heart muscle. It is important to remember that the ECG shows you only the electrical activity of the heart it shows nothing related to the mechanical function of the heart muscle. When no current is flowing, the stylus (writing point) of the electrocardiograph does not move, and a straight line is recorded. A current flow causes a deflection (movement) of the stylus, so that a wave is inscribed on the ECG paper. Normal movements from the baseline are called waves and are designated P, q, R, s, T and U. The spaces between the waves, which usually appear as straight lines, are called segments and are named by the waves they separate (for example, ST segment between the S and T waves). Intervals are also named by the waves at their beginning and end, for example, PR interval, but their measurement is from the beginning of the first wave, unlike the segments whose measurement starts at the end of the first wave. An interval ends with the start of the wave at its end just like a segment does, with one exception; the qt interval is measured from the start of the q wave to the end of the T wave. A complex includes more than one wave (qrs complex). Each wave recorded on the electrocardiogram corresponds to a particular event in the cardiac cycle. Although the heart consists of several layers, it is only the heart muscle cell layer (myocardium) that generates currents large enough to be recorded by the electrocardiograph. The current recorded by the electrocardiograph at any moment is the sum of all the currents flowing in cells throughout the heart at the particular instant. Deflections that emanate above the isoelectric line are called positive deflections. Deflections that radiate below the isoelectric line are considered negative deflections. Isoelectric Positive Negative 15
16 ELECTRODE PLACEMENT Electrodes are small patches which are placed on the chest to transmit electrical activity from the heart to the telemetry system. Correct electrode placement is critical in order to correctly identify cardiac rhythms and rhythm disturbances. Research has shown that when an electrode is misplaced by 1 intercostal space, the morphology of the qrs can change dramatically and missed diagnosis may occur There are certain leads that are appropriate for specific dysrhythmias. For example, leads V1 and V6 are the leads of choice to differentiate Ventricular Tachycardia from SVT (AACN Practice Alert: Dysrhythmia Monitoring, 2004). Telemetry devices can be portable and fit into the pocket of a gown, or they can be hardwired to the central nursing station or a bedside monitor. There are 3, 5 and even 12-lead bedside systems. If you have the capability with your monitoring system, it is always wise to display two leads from two different areas of the heart to maximize your ability to capture ectopy or ECG changes. Skin preparation is another important factor in the quality of an ECG. The skin should be cleaned with soap and water or alcohol and allowed to dry. Gentle abrasion of the electrode sites with a washcloth aids with impulse transmission. It may be necessary to shave the sites. Before applying the electrodes, ensure that the conductive gel is moist and intact, and attach the lead wires. Avoid bony prominences. 2 nd ICS Right Mid- Clavicular Line 2 nd ICS Left Mid- Clavicular Line 8th ICS Right Mid-Clavicular Line 2 nd ICS Right Mid- Clavicular Line 2 nd ICS Left Mid-Clavicular Line 4 th ICS Right Sternal Border 8th ICS Left Mid-Clavicular Line 16
17 Normal ECG Complex The wave of depolarization spreading through the heart can be recorded on paper. This is called the electrocardiogram ECG (EKG). The electrical stimulus originating from the SA Node proceeds away from the node concentrically in all directions in an enlarging circular wave. This electrical impulse spreads across the atria and yields a P Wave on the ECG. The P wave represents atrial depolarization electrically. P Waves Normal Inverted Notched Peaked The impulse then reaches the AV Node, where conduction is the slowest. The impulse takes 1/10 second to travel through the node, allowing blood to enter the ventricles. This time frame is shown on the ECG as the P-R interval, which is measured from the onset of the P wave to the beginning of the QRS complex. The normal P-R interval is seconds PR Interval 17
18 After the 1/10 second pause, the AV Node is stimulated, initiating an electrical impulse that starts down the AV bundle into the Bundle Branches, to the Purkinje fibers and into the myocardial cells, causing ventricular depolarization. The electrical activity of the stimulation of the ventricles is represented by the qrs complex. The q wave is the first downward stroke of the qrs complex and is followed by the upward R wave. The q wave is often not present. The upward R wave is followed by a downward s wave. This total complex duration represents the electrical activity of ventricular depolarization and contraction. Normal duration of the qrs is seconds R = first positive deflection R = first positive deflection q = negative deflection preceding R s = negative deflection following R q = negative deflection preceding R s = negative deflection following R Variation of qrs Complexes R s R q s r S Q S There is a pause after ventricular depolarization that is represented by the ST segment, which normally is on the isoelectric (flat) line having no voltage from the end of the S wave to the beginning of the T wave. R S R S R S R 18
19 Elevated Depressed Normal ST Segment S-T segments Recent studies have shown the importance of continuous ST segment monitoring, especially in patients with acute coronary syndromes presenting to the ED, patients undergoing a catheterbased procedure, patients with a cardiac history undergoing a surgical procedure and patients in the ICU following cardiac surgery (AACN Practice Alert: ST Segment Monitoring, 2004). Continuous ST segment monitoring allows for continuous monitoring of ST segment for changes associated with ischemia to allow early indications of ischemia even in the absence of chest pain (Dennison, 2000, p.56). It is important to realize that elevation or depression of just 1mm is considered significant. Just as with dysrhythmia detection, in which leads V1 and V6 were optimal, leads III and V3 are optimal to detect ST segment deviations. However, if the patient has had a 12-lead ECG, you can determine which lead will be the most appropriate based on their individual ischemic event. Typically, ST segment elevation represents injury or severe ischemia, and ST segment depression represents ischemia. The repolarization of the ventricles then occurs so that heart cells can regain the negative charge and, thus, may depolarize again. Final repolarization is represented by the T wave. T Waves Normal T Inverted Peaked 19
20 The q-t interval is measured from the onset of the qrs complex to the completion of the T wave. The normal duration of the q-t (with a normal rate ) is generally seconds. The typical qt interval should not exceed more than one-half of the preceding R-R interval. Count the number of small boxes between two consecutive R waves and divide by 2. Count the number of small boxes in the qt interval. If the qt is longer than ½ of the R-R measurement, the qt is prolonged. This method is called the qtc (or the qt calculated to take heart rate into account) and is the most accurate method of determining the length of the qt interval. The Corrected qt (qtc) equation is qt/sqrt (RR). The qt interval should be calculated with each rhythm interpretation according to hospital or unit policy (see policy ECG Monitoring, Continuous), and be monitored for trends. A prolonged qt interval shows that there is a delay in ventricular repolarization. This means that the relative refractory period (the most vulnerable part of the cardiac cycle) is prolonged and this can place the patient at risk for Torsades de Pointe. Some references site a qtc of > 0.50 seconds as a risk for Torsades de Pointe. Specific risk factors include certain medications such as Amiodarone, hypokalemia, low magnesium and calcium levels, bradydysrhythmias, and hypothermia. q-t interval 20
21 A U wave, a small wave of low voltage, is sometimes seen following the T wave. It is often best discerned in lead V3. It is rendered more prominent by potassium deficiency, and its polarity is often reversed in myocardial ischemia and left ventricular strain. The U Wave's precise significance is uncertain. In the cardiac cycle it coincides with the phase of supernormal excitability during ventricular recovery, and in this connection it is interesting to note that most ventricular premature beats occur at about the U wave. It is important to distinguish U waves from a second P wave. U Wave 21
22 P-QRS-T-U Waves Summary P Waves Represent atrial depolarization Should be smooth and round Should be upright in all leads except avr May be diphasic or biphasic (both positive and negative components) May be notched or peaked Should be one P for every qrs complex PR Interval Normal duration = seconds Measured from the beginning of the P to the beginning of the qrs Represents atrial depolarization + delay through the AV Node qrs Complex Normal duration 0.10 seconds or less Measured from the beginning of the qrs complex to the end of the S (the J-point) Represents ventricular depolarization Atrial repolarization is hidden within the qrs q = first downward deflection before the R wave R = first initial upward deflection following the P wave s = first downward deflection following the R wave; the J-point is the point at which the s wave returns to baseline ST Segment Period between the completion of ventricular depolarization and beginning of final ventricular repolarization. Normally found on the isoelectric line; may be elevated or depressed T Wave Represents recovery phase Normally upright in all leads except avr Round and asymmetrical U Wave Occurs after the T wave (not always present) Important to distinguish from second P wave QT Interval Measured from the beginning of the qrs complex to the end of the T wave Normal interval is dependent on rate and gender (normal seconds) 22
23 R PR interval P T q s qrs interval qt Interval 23
24 Each rhythm strip should be analyzed in a systematic fashion. It is helpful to consider the Five Steps of ECG Rhythm analysis. The Five Steps of ECG Rhythm Analysis 5. Identify the Rhythm 4. Measure Intervals 3. Examine P-qRs-T waves 2. Calculate Heart Rate 1. Determine regularity Step 1 Determine Regularity RHYTHM The rhythm is said to be regular when there is a constant distance between similar waves (P-P or R-R). To determine whether the rhythm is regular or irregular place the straight edge of a piece of paper along the baseline of the rhythm strip. Then, move the paper up slightly so that the straight edge is near the top peak of the P waves. With your pencil, make a dot on the paper at each of two consecutive P waves; this is the P-P interval. Now, move the paper across the strip from left to right lining up the dots with each consecutive P wave. If each distance between all the P waves is the same, the atrial rhythm is regular, if the distance varies, the atrial rhythm is irregular. Next, using the same method, measure the distance between consecutive R waves (the R-R interval) to determine whether the ventricular rhythm is regular or irregular. 24

, the rhythm is considered essentially regular (even though it is slightly irregular).")
25 Calipers may also be used to achieve measurement (a more accurate technique). The rhythm is considered regular if all the R-R measurements are consistent. If the rate is within a normal range of beats per minute, and the R-R interval varies no more than 3 small boxes (0.12 sec), the rhythm is considered essentially regular (even though it is slightly irregular). This 0.12 second leeway in regularity does not apply to rates above
. There are five small squares between the heavy black lines.")


26 Step 2 Calculate the Heart Rate ECG PAPER The ECG is recorded on ruled paper. The smallest divisions are one millimeter squares (one mm long and one mm high). There are five small squares between the heavy black lines. The height and depth of a wave is measured in millimeters and represents a measure of voltage. Time The horizontal axis represents time. The amount of time represented by the distance between the heavy black lines is 0.20 seconds. There are five small squares between the heavy black lines. Therefore each small square represents 0.04 seconds. By measuring along the horizontal axis the duration of any part of the cardiac cycle can be determined. One Large Square 0.04 x 5 = 0.20 seconds 1 small box =.04 sec (1mm) 5 mm or 5 small boxes = 0.20 sec 3 Second Lines Time 0.20 x 5 = 1 second 0.20 x 10 = 2 seconds 0.20 x 15 = 3 seconds 6 seconds = 30 Large or 150 Small Boxes 26
27 Step 2 Calculate the Heart Rate The rate of any cardiac rhythm can be quickly determined from an ECG strip. Once you understand the layout and measurement of the graph paper, rate calculations become easy. Most ECG recorders in North America run ECG paper at 25mm/sec. (Remember Large boxes = 0.20 seconds in time and small boxes = 0.04 seconds in time). Three methods for determining heart rates will be discussed. The method used for rate measurement is determined by whether the rhythm is regular or irregular. If the rhythm is regular the Grid or Ruler Method can determine the rate accurately. If the rhythm is irregular the best means for determining the rate is the Scan Method. Time Small boxes (1 = 0.04 seconds) Large Boxes (1 = 0.20 seconds) 0.04 seconds 1 small box 0.20 seconds 5 small boxes 1 large box 1 second 25 small boxes 5 large boxes 3 seconds 75 small boxes 15 large boxes 6 seconds 150 small boxes 30 large boxes 60 seconds 1500 small boxes* 300 large boxes* * = Number of small and large boxes in a minute 1. Grid Method The rate can be determined by counting the number of boxes, small or large, between R waves and then dividing that number into 1500 or 300 respectively. (See example strips below) Large Boxes between R Waves = 50 Rate = Small Boxes between R Waves = 50 Rate = 50 27
28 1. The Grid Method is done by either dividing 1500 (1500 smaller, 1mm, squares in one minute) by the number of small boxes between 2 R waves or by dividing 300 (300 large, 5mm, squares in one minute) by the number of large boxes between 2 R waves. The Grid method is the most accurate, yet very time consuming to calculate and impractical when trying to get a quick estimate of the heart rate. The large box method can be completed quickly by memorization. The Grid Method is limited to regular rhythms. Large Squares Between R Waves Rate Per Minute 1 Large Square Large Squares Large Squares Large Squares 75 5 Large Squares 60 6 Large Squares 50 7 Large Squares 42 Memorize 2. The Scan Method is done by counting the number of R waves in a 6 second strip and then multiplying by 10 (6 seconds x 10 = 60 seconds; therefore the number of R waves per 6 second strip multiplied by 10 gives the rate/minute). The scan method is the most practical and commonly used because calculations can be determined for both regular and irregular rhythms quickly. 6 Seconds 3 Seconds 5 R waves/6 second strip = 5 x 10 Rate = 50/minute 28

29 3. Three Beat Ruler Method is done by using a commercially developed ruler. Place the first qrs complex on the 0. Next, count three complexes over; the rate on the ruler corresponds with the third complex. Rate = 50 0 Mark 1 st Complex 2 nd Complex 3 rd Complex Step 3 Examine P-qRs-T Waves P WAVES After assessing the rate and rhythm, the next step is to examine the P waves. Determine the following: Are P waves present and in front of all qrs complexes? Does a P wave follow the qrs complex? Is there 1P:1qRs relationship? Are the P waves all a similar shape? Are the P waves all upright (positive) in all leads except avr? qrs complexes Next determine the following: Are the qrs complexes present with each p wave? 29
 and ends with the first deflection of the qrs complex.")
. The qrs PR interval = 0.")
30 Step 4 Measure PR Intervals and qrs Complexes PR INTERVAL The next step is to measure the PR Interval. The PR interval begins with the initiation of the P wave (where the slope of the P wave first leaves the isoelectric line) and ends with the first deflection of the qrs complex. Are PR Intervals within normal limits (0.12 seconds 0.20 seconds)? Are PR Intervals consistent (constant)? J Point qrs Duration The qrs should measure between 0.04 seconds up to 0.10 seconds (not equal to or greater than 0.12 seconds). The qrs PR interval = 0.16 seconds begins at the point where the complex begins (either with a q or R) and ends with the J point (sometimes referred to as the J junction). The J point is defined as the point at which the s wave returns to baseline and the ST segment begins. Normal qrs duration is 0.04 seconds 0.10 seconds QT Intervals The Q-T interval is measured from the first initiation of the qrs complex to the end of the T wave. Normal Q-T intervals are based on rate and gender. The Q-T grows shorter as the rate increases. (See chart on next page) qt Interval= 0.40 seconds 30
31 Normal Q-T Intervals Heart Rate Men & Children Women seconds seconds seconds seconds seconds seconds seconds seconds seconds seconds seconds seconds seconds seconds Step 5 Identify the Rhythm Once all of the steps have completed and the information examined, a correct and complete interpretation can be made. The steps are summarized below, along with normal ranges noted. Rate = per minute Rhythm = Regular P waves = Present, similar, 1 and only 1 P for each qrs PRI = seconds and consistent qrs = seconds P: qrs = One P for each qrs 31
32 Chapter Two Rhythms Originating from the Sinus Node Published by: Department of Educational Development & Resources The Ohio State University Medical Center OSU revised May
33 Objectives Chapter Two 1. Identify normal Sinus Rhythm. 2. Compare and contrast Normal Sinus Rhythm, Sinus Bradycardia and Sinus Tachycardia. 3. Differentiate normal Sinus Rhythm from Sinus Arrhythmia and Sinus Pause or Sinus Arrest. 29
34 The Sinus Complex The salient point for identifying a complex from the Sinus Node is the presence of a normal P wave. In lead II normal P waves will have a shape that is rounded, upright and similar to each other. A normal P wave in Lead avr will be inverted; and in V1 may be biphasic (have both a negative and positive component. Normal P Wave Lead II Normal P Wave Lead avr Normal P Wave Lead V 1 The normal qrs will also vary from lead to lead. It should be upright or positive in Lead II. Most normal qrs complexes in Lead II will not have a visible q Wave, while a normal q wave may be present in Leads I, avl, V5 & V6. Normal qrs Lead I Therefore any complex that has originated from the SA Node will have this normal P-qRs-T configuration. 30
35 If the impulse from the SA Node is normally conducted down through the atrial tracts, the AV Node, the Bundle of HIS, the bundle branches and the purkinje system, the sinus complex will have normal PR interval ( second) and qrs duration ( second). Every complex arising from the SA node that is conducted normally will have similar morphology. Sinus rhythms have the following ECG characteristics in common: One Sinus P wave for each qrs and similar to each other, PR and qrs intervals normal and constant PR intervals. ECG characteristics that vary are rate and rhythm. Sinus rhythms include: Normal Sinus Rhythm Sinus Tachycardia Sinus Bradycardia Sinus Dysrhythmia Sinus Pause (Arrest) Sinus Rhythms ECG Summary Rate: , >100 or < 60 per minute Rhythm: R- R = or P Waves: Upright (except AVR); similar P-R interval: seconds & consistent qrs: seconds P to qrs: 1P:1qRs 31
36 Normal Sinus Rhythm (NSR) Normal sinus rhythm represents a regular discharge of the sinus node with subsequent atrial depolarization at a rate between per minute. The rhythm is regular (or slightly irregularno more than 3 small boxes or 0.12 seconds difference in R-R intervals when the rate is ). ECG Summary Rate: per minute Rhythm: R- R = (no more than 0.12 seconds difference in R-R when the rate is ) P Waves: Upright (except AVR); similar P-R interval: seconds & consistent qrs: seconds P to qrs: 1P:1qRs Normal Sinus Rhythm = P Waves = R Waves = T Waves Rate: 80 Rhythm: R R = PRI: seconds qrs: 0.08 seconds 32

37 Sinus Tachycardia Sinus Tachycardia represents an increase in the rate of discharge of the sinus node. It may be secondary to multiple factors and is a physiologic response to a demand for a higher cardiac output. ECG Summary Rate: > 100 (usually not > 150) Rhythm: R- R = P Waves: Upright (except AVR); similar P-R interval: seconds & consistent qrs: seconds P to qrs: 1P:1qRs Causes of Sinus Tachycardia: Exercise Hypovolemia Medications Fever Hypoxia Substances Anxiety, Fear Acute MI Fight or Flight Congestive Heart Failure Therapy: None specific for this dysrhythmia Assess patient to determine stability and notify the physician if new rhythm and/or unstable Treat underlying cause 6 Seconds 3 Second Mark 1 Second Marks Rate = 120 Sinus Tachycardia 33

38 Sinus Bradycardia Sinus Bradycardia is a decrease in the rate of atrial depolarization subsequent to a slowing of the sinus node. It may be secondary to intrinsic sinus node disease, increased parasympathetic tone, or drug effect. ECG Summary Rate: < 60 (usually 40-59) Rhythm: R- R = P Waves: Upright (except AVR); similar P-R interval: seconds & consistent qrs: seconds P to qrs: 1P:1qRs Causes: Healthy Athlete Sinus Node Disease Sleep Medications Increased Vagal Tone Increased Intracranial Pressure Valsalva maneuver, Vomiting, Suctioning Therapy: Stable Assess patient; notify physician if new rhythm; 12-lead ECG; observe Unstable Notify physician, 12-lead ECG, support ABCs/determine need for oxygen, confirm or initiate IV, Monitor, Atropine 0.5mg IVP, pacemaker (see page 35 for unstable parameters) See OSUMC or unit-specific policy regarding oxygen administration Rate - 38 Sinus Bradycardia 34
39 Unstable Four basic parameters classify a patient as unstable. They are: Hypotension Systolic blood pressure 90 mmhg, signs of shock Altered mental status Shortness of breath pulmonary congestion Ischemic chest pain Sinus Dysrhythmia (Sinus Arrhythmia) Sinus Dysrhythmia is a normal variation of Normal Sinus Rhythm and in most cases is considered a normal rhythm. The rhythm has slight irregularities. A rhythm strip may appear normal but when measured, the P-P and R-R intervals will reveal a variation of the rhythm (to be considered irregular the R-R must vary more than 0.12 seconds). The most common type of Sinus Dysrhythmia is found in children and is usually associated with respiration; that is the rate speeds up with inspiration and slows with expiration. There are also non-respiratory versions. Some Sinus Dysrhythmias may be bradycardic, if so then the rhythm name would be Sinus Bradydysrhythmia. (A tachycardic rate would be called Sinus Tachydysrhythmia). It is important to differentiate Sinus Dysrhythmia from a Normal Sinus Rhythm with ectopy. With Sinus Dysrhythmia, all the complexes and waveforms are identical because they originate in the same focus (the SA Node). Ectopic complexes will differ in appearance from the underlying rhythm which is how you know they came from a different focus (atrial tissue, AV Junction, etc.). ECG Summary Rate: (may also be < 60 or > 100) Rhythm: R- R ( > 0.12 seconds difference) P Waves: Upright (except AVR); similar P-R interval: seconds & consistent qrs: seconds P to qrs: 1P:1qRs Causes: 35

40 Normal in children, young adults & the elderly Coronary Artery Disease Medications Treatment: Assess patient to determine stability; 12-lead ECG, notify physician if new rhythm or unstable Generally no treatment is required. If the patient is unstable, it is due to a bradycardic rate Sinus Dysrhythmia Rate = R-R = 0.60 seconds R-R = 0.78 seconds Sinus Pause Occasionally, the SA Node will fail momentarily and will not initiate an impulse. This might be due to increased vagal stimulation, pharyngeal irritation, carotid sinus massage or deep inspiration. In the case of severely delayed or even permanent cessation, alternative or secondary pacemakers may takeover and maintain the heart rhythm. Two rhythms fall under the Sinus Pause category: Sinus Arrest and Sinus Exit Block. Sinus Arrest Sinus Arrest is a failure of the SA Node to initiate an impulse. This is a disorder of automaticity. The rhythm will be slightly irregular as the SA Node will not resume on time after the arrest. Sinus Exit Block 36
41 In Sinus Exit Block, the SA Node initiates impulses in a regular rhythm; however, some of the impulses are blocked as they leave the SA Node and therefore do not reach the atria. This is a disorder of conductivity. This rhythm will have P waves that march out. Clinically, it is not necessary to distinguish between a Sinus Arrest and a Sinus Exit Block. If the underlying rhythm is irregular (Sinus Dysrhythmia) then differentiation is impossible, and the general term of Sinus Pause is used. Sinus Pause ECG Summary Rate: Usually < 60 due to the pause Rhythm: R- R due to the pause P Waves: Upright (except AVR); similar P-R interval: seconds & consistent qrs: seconds P to qrs: 1P:1qRs Causes: Vagal Stimulation overeating, caffeine, nicotine Pharyngeal irritation -Intubation Valsalva maneuver - Carotid Sinus Massage, deep inspiration Sick Sinus Node Medications Coronary Artery Disease, Myocardial Infarction Treatment: Stable Assess patient to determine stability; 12-lead ECG, determine need for oxygen, ensure adequate IV access, notify physician if new, observe Unstable Ensure ABCs/determine need for oxygen; notify physician; initiate or confirm IV access, Atropine 0.5mg IVP; pacemaker 37

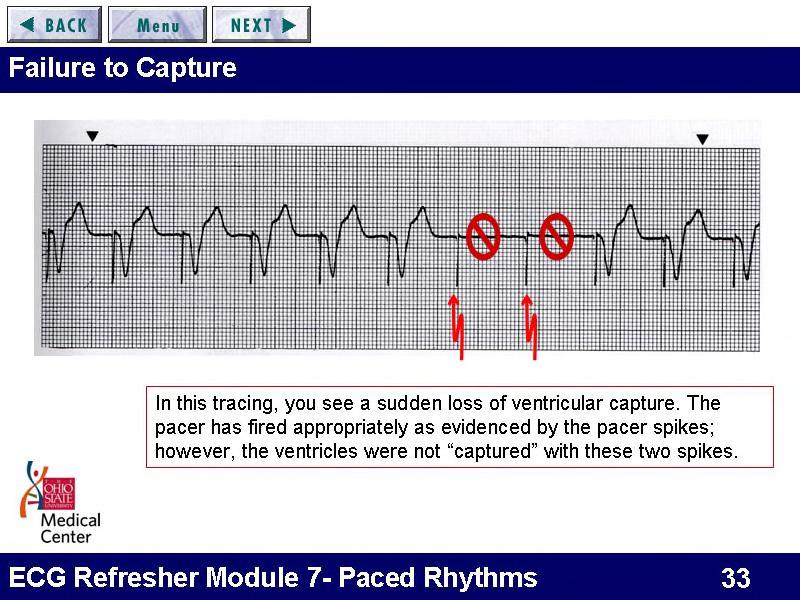
42 Normal Sinus Rhythm with a 2.44 Second Sinus Pause. R R = Before and After Pause Sinus Arrest interval = Measure from the start of the P before the pause to the start of the P after the pause = 2.44 Second Sinus Pause It is imperative to measure and document the length of the pause and assess the patient s tolerance of the pause. Does the patient complain of dizziness, shortness of breath or chest pain? Is the blood pressure stable? With any dysrhythmia, the nurse needs to begin to assess the possible causes of the rhythm disturbance and have that information ready to discuss with the physician and health-care team. As you will see, there are several common causes of the various dysrhythmias such as hypoxia, cardiac ischemia, electrolyte imbalance and acidosis just to name a few. It is pointless to simply medicate for the dysrhythmia if the underlying cause is not corrected. Clinical Picture It is just as imperative for the nurse or healthcare provider to notice and document trends in the clinical picture. Trends in vital signs, physical assessments or patient complaints can assist the healthcare provider in anticipating untoward clinical events. When these signs are not recognized, this is known as Failure to Rescue. It has been shown that patients will exhibit signs and symptoms as far out as 24 to 48 hours prior to full cardiac arrest. The ECG is just one tool that, if used correctly, can provide clues to the patient s underlying disease process or injury. 38


43 Electrocardiographic Artifact Electrocardiographic artifact or electrical noise can be seen on the ECG strip as a result of patient body movement, muscle tremor, electrical current near the patient, or poor skin-toelectrode contact. It is important to recognize artifact as such and not to confuse it with other rhythms such as Atrial Fibrillation or Ventricular Tachycardia. R P T Normal Sinus Rhythm with Artifact Documentation & Housekeeping The monitor ECG strip should be placed in the Nursing and Allied Health Professions Notes. A note immediately following the strip should include the patient s name, date, time, rhythm interpretation, heart rate, PR interval, qrs interval, QT interval, any wave abnormalities and RN signature. Rhythm interpretation documentation should include a full description such as Normal Sinus Rhythm with 2.44 second Sinus Pause. Do not write directly on the rhythm strip! Rhythm strips should be obtained at least every 8 hours (or per unit-specific policy) and with any significant change in rhythm. Monitor recall should be done per unit policy. The alarm limits should be set at bpm (unless physician order dictates otherwise), and telemetry batteries should be changed q24 hours (Policy: ECG Monitoring, Continuous). 39
44 Bradycardia Assess patient to determine stability Stable or Unstable? Stable Unstable Yes Notify MD if new rhythm 12-lead ECG Ensure IV access Observe and Reassess No Ensure ABCs/determine need for oxygen Notify MD Initiate or confirm IV access (at least 2 sites) Remain with patient and continually reassess Atropine 0.5mg IVP (total dose of 3mg) TCP or Transvenous pacer Dopamine or Epinephrine drips (Hypotension) Sinus Rhythms Causes and Treatments 40
45 Rhythm Causes Treatment Sinus Tachycardia Exercise Temperature Hypovolemia, Dehydration Stress, Anxiety, Fight or Flight Hypoxia, CHF, Acute MI Sympathetic Stimulation Meds or Substances Treat or remove cause MI Beta Blockers Sinus Bradycardia Normal Increased Vagal Tone Medications Diseased SA Node Hypothermia Stable Notify MD if new rhythm; 12-lead ECG; Observe & Reassess Unstable Notify MD Ensure ABCs/determine need for oxygen Ensure IV Access Atropine 0.5mg IV Pacemaker Sinus Dysrhythmia Normal Coronary Artery Disease Myocardial Infarction Medications Sinus Pause (Arrest) Increased Vagal Tone Coronary Artery Disease Rheumatic Heart Disease Myocarditis Medications Assess Notify MD if new rhythm Stable Notify MD if new rhythm; 12-lead ECG; Observe & Reassess Unstable Notify MD Ensure ABCs O2 at 2L/NC Ensure IV Access Atropine 0.5mg Pacemaker 41
46
47
48
49
50
51

52
53
54
55
56
57
58

 P:qRs 1:1 Rhythm: R Sinus Tachycardia Sinus Bradycardia Sinus")


59 ECG Rhythm Characteristics Ohio State University Medical Center Rhythm P waves qrs Notes Round, upright, Rate: bpm Normal Sinus Rhythm similar PRI: (NSR) P:qRs 1:1 Rhythm: R Sinus Tachycardia Sinus Bradycardia Sinus Dysrhythmia Round, upright, similar PRI: P:qRs 1:1 Round, upright, similar PRI: P:qRs 1:1 Round, upright, similar PRI: P:qRs 1: bpm Rhythm: R bpm Rhythm: R Rate: variable Rhythm: I PAC Varies from sinus Ps; small, peaked or notched; may be buried in preceding sinus T wave; PRI may be different than sinus PRI Rate: Variable Rhythm: I (d/t PAC) Timing: Early OSU June 2006 Revised August 07 1


60 ECG Rhythm Characteristics Ohio State University Medical Center Rhythm P waves qrs Notes Rate: 150 bpm Supraventricular Not visible Tachycardia (SVT) PRI: N/A Rhythm: R Atrial Flutter Atrial Fibrillation PJC Junctional escape Rhythm N/A F or flutter waves PRI: N/A N/A Fibrillating baseline PRI: N/A No P wave, or inverted P wave before or after qrs PRI: 0.12 if present before qrs No P wave, or inverted P wave before or after qrs PRI: 0.12 if present before qrs Rate: Variable Rhythm: R or I Saw tooth pattern Rate: Varies Rhythm: I Rate: Varies Rhythm: I (d/t PJC) Timing: Early Rate: bpm Rhythm: R OSU June 2006 Revised August 07 2


 Timing: Early Pattern: Bigeminyevery other beat;")
61 ECG Rhythm Characteristics Ohio State University Medical Center Rhythm P waves qrs Notes Accelerated Junctional No P wave, or inverted P wave before or after qrs Rate: bpm Rhythm: R Junctional Tachycardia PRI: 0.12 if present before qrs No P wave, or inverted P wave before or after qrs Rate: bpm PRI: 0.12 if present before qrs PVC None >0.12 Rate: Variable Rhythm: I (d/t PVC) Timing: Early Pattern: Bigeminyevery other beat; Trigeminy-every third beat; Multiformeddifferent shapes; Couplet-two in a row OSU June 2006 Revised August 07 3


62 ECG Rhythm Characteristics Ohio State University Medical Center Rhythm P waves qrs Notes Idioventricular Rhythm None >0.12 Rate: bpm Rhythm: R PRI: N/A Accelerated Idioventricular None PRI: N/A >0.12 Rate: bpm Rhythm: R Ventricular Tachycardia None PRI: N/A >0.12 Rate: >100 bpm Rhythm: R Ventricular Fibrillation None PRI: N/A N/A Rate: N/A Rhythm: Chaos OSU June 2006 Revised August 07 4
 PRI: N/A Any organized")


63 ECG Rhythm Characteristics Ohio State University Medical Center Rhythm P waves qrs Notes May be N/A Asystole present; round, upright & similar Rate: 0 Rhythm: R (if P waves present) PRI: N/A Any organized rhythm that should perfuse but patient is PULSELESS = Rhythm Name with PEA 1 st degree AV Block Round, upright, similar PRI: >0.20 but < Only block that does not drop qrs Consistent PRI 2 nd degree AV Block, Type II P:qRs 1:1 Round, upright, similar PRI: normal or long; consistent across strip OR 0.12 Consistent PRI when P conducts to qrs; unpredictable drop of qrs #P > #qrs OSU June 2006 Revised August 07 5


64 ECG Rhythm Characteristics Ohio State University Medical Center Rhythm P waves qrs Notes 2 nd degree AV Block, Type I Round, upright, similar Cyclic pattern PRI: progressive lengthening until drop of qrs #P > #qrs Inconsistent PRI Predictable drop of qrs after lengthening PRI 3 rd degree AV Block Round, upright, similar PRI: N/A #P > #qrs OR 0.12 qrs march out Inconsistent PRI No relationship between P and qrs Ps march out OSU June 2006 Revised August 07 6
65 ECG Rhythm Characteristics Ohio State University Medical Center Drugs Defib Synch Cardiovert TCP Atropine Adenosine Amiodarone Lidocaine Epinephrine OSU June 2006 Revised August 07 7


66 CONDUCTION SYSTEM IN RELATION TO HEART STRUCTURES SA Node Intrinsic Rate Atrial Rhythms AV Junction Intrinsic Rate Ventricular Rhythm Intrinsic Rate 20-40
CORONARY ARTERIES. LAD Anterior wall of the left vent Lateral wall of left vent Anterior 2/3 of interventricluar septum R & L bundle branches
 CORONARY ARTERIES RCA Right atrium Right ventricle SA node 55% AV node 90% Posterior wall of left ventricle in 90% Posterior third of interventricular septum 90% LAD Anterior wall of the left vent Lateral
UNDERSTANDING YOUR ECG: A REVIEW
 UNDERSTANDING YOUR ECG: A REVIEW Health professionals use the electrocardiograph (ECG) rhythm strip to systematically analyse the cardiac rhythm. Before the systematic process of ECG analysis is described
Basic ECG Interpretation Module Notebook
 Basic ECG Interpretation Module Notebook ECG_Notebook_04.27.05 Page 1 of 142 Basic ECG Interpretation Table of Contents Module Objectives... 3 Module Outline... 6 Lesson I... 6 Lesson II... 8 Lesson III...
Atlantic Health System
 Atlantic Health System Morristown Medical Center Newton Medical Center Overlook Medical Center Basic Dysrhythmia Course Day 1 1 2 Chapter 1 Anatomy and Physiology Learning Objectives 1) Identify electrophysiology
11/10/2014. Muscular pump Two atria Two ventricles. In mediastinum of thoracic cavity 2/3 of heart's mass lies left of midline of sternum
 It beats over 100,000 times a day to pump over 1,800 gallons of blood per day through over 60,000 miles of blood vessels. During the average lifetime, the heart pumps nearly 3 billion times, delivering
Full file at
 MULTIPLE CHOICE. Choose the one alternative that best completes the statement or answers the question. 1) What electrical event must occur for atrial kick to occur? 1) A) Atrial repolarization B) Ventricular
ECG Interpretation Cat Williams, DVM DACVIM (Cardiology)
") ECG Interpretation Cat Williams, DVM DACVIM (Cardiology) Providing the best quality care and service for the patient, the client, and the referring veterinarian. GOAL: Reduce Anxiety about ECGs Back to
ECG Interpretation Cat Williams, DVM DACVIM (Cardiology) Providing the best quality care and service for the patient, the client, and the referring veterinarian. GOAL: Reduce Anxiety about ECGs Back to
BASIC PRINCIPLES OF ECG INTERPRETATION
 Chapter 1 BASIC PRINCIPLES OF ECG INTERPRETATION Cardiac rhythm analysis may be accomplished informally via cardiac monitoring and more diagnostically via a 12-lead electrocardiogram (ECG). An electrocardiogram
CRC 431 ECG Basics. Bill Pruitt, MBA, RRT, CPFT, AE-C
 CRC 431 ECG Basics Bill Pruitt, MBA, RRT, CPFT, AE-C Resources White s 5 th ed. Ch 6 Electrocardiography Einthoven s Triangle Chest leads and limb leads Egan s 10 th ed. Ch 17 Interpreting the Electrocardiogram
TEST BANK FOR ECGS MADE EASY 5TH EDITION BY AEHLERT
 Link download full: http://testbankair.com/download/test-bank-for-ecgs-made-easy-5thedition-by-aehlert/ TEST BANK FOR ECGS MADE EASY 5TH EDITION BY AEHLERT Chapter 5 TRUE/FALSE 1. The AV junction consists
THE CARDIOVASCULAR SYSTEM. Heart 2
 THE CARDIOVASCULAR SYSTEM Heart 2 PROPERTIES OF CARDIAC MUSCLE Cardiac muscle Striated Short Wide Branched Interconnected Skeletal muscle Striated Long Narrow Cylindrical PROPERTIES OF CARDIAC MUSCLE Intercalated
Course Objectives. Proper Lead Placements. Review the ECG print paper. Review the mechanics of the Myocardium. Review basics of ECG Rhythms
 ECG Interpretations Course Objectives Proper Lead Placements Review the ECG print paper Review the mechanics of the Myocardium Review basics of ECG Rhythms How Leads Work The ECG Leads we use are Bipolar
ELECTROCARDIOGRAPHY (ECG)
") ELECTROCARDIOGRAPHY (ECG) The heart is a muscular organ, which pumps blood through the blood vessels of the circulatory system. Blood provides the body with oxygen and nutrients, as well as assists in
ELECTROCARDIOGRAPHY (ECG) The heart is a muscular organ, which pumps blood through the blood vessels of the circulatory system. Blood provides the body with oxygen and nutrients, as well as assists in
Chapter 20 (2) The Heart
 The Heart") Chapter 20 (2) The Heart ----------------------------------------------------------------------------------------------------------------------------------------- Describe the component and function of
Chapter 20 (2) The Heart ----------------------------------------------------------------------------------------------------------------------------------------- Describe the component and function of
Chapter 20: Cardiovascular System: The Heart
 Chapter 20: Cardiovascular System: The Heart I. Functions of the Heart A. List and describe the four functions of the heart: 1. 2. 3. 4. II. Size, Shape, and Location of the Heart A. Size and Shape 1.
4. The two inferior chambers of the heart are known as the atria. the superior and inferior vena cava, which empty into the left atrium.
 Answer each statement true or false. If the statement is false, change the underlined word to make it true. 1. The heart is located approximately between the second and fifth ribs and posterior to the
Rhythm ECG Characteristics Example. Normal Sinus Rhythm (NSR)
") Normal Sinus Rhythm (NSR) Rate: 60-100 per minute Rhythm: R- R = P waves: Upright, similar P-R: 0.12-0.20 second & consistent P:qRs: 1P:1qRs Sinus Tachycardia Exercise Hypovolemia Medications Fever Substances
Normal Sinus Rhythm (NSR) Rate: 60-100 per minute Rhythm: R- R = P waves: Upright, similar P-R: 0.12-0.20 second & consistent P:qRs: 1P:1qRs Sinus Tachycardia Exercise Hypovolemia Medications Fever Substances
CASE 10. What would the ST segment of this ECG look like? On which leads would you see this ST segment change? What does the T wave represent?
 CASE 10 A 57-year-old man presents to the emergency center with complaints of chest pain with radiation to the left arm and jaw. He reports feeling anxious, diaphoretic, and short of breath. His past history
BEDSIDE ECG INTERPRETATION
 BEDSIDE ECG INTERPRETATION Presented by: Ryan Dean, RN, MSN, CCRN, CCNS, CFRN Flight Nurse 2017 Based on presentations originally by Gennifer DePaoli, RN Objectives Hospital policies Electrical conduction
The Heart. Size, Form, and Location of the Heart. 1. Blunt, rounded point; most inferior part of the heart.
 12 The Heart FOCUS: The heart is composed of cardiac muscle cells, which are elongated, branching cells that appear striated. Cardiac muscle cells behave as a single electrical unit, and the highly coordinated
Matters of the Heart: Comprehensive Cardiology SARAH BEANLANDS RN BSCN MSC
 Matters of the Heart: Comprehensive Cardiology SARAH BEANLANDS RN BSCN MSC Who am I? Class Outline Gross anatomy of the heart Trip around the heart Micro anatomy: cellular and tissue level Introduction
37 1 The Circulatory System
 H T H E E A R T 37 1 The Circulatory System The circulatory system and respiratory system work together to supply cells with the nutrients and oxygen they need to stay alive. a) The respiratory system:
Cardiovascular System
 Cardiovascular System The Heart Cardiovascular System The Heart Overview What does the heart do? By timed muscular contractions creates pressure gradients blood moves then from high pressure to low pressure
10/23/2017. Muscular pump Two atria Two ventricles. In mediastinum of thoracic cavity 2/3 of heart's mass lies left of midline of sternum
 It beats over 100,000 times a day to pump over 1,800 gallons of blood per day through over 60,000 miles of blood vessels. During the average lifetime, the heart pumps nearly 3 billion times, delivering
ECG. Prepared by: Dr.Fatima Daoud Reference: Guyton and Hall Textbook of Medical Physiology,12 th edition Chapters: 11,12,13
 ECG Prepared by: Dr.Fatima Daoud Reference: Guyton and Hall Textbook of Medical Physiology,12 th edition Chapters: 11,12,13 The Concept When the cardiac impulse passes through the heart, electrical current
Cardiovascular System
 Cardiovascular System Purpose Transport oxygen and nutrients Take waste products away from tissues & organs Things we learned Blood pressure: the force of blood pushing against the walls of blood vessels
Chapter 13 The Cardiovascular System: Cardiac Function
 Chapter 13 The Cardiovascular System: Cardiac Function Overview of the Cardiovascular System The Path of Blood Flow through the Heart and Vasculature Anatomy of the Heart Electrical Activity of the Heart
This presentation will deal with the basics of ECG description as well as the physiological basics of
 Snímka 1 Electrocardiography basics This presentation will deal with the basics of ECG description as well as the physiological basics of Snímka 2 Lecture overview 1. Cardiac conduction system functional
Electrical Conduction
 Sinoatrial (SA) node Electrical Conduction Sets the pace of the heartbeat at 70 bpm AV node (50 bpm) and Purkinje fibers (25 40 bpm) can act as pacemakers under some conditions Internodal pathway from
EKG Competency for Agency
 EKG Competency for Agency Name: Date: Agency: 1. The upper chambers of the heart are known as the: a. Atria b. Ventricles c. Mitral Valve d. Aortic Valve 2. The lower chambers of the heart are known as
10. Thick deposits of lipids on the walls of blood vessels, called, can lead to serious circulatory issues. A. aneurysm B. atherosclerosis C.
 Heart Student: 1. carry blood away from the heart. A. Arteries B. Veins C. Capillaries 2. What is the leading cause of heart attack and stroke in North America? A. alcohol B. smoking C. arteriosclerosis
Introduction to Electrocardiography
 Introduction to Electrocardiography Class Objectives: Introduction to ECG monitoring Discuss principles of interpretation Identify the components and measurements of the ECG ECG analysis ECG Monitoring
Chapter 03: Sinus Mechanisms Test Bank MULTIPLE CHOICE
 Instant download and all chapters Tesst Bank ECGs Made Easy 5th Edition Barbara J Aehlert https://testbanklab.com/download/tesst-bank-ecgs-made-easy-5th-edition-barbara-jaehlert/ Chapter 03: Sinus Mechanisms
Chapter 18 - Heart. I. Heart Anatomy: size of your fist; located in mediastinum (medial cavity)
") Chapter 18 - Heart I. Heart Anatomy: size of your fist; located in mediastinum (medial cavity) A. Coverings: heart enclosed in double walled sac called the pericardium 1. Fibrous pericardium: dense connective
Chapter 18 - Heart I. Heart Anatomy: size of your fist; located in mediastinum (medial cavity) A. Coverings: heart enclosed in double walled sac called the pericardium 1. Fibrous pericardium: dense connective
HTEC 91. Performing ECGs: Procedure. Normal Sinus Rhythm (NSR) Topic for Today: Sinus Rhythms. Characteristics of NSR. Conduction Pathway
 Topic for Today: Sinus Rhythms. Characteristics of NSR. Conduction Pathway") HTEC 91 Medical Office Diagnostic Tests Week 3 Performing ECGs: Procedure o ECG protocol: you may NOT do ECG if you have not signed up! If you are signed up and the room is occupied with people who did
HTEC 91 Medical Office Diagnostic Tests Week 3 Performing ECGs: Procedure o ECG protocol: you may NOT do ECG if you have not signed up! If you are signed up and the room is occupied with people who did
Cardiovascular System Notes: Physiology of the Heart
 Cardiovascular System Notes: Physiology of the Heart Interesting Heart Fact Capillaries are so small it takes ten of them to equal the thickness of a human hair. Review What are the 3 parts of the cardiovascular
Electrocardiography for Healthcare Professionals
 Electrocardiography for Healthcare Professionals Chapter 7: Junctional Dysrhythmias 2012 The Companies, Inc. All rights reserved. Learning Outcomes 7.1 Describe the various junctional dysrhythmias 7.2
8/20/2012. Learning Outcomes (Cont d)
") 1 2 3 4 Electrocardiography for Healthcare Professionals Chapter 7: Junctional Dysrhythmias Learning Outcomes 7.1 Describe the various junctional dysrhythmias 7.2 Identify premature junctional complexes
1 2 3 4 Electrocardiography for Healthcare Professionals Chapter 7: Junctional Dysrhythmias Learning Outcomes 7.1 Describe the various junctional dysrhythmias 7.2 Identify premature junctional complexes
The Heart. Happy Friday! #takeoutyournotes #testnotgradedyet
 The Heart Happy Friday! #takeoutyournotes #testnotgradedyet Introduction Cardiovascular system distributes blood Pump (heart) Distribution areas (capillaries) Heart has 4 compartments 2 receive blood (atria)
Electrocardiogram ECG. Hilal Al Saffar FRCP FACC College of medicine,baghdad University
 Electrocardiogram ECG Hilal Al Saffar FRCP FACC College of medicine,baghdad University Tuesday 29 October 2013 ECG introduction Wednesday 30 October 2013 Abnormal ECG ( ischemia, chamber hypertrophy, heart
Electrocardiography for Healthcare Professionals
 Electrocardiography for Healthcare Professionals Kathryn A. Booth Thomas O Brien Chapter 5: Rhythm Strip Interpretation and Sinus Rhythms Learning Outcomes 5.1 Explain the process of evaluating ECG tracings
Electrocardiography Abnormalities (Arrhythmias) 7. Faisal I. Mohammed, MD, PhD
 7. Faisal I. Mohammed, MD, PhD") Electrocardiography Abnormalities (Arrhythmias) 7 Faisal I. Mohammed, MD, PhD 1 Causes of Cardiac Arrythmias Abnormal rhythmicity of the pacemaker Shift of pacemaker from sinus node Blocks at different
Electrocardiography Abnormalities (Arrhythmias) 7 Faisal I. Mohammed, MD, PhD 1 Causes of Cardiac Arrythmias Abnormal rhythmicity of the pacemaker Shift of pacemaker from sinus node Blocks at different
The Cardiovascular System
 The Cardiovascular System The Cardiovascular System A closed system of the heart and blood vessels The heart pumps blood Blood vessels allow blood to circulate to all parts of the body The function of
ECG ABNORMALITIES D R. T AM A R A AL Q U D AH
 ECG ABNORMALITIES D R. T AM A R A AL Q U D AH When we interpret an ECG we compare it instantaneously with the normal ECG and normal variants stored in our memory; these memories are stored visually in
PART I. Disorders of the Heart Rhythm: Basic Principles
 PART I Disorders of the Heart Rhythm: Basic Principles FET01.indd 1 1/11/06 9:53:05 AM FET01.indd 2 1/11/06 9:53:06 AM CHAPTER 1 The Cardiac Electrical System The heart spontaneously generates electrical
ECG Interpretation. Introduction to Cardiac Telemetry. Michael Peters, RN, CCRN, CFRN CALSTAR Air Medical Services
 ECG Interpretation Introduction to Cardiac Telemetry Michael Peters, RN, CCRN, CFRN CALSTAR Air Medical Services Disclosures Nothing to disclose Objectives Describe the electrical conduction pathway in
CARDIOVASCULAR SYSTEM
 CARDIOVASCULAR SYSTEM Overview Heart and Vessels 2 Major Divisions Pulmonary Circuit Systemic Circuit Closed and Continuous Loop Location Aorta Superior vena cava Right lung Pulmonary trunk Base of heart
By the end of this lecture, you will be able to: Understand the 12 lead ECG in relation to the coronary circulation and myocardium Perform an ECG
 By the end of this lecture, you will be able to: Understand the 12 lead ECG in relation to the coronary circulation and myocardium Perform an ECG recording Identify the ECG changes that occur in the presence
Lab #3: Electrocardiogram (ECG / EKG)
") Lab #3: Electrocardiogram (ECG / EKG) An introduction to the recording and analysis of cardiac activity Introduction The beating of the heart is triggered by an electrical signal from the pacemaker. The
Lab #3: Electrocardiogram (ECG / EKG) An introduction to the recording and analysis of cardiac activity Introduction The beating of the heart is triggered by an electrical signal from the pacemaker. The
Circulation. Circulation = is a process used for the transport of oxygen, carbon! dioxide, nutrients and wastes through-out the body
 Circulation Circulation = is a process used for the transport of oxygen, carbon! dioxide, nutrients and wastes through-out the body Heart = muscular organ about the size of your fist which pumps blood.
Cardiac Cycle. Each heartbeat is called a cardiac cycle. First the two atria contract at the same time.
 The Heartbeat Cardiac Cycle Each heartbeat is called a cardiac cycle. First the two atria contract at the same time. Next the two ventricles contract at the same time. Then all the chambers relax. http://www.youtube.com/watch?v=frd3k6lkhws
ECG Interpretation and Clinical Significance
 Confirming Pages ECG Interpretation and Clinical Significance Chapter Outline 5.1 5.2 5.3 5.4 5.5 5.6 5.7 5.8 5.9 5.10 Learning Outcomes Key Terms Introduction (p. 114) Identifying the Components of the
2017 BDKA Review. Regularity Rate P waves PRI QRS Interpretation. Regularity Rate P waves PRI QRS Interpretation 1/1/2017
 1. 2017 BDKA Review 2. 3. 4. Interpretation 5. QT 6. 7. 8. 9. 10. QT 11. 12. 13. 14. 15. 16. 17. 18. QT 19. 20. QT 21. 22. QT 23. 24. Where are pacer spikes? Before the P wave or before the QRS complex?
Heart. Heart 2-Tunica media: middle layer (media ='middle') muscle fibers (smooth or cardiac).
 muscle fibers (smooth or cardiac).") t. innermost lumenal General Circulatory system heart and blood vessels walls have 3 layers (inside to outside) 1-Tunica interna: aka tunica intima layer--lumenal layer epithelium--endothelium simple squamous
t. innermost lumenal General Circulatory system heart and blood vessels walls have 3 layers (inside to outside) 1-Tunica interna: aka tunica intima layer--lumenal layer epithelium--endothelium simple squamous
Pearson's Comprehensive Medical Assisting Administrative and Clinical Competencies
 Pearson's Comprehensive Medical Assisting Administrative and Clinical Competencies THIRD EDITION CHAPTER 27 The Cardiovascular System Lesson 1: Overview of the Cardiovascular System Lesson Objectives Upon
Principles of Anatomy and Physiology
 Principles of Anatomy and Physiology 14 th Edition CHAPTER 20 The Cardiovascular System: The Heart Introduction The purpose of the chapter is to: 1. Learn about the components of the cardiovascular system
physiology 6 Mohammed Jaafer Turquoise team
 15 physiology 6 Mohammed Jaafer 22-3-2016 Turquoise team Cardiac Arrhythmias and Their Electrocardiographic Interpretation Today, we are going to talk about the abnormal excitation. As we said before,
Lab Activity 24 EKG. Portland Community College BI 232
 Lab Activity 24 EKG Reference: Dubin, Dale. Rapid Interpretation of EKG s. 6 th edition. Tampa: Cover Publishing Company, 2000. Portland Community College BI 232 Graph Paper 1 second equals 25 little boxes
Cardiovascular system
 BIO 301 Human Physiology Cardiovascular system The Cardiovascular System: consists of the heart plus all the blood vessels transports blood to all parts of the body in two 'circulations': pulmonary (lungs)
The cardiovascular system is composed of the heart and blood vessels that carry blood to and from the body s organs. There are 2 major circuits:
 1 The cardiovascular system is composed of the heart and blood vessels that carry blood to and from the body s organs. There are 2 major circuits: pulmonary and systemic. The pulmonary goes out to the
12-Lead ECG Interpretation. Kathy Kuznar, RN, ANP
 12-Lead ECG Interpretation Kathy Kuznar, RN, ANP The 12-Lead ECG Objectives Identify the normal morphology and features of the 12- lead ECG. Perform systematic analysis of the 12-lead ECG. Recognize abnormalities
Ch 19: Cardiovascular System - The Heart -
 Ch 19: Cardiovascular System - The Heart - Give a detailed description of the superficial and internal anatomy of the heart, including the pericardium, the myocardium, and the cardiac muscle. Trace the
2) Heart Arrhythmias 2 - Dr. Abdullah Sharif
 Heart Arrhythmias 2 - Dr. Abdullah Sharif") 2) Heart Arrhythmias 2 - Dr. Abdullah Sharif Rhythms from the Sinus Node Sinus Tachycardia: HR > 100 b/m Causes: o Withdrawal of vagal tone & Sympathetic stimulation (exercise, fight or flight) o Fever
2) Heart Arrhythmias 2 - Dr. Abdullah Sharif Rhythms from the Sinus Node Sinus Tachycardia: HR > 100 b/m Causes: o Withdrawal of vagal tone & Sympathetic stimulation (exercise, fight or flight) o Fever
Cardiovascular Physiology. Heart Physiology. Introduction. The heart. Electrophysiology of the heart
 Cardiovascular Physiology Heart Physiology Introduction The cardiovascular system consists of the heart and two vascular systems, the systemic and pulmonary circulations. The heart pumps blood through
Introduction. Circulation
 Introduction Circulation 1- Systemic (general) circulation 2- Pulmonary circulation carries oxygenated blood to all parts of the body carries deoxygenated blood to the lungs From Lt. ventricle aorta From
Collin County Community College. ! BIOL Anatomy & Physiology! WEEK 5. The Heart
 Collin County Community College! BIOL. 2402 Anatomy & Physiology! WEEK 5 The Heart 1 (1578-1657) A groundbreaking work in the history of medicine, English physician William Harvey s Anatomical Essay on
Cardiac Arrhythmias. Cathy Percival, RN, FALU, FLMI VP, Medical Director AIG Life and Retirement Company
 Cardiac Arrhythmias Cathy Percival, RN, FALU, FLMI VP, Medical Director AIG Life and Retirement Company The Cardiovascular System Three primary functions Transport of oxygen, nutrients, and hormones to
EKG Abnormalities. Adapted from:
 EKG Abnormalities Adapted from: http://www.bem.fi/book/19/19.htm Some key terms: Arrhythmia-an abnormal rhythm or sequence of events in the EKG Flutter-rapid depolarizations (and therefore contractions)
Relax and Learn At the Farm 2012
 Relax and Learn At the Farm 2012 Session 2: 12 Lead ECG Fundamentals 101 Cynthia Webner DNP, RN, CCNS, CCRN-CMC, CHFN Though for Today Mastery is not something that strikes in an instant, like a thunderbolt,
ECG CONVENTIONS AND INTERVALS
 1 ECG Waveforms and Intervals ECG waveforms labeled alphabetically P wave== represents atrial depolarization QRS complex=ventricular depolarization ST-T-U complex (ST segment, T wave, and U wave)== V repolarization.
Step by step approach to EKG rhythm interpretation:
 Sinus Rhythms Normal sinus arrhythmia Small, slow variation of the R-R interval i.e. variation of the normal sinus heart rate with respiration, etc. Sinus Tachycardia Defined as sinus rhythm with a rate
ABCs of ECGs. Shelby L. Durler
 ABCs of ECGs Shelby L. Durler Objectives Review the A&P of the cardiac conduction system Placement and obtaining 4-lead and 12-lead ECGs Overview of the basics of ECG rhythm interpretation Intrinsic
THE HEART. A. The Pericardium - a double sac of serous membrane surrounding the heart
 THE HEART I. Size and Location: A. Fist-size weighing less than a pound (250 to 350 grams). B. Located in the mediastinum between the 2 nd rib and the 5 th intercostal space. 1. Tipped to the left, resting
Understanding the 12-lead ECG, part II
 Bundle-branch blocks Understanding the 12-lead ECG, part II Most common electrocardiogram (ECG) abnormality Appears as a wider than normal S complex Occurs when one of the two bundle branches can t conduct
Ekg pra pr c a tice D.HAMMOUDI.MD
 Ekg practice D.HAMMOUDI.MD Anatomy Revisited RCA (Right Coronary Artery) Right ventricle Inferior wall of LV Posterior wall of LV (75%) SA Node (60%) AV Node (>80%) LCA (Left Coronary Artery) Septal wall
Approximately the size of your fist Location. Pericardial physiology
 Heart Anatomy Approximately the size of your fist Location Superior surface of diaphragm Left of the midline Anterior to the vertebral column, posterior to the sternum Wednesday, March 28, 2012 Muscle
Electrocardiogram and Heart Sounds
 Electrocardiogram and Heart Sounds Five physiologic properties of cardiac muscle Automaticity: SA node is the primary pacemaker of the heart, but any cells in the conduction system can initiate their
Cardiovascular System: The Heart
 Cardiovascular System: The Heart I. Anatomy of the Heart (See lab handout for terms list) A. Describe the size, shape and location of the heart B. Describe the structure and function of the pericardium
CORONARY ARTERIES HEART
 CARDIAC/ECG MODULE THE HEART CORONARY ARTERIES FIBRILLATING HEART CORONARY ARTERIES HEART PRACTICE RHYTHMS PRACTICE RHYTHMS ELECTRICAL CONDUCTION SA Node (60 100) Primary pacemaker AV Node (40 60) ***Creates
Figure ) The specific chamber of the heart that is indicated by letter A is called the. Diff: 1 Page Ref: 364
 The specific chamber of the heart that is indicated by letter A is called the. Diff: 1 Page Ref: 364") Essentials of Anatomy and Physiology, 9e (Marieb) Chapter 11 The Cardiovascular System Short Answer Figure 11.1 Using Figure 11.1, identify the following: 1) The Purkinje fibers are indicated by label.
Essentials of Anatomy and Physiology, 9e (Marieb) Chapter 11 The Cardiovascular System Short Answer Figure 11.1 Using Figure 11.1, identify the following: 1) The Purkinje fibers are indicated by label.
Electrocardiography Biomedical Engineering Kaj-Åge Henneberg
 Electrocardiography 31650 Biomedical Engineering Kaj-Åge Henneberg Electrocardiography Plan Function of cardiovascular system Electrical activation of the heart Recording the ECG Arrhythmia Heart Rate
Cardiac Telemetry Self Study: Part One Cardiovascular Review 2017 THINGS TO REMEMBER
 Please review the above anatomy of the heart. THINGS TO REMEMBER There are 3 electrolytes that affect cardiac function o Sodium, Potassium, and Calcium When any of these electrolytes are out of the normal
human anatomy 2016 lecture thirteen Dr meethak ali ahmed neurosurgeon
 Heart The heart is a hollow muscular organ that is somewhat pyramid shaped and lies within the pericardium in the mediastinum. It is connected at its base to the great blood vessels but otherwise lies
Chapter 9, Part 2. Cardiocirculatory Adjustments to Exercise
 Chapter 9, Part 2 Cardiocirculatory Adjustments to Exercise Electrical Activity of the Heart Contraction of the heart depends on electrical stimulation of the myocardium Impulse is initiated in the right
WHAT S THAT RHYTHM I AM HEARING? GUIDE TO AUSCULTATION OF ARRHYTHMIAS IN HORSES
 WHAT S THAT RHYTHM I AM HEARING? GUIDE TO AUSCULTATION OF ARRHYTHMIAS IN HORSES Michelle Henry Barton DVM, PhD, DACVIM University of Georgia, Athens, GA INTRODUCTION The purpose of this talk is to review
Introduction to ECG Gary Martin, M.D.
 Brief review of basic concepts Introduction to ECG Gary Martin, M.D. The electrical activity of the heart is caused by a sequence of rapid ionic movements across cell membranes resulting first in depolarization
The Cardiovascular System
 The Cardiovascular System The Manila Times College of Subic Prepared by: Stevens B. Badar, RN, MANc THE HEART Anatomy of the Heart Location and Size approx. the size of a person s fist, hollow and cone-shaped,
3/26/15 HTEC 91. EKG Sign-in Book. The Cardiac Cycle. Parts of the ECG. Waves. Waves. Review of protocol Review of placement of chest leads (V1, V2)
") EKG Sign-in Book HTEC 91 Review of protocol Review of placement of chest leads (V1, V2) Medical Office Diagnostic Tests Week 2 http://www.cvphysiology.com/arrhythmias/a013c.htm The Cardiac Cycle Represents
EKG Sign-in Book HTEC 91 Review of protocol Review of placement of chest leads (V1, V2) Medical Office Diagnostic Tests Week 2 http://www.cvphysiology.com/arrhythmias/a013c.htm The Cardiac Cycle Represents
Sample. Analyzing the Heart with EKG. Computer
 Analyzing the Heart with EKG Computer An electrocardiogram (ECG or EKG) is a graphical recording of the electrical events occurring within the heart. In a healthy heart there is a natural pacemaker in
Cardiovascular System Notes: Heart Disease & Disorders
 Cardiovascular System Notes: Heart Disease & Disorders Interesting Heart Facts The Electrocardiograph (ECG) was invented in 1902 by Willem Einthoven Dutch Physiologist. This test is still used to evaluate
Bradydysrhythmias and Atrioventricular Conduction Blocks
 Emerg Med Clin N Am 24 (2006) 1 9 Bradydysrhythmias and Atrioventricular Conduction Blocks Jacob W. Ufberg, MD*, Jennifer S. Clark, MD Department of Emergency Medicine, Temple University School of Medicine,
Review Packet EKG Competency This packet is a review of the information you will need to know for the proctored EKG competency test.
 Review Packet EKG Competency 2015 This packet is a review of the information you will need to know for the proctored EKG competency test. Normal Sinus Rhythm Rhythm: Regular Ventricular Rate: 60-100 bpm
Anatomy Review: The Heart Graphics are used with permission of A.D.A.M. Software, Inc. and Benjamin/Cummings Publishing Co.
 Anatomy Review: The Heart Graphics are used with permission of A.D.A.M. Software, Inc. and Benjamin/Cummings Publishing Co. Anatomy Views Label the diagrams of the heart below: Interactive Physiology Study
the Cardiovascular System I
 the Cardiovascular System I By: Dr. Nabil A Khouri MD, MsC, Ph.D MEDIASTINUM 1. Superior Mediastinum 2. inferior Mediastinum Anterior mediastinum. Middle mediastinum. Posterior mediastinum Anatomy of
Department of medical physiology 7 th week and 8 th week
 Department of medical physiology 7 th week and 8 th week Semester: winter Study program: Dental medicine Lecture: RNDr. Soňa Grešová, PhD. Department of medical physiology Faculty of Medicine PJŠU Cardiovascular
BME 5742 Bio-Systems Modeling and Control. Lecture 41 Heart & Blood Circulation Heart Function Basics
 BME 5742 Bio-Systems Modeling and Control Lecture 41 Heart & Blood Circulation Heart Function Basics Dr. Zvi Roth (FAU) 1 Pumps A pump is a device that accepts fluid at a low pressure P 1 and outputs the
Electrocardiography for Healthcare Professionals
 Electrocardiography for Healthcare Professionals Chapter 9: Ventricular Dysrhythmias 2012 The Companies, Inc. All rights reserved. Learning Outcomes 9.1 Describe the various ventricular dysrhythmias 9.2
2. right heart = pulmonary pump takes blood to lungs to pick up oxygen and get rid of carbon dioxide
 A. location in thorax, in inferior mediastinum posterior to sternum medial to lungs superior to diaphragm anterior to vertebrae orientation - oblique apex points down and to the left 2/3 of mass on left
The HEART. What is it???? Pericardium. Heart Facts. This muscle never stops working It works when you are asleep
 This muscle never stops working It works when you are asleep The HEART It works when you eat It really works when you exercise. What is it???? Located between the lungs in the mid thoracic region Apex
The Heart. The Heart A muscular double pump. The Pulmonary and Systemic Circuits
 C H A P T E R 19 The Heart The Heart A muscular double pump circuit takes blood to and from the lungs Systemic circuit vessels transport blood to and from body tissues Atria receive blood from the pulmonary