Nature Structural & Molecular Biology: doi: /nsmb.2419
|
|
|
- Ronald Willis
- 6 years ago
- Views:
Transcription
1
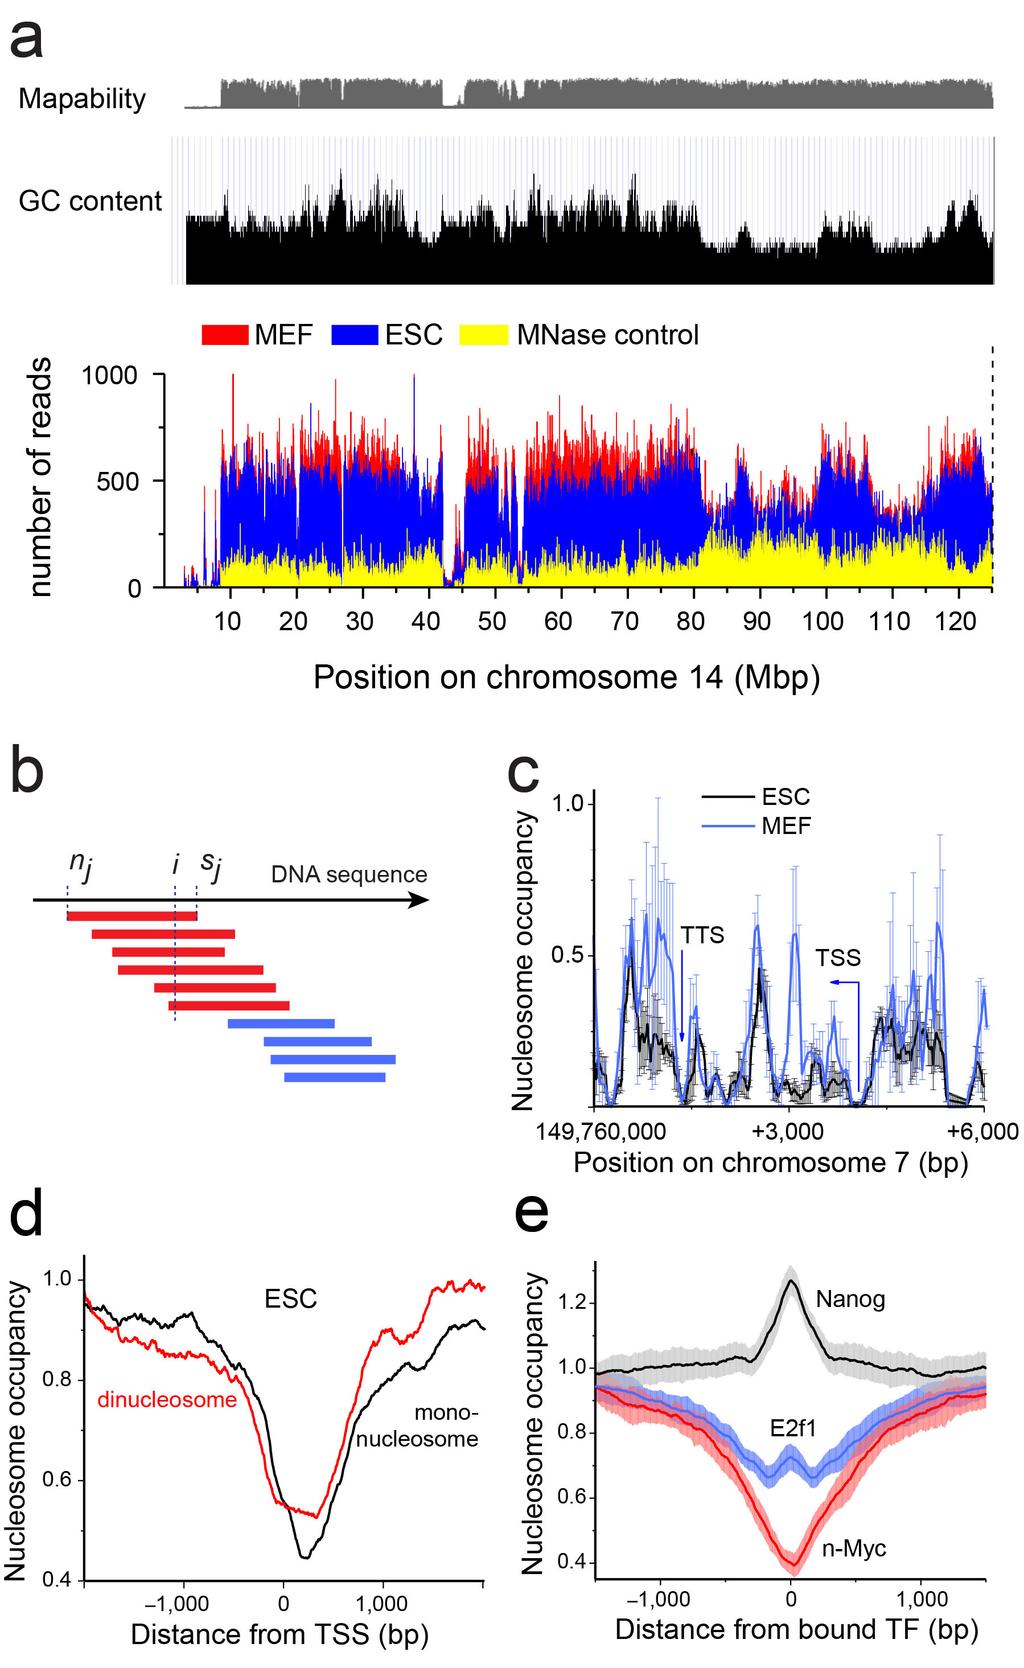
2 Supplementary Figure 1 Mapped sequence reads and nucleosome occupancies. (a) Distribution of sequencing reads on the mouse reference genome for chromosome 14 as an example. The number of reads in a 1 Mb window was plotted for ESCs, MEFs and purified genomic mouse DNA treated with MNase. The top panel shows mapability scores for these regions as given by the UCSC Genome Browser and the average GC content for a selected region in black. The region without nucleosome occupancy signal coincided with regions for which sequence information for mapping was insufficient. The level of the nucleosome occupancy signal correlated with GC content, while the signal of the MNase control digestion of genomic DNA was anti-correlated with the GC content. (b) Computation of nucleosome occupancies. The paired-end sequencing data of DNA fragments obtained after MNase digestion can be directly translated into nucleosome occupancies. In our analysis the nucleosome occupancy was defined as a normalized number of individual nucleosome reads covering a given DNA position. (c) Accuracy of nucleosome occupancy maps for ESCs (black) and MEFs (blue) around the H19 gene. The standard errors of the average were calculated from three replicate experiments for ESCs (black) and two replicates for MEFs (blue), with each sequencing run returning ~150 million mapped reads. (d) Comparison of the nucleosome occupancy profiles obtained from the analysis of mononucleosome ( bp average length) versus dinucleosome (340 bp average length) samples around the transcription start site (TSS) in ESCs for the 5% highest-expressed genes. (e) Accuracy of nucleosome occupancy determination in the average genome-wide profiles around TF binding sites. The nucleosome profiles of Nanog, E2f1 and n-myc from Fig. 2 are shown together with the standard deviation at each base pair positions. The standard deviation was calculated by averaging the corresponding value for each of the mouse chromosomes.
3 Supplementary Figure 2 Nucleosome patterns around sub-classes of CTCF sites. (a) Average patterns of MEF nucleosomes around common CTCF sites present both in ESCs and MEFs (black) are compared to average patterns of CTCF sites in MEFs that are not occupied by CTCF in ESCs (blue). (b) Example for a CTCF site that resides within a sequence occupied by a nucleosome in both ESCs and MEFs. (c) Average nucleosome occupancy patterns around common CTCF sites overlapping with putative enhancers (black) and nucleosome patterns around enhancer centers (red). The enhancer regions have been defined according to the multiple transcription factor loci identified previously (Chen et al., 2008, Cell 133, ).
 to high (red).")
4 Supplementary Figure 3 Cluster maps of nucleosome occupancy at transcription start sites. Each horizontal line corresponds to the promoter associated with a given transcript identified in the RNA-seq analysis. The colors indicate nucleosome occupancy from low (dark blue) to high (red). Nucleosome occupancies are shown for transcription start sites of the 5% transcripts with (a) highest and (b) lowest expression levels.

 highest")
5 Supplementary Figure 4 Cluster maps of nucleosome occupancy at transcription termination sites. Each horizontal line corresponds to the termination site associated with a given transcript identified in the RNA-seq analysis. The colors indicate nucleosome occupancy from low (dark blue) to high (red). Nucleosome occupancies are shown for transcription termination sites of the 5% transcripts with (a) highest and (b) lowest expression levels.
6 Supplementary Figure 5 Nucleosome occupancies at promoters with H3K4me3 and H3K27me3 histone modifications in ESCs. (a) Promoters marked by H3K4me3 (black), H3K27me3 (blue), and bivalent promoters carrying both of these modifications (red) in each of the three studied cell types. (b) Promoters indicated as bivalent in ESCs, which remain bivalent in NPCs (top panel), resolve to H3K4me3 only in NPCs (middle panel), or transform into H3K27me3 only (bottom panel).
7 Supplementary Table 1 Comparison of gene expression levels of CTCF and linker histone variants H1.0 and H1.7 in ESCs, NPCs and MEFs. CTCF H1.0 H1.7 H4 Normalized RNA expression levels CTCF/H4 (ESC = 1) H1.0/H4 (ESC =1) H1.7/H4 (ESC =1) ESC NPC MEF Normalized expression levels of a given protein were obtained by averaging the normalized expression levels of all transcripts corresponding to this protein as obtained from the DEseq analysis using the Eldorado gene annotation integrated in Genomatix.
8 Supplementary Table 2 Correlation of nucleosome occupancy at the transcription start site [-500,+500] versus log 2 (gene expression) Cell type Promoter Corr. coeff # Transcripts ESC all MEF all NPC all ESC HCG MEF HCG ESC LCG MEF LCG The transcription start site region evaluated in terms of nucleosome occupancy comprised the [-500,+500] region around the TSS. All correlation coefficients were highly significant with p- values <10-10.
9 Supplementary Table 3 Correlation of log 2 (MEF occupancy/esc occupancy) at the transcription start site versus log 2 (MEF expression/esc expression) Promoter Corr. coeff. # Transcripts p-value all <10-10 HCG LCG bivalent ESC <10-10 H3K4me3 ESC <10-10 H3K27me3 ESC The transcription start site region was evaluated in terms of nucleosome occupancy in the region [-500,+500] around the TSS.
10 Supplementary Table 4 Correlation of nucleosome occupancy changes between ESCs and MEFs at TSSs that become silenced in MEFs or ESCs Promoter Active transcription in ESCs and silencing in MEFs % increased % decreased # transcripts occupancy in MEFs occupancy in MEFs total all HCG LCG bivalent ESC H3K4me3 ESC H3K27me3 ESC Promoter Active transcription in MEFs and silencing in ESCs % increased % decreased # transcripts occupancy in ESCs occupancy in ESCs total all HCG LCG bivalent ESC H3K4me3 ESC H3K27me3 ESC Since the global analysis shown in Table 3 did not include transcripts that were not detected either in ESCs or MEFs (corresponding to a log 2 (MEF expression/esc expression) ratio of infinity), these two groups were analyzed separately. Transcripts with non-zero RNA-seq counts in ESCs and with zero reads detected in MEFs or (or vice versa) were identified. For these transcripts the change in nucleosome occupancy at the TSS in the region [-500,+500] was evaluated as given by log 2 (MEF nucleosome occupancy/esc nucleosome occupancy). The number of transcripts that showed an increased or decreased occupancy for all transcripts evaluated was set to 100% to obtain the relative fraction of the different promoter subgroups that were silenced, and either displayed an increased or decreased nucleosome occupancy.
11 Supplementary Note Nucleosome positions were mapped by genome-wide sequencing of nucleosomal DNA from mouse ESCs, NPCs and MEFs after digesting the linker DNA between nucleosomes with micrococcal nuclease (MNase) as described in Methods. Our determination of the nucleosome occupancy did not involve peak calling or averaging but was based on simply counting the number of times a given base pair was covered by a sequencing read (Supplementary Fig. 1b). Furthermore, no assumptions on the length of the nucleosomal DNA had to be made to derive the nucleosome occupancy, since nucleosome boundaries were determined on both sides of the nucleosome by paired-end sequencing. Thus, our analysis evaluated the raw data in a straightforward manner. From a comparison of three independent biological replicates we conclude that the error of the nucleosome occupancy value varied between 10 and 50 % for individual nucleosomes as shown for a representative region in Supplementary Fig. 1c. The MNase digestion conditions were selected to avoid overdigestion as reflected by the presence of subnucleosomal particles (< 145 bp DNA) that form at high degrees of MNase digestion. Nucleosome occupancies at the TSS varied slightly for fragment sizes of 150 bp, 155 bp, 160 bp and 180 bp or dinucleosomes (340 bp fragment, Supplementary Fig. 1d). For the 180 bp mononucleosome and the 340 bp dinucleosome samples more reads were needed to get similar accuracies of nucleosome positions, since less fragments mapped to the border of the nucleosome. Accordingly, we included only the 150 bp, 155 bp and 160 bp samples in our final analysis. With respect to the standard errors associated with our measurement, three types of data sets need to be distinguished in terms of the accuracy at which we were able to determine them: (i) The averaged nucleosome occupancy profiles like those shown in Fig. 2-6 have only a very small error as shown for the nucleosome occupancy at binding sites for transcription factors. These originate from averaging hundreds or thousands of normalized nucleosome occupancy profiles as shown for three exemplary transcription-factor binding sites in Supplementary Fig. 1e. (ii) For an individual locus the occupancy at a given base pair position had an error of 10-50% as mentioned above (Supplementary Fig. 1d). However, this type of analysis was not applied here in a quantitative manner and the conclusions of our study are based on the analysis of averaged profiles. (iii) The accuracy at which we can determine the position of individual nucleosome, i.e. the location of a given occupancy peak along the x-axis, is estimated to be ±20 base pairs as inferred from a comparison of three different independent replicate experiments (Supplementary Fig. 1c).
Computational Analysis of UHT Sequences Histone modifications, CAGE, RNA-Seq
 Computational Analysis of UHT Sequences Histone modifications, CAGE, RNA-Seq Philipp Bucher Wednesday January 21, 2009 SIB graduate school course EPFL, Lausanne ChIP-seq against histone variants: Biological
7SK ChIRP-seq is specifically RNA dependent and conserved between mice and humans.
 Supplementary Figure 1 7SK ChIRP-seq is specifically RNA dependent and conserved between mice and humans. Regions targeted by the Even and Odd ChIRP probes mapped to a secondary structure model 56 of the
Nature Structural & Molecular Biology: doi: /nsmb Supplementary Figure 1
 Supplementary Figure 1 Effect of HSP90 inhibition on expression of endogenous retroviruses. (a) Inducible shrna-mediated Hsp90 silencing in mouse ESCs. Immunoblots of total cell extract expressing the
The Insulator Binding Protein CTCF Positions 20 Nucleosomes around Its Binding Sites across the Human Genome
 The Insulator Binding Protein CTCF Positions 20 Nucleosomes around Its Binding Sites across the Human Genome Yutao Fu 1, Manisha Sinha 2,3, Craig L. Peterson 3, Zhiping Weng 1,4,5 * 1 Bioinformatics Program,
Supplementary Figure S1. Gene expression analysis of epidermal marker genes and TP63.
 Supplementary Figure Legends Supplementary Figure S1. Gene expression analysis of epidermal marker genes and TP63. A. Screenshot of the UCSC genome browser from normalized RNAPII and RNA-seq ChIP-seq data
High Throughput Sequence (HTS) data analysis. Lei Zhou
 data analysis. Lei Zhou") High Throughput Sequence (HTS) data analysis Lei Zhou (leizhou@ufl.edu) High Throughput Sequence (HTS) data analysis 1. Representation of HTS data. 2. Visualization of HTS data. 3. Discovering genomic
High Throughput Sequence (HTS) data analysis Lei Zhou (leizhou@ufl.edu) High Throughput Sequence (HTS) data analysis 1. Representation of HTS data. 2. Visualization of HTS data. 3. Discovering genomic
Supplemental Figure S1. Tertiles of FKBP5 promoter methylation and internal regulatory region
 Supplemental Figure S1. Tertiles of FKBP5 promoter methylation and internal regulatory region methylation in relation to PSS and fetal coupling. A, PSS values for participants whose placentas showed low,
Accessing and Using ENCODE Data Dr. Peggy J. Farnham
 1 William M Keck Professor of Biochemistry Keck School of Medicine University of Southern California How many human genes are encoded in our 3x10 9 bp? C. elegans (worm) 959 cells and 1x10 8 bp 20,000
Comprehensive nucleosome mapping of the human genome in cancer progression
 /, Vol. 7, No. 12 Comprehensive nucleosome mapping of the human genome in cancer progression Brooke R. Druliner 1,5, Daniel Vera 1,6, Ruth Johnson 2, Xiaoyang Ruan 3, Lynn M. Apone 4, Eileen T. Dimalanta
The Epigenome Tools 2: ChIP-Seq and Data Analysis
 The Epigenome Tools 2: ChIP-Seq and Data Analysis Chongzhi Zang zang@virginia.edu http://zanglab.com PHS5705: Public Health Genomics March 20, 2017 1 Outline Epigenome: basics review ChIP-seq overview
Supplementary Figure 1: Attenuation of association signals after conditioning for the lead SNP. a) attenuation of association signal at the 9p22.
 attenuation of association signal at the 9p22.") Supplementary Figure 1: Attenuation of association signals after conditioning for the lead SNP. a) attenuation of association signal at the 9p22.32 PCOS locus after conditioning for the lead SNP rs10993397;
Supplementary Figure 1: Attenuation of association signals after conditioning for the lead SNP. a) attenuation of association signal at the 9p22.32 PCOS locus after conditioning for the lead SNP rs10993397;
Broad H3K4me3 is associated with increased transcription elongation and enhancer activity at tumor suppressor genes
 Broad H3K4me3 is associated with increased transcription elongation and enhancer activity at tumor suppressor genes Kaifu Chen 1,2,3,4,5,10, Zhong Chen 6,10, Dayong Wu 6, Lili Zhang 7, Xueqiu Lin 1,2,8,
Comparison of open chromatin regions between dentate granule cells and other tissues and neural cell types.
 Supplementary Figure 1 Comparison of open chromatin regions between dentate granule cells and other tissues and neural cell types. (a) Pearson correlation heatmap among open chromatin profiles of different
CTCF-Mediated Functional Chromatin Interactome in Pluripotent Cells
 SUPPLEMENTARY INFORMATION CTCF-Mediated Functional Chromatin Interactome in Pluripotent Cells Lusy Handoko 1,*, Han Xu 1,*, Guoliang Li 1,*, Chew Yee Ngan 1, Elaine Chew 1, Marie Schnapp 1, Charlie Wah
Nature Genetics: doi: /ng Supplementary Figure 1
 Supplementary Figure 1 Expression deviation of the genes mapped to gene-wise recurrent mutations in the TCGA breast cancer cohort (top) and the TCGA lung cancer cohort (bottom). For each gene (each pair
Transcript-indexed ATAC-seq for immune profiling
 Transcript-indexed ATAC-seq for immune profiling Technical Journal Club 22 nd of May 2018 Christina Müller Nature Methods, Vol.10 No.12, 2013 Nature Biotechnology, Vol.32 No.7, 2014 Nature Medicine, Vol.24,
Nature Immunology: doi: /ni Supplementary Figure 1. DNA-methylation machinery is essential for silencing of Cd4 in cytotoxic T cells.
 Supplementary Figure 1 DNA-methylation machinery is essential for silencing of Cd4 in cytotoxic T cells. (a) Scheme for the retroviral shrna screen. (b) Histogram showing CD4 expression (MFI) in WT cytotoxic
Supplemental Figure 1. Genes showing ectopic H3K9 dimethylation in this study are DNA hypermethylated in Lister et al. study.
 mc mc mc mc SUP mc mc Supplemental Figure. Genes showing ectopic HK9 dimethylation in this study are DNA hypermethylated in Lister et al. study. Representative views of genes that gain HK9m marks in their
MODULE 4: SPLICING. Removal of introns from messenger RNA by splicing
 Last update: 05/10/2017 MODULE 4: SPLICING Lesson Plan: Title MEG LAAKSO Removal of introns from messenger RNA by splicing Objectives Identify splice donor and acceptor sites that are best supported by
Session 6: Integration of epigenetic data. Peter J Park Department of Biomedical Informatics Harvard Medical School July 18-19, 2016
 Session 6: Integration of epigenetic data Peter J Park Department of Biomedical Informatics Harvard Medical School July 18-19, 2016 Utilizing complimentary datasets Frequent mutations in chromatin regulators
Peak-calling for ChIP-seq and ATAC-seq
 Peak-calling for ChIP-seq and ATAC-seq Shamith Samarajiwa CRUK Autumn School in Bioinformatics 2017 University of Cambridge Overview Peak-calling: identify enriched (signal) regions in ChIP-seq or ATAC-seq
Computational aspects of ChIP-seq. John Marioni Research Group Leader European Bioinformatics Institute European Molecular Biology Laboratory
 Computational aspects of ChIP-seq John Marioni Research Group Leader European Bioinformatics Institute European Molecular Biology Laboratory ChIP-seq Using highthroughput sequencing to investigate DNA
Processing, integrating and analysing chromatin immunoprecipitation followed by sequencing (ChIP-seq) data
 data") Processing, integrating and analysing chromatin immunoprecipitation followed by sequencing (ChIP-seq) data Bioinformatics methods, models and applications to disease Alex Essebier ChIP-seq experiment To
Processing, integrating and analysing chromatin immunoprecipitation followed by sequencing (ChIP-seq) data Bioinformatics methods, models and applications to disease Alex Essebier ChIP-seq experiment To
Table S1. Total and mapped reads produced for each ChIP-seq sample
 Tale S1. Total and mapped reads produced for each ChIP-seq sample Sample Total Reads Mapped Reads Col- H3K27me3 rep1 125662 1334323 (85.76%) Col- H3K27me3 rep2 9176437 7986731 (87.4%) atmi1a//c H3K27m3
Nature Immunology: doi: /ni Supplementary Figure 1. Characteristics of SEs in T reg and T conv cells.
 Supplementary Figure 1 Characteristics of SEs in T reg and T conv cells. (a) Patterns of indicated transcription factor-binding at SEs and surrounding regions in T reg and T conv cells. Average normalized
levels of genes were separated by their expression levels; 2,000 high, medium, and low
 Figure S1. Histone modification profiles near transcription start sites. The overall histone modification around transcription start sites (TSSs) was calculated. Histone modification levels of genes were
Nature Genetics: doi: /ng Supplementary Figure 1. Assessment of sample purity and quality.
 Supplementary Figure 1 Assessment of sample purity and quality. (a) Hematoxylin and eosin staining of formaldehyde-fixed, paraffin-embedded sections from a human testis biopsy collected concurrently with
Allelic reprogramming of the histone modification H3K4me3 in early mammalian development
 Allelic reprogramming of the histone modification H3K4me3 in early mammalian development 张戈 Method and material STAR ChIP seq (small-scale TELP-assisted rapid ChIP seq) 200 mouse embryonic stem cells PWK/PhJ
SUPPLEMENTARY INFORMATION
 doi:10.1038/nature10866 a b 1 2 3 4 5 6 7 Match No Match 1 2 3 4 5 6 7 Turcan et al. Supplementary Fig.1 Concepts mapping H3K27 targets in EF CBX8 targets in EF H3K27 targets in ES SUZ12 targets in ES
Not IN Our Genes - A Different Kind of Inheritance.! Christopher Phiel, Ph.D. University of Colorado Denver Mini-STEM School February 4, 2014
 Not IN Our Genes - A Different Kind of Inheritance! Christopher Phiel, Ph.D. University of Colorado Denver Mini-STEM School February 4, 2014 Epigenetics in Mainstream Media Epigenetics *Current definition:
Raymond Auerbach PhD Candidate, Yale University Gerstein and Snyder Labs August 30, 2012
 Elucidating Transcriptional Regulation at Multiple Scales Using High-Throughput Sequencing, Data Integration, and Computational Methods Raymond Auerbach PhD Candidate, Yale University Gerstein and Snyder
Heintzman, ND, Stuart, RK, Hon, G, Fu, Y, Ching, CW, Hawkins, RD, Barrera, LO, Van Calcar, S, Qu, C, Ching, KA, Wang, W, Weng, Z, Green, RD,
 Heintzman, ND, Stuart, RK, Hon, G, Fu, Y, Ching, CW, Hawkins, RD, Barrera, LO, Van Calcar, S, Qu, C, Ching, KA, Wang, W, Weng, Z, Green, RD, Crawford, GE, Ren, B (2007) Distinct and predictive chromatin
Meaning-based guidance of attention in scenes as revealed by meaning maps
 SUPPLEMENTARY INFORMATION Letters DOI: 1.138/s41562-17-28- In the format provided by the authors and unedited. -based guidance of attention in scenes as revealed by meaning maps John M. Henderson 1,2 *
Chromatin marks identify critical cell-types for fine-mapping complex trait variants
 Chromatin marks identify critical cell-types for fine-mapping complex trait variants Gosia Trynka 1-4 *, Cynthia Sandor 1-4 *, Buhm Han 1-4, Han Xu 5, Barbara E Stranger 1,4#, X Shirley Liu 5, and Soumya
Supplementary Figures
 Supplementary Figures Supplementary Figure 1. Confirmation of Dnmt1 conditional knockout out mice. a, Representative images of sorted stem (Lin - CD49f high CD24 + ), luminal (Lin - CD49f low CD24 + )
Relationship between genomic features and distributions of RS1 and RS3 rearrangements in breast cancer genomes.
 Supplementary Figure 1 Relationship between genomic features and distributions of RS1 and RS3 rearrangements in breast cancer genomes. (a,b) Values of coefficients associated with genomic features, separately
Supervised Learner for the Prediction of Hi-C Interaction Counts and Determination of Influential Features. Tyler Yue Lab
 Supervised Learner for the Prediction of Hi-C Interaction Counts and Determination of Influential Features Tyler Derr @ Yue Lab tsd5037@psu.edu Background Hi-C is a chromosome conformation capture (3C)
The common colorectal cancer predisposition SNP rs at chromosome 8q24 confers potential to enhanced Wnt signaling
 SUPPLEMENTARY INFORMATION The common colorectal cancer predisposition SNP rs6983267 at chromosome 8q24 confers potential to enhanced Wnt signaling Sari Tuupanen 1, Mikko Turunen 2, Rainer Lehtonen 1, Outi
MODULE 3: TRANSCRIPTION PART II
 MODULE 3: TRANSCRIPTION PART II Lesson Plan: Title S. CATHERINE SILVER KEY, CHIYEDZA SMALL Transcription Part II: What happens to the initial (premrna) transcript made by RNA pol II? Objectives Explain
Supplementary Figures
 Supplementary Figures Supplementary Figure 1. Heatmap of GO terms for differentially expressed genes. The terms were hierarchically clustered using the GO term enrichment beta. Darker red, higher positive
Eukaryotic transcription (III)
") Eukaryotic transcription (III) 1. Chromosome and chromatin structure Chromatin, chromatid, and chromosome chromatin Genomes exist as chromatins before or after cell division (interphase) but as chromatids
Eukaryotic transcription (III) 1. Chromosome and chromatin structure Chromatin, chromatid, and chromosome chromatin Genomes exist as chromatins before or after cell division (interphase) but as chromatids
Discovery of Novel Human Gene Regulatory Modules from Gene Co-expression and
 Discovery of Novel Human Gene Regulatory Modules from Gene Co-expression and Promoter Motif Analysis Shisong Ma 1,2*, Michael Snyder 3, and Savithramma P Dinesh-Kumar 2* 1 School of Life Sciences, University
SUPPLEMENTARY FIGURE 1: f-i
 SUPPLEMENTARY FIGURE 1: Comparisons of the biological replicates of ChIP-seq, Input and Bisulfite-seq. (a) Density plot of MeCP2 ChIP-seq genome coverage (calculated using tiled 15 bp windows) shows high
Yingying Wei George Wu Hongkai Ji
 Stat Biosci (2013) 5:156 178 DOI 10.1007/s12561-012-9066-5 Global Mapping of Transcription Factor Binding Sites by Sequencing Chromatin Surrogates: a Perspective on Experimental Design, Data Analysis,
a) List of KMTs targeted in the shrna screen. The official symbol, KMT designation,
 List of KMTs targeted in the shrna screen. The official symbol, KMT designation,") Supplementary Information Supplementary Figures Supplementary Figure 1. a) List of KMTs targeted in the shrna screen. The official symbol, KMT designation, gene ID and specifities are provided. Those highlighted
Supplementary Information Supplementary Figures Supplementary Figure 1. a) List of KMTs targeted in the shrna screen. The official symbol, KMT designation, gene ID and specifities are provided. Those highlighted
Alternative splicing. Biosciences 741: Genomics Fall, 2013 Week 6
 Alternative splicing Biosciences 741: Genomics Fall, 2013 Week 6 Function(s) of RNA splicing Splicing of introns must be completed before nuclear RNAs can be exported to the cytoplasm. This led to early
Supplementary Figure 1. Efficiency of Mll4 deletion and its effect on T cell populations in the periphery. Nature Immunology: doi: /ni.
 Supplementary Figure 1 Efficiency of Mll4 deletion and its effect on T cell populations in the periphery. Expression of Mll4 floxed alleles (16-19) in naive CD4 + T cells isolated from lymph nodes and
Chapter 2. Aims & Objectives
 2.1. Statement of the problem: Earlier reports have shown ambiguous alteration of histone marks in response to DNA damage in asynchronized population of cells. These histone marks not only undergo dynamic
Part-II: Statistical analysis of ChIP-seq data
 Part-II: Statistical analysis of ChIP-seq data Outline ChIP-seq data, features, detailed modeling aspects (today). Other ChIP-seq related problems - overview (next lecture). IDR (next lecture) Stat 877
Nature Genetics: doi: /ng Supplementary Figure 1. SEER data for male and female cancer incidence from
 Supplementary Figure 1 SEER data for male and female cancer incidence from 1975 2013. (a,b) Incidence rates of oral cavity and pharynx cancer (a) and leukemia (b) are plotted, grouped by males (blue),
Lung Met 1 Lung Met 2 Lung Met Lung Met H3K4me1. Lung Met H3K27ac Primary H3K4me1
 a Gained Met-VELs 1.5 1.5 -.5 Lung Met 1 Lung Met Lung Met 3 1. Lung Met H3K4me1 Lung Met H3K4me1 1 Lung Met H3K4me1 Lung Met H3K7ac 1.5 Lung Met H3K7ac Lung Met H3K7ac.8 Primary H3K4me1 Primary H3K7ac
SUPPLEMENTARY INFORMATION
 doi: 1.138/nature8645 Physical coverage (x haploid genomes) 11 6.4 4.9 6.9 6.7 4.4 5.9 9.1 7.6 125 Neither end mapped One end mapped Chimaeras Correct Reads (million ns) 1 75 5 25 HCC1187 HCC1395 HCC1599
Genome-wide positioning of bivalent mononucleosomes
 Sen et al. BMC Medical Genomics (2016) 9:60 DOI 10.1186/s12920-016-0221-6 RESEARCH ARTICLE Open Access Genome-wide positioning of bivalent mononucleosomes Subhojit Sen 1,2, Kirsten F. Block 1, Alice Pasini
Cluster Dendrogram. dist(cor(na.omit(tss.exprs.chip[, c(1:10, 24, 27, 30, 48:50, dist(cor(na.omit(tss.exprs.chip[, c(1:99, 103, 104, 109, 110,
 A Transcriptome (RNA-seq) Transcriptome (RNA-seq) 3. 2.5 2..5..5...5..5 2. 2.5 3. 2.5 2..5..5...5..5 2. 2.5 Cluster Dendrogram RS_ES3.2 RS_ES3. RS_SHS5.2 RS_SHS5. PS_SHS5.2 PS_SHS5. RS_LJ3 PS_LJ3..4 _SHS5.2
Supplemental Figure 1. Small RNA size distribution from different soybean tissues.
 Supplemental Figure 1. Small RNA size distribution from different soybean tissues. The size of small RNAs was plotted versus frequency (percentage) among total sequences (A, C, E and G) or distinct sequences
ChromHMM Tutorial. Jason Ernst Assistant Professor University of California, Los Angeles
 ChromHMM Tutorial Jason Ernst Assistant Professor University of California, Los Angeles Talk Outline Chromatin states analysis and ChromHMM Accessing chromatin state annotations for ENCODE2 and Roadmap
An epigenetic approach to understanding (and predicting?) environmental effects on gene expression
 environmental effects on gene expression") www.collaslab.com An epigenetic approach to understanding (and predicting?) environmental effects on gene expression Philippe Collas University of Oslo Institute of Basic Medical Sciences Stem Cell Epigenetics
www.collaslab.com An epigenetic approach to understanding (and predicting?) environmental effects on gene expression Philippe Collas University of Oslo Institute of Basic Medical Sciences Stem Cell Epigenetics
Chip Seq Peak Calling in Galaxy
 Chip Seq Peak Calling in Galaxy Chris Seward PowerPoint by Pei-Chen Peng Chip-Seq Peak Calling in Galaxy Chris Seward 2018 1 Introduction This goals of the lab are as follows: 1. Gain experience using
Genome-Wide Localization of Protein-DNA Binding and Histone Modification by a Bayesian Change-Point Method with ChIP-seq Data
 Genome-Wide Localization of Protein-DNA Binding and Histone Modification by a Bayesian Change-Point Method with ChIP-seq Data Haipeng Xing, Yifan Mo, Will Liao, Michael Q. Zhang Clayton Davis and Geoffrey
Nature Structural & Molecular Biology: doi: /nsmb Supplementary Figure 1
 Supplementary Figure 1 Design of isolated protein and RNC constructs, and homogeneity of purified RNCs. (a) Schematic depicting the design and nomenclature used for all the isolated proteins and RNCs used
Nature Getetics: doi: /ng.3471
 Supplementary Figure 1 Summary of exome sequencing data. ( a ) Exome tumor normal sample sizes for bladder cancer (BLCA), breast cancer (BRCA), carcinoid (CARC), chronic lymphocytic leukemia (CLLX), colorectal
MIR retrotransposon sequences provide insulators to the human genome
 Supplementary Information: MIR retrotransposon sequences provide insulators to the human genome Jianrong Wang, Cristina Vicente-García, Davide Seruggia, Eduardo Moltó, Ana Fernandez- Miñán, Ana Neto, Elbert
A high-throughput ChIP-Seq for large-scale chromatin studies
 Article A high-throughput ChIP-Seq for large-scale chromatin studies Christophe D Chabbert,1, Sophie H Adjalley,1, Bernd Klaus 1, Emilie S Fritsch 1, Ishaan Gupta 1, Vicent Pelechano 1,* & Lars M Steinmetz
1000 Patient study of detection of CRC and polyps by serum ELISA of altered epigenetic signatures in circulating cell free nucleosomes
 1000 Patient study of detection of CRC and polyps by serum ELISA of altered epigenetic signatures in circulating cell free nucleosomes 9 th International Conference of Anticancer Research Sithonia, Oct
Large conserved domains of low DNA methylation maintained by Dnmt3a
 Supplementary information Large conserved domains of low DNA methylation maintained by Dnmt3a Mira Jeong# 1, Deqiang Sun # 2, Min Luo# 1, Yun Huang 3, Grant A. Challen %1, Benjamin Rodriguez 2, Xiaotian
BIMM 143. RNA sequencing overview. Genome Informatics II. Barry Grant. Lecture In vivo. In vitro.
 RNA sequencing overview BIMM 143 Genome Informatics II Lecture 14 Barry Grant http://thegrantlab.org/bimm143 In vivo In vitro In silico ( control) Goal: RNA quantification, transcript discovery, variant
Figure S2. Distribution of acgh probes on all ten chromosomes of the RIL M0022
 96 APPENDIX B. Supporting Information for chapter 4 "changes in genome content generated via segregation of non-allelic homologs" Figure S1. Potential de novo CNV probes and sizes of apparently de novo
Sirt1 Hmg20b Gm (0.17) 24 (17.3) 877 (857)
 24 (17.3) 877 (857)") 3 (0.17) 24 (17.3) Sirt1 Hmg20 Gm4763 877 (857) c d Suppl. Figure 1. Screen validation for top candidate antagonists of Dot1L (a) Numer of genes with one (gray), two (cyan) or three (red) shrna scored
3 (0.17) 24 (17.3) Sirt1 Hmg20 Gm4763 877 (857) c d Suppl. Figure 1. Screen validation for top candidate antagonists of Dot1L (a) Numer of genes with one (gray), two (cyan) or three (red) shrna scored
QIAsymphony DSP Circulating DNA Kit
 QIAsymphony DSP Circulating DNA Kit February 2017 Performance Characteristics 937556 Sample to Insight Contents Performance Characteristics... 4 Basic performance... 4 Run precision... 6 Equivalent performance
Analysis of the peroxisome proliferator-activated receptor-β/δ (PPARβ/δ) cistrome reveals novel co-regulatory role of ATF4
 cistrome reveals novel co-regulatory role of ATF4") Khozoie et al. BMC Genomics 2012, 13:665 RESEARCH ARTICLE Open Access Analysis of the peroxisome proliferator-activated receptor-β/δ (PPARβ/δ) cistrome reveals novel co-regulatory role of ATF4 Combiz Khozoie
Khozoie et al. BMC Genomics 2012, 13:665 RESEARCH ARTICLE Open Access Analysis of the peroxisome proliferator-activated receptor-β/δ (PPARβ/δ) cistrome reveals novel co-regulatory role of ATF4 Combiz Khozoie
Supplemental Information. Genomic Characterization of Murine. Monocytes Reveals C/EBPb Transcription. Factor Dependence of Ly6C Cells
 Immunity, Volume 46 Supplemental Information Genomic Characterization of Murine Monocytes Reveals C/EBPb Transcription Factor Dependence of Ly6C Cells Alexander Mildner, Jörg Schönheit, Amir Giladi, Eyal
SUPPLEMENTARY INFORMATION
 doi:10.1038/nature16931 Contents 1 Nomenclature 3 2 Fertility of homozygous B6 H/H and heterozygous B6 B6/H mice 3 3 DSB hotspot maps 3 3.1 DSB hotspot caller............................... 3 3.2 Calling
Nature Neuroscience: doi: /nn Supplementary Figure 1. Behavioral training.
 Supplementary Figure 1 Behavioral training. a, Mazes used for behavioral training. Asterisks indicate reward location. Only some example mazes are shown (for example, right choice and not left choice maze
Breast cancer. Risk factors you cannot change include: Treatment Plan Selection. Inferring Transcriptional Module from Breast Cancer Profile Data
 Breast cancer Inferring Transcriptional Module from Breast Cancer Profile Data Breast Cancer and Targeted Therapy Microarray Profile Data Inferring Transcriptional Module Methods CSC 177 Data Warehousing
RNA-seq Introduction
 RNA-seq Introduction DNA is the same in all cells but which RNAs that is present is different in all cells There is a wide variety of different functional RNAs Which RNAs (and sometimes then translated
SUPPLEMENTAL INFORMATION
 SUPPLEMENTAL INFORMATION GO term analysis of differentially methylated SUMIs. GO term analysis of the 458 SUMIs with the largest differential methylation between human and chimp shows that they are more
Supplemental Figure legends
 Supplemental Figure legends Supplemental Figure S1 Frequently mutated genes. Frequently mutated genes (mutated in at least four patients) with information about mutation frequency, RNA-expression and copy-number.
Hands-On Ten The BRCA1 Gene and Protein
 Hands-On Ten The BRCA1 Gene and Protein Objective: To review transcription, translation, reading frames, mutations, and reading files from GenBank, and to review some of the bioinformatics tools, such
The Biology and Genetics of Cells and Organisms The Biology of Cancer
 The Biology and Genetics of Cells and Organisms The Biology of Cancer Mendel and Genetics How many distinct genes are present in the genomes of mammals? - 21,000 for human. - Genetic information is carried
genomics for systems biology / ISB2020 RNA sequencing (RNA-seq)
") RNA sequencing (RNA-seq) Module Outline MO 13-Mar-2017 RNA sequencing: Introduction 1 WE 15-Mar-2017 RNA sequencing: Introduction 2 MO 20-Mar-2017 Paper: PMID 25954002: Human genomics. The human transcriptome
RNA sequencing (RNA-seq) Module Outline MO 13-Mar-2017 RNA sequencing: Introduction 1 WE 15-Mar-2017 RNA sequencing: Introduction 2 MO 20-Mar-2017 Paper: PMID 25954002: Human genomics. The human transcriptome
Use Case 9: Coordinated Changes of Epigenomic Marks Across Tissue Types. Epigenome Informatics Workshop Bioinformatics Research Laboratory
 Use Case 9: Coordinated Changes of Epigenomic Marks Across Tissue Types Epigenome Informatics Workshop Bioinformatics Research Laboratory 1 Introduction Active or inactive states of transcription factor
STAT1 regulates microrna transcription in interferon γ stimulated HeLa cells
 CAMDA 2009 October 5, 2009 STAT1 regulates microrna transcription in interferon γ stimulated HeLa cells Guohua Wang 1, Yadong Wang 1, Denan Zhang 1, Mingxiang Teng 1,2, Lang Li 2, and Yunlong Liu 2 Harbin
Transcription and chromatin. General Transcription Factors + Promoter-specific factors + Co-activators
 Transcription and chromatin General Transcription Factors + Promoter-specific factors + Co-activators Cofactor or Coactivator 1. work with DNA specific transcription factors to make them more effective
Supplementary Figure 1: Features of IGLL5 Mutations in CLL: a) Representative IGV screenshot of first
 Representative IGV screenshot of first") Supplementary Figure 1: Features of IGLL5 Mutations in CLL: a) Representative IGV screenshot of first intron IGLL5 mutation depicting biallelic mutations. Red arrows highlight the presence of out of phase
Supplementary Figure 1: Features of IGLL5 Mutations in CLL: a) Representative IGV screenshot of first intron IGLL5 mutation depicting biallelic mutations. Red arrows highlight the presence of out of phase
Data mining with Ensembl Biomart. Stéphanie Le Gras
 Data mining with Ensembl Biomart Stéphanie Le Gras (slegras@igbmc.fr) Guidelines Genome data Genome browsers Getting access to genomic data: Ensembl/BioMart 2 Genome Sequencing Example: Human genome 2000:
A Practical Guide to Integrative Genomics by RNA-seq and ChIP-seq Analysis
 A Practical Guide to Integrative Genomics by RNA-seq and ChIP-seq Analysis Jian Xu, Ph.D. Children s Research Institute, UTSW Introduction Outline Overview of genomic and next-gen sequencing technologies
Analysis of Massively Parallel Sequencing Data Application of Illumina Sequencing to the Genetics of Human Cancers
 Analysis of Massively Parallel Sequencing Data Application of Illumina Sequencing to the Genetics of Human Cancers Gordon Blackshields Senior Bioinformatician Source BioScience 1 To Cancer Genetics Studies
EPIGENOMICS PROFILING SERVICES
 EPIGENOMICS PROFILING SERVICES Chromatin analysis DNA methylation analysis RNA-seq analysis Diagenode helps you uncover the mysteries of epigenetics PAGE 3 Integrative epigenomics analysis DNA methylation
Nature Genetics: doi: /ng Supplementary Figure 1
 Supplementary Figure 1 Replicability of blood eqtl effects in ileal biopsies from the RISK study. eqtls detected in the vicinity of SNPs associated with IBD tend to show concordant effect size and direction
Patterns of Histone Methylation and Chromatin Organization in Grapevine Leaf. Rachel Schwope EPIGEN May 24-27, 2016
 Patterns of Histone Methylation and Chromatin Organization in Grapevine Leaf Rachel Schwope EPIGEN May 24-27, 2016 What does H3K4 methylation do? Plant of interest: Vitis vinifera Culturally important
Supplemental Information For: The genetics of splicing in neuroblastoma
 Supplemental Information For: The genetics of splicing in neuroblastoma Justin Chen, Christopher S. Hackett, Shile Zhang, Young K. Song, Robert J.A. Bell, Annette M. Molinaro, David A. Quigley, Allan Balmain,
Distinct Epigenetic Signatures Delineate Transcriptional Programs during Virus-Specific CD8 + T Cell Differentiation
 Resource Distinct Epigenetic Signatures Delineate Transcriptional Programs during Virus-Specific CD8 + T Cell Differentiation Brendan E. Russ, 1 Moshe Olshanksy, 2 Heather S. Smallwood, 3 Jasmine Li, 1
Supplemental Data. Integrating omics and alternative splicing i reveals insights i into grape response to high temperature
 Supplemental Data Integrating omics and alternative splicing i reveals insights i into grape response to high temperature Jianfu Jiang 1, Xinna Liu 1, Guotian Liu, Chonghuih Liu*, Shaohuah Li*, and Lijun
Nature Genetics: doi: /ng Supplementary Figure 1. Mutational signatures in BCC compared to melanoma.
 Supplementary Figure 1 Mutational signatures in BCC compared to melanoma. (a) The effect of transcription-coupled repair as a function of gene expression in BCC. Tumor type specific gene expression levels
Supplementary Figure 1. Schematic diagram of o2n-seq. Double-stranded DNA was sheared, end-repaired, and underwent A-tailing by standard protocols.
 Supplementary Figure 1. Schematic diagram of o2n-seq. Double-stranded DNA was sheared, end-repaired, and underwent A-tailing by standard protocols. A-tailed DNA was ligated to T-tailed dutp adapters, circularized
Histone Modifications Are Associated with Transcript Isoform Diversity in Normal and Cancer Cells
 Histone Modifications Are Associated with Transcript Isoform Diversity in Normal and Cancer Cells Ondrej Podlaha 1, Subhajyoti De 2,3,4, Mithat Gonen 5, Franziska Michor 1 * 1 Department of Biostatistics
Supplemental Figure S1. Expression of Cirbp mrna in mouse tissues and NIH3T3 cells.
 SUPPLEMENTAL FIGURE AND TABLE LEGENDS Supplemental Figure S1. Expression of Cirbp mrna in mouse tissues and NIH3T3 cells. A) Cirbp mrna expression levels in various mouse tissues collected around the clock
Whole Genome and Transcriptome Analysis of Anaplastic Meningioma. Patrick Tarpey Cancer Genome Project Wellcome Trust Sanger Institute
 Whole Genome and Transcriptome Analysis of Anaplastic Meningioma Patrick Tarpey Cancer Genome Project Wellcome Trust Sanger Institute Outline Anaplastic meningioma compared to other cancers Whole genomes
Integrated analysis of sequencing data
 Integrated analysis of sequencing data How to combine *-seq data M. Defrance, M. Thomas-Chollier, C. Herrmann, D. Puthier, J. van Helden *ChIP-seq, RNA-seq, MeDIP-seq, Transcription factor binding ChIP-seq