CTCF-Mediated Functional Chromatin Interactome in Pluripotent Cells
|
|
|
- Leslie Payne
- 6 years ago
- Views:
Transcription
1 SUPPLEMENTARY INFORMATION CTCF-Mediated Functional Chromatin Interactome in Pluripotent Cells Lusy Handoko 1,*, Han Xu 1,*, Guoliang Li 1,*, Chew Yee Ngan 1, Elaine Chew 1, Marie Schnapp 1, Charlie Wah Heng Lee 1, Chaopeng Ye 1, Joanne Lim Hui Ping, Fabianus Mulawadi 1, Eleanor Wong 1, 2, Jianpeng Sheng 3, Yubo Zhang 1, Thompson Poh 1, Chee Seng Chan 1, Galih Kunarso 4, Atif Shahab 1, Guillaume Bourque 1, Valere Cacheux-Rataboul 1, Wing-Kin Sung 1, 3, Yijun Ruan 1, # 1, 2, #,, Chia-Lin Wei 1 Genome Institute of Singapore, Singapore National University of Singapore, Singapore Nanyang Technological University, Singapore Duke-NUS Graduate Medical School Singapore, Singapore # Corresponding authors Chia-Lin Wei Yijun Ruan Tel: 1 (925) (65) cwei@lbl.gov ruanyj@gis.a-star.edu.sg * These authors contributed equally Current address: Joint Genome Institute, Walnut Creek, California, U.S.A. Keyword: insulator, enhancer, chromatin organization, epigenetic regulation, nuclear lamina 1
2 Supplementary Note 1. ChIA-PET analysis 1.1 Determine cutoff fragment size between self ligation and inter ligation PETs 1.2 Chimeric ChIA-PETs represent non-specific random inter-molecular ligation 1.3 Reproducibility between biological and technical replicates of ChIA-PET libraries Supplementary Figures Supplementary Figure 1. CTCF ChIA-PET analysis Supplementary Figure 2. Molecular and cytogenetic validation of CTCF directed inter- and intra-chromosomal interactions Supplementary Figure 3. Clustering of inter-chromosomal interactions Supplementary Figure 4. Specificity of chromatin domains defined by CTCF-mediated DNA looping Supplementary Figure 5. Probability of loop span in each category and reduction of H3K4me1 signal intensities after CTCF knock-down Supplementary Figure 6. Histone modification and RNAP II profiles in each chromatin domain and neighboring regions Supplementary Figure 7. Examples of loops from category I-IV Supplementary Figure 8. p300 association with cell specific open chromatin marks and enhancer signals Supplementary Figure 9. DNA loop brings promoter and p300 enhancer into close proximity and affects expression of the corresponding genes Supplementary Figure 10. Characterization of Lamin B-binding regions Supplementary Figure 11. Model of CTCF directed chromatin domains (category I-IV), their associated gene activities and sub-nuclear chromatin localizations Supplementary Tables Supplementary Table 1. ChIA-PET sequencing processing and mapping summary Supplementary Table 2. CTCF binding sites (Excel file) Supplementary Table 3. Intra-and inter-chromosomal interactions detected by CTCF ChIA- PET (Excel file) Supplementary Table 4. 4C, FISH and 3C validation results 2
3 Supplementary Table 5. List of 5 categories assigned to intra-chromosomal interactions (Excel File) Supplementary Table 6. RNA Pol II, p300 and LADs sites defined by ChIP-Seq (Excel file) Supplementary Table 7. ChIP-qPCR of CTCF, Lamin B, p300 Supplementary Table 8. RNAP II interactions defined by ChIA-PET (Excel File) Supplementary Table 9. SALL4 interactions defined by ChIA-PET (Excel File) Supplementary Table 10. Sequences of ChIA-PET linkers, sirna, primers (qpcr, 3C, 4C) and list of BAC clones 3
4 Supplementary Note 1. ChIA-PET analysis 1.1. Determination of a self ligation and inter ligation cutoff. In the ChIA-PET analysis, two types of ligation products were produced: the inter-molecular ligation events and self-ligation events. Self-ligation events mean that the two ends of the same DNA fragment are ligated together. We used the inter-molecular ligation PETs to identify interactions and self-ligation PETs to define binding sites. To determine the span cutoff between self-ligation and intra-chromosomal inter-molecular ligation PETs, we used the log-log plot analysis of the span distribution on the CTCF ChIA- PETs. A mixture model was observed with two straight distribution lines (see left); clearly representing two distinct PET populations. The size distribution of the self-ligating PETs follows a power-law distribution, which is a straight line on the left in the log-log plot. A different power-law distribution was observed for the intra-chromosomal interactions. Therefore, the span cutoff can be determined by the intersection between these two lines in the log-log plot which is between 5-10 Kb. Because the PETs around the calculated cutoff are a mixture of the self-ligation PETs and inter-ligation PETs, we used 10 Kb as cutoff size to select high confidence inter-ligating PETs. 0.1Kb 0.3Kb 1Kb 3.3Kb 3.1Kb 10Kb 31.6Kb 33Kb 100Kb Span (log scale) 1.2. Chimeric ChIA-PETs represent non-specific random inter-molecular ligation The chimeric libraries generate no interaction cluster with FDR=0.05 and the interaction PETs identified shared little overlap between both biological and technical replicates. We further compared the span distributions of the intra-chromosomal PETs between chimeric and nonchimeric ChIA-PET libraries. The span of a PET is the genomic distance between the head and tail of each ChIA- PET. A log-log plot of the PET span distributions for PETs with spans from 10 Kb to 1 Mb from both chimeric and non-chimeric libraries is given below. The span 4
5 distribution from the non-chimeric library shows a good correlation (R 2 = 0.94) to a power-law distribution, while the span distribution from the chimeric library looks quite noisy. We also generated the span distribution with the random data by shuffling the heads and tails of the PETs. The span distribution from the random data looks like a constant. This confirms the quality of the non-chimeric ChIA-PET library and indicates that the ligation in the chimeric ChIA-PET library resulted from random chromatin ligation rather than the ligation of DNA molecules proximal to one another in the nucleus frequency of intra-chromosomal PETs y = 3920.x R² = y = 3E+08x R² = span of intra-chromosomal PETs IME041_042_043 Non-chimeric library IME041_042_043 Chimeric library Power (IME041_042_043 Non-chimeric library) Power (IME041_042_043 Chimeric library) 5
6 1.3. Reproducibility between biological and technical replicates of ChIA-PET libraries To evaluate the complexity and dynamic status of interactions, CTCF ChIP material from mouse ES cells grown separately was used to construct biological (BR1 vs. BR2) and technical replicates (TR1 vs. TR2)(Supplementary Table 1). Plotting distribution of tags across the genome in each library against its matched replicate (see left) shows a high correlation for each replicate pair. Among the reliable interaction clusters detected between TR1 (1,197) and TR2 (1,206), 906 (76%) clusters are shared and common. Among the reliable interaction clusters detected between BR1 (3,811) and BR2 (1,384), 533 (38%) are commonly found. Such significant degree of Technical Replicates TR1 vs. TR Biological Replicates BR1 vs. BR overlaps (empirical p-value < 1e-6) indicates that the interaction clusters defined are reliable. The larger difference between interactions detected in the biological replicates suggests that such chromatin interactions could be highly complex and dynamic among cell populations. To further determine whether the overlap between these replicates is specific and significant, we examined the level of reproducibility between the replicates of chimeric libraries. As expected, no significant interacting PET clusters were found in multiple chimeric ChIA-PET libraries even when the top 1000 interacting loci (chosen based on the FDR) were compared. We next performed saturation analysis using the reproducibility of two biological replicates (BR1 and BR2). Based on the degree of overlapping interactions among biological replicates and assuming random sampling from the total pool by each replicate, we predict that there are 9,000-10,000 potential interactions in the ES cells. Since our cluster analysis identified ~ 5,384 PET clusters, we potentially have detected ~ 50% of the total CTCF-associated
7 chromatin interactions present in these cells. Upon close examination, the interactions identified are mostly involved the binding sites with higher peak intensities and thus likely to result from stronger interactions. However, the true level of comprehensiveness will probably beyond the current estimation with the improvement of the robustness of the detection method and many more bona fide but weaker or transient interactions will be found. The Venn diagram above shows the overlap between two sets of interactions. We next asked how many more sequences from BR1 were needed in order to capture most of the interactions found in BR2 To answer this question, we randomly selected 10%, 20%,, 100% of the non-redundant reads from BR1, identified interactions using the criteria (PET2+, FDR<0.05), and counted the number of overlapping interactions in BR2 with different sequencing depths from BR1. A Hill-function was fitted to the data to estimate the level of saturation. Based on the fitted Hill function, 632 interactions in BR2 can be called if we retrieve infinite sequences from BR1. With the current sequencing depth of BR1, 533 out of 632 (84%) of the interactions are called. While only 45.7% (632 out of 1384) of the interactions in BR2 can be called even if we sequence BR1 infinitely. So, these numbers suggest that we have achieved over 80% saturation of the current library sequencing but only reached 45% saturation on the identifying all the potential interactions. This result suggests that the diversity among different biological replicates is large and library complexity is limited. Therefore, to achieve higher sensitivities, more biological replicates, rather than deeper sequencing on a single library, is needed. 7
8 Supplementary Figures Supplementary Figure 1. CTCF ChIA-PET analysis (a) Overview of CTCF ChIA-PET analysis. Juxtaposed chromatin complexes are cross-linked and the interactions tethered by CTCF are enriched by chromatin immunoprecipitation. The resulted ChIP complexes are split into two reactions and ligated with a special linker A or B containing a MmeI restriction enzyme 8
9 recognition site and biotin label. Intra-molecular ligation is then carried out to join the ends of proximal chromatin fragment. Three different types of ligation products are obtained: self-ligated DNA fragments (very left and very right), intra molecular ligations from chromatin fragments containing either A-A or B-B linkers (2 nd to the right and left), and inter-molecular chimeric ligations obtained from two non specifically-interacting chromatin complexes carrying A-B linker (middle). Ligation products (self-circularization of individual DNA fragment or intramolecular ligation of multiple DNA fragments within one interacting chromatin complex) are digested with MmeI to release PETs and selected by streptavidin conjugated magnetic beads. Ultrahigh throughput sequencing analysis is then performed to reveal long range chromatin interaction loci. The DNA fragments with either A-A or B-B linkers will be used as nonchimeric PETs to determine binding sites or chromatin interaction loci. The fragments with A-B linkers (chimeric PETs) are used as an indicator to estimate the level of noise in the ChIA-PET library. From the 10.1 million uniquely mapped inter-ligating PETs, we then defined the interligation PET clusters. Using occurrence frequency to distinguish real interaction signals (multiple overlapping clusters) from random noise (PET singletons); we obtained 2,275 intraand 3,109 inter-ligation PET clusters (Supplementary Table 3a, b). We further checked for homology between anchors and found that the majority of the sequences from the paired interaction anchor regions show no homology and thus are unlikely to have resulted from mapping errors of segmental duplications and homologous sequences. Furthermore, most of these interaction loci are supported by CTCF binding. 2,115 of the 2,275 intra-chromosomal (93%) and 2,648 of the 3,109 inter-chromosomal interactions (85%) harbor CTCF binding sites on either or both anchors of the interaction loci. 9
10 (b) CTCF binding sites defined by self-ligating ChIA-PETs 10
11 An example is shown here in a 92 Kb interval around chr2:106,149, ,241,509 surrounding the gene G10Rik. Two strong CTCF binding sites are detected by ChIP-Seq analysis (green track). Self-ligating ChIA-PETs shown as overlapping red connecting lines are also found to be accumulated at the same locations. The intensity profile resulting from these self-ligating ChIA-PETs is highly similar to the profile generated from ChIP-Seq. (c) ChIP-qPCR validation of CTCF binding sites detected by ChIP-Seq. 21 CTCF binding sites were chosen based on the peak intensities (decreasing from the left to the right). Negative control regions (22-41) represent regions with no CTCF binding sites. The fold of enrichment is shown in the Y-axis for the list of 1-21 sites selected (Supplementary Table 7a). (d) Correlation of binding intensities of CTCF and their involvement in the interactions. In total, 3,306 CTCF binding sites are involved in these chromatin interactions. Compared with the binding sites that are not involved in the interactions, these 3,306 sites have higher binding intensities (p<10e-308 in KS-test). The plot shows the ratio of binding sites found to anchor chromatin interactions ranked by the binding site intensities. 20% of the top 200 CTCF binding peaks are found in the interaction anchors while only 2% of the bottom 200 binding peaks are detected in the anchors. (e) The distributions of peak heights for binding sites involved in interactions (blue) and those not involved in interactions (red). It appears that the detected interactions are mediated through the stronger binding events. 11
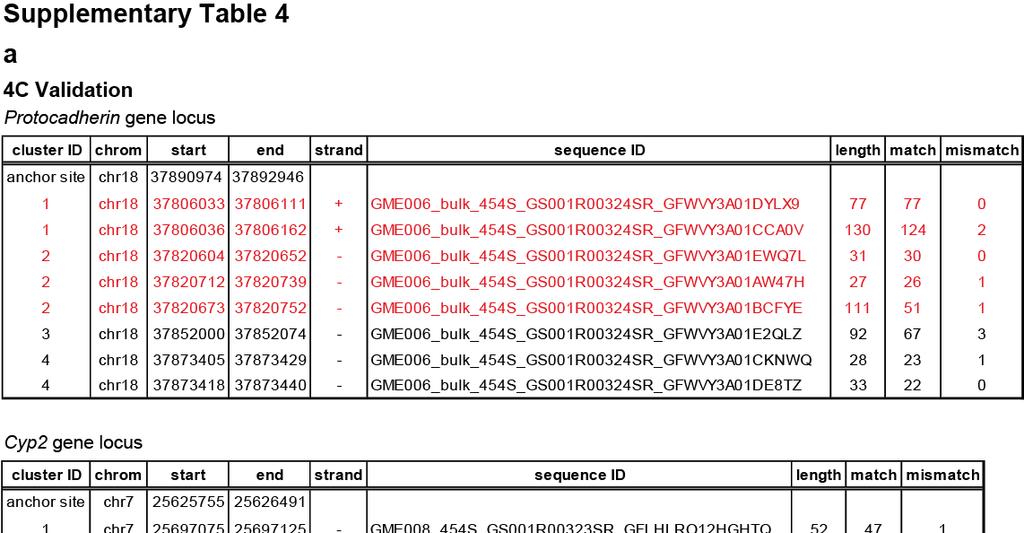
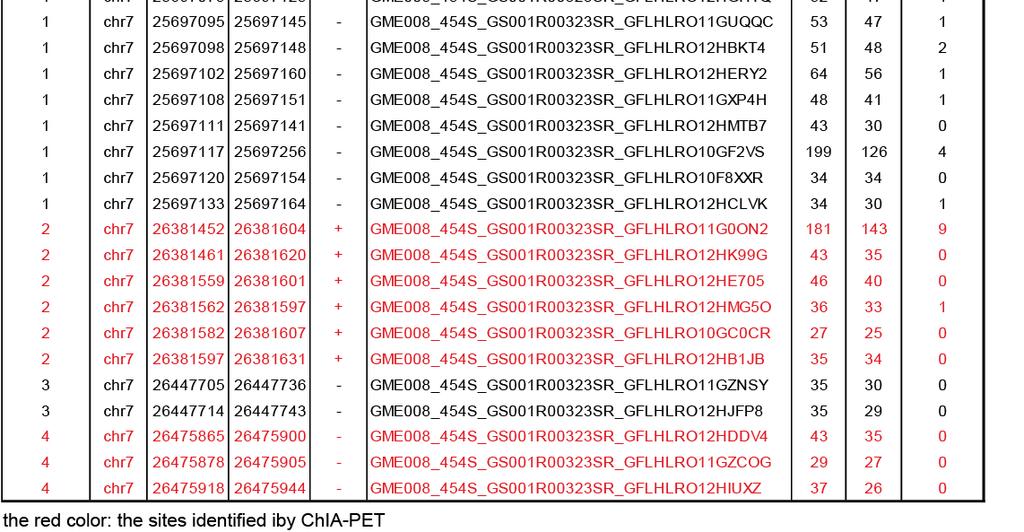
12 Supplementary Figure 2. Molecular and cytogenetic validation of CTCF directed inter- and intra-chromosomal interactions. (a) Validation of intra-chromosomal interaction by 4C assay. In the Pcdhga and b locus (chr18: ), ChIA-PET detected 5 interactions. Using Protocadherin subfamily A12 promoter (chr18: 37,890,974-37,892,946) as a 4C bait region or anchor point (green triangle, ), 4 different intra-chromosomal interactions were detected. Among these 4 clusters, 2 confirmed the interactions detected by ChIA-PET (dashed circles). One interaction is detected between the Pcdhga12 promoter and the Pcdhgb1 promoter (chr18:37,806,000) approximately 85 kb upstream. The other interaction (~ 71 kb) is found between the promoter of Pcdhga12 and Pcdhga4 (chr18: 37,820,000). 4C also detected 2 more intra-chromosomal interactions anchored by CTCF binding which were missed by ChIA-PET analysis. One of them occurs between the anchor site, Pcdhga12 promoter, and the promoter of Pcdhga8 which are 40 kb in apart, while the other loop with 20 kb span connects the promoter of Pcdhga12 and of Pcdhga10 (see Supplementary Table 4a for a list of sites detected by 4C). 12

13 (b) List of inter-chromosomal interaction validated by FISH (Fluorescent In Situ Hybridization) To validate the inter-chromosomal interactions, we performed DNA FISH cytogenetic assays on the ES cells. The table shows fourteen inter-chromosomal interactions with cluster size 3 selected for FISH validation. 2 of them have CTCF binding site at one interaction anchor only. (c) Co-localization ratio distribution (fold change between fusion of two interacting loci and fusion of the control region) among all sites validated. As a negative control region, we randomly chose a region on chr16 (chr16:52,100,818-52,400,160) which is > 1 Mb in distance from any interaction site detected by ChIA-PET. 9 of 14 inter-chromosomal interactions have p- value <0.05, co-localization ratio > 1.5 and were considered successfully validated. Interactions 1-14 indicate the interactions listed in the table (b). 13
14 (d) Example of FISH images from a validated inter-chromosomal interaction. The interaction fusion event connects Syne1 (chr10) and Rnps1-Abca3 gene (chr17) loci. Top panel: location of the probes for FISH. Bottom panel: co-localization of signals from two interacting chromosomes. (e) Validation of intra-chromosomal interaction by 3C-qPCR assay. 14
15 DNA looping mediated by CTCF was detected between Acbd4 gene and Hexim1 (chr11: ) (top panel). Chromatin from mouse ES cells was digested with EcoRI ( EcoRI digestion map is shown in the middle panel, A, 1, 2,,6 represent the region ~ 100 bp from the digested sites and were used to design the primers). As expected, the interaction formed between the anchor A (green triangle, ) and the nearest region (A-1) which is 4 kb downstream from the anchor was found to occur at high frequency. Interaction frequency decreased with the distance to the anchor region, but increased at the region where the loop was detected (A-5, interaction frequency of 0.6) (all 3C results can be found in Supplementary Table 4c). (f) Validation of intra-chromosomal interaction by 3C-qPCR assay on CTCF knock down cells. DNA looping mediated by CTCF was detected between the promoter region of Efna2 and 3 end of the Mim1 gene (top panel). In this 3C assay, chromatin from mouse ES cells was digested with HindIII (middle panel). In the control cells, we observe a high interaction frequency between A-5 where the loop was detected. In contrast, the interaction between A and 5 was reduced 3 fold in the CTCF knock down cell (relative interaction frequency in CTCF kd vs. control cells= vs ) (Supplementary Table 4c). This result suggests that the DNA loop detected here was indeed CTCF-specific. We did however find an overall reduction of interaction frequency in the other ligated fragments A-1, A-2, A-4 and A-7. Since we used an independent locus on another chromosome for normalization (Ercc3, chr18), we could exclude the possibility that the changes resulted from technique variation between samples (digestion and ligation efficiency). Furthermore, FACS analysis on CTCF kd cells suggests that no changes in cell cycle or cell death were observed in the CTCF knock down cells, when compared to the control cells and untreated cells (data not shown). This further ruled out the possibility that the overall reduction of interaction frequency was due to cell cycle arrest or cell death. 15

16 Supplementary Figure 3. Clustering of inter-chromosomal interactions. (a) Normalized inter-chromosomal interaction frequency matrix between different chromosome pairs. The normalized frequency is plotted as a heat map and the enriched pairs of high frequency interactions are displayed here as intense color regions. Significant enrichments are observed above background between specific chromosome pairs. (b) Hierarchical clustering of each chromosome pair indicates the spatial relation between chromosomes. Two or more chromosomes are assumed to be spatially closer to each other if they interact more frequently. Height represents distance between chromosomes. The clustering shows that chromosomes 8, 15, 16, 18, which belong to the same subcluster, have more 16
17 interactions and are spatially closer to each other than to the other remaining chromosomes, as indicated by having the lowest distance/height. (c) Interaction density matrix of each pair of chromosomes (as shown in a), from two biological replicates (BR1 and BR2). 17

18 Handoko L*, Han X*, Li G* et. al., 18
19 Supplementary Figure 4. Specificity of chromatin domains defined by CTCF-mediated DNA looping. (a) Three different sets of control loops were used to determine whether the different chromatin domains determined from the clustering analysis are specific to CTCF. Histone profiling derived from CTCF-mediated loops (left), randomly simulated loops (second from the left), SALL4 loops (second from the right) and RNAP II loop (right). 1,622 of RNAP II-associated intrachromosomal interactions with cluster size 5 (PET5+ RNAP II) (Supplementary Table 8), 1,636 SALL4-associated intra-chromosomal interaction loops (PET-4+ SALL4) (Supplementary Table 9) and simulated loops randomly paired by CTCF binding sites spanning between 10 Kb to 1 Mb were selected. Loops were sorted in ascending order of span, and we examined the histone pattern associated with different span. Each column corresponds to an aligned bin, and each row corresponds to a loop. A window containing 100 loops was moved vertically to average the signal. CTCF Loops with span < 200k are mostly active domains (indicated by H3K4me1, and to lesser degree H3K36me3 enrichments. CTCF loops with span > 200k has clearly different pattern (K9 and K20 me3). Loops > 200K are mostly repressive domains indicated by H3K9 and K20 me3 enrichment. As shown, the histone signal intensity patterns defined from CTCF interactions are unique to the CTCF and not found in RNAP II and SALL4-associated interactions. Furthermore, the loop span correlation, particularly around 200 Kb, is not observed in the RNAP II, SALL4 and simulated control interactions. (b) Histone modification patterns within the chromatin domains are CTCF loop-specific. Top panel: in CTCF loops less than 200 Kb in size, K4me1 shows significant enrichment (left) and K36me3 shows significant depletion (right) relative to three different sets of control interactions (p-values are shown below each graph). Bottom panel: In the CTCF interactions > 200 Kb, H3K9 (left) & K20 me3 (right) are found to be significantly enriched inside of the loops compared with the signals found in other control interactions. Therefore, we conclude the histone modification patterns and chromatin domains uncovered here are unique to the CTCF-associated interactions. 19
20 Supplementary Figure 5. Reduction of H3K4m1 signal intensities within the loops after CTCF knock-down. 20
21 (a) Reduction of CTCF led to decrease in signal intensities of H3K4me1 within active domain defined by CTCF-associated DNA loop. The accumulated normalized intensity of H3K4me1 is plotted along the CTCF demarcated chromatin loops and their neighboring regions. The blue line represents the signals from the CTCF kd cells and the red line represents the signals from the control sirna transfected cells. (b) Examples of the active domains with decreased H3K4me1 level in the CTCF kd cells. Top panel: DNA looping detected by CTCF, H3K4me1 signals represented by ChIP-seq tag count distribution are plotted in the middle (control cells) and in the bottom (CTCF kd cells) panels. The scale was normalized based on the sequencing depth. 21
22 Supplementary Figure 6. Histone modification and RNAP II profiles in each chromatin domain and neighboring regions. Cumulative histone modification signals and RNAP II intensities within (center) and outside (to the upstream and downstream) of the CTCF demarcated loops (see model on the top) for each category. The X-axis shows the relative location of loops and the Y-axis shows the normalized cumulative intensities. 22

23 Supplementary Figure 7. Examples of loops from category I-IV. Examples of loops found in category I-IV at genomic coordinates chr14:53,899,359-54,135,506, chr19:43,484,753-43,776,079, chr6:83,807,453-83,917,825 and chr7:99,844,767-99,896,702, respectively. The categories are labeled on the top left corner. The order of the tracks shown from the top is: genes, CTCF binding peaks, observed interactions and active histone marks (H3K4m1, m3, H3K36m3), RNAP II profiles and repressive histone marks (H3K27m3 and H3K9m3). 23

24 Supplementary Figure 8. p300 association with cell specific open chromatin marks and enhancer signals. 24
25 (a) ChIP-qPCR validation of p300 binding sites. The level of enrichment is shown. 21 p300 sites and 25 negative control regions were chosen (Supplementary Table 7b). (b) ChIP-qPCR validation of Lamin associated domains (LADs). LADs were selected based on fold change. 16 of 17 LADs were successfully validated. Nine sites outside LAD were used as negative controls (Supplementary Table 7c). (c) Genomic distribution of p300 binding relative to gene locations. The genome was divided into 4 distinct regions: proximal promoter (± 2.5 kb from well-annotated transcription start sites/tss), distal promoter (a region lies between 2.5 kb 20 kb upstream from TSS), gene body or intragenic region (2.5 kb downstream from TSS 2.5 kb downstream from transcription stop sites) and intergenic region (>20 kb distal from TSS or transcription stop site). ~60% of the p300 sites are associated with gene regions, but largely (>80%) located distal from the proximal promoters. Only 16 % of p300 binding sites occur in proximal promoter regions. (d) FAIRE, an open chromatin indicator, signal intensities from ES cells are plotted ± 1Kb of ES specific p300 binding peaks. ES specific p300 sites were associated with cell specific FAIRE signals. p300 associated genomic regions exhibited cell specific open chromatin states as indicated by FAIRE signal. (e) Venn diagraphs of the overlaps between p300, H3K4me1 and me2 sites in ES cells. Majority of the p300 binding sites overlap with a subset of enhancer marks H3K4me1 and me2 marks. 70% (3,526/5,033) of ESC-p300 sites overlap with only 9% and 12% of the H3K4me1 sites found in ES cells. Similarly, only 8% of the H3K4me2 sites found overlap with 62% (3,127/5,033) of the p300 sites. Therefore, it appears that the repertoire of whole genome p300 sites only represents a subset of enhancers defined by H3K4 methylations. When dissecting which state(s) of H3K4 methylation best correlate with p300 occupancy, we found that the majority of the p300 sites overlap with cell specific H3K4me1&me2 co-modified regions. Out of 5,033 p300 sites, 3,837 (76%) overlap with either me1 or me2 and 2,816 (56%) overlap with regions modified by both H3K4me1&me2. (f) The enrichment of p300 binding sites in active and enhancer loops The # of p300 binding sites found per Mb among different categories of CTCF tethered intrachromosomal interaction loops. The genomic length of each different category of loop is normalized. 25
26 Supplementary Figure 9. DNA loop brings promoter and p300 enhancer into close proximity and affects expression of the corresponding genes. (a) Tmem170 (chr8:114,748, ,793,183) and (b) Crtac1 (chr19:42,298,499-42,553,831). Top panel: the associated genes and CTCF-associated DNA loops. Middle panel: RNAP II 26
27 binding was detected at the promoter and the p300 site in the normal cells. Reduced CTCF levels decreased the binding intensities of RNAP II at the p300 sites and the relative gene expression (right top panel). Bottom panel: the box shows a detailed view of RNAP II binding at p300 in the normal control and CTCF kd cells. 27
 are mostly found outside or between LADs (light blue track). As a comparison, LADs detected by the Dam ID technology are shown.")
28 Supplementary Figure 10. Characterization of Lamin B-binding regions. (a) An example of LADs within Chr1:132,356, ,713,307. DNA loops formed by CTCF (represented by CTCF loop track) are mostly found outside or between LADs (light blue track). As a comparison, LADs detected by the Dam ID technology are shown. Histone profiles were also shown. Overall, the genomic features of LADs determined here in ES cells using sequencing exhibit good agreements with the earlier analysis in human fibroblast cells and mouse ES cells 28
 CTCF signals distribution across the LAD borders. Strong enrichment of CTCF signal is found at the borders of LADs.")
29 using DamID technology; indicating that ChIP-Seq can result in equivalent resolution and should be feasible to apply for genome wide Lamin study in other cells. (b) CTCF signals distribution across the LAD borders. Strong enrichment of CTCF signal is found at the borders of LADs. (c) A Circos map of inter-chromosomal interactions among subcluster of chromosomes and 18. The purple lines indicate the inter-chromosomal interactions and the color intensity is proportion to the cluster size. The orange bars deplict the LADs and the green peaks show the p300 binding sites. (d) Profiles of active histone modification marks, H3K4me1, H3K4m2, and H3K36me3 across LADs and neighboring regions. LADs are depleted of active histone marks. In particular, active chromatin signals, H3K4me1&2 marks, are mildly enriched in the LAD borders and then devoid within LADs; while the active transcription H3K36me3 mark is depleted sharply in the boundaries and the depletion is further extended inside the LADs. We did not observe any significant enrichment of the heterochromatin marks such as H4K20me3 and H3K9me3. 29
30 (e) LADs are enriched with repeats. 48.5% of LADs contain repeat sequences. Among the 53 known repeat families, the L1 repeats are significantly enriched within LADs (Z-score 24, 30% of LADs). The L1 repeat family is one of the largest and most common repeats in the genome. As a comparison, the repeat distribution in overall genome is shown. Repeat sequences enriched in LADs could also be involved in regulating the dynamics of transcription factor binding or gene regulation. 30


31 Supplementary Figure 11. Model of CTCF directed chromatin domains (category I-V), their associated gene activities and sub-nuclear chromatin localizations. 31
32 Supplementary Tables 32
33 33
34 34
35 35
36 36
37 37
38 38
39 39
40 40
41 41
42 42
7SK ChIRP-seq is specifically RNA dependent and conserved between mice and humans.
 Supplementary Figure 1 7SK ChIRP-seq is specifically RNA dependent and conserved between mice and humans. Regions targeted by the Even and Odd ChIRP probes mapped to a secondary structure model 56 of the
Nature Structural & Molecular Biology: doi: /nsmb.2419
 Supplementary Figure 1 Mapped sequence reads and nucleosome occupancies. (a) Distribution of sequencing reads on the mouse reference genome for chromosome 14 as an example. The number of reads in a 1 Mb
Supplementary Figure S1. Gene expression analysis of epidermal marker genes and TP63.
 Supplementary Figure Legends Supplementary Figure S1. Gene expression analysis of epidermal marker genes and TP63. A. Screenshot of the UCSC genome browser from normalized RNAPII and RNA-seq ChIP-seq data
MIR retrotransposon sequences provide insulators to the human genome
 Supplementary Information: MIR retrotransposon sequences provide insulators to the human genome Jianrong Wang, Cristina Vicente-García, Davide Seruggia, Eduardo Moltó, Ana Fernandez- Miñán, Ana Neto, Elbert
Computational Analysis of UHT Sequences Histone modifications, CAGE, RNA-Seq
 Computational Analysis of UHT Sequences Histone modifications, CAGE, RNA-Seq Philipp Bucher Wednesday January 21, 2009 SIB graduate school course EPFL, Lausanne ChIP-seq against histone variants: Biological
Nature Structural & Molecular Biology: doi: /nsmb Supplementary Figure 1
 Supplementary Figure 1 Effect of HSP90 inhibition on expression of endogenous retroviruses. (a) Inducible shrna-mediated Hsp90 silencing in mouse ESCs. Immunoblots of total cell extract expressing the
Supplemental Figure 1. Genes showing ectopic H3K9 dimethylation in this study are DNA hypermethylated in Lister et al. study.
 mc mc mc mc SUP mc mc Supplemental Figure. Genes showing ectopic HK9 dimethylation in this study are DNA hypermethylated in Lister et al. study. Representative views of genes that gain HK9m marks in their
Broad H3K4me3 is associated with increased transcription elongation and enhancer activity at tumor suppressor genes
 Broad H3K4me3 is associated with increased transcription elongation and enhancer activity at tumor suppressor genes Kaifu Chen 1,2,3,4,5,10, Zhong Chen 6,10, Dayong Wu 6, Lili Zhang 7, Xueqiu Lin 1,2,8,
Accessing and Using ENCODE Data Dr. Peggy J. Farnham
 1 William M Keck Professor of Biochemistry Keck School of Medicine University of Southern California How many human genes are encoded in our 3x10 9 bp? C. elegans (worm) 959 cells and 1x10 8 bp 20,000
Supplementary Figures
 Supplementary Figures Supplementary Figure 1. Heatmap of GO terms for differentially expressed genes. The terms were hierarchically clustered using the GO term enrichment beta. Darker red, higher positive
Supplemental Figure S1. Tertiles of FKBP5 promoter methylation and internal regulatory region
 Supplemental Figure S1. Tertiles of FKBP5 promoter methylation and internal regulatory region methylation in relation to PSS and fetal coupling. A, PSS values for participants whose placentas showed low,
Nature Genetics: doi: /ng Supplementary Figure 1. Assessment of sample purity and quality.
 Supplementary Figure 1 Assessment of sample purity and quality. (a) Hematoxylin and eosin staining of formaldehyde-fixed, paraffin-embedded sections from a human testis biopsy collected concurrently with
High Throughput Sequence (HTS) data analysis. Lei Zhou
 data analysis. Lei Zhou") High Throughput Sequence (HTS) data analysis Lei Zhou (leizhou@ufl.edu) High Throughput Sequence (HTS) data analysis 1. Representation of HTS data. 2. Visualization of HTS data. 3. Discovering genomic
High Throughput Sequence (HTS) data analysis Lei Zhou (leizhou@ufl.edu) High Throughput Sequence (HTS) data analysis 1. Representation of HTS data. 2. Visualization of HTS data. 3. Discovering genomic
Supplementary Information. Preferential associations between co-regulated genes reveal a. transcriptional interactome in erythroid cells
 Supplementary Information Preferential associations between co-regulated genes reveal a transcriptional interactome in erythroid cells Stefan Schoenfelder, * Tom Sexton, * Lyubomira Chakalova, * Nathan
The Insulator Binding Protein CTCF Positions 20 Nucleosomes around Its Binding Sites across the Human Genome
 The Insulator Binding Protein CTCF Positions 20 Nucleosomes around Its Binding Sites across the Human Genome Yutao Fu 1, Manisha Sinha 2,3, Craig L. Peterson 3, Zhiping Weng 1,4,5 * 1 Bioinformatics Program,
Raymond Auerbach PhD Candidate, Yale University Gerstein and Snyder Labs August 30, 2012
 Elucidating Transcriptional Regulation at Multiple Scales Using High-Throughput Sequencing, Data Integration, and Computational Methods Raymond Auerbach PhD Candidate, Yale University Gerstein and Snyder
Comparison of open chromatin regions between dentate granule cells and other tissues and neural cell types.
 Supplementary Figure 1 Comparison of open chromatin regions between dentate granule cells and other tissues and neural cell types. (a) Pearson correlation heatmap among open chromatin profiles of different
Heintzman, ND, Stuart, RK, Hon, G, Fu, Y, Ching, CW, Hawkins, RD, Barrera, LO, Van Calcar, S, Qu, C, Ching, KA, Wang, W, Weng, Z, Green, RD,
 Heintzman, ND, Stuart, RK, Hon, G, Fu, Y, Ching, CW, Hawkins, RD, Barrera, LO, Van Calcar, S, Qu, C, Ching, KA, Wang, W, Weng, Z, Green, RD, Crawford, GE, Ren, B (2007) Distinct and predictive chromatin
Nature Genetics: doi: /ng Supplementary Figure 1
 Supplementary Figure 1 Expression deviation of the genes mapped to gene-wise recurrent mutations in the TCGA breast cancer cohort (top) and the TCGA lung cancer cohort (bottom). For each gene (each pair
ChIP-seq analysis. J. van Helden, M. Defrance, C. Herrmann, D. Puthier, N. Servant, M. Thomas-Chollier, O.Sand
 ChIP-seq analysis J. van Helden, M. Defrance, C. Herrmann, D. Puthier, N. Servant, M. Thomas-Chollier, O.Sand Tuesday : quick introduction to ChIP-seq and peak-calling (Presentation + Practical session)
Nature Immunology: doi: /ni Supplementary Figure 1. Characteristics of SEs in T reg and T conv cells.
 Supplementary Figure 1 Characteristics of SEs in T reg and T conv cells. (a) Patterns of indicated transcription factor-binding at SEs and surrounding regions in T reg and T conv cells. Average normalized
Nature Immunology: doi: /ni Supplementary Figure 1. Transcriptional program of the TE and MP CD8 + T cell subsets.
 Supplementary Figure 1 Transcriptional program of the TE and MP CD8 + T cell subsets. (a) Comparison of gene expression of TE and MP CD8 + T cell subsets by microarray. Genes that are 1.5-fold upregulated
Computational aspects of ChIP-seq. John Marioni Research Group Leader European Bioinformatics Institute European Molecular Biology Laboratory
 Computational aspects of ChIP-seq John Marioni Research Group Leader European Bioinformatics Institute European Molecular Biology Laboratory ChIP-seq Using highthroughput sequencing to investigate DNA
Comprehensive nucleosome mapping of the human genome in cancer progression
 /, Vol. 7, No. 12 Comprehensive nucleosome mapping of the human genome in cancer progression Brooke R. Druliner 1,5, Daniel Vera 1,6, Ruth Johnson 2, Xiaoyang Ruan 3, Lynn M. Apone 4, Eileen T. Dimalanta
Peak-calling for ChIP-seq and ATAC-seq
 Peak-calling for ChIP-seq and ATAC-seq Shamith Samarajiwa CRUK Autumn School in Bioinformatics 2017 University of Cambridge Overview Peak-calling: identify enriched (signal) regions in ChIP-seq or ATAC-seq
SUPPLEMENTAL INFORMATION
 SUPPLEMENTAL INFORMATION GO term analysis of differentially methylated SUMIs. GO term analysis of the 458 SUMIs with the largest differential methylation between human and chimp shows that they are more
Supplemental Figure S1. Expression of Cirbp mrna in mouse tissues and NIH3T3 cells.
 SUPPLEMENTAL FIGURE AND TABLE LEGENDS Supplemental Figure S1. Expression of Cirbp mrna in mouse tissues and NIH3T3 cells. A) Cirbp mrna expression levels in various mouse tissues collected around the clock
a) List of KMTs targeted in the shrna screen. The official symbol, KMT designation,
 List of KMTs targeted in the shrna screen. The official symbol, KMT designation,") Supplementary Information Supplementary Figures Supplementary Figure 1. a) List of KMTs targeted in the shrna screen. The official symbol, KMT designation, gene ID and specifities are provided. Those highlighted
Supplementary Information Supplementary Figures Supplementary Figure 1. a) List of KMTs targeted in the shrna screen. The official symbol, KMT designation, gene ID and specifities are provided. Those highlighted
ChIP-seq data analysis
 ChIP-seq data analysis Harri Lähdesmäki Department of Computer Science Aalto University November 24, 2017 Contents Background ChIP-seq protocol ChIP-seq data analysis Transcriptional regulation Transcriptional
Supplementary Figure 1. Using DNA barcode-labeled MHC multimers to generate TCR fingerprints
 Supplementary Figure 1 Using DNA barcode-labeled MHC multimers to generate TCR fingerprints (a) Schematic overview of the workflow behind a TCR fingerprint. Each peptide position of the original peptide
Session 6: Integration of epigenetic data. Peter J Park Department of Biomedical Informatics Harvard Medical School July 18-19, 2016
 Session 6: Integration of epigenetic data Peter J Park Department of Biomedical Informatics Harvard Medical School July 18-19, 2016 Utilizing complimentary datasets Frequent mutations in chromatin regulators
Table S1. Total and mapped reads produced for each ChIP-seq sample
 Tale S1. Total and mapped reads produced for each ChIP-seq sample Sample Total Reads Mapped Reads Col- H3K27me3 rep1 125662 1334323 (85.76%) Col- H3K27me3 rep2 9176437 7986731 (87.4%) atmi1a//c H3K27m3
Patterns of Histone Methylation and Chromatin Organization in Grapevine Leaf. Rachel Schwope EPIGEN May 24-27, 2016
 Patterns of Histone Methylation and Chromatin Organization in Grapevine Leaf Rachel Schwope EPIGEN May 24-27, 2016 What does H3K4 methylation do? Plant of interest: Vitis vinifera Culturally important
Supplemental Information. Genomic Characterization of Murine. Monocytes Reveals C/EBPb Transcription. Factor Dependence of Ly6C Cells
 Immunity, Volume 46 Supplemental Information Genomic Characterization of Murine Monocytes Reveals C/EBPb Transcription Factor Dependence of Ly6C Cells Alexander Mildner, Jörg Schönheit, Amir Giladi, Eyal
Figure S2. Distribution of acgh probes on all ten chromosomes of the RIL M0022
 96 APPENDIX B. Supporting Information for chapter 4 "changes in genome content generated via segregation of non-allelic homologs" Figure S1. Potential de novo CNV probes and sizes of apparently de novo
Yue Wei 1, Rui Chen 2, Carlos E. Bueso-Ramos 3, Hui Yang 1, and Guillermo Garcia-Manero 1
 Genome-wide CHIP-Seq Analysis of Histone Methylation Reveals Modulators of NF- B Signaling And the Histone Demethylase JMJD3 Implicated in Myelodysplastic Syndrome Yue Wei 1, Rui Chen 2, Carlos E. Bueso-Ramos
ChromHMM Tutorial. Jason Ernst Assistant Professor University of California, Los Angeles
 ChromHMM Tutorial Jason Ernst Assistant Professor University of California, Los Angeles Talk Outline Chromatin states analysis and ChromHMM Accessing chromatin state annotations for ENCODE2 and Roadmap
EPIGENOMICS PROFILING SERVICES
 EPIGENOMICS PROFILING SERVICES Chromatin analysis DNA methylation analysis RNA-seq analysis Diagenode helps you uncover the mysteries of epigenetics PAGE 3 Integrative epigenomics analysis DNA methylation
Supplementary. properties of. network types. randomly sampled. subsets (75%
 Supplementary Information Gene co-expression network analysis reveals common system-level prognostic genes across cancer types properties of Supplementary Figure 1 The robustness and overlap of prognostic
Supplementary Figure 1. Efficiency of Mll4 deletion and its effect on T cell populations in the periphery. Nature Immunology: doi: /ni.
 Supplementary Figure 1 Efficiency of Mll4 deletion and its effect on T cell populations in the periphery. Expression of Mll4 floxed alleles (16-19) in naive CD4 + T cells isolated from lymph nodes and
RNA-Seq Preparation Comparision Summary: Lexogen, Standard, NEB
 RNA-Seq Preparation Comparision Summary: Lexogen, Standard, NEB CSF-NGS January 22, 214 Contents 1 Introduction 1 2 Experimental Details 1 3 Results And Discussion 1 3.1 ERCC spike ins............................................
Discovery of Novel Human Gene Regulatory Modules from Gene Co-expression and
 Discovery of Novel Human Gene Regulatory Modules from Gene Co-expression and Promoter Motif Analysis Shisong Ma 1,2*, Michael Snyder 3, and Savithramma P Dinesh-Kumar 2* 1 School of Life Sciences, University
The Epigenome Tools 2: ChIP-Seq and Data Analysis
 The Epigenome Tools 2: ChIP-Seq and Data Analysis Chongzhi Zang zang@virginia.edu http://zanglab.com PHS5705: Public Health Genomics March 20, 2017 1 Outline Epigenome: basics review ChIP-seq overview
Transcript-indexed ATAC-seq for immune profiling
 Transcript-indexed ATAC-seq for immune profiling Technical Journal Club 22 nd of May 2018 Christina Müller Nature Methods, Vol.10 No.12, 2013 Nature Biotechnology, Vol.32 No.7, 2014 Nature Medicine, Vol.24,
Supervised Learner for the Prediction of Hi-C Interaction Counts and Determination of Influential Features. Tyler Yue Lab
 Supervised Learner for the Prediction of Hi-C Interaction Counts and Determination of Influential Features Tyler Derr @ Yue Lab tsd5037@psu.edu Background Hi-C is a chromosome conformation capture (3C)
Nature Genetics: doi: /ng Supplementary Figure 1. Immunofluorescence (IF) confirms absence of H3K9me in met-2 set-25 worms.
 confirms absence of H3K9me in met-2 set-25 worms.") Supplementary Figure 1 Immunofluorescence (IF) confirms absence of H3K9me in met-2 set-25 worms. IF images of wild-type (wt) and met-2 set-25 worms showing the loss of H3K9me2/me3 at the indicated developmental
Supplementary Figure 1 Immunofluorescence (IF) confirms absence of H3K9me in met-2 set-25 worms. IF images of wild-type (wt) and met-2 set-25 worms showing the loss of H3K9me2/me3 at the indicated developmental
Processing, integrating and analysing chromatin immunoprecipitation followed by sequencing (ChIP-seq) data
 data") Processing, integrating and analysing chromatin immunoprecipitation followed by sequencing (ChIP-seq) data Bioinformatics methods, models and applications to disease Alex Essebier ChIP-seq experiment To
Processing, integrating and analysing chromatin immunoprecipitation followed by sequencing (ChIP-seq) data Bioinformatics methods, models and applications to disease Alex Essebier ChIP-seq experiment To
Nature Immunology: doi: /ni Supplementary Figure 1. DNA-methylation machinery is essential for silencing of Cd4 in cytotoxic T cells.
 Supplementary Figure 1 DNA-methylation machinery is essential for silencing of Cd4 in cytotoxic T cells. (a) Scheme for the retroviral shrna screen. (b) Histogram showing CD4 expression (MFI) in WT cytotoxic
Where Splicing Joins Chromatin And Transcription. 9/11/2012 Dario Balestra
 Where Splicing Joins Chromatin And Transcription 9/11/2012 Dario Balestra Splicing process overview Splicing process overview Sequence context RNA secondary structure Tissue-specific Proteins Development
Supplementary Figures
 Supplementary Figures Supplementary Figure 1. Pan-cancer analysis of global and local DNA methylation variation a) Variations in global DNA methylation are shown as measured by averaging the genome-wide
Nature Genetics: doi: /ng Supplementary Figure 1. SEER data for male and female cancer incidence from
 Supplementary Figure 1 SEER data for male and female cancer incidence from 1975 2013. (a,b) Incidence rates of oral cavity and pharynx cancer (a) and leukemia (b) are plotted, grouped by males (blue),
Supplementary note: Comparison of deletion variants identified in this study and four earlier studies
 Supplementary note: Comparison of deletion variants identified in this study and four earlier studies Here we compare the results of this study to potentially overlapping results from four earlier studies
SUPPLEMENTARY INFORMATION
 doi: 1.138/nature8645 Physical coverage (x haploid genomes) 11 6.4 4.9 6.9 6.7 4.4 5.9 9.1 7.6 125 Neither end mapped One end mapped Chimaeras Correct Reads (million ns) 1 75 5 25 HCC1187 HCC1395 HCC1599
Relationship between genomic features and distributions of RS1 and RS3 rearrangements in breast cancer genomes.
 Supplementary Figure 1 Relationship between genomic features and distributions of RS1 and RS3 rearrangements in breast cancer genomes. (a,b) Values of coefficients associated with genomic features, separately
Supplementary Figure 1: Attenuation of association signals after conditioning for the lead SNP. a) attenuation of association signal at the 9p22.
 attenuation of association signal at the 9p22.") Supplementary Figure 1: Attenuation of association signals after conditioning for the lead SNP. a) attenuation of association signal at the 9p22.32 PCOS locus after conditioning for the lead SNP rs10993397;
Supplementary Figure 1: Attenuation of association signals after conditioning for the lead SNP. a) attenuation of association signal at the 9p22.32 PCOS locus after conditioning for the lead SNP rs10993397;
Not IN Our Genes - A Different Kind of Inheritance.! Christopher Phiel, Ph.D. University of Colorado Denver Mini-STEM School February 4, 2014
 Not IN Our Genes - A Different Kind of Inheritance! Christopher Phiel, Ph.D. University of Colorado Denver Mini-STEM School February 4, 2014 Epigenetics in Mainstream Media Epigenetics *Current definition:
PDF hosted at the Radboud Repository of the Radboud University Nijmegen
 PDF hosted at the Radboud Repository of the Radboud University Nijmegen The following full text is a publisher's version. For additional information about this publication click this link. http://hdl.handle.net/2066/156973
Breast cancer. Risk factors you cannot change include: Treatment Plan Selection. Inferring Transcriptional Module from Breast Cancer Profile Data
 Breast cancer Inferring Transcriptional Module from Breast Cancer Profile Data Breast Cancer and Targeted Therapy Microarray Profile Data Inferring Transcriptional Module Methods CSC 177 Data Warehousing
Supplementary Figure 1. Schematic diagram of o2n-seq. Double-stranded DNA was sheared, end-repaired, and underwent A-tailing by standard protocols.
 Supplementary Figure 1. Schematic diagram of o2n-seq. Double-stranded DNA was sheared, end-repaired, and underwent A-tailing by standard protocols. A-tailed DNA was ligated to T-tailed dutp adapters, circularized
SUPPLEMENTARY INFORMATION
 doi:.38/nature8975 SUPPLEMENTAL TEXT Unique association of HOTAIR with patient outcome To determine whether the expression of other HOX lincrnas in addition to HOTAIR can predict patient outcome, we measured
Supplementary Materials for
 www.sciencesignaling.org/cgi/content/full/8/375/ra41/dc1 Supplementary Materials for Actin cytoskeletal remodeling with protrusion formation is essential for heart regeneration in Hippo-deficient mice
Nature Neuroscience: doi: /nn Supplementary Figure 1. Behavioral training.
 Supplementary Figure 1 Behavioral training. a, Mazes used for behavioral training. Asterisks indicate reward location. Only some example mazes are shown (for example, right choice and not left choice maze
DNA-seq Bioinformatics Analysis: Copy Number Variation
 DNA-seq Bioinformatics Analysis: Copy Number Variation Elodie Girard elodie.girard@curie.fr U900 institut Curie, INSERM, Mines ParisTech, PSL Research University Paris, France NGS Applications 5C HiC DNA-seq
Main Study: Summer Methods. Design
 Main Study: Summer 2000 Methods Design The experimental design is within-subject each participant experiences five different trials for each of the ten levels of Display Condition and for each of the three
Eukaryotic transcription (III)
") Eukaryotic transcription (III) 1. Chromosome and chromatin structure Chromatin, chromatid, and chromosome chromatin Genomes exist as chromatins before or after cell division (interphase) but as chromatids
Eukaryotic transcription (III) 1. Chromosome and chromatin structure Chromatin, chromatid, and chromosome chromatin Genomes exist as chromatins before or after cell division (interphase) but as chromatids
Genome-Wide Localization of Protein-DNA Binding and Histone Modification by a Bayesian Change-Point Method with ChIP-seq Data
 Genome-Wide Localization of Protein-DNA Binding and Histone Modification by a Bayesian Change-Point Method with ChIP-seq Data Haipeng Xing, Yifan Mo, Will Liao, Michael Q. Zhang Clayton Davis and Geoffrey
Genomic structural variation
 Genomic structural variation Mario Cáceres The new genomic variation DNA sequence differs across individuals much more than researchers had suspected through structural changes A huge amount of structural
Lung Met 1 Lung Met 2 Lung Met Lung Met H3K4me1. Lung Met H3K27ac Primary H3K4me1
 a Gained Met-VELs 1.5 1.5 -.5 Lung Met 1 Lung Met Lung Met 3 1. Lung Met H3K4me1 Lung Met H3K4me1 1 Lung Met H3K4me1 Lung Met H3K7ac 1.5 Lung Met H3K7ac Lung Met H3K7ac.8 Primary H3K4me1 Primary H3K7ac
Nature Methods: doi: /nmeth.3115
 Supplementary Figure 1 Analysis of DNA methylation in a cancer cohort based on Infinium 450K data. RnBeads was used to rediscover a clinically distinct subgroup of glioblastoma patients characterized by
Nature Structural & Molecular Biology: doi: /nsmb Supplementary Figure 1
 Supplementary Figure 1 U1 inhibition causes a shift of RNA-seq reads from exons to introns. (a) Evidence for the high purity of 4-shU-labeled RNAs used for RNA-seq. HeLa cells transfected with control
H3K4 demethylase KDM5B regulates global dynamics of transcription elongation and alternative splicing in embryonic stem cells
 Nucleic Acids Research, 2017 1 doi: 10.1093/nar/gkx251 H3K4 demethylase KDM5B regulates global dynamics of transcription elongation and alternative splicing in embryonic stem cells Runsheng He 1,2 and
Theta sequences are essential for internally generated hippocampal firing fields.
 Theta sequences are essential for internally generated hippocampal firing fields. Yingxue Wang, Sandro Romani, Brian Lustig, Anthony Leonardo, Eva Pastalkova Supplementary Materials Supplementary Modeling
A Practical Guide to Integrative Genomics by RNA-seq and ChIP-seq Analysis
 A Practical Guide to Integrative Genomics by RNA-seq and ChIP-seq Analysis Jian Xu, Ph.D. Children s Research Institute, UTSW Introduction Outline Overview of genomic and next-gen sequencing technologies
Chromatin marks identify critical cell-types for fine-mapping complex trait variants
 Chromatin marks identify critical cell-types for fine-mapping complex trait variants Gosia Trynka 1-4 *, Cynthia Sandor 1-4 *, Buhm Han 1-4, Han Xu 5, Barbara E Stranger 1,4#, X Shirley Liu 5, and Soumya
Supplementary Figures
 Supplementary Figures Supplementary Figure 1. Confirmation of Dnmt1 conditional knockout out mice. a, Representative images of sorted stem (Lin - CD49f high CD24 + ), luminal (Lin - CD49f low CD24 + )
SUPPLEMENTARY FIGURE 1: f-i
 SUPPLEMENTARY FIGURE 1: Comparisons of the biological replicates of ChIP-seq, Input and Bisulfite-seq. (a) Density plot of MeCP2 ChIP-seq genome coverage (calculated using tiled 15 bp windows) shows high
ChipSeq. Technique and science. The genome wide dynamics of the binding of ldb1 complexes during erythroid differentiation
 Center for Biomics ChipSeq Technique and science The genome wide dynamics of the binding of ldb1 complexes during erythroid differentiation Wilfred van IJcken Sequencing Seminar Illumina September 8 Scheme
Nature Biotechnology: doi: /nbt.1904
 Supplementary Information Comparison between assembly-based SV calls and array CGH results Genome-wide array assessment of copy number changes, such as array comparative genomic hybridization (acgh), is
Nature Biotechnology: doi: /nbt Supplementary Figure 1. Binding capacity of DNA-barcoded MHC multimers and recovery of antigen specificity
 Supplementary Figure 1 Binding capacity of DNA-barcoded MHC multimers and recovery of antigen specificity (a, b) Fluorescent-based determination of the binding capacity of DNA-barcoded MHC multimers (+barcode)
SUPPLEMENTARY INFORMATION
 doi:10.1038/nature10866 a b 1 2 3 4 5 6 7 Match No Match 1 2 3 4 5 6 7 Turcan et al. Supplementary Fig.1 Concepts mapping H3K27 targets in EF CBX8 targets in EF H3K27 targets in ES SUZ12 targets in ES
Sirt1 Hmg20b Gm (0.17) 24 (17.3) 877 (857)
 24 (17.3) 877 (857)") 3 (0.17) 24 (17.3) Sirt1 Hmg20 Gm4763 877 (857) c d Suppl. Figure 1. Screen validation for top candidate antagonists of Dot1L (a) Numer of genes with one (gray), two (cyan) or three (red) shrna scored
3 (0.17) 24 (17.3) Sirt1 Hmg20 Gm4763 877 (857) c d Suppl. Figure 1. Screen validation for top candidate antagonists of Dot1L (a) Numer of genes with one (gray), two (cyan) or three (red) shrna scored
Structural Variation and Medical Genomics
 Structural Variation and Medical Genomics Andrew King Department of Biomedical Informatics July 8, 2014 You already know about small scale genetic mutations Single nucleotide polymorphism (SNPs) Deletions,
Expanded View Figures
 Solip Park & Ben Lehner Epistasis is cancer type specific Molecular Systems Biology Expanded View Figures A B G C D E F H Figure EV1. Epistatic interactions detected in a pan-cancer analysis and saturation
Table S1. Relative abundance of AGO1/4 proteins in different organs. Table S2. Summary of smrna datasets from various samples.
 Supplementary files Table S1. Relative abundance of AGO1/4 proteins in different organs. Table S2. Summary of smrna datasets from various samples. Table S3. Specificity of AGO1- and AGO4-preferred 24-nt
Sudin Bhattacharya Institute for Integrative Toxicology
 Beyond the AHRE: the Role of Epigenomics in Gene Regulation by the AHR (or, Varied Applications of Computational Modeling in Toxicology and Ingredient Safety) Sudin Bhattacharya Institute for Integrative
An Unexpected Function of the Prader-Willi Syndrome Imprinting Center in Maternal Imprinting in Mice
 An Unexpected Function of the Prader-Willi Syndrome Imprinting Center in Maternal Imprinting in Mice Mei-Yi Wu 1 *, Ming Jiang 1, Xiaodong Zhai 2, Arthur L. Beaudet 2, Ray-Chang Wu 1 * 1 Department of
Supplementary Figure 1 IL-27 IL
 Tim-3 Supplementary Figure 1 Tc0 49.5 0.6 Tc1 63.5 0.84 Un 49.8 0.16 35.5 0.16 10 4 61.2 5.53 10 3 64.5 5.66 10 2 10 1 10 0 31 2.22 10 0 10 1 10 2 10 3 10 4 IL-10 28.2 1.69 IL-27 Supplementary Figure 1.
Mechanisms of alternative splicing regulation
 Mechanisms of alternative splicing regulation The number of mechanisms that are known to be involved in splicing regulation approximates the number of splicing decisions that have been analyzed in detail.
Chromosome-Wide Analysis of Parental Allele-Specific Chromatin and DNA Methylation
 MOLECULAR AND CELLULAR BIOLOGY, Apr. 2011, p. 1757 1770 Vol. 31, No. 8 0270-7306/11/$12.00 doi:10.1128/mcb.00961-10 Copyright 2011, American Society for Microbiology. All Rights Reserved. Chromosome-Wide
Analysis of the peroxisome proliferator-activated receptor-β/δ (PPARβ/δ) cistrome reveals novel co-regulatory role of ATF4
 cistrome reveals novel co-regulatory role of ATF4") Khozoie et al. BMC Genomics 2012, 13:665 RESEARCH ARTICLE Open Access Analysis of the peroxisome proliferator-activated receptor-β/δ (PPARβ/δ) cistrome reveals novel co-regulatory role of ATF4 Combiz Khozoie
Khozoie et al. BMC Genomics 2012, 13:665 RESEARCH ARTICLE Open Access Analysis of the peroxisome proliferator-activated receptor-β/δ (PPARβ/δ) cistrome reveals novel co-regulatory role of ATF4 Combiz Khozoie
Genome-wide Association Studies (GWAS) Pasieka, Science Photo Library
 Pasieka, Science Photo Library") Lecture 5 Genome-wide Association Studies (GWAS) Pasieka, Science Photo Library Chi-squared test to evaluate whether the odds ratio is different from 1. Corrected for multiple testing Source: wikipedia.org
Lecture 5 Genome-wide Association Studies (GWAS) Pasieka, Science Photo Library Chi-squared test to evaluate whether the odds ratio is different from 1. Corrected for multiple testing Source: wikipedia.org
Supplemental Data. Integrating omics and alternative splicing i reveals insights i into grape response to high temperature
 Supplemental Data Integrating omics and alternative splicing i reveals insights i into grape response to high temperature Jianfu Jiang 1, Xinna Liu 1, Guotian Liu, Chonghuih Liu*, Shaohuah Li*, and Lijun
SUPPLEMENTARY APPENDIX
 SUPPLEMENTARY APPENDIX 1) Supplemental Figure 1. Histopathologic Characteristics of the Tumors in the Discovery Cohort 2) Supplemental Figure 2. Incorporation of Normal Epidermal Melanocytic Signature
MRC-Holland MLPA. Description version 08; 30 March 2015
 SALSA MLPA probemix P351-C1 / P352-D1 PKD1-PKD2 P351-C1 lot C1-0914: as compared to the previous version B2 lot B2-0511 one target probe has been removed and three reference probes have been replaced.
Allelic reprogramming of the histone modification H3K4me3 in early mammalian development
 Allelic reprogramming of the histone modification H3K4me3 in early mammalian development 张戈 Method and material STAR ChIP seq (small-scale TELP-assisted rapid ChIP seq) 200 mouse embryonic stem cells PWK/PhJ
Supplemental Figure 1. Small RNA size distribution from different soybean tissues.
 Supplemental Figure 1. Small RNA size distribution from different soybean tissues. The size of small RNAs was plotted versus frequency (percentage) among total sequences (A, C, E and G) or distinct sequences
Alpha thalassemia mental retardation X-linked. Acquired alpha-thalassemia myelodysplastic syndrome
 Alpha thalassemia mental retardation X-linked Acquired alpha-thalassemia myelodysplastic syndrome (Alpha thalassemia mental retardation X-linked) Acquired alpha-thalassemia myelodysplastic syndrome Schematic
An epigenetic approach to understanding (and predicting?) environmental effects on gene expression
 environmental effects on gene expression") www.collaslab.com An epigenetic approach to understanding (and predicting?) environmental effects on gene expression Philippe Collas University of Oslo Institute of Basic Medical Sciences Stem Cell Epigenetics
www.collaslab.com An epigenetic approach to understanding (and predicting?) environmental effects on gene expression Philippe Collas University of Oslo Institute of Basic Medical Sciences Stem Cell Epigenetics
Supplementary Figure 1
 Supplementary Figure 1 Supplementary Fig. 1: Quality assessment of formalin-fixed paraffin-embedded (FFPE)-derived DNA and nuclei. (a) Multiplex PCR analysis of unrepaired and repaired bulk FFPE gdna from
Figure S1, Beyer et al.
 Figure S1, eyer et al. Pax7 Myogenin si sitrl Hoechst T = 72h 14 1.8.6.4.2 12 1 8 6 4 2 24h 48h 96h diff. sitrl siset1 212 72h diff. b1 td r t Se km MyH Vinculin Myogenin β-ctin Vinculin MW b1 ka td r