Supplemental Table 1: Demographics and characteristics of study participants. Male, n (%) 3 (20%) 6 (50%) Age, years [mean ± SD] 33.3 ± ± 9.
|
|
|
- Alan Thornton
- 5 years ago
- Views:
Transcription
1 SUPPLEMENTAL DATA Supplemental Table 1: Demographics and characteristics of study participants Lean (n=15) Obese (n=12) Male, n (%) 3 (20%) 6 (50%) Age, years [mean ± SD] 33.3 ± ± 9.1 White, n (%) 13 (87%) 9 (75%) BMI, kg/m² [mean ± SD] 21.7 ± ± 4.8 Supplemental Table 2: Adipose tissue in lean (n=4) and obese (n=4) mice as quantified by micro- CT imaging Adipose Tissue, mm² Lean Mice (ND-fed) Obese Mice (60% HFD-fed) P-Value Thigh IMAT/PMAT 2.14 ( ) ( ) Calf IMAT/PMAT 0.18 ( ) 8.29 ( ) Total IMAT/PMAT 2.3 ( ) 56.4 ( ) VAT 45.3 ( ) ( ) SAT 13.8 ( ) ( ) IMAT/PMAT: intermuscular adipose tissue/perimuscular adipose tissue; VAT: abdominal visceral adipose tissue; SAT: abdominal subcutaneous adipose tissue. Values are reported as median (interquartile range). P-values were computed using the nonparametric Kruskal Wallis test (SAS 9.3). All tests were 2-sided.
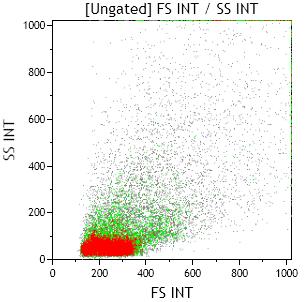
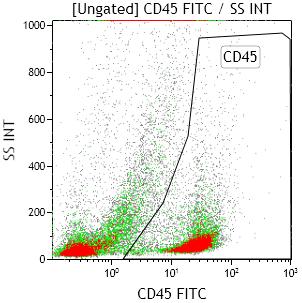
2 Supplemental Figure Legends Supplemental Figure 1: Quantitative RT-PCR analysis of inflammatory gene expression in SM. The entire quadriceps SM (including muscle fibers, IMAT, and PMAT) harvested from mice fed normal diet (ND; n=6 8 mice/group) or high-fat diet (HFD; n=8 10 mice/group) for 12 weeks were analyzed by quantitative RT-PCR. *P<0.05, **P<0.01, P<0.001 compared with ND group. Supplemental Figure 2: Flow cytometric analysis of macrophages and T cells in SM. (A) Gating example of F4/80+ macrophages and F4/80+CD11c+ M1 macrophages. (B) Example of gating total CD3+, CD4+, and CD8+ T cells in SM of ND-fed mice. Supplemental Figure 3: Immunohistochemical staining of sections of quadriceps isolated from ND-fed mice under 10x magnification Supplemental Figure 4: Representative images of extramyocellular adipose tissue in mouse fed lower-fat diet. Cross-sectional micro-ct images of the proximal, mid, and distal thigh and midcalf for a mouse fed lower-fat diet (panels A D) with corresponding adipose tissue superimposed in red (panels E H). Supplemental Figure 5: Representative images of extramyocellular adipose tissue in 60% HFD-fed mouse. Cross-sectional micro-ct images of the proximal, mid, and distal thigh and
3 midcalf for a mouse fed 60% HFD (panels A D) with corresponding adipose tissue superimposed in red (panels E H). Supplemental Figure 6: Representative images of visceral adipose tissue in lean and obese mice. Cross-sectional micro-ct images of the abdomen and adipose tissue for a mouse fed lower-fat diet (panels A and B) and a mouse fed 60% HFD (panels C and D). VAT is shown in red, and SAT is shown in yellow. Supplemental Figure 7: Obesity-induced SM and systemic insulin resistance. (A) Homeostasis model assessment of insulin resistance (HOMA-IR) in lean and 60% HFD fed WT mice (n=4 mice/group). (B) Representative immunoblot and quantification of serinephosphorylated Akt [P-Akt (S473)] protein expression in SM of mice fed ND or 60% HFD and injected with 1.5 U/kg body weight regular human insulin or PBS 10 minutes prior to sacrifice. The levels of P-Akt (S473) were expressed as P-Akt/Akt ratio. Insulin-stimulated P-Akt/Akt ratio was compared between lean and obese groups. *P<0.05, P<0.001 compared with lean controls. Supplemental Figure 8: The effect of T H 1 cells on myotube inflammation and metabolic functions and the involvement of the JAK/STAT pathway. (A) Representative immunoblot and quantification of total STAT1 protein and tyrosine 701 phosphorylated STAT1 (P-STAT1) protein in SM of mice fed ND or HFD for 12 weeks. (B) Quantitative RT-PCR analysis of proinflammatory cytokine and chemokine expression in differentiated C2C12 myotubes treated with T H 1 supernatant with or without antibody neutralization of IFNγ and T H 1 supernatant in the
4 presence of JAK inhibitor I for 48 hours (n=6 10 samples/group). (C) mrna level (n=4 6 samples/group) and the amount of P-STAT1 protein (n=5 samples/group) in C2C12 cells treated with T H 1-conditioned medium with or without antibody neutralization of IFNγ. (D) P-Akt (S473)/Akt protein levels in differentiated C2C12 cells treated with T H 1 for 48 hours and exposed to 100 nm insulin for 15 minutes (n=4 5 samples/group). Results are shown as mean SEM of 2 separate experiments, each with 2 3 samples/group. *P<0.05, **P<0.01, P<0.001 for comparison between control and each treatment group.
5 Supplemental Figure 1 T cell and macrophage marker expression in SM of lean and obese mice 40 ND 30 ** ** HFD 20 * ** Relative mrna ** * ** * ** 3 * 2 * 1 0 F4/80 CD11c MCP1 IL-12b IL-18 T N F α C D 3 C D 8 C D 4 R A N T E S IF N g
6 Supplemental Figure 2 A B
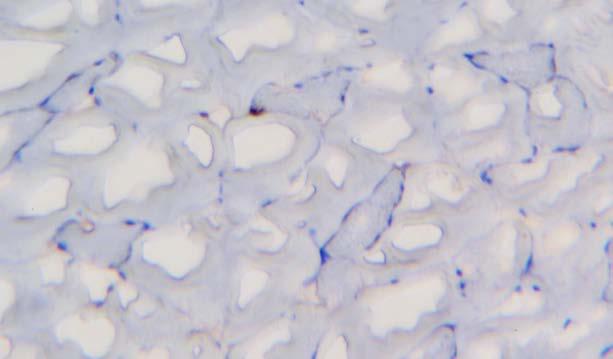
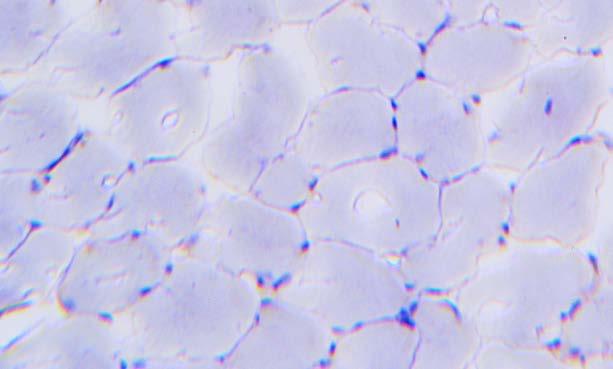
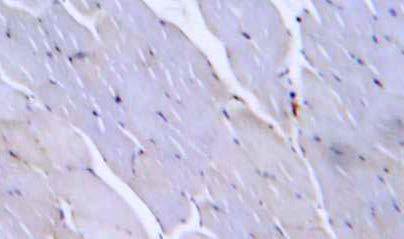
7 Supplemental Figure 3 Isotype control Mac3 macrophages CD3 T cells
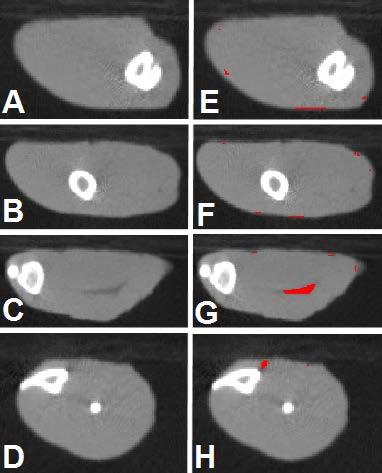
8 Supplemental Figure 4
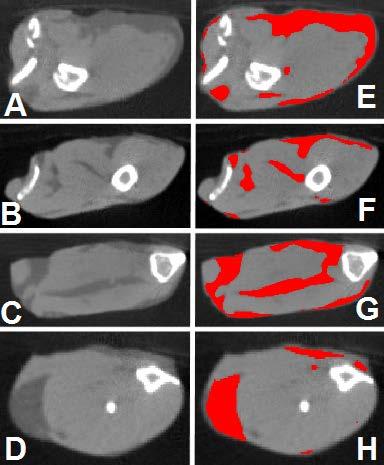
9 Supplemental Figure 5
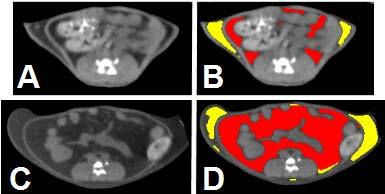
10 Supplemental Figure 6
11 Supplemental Figure 7 A B HOMA-IR * Insulin Lean Obese P-Akt Akt 0 Lean Obese P-Akt (S473)/Akt Insulin Lean Obese
12 Supplemental Figure 8 A ND HFD P-Stat1 Stat1 Tubulin 2.0 STAT1 ns 2.0 P-STAT1 * STAT1/Tubulin P-STAT1/STAT N D H F 0.0 N D H F D
13 Supplemental Figure 8 B Relative mrna IL-6 Relative mrna ** TNFα ns ns 0 Control T H 1 T H 1+Anti-IFNγ T H 1+Jak inh. 0.0 Control T H 1 T H 1+Anti-IFNγ T H 1+Jak inh. Relative mrna MCP-1 Relative mrna RANTES 0 Control T H 1 T H 1+Anti-IFNγ T H 1+Jak inh. 0 Control T H 1 T H 1+Anti-IFNγ T H 1+Jak inh.
14 Supplemental Figure 8 C Control TH1 TH1+Anti-IFNg P-STAT1 (Y701) β-actin Relative mrna STAT1 P-STAT1/β-actin P-STAT1 ** ** 0 Control T H 1 T H 1+Anti-IFNγ 0.0 Control T H 1 T H 1+Anti-IFNγ
15 Supplemental Figure 8 D Control Naive CD4 TH1 TH1+Jak P-Akt Insulin inhibitor ** P-STAT1 (Y701) P-Akt (S473) P-Akt/Akt Akt 0.0 Control Naive CD4 T H 1 T H 1+Jak inh.
General Laboratory methods Plasma analysis: Gene Expression Analysis: Immunoblot analysis: Immunohistochemistry:
 General Laboratory methods Plasma analysis: Plasma insulin (Mercodia, Sweden), leptin (duoset, R&D Systems Europe, Abingdon, United Kingdom), IL-6, TNFα and adiponectin levels (Quantikine kits, R&D Systems
Supplementary Figures
 Supplementary Figures mir-150 regulates obesityassociated insulin resistance by controlling B cell functions Wei Ying, Alexander Tseng, Richard Cheng-An Chang, Haiqing Wang, Yu-lieh Lin, Srikanth Kanameni,
well for 2 h at rt. Each dot represents an individual mouse and bar is the mean ±
 Supplementary data: Control DC Blimp-1 ko DC 8 6 4 2-2 IL-1β p=.5 medium 8 6 4 2 IL-2 Medium p=.16 8 6 4 2 IL-6 medium p=.3 5 4 3 2 1-1 medium IL-1 n.s. 25 2 15 1 5 IL-12(p7) p=.15 5 IFNγ p=.65 4 3 2 1
Supplementary Figure 1. mrna expression of chitinase and chitinase-like protein in splenic immune cells. Each splenic immune cell population was
 Supplementary Figure 1. mrna expression of chitinase and chitinase-like protein in splenic immune cells. Each splenic immune cell population was sorted by FACS. Surface markers for sorting were CD11c +
Supplementary Figure 1. DJ-1 modulates ROS concentration in mouse skeletal muscle.
 Supplementary Figure 1. DJ-1 modulates ROS concentration in mouse skeletal muscle. (a) mrna levels of Dj1 measured by quantitative RT-PCR in soleus, gastrocnemius (Gastroc.) and extensor digitorum longus
Supplemental Information. Increased 4E-BP1 Expression Protects. against Diet-Induced Obesity and Insulin. Resistance in Male Mice
 Cell Reports, Volume 16 Supplemental Information Increased 4E-BP1 Expression Protects against Diet-Induced Obesity and Insulin Resistance in Male Mice Shih-Yin Tsai, Ariana A. Rodriguez, Somasish G. Dastidar,
Supplementary Figure 1: TSLP receptor skin expression in dcssc. A: Healthy control (HC) skin with TSLP receptor expression in brown (10x
 skin with TSLP receptor expression in brown (10x") Supplementary Figure 1: TSLP receptor skin expression in dcssc. A: Healthy control (HC) skin with TSLP receptor expression in brown (10x magnification). B: Second HC skin stained for TSLP receptor in brown
Supplementary Figure 1: TSLP receptor skin expression in dcssc. A: Healthy control (HC) skin with TSLP receptor expression in brown (10x magnification). B: Second HC skin stained for TSLP receptor in brown
Inflammasome-mediated caspase-1 activity Gatekeeper of inflammation in the adipose tissue. Rinke Stienstra
 Inflammasome-mediated caspase-1 activity Gatekeeper of inflammation in the adipose tissue Rinke Stienstra Obesity promotes the development of insulin resistance and type 2 diabetes County-level Estimates
Metabolic ER stress and inflammation in white adipose tissue (WAT) of mice with dietary obesity.
 of mice with dietary obesity.") Supplementary Figure 1 Metabolic ER stress and inflammation in white adipose tissue (WAT) of mice with dietary obesity. Male C57BL/6J mice were fed a normal chow (NC, 10% fat) or a high-fat diet (HFD,
Supplementary Figure 1 Metabolic ER stress and inflammation in white adipose tissue (WAT) of mice with dietary obesity. Male C57BL/6J mice were fed a normal chow (NC, 10% fat) or a high-fat diet (HFD,
A Central Role of MG53 in Metabolic Syndrome. and Type-2 Diabetes
 A Central Role of MG53 in Metabolic Syndrome and Type-2 Diabetes Yan Zhang, Chunmei Cao, Rui-Ping Xiao Institute of Molecular Medicine (IMM) Peking University, Beijing, China Accelerated Aging in China
FH- FH+ DM. 52 Volunteers. Oral & IV Glucose Tolerance Test Hyperinsulinemic Euglycemic Clamp in Non-DM Subjects ACADSB MYSM1. Mouse Skeletal Muscle
 A 52 Volunteers B 6 5 4 3 2 FH- FH+ DM 1 Oral & IV Glucose Tolerance Test Hyperinsulinemic Euglycemic Clamp in Non-DM Subjects ZYX EGR2 NR4A1 SRF target TPM1 ACADSB MYSM1 Non SRF target FH- FH+ DM2 C SRF
Supplementary Figure 1. Characterization of basophils after reconstitution of SCID mice
 Supplementary figure legends Supplementary Figure 1. Characterization of after reconstitution of SCID mice with CD4 + CD62L + T cells. (A-C) SCID mice (n = 6 / group) were reconstituted with 2 x 1 6 CD4
ZL ZDF ZDF + E2 *** Visceral (g) ZDF
 ZDF") Body Weight (g) 4 3 2 1 ** * ZL ZDF 6 8 1 12 14 16 Age (weeks) B * Sub-cutaneous (g) 16 12 8 4 ZL ZDF Visceral (g) 25 2 15 1 5 ZL ZDF Total fat pad weight (g) 4 3 2 1 ZDF ZL Supplemental Figure 1: Effect
Body Weight (g) 4 3 2 1 ** * ZL ZDF 6 8 1 12 14 16 Age (weeks) B * Sub-cutaneous (g) 16 12 8 4 ZL ZDF Visceral (g) 25 2 15 1 5 ZL ZDF Total fat pad weight (g) 4 3 2 1 ZDF ZL Supplemental Figure 1: Effect
Stewart et al. CD36 ligands promote sterile inflammation through assembly of a TLR 4 and 6 heterodimer
 NFκB (fold induction) Stewart et al. ligands promote sterile inflammation through assembly of a TLR 4 and 6 heterodimer a. mrna (fold induction) 5 4 3 2 1 LDL oxldl Gro1a MIP-2 RANTES mrna (fold induction)
Supplementary Figure 1
 Supplementary Figure 1 a Percent of body weight! (%) 4! 3! 1! Epididymal fat Subcutaneous fat Liver SD Percent of body weight! (%) ** 3! 1! SD Percent of body weight! (%) 6! 4! SD ** b Blood glucose (mg/dl)!
Supplementary Figure 1: STAT3 suppresses Kras-induced lung tumorigenesis
 Supplementary Figure 1: STAT3 suppresses Kras-induced lung tumorigenesis (a) Immunohistochemical (IHC) analysis of tyrosine 705 phosphorylation status of STAT3 (P- STAT3) in tumors and stroma (all-time
STAT4 Deficiency Reduces Obesity-Induced Insulin Resistance and Adipose Tissue Inflammation
 ORIGINAL ARTICLE STAT4 Deficiency Reduces Obesity-Induced Insulin Resistance and Adipose Tissue Inflammation Anca D. Dobrian, 1 Elena V. Galkina, 2 Qian Ma, 1 Margaret Hatcher, 1 Sabai Myo Aye, 1 Mathew
Supplementary Information. Protectin DX alleviates insulin resistance by activating a myokine-liver glucoregulatory axis.
 Supplementary Information Protectin DX alleviates insulin resistance by activating a myokine-liver glucoregulatory axis. Phillip J. White, Philippe St-Pierre, Alexandre Charbonneau, Patricia Mitchell,
SUPPLEMENTARY INFORMATION
 doi:10.1038/nature12652 Supplementary Figure 1. PRDM16 interacts with endogenous EHMT1 in brown adipocytes. Immunoprecipitation of PRDM16 complex by flag antibody (M2) followed by Western blot analysis
Supplementary Figure 1. DNA methylation of the adiponectin promoter R1, Pparg2, and Tnfa promoter in adipocytes is not affected by obesity.
 Supplementary Figure 1. DNA methylation of the adiponectin promoter R1, Pparg2, and Tnfa promoter in adipocytes is not affected by obesity. (a) Relative amounts of adiponectin, Ppar 2, C/ebp, and Tnf mrna
Supplementary Figure 1 Chemokine and chemokine receptor expression during muscle regeneration (a) Analysis of CR3CR1 mrna expression by real time-pcr
 Analysis of CR3CR1 mrna expression by real time-pcr") Supplementary Figure 1 Chemokine and chemokine receptor expression during muscle regeneration (a) Analysis of CR3CR1 mrna expression by real time-pcr at day 0, 1, 4, 10 and 21 post- muscle injury. (b)
Supplementary Figure 1 Chemokine and chemokine receptor expression during muscle regeneration (a) Analysis of CR3CR1 mrna expression by real time-pcr at day 0, 1, 4, 10 and 21 post- muscle injury. (b)
Nature Medicine doi: /nm.3957
 Supplementary Fig. 1. p38 alternative activation, IL-21 expression, and T helper cell transcription factors in PDAC tissue. (a) Tissue microarrays of pancreatic tissue from 192 patients with pancreatic
Supplementary Figures
 Supplementary Figures Supplementary Figure 1 Increased ABHD5 expression in human colon cancer associated macrophages. (a) Murine peritoneal macrophages were treated with regular culture medium (Ctrl) or
Intracellular MHC class II molecules promote TLR-triggered innate. immune responses by maintaining Btk activation
 Intracellular MHC class II molecules promote TLR-triggered innate immune responses by maintaining Btk activation Xingguang Liu, Zhenzhen Zhan, Dong Li, Li Xu, Feng Ma, Peng Zhang, Hangping Yao and Xuetao
Figure S1. Reduction in glomerular mir-146a levels correlate with progression to higher albuminuria in diabetic patients.
 Supplementary Materials Supplementary Figures Figure S1. Reduction in glomerular mir-146a levels correlate with progression to higher albuminuria in diabetic patients. Figure S2. Expression level of podocyte
SUPPLEMENTARY MATERIAL
 SUPPLEMENTARY MATERIAL IL-1 signaling modulates activation of STAT transcription factors to antagonize retinoic acid signaling and control the T H 17 cell it reg cell balance Rajatava Basu 1,5, Sarah K.
pplementary Figur Supplementary Figure 1. a.
 pplementary Figur Supplementary Figure 1. a. Quantification by RT-qPCR of YFV-17D and YFV-17D pol- (+) RNA in the supernatant of cultured Huh7.5 cells following viral RNA electroporation of respective
NK cells link obesity-induced adipose stress to inflammation and insulin resistance
 NK cells link obesity-induced adipose stress to inflammation and insulin resistance Felix M Wensveen 1, Vedrana Jelenčić 1,, Sonja Valentić 1,, Marko Šestan 1,, Tamara Turk Wensveen, Sebastian Theurich
Supplementary Figure 1. Antibiotic partially rescues mice from sepsis. (ab) BALB/c mice under CLP were treated with antibiotic or PBS.
 BALB/c mice under CLP were treated with antibiotic or PBS.") 1 Supplementary Figure 1. Antibiotic partially rescues mice from sepsis. (ab) BALB/c mice under CLP were treated with antibiotic or PBS. (a) Survival curves. WT Sham (n=5), WT CLP or WT CLP antibiotic
1 Supplementary Figure 1. Antibiotic partially rescues mice from sepsis. (ab) BALB/c mice under CLP were treated with antibiotic or PBS. (a) Survival curves. WT Sham (n=5), WT CLP or WT CLP antibiotic
Plasma exposure levels from individual mice 4 hours post IP administration at the
 Supplemental Figure Legends Figure S1. Plasma exposure levels of MKC-3946 in mice. Plasma exposure levels from individual mice 4 hours post IP administration at the indicated dose mg/kg. Data represent
W/T Itgam -/- F4/80 CD115. F4/80 hi CD115 + F4/80 + CD115 +
 F4/8 % in the peritoneal lavage 6 4 2 p=.15 n.s p=.76 CD115 F4/8 hi CD115 + F4/8 + CD115 + F4/8 hi CD115 + F4/8 + CD115 + MHCII MHCII Supplementary Figure S1. CD11b deficiency affects the cellular responses
Crucial role for human Toll-like receptor 4 in the development of contact allergy to nickel
 Supplementary Figures 1-8 Crucial role for human Toll-like receptor 4 in the development of contact allergy to nickel Marc Schmidt 1,2, Badrinarayanan Raghavan 1,2, Verena Müller 1,2, Thomas Vogl 3, György
Supplementary Information
 Supplementary Information TABLE S1. SUBJECT CHARACTERISTICS* Normal Control Subjects Subjects with Asthma p Value Number 23 48 Age (years) 35±10 35±10 0.75 Sex, M:F (% F) 9:12 (57) 17:26 (60) 0.76 FEV1
Tissue factor-par2 signaling promotes diet-induced obesity and adipose
 Supplementary figures for Tissue factor-par2 signaling promotes diet-induced obesity and adipose inflammation. Leylla Badeanlou 1, Christian Furlan-Freguia 2, Guang Yang 1, Wolfram Ruf 2,3, and Fahumiya
18s AAACGGCTACCACATCCAAG CCTCCAATGGATCCTCGTTA. 36b4 GTTCTTGCCCATCAGCACC AGATGCAGCAGATCCGCAT. Acc1 AGCAGATCCGCAGCTTG ACCTCTGCTCGCTGAGTGC
 Supplementary Table 1. Quantitative PCR primer sequences Gene symbol Sequences (5 to 3 ) Forward Reverse 18s AAACGGCTACCACATCCAAG CCTCCAATGGATCCTCGTTA 36b4 GTTCTTGCCCATCAGCACC AGATGCAGCAGATCCGCAT Acc1
Pathologic Stage. Lymph node Stage
 ASC ASC a c Patient ID BMI Age Gleason score Non-obese PBMC 1 22.1 81 6 (3+3) PBMC 2 21.9 6 6 (3+3) PBMC 3 22 84 8 (4+4) PBMC 4 24.6 68 7 (3+4) PBMC 24. 6 (3+3) PBMC 6 24.7 73 7 (3+4) PBMC 7 23. 67 7 (3+4)
Supplementary Figure 1: Hsp60 / IEC mice are embryonically lethal (A) Light microscopic pictures show mouse embryos at developmental stage E12.
 Light microscopic pictures show mouse embryos at developmental stage E12.") Supplementary Figure 1: Hsp60 / IEC mice are embryonically lethal (A) Light microscopic pictures show mouse embryos at developmental stage E12.5 and E13.5 prepared from uteri of dams and subsequently genotyped.
Supplementary Figure 1: Hsp60 / IEC mice are embryonically lethal (A) Light microscopic pictures show mouse embryos at developmental stage E12.5 and E13.5 prepared from uteri of dams and subsequently genotyped.
Programmed necrosis, not apoptosis, is a key mediator of cell loss and DAMP-mediated inflammation in dsrna-induced retinal degeneration
 Programmed necrosis, not apoptosis, is a key mediator of cell loss and DAMP-mediated inflammation in dsrna-induced retinal degeneration The Harvard community has made this article openly available. Please
Supplementary Figure 1
 Supplementary Figure 1 how HFD how HFD Epi WT p p Hypothalamus p p Inguinal WT T Liver Lean mouse adipocytes p p p p p p Obese mouse adipocytes Kidney Muscle Spleen Heart p p p p p p p p Extracellular
Supporting Online Material for
 www.sciencemag.org/cgi/content/full/science.118828/dc1 Supporting Online Material for Is an Anti-Inflammatory Adipokine That Modulates Metabolic Dysfunction in Obesity Noriyuki Ouchi, Akiko Higuchi, Koji
Quantitative PPARγ expression affects the balance between tolerance and immunity
 Quantitative PPARγ expression affects the balance between tolerance and immunity Ya-Hui Liu 1, Yau-Sheng Tsai 1,2,3, Shih-Chieh Lin 4, Nan-Shih Liao 5, Ming-Shiou Jan 6, Chung-Tiang Liang 7, Shih-Wen Hsu
3/25/2010. Age-adjusted incidence rates for coronary heart disease according to body mass index and waist circumference tertiles
 Outline Relationships among Regional Adiposity, Physical Activity, and CVD Risk Factors: Preliminary Results from Two Epidemiologic Studies Molly Conroy, MD, MPH Obesity Journal Club February 18, 2010
Supplementary Figure 1. ETBF activate Stat3 in B6 and Min mice colons
 Supplementary Figure 1 ETBF activate Stat3 in B6 and Min mice colons a pstat3 controls Pos Neg ETBF 1 2 3 4 b pstat1 pstat2 pstat3 pstat4 pstat5 pstat6 Actin Figure Legend: (a) ETBF induce predominantly
Supplementary Figure 1. Characterization of human carotid plaques. (a) Flash-frozen human plaques were separated into vulnerable (V) and stable (S),
 Flash-frozen human plaques were separated into vulnerable (V) and stable (S),") Supplementary Figure 1. Characterization of human carotid plaques. (a) Flash-frozen human plaques were separated into vulnerable (V) and stable (S), regions which were then quantified for mean fluorescence
Supplementary Figure 1. Characterization of human carotid plaques. (a) Flash-frozen human plaques were separated into vulnerable (V) and stable (S), regions which were then quantified for mean fluorescence
COPD lungs show an attached stratified mucus layer that separate. bacteria from the epithelial cells resembling the protective colonic
 COPD lungs show an attached stratified mucus layer that separate bacteria from the epithelial cells resembling the protective colonic mucus SUPPLEMENTARY TABLES AND FIGURES Tables S1 S8, page 1 and separate
SUPPLEMENTARY INFORMATION
 SUPPLEMENTARY INFORMATION doi:10.1038/nature11464 Supplemental Figure S1. The expression of Vegfb is increased in obese and diabetic mice as compared to lean mice. a-b, Body weight and postprandial blood
SUPPLEMENTARY DATA. Nature Medicine: doi: /nm.4171
 SUPPLEMENTARY DATA Supplementary Figure 1 a b c PF %Change - -4-6 Body weight Lean mass Body fat Tissue weight (g).4.3.2.1. PF GC iwat awat BAT PF d e f g week 2 week 3 NEFA (mmol/l) 1..5. PF phsl (Ser565)
Supplementary Figure 1
 Combination index (CI) Supplementary Figure 1 2. 1.5 1. Ishikawa AN3CA Nou-1 Hec-18.5...2.4.6.8 1. Fraction affected (Fa) Supplementary Figure 1. The synergistic effect of PARP inhibitor and PI3K inhibitor
UMHS-PUHSC JOINT INSTITUTE
 Role of Visceral Adiposity in the Pathogenesis of Non-Alcoholic Fatty Liver Disease in Lean versus Obese Patients: A Comparative Study between Patients at UMHS versus PUHSC Lai WEI and Anna LOK W Zhang,
Mouse Glu-OC (undercarboxylated osteocalcin) and Gla-OC (carboxylated osteocalcin) levels were
 and Gla-OC (carboxylated osteocalcin) levels were") Supplemental Data Supplemental Materials and Methods Plasma measurements Mouse Glu-OC (undercarboxylated osteocalcin) and Gla-OC (carboxylated osteocalcin) levels were determined using ELISA kits according
Supplemental Data Supplemental Materials and Methods Plasma measurements Mouse Glu-OC (undercarboxylated osteocalcin) and Gla-OC (carboxylated osteocalcin) levels were determined using ELISA kits according
a 10 4 Link et al. Supplementary Figure 1 Nature Immunology: doi: /ni.1842 Cells per mouse ( 10 5 ) TRPV2KO anti-gr1 anti-gr anti-f4/80
 TRPV2KO anti-gr1 anti-gr anti-f4/80") a 10 4 WT 10 4 TRPV2KO 10 3 10 3 anti-gr1 10 2 10 1 anti-gr1 10 2 10 1 10 0 10 0 10 1 10 2 10 3 10 4 anti-f4/80 42.3 45.2 10 0 10 0 10 1 10 2 10 3 10 4 anti-f4/80 10 4 10 4 40 42.5 anti-cd11b 10 3 10 2
a 10 4 WT 10 4 TRPV2KO 10 3 10 3 anti-gr1 10 2 10 1 anti-gr1 10 2 10 1 10 0 10 0 10 1 10 2 10 3 10 4 anti-f4/80 42.3 45.2 10 0 10 0 10 1 10 2 10 3 10 4 anti-f4/80 10 4 10 4 40 42.5 anti-cd11b 10 3 10 2
Supplementary Figure S I: Effects of D4F on body weight and serum lipids in apoe -/- mice.
 Supplementary Figures: Supplementary Figure S I: Effects of D4F on body weight and serum lipids in apoe -/- mice. Male apoe -/- mice were fed a high-fat diet for 8 weeks, and given PBS (model group) or
Supplementary Figure 1 a
 Supplementary Figure a Normalized expression/tbp (A.U.).6... Trip-br transcripts Trans Trans Trans b..5. Trip-br Ctrl LPS Normalized expression/tbp (A.U.) c Trip-br transcripts. adipocytes.... Trans Trans
Ct=28.4 WAT 92.6% Hepatic CE (mg/g) P=3.6x10-08 Plasma Cholesterol (mg/dl)
 P=3.6x10-08 Plasma Cholesterol (mg/dl)") a Control AAV mtm6sf-shrna8 Ct=4.3 Ct=8.4 Ct=8.8 Ct=8.9 Ct=.8 Ct=.5 Relative TM6SF mrna Level P=.5 X -5 b.5 Liver WAT Small intestine Relative TM6SF mrna Level..5 9.6% Control AAV mtm6sf-shrna mtm6sf-shrna6
a Control AAV mtm6sf-shrna8 Ct=4.3 Ct=8.4 Ct=8.8 Ct=8.9 Ct=.8 Ct=.5 Relative TM6SF mrna Level P=.5 X -5 b.5 Liver WAT Small intestine Relative TM6SF mrna Level..5 9.6% Control AAV mtm6sf-shrna mtm6sf-shrna6
Nature Immunology: doi: /ni Supplementary Figure 1
 Supplementary Figure 1 NLRP12 is downregulated in biopsy samples from patients with active ulcerative colitis (UC). (a-g) NLRP12 expression in 7 UC mrna profiling studies deposited in NCBI GEO database.
Supplementary Table 2. Plasma lipid profiles in wild type and mutant female mice submitted to a HFD for 12 weeks wt ERα -/- AF-1 0 AF-2 0
 Supplementary Table 1. List of specific primers used for gene expression analysis. Genes Primer forward Primer reverse Hprt GCAGTACAGCCCCAAAATGG AACAAAGTCTGGCCTGTATCCA Srebp-1c GGAAGCTGTCGGGGTAGCGTC CATGTCTTCAAATGTGCAATCCAT
Effect of High-fat or High-glucose Diet on Obesity and Visceral Adipose Tissue in Mice
 ACTA ACADEMIAE MEDICINAE SINICAE 410011 0731-85295846 lixia2014@vip. 163. com 4 C57BL /6 20-1 mrna 20 P < 0. 05 O 20 P > 0. 05 M2 P < 0. 05-1 mrna P < 0. 05 P > 0. 05 R589. 2 DOI 10. 3881 /j. issn. 1000-503X.
Supplemental Information. CD4 + CD25 + Foxp3 + Regulatory T Cells Promote. Th17 Cells In Vitro and Enhance Host Resistance
 Immunity, Volume 34 Supplemental Information D4 + D25 + + Regulatory T ells Promote Th17 ells In Vitro and Enhance Host Resistance in Mouse andida albicans Th17 ell Infection Model Pushpa Pandiyan, Heather
Supplemental Materials for. Effects of sphingosine-1-phosphate receptor 1 phosphorylation in response to. FTY720 during neuroinflammation
 Supplemental Materials for Effects of sphingosine-1-phosphate receptor 1 phosphorylation in response to FTY7 during neuroinflammation This file includes: Supplemental Table 1. EAE clinical parameters of
TBP (H) CACAGTGAATCTTGGTTGTAAACTTGA AAACCGCTTGGGATTATATTCG ANGPTL8 (H) CTGGGCCCTGCCTACCGAGA CCGATGCTGCTGTGCCACCA [1]
![TBP (H) CACAGTGAATCTTGGTTGTAAACTTGA AAACCGCTTGGGATTATATTCG ANGPTL8 (H) CTGGGCCCTGCCTACCGAGA CCGATGCTGCTGTGCCACCA [1]](/thumbs/89/99233308.jpg "TBP (H) CACAGTGAATCTTGGTTGTAAACTTGA AAACCGCTTGGGATTATATTCG ANGPTL8 (H) CTGGGCCCTGCCTACCGAGA CCGATGCTGCTGTGCCACCA [1]") ESM Table 1. Immunoblot antibodies. Primary Supplier Dilution Antibody Akt Cell Signaling 1:1000 Technology Phosphorylated Cell Signaling 1:1000 Akt (Ser 473) Technology PKCε Cell Signaling 1:1000 Technology
ESM Table 1. Immunoblot antibodies. Primary Supplier Dilution Antibody Akt Cell Signaling 1:1000 Technology Phosphorylated Cell Signaling 1:1000 Akt (Ser 473) Technology PKCε Cell Signaling 1:1000 Technology
Fasted Insulin Coincidence of Macrophage Infiltration into White Adipose Tissue and Onset of Hyperinsulinemia During Diet- Induced Obesity
 Fasted Insulin Coincidence of Macrophage Infiltration into White Adipose Tissue and Onset of Hyperinsulinemia During Diet- Induced Obesity F4/80 MCP-1 (After: Xu et al, 2003 JCI vol.112) F4/80+ Cells are
Supplementary Materials for
 www.sciencesignaling.org/cgi/content/full/8/407/ra127/dc1 Supplementary Materials for Loss of FTO in adipose tissue decreases Angptl4 translation and alters triglyceride metabolism Chao-Yung Wang,* Shian-Sen
Protein extraction and western blot analysis Protein extraction was performed as
 ESM Methods Protein extraction and western blot analysis Protein extraction was performed as previously described [1]. 2 g protein was loaded on SDSPAGE and immunoblotted with antibodies to mouse AKT (1:1,
Supplementary Figure 1
 d f a IL7 b IL GATA RORγt h HDM IL IL7 PBS Ilra R7 PBS HDM Ilra R7 HDM Foxp Foxp Ilra R7 HDM HDM Ilra R7 HDM. 9..79. CD + FOXP + T reg cell CD + FOXP T conv cell PBS Ilra R7 PBS HDM Ilra R7 HDM CD + FOXP
(A) RT-PCR for components of the Shh/Gli pathway in normal fetus cell (MRC-5) and a
 RT-PCR for components of the Shh/Gli pathway in normal fetus cell (MRC-5) and a") Supplementary figure legends Supplementary Figure 1. Expression of Shh signaling components in a panel of gastric cancer. (A) RT-PCR for components of the Shh/Gli pathway in normal fetus cell (MRC-5) and
Supplementary figure legends Supplementary Figure 1. Expression of Shh signaling components in a panel of gastric cancer. (A) RT-PCR for components of the Shh/Gli pathway in normal fetus cell (MRC-5) and
Supplemental Figure 1. Western blot analysis indicated that MIF was detected in the fractions of
 Supplemental Figure Legends Supplemental Figure 1. Western blot analysis indicated that was detected in the fractions of plasma membrane and cytosol but not in nuclear fraction isolated from Pkd1 null
Supplementary information to: Mechanism of lipopolysaccharide-induced skin edema formation in the mouse
 Supplementary information to: Mechanism of lipopolysaccharide-induced skin edema formation in the mouse Ivan Zanoni*, Renato Ostuni*, Simona Barresi, Marco Di Gioia, Achille Broggi, Barbara Costa, Roberta
Activated mast cells promote differentiation of B cells into effector cells
 Supplementary,information, Activated mast cells promote differentiation of B cells into effector cells Anna-Karin E. Palm 1, Gianni Garcia Faroldi 2, Marcus Lundberg 1, Gunnar Pejler 3, 2 and Sandra Kleinau
IL-6Rα IL-6RαT-KO KO. IL-6Rα f/f bp. f/f 628 bp deleted 368 bp. 500 bp
 STD H 2 O WT KO IL-6Rα f/f IL-6Rα IL-6RαT-KO KO 1000 bp 500 bp f/f 628 bp deleted 368 bp Supplementary Figure 1 Confirmation of T-cell IL-6Rα deficiency. (a) Representative histograms and (b) quantification
We obtained Male C57BL/6J, ob/ob, and Cd8a-deficient mice from Charles River Japan
 Supplementary Methods Animal models We obtained Male C57BL/6J, ob/ob, and Cd8a-deficient mice from Charles River Japan or Jackson Laboratories. All mice were housed under a 12-h light-dark cycle and allowed
IL-34 is a tissue-restricted ligand of CSF1R required for the development of Langerhans cells and microglia
 Supplementary Figures IL-34 is a tissue-restricted ligand of CSF1R required for the development of Langerhans cells and microglia Yaming Wang, Kristy J. Szretter, William Vermi, Susan Gilfillan, Cristina
NMED-A65251A. Supplementary Figures.
 NMED-A65251A Supplementary Figures. Sup. Fig. 1. ILC3 cells are the main source of in obese mice a. We gated on T cells (upper panels) or T cells (lower panels), and examined production. b. CD45 + - IL-13
Immune Cells in Regional Adipose Tissue Depots: A Pilot Study. Vi Dam. A Thesis. The Department. Exercise Science
 Effect of Early onset Obesity versus Late onset Obesity on Immune Cells in Regional Adipose Tissue Depots: A Pilot Study Vi Dam A Thesis in The Department of Exercise Science Presented in Partial Fulfillment
Supplementary Table 1.
 Supplementary Table 1. Expression of genes involved in brown fat differentiation in WAT of db/db mice treated with HDAC inhibitors. Data are expressed as fold change (FC) versus control. symbol FC SAHA
Supplementary Figures for TSC1 controls macrophage polarization to prevent inflammatory disorder by Linnan Zhu et al
 Supplementary Figures for TSC1 controls macrophage polarization to prevent inflammatory disorder by Linnan Zhu et al Suppl. Fig. 1 Tissue DN C Proteins kd TSC1-17 TSC 1 loxp bp -48-285 ctin PEMs Neutrophils
TGF-β Signaling Regulates Neuronal C1q Expression and Developmental Synaptic Refinement
 Supplementary Information Title: TGF-β Signaling Regulates Neuronal C1q Expression and Developmental Synaptic Refinement Authors: Allison R. Bialas and Beth Stevens Supplemental Figure 1. In vitro characterization
Figure legends Supplemental Fig.1. Glucose-induced insulin secretion and insulin content of islets. Supplemental Fig. 2.
 Figure legends Supplemental Fig.. Glucose-induced insulin secretion and insulin content of islets. Insulin secretory responses to.,., and. mm glucose (A) (n = 7-), and the insulin content in the islets
Generation of ST2-GFP reporter mice and characterization of ILC1 cells following infection
 Supplementary Figure 1 Generation of ST2-GFP reporter mice and characterization of ILC1 cells following infection with influenza virus. (a) ST2-GFP reporter mice were generated as described in Methods.
Supplementary Materials for. c-abl Activation Plays a Role in α-synucleinopathy Induced Neurodegeneration
 Supplementary Materials for c-abl Activation Plays a Role in α-synucleinopathy Induced Neurodegeneration Saurav Brahmachari, Preston Ge, Su Hyun Lee, Donghoon Kim, Senthilkumar S. Karuppagounder, Manoj
Nature Immunology: doi: /ni Supplementary Figure 1. Production of cytokines and chemokines after vaginal HSV-2 infection.
 Supplementary Figure 1 Production of cytokines and chemokines after vaginal HSV-2 infection. C57BL/6 mice were (a) treated intravaginally with 20 µl of PBS or infected with 6.7x10 4 pfu of HSV-2 in the
SUPPLEMENTARY INFORMATION
 doi: 1.138/nature89 IFN- (ng ml ) 5 4 3 1 Splenocytes NS IFN- (ng ml ) 6 4 Lymph node cells NS Nfkbiz / Nfkbiz / Nfkbiz / Nfkbiz / IL- (ng ml ) 3 1 Splenocytes IL- (ng ml ) 1 8 6 4 *** ** Lymph node cells
Expanded View Figures
 Expanded View Figures A B C D E F G H I J K L Figure EV1. The dysregulated lipid metabolic phenotype of mouse models of metabolic dysfunction is most pronounced in the fasted state. A L Male 12-weeks-old
Client Sex Facility Birth Date Height Weight Measured ####, #### #### (not specified) #### #### #### ####
 #### #### #### ####") SUMMARY RESULTS This table provides an overview of your total body composition, broken down into total body fat %, total mass, fat tissue, lean tissue, and bone mineral content. These metrics establish
SUMMARY RESULTS This table provides an overview of your total body composition, broken down into total body fat %, total mass, fat tissue, lean tissue, and bone mineral content. These metrics establish
Obesity, Metabolic Syndrome, and Diabetes: Making the Connections
 Obesity, Metabolic Syndrome, and Diabetes: Making the Connections Alka M. Kanaya, M.D. Associate Professor of Medicine & Epi/Biostats University of California, San Francisco February 26, 21 Roadmap 1.
Supplementary Figure 1.
 Supplementary Figure 1. Female Pro-ins2 -/- mice at 5-6 weeks of age were either inoculated i.p. with a single dose of CVB4 (1x10 5 PFU/mouse) or PBS and treated with αgalcer or control vehicle. On day
SUPPLEMENTARY INFORMATION
 DOI: 10.1038/ncb3461 In the format provided by the authors and unedited. Supplementary Figure 1 (associated to Figure 1). Cpeb4 gene-targeted mice develop liver steatosis. a, Immunoblot displaying CPEB4
Integrin CD11b negatively regulates TLR-triggered inflammatory responses by. activating Syk and promoting MyD88 and TRIF degradation via cbl-b
 Integrin CD11b negatively regulates TLR-triggered inflammatory responses by activating Syk and promoting MyD88 and TRIF degradation via cbl-b Chaofeng Han, Jing Jin, Sheng Xu, Haibo Liu, Nan Li, and Xuetao
Akt and mtor pathways differentially regulate the development of natural and inducible. T H 17 cells
 Akt and mtor pathways differentially regulate the development of natural and inducible T H 17 cells Jiyeon S Kim, Tammarah Sklarz, Lauren Banks, Mercy Gohil, Adam T Waickman, Nicolas Skuli, Bryan L Krock,
Supplementary Figure 1: Expression of NFAT proteins in Nfat2-deleted B cells (a+b) Protein expression of NFAT2 (a) and NFAT1 (b) in isolated splenic
 Protein expression of NFAT2 (a) and NFAT1 (b) in isolated splenic") Supplementary Figure 1: Expression of NFAT proteins in Nfat2-deleted B cells (a+b) Protein expression of NFAT2 (a) and NFAT1 (b) in isolated splenic B cells from WT Nfat2 +/+, TCL1 Nfat2 +/+ and TCL1 Nfat2
Supplementary Figure 1: Expression of NFAT proteins in Nfat2-deleted B cells (a+b) Protein expression of NFAT2 (a) and NFAT1 (b) in isolated splenic B cells from WT Nfat2 +/+, TCL1 Nfat2 +/+ and TCL1 Nfat2
University of California, San Diego La Jolla CA 92093
 AD Award Number: W81XWH-11-1-0131 TITLE: Role of Inflammation and Insulin Resistance in Mouse Models of Breast Cancer PRINCIPAL INVESTIGATOR: Jerrold Olefsky, M.D. CONTRACTING ORGANIZATION: University
Supplementary Figure 1. Characterization of NMuMG-ErbB2 and NIC breast cancer cells expressing shrnas targeting LPP. NMuMG-ErbB2 cells (a) and NIC
 and NIC") Supplementary Figure 1. Characterization of NMuMG-ErbB2 and NIC breast cancer cells expressing shrnas targeting LPP. NMuMG-ErbB2 cells (a) and NIC cells (b) were engineered to stably express either a LucA-shRNA
Supplementary Figure 1. Characterization of NMuMG-ErbB2 and NIC breast cancer cells expressing shrnas targeting LPP. NMuMG-ErbB2 cells (a) and NIC cells (b) were engineered to stably express either a LucA-shRNA
SUPPLEMENTARY INFORMATION
 DOI: 10.1038/ncb2211 a! mir-143! b! mir-103/107! let-7a! mir-144! mir-122a! mir-126-3p! mir-194! mir-27a! mir-30c! Figure S1 Northern blot analysis of mir-143 expression dependent on feeding conditions.
IL METABOLISMO EPATICO DEI CARBOIDRATI IN FISIOLOGIA E PATOLOGIA
 UNIGASTRO Il fegato come centrale metabolica e i fattori di danno oltre ai virus epatitici IL METABOLISMO EPATICO DEI CARBOIDRATI IN FISIOLOGIA E PATOLOGIA Dr Elisabetta Bugianesi Divisione di Gastro-Epatologia
Supplementary Figure S1. PTPN2 levels are not altered in proliferating CD8+ T cells. Lymph node (LN) CD8+ T cells from C57BL/6 mice were stained with
 CD8+ T cells from C57BL/6 mice were stained with") Supplementary Figure S1. PTPN2 levels are not altered in proliferating CD8+ T cells. Lymph node (LN) CD8+ T cells from C57BL/6 mice were stained with CFSE and stimulated with plate-bound α-cd3ε (10µg/ml)
Supplementary Figure S1. PTPN2 levels are not altered in proliferating CD8+ T cells. Lymph node (LN) CD8+ T cells from C57BL/6 mice were stained with CFSE and stimulated with plate-bound α-cd3ε (10µg/ml)
Imbalance between Neutrophil Elastase and its Inhibitor a1-antitrypsin in Obesity Alters Insulin Sensitivity, Inflammation, and Energy Expenditure
 Article Imbalance between Neutrophil Elastase and its Inhibitor a1-antitrypsin in Obesity Alters Insulin Sensitivity, Inflammation, and Energy Expenditure Virginie Mansuy-Aubert, 1,8 Qiong L. Zhou, 1,8
Supplemental Figure 1. Signature gene expression in in vitro differentiated Th0, Th1, Th2, Th17 and Treg cells. (A) Naïve CD4 + T cells were cultured
 Naïve CD4 + T cells were cultured") Supplemental Figure 1. Signature gene expression in in vitro differentiated Th0, Th1, Th2, Th17 and Treg cells. (A) Naïve CD4 + T cells were cultured under Th0, Th1, Th2, Th17, and Treg conditions. mrna
Supplemental Figure 1. Signature gene expression in in vitro differentiated Th0, Th1, Th2, Th17 and Treg cells. (A) Naïve CD4 + T cells were cultured under Th0, Th1, Th2, Th17, and Treg conditions. mrna
Fat Mass. Baseline. (lbs) (lbs) Composition Trend: Total. Aug 17. Apr 17. May 17. Jun 17. Jul 17. Measured Date
 (lbs) Composition Trend: Total. Aug 17. Apr 17. May 17. Jun 17. Jul 17. Measured Date") Name Sample Report Birth Date: 00/00/000 Height: 74.0 in. Gender Male Age: 54.7 Input Weight: 165.0 lbs. Body Composition Analysis (BCA) DXA or DEXA is a three component model, which means it quantifies
Name Sample Report Birth Date: 00/00/000 Height: 74.0 in. Gender Male Age: 54.7 Input Weight: 165.0 lbs. Body Composition Analysis (BCA) DXA or DEXA is a three component model, which means it quantifies
Primer sequences Target Sequence F Sequence R TNF-α (Tnfa) TCAGCCGATTTGCTATCTCAT A
 TCAGCCGATTTGCTATCTCAT A") Supplementary Table 1. Q- and RT-PR primers used in this study. Primer sequences Target Sequence F Sequence R TNF-α (Tnfa) TGGTTTGTTTT GTTTGGGGTTG T hemokine (- motif) ligand 5 (cl5) GTGTTTGTTT TGGTGGTG
Supplementary Table 1. Q- and RT-PR primers used in this study. Primer sequences Target Sequence F Sequence R TNF-α (Tnfa) TGGTTTGTTTT GTTTGGGGTTG T hemokine (- motif) ligand 5 (cl5) GTGTTTGTTT TGGTGGTG
As outlined under External contributions (see appendix 7.1), the group of Prof. Gröne at the
, the group of Prof. Gröne at the") 3 RESULTS As outlined under External contributions (see appendix 7.1), the group of Prof. Gröne at the DKFZ in Heidelberg (Dept. of Cellular and Molecular pathology) contributed to this work by performing
3 RESULTS As outlined under External contributions (see appendix 7.1), the group of Prof. Gröne at the DKFZ in Heidelberg (Dept. of Cellular and Molecular pathology) contributed to this work by performing
SUPPLEMENTARY INFORMATION
 doi:1.138/nature1554 a TNF-α + in CD4 + cells [%] 1 GF SPF 6 b IL-1 + in CD4 + cells [%] 5 4 3 2 1 Supplementary Figure 1. Effect of microbiota on cytokine profiles of T cells in GALT. Frequencies of TNF-α