Supplementary Information
|
|
|
- Verity Johns
- 5 years ago
- Views:
Transcription
1 Supplementary Information GADD34-deficient mice develop obesity, nonalcoholic fatty liver disease, hepatic carcinoma and insulin resistance Naomi Nishio and Ken-ichi Isobe Department of Immunology, Nagoya University Graduate School of Medicine, 65 Turumai-cho, Showa-ku, Nagoya, Aichi, , Japan Correspondence: K. Isobe, Department of Immunology, Nagoya University Graduate School of Medicine, 65 Tsurumai-cho, Showa-ku, Nagoya, Aichi, , Japan. address: Tel: Fax:
.")

2 Supplemental Figure 1. (c) Supplemental Figure 1; GADD34 deficiency induced the liver diseases in aged mice. Frozen sections of liver from aged WT and GADD34 -deficient mice were stained with anti-αsma-cy3 (Red). Analyzed by confocal microscopy. H& E section of Hepatocellular carcinoma from the liver of male GADD34 -deficient 17 M mice. (c) Immunohistological staining by FITC-labeled anti-afp (Green) was analyzed by confocal microscopy.


 / analyzed mice.")
3 Supplemental Figure 2 Supplemental Figure 2; GADD34 deficiency induced the liver diseases in aged mice. Sections of liver from male WT and GADD34 -deficient mice at different age were stained with H&E, Masson s Trichrome and Oil Red O. Scale bars represent 100 μm. Photographs of Epididymal WAT of each age were shown below. The pictures show the male WT mice (left) and GADD34 -deficient mice (right) in each age. Data shows liver diseases (liver cirrhosis and liver carcinoma) / analyzed mice. The pictures show the representative macroscopic photographs of livers from aged GADD34-deficient mice.
 and HFD. Liver tissues were taken from the 2.")
4 Supplementary Figure 3 a b c d e f g h Supplementary Figure 3; Hepatic glycogen, TG and Cholesterol contents in erwt and GADD34 KO. Differences of hepatic glycogen contents between normal diet (ND) and HFD. Liver tissues were taken from the 2.5M old WT and GADD34-deficient mice fed on a normal diet (ND) or the mice after 2 weeks of HFD. Data shown are the mean ratio ± SEM of three mice. (b-d) Differences of hepatic glycogen, TG (c) or cholestrrol (d) contents between young and aged mice. Liver tissues were taken from the 3M old or 10-15M old GADD34-deficient and WT mice fed on a ND or the mice after 2 weeks of HFD. RNAs were taken from the liver of control, at 3 days and at 2 weeks of HFD (e, g) or young (3M) and aged (10-15 M) (f, h) GADD34 -deficient or WT mice. Expressions of Srebf1, Scd1 mrna were measured by Real time PCR analysis. Data shown are the mean ratio ± SEM of four mice.
5 Supplemental Figure 4 (c) (d) Supplemental Figure 4; Serum insulin levels of normal diet, HFD and aging in GADD34 KO and WT mice. Serum insulin levels were measured in normal diet, at 2 weeks HFD and aging (c) of WT and GADD34-deficient mice. After 5 h starvation, serum insulin levels were measured by taking serum (fasted) or taking serum after 30 min. of intraperitoneal glucose (2g/kg) injection in young (2.5M) GADD34-deficient and WT mice. Same experiments were done in the mice of two weeks of HFD, and young (3M) and aged (15M) mice with normal diet (c). Data shown are the mean ratio ± SEM of four mice.
 to intravenously under anesthesia and the liver, fat and muscle were removed from these mice in each time (0 min, 3min, 15min).")
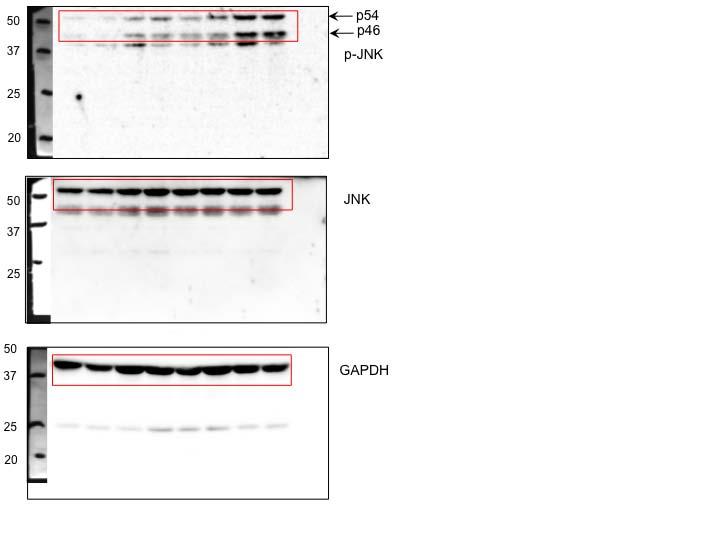
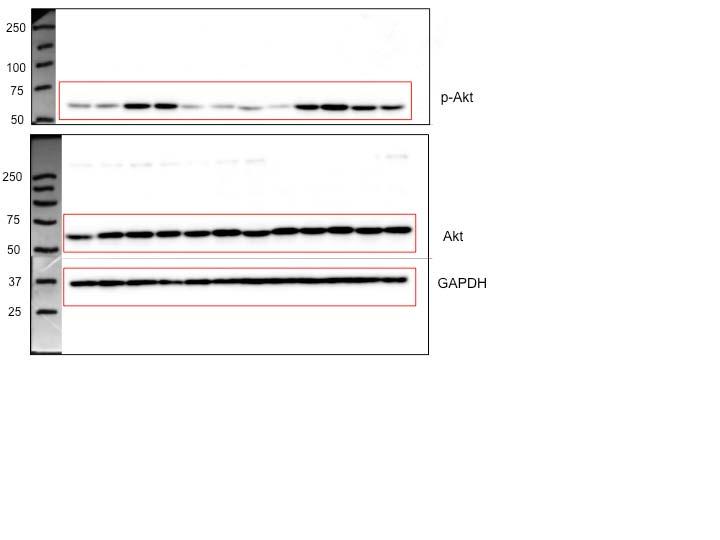
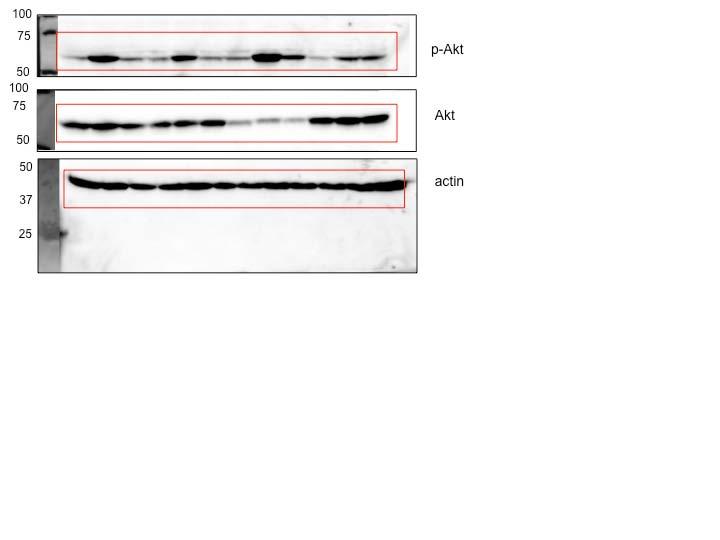
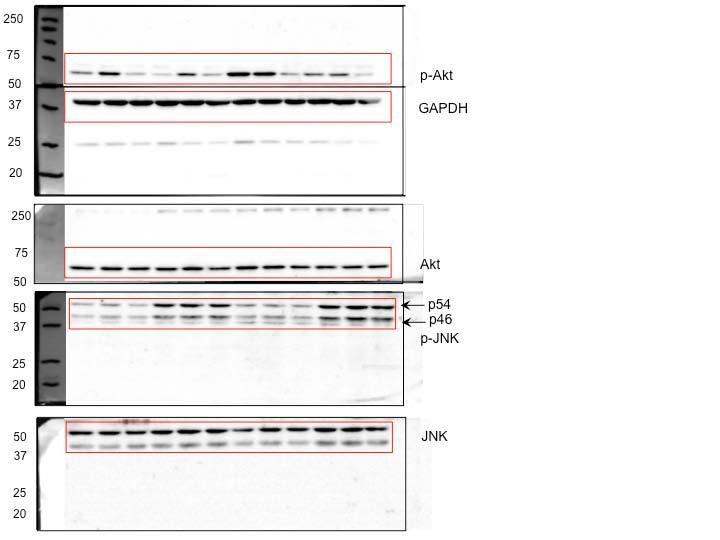
6 Supplemental Figure 5 Supplemental Figure 5; GADD34 deficiency induced the insulin resistance in each tissue WT and GADD34-deficient mice fed HFD for 2 weeks and young (3M) and aged (10M) with normal diet were fasted for 5 h then were injected insulin (5U/mice) to intravenously under anesthesia and the liver, fat and muscle were removed from these mice in each time (0 min, 3min, 15min). Protein expressions of p-akt, Akt and GAPDH in liver were analyzed by western blotting.

, anti-f4/80-apc/ anti-ly6g-pe (d) or anti-ly6c-apc/ anti-c11c-fitc (e).")

7 Supplemental Figure 6 (c) (f) (d) (g) (e) Supplemental Figure 6; Higher number of myelid lineage cells migration to epididimal WAT of GADD34 deficient mice by HFD, Related to Figure 4 Liver Epididimal WAT weight of 3 M old male WT and GADD34-deficient mice. (c-e) Epididimal WAT taken from 3 M old male WT and GADD34-deficient mice fed on a ND or 2 weeks of HFD were analyzed by FACS. Immune cells from WAT were stained with anti-gr-1-apc/anti-c11b-pe (c), anti-f4/80-apc/ anti-ly6g-pe (d) or anti-ly6c-apc/ anti-c11c-fitc (e). (f-g) Liver was extracted from 3 months old female WT and GADD34-deficient mice at 5 days and 2 weeks after HFD or ND. (f) Sections were stained with H&E. Scale bars represent 100 μm. (g) Frozen sections of liver from GADD34 -deficient mice were stained with anti-cd4-fitc (Green)/anti-CD8-PE (Red), anti-gr-1-fitc(green)/anti-cd11b-pe (Red)/anti-F4/80-APC (white), anti-cd11c-pe (Red) and anti-αsma-cy3 (Red).
8 Suplemental Figure 7 Supplemental Figure 7; cematic Protocol of Mouse embryonic fibroblast adipogenesis assay. MEFs were prepared from 14.5-day post-coital mouse embryos and digested with trypsin. They were cultured in Dulbecco s Modified Eagle s Medium (DMEM) supplemented with 10% fetal bovine serum (FBS), 50 U/ml penicillin and 50 mg/ml streptomycin. Confluent MEFs from WT and GADD34-deficient mice were used for adipogenic differentiation assays by incubating first with 10 μg/ml insulin, 250 nm dexamethasone and 0.5 mm isobutylmethylxanthine (Sigma-Aldrich) for 2 days, and then 10 μg/ml insulin was added every 2 days.
9 Supplemental Figure 8 Supplemental Figure 8; Adipocytes progenitor cells were increased in GADD34-deficient mice by HFD. FACS analysis of bone marrow cells from WT and GADD34 -deficient mice fed on a HFD. Bone marrow cells were stained with anti-cd24, Sca-1 and CD34 antibody. Graph shows CD24+/Sca-1+/CD34+ adipocyte progenitor bone marrow cells. Representative results of three independent experiments are shown. Data shown are the mean ratio ± SEM. (*; p<0.05)

10 Supplemental Figure 9 a b Supplemental Figure 9; Expression of p-eif2α by HFD feeding and aging. Expression of p-eif2α and eif2α were analyzed by western blotting in the liver taken from different days of WT and GADD34-deficient mice fed on a ND or HFD. Expression of p-eif2α and eif2α were analyzed by western blotting in the liver taken from different ages of WT and GADD34-deficient mice fed on a ND.
11 Supplemental Figure 10 (e) (f) (c) (d)
Supplementary Figure 1
 Supplementary Figure 1 a Percent of body weight! (%) 4! 3! 1! Epididymal fat Subcutaneous fat Liver SD Percent of body weight! (%) ** 3! 1! SD Percent of body weight! (%) 6! 4! SD ** b Blood glucose (mg/dl)!
Supplementary Figure 1. DNA methylation of the adiponectin promoter R1, Pparg2, and Tnfa promoter in adipocytes is not affected by obesity.
 Supplementary Figure 1. DNA methylation of the adiponectin promoter R1, Pparg2, and Tnfa promoter in adipocytes is not affected by obesity. (a) Relative amounts of adiponectin, Ppar 2, C/ebp, and Tnf mrna
SUPPLEMENTARY INFORMATION
 doi:10.1038/nature12652 Supplementary Figure 1. PRDM16 interacts with endogenous EHMT1 in brown adipocytes. Immunoprecipitation of PRDM16 complex by flag antibody (M2) followed by Western blot analysis
Serum Amyloid A3 Gene Expression in Adipocytes is an Indicator. of the Interaction with Macrophages
 Serum Amyloid A3 Gene Expression in Adipocytes is an Indicator of the Interaction with Macrophages Yohei Sanada, Takafumi Yamamoto, Rika Satake, Akiko Yamashita, Sumire Kanai, Norihisa Kato, Fons AJ van
Supplementary Figure S1. Flow cytometric analysis of the expression of Thy1 in NH cells. Flow cytometric analysis of the expression of T1/ST2 and
 Supplementary Figure S1. Flow cytometric analysis of the expression of Thy1 in NH cells. Flow cytometric analysis of the expression of T1/ST2 and Thy1 in NH cells derived from the lungs of naïve mice.
Supplementary Figure 1. mtor LysM and Rictor LysM mice have normal cellularity and percentages of hematopoe>c cells. a. Cell numbers of lung, liver,
 a. b. c. Supplementary Figure 1. mtor LysM and Rictor LysM mice have normal cellularity and percentages of hematopoe>c cells. a. Cell numbers of lung, liver, and spleen. b. Cell numbers of bone marrow
Supplemental Information. Increased 4E-BP1 Expression Protects. against Diet-Induced Obesity and Insulin. Resistance in Male Mice
 Cell Reports, Volume 16 Supplemental Information Increased 4E-BP1 Expression Protects against Diet-Induced Obesity and Insulin Resistance in Male Mice Shih-Yin Tsai, Ariana A. Rodriguez, Somasish G. Dastidar,
SUPPLEMENTARY INFORMATION
 doi: 1.138/nature7221 Brown fat selective genes 12 1 Control Q-RT-PCR (% of Control) 8 6 4 2 Ntrk3 Cox7a1 Cox8b Cox5b ATPase b2 ATPase f1a1 Sirt3 ERRα Elovl3/Cig3 PPARα Zic1 Supplementary Figure S1. stimulates
Defective Hepatic Autophagy in Obesity Promotes ER Stress and Causes Insulin Resistance
 Cell Metabolism, Volume 11 Supplemental Information Defective Hepatic Autophagy in Obesity Promotes ER Stress and Causes Insulin Resistance Ling Yang, Ping Li, Suneng Fu, Ediz S. Calay, and Gökhan S. Hotamisligil
SUPPLEMENTARY INFORMATION
 DOI: 10.1038/ncb3461 In the format provided by the authors and unedited. Supplementary Figure 1 (associated to Figure 1). Cpeb4 gene-targeted mice develop liver steatosis. a, Immunoblot displaying CPEB4
Supplementary Figure S I: Effects of D4F on body weight and serum lipids in apoe -/- mice.
 Supplementary Figures: Supplementary Figure S I: Effects of D4F on body weight and serum lipids in apoe -/- mice. Male apoe -/- mice were fed a high-fat diet for 8 weeks, and given PBS (model group) or
Supplemental Material:
 Supplemental Material: MATERIALS AND METHODS RNA interference Mouse CHOP sirna (ON-TARGETplus SMARTpool Cat# L-062068-00) and control sirna (ON-TARGETplus Control) were purchased from Dharmacon. Transfection
ab Adipogenesis Assay Kit (Cell-Based)
") ab133102 Adipogenesis Assay Kit (Cell-Based) Instructions for Use For the study of induction and inhibition of adipogenesis in adherent cells. This product is for research use only and is not intended
ab133102 Adipogenesis Assay Kit (Cell-Based) Instructions for Use For the study of induction and inhibition of adipogenesis in adherent cells. This product is for research use only and is not intended
Suppl Video: Tumor cells (green) and monocytes (white) are seeded on a confluent endothelial
 and monocytes (white) are seeded on a confluent endothelial") Supplementary Information Häuselmann et al. Monocyte induction of E-selectin-mediated endothelial activation releases VE-cadherin junctions to promote tumor cell extravasation in the metastasis cascade
Supplementary Information Häuselmann et al. Monocyte induction of E-selectin-mediated endothelial activation releases VE-cadherin junctions to promote tumor cell extravasation in the metastasis cascade
General Laboratory methods Plasma analysis: Gene Expression Analysis: Immunoblot analysis: Immunohistochemistry:
 General Laboratory methods Plasma analysis: Plasma insulin (Mercodia, Sweden), leptin (duoset, R&D Systems Europe, Abingdon, United Kingdom), IL-6, TNFα and adiponectin levels (Quantikine kits, R&D Systems
SUPPLEMENTARY INFORMATION
 -. -. SUPPLEMENTARY INFORMATION DOI: 1.1/ncb86 a WAT-1 WAT- BAT-1 BAT- sk-muscle-1 sk-muscle- mir-133b mir-133a mir-6 mir-378 mir-1 mir-85 mir-378 mir-6a mir-18 mir-133a mir- mir- mir-341 mir-196a mir-17
Supplementary Figure 1
 Supplementary Figure 1 A B mir-141, human cell lines mir-2c, human cell lines mir-141, hepatocytes mir-2c, hepatocytes Relative RNA.1.8.6.4.2 Relative RNA.3.2.1 Relative RNA 1.5 1..5 Relative RNA 2. 1.5
Supplementary Figure S1. Effect of Glucose on Energy Balance in WT and KHK A/C KO
 Supplementary Figure S1. Effect of Glucose on Energy Balance in WT and KHK A/C KO Mice. WT mice and KHK-A/C KO mice were provided drinking water containing 10% glucose or tap water with normal chow ad
IL-6Rα IL-6RαT-KO KO. IL-6Rα f/f bp. f/f 628 bp deleted 368 bp. 500 bp
 STD H 2 O WT KO IL-6Rα f/f IL-6Rα IL-6RαT-KO KO 1000 bp 500 bp f/f 628 bp deleted 368 bp Supplementary Figure 1 Confirmation of T-cell IL-6Rα deficiency. (a) Representative histograms and (b) quantification
SUPPLEMENTARY INFORMATION
 SUPPLEMENTARY INFORMATION doi:10.1038/nature11464 Supplemental Figure S1. The expression of Vegfb is increased in obese and diabetic mice as compared to lean mice. a-b, Body weight and postprandial blood
SUPPLEMENTARY INFORMATION
 DOI: 10.1038/ncb2211 a! mir-143! b! mir-103/107! let-7a! mir-144! mir-122a! mir-126-3p! mir-194! mir-27a! mir-30c! Figure S1 Northern blot analysis of mir-143 expression dependent on feeding conditions.
Supplementary Information. Glycogen shortage during fasting triggers liver-brain-adipose. neurocircuitry to facilitate fat utilization
 Supplementary Information Glycogen shortage during fasting triggers liver-brain-adipose neurocircuitry to facilitate fat utilization Supplementary Figure S1. Liver-Brain-Adipose neurocircuitry Starvation
18s AAACGGCTACCACATCCAAG CCTCCAATGGATCCTCGTTA. 36b4 GTTCTTGCCCATCAGCACC AGATGCAGCAGATCCGCAT. Acc1 AGCAGATCCGCAGCTTG ACCTCTGCTCGCTGAGTGC
 Supplementary Table 1. Quantitative PCR primer sequences Gene symbol Sequences (5 to 3 ) Forward Reverse 18s AAACGGCTACCACATCCAAG CCTCCAATGGATCCTCGTTA 36b4 GTTCTTGCCCATCAGCACC AGATGCAGCAGATCCGCAT Acc1
Supplementary Fig. 1 eif6 +/- mice show a reduction in white adipose tissue, blood lipids and normal glycogen synthesis. The cohort of the original
 Supplementary Fig. 1 eif6 +/- mice show a reduction in white adipose tissue, blood lipids and normal glycogen synthesis. The cohort of the original phenotypic screening was n=40. For specific tests, the
Supplementary Figure 1. DJ-1 modulates ROS concentration in mouse skeletal muscle.
 Supplementary Figure 1. DJ-1 modulates ROS concentration in mouse skeletal muscle. (a) mrna levels of Dj1 measured by quantitative RT-PCR in soleus, gastrocnemius (Gastroc.) and extensor digitorum longus
Supplementary Information
 Supplementary Information Notch deficiency decreases hepatic lipid accumulation by induction of fatty acid oxidation No-Joon Song,#, Ui Jeong Yun,#, Sunghee Yang, Chunyan Wu, Cho-Rong Seo, A-Ryeong Gwon,,
Proteomic profiling of small-molecule inhibitors reveals dispensability of MTH1 for cancer cell survival
 Supplementary Information for Proteomic profiling of small-molecule inhibitors reveals dispensability of MTH1 for cancer cell survival Tatsuro Kawamura 1, Makoto Kawatani 1, Makoto Muroi, Yasumitsu Kondoh,
A synergistic anti-obesity effect by a combination of capsinoids and cold temperature through the promotion of beige adipocyte biogenesis
 A synergistic anti-obesity effect by a combination of capsinoids and cold temperature through the promotion of beige adipocyte biogenesis Kana Ohyama, 1,2 Yoshihito Nogusa, 1 Kosaku Shinoda, 2 Katsuya
Low Cell Binding Property of LIPIDURE -COAT
 Technical Note_1 ver.1 Low Cell Binding Property of LIPIDURE -COAT 1. LIPIDURE -COAT MULTI DISH A-6MD (Cat. No. 51011617) 2. Cell; NIH 3T3 (Fibroblast, mouse) 1. 10 %CS-DMEM; DMEM (Dulbecco's Modified
Pathologic Stage. Lymph node Stage
 ASC ASC a c Patient ID BMI Age Gleason score Non-obese PBMC 1 22.1 81 6 (3+3) PBMC 2 21.9 6 6 (3+3) PBMC 3 22 84 8 (4+4) PBMC 4 24.6 68 7 (3+4) PBMC 24. 6 (3+3) PBMC 6 24.7 73 7 (3+4) PBMC 7 23. 67 7 (3+4)
1.5 ASK1KO fed. fasted 16 hrs w/o water. Fed. 4th. 4th WT ASK1KO N=29, 11(WT), ,5(ASK1KO) ASK1KO ASK1KO **** Time [h]
![1.5 ASK1KO fed. fasted 16 hrs w/o water. Fed. 4th. 4th WT ASK1KO N=29, 11(WT), ,5(ASK1KO) ASK1KO ASK1KO **** Time [h]](/thumbs/87/97258189.jpg "1.5 ASK1KO fed. fasted 16 hrs w/o water. Fed. 4th. 4th WT ASK1KO N=29, 11(WT), ,5(ASK1KO) ASK1KO ASK1KO **** Time [h]") 7: 13: 19: 1: 7: 151117 a 151117 4th 4th b c RQ.95 KO.9.85.8.75.7 light dark light dark.65 7: 19: 7: 19: 7: Means ± SEM, N=6 RQ 1..9.8.7.6.6 KO CL (-) CL (+) ibat weight ratio (/body weight) [%].5.4.3.2.1
7: 13: 19: 1: 7: 151117 a 151117 4th 4th b c RQ.95 KO.9.85.8.75.7 light dark light dark.65 7: 19: 7: 19: 7: Means ± SEM, N=6 RQ 1..9.8.7.6.6 KO CL (-) CL (+) ibat weight ratio (/body weight) [%].5.4.3.2.1
SUPPLEMENTARY DATA. Supplementary Table 1. Primers used in qpcr
 Supplementary Table 1. Primers used in qpcr Gene forward primer (5'-3') reverse primer (5'-3') β-actin AGAGGGAAATCGTGCGTGAC CAATAGTGATGACCTGGCCGT Hif-p4h-2 CTGGGCAACTACAGGATAAAC GCGTCCCAGTCTTTATTTAGATA
Supplementary Figure 1. Expression of CUGBP1 in non-parenchymal liver cells treated with TGF-β
 Supplementary Figures Supplementary Figure 1. Expression of CUGBP1 in non-parenchymal liver cells treated with TGF-β and LPS. Non-parenchymal liver cells were isolated and treated with or without TGF-β
SUPPLEMENTARY INFORMATION. Supplemental Figure 1. Body weight and blood glucose parameters of chow-diet (CD)
") SUPPLEMENTARY INFORMATION LEGENDS Supplemental Figure. Body weight and blood glucose parameters of chow-diet (CD) fed and high-fat diet (HFD) fed mice. (A) Body weight was measured at the beginning of
SUPPLEMENTARY INFORMATION LEGENDS Supplemental Figure. Body weight and blood glucose parameters of chow-diet (CD) fed and high-fat diet (HFD) fed mice. (A) Body weight was measured at the beginning of
a surface permeabilized
 a surface permeabilized RAW 64.7 P388D1 J774 b CD11b + Ly-6G - Blood Monocytes WT Supplementary Figure 1. Cell surface expression on macrophages and DCs. (a) RAW64.7, P388D1, and J774 cells were subjected
SUPPLEMENTARY INFORMATION
 Figure S1 Induction of non-apoptotic death of SV40-transformed and primary DKO MEFs, and DKO thymocytes. (A-F) STS-induced non-apoptotic death of DKO MEF. (A, B) Reduced viability of DKO MEFs after exposure
GPR120 *** * * Liver BAT iwat ewat mwat Ileum Colon. UCP1 mrna ***
 a GPR120 GPR120 mrna/ppia mrna Arbitrary Units 150 100 50 Liver BAT iwat ewat mwat Ileum Colon b UCP1 mrna Fold induction 20 15 10 5 - camp camp SB202190 - - - H89 - - - - - GW7647 Supplementary Figure
Figure S1. Western blot analysis of clathrin RNA interference in human DCs Human immature DCs were transfected with 100 nm Clathrin SMARTpool or
 Figure S1. Western blot analysis of clathrin RNA interference in human DCs Human immature DCs were transfected with 100 nm Clathrin SMARTpool or control nontargeting sirnas. At 90 hr after transfection,
SUPPLEMENTARY INFORMATION
 SUPPLEMENTARY INFORMATION FOR Liver X Receptor α mediates hepatic triglyceride accumulation through upregulation of G0/G1 Switch Gene 2 (G0S2) expression I: SUPPLEMENTARY METHODS II: SUPPLEMENTARY FIGURES
sequences of a styx mutant reveals a T to A transversion in the donor splice site of intron 5
 sfigure 1 Styx mutant mice recapitulate the phenotype of SHIP -/- mice. (A) Analysis of the genomic sequences of a styx mutant reveals a T to A transversion in the donor splice site of intron 5 (GTAAC
Supplementary Table 2. Plasma lipid profiles in wild type and mutant female mice submitted to a HFD for 12 weeks wt ERα -/- AF-1 0 AF-2 0
 Supplementary Table 1. List of specific primers used for gene expression analysis. Genes Primer forward Primer reverse Hprt GCAGTACAGCCCCAAAATGG AACAAAGTCTGGCCTGTATCCA Srebp-1c GGAAGCTGTCGGGGTAGCGTC CATGTCTTCAAATGTGCAATCCAT
Tissue factor-par2 signaling promotes diet-induced obesity and adipose
 Supplementary figures for Tissue factor-par2 signaling promotes diet-induced obesity and adipose inflammation. Leylla Badeanlou 1, Christian Furlan-Freguia 2, Guang Yang 1, Wolfram Ruf 2,3, and Fahumiya
SUPPLEMENTARY INFORMATION
 doi:10.1038/nature11095 Supplementary Table 1. Summary of the binding between Angptls and various Igdomain containing receptors as determined by flow cytometry analysis. The results were summarized from
Metabolic ER stress and inflammation in white adipose tissue (WAT) of mice with dietary obesity.
 of mice with dietary obesity.") Supplementary Figure 1 Metabolic ER stress and inflammation in white adipose tissue (WAT) of mice with dietary obesity. Male C57BL/6J mice were fed a normal chow (NC, 10% fat) or a high-fat diet (HFD,
Supplementary Figure 1 Metabolic ER stress and inflammation in white adipose tissue (WAT) of mice with dietary obesity. Male C57BL/6J mice were fed a normal chow (NC, 10% fat) or a high-fat diet (HFD,
Chronic variable stress activates hematopoietic stem cells
 SUPPLEMENTARY INFORMATION Chronic variable stress activates hematopoietic stem cells Timo Heidt *, Hendrik B. Sager *, Gabriel Courties, Partha Dutta, Yoshiko Iwamoto, Alex Zaltsman, Constantin von zur
Supplementary Figure 1.
 Supplementary Figure 1. FGF21 does not exert direct effects on hepatic glucose production. The liver explants from C57BL/6J mice (A, B) or primary rat hepatocytes (C, D) were incubated with rmfgf21 (2
Supplementary Figures
 Supplementary Figures Supplementary Figure 1 Characterization of stable expression of GlucB and sshbira in the CT26 cell line (a) Live cell imaging of stable CT26 cells expressing green fluorescent protein
Supplementary Figure 1 Chemokine and chemokine receptor expression during muscle regeneration (a) Analysis of CR3CR1 mrna expression by real time-pcr
 Analysis of CR3CR1 mrna expression by real time-pcr") Supplementary Figure 1 Chemokine and chemokine receptor expression during muscle regeneration (a) Analysis of CR3CR1 mrna expression by real time-pcr at day 0, 1, 4, 10 and 21 post- muscle injury. (b)
Supplementary Figure 1 Chemokine and chemokine receptor expression during muscle regeneration (a) Analysis of CR3CR1 mrna expression by real time-pcr at day 0, 1, 4, 10 and 21 post- muscle injury. (b)
Supplementary Table 1. Metabolic parameters in GFP and OGT-treated mice
 Supplementary Table 1. Metabolic parameters in GFP and OGT-treated mice Fasted Refed GFP OGT GFP OGT Liver G6P (mmol/g) 0.03±0.01 0.04±0.02 0.60±0.04 0.42±0.10 A TGs (mg/g of liver) 20.08±5.17 16.29±0.8
Supplementary Figures
 Supplementary Figures Supplementary Figure 1. Confirmation of Dnmt1 conditional knockout out mice. a, Representative images of sorted stem (Lin - CD49f high CD24 + ), luminal (Lin - CD49f low CD24 + )
Males- Western Diet WT KO Age (wks) Females- Western Diet WT KO Age (wks)
 Females- Western Diet WT KO Age (wks)") Relative Arv1 mrna Adrenal 33.48 +/- 6.2 Skeletal Muscle 22.4 +/- 4.93 Liver 6.41 +/- 1.48 Heart 5.1 +/- 2.3 Brain 4.98 +/- 2.11 Ovary 4.68 +/- 2.21 Kidney 3.98 +/-.39 Lung 2.15 +/-.6 Inguinal Subcutaneous
Relative Arv1 mrna Adrenal 33.48 +/- 6.2 Skeletal Muscle 22.4 +/- 4.93 Liver 6.41 +/- 1.48 Heart 5.1 +/- 2.3 Brain 4.98 +/- 2.11 Ovary 4.68 +/- 2.21 Kidney 3.98 +/-.39 Lung 2.15 +/-.6 Inguinal Subcutaneous
Supplementary Figures
 Supplementary Figures mir-150 regulates obesityassociated insulin resistance by controlling B cell functions Wei Ying, Alexander Tseng, Richard Cheng-An Chang, Haiqing Wang, Yu-lieh Lin, Srikanth Kanameni,
Supplementary Figure 1
 Combination index (CI) Supplementary Figure 1 2. 1.5 1. Ishikawa AN3CA Nou-1 Hec-18.5...2.4.6.8 1. Fraction affected (Fa) Supplementary Figure 1. The synergistic effect of PARP inhibitor and PI3K inhibitor
Programmed necrosis, not apoptosis, is a key mediator of cell loss and DAMP-mediated inflammation in dsrna-induced retinal degeneration
 Programmed necrosis, not apoptosis, is a key mediator of cell loss and DAMP-mediated inflammation in dsrna-induced retinal degeneration The Harvard community has made this article openly available. Please
Supplementary Information
 Supplementary Information Akt regulates hepatic metabolism by suppressing a Foxo1 dependent global inhibition of adaptation to nutrient intake Mingjian Lu 1, Min Wan 1, Karla F. Leavens 1, Qingwei Chu
Supplementary Figure 1: si-craf but not si-braf sensitizes tumor cells to radiation.
 Supplementary Figure 1: si-craf but not si-braf sensitizes tumor cells to radiation. (a) Embryonic fibroblasts isolated from wildtype (WT), BRAF -/-, or CRAF -/- mice were irradiated (6 Gy) and DNA damage
ZL ZDF ZDF + E2 *** Visceral (g) ZDF
 ZDF") Body Weight (g) 4 3 2 1 ** * ZL ZDF 6 8 1 12 14 16 Age (weeks) B * Sub-cutaneous (g) 16 12 8 4 ZL ZDF Visceral (g) 25 2 15 1 5 ZL ZDF Total fat pad weight (g) 4 3 2 1 ZDF ZL Supplemental Figure 1: Effect
Body Weight (g) 4 3 2 1 ** * ZL ZDF 6 8 1 12 14 16 Age (weeks) B * Sub-cutaneous (g) 16 12 8 4 ZL ZDF Visceral (g) 25 2 15 1 5 ZL ZDF Total fat pad weight (g) 4 3 2 1 ZDF ZL Supplemental Figure 1: Effect
Supplementary Figure 1. Deletion of Smad3 prevents B16F10 melanoma invasion and metastasis in a mouse s.c. tumor model.
 A B16F1 s.c. Lung LN Distant lymph nodes Colon B B16F1 s.c. Supplementary Figure 1. Deletion of Smad3 prevents B16F1 melanoma invasion and metastasis in a mouse s.c. tumor model. Highly invasive growth
Title: Vectorization of biomacromolecules into cells using extracellular vesicles with enhanced internalization induced by macropinocytosis
 Scientific Reports Supplementary information Title: Vectorization of biomacromolecules into cells using extracellular vesicles with enhanced internalization induced by macropinocytosis Authors: Ikuhiko
Supplementary Materials for
 www.sciencesignaling.org/cgi/content/full/8/366/ra25/dc1 Supplementary Materials for Viral entry route determines how human plasmacytoid dendritic cells produce type I interferons Daniela Bruni, Maxime
LPS LPS P6 - + Supplementary Fig. 1.
 P6 LPS - - - + + + - LPS + + - - P6 + Supplementary Fig. 1. Pharmacological inhibition of the JAK/STAT blocks LPS-induced HMGB1 nuclear translocation. RAW 267.4 cells were stimulated with LPS in the absence
SUPPLEMENTARY INFORMATION
 1. Supplementary Figures and Legends Supplementary Fig. 1. S1P-mediated transcriptional regulation of integrins expressed in OP/monocytoid cells. Real-time quantitative PCR analyses of mrna for two integrins,
(a) Significant biological processes (upper panel) and disease biomarkers (lower panel)
 Significant biological processes (upper panel) and disease biomarkers (lower panel)") Supplementary Figure 1. Functional enrichment analyses of secretomic proteins. (a) Significant biological processes (upper panel) and disease biomarkers (lower panel) 2 involved by hrab37-mediated secretory
Supplementary Figure 1. Functional enrichment analyses of secretomic proteins. (a) Significant biological processes (upper panel) and disease biomarkers (lower panel) 2 involved by hrab37-mediated secretory
Supplementary Figure 1
 Supplementary Figure 1 how HFD how HFD Epi WT p p Hypothalamus p p Inguinal WT T Liver Lean mouse adipocytes p p p p p p Obese mouse adipocytes Kidney Muscle Spleen Heart p p p p p p p p Extracellular
Keiji Kobayashi, Hidetoshi Nojiri, Yoshitomo Saita, Daichi Morikawa, Yusuke Ozawa, Kenji
 Supplementary Information Mitochondrial superoxide in osteocytes perturbs canalicular networks in the setting of age-related osteoporosis Keiji Kobayashi, Hidetoshi Nojiri, Yoshitomo Saita, Daichi Morikawa,
Effect of High-fat or High-glucose Diet on Obesity and Visceral Adipose Tissue in Mice
 ACTA ACADEMIAE MEDICINAE SINICAE 410011 0731-85295846 lixia2014@vip. 163. com 4 C57BL /6 20-1 mrna 20 P < 0. 05 O 20 P > 0. 05 M2 P < 0. 05-1 mrna P < 0. 05 P > 0. 05 R589. 2 DOI 10. 3881 /j. issn. 1000-503X.
Supplementary Materials for
 www.sciencesignaling.org/cgi/content/full/8/407/ra127/dc1 Supplementary Materials for Loss of FTO in adipose tissue decreases Angptl4 translation and alters triglyceride metabolism Chao-Yung Wang,* Shian-Sen
Supplementary Figure 1. Expression of EPO and EPOR during self-limited versus delayed
 Supplementary Figure 1. Expression of EPO and EPOR during self-limited versus delayed inflammation resolution. a: Flow cytometry analysis showing the electronic gating strategy used to identify peritoneal
EFFECTS OF NICOTINE ON HUMAN MESENCHYMAL STEM CELLS. Connor McNeil Central Catholic HS
 EFFECTS OF NICOTINE ON HUMAN MESENCHYMAL STEM CELLS Connor McNeil Central Catholic HS Purpose To determine whether nicotine causes any effects on human Mesenchymal Stem Cell (hmsc) proliferation or migration
Supplementary Figure 1.
 Supplementary Figure 1. Increased β cell mass and islet diameter in βtsc2 -/- mice up to 35 weeks A: Reconstruction of multiple anti-insulin immunofluorescence images showing differences in β cell mass
ACC ELOVL MCAD. CPT1α 1.5 *** 0.5. Reverbα *** *** 0.5. Fasted. Refed
 Supplementary Figure A 8 SREBPc 6 5 FASN ELOVL6.5.5.5 ACC.5.5 CLOCK.5.5 CRY.5.5 PPARα.5.5 ACSL CPTα.5.5.5.5 MCAD.5.5 PEPCK.5.5 G6Pase 5.5.5.5 BMAL.5.5 Reverbα.5.5 Reverbβ.5.5 PER.5.5 PER B Fasted Refed
Title of file for HTML: Supplementary Information Description: Supplementary Figures and Supplementary Table
 Title of file for HTML: Supplementary Information Description: Supplementary Figures and Supplementary Table Title of file for HTML: Peer Review File Description: Innate Scavenger Receptor-A regulates
Supplementary Figure 1. H-PGDS deficiency does not affect GI tract functions and anaphylactic reaction. (a) Representative pictures of H&E-stained
 Representative pictures of H&E-stained") 1 2 3 4 5 6 7 8 9 10 11 Supplementary Figure 1. H-PGDS deficiency does not affect GI tract functions and anaphylactic reaction. (a) Representative pictures of H&E-stained jejunum sections ( 200 magnification;
1 2 3 4 5 6 7 8 9 10 11 Supplementary Figure 1. H-PGDS deficiency does not affect GI tract functions and anaphylactic reaction. (a) Representative pictures of H&E-stained jejunum sections ( 200 magnification;
Supporting Information
 Supporting Information Charalambous et al. 10.1073/pnas.1406119111 SI Experimental Procedures Serum and Tissue Biochemistry. Enzymatic assay kits were used for determination of plasma FFAs (Roche), TAGs
Supplementary Materials for
 advances.sciencemag.org/cgi/content/full/1/9/e1500781/dc1 Supplementary Materials for pnaktide inhibits Na/K-ATPase reactive oxygen species amplification and attenuates adipogenesis Komal Sodhi, Kyle Maxwell,
SUPPLEMENTAL MATERIAL. Supplementary Methods
 SUPPLEMENTAL MATERIAL Supplementary Methods Culture of cardiomyocytes, fibroblasts and cardiac microvascular endothelial cells The isolation and culturing of neonatal rat ventricular cardiomyocytes was
Supplementary Information. Tissue-wide immunity against Leishmania. through collective production of nitric oxide
 Supplementary Information Tissue-wide immunity against Leishmania through collective production of nitric oxide Romain Olekhnovitch, Bernhard Ryffel, Andreas J. Müller and Philippe Bousso Supplementary
SUPPLEMENTARY FIGURES
 SUPPLEMENTARY FIGURES Figure S1. Effect of a HFD on the Acox gene expression in the livers of WT and IL-6 -/- mice. Expression of Acox in the livers of WT and IL-6 -/- mice fed STD or HFD determined through
Figure S1. Body composition, energy homeostasis and substrate utilization in LRH-1 hep+/+ (white bars) and LRH-1 hep-/- (black bars) mice.
 and LRH-1 hep-/- (black bars) mice.") Figure S1. Body composition, energy homeostasis and substrate utilization in LRH-1 hep+/+ (white bars) and LRH-1 hep-/- (black bars) mice. (A) Lean and fat masses, determined by EchoMRI. (B) Food and water
Figure S1. Body composition, energy homeostasis and substrate utilization in LRH-1 hep+/+ (white bars) and LRH-1 hep-/- (black bars) mice. (A) Lean and fat masses, determined by EchoMRI. (B) Food and water
Nature Immunology: doi: /ni Supplementary Figure 1. Huwe1 has high expression in HSCs and is necessary for quiescence.
 Supplementary Figure 1 Huwe1 has high expression in HSCs and is necessary for quiescence. (a) Heat map visualizing expression of genes with a known function in ubiquitin-mediated proteolysis (KEGG: Ubiquitin
Effect of BI-1 on insulin resistance through regulation of CYP2E1
 Effect of BI-1 on insulin resistance through regulation of CYP2E1 Geum-Hwa Lee 1, Kyoung-Jin Oh 2, 3, Hyung-Ryong Kim 4, Hye-Sook Han 2, Hwa-Young Lee 1, Keun-Gyu Park 5, Ki-Hoan Nam 6, Seung-Hoi Koo 2
control kda ATGL ATGLi HSL 82 GAPDH * ** *** WT/cTg WT/cTg ATGLi AKO/cTg AKO/cTg ATGLi WT/cTg WT/cTg ATGLi AKO/cTg AKO/cTg ATGLi iwat gwat ibat
 body weight (g) tissue weights (mg) ATGL protein expression (relative to GAPDH) HSL protein expression (relative to GAPDH) ### # # kda ATGL 55 HSL 82 GAPDH 37 2.5 2. 1.5 1..5 2. 1.5 1..5.. Supplementary
Nature Immunology: doi: /ni Supplementary Figure 1. Production of cytokines and chemokines after vaginal HSV-2 infection.
 Supplementary Figure 1 Production of cytokines and chemokines after vaginal HSV-2 infection. C57BL/6 mice were (a) treated intravaginally with 20 µl of PBS or infected with 6.7x10 4 pfu of HSV-2 in the
SUPPLEMENTARY INFORMATION
 DOI:.38/ncb3399 a b c d FSP DAPI 5mm mm 5mm 5mm e Correspond to melanoma in-situ Figure a DCT FSP- f MITF mm mm MlanaA melanoma in-situ DCT 5mm FSP- mm mm mm mm mm g melanoma in-situ MITF MlanaA mm mm
Solid-in-oil peptide nanocarriers for transcutaneous cancer vaccine delivery. against melanoma
 Supplementary Information for Solid-in-oil peptide nanocarriers for transcutaneous cancer vaccine delivery against melanoma Rie Wakabayashi,,a,b Masato Sakuragi,,a Shuto Kozaka, a Yoshiro Tahara, a Noriho
Supplementary Information. MicroRNA-33b knock-in mice for an intron of sterol regulatory
 Supplementary Information MicroRNA-33b knock-in mice for an intron of sterol regulatory element-binding factor 1 (Srebf1) exhibit reduced HDL-C in vivo Takahiro Horie, Tomohiro Nishino, Osamu Baba, Yasuhide
AAV-TBGp-Cre treatment resulted in hepatocyte-specific GH receptor gene recombination
 AAV-TBGp-Cre treatment resulted in hepatocyte-specific GH receptor gene recombination Supplementary Figure 1. Generation of the adult-onset, liver-specific GH receptor knock-down (alivghrkd, Kd) mouse
Mesenchymal Stem Cells Reshape and Provoke Proliferation of Articular. State Key Laboratory of Bioreactor Engineering, East China University of
 Mesenchymal Stem Cells Reshape and Provoke Proliferation of Articular Chondrocytes by Paracrine Secretion Lei Xu, Yuxi Wu, Zhimiao Xiong, Yan Zhou, Zhaoyang Ye *, Wen-Song Tan * State Key Laboratory of
We obtained Male C57BL/6J, ob/ob, and Cd8a-deficient mice from Charles River Japan
 Supplementary Methods Animal models We obtained Male C57BL/6J, ob/ob, and Cd8a-deficient mice from Charles River Japan or Jackson Laboratories. All mice were housed under a 12-h light-dark cycle and allowed
Quantitative Real-Time PCR was performed as same as Materials and Methods.
 Supplemental Material Quantitative Real-Time PCR Quantitative Real-Time PCR was performed as same as Materials and Methods. Expression levels in the aorta were normalized to peptidylprolyl isomerase B
Supplement Material. Spleen weight (mg) LN cells (X106) Acat1-/- Acat1-/- Mouse weight (g)
 LN cells (X106) Acat1-/- Acat1-/- Mouse weight (g)") Supplement Material A Spleen weight (mg) C Mouse weight (g) 1 5 1 2 9 6 3 2 5 2 1 5 Male LN cells (X16) 4 ** ** Female B 3 2 1 Supplemental Figure I. Spleen weight (A), Inguinal lymph node (LN) cell number
Supplement Material A Spleen weight (mg) C Mouse weight (g) 1 5 1 2 9 6 3 2 5 2 1 5 Male LN cells (X16) 4 ** ** Female B 3 2 1 Supplemental Figure I. Spleen weight (A), Inguinal lymph node (LN) cell number
Supplementary material page 1/10
 Supplementary Figure 1. Metoprolol administration during ongoing AMI reduces MVO in STEMI patients (a, b) Complete representative CMR exams (short-axis covering the entire left ventricle (LV) from base
ACTH Enhances Lipid Accumulation in Bone-marrow derived Mesenchymal stem cells undergoing adipogenesis
 ACTH Enhances Lipid Accumulation in Bone-marrow derived Mesenchymal stem cells undergoing adipogenesis Thomas Rhodes a, Michelle Pazienza a and Jodi F. Evans a ACTH is a major hormone of the stress axis
Supplementary data Supplementary Figure 1 Supplementary Figure 2
 Supplementary data Supplementary Figure 1 SPHK1 sirna increases RANKL-induced osteoclastogenesis in RAW264.7 cell culture. (A) RAW264.7 cells were transfected with oligocassettes containing SPHK1 sirna
Supplemental Table 1: Demographics and characteristics of study participants. Male, n (%) 3 (20%) 6 (50%) Age, years [mean ± SD] 33.3 ± ± 9.
![Supplemental Table 1: Demographics and characteristics of study participants. Male, n (%) 3 (20%) 6 (50%) Age, years [mean ± SD] 33.3 ± ± 9.](/thumbs/90/103696086.jpg "Supplemental Table 1: Demographics and characteristics of study participants. Male, n (%) 3 (20%) 6 (50%) Age, years [mean ± SD] 33.3 ± ± 9.") SUPPLEMENTAL DATA Supplemental Table 1: Demographics and characteristics of study participants Lean (n=15) Obese (n=12) Male, n (%) 3 (20%) 6 (50%) Age, years [mean ± SD] 33.3 ± 9.5 44.8 ± 9.1 White, n
SUPPLEMENTAL DATA Supplemental Table 1: Demographics and characteristics of study participants Lean (n=15) Obese (n=12) Male, n (%) 3 (20%) 6 (50%) Age, years [mean ± SD] 33.3 ± 9.5 44.8 ± 9.1 White, n
Male 30. Female. Body weight (g) Age (weeks) Age (weeks) Atg7 f/f Atg7 ΔCD11c
 Age (weeks) Age (weeks) Atg7 f/f Atg7 ΔCD11c") ody weight (g) ody weight (g) 34 3 Male 3 27 Female 26 24 22 18 7 9 11 13 15 17 19 21 23 21 18 15 7 9 11 13 15 17 19 21 23 Age (weeks) Age (weeks) Supplementary Figure 1. Lean phenotypes in mice regardless
ody weight (g) ody weight (g) 34 3 Male 3 27 Female 26 24 22 18 7 9 11 13 15 17 19 21 23 21 18 15 7 9 11 13 15 17 19 21 23 Age (weeks) Age (weeks) Supplementary Figure 1. Lean phenotypes in mice regardless
Supplementary information
 Supplementary information Intrahepatic myeloid cell-aggregates enable local CD8 + T cell expansion and successful immunotherapy against chronic viral liver infection Li- Rung Huang, Dirk Wohlleber, Florian
Supplementary Figure 1. Validation of astrocytes. Primary astrocytes were
 Supplementary Figure 1. Validation of astrocytes. Primary astrocytes were separated from the glial cultures using a mild trypsinization protocol. Anti-glial fibrillary acidic protein (GFAP) immunofluorescent
Supplementary Figure 1
 Supplementary Figure 1 Supplementary Figure 1 Schematic depiction of the tandem Fc GDF15. Supplementary Figure 2 Supplementary Figure 2 Gfral mrna levels in the brains of both wild-type and knockout Gfral
University of Groningen. Non-alcoholic fatty liver disease Sheedfar, Fareeba
 University of Groningen Non-alcoholic fatty liver disease Sheedfar, Fareeba IMPORTANT NOTE: You are advised to consult the publisher's version (publisher's PDF) if you wish to cite from it. Please check