Supplemental Information. Increased 4E-BP1 Expression Protects. against Diet-Induced Obesity and Insulin. Resistance in Male Mice
|
|
|
- Garry Ferdinand Dalton
- 5 years ago
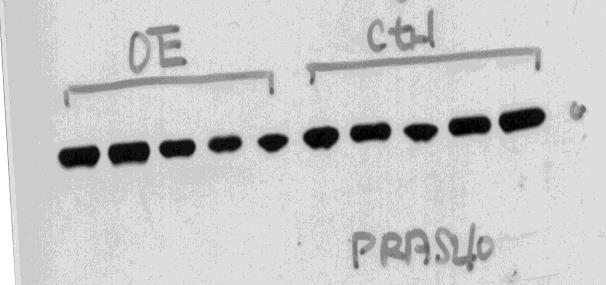
- Views:
Transcription
1 Cell Reports, Volume 16 Supplemental Information Increased 4E-BP1 Expression Protects against Diet-Induced Obesity and Insulin Resistance in Male Mice Shih-Yin Tsai, Ariana A. Rodriguez, Somasish G. Dastidar, Elizabeth Del Greco, Kaili Lia Carr, Joanna M. Sitzmann, Emmeline C. Academia, Christian Michael Viray, Lizbeth Leon Martinez, Brian Stephen Kaplowitz, Travis D. Ashe, Albert R. La Spada, and Brian K. Kennedy
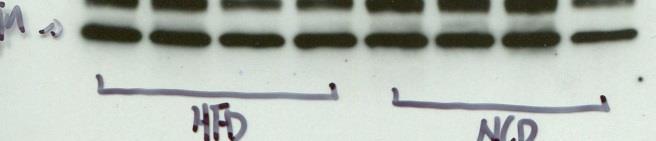
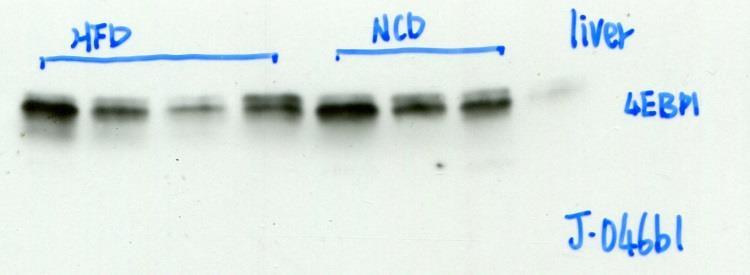
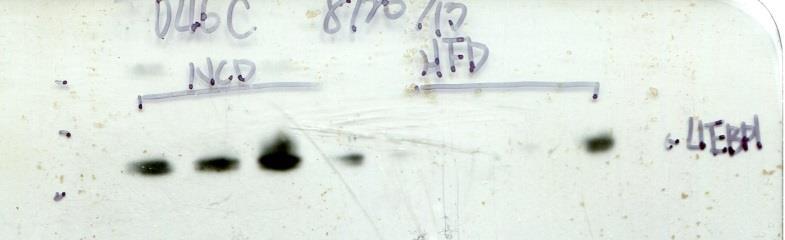
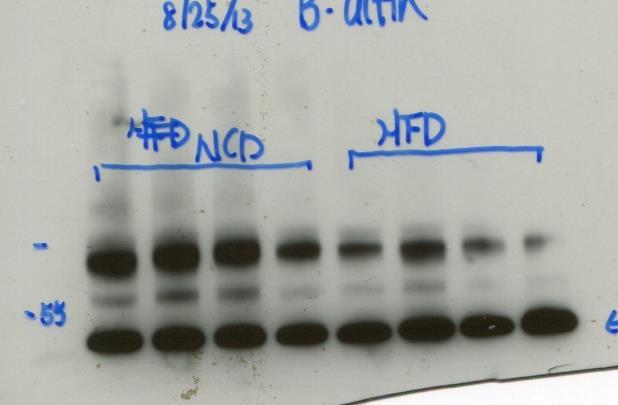
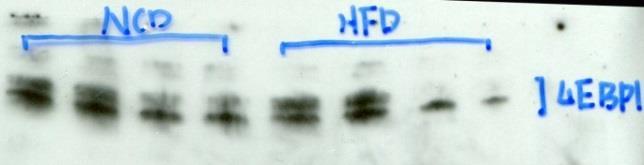
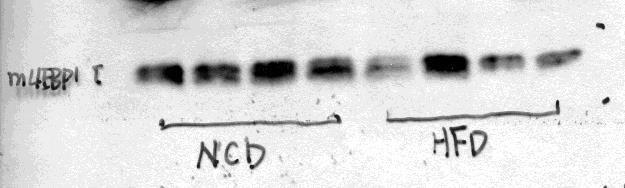
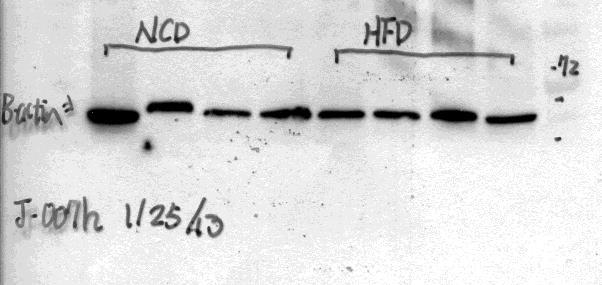
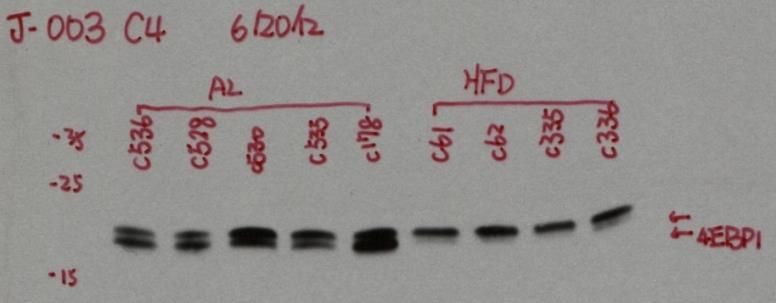
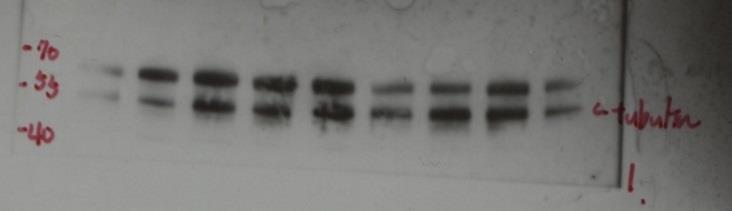
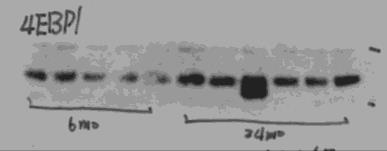
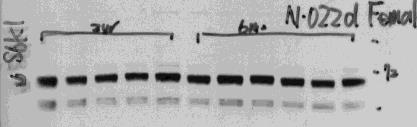
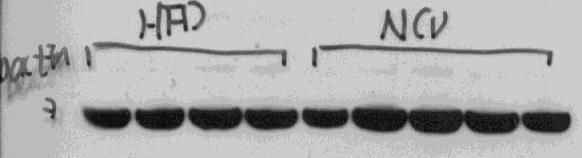
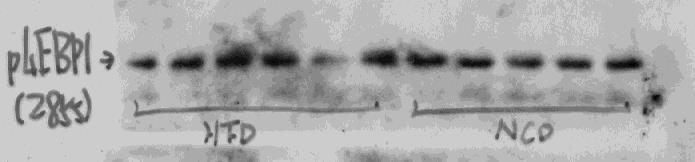
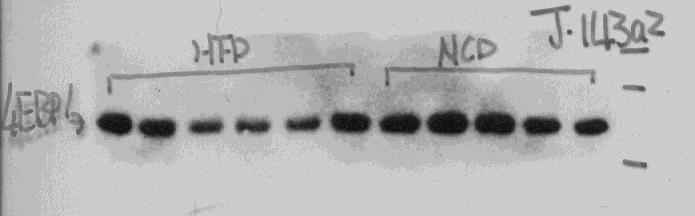
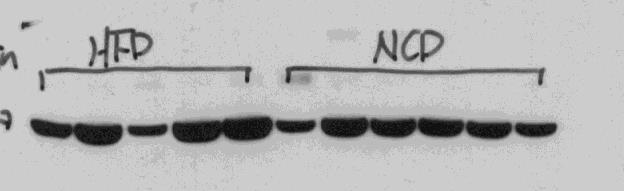
2 Supplementary Information Supplemental Figure Legend Figure S1 is related to Figure 1 Supplementary Figure 1- Male C57BL/6J mice are sensitizing to diet-induced obesity and insulin resistance and increasing S6 activities in HFD-fed C57BL/6J mice. A. Fat mass measurement in wild-type C57BL/6J male and female mice on a normal chow and HFD at 6 months of age. B. Plasma glucose measurement in 6-hr-fasting wild-type C57BL/6J male and female mice on a normal chow and HFD at 6 months of age. C. Insulin challenge assay in 6-hr-fasting wild-type C57BL/6J male and female mice on a HFD at 6 months of age (4). D. Plasma triglyceride measurement in 6-hr-fasting wild-type C57BL/6J male and female mice on a normal chow and HFD at 6 months of age. E. Western blot of phosphorylated S6 at Ser 235/236 and total S6 protein expression in quadriceps muscle, liver and visceral fat from normal-diet-fed and HFD-fed wild-type mice at 6 months of age. F. Quantification of western blot of phosphorylated S6 at Ser 235/236 normalized with total S6 expression, relative to normal-diet-fed samples. All graphs are plotted as means ± SEM of n, number of mice used in each analysis. Number of samples analyzed indicated in figure. P values were calculated by a two-way ANOVA [(A), (B), (D) and (F)], and two-way ANOVA for repeated measures [(C)] with Bonferroni post-tests to compare replicate means by row. P value of the cross comparison from the other groups was labeled P<0.05;P<0.01; P< Figure S2 is related to Figure 2 Supplementary Figure 2- Decreasing 4E-BP1 expression in HFD-fed male C57BL/6J mouse tissues and acute inflammation treatment decreases 4E-BP1 expression in wild-type MEFs. A. Western blot of 4E-BP1 and housekeeping genes (βactin and αtubulin) protein expression in quadriceps muscle, and visceral fat from normal-diet-fed and HFD-fed wild-type male mice at 6 months of age. Each lane represents individual mice fed with indicated diet. 4EBP1 indicates longer exposure. B. Quantification of western blot of 4E-BP1expression normalized with housekeeping genes relative to normal diet fed samples.
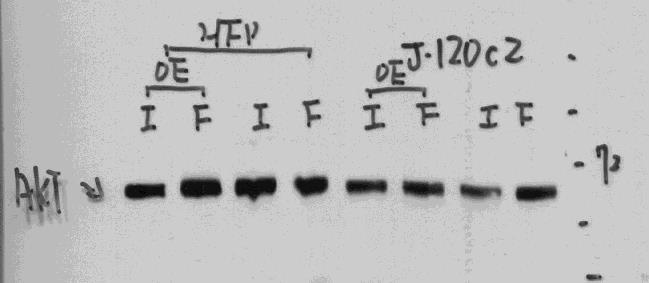
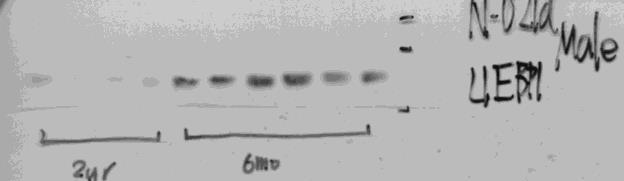
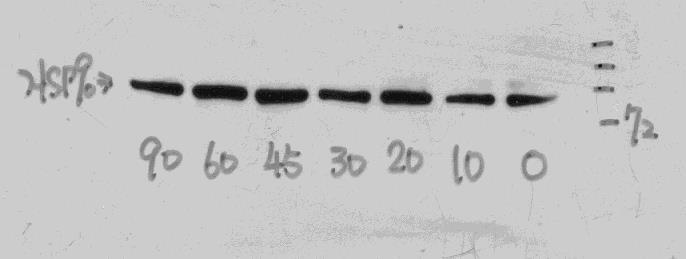
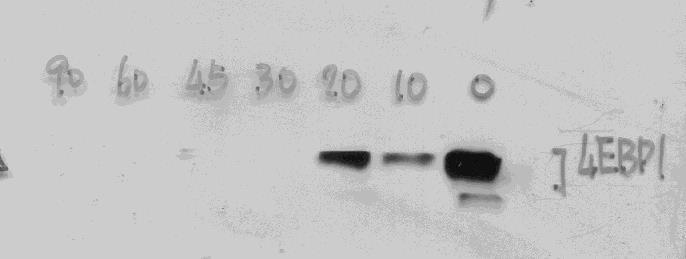
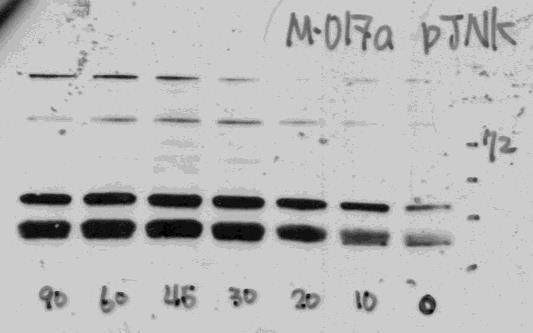
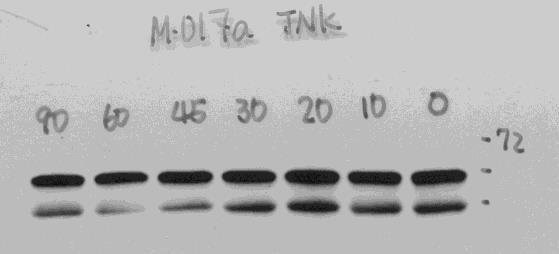
3 C. Quantification of western blot of 4E-BP1expression normalized with housekeeping gene, relative to male from normal diet fed samples in quadriceps muscle. P values were calculated by one-tailed unpaired student s t-test. D. Quantification of western blot of phosphorylated 4EBP1 at Thr 37/46 normalized with total 4EBP1 expression, relative to normal-diet-fed samples. E. Western blot of 4E-BP1 and housekeeping genes (αtubulin) protein expression in visceral fat from normal-diet-fed and HFD-fed wild-type male mice at 6 months of age. Each lane represents individual mice fed with indicated diet. F. Quantification of western blot of 4E-BP1expression normalized with housekeeping gene, HSP90, or phosphorylated JNK at Thr183/Tyr185 normalized with total JNK expression relative to LPS non-treated samples. () G. Wild-type MEFs were treated with LPS at indicated time intervals. Samples of cell lysates were analyzed by Western blot of 4E-BP1, pjnk (indicated inflammation), JNK and HSP90 (loading control). All graphs are plotted as means ± SEM of n, number of mice used in each analysis. Number of samples analyzed indicated in figure. P values were calculated by a two-way ANOVA with Bonferroni post-tests to compare replicate means by row. Figure S3 is related to Figure 3 Supplementary Figure 3- Generation of 4EBP1-OE transgenic mice. A. Construct of 4E-BP1 transgenic allele. The expression of transgenic 4E-BP1 is under the control of the chicken β actin promoter. B. Western blot of 4E-BP1 protein expression in quadriceps muscle, liver, visceral fat and brown adipose tissues from normal-diet-fed male mice at 2 months of age. C. Western blot of phosphorylation of 4E-BP1 at Ser 65 in visceral fat of 4EBP1-OE transgenic and wild-type male mice before (-) or after (+) insulin stimulation on a normal chow at 2-months of age. D. Western blot of cap binding assay to analyze eif4e-eif4g complex formation in skeletal muscle. The translation initiation complex was pull down by the cap analog m7gtp-sepharose and western blotted with antibodies against eif4g, eif4e, or 4E-BP1. E. Quantification of cap binding assays on eif4g level, which associated with translation initiation complex normalized to control. P values were calculated by one-tailed unpaired student s t-test.
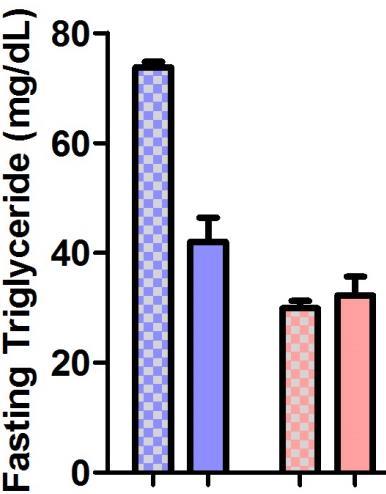
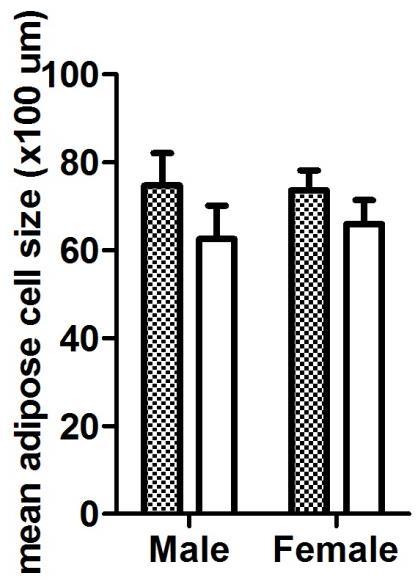
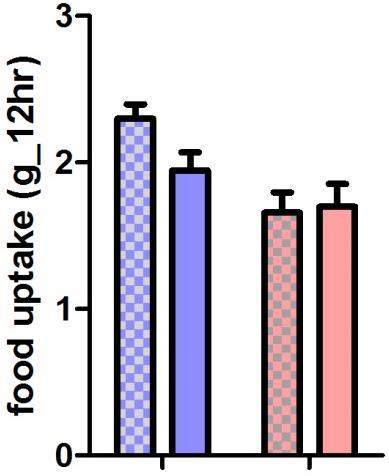
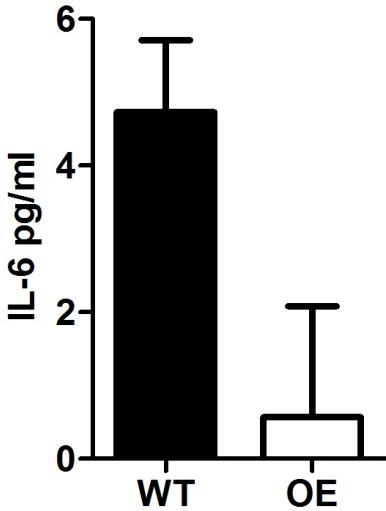
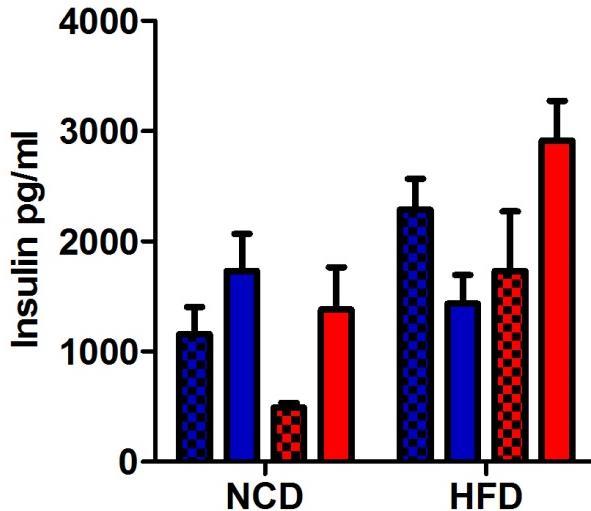
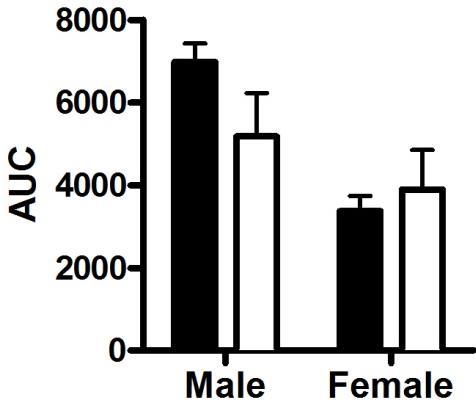
4 F. Representative pictures of Oil-red stained liver section and Hematoxylin & Eosin stained sections on skin, visceral fat, brown adipose and quadriceps muscle from 6-month-old mice fed a normal chow, scale bar = 100µm. ( per group) G. Body weight measurement in 4EBP1-OE transgenic and wild-type mice on a normal chow (~11). H. Plasma glucose measurement in 6-hr-fasting 4EBP1-OE transgenic and wild-type mice on a normal chow. P values were calculated by a two-way ANOVA with Bonferroni post-tests to compare replicate means by row. All graphs are plotted as means ± SEM of n, number of mice used in each analysis. Figure S4 is related to Figure 3 Supplementary Figure 4- Measurement of metabolic homeostasis of 4EBP1-OE transgenic and wild-type mice at 6 month-old of age. A. Glucose tolerance assay in 6-hr-fasting 4EBP1-OE transgenic and wild-type mice (-11). B. Insulin challenge assay in 6-hr-fasting 4EBP1-OE transgenic and wild-type mice (). C. Fat mass measurement in fasting 4EBP1-OE transgenic and wild-type mice. D. Plasma triglyceride measurement in 6-hr-fasting 4EBP1-OE transgenic and wild-type mice. E. Quantification of adipose cell size in visceral fat of 4EBP1-OE transgenic and wild-type mice (n=2-5). F. Analysis of the mean adipose cell size in visceral fat of 4EBP1-OE transgenic and wild-type mice from C. (n=2-5). G. Quantification of western blot of UCP1expression normalized with housekeeping gene, HSP90, relative to male samples in brown adipose tissues. H. Food intake was measured in 3-night period of time in 4EBP1-OE transgenic and wild-type mice on a HFD at 6 month-old of age. I. Serum IL-6 was measured in 4EBP1-OE transgenic and wild-type male mice on HFD. J. Serum Insulin measurement in 6-hr-fasting 4EBP1-OE transgenic and wild-type mice on HFD. K. Insulin challenge assay in 6-hr-fasting 4EBP1-OE transgenic and wild-type mice on a HFD at 6 month-old of age (n=9). L. The measurement of area under curve from (K).
5 All graphs are plotted as means ± SEM of n, number of mice used in each analysis. Number of samples analyzed indicated in figure. P values were calculated by a two-way ANOVA for repeated measures [(A) (B), and (K)] and two-way ANOVA [(C), (D), (E), (F), (H), (J), and (L)] with Bonferroni post-tests to compare replicate means by row, and P values were calculated by one-tailed unpaired student s t-test [(G) and (I)]. P value of the cross comparison from the other groups was labeled P<0.05;P<0.01; P< Figure S5 is related to Figure 3 Supplementary Figure 5- Male 4EBP1-OE transgenic mice protect from diet induced metabolic dysfunction. A. Representative pictures of Oil-red stained liver section characterizing lipid accumulation, Hematoxylin & Eosin stained adipose sections on skin, inguinal fat, brown adipose, and visceral fat, and F4/80 IHC stained visceral fat detecting macrophage infiltration from 6-month-old mice fed a HFD, scale bar = 100 µm ( per group). B. Quantification of western blot of FGF21 expression normalized with housekeeping gene, HSP90, relative to wild-type samples in livers from HFD-fed male mice at 6-months of age. Graph is plotted as means ± SEM of n, number of mice used in each analysis. Number of samples analyzed indicated in figure. P values were calculated by one-tailed unpaired student s t- test. C. Western blot of phosphorylation of AKT1 at Ser 473 and total AKT1 protein expression in liver of 4EBP1-OE transgenic and wild-type mice before (-) or after (+) insulin stimulation on a normal chow or HFD at 6 month-old of age. D. Western blot of phosphorylation of AKT1 at Ser 473 and total AKT1 protein expression in skeletal muscle of 4EBP1-OE transgenic and wild-type mice before (-) or after (+) insulin stimulation on a normal chow or HFD at 6 month-old of age. E. Western blot of phosphorylation of AKT1 at Ser 473 and total AKT1 protein expression in visceral fat of 4EBP1-OE transgenic and wild-type female mice before (-) or after (+) insulin stimulation on a normal chow or HFD at 6 month-old of age. F. Quantification of western blot of phosphorylation AKT1 at Ser 473 normalized with total AKT1 expression, relative to paired fasting sample. ~6. Figure S6 is related to Figure 3
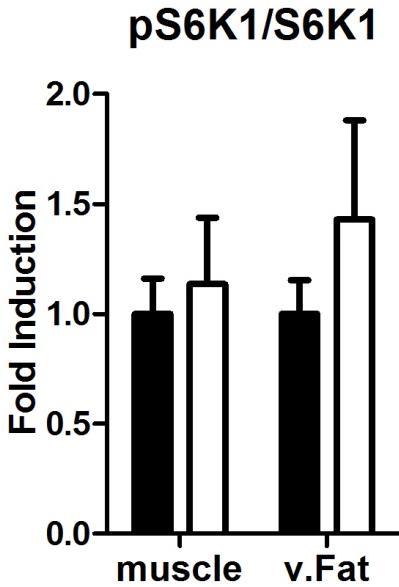
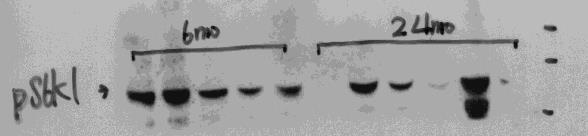
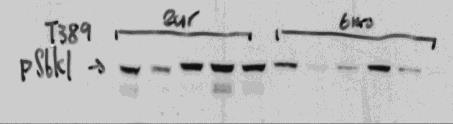
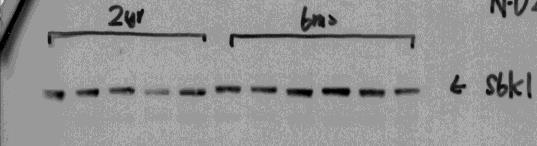
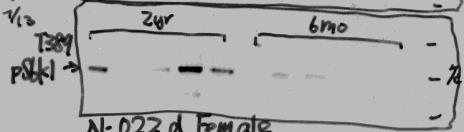
6 Supplementary Figure 6- The assessment of other mtorc1 target signaling in HFD-fed wild-type and 4EBP1-OE transgenic mice A. Quantification of western blot of phosphorylated S6K1 at Thr 389 normalized with total S6K1 expression, relative to wild-type samples in quadriceps muscle and visceral fat from HFDfed mice at 6-months of age. B. Quantification of western blot of phosphorylated S6 at Ser 235/236 normalized with total S6 expression, relative to wild-type samples in liver and quadriceps from HFD-fed mice at 6-months of age. C. Quantification of western blot of phosphorylated PRAS40 at Ser 183 normalized with total PRAS40 expression, relative to relative to normal diet fed samples in wild-type mouse visceral fat. D. Quantification of western blot of phosphorylated PRAS40 at Ser 183 normalized with total PRAS40 expression, relative to wild-type samples from HFD-fed male mice at 6-months of age. E. Quantification of western blot of DEPTOR expression normalized with housekeeping gene, HSP90, relative to normal diet fed samples in male wild-type mouse tissues. F. Quantification of western blot of DEPTOR expression normalized with housekeeping gene, HSP90, relative to wild-type samples in visceral fat from HFD-fed male mice at 6-months of age. P values were calculated by one-tailed unpaired student s t-test. All graphs are plotted as means ± SEM of n, number of mice used in each analysis. Number of samples analyzed indicated in figure. P values were calculated by a two-way ANOVA with Bonferroni post-tests to compare replicate means by row. Figure S7 is related to Figure 4 Supplementary Figure 7- Generation of 4E-BP1 double transgenic mice. A. Western blot of 4E-BP1 protein expression in quadriceps muscle from normal-diet-fed male Tg-4EBP1wt-muscle mice at 2-months of age. B. Western blot of 4E-BP1 protein expression in visceral fat muscle from normal-diet-fed male Tg-4EBP1wt-fat mice at 2-months of age. C. Body weight measurement in Tg-4EBP1wt-fat and Tg-4EBp1wt-muscle female mice on a normal chow and HFD (-16). D. Fasting glucose measurement in Tg-4EBP1wt-fat and Tg-4EBp1wt-muscle mice on a normal chow and HFD at 6-months of age (-16).
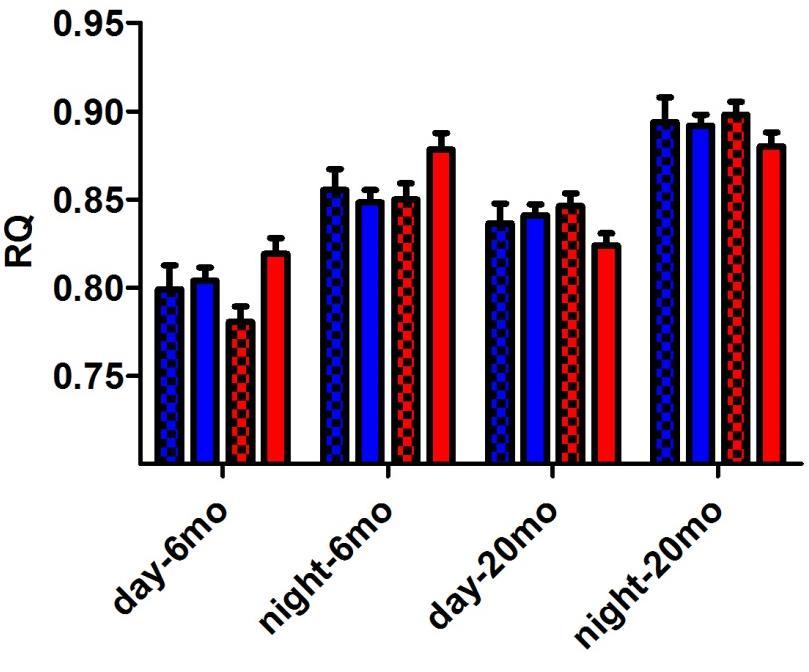
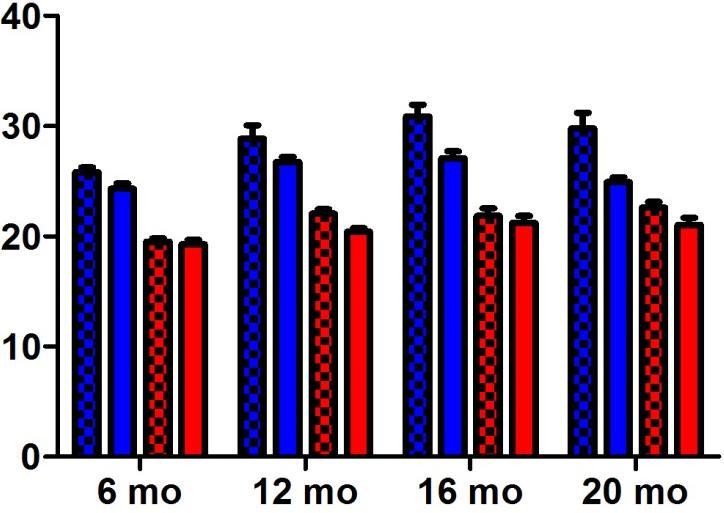
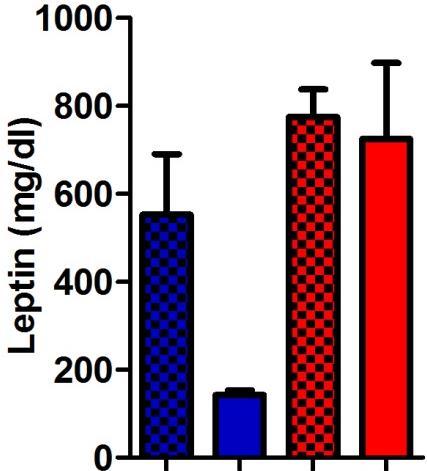
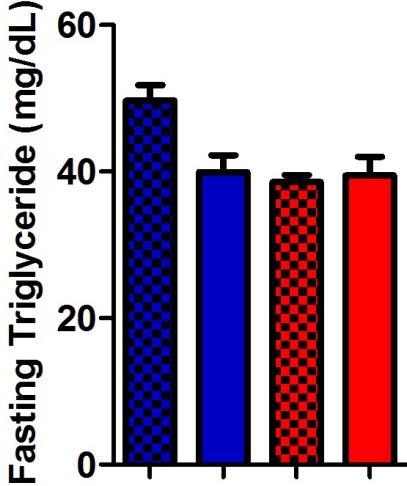
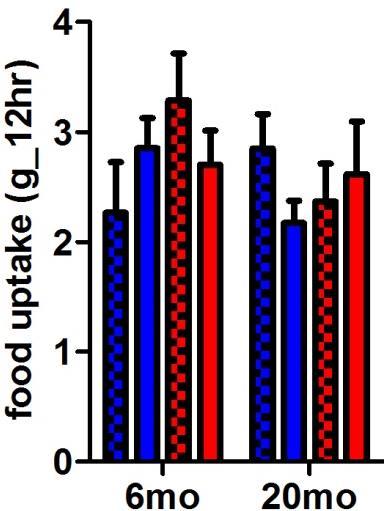
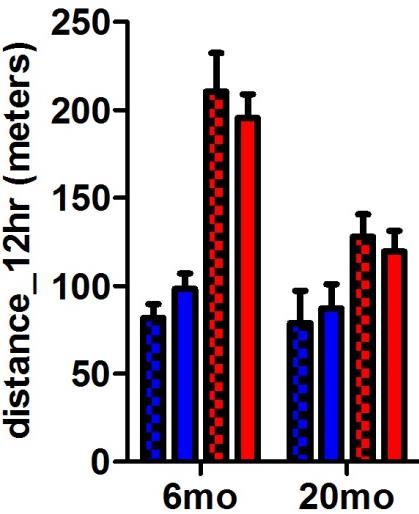
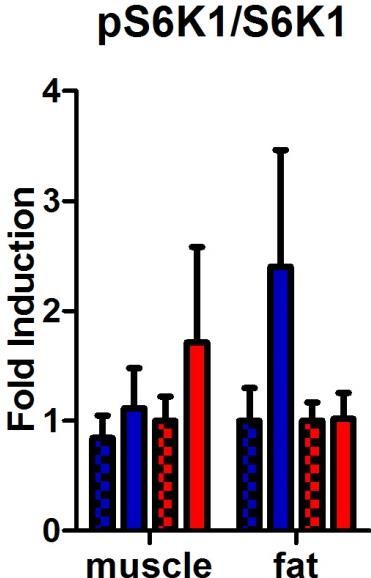
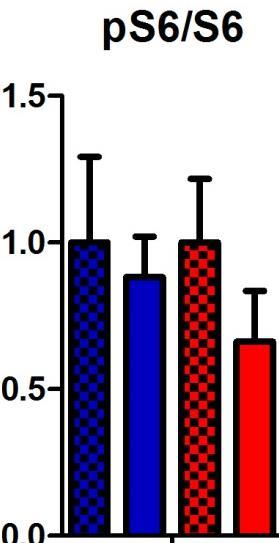
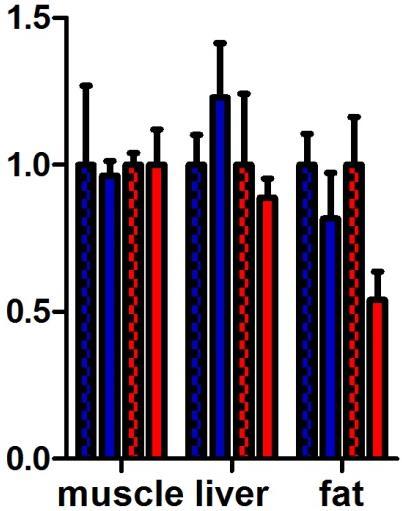
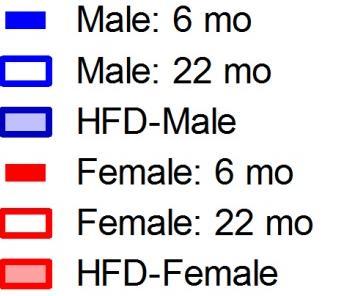
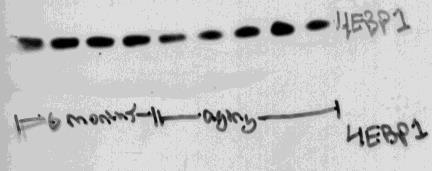
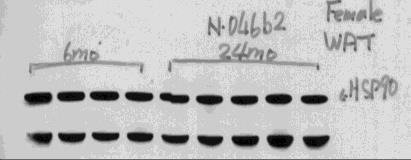
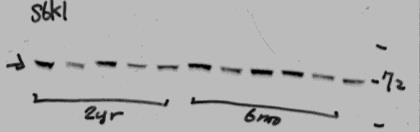
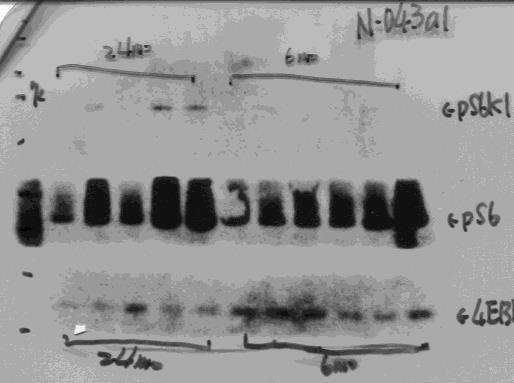
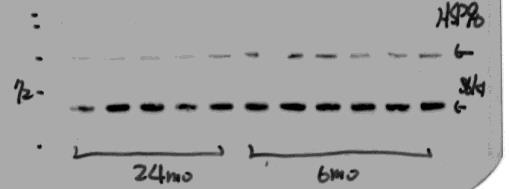
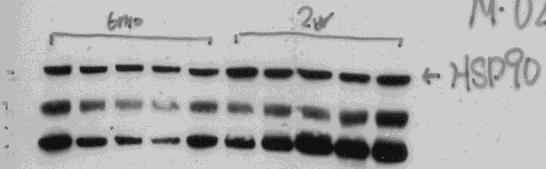
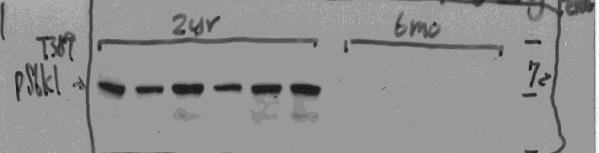
7 E. Plasma glucose measurement in 6-hr-fasting Tg-4EBP1wt-fat and Tg-4EBp1wt-muscle female mice on a normal chow and HFD 6-months of age (-16). F. Insulin challenge assay in 6-hr-fasting Tg-4EBP1wt-fat and Tg-4EBp1wt-muscle female mice on a HFD 6-months of age (-16). G. Western blot of 4E-BP1-Serine 65 phosphorylation in visceral fat muscle from normal-dietfed male Tg-4EBP1wt-fat mice 2-months of age. H. Western blot of 4E-BP1 Serine 65 phosphorylation in quadriceps muscle from normal-dietfed male Tg-4EBP1wt-muscle mice 2-months of age. All graphs are plotted as means ± SEM of n, number of mice used in each analysis. Number of samples analyzed indicated in figure. P values were calculated by a two-way ANOVA [(D)] and a two-way ANOVA for repeated measures [(E), and (F)] with Bonferroni post-tests to compare replicate means by row. [P<0.001, NCD vs HFD cross genotype] Figure S8 is related to Figure 5 Supplementary Figure 8- Metabolic parameters of 4EBP1-OE transgenic and wild-type mice under a normal chow during aging. A. Lean mass measurement in 4EBP1-OE transgenic and wild-type mice on a normal chow during aging. B. Plasma leptin measurement in 4EBP1-OE transgenic and wild-type mice on a normal chow at 6 month of age. C. Plasma triglyceride measurement in 6-hr-fasting 4EBP1-OE transgenic and wild-type mice on a normal chow at 6 months of age. D. Food consumption measured in 3 day-night period of time in 6 month-old and 20 month-old 4EBP1-OE transgenic and wild-type mice fed a normal chow. E. Home cage activity in 3 day-night period of time in 6 month-old and 20 month-old 4EBP1-OE transgenic and wild-type mice fed a normal chow. F. Respiratory exchange ratio in 3 day-night period of time in 6 month-old and 20 month-old 4EBP1-OE transgenic and wild-type mice fed a normal chow. G. Quantification of western blot of phosphorylated S6K1 at Thr 389 normalized with total S6K1 expression, relative to wild-type samples in quadriceps muscle and visceral fat from 24- months of age mice. H. Quantification of western blot of phosphorylated S6 at Ser 235/236 normalized with total S6 expression, relative to wild-type samples in liver from 24-months of age mice.
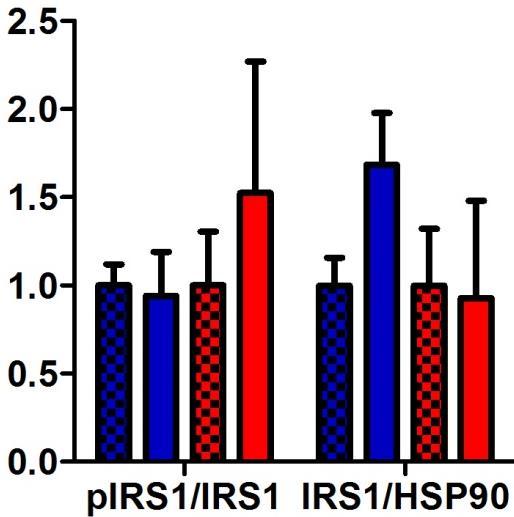
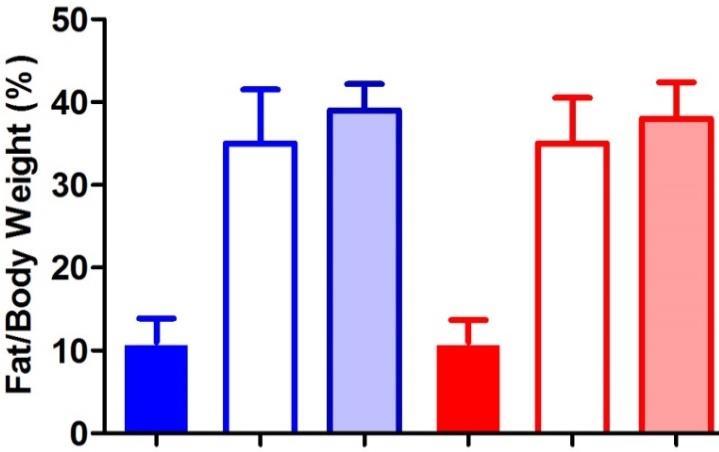
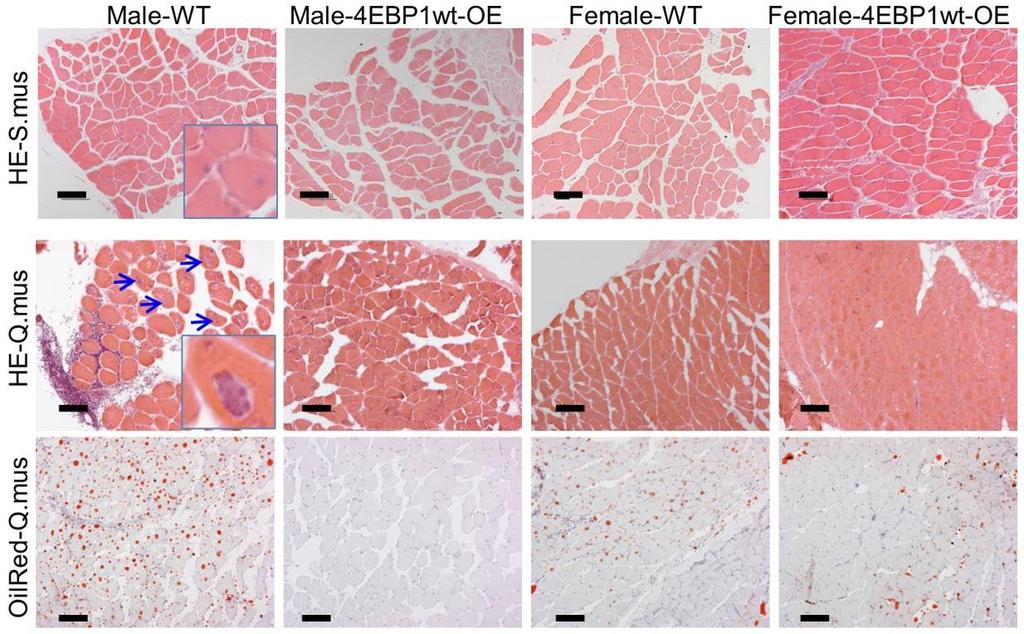
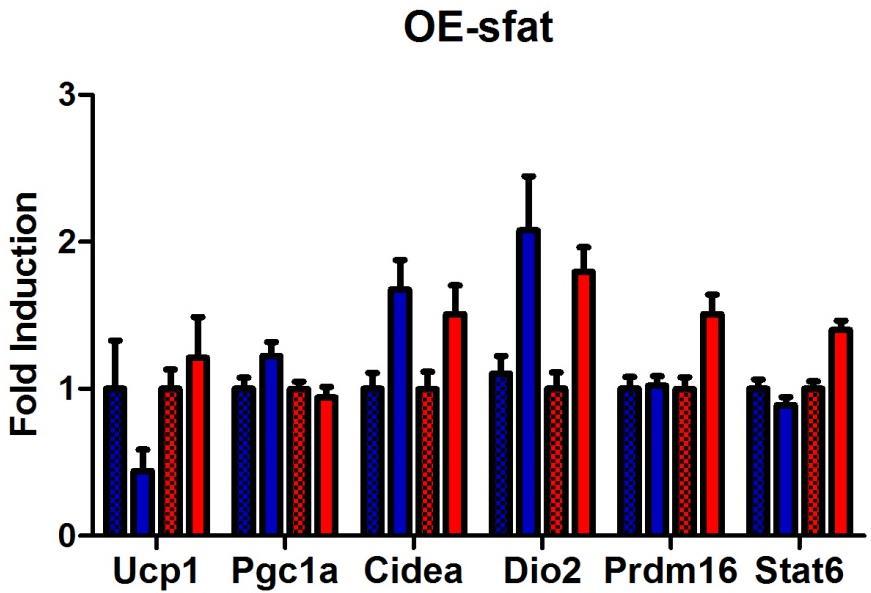
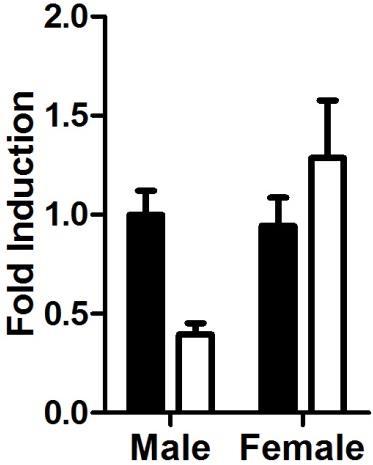
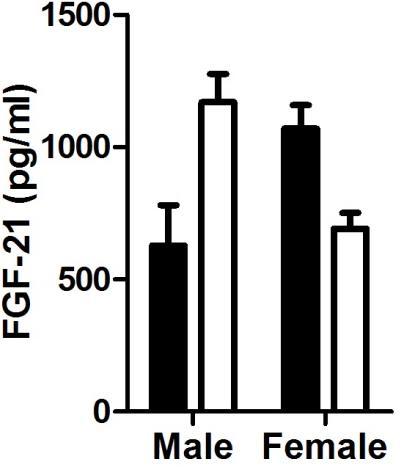
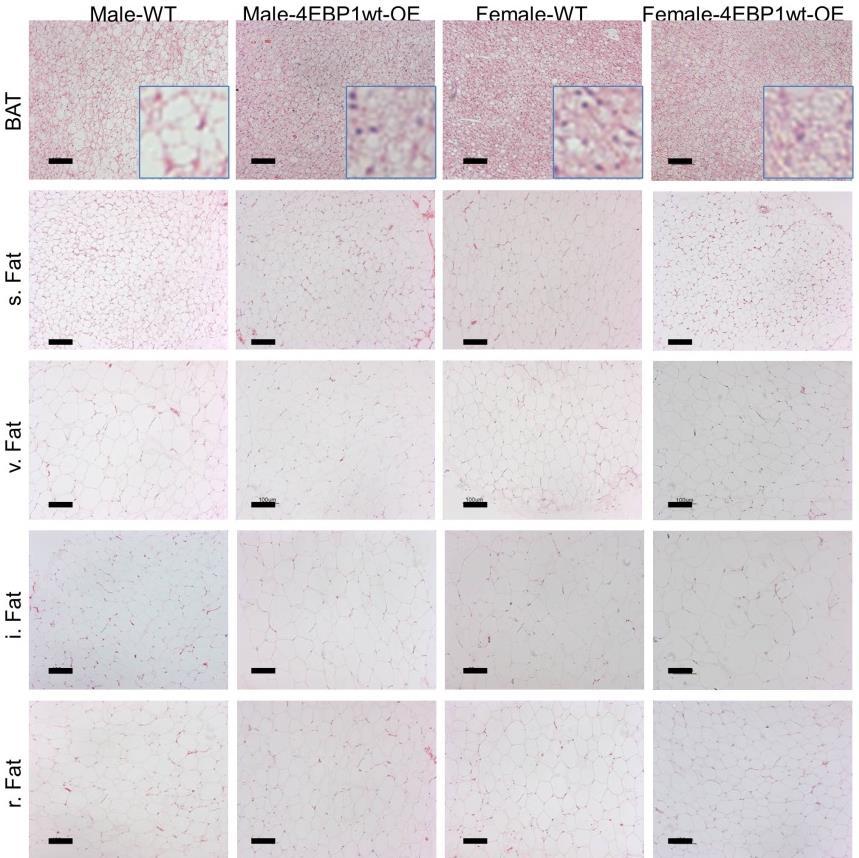
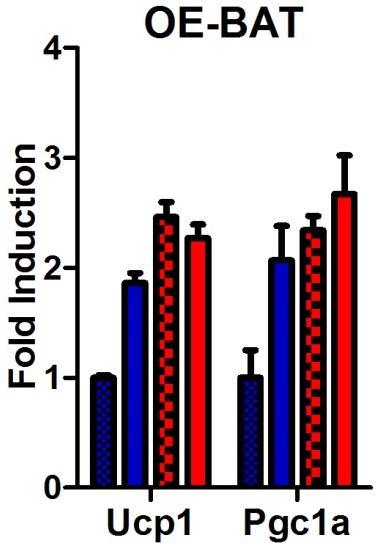
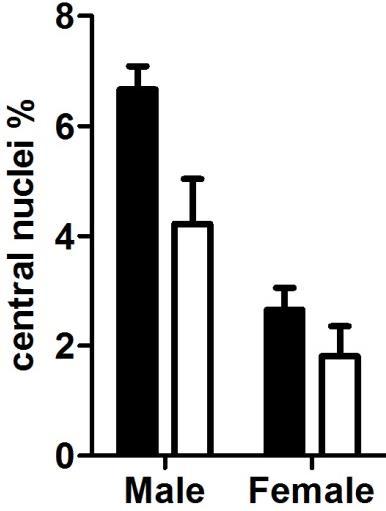
8 I. Quantification of western blot of phosphorylated IRS1 at Ser 636/639 normalized with total IRS1 expression or IRS1 expression normalized with housekeeping gene, HSP90, relative to wild-type samples in visceral fat from 24-months of age mice. J. Quantification of western blot of puromycin incorporation in total protein normalized with housekeeping gene, HSP90, relative to wild-type samples from 24-months of age mice. K. Fat mass measurement normalized with body weight in wild-type C57BL/6J male and female mice. All graphs are plotted as means ± SEM of n, number of mice used in each analysis. P values were calculated by a two-way ANOVA with Bonferroni post-tests to compare replicate means by row. P value of the cross comparison from the other groups was labeled P<0.05;P<0.01; P< Figure S9 is related to Figure 5 Supplementary Figure 9- The assessment of aging 4EBP1-OE transgenic mouse fat and skeletal muscle tissues. A. Quantification of western blot of phosphorylated PRAS40 at Ser 183 normalized with total PRAS40 expression, relative to relative to wild-type samples in 24-months of age mouse visceral fat. B. Plasma FGF21 measurement in 6-hr-fasting 4EBP1-OE transgenic and wild-type mice on a normal chow at 18 months of age. C. Representative pictures of Hematoxylin & Eosin stained sections on brown adipose, subcutaneous white adipose, visceral fat, inguinal fat, and retroperitoneal white adipose from 24- month-old mice on a normal chow, scale bar = 100µm. (-10 per group) D. Real-time PCR analysis of thermogenesis gene expression in subcutaneous white adipose tissues from 24-month-old mice. Fold induction was normalized to wild-type mouse samples. E. Real-time PCR analysis of Ucp-1 and Pgc-1α mrna expression in brown adipose tissues from 24-month-old mice. Fold induction was normalized to wild-type male mouse samples. F. Quantification of percentage of central nuclei in 24 month-old mouse soleus muscles. G. Representative pictures of Hematoxylin & Eosin stained sections on soleus muscle from 24- month-old mice fed a normal chow, scale bar = 100µm. (-5 per group) H. Representative pictures of Hematoxylin & Eosin and Oil-Red stained sections to detect lipid accumulation on quadriceps muscle from 24-month-old mice fed a normal chow, scale bar = 100µm (-10 per group). Blue arrows indicated vacuolated fibers.
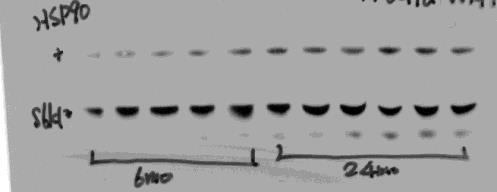
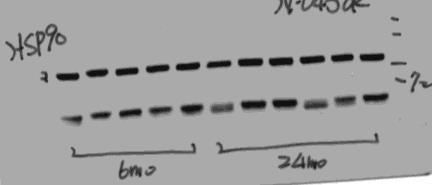
9 All graphs are plotted as means ± SEM of n, number of mice used in each analysis. Number of samples analyzed indicated in figure. P values were calculated by a two-way ANOVA with Bonferroni post-tests to compare replicate means by row. P value of the cross comparison from the other groups was labeled P<0.05;P<0.01; P< Figure S10 is related to Figure 6 Supplementary Figure 10- Increasing S6K1 activity in aging female C57BL/6J mouse liver. A. Western blot of phosphorylated S6 at Ser 235/236 and total S6 protein expression in liver. B. Quantification of western blot of phosphorylated S6 at Ser 235/236 normalized with total S6 expression, relative to 6-months old mouse samples. Number of samples analyzed indicated in figure and results are presented as means ± SEM. P values were calculated using two-way ANOVA with Bonferroni post-tests. Supplemental Experimental Procedures Cell Culture For the lipopolysaccharide (LPS) treatment, passage 5 wildtype mouse embryonic fibroblasts (MEFs) were plated and serum deprived overnight in Dulbecco s modified Eagle s medium (DMEM). The next day, they were treated with 0.5 µg/ml LPS (Sigma) and harvested at the indicated time point. Cap-binding assay and immunoprecipitation Tissues were homogenized in cold buffer A (10mM Tris ph7.5, 150mM KCl, 4mM MgCl2 and 1mM EDTA and 1% NP-40) with protease inhibitor cocktail (Roche ) and phosphatase inhibitor cocktail II and III (Sigma P5726 and P0044). For Cap-binding assay, 1.2mg of tissue lysates were incubated overnight at 4 o C with 50μl of the mrna cap analogue. m7gtp agarose (Jena Bioscience) in buffer A. The complex was washed once with buffer A. Protein complexes were eluted using 2x sample buffer, and evaluated in western blot. Protein synthesis assay A non-isotope labeled protein synthesis assay was performed as previously described using thesunset method (84, 85). Puromycin (0.04 um/g puromycin) was injected 30 minutes prior to harvesting. Protein was extracted and analyzed as stated above. Total protein was assessed
10 using the loading control, HSP90 and newly synthesized puromycin incorporated protein was detected by puromycin antibody (Gift from Dr. Philippe Pierre in INSERM).


11 liver n=28 n=21 n=27 n= A C B D E Male NCD HFD Female NCD HFD F v.fat q.muscle ps6 S S6 βactin ps6 S S6 HSP90 ps6 S S6 αtubulin Supplementary Figure 1


12 A n=18 n=2 n=16 q. muscle v.fat NCD-1 HFD-1 NCD-3 HFD-3 n=15 n=18 Male Female NCD-2 HFD-2 4EBP1 4EBP1 βactin NCD-4 HFD-4 B 4EBP1 4EBP1 αtubulin C P<0.05 P<0.05 P<0.05 D E NCD HFD p4ebp1 37/46 4EBP1 αtubulin NCD HFD p4ebp1 37/46 4EBP1 αtubulin F G LPS (min) pjnk JNK 4EBP1 HSP90 Supplementary Figure 2


13 n=9 BAT v.fat liver q.muscle A B EGFP -STOP CAGGS expression cassette wildtype 4E-BP1 wt Cre 4EBP1wt-OE 4E-BP1 wt 4E-BP1 βactin 4E-BP1 βactin m 7 GTP pulldown C 4EBP1- OE D OE WT Ctrl Insulin OE Input Ctrl E α-p4e-bp1 S65 α-p4e-bp1 S65 longer exposure α-4e-bp1 HSP90 P< 0.05 F 4E-BP1 βactin 4E-BP1 βactin G αeif4g αeif4e α4ebp1 H P<0.001 P<0.05 Supplementary Figure 3


14 A n=9 B n=21 C D E F G P=0.067 H I J K L Supplementary Figure 4


15 A B P<0.05 E Female v.fat HFD NCD 4EBP1-4EBP1- OE WT OE WT Insulin pakt S473 Akt HSP90 C HFD 4EBP1- OE Female liver NCD 4EBP1- WT OE WT HFD 4EBP1- OE Male liver NCD 4EBP1- WT OE WT Insulin pakt S473 F Akt βactin D Female s.mus HFD NCD Male s.mus HFD NCD EBP1- OE WT 4EBP1- OE WT 4EBP1- OE WT 4EBP1- OE WT Insulin pakt S473 Akt αtubulin Supplementary Figure 5


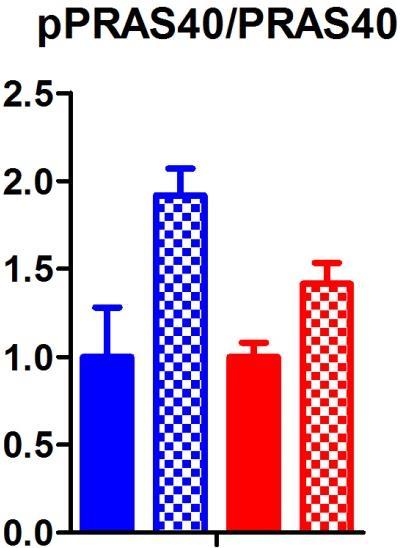
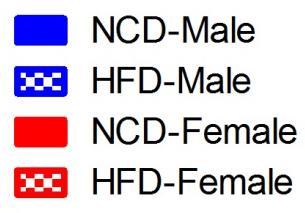
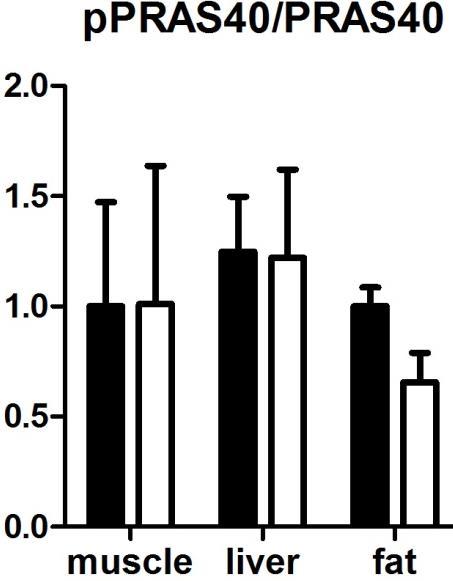

16 A B C n=9 D P<0.01 E F P<0.05 Supplementary Figure 6


17 A Ckmm-Cre B + - Fabp4-Cre Tg-4EBP1wt + - Tg-4EBP1wt α-4ebp1 α-4ebp1 α-βactin α-tubulin C E D F G Fabp4-Cre Tg-4EBP1wt H Ckmm-Cre Tg-4EBP1wt α-p4ebp1 S65 α-p4ebp1 S65 α-tubulin α-hsp90 Supplementary Figure 7
18 Supplementary Figure 8 n=9 n=9 n=9 n=14 n=16 n=14 n=13 n=13 B C n=9 A n=9 F D E n=9 n=9 n=2 I G H J K
19 n=14 n=14 n=14 n=14 n=14 n=14 Supplementary Figure 9 n=13 A B n=13 C D n=13 n=14 n=13 n=14 F E G H
20 A Male Female 24 mo. 6 mo. 24 mo. 6 mo. ps6 s235/236 ps6 s235/236 Longer exposure S6 βactin HSP90 B P<0.01 Supplementary Figure 10


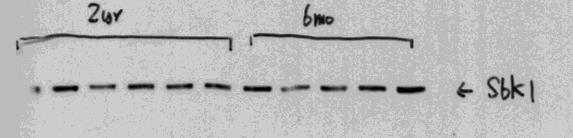
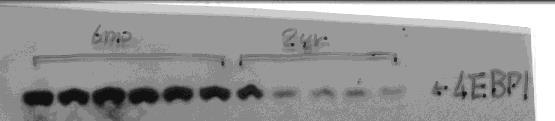
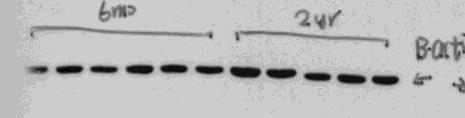
21 Uncropped scans- Fig 2 Male-muscle S6K1 Female-muscle 4E-BP1 βactin Male-liver Female-liver βactin Male-v.fat Female-v.fat

22 Uncropped scans- Fig 3


23 Male-fat Female-fat Uncropped scans- Fig 6 HSP90 Male-muscle Female-muscle Female-liver Male-liver ps6k1


24 Uncropped scans- Fig S2 S2D: Male-muscle S2D: Female-muscle Tubulin S2G


25 Uncropped scans- Fig S9A Male Female ppras40
GPR120 *** * * Liver BAT iwat ewat mwat Ileum Colon. UCP1 mrna ***
 a GPR120 GPR120 mrna/ppia mrna Arbitrary Units 150 100 50 Liver BAT iwat ewat mwat Ileum Colon b UCP1 mrna Fold induction 20 15 10 5 - camp camp SB202190 - - - H89 - - - - - GW7647 Supplementary Figure
18s AAACGGCTACCACATCCAAG CCTCCAATGGATCCTCGTTA. 36b4 GTTCTTGCCCATCAGCACC AGATGCAGCAGATCCGCAT. Acc1 AGCAGATCCGCAGCTTG ACCTCTGCTCGCTGAGTGC
 Supplementary Table 1. Quantitative PCR primer sequences Gene symbol Sequences (5 to 3 ) Forward Reverse 18s AAACGGCTACCACATCCAAG CCTCCAATGGATCCTCGTTA 36b4 GTTCTTGCCCATCAGCACC AGATGCAGCAGATCCGCAT Acc1
Muscle-specific 4E-BP1 signaling activation improves metabolic parameters during aging and obesity
 Muscle-specific 4E-BP1 signaling activation improves metabolic parameters during aging and obesity Shihyin Tsai,, Albert R. La Spada, Brian K. Kennedy J Clin Invest. 2015;125(8):2952-2964. https://doi.org/10.1172/jci77361.
Supplementary Fig. 1. GPRC5A post-transcriptionally down-regulates EGFR expression. (a) Plot of the changes in steady state mrna levels versus
 Plot of the changes in steady state mrna levels versus") Supplementary Fig. 1. GPRC5A post-transcriptionally down-regulates EGFR expression. (a) Plot of the changes in steady state mrna levels versus changes in corresponding proteins between wild type and Gprc5a-/-
Supplementary Fig. 1. GPRC5A post-transcriptionally down-regulates EGFR expression. (a) Plot of the changes in steady state mrna levels versus changes in corresponding proteins between wild type and Gprc5a-/-
Males- Western Diet WT KO Age (wks) Females- Western Diet WT KO Age (wks)
 Females- Western Diet WT KO Age (wks)") Relative Arv1 mrna Adrenal 33.48 +/- 6.2 Skeletal Muscle 22.4 +/- 4.93 Liver 6.41 +/- 1.48 Heart 5.1 +/- 2.3 Brain 4.98 +/- 2.11 Ovary 4.68 +/- 2.21 Kidney 3.98 +/-.39 Lung 2.15 +/-.6 Inguinal Subcutaneous
Relative Arv1 mrna Adrenal 33.48 +/- 6.2 Skeletal Muscle 22.4 +/- 4.93 Liver 6.41 +/- 1.48 Heart 5.1 +/- 2.3 Brain 4.98 +/- 2.11 Ovary 4.68 +/- 2.21 Kidney 3.98 +/-.39 Lung 2.15 +/-.6 Inguinal Subcutaneous
Supplementary Fig. 1 eif6 +/- mice show a reduction in white adipose tissue, blood lipids and normal glycogen synthesis. The cohort of the original
 Supplementary Fig. 1 eif6 +/- mice show a reduction in white adipose tissue, blood lipids and normal glycogen synthesis. The cohort of the original phenotypic screening was n=40. For specific tests, the
Supplementary Figure 1. DJ-1 modulates ROS concentration in mouse skeletal muscle.
 Supplementary Figure 1. DJ-1 modulates ROS concentration in mouse skeletal muscle. (a) mrna levels of Dj1 measured by quantitative RT-PCR in soleus, gastrocnemius (Gastroc.) and extensor digitorum longus
SUPPLEMENTARY INFORMATION
 doi:10.1038/nature12652 Supplementary Figure 1. PRDM16 interacts with endogenous EHMT1 in brown adipocytes. Immunoprecipitation of PRDM16 complex by flag antibody (M2) followed by Western blot analysis
General Laboratory methods Plasma analysis: Gene Expression Analysis: Immunoblot analysis: Immunohistochemistry:
 General Laboratory methods Plasma analysis: Plasma insulin (Mercodia, Sweden), leptin (duoset, R&D Systems Europe, Abingdon, United Kingdom), IL-6, TNFα and adiponectin levels (Quantikine kits, R&D Systems
control kda ATGL ATGLi HSL 82 GAPDH * ** *** WT/cTg WT/cTg ATGLi AKO/cTg AKO/cTg ATGLi WT/cTg WT/cTg ATGLi AKO/cTg AKO/cTg ATGLi iwat gwat ibat
 body weight (g) tissue weights (mg) ATGL protein expression (relative to GAPDH) HSL protein expression (relative to GAPDH) ### # # kda ATGL 55 HSL 82 GAPDH 37 2.5 2. 1.5 1..5 2. 1.5 1..5.. Supplementary
1.5 ASK1KO fed. fasted 16 hrs w/o water. Fed. 4th. 4th WT ASK1KO N=29, 11(WT), ,5(ASK1KO) ASK1KO ASK1KO **** Time [h]
![1.5 ASK1KO fed. fasted 16 hrs w/o water. Fed. 4th. 4th WT ASK1KO N=29, 11(WT), ,5(ASK1KO) ASK1KO ASK1KO **** Time [h]](/thumbs/87/97258189.jpg "1.5 ASK1KO fed. fasted 16 hrs w/o water. Fed. 4th. 4th WT ASK1KO N=29, 11(WT), ,5(ASK1KO) ASK1KO ASK1KO **** Time [h]") 7: 13: 19: 1: 7: 151117 a 151117 4th 4th b c RQ.95 KO.9.85.8.75.7 light dark light dark.65 7: 19: 7: 19: 7: Means ± SEM, N=6 RQ 1..9.8.7.6.6 KO CL (-) CL (+) ibat weight ratio (/body weight) [%].5.4.3.2.1
7: 13: 19: 1: 7: 151117 a 151117 4th 4th b c RQ.95 KO.9.85.8.75.7 light dark light dark.65 7: 19: 7: 19: 7: Means ± SEM, N=6 RQ 1..9.8.7.6.6 KO CL (-) CL (+) ibat weight ratio (/body weight) [%].5.4.3.2.1
Supplemental Table 1: Demographics and characteristics of study participants. Male, n (%) 3 (20%) 6 (50%) Age, years [mean ± SD] 33.3 ± ± 9.
![Supplemental Table 1: Demographics and characteristics of study participants. Male, n (%) 3 (20%) 6 (50%) Age, years [mean ± SD] 33.3 ± ± 9.](/thumbs/90/103696086.jpg "Supplemental Table 1: Demographics and characteristics of study participants. Male, n (%) 3 (20%) 6 (50%) Age, years [mean ± SD] 33.3 ± ± 9.") SUPPLEMENTAL DATA Supplemental Table 1: Demographics and characteristics of study participants Lean (n=15) Obese (n=12) Male, n (%) 3 (20%) 6 (50%) Age, years [mean ± SD] 33.3 ± 9.5 44.8 ± 9.1 White, n
SUPPLEMENTAL DATA Supplemental Table 1: Demographics and characteristics of study participants Lean (n=15) Obese (n=12) Male, n (%) 3 (20%) 6 (50%) Age, years [mean ± SD] 33.3 ± 9.5 44.8 ± 9.1 White, n
Supplementary Materials for
 www.sciencesignaling.org/cgi/content/full/7/308/ra4/dc1 Supplementary Materials for Antipsychotics Activate mtorc1-dependent Translation to Enhance Neuronal Morphological Complexity Heather Bowling, Guoan
Supplementary Table 2. Plasma lipid profiles in wild type and mutant female mice submitted to a HFD for 12 weeks wt ERα -/- AF-1 0 AF-2 0
 Supplementary Table 1. List of specific primers used for gene expression analysis. Genes Primer forward Primer reverse Hprt GCAGTACAGCCCCAAAATGG AACAAAGTCTGGCCTGTATCCA Srebp-1c GGAAGCTGTCGGGGTAGCGTC CATGTCTTCAAATGTGCAATCCAT
SUPPLEMENTARY INFORMATION
 DOI: 10.1038/ncb3461 In the format provided by the authors and unedited. Supplementary Figure 1 (associated to Figure 1). Cpeb4 gene-targeted mice develop liver steatosis. a, Immunoblot displaying CPEB4
SUPPLEMENTARY INFORMATION
 DOI:.38/ncb2822 a MTC02 FAO cells EEA1 b +/+ MEFs /DAPI -/- MEFs /DAPI -/- MEFs //DAPI c HEK 293 cells WCE N M C P AKT TBC1D7 Lamin A/C EEA1 VDAC d HeLa cells WCE N M C P AKT Lamin A/C EEA1 VDAC Figure
SUPPLEMENTARY DATA. Supplementary Table 1. Primers used in qpcr
 Supplementary Table 1. Primers used in qpcr Gene forward primer (5'-3') reverse primer (5'-3') β-actin AGAGGGAAATCGTGCGTGAC CAATAGTGATGACCTGGCCGT Hif-p4h-2 CTGGGCAACTACAGGATAAAC GCGTCCCAGTCTTTATTTAGATA
Supplementary Information
 Supplementary Information GADD34-deficient mice develop obesity, nonalcoholic fatty liver disease, hepatic carcinoma and insulin resistance Naomi Nishio and Ken-ichi Isobe Department of Immunology, Nagoya
Supplementary Figure 1
 VO (ml kg - min - ) VCO (ml kg - min - ) Respiratory exchange ratio Energy expenditure (cal kg - min - ) Locomotor activity (x count) Body temperature ( C) Relative mrna expression TA Sol EDL PT Heart
hexahistidine tagged GRP78 devoid of the KDEL motif (GRP78-His) on SDS-PAGE. This
 on SDS-PAGE. This") SUPPLEMENTAL FIGURE LEGEND Fig. S1. Generation and characterization of. (A) Coomassie staining of soluble hexahistidine tagged GRP78 devoid of the KDEL motif (GRP78-His) on SDS-PAGE. This protein was expressed
SUPPLEMENTAL FIGURE LEGEND Fig. S1. Generation and characterization of. (A) Coomassie staining of soluble hexahistidine tagged GRP78 devoid of the KDEL motif (GRP78-His) on SDS-PAGE. This protein was expressed
Supplementary Table 1. The primers used for quantitative RT-PCR. Gene name Forward (5 > 3 ) Reverse (5 > 3 )
 Reverse (5 > 3 )") 770 771 Supplementary Table 1. The primers used for quantitative RT-PCR. Gene name Forward (5 > 3 ) Reverse (5 > 3 ) Human CXCL1 GCGCCCAAACCGAAGTCATA ATGGGGGATGCAGGATTGAG PF4 CCCCACTGCCCAACTGATAG TTCTTGTACAGCGGGGCTTG
770 771 Supplementary Table 1. The primers used for quantitative RT-PCR. Gene name Forward (5 > 3 ) Reverse (5 > 3 ) Human CXCL1 GCGCCCAAACCGAAGTCATA ATGGGGGATGCAGGATTGAG PF4 CCCCACTGCCCAACTGATAG TTCTTGTACAGCGGGGCTTG
Supplementary Figure 1. DNA methylation of the adiponectin promoter R1, Pparg2, and Tnfa promoter in adipocytes is not affected by obesity.
 Supplementary Figure 1. DNA methylation of the adiponectin promoter R1, Pparg2, and Tnfa promoter in adipocytes is not affected by obesity. (a) Relative amounts of adiponectin, Ppar 2, C/ebp, and Tnf mrna
Supplementary Figure 1: si-craf but not si-braf sensitizes tumor cells to radiation.
 Supplementary Figure 1: si-craf but not si-braf sensitizes tumor cells to radiation. (a) Embryonic fibroblasts isolated from wildtype (WT), BRAF -/-, or CRAF -/- mice were irradiated (6 Gy) and DNA damage
Requires Signaling though Akt2 Independent of the. Transcription Factors FoxA2, FoxO1, and SREBP1c
 Cell Metabolism, Volume 14 Supplemental Information Postprandial Hepatic Lipid Metabolism Requires Signaling though Akt2 Independent of the Transcription Factors FoxA2, FoxO1, and SREBP1c Min Wan, Karla
SUPPLEMENTARY INFORMATION
 DOI: 10.1038/ncb2211 a! mir-143! b! mir-103/107! let-7a! mir-144! mir-122a! mir-126-3p! mir-194! mir-27a! mir-30c! Figure S1 Northern blot analysis of mir-143 expression dependent on feeding conditions.
Supplementary Materials for
 www.sciencesignaling.org/cgi/content/full/8/407/ra127/dc1 Supplementary Materials for Loss of FTO in adipose tissue decreases Angptl4 translation and alters triglyceride metabolism Chao-Yung Wang,* Shian-Sen
Supplementary Figure 1
 Supplementary Figure 1 a Percent of body weight! (%) 4! 3! 1! Epididymal fat Subcutaneous fat Liver SD Percent of body weight! (%) ** 3! 1! SD Percent of body weight! (%) 6! 4! SD ** b Blood glucose (mg/dl)!
Central injection of fibroblast growth factor 1 induces sustained remission of diabetic hyperglycemia in rodents
 Central injection of fibroblast growth factor 1 induces sustained remission of diabetic hyperglycemia in rodents Jarrad M Scarlett 1,,1, Jennifer M Rojas 1,1, Miles E Matsen 1, Karl J Kaiyala 3, Darko
Supplementary Table 1.
 Supplementary Table 1. Expression of genes involved in brown fat differentiation in WAT of db/db mice treated with HDAC inhibitors. Data are expressed as fold change (FC) versus control. symbol FC SAHA
Supplementary Figure 1. Normal T lymphocyte populations in Dapk -/- mice. (a) Normal thymic development in Dapk -/- mice. Thymocytes from WT and Dapk
 Normal thymic development in Dapk -/- mice. Thymocytes from WT and Dapk") Supplementary Figure 1. Normal T lymphocyte populations in Dapk -/- mice. (a) Normal thymic development in Dapk -/- mice. Thymocytes from WT and Dapk -/- mice were stained for expression of CD4 and CD8.
Supplementary Figure 1. Normal T lymphocyte populations in Dapk -/- mice. (a) Normal thymic development in Dapk -/- mice. Thymocytes from WT and Dapk -/- mice were stained for expression of CD4 and CD8.
ZL ZDF ZDF + E2 *** Visceral (g) ZDF
 ZDF") Body Weight (g) 4 3 2 1 ** * ZL ZDF 6 8 1 12 14 16 Age (weeks) B * Sub-cutaneous (g) 16 12 8 4 ZL ZDF Visceral (g) 25 2 15 1 5 ZL ZDF Total fat pad weight (g) 4 3 2 1 ZDF ZL Supplemental Figure 1: Effect
Body Weight (g) 4 3 2 1 ** * ZL ZDF 6 8 1 12 14 16 Age (weeks) B * Sub-cutaneous (g) 16 12 8 4 ZL ZDF Visceral (g) 25 2 15 1 5 ZL ZDF Total fat pad weight (g) 4 3 2 1 ZDF ZL Supplemental Figure 1: Effect
marker. DAPI labels nuclei. Flies were 20 days old. Scale bar is 5 µm. Ctrl is
 Supplementary Figure 1. (a) Nos is detected in glial cells in both control and GFAP R79H transgenic flies (arrows), but not in deletion mutant Nos Δ15 animals. Repo is a glial cell marker. DAPI labels
Supplementary Information
 Supplementary Information Overexpression of Fto leads to increased food intake and results in obesity Chris Church, Lee Moir, Fiona McMurray, Christophe Girard, Gareth T Banks, Lydia Teboul, Sara Wells,
Supplementary Materials for
 www.sciencesignaling.org/cgi/content/full/9/430/ra57/dc1 Supplementary Materials for The 4E-BP eif4e axis promotes rapamycinsensitive growth and proliferation in lymphocytes Lomon So, Jongdae Lee, Miguel
Supplementary Figure S I: Effects of D4F on body weight and serum lipids in apoe -/- mice.
 Supplementary Figures: Supplementary Figure S I: Effects of D4F on body weight and serum lipids in apoe -/- mice. Male apoe -/- mice were fed a high-fat diet for 8 weeks, and given PBS (model group) or
Supplementary Figure 1
 Supplementary Figure 1 Supplementary Figure 1 Schematic depiction of the tandem Fc GDF15. Supplementary Figure 2 Supplementary Figure 2 Gfral mrna levels in the brains of both wild-type and knockout Gfral
Supplementary Information. Protectin DX alleviates insulin resistance by activating a myokine-liver glucoregulatory axis.
 Supplementary Information Protectin DX alleviates insulin resistance by activating a myokine-liver glucoregulatory axis. Phillip J. White, Philippe St-Pierre, Alexandre Charbonneau, Patricia Mitchell,
SUPPLEMENTARY INFORMATION
 doi: 1.138/nature7221 Brown fat selective genes 12 1 Control Q-RT-PCR (% of Control) 8 6 4 2 Ntrk3 Cox7a1 Cox8b Cox5b ATPase b2 ATPase f1a1 Sirt3 ERRα Elovl3/Cig3 PPARα Zic1 Supplementary Figure S1. stimulates
Supplemental Information Supplementary Table 1. Tph1+/+ Tph1 / Analyte Supplementary Table 2. Tissue Vehicle LP value
 Supplemental Information Supplementary Table. Urinary and adipose tissue catecholamines in Tph +/+ and Tph / mice fed a high fat diet for weeks. Tph +/+ Tph / Analyte ewat ibat ewat ibat Urine (ng/ml)
SUPPLEMENTARY INFORMATION
 SUPPLEMENTARY INFORMATION doi:10.1038/nature11464 Supplemental Figure S1. The expression of Vegfb is increased in obese and diabetic mice as compared to lean mice. a-b, Body weight and postprandial blood
a b G75 G60 Sw-2 Sw-1 Supplementary Figure 1. Structure predictions by I-TASSER Server.
 a b G75 2 2 G60 Sw-2 Sw-1 Supplementary Figure 1. Structure predictions by I-TASSER Server. a. Overlay of top 10 models generated by I-TASSER illustrates the potential effect of 7 amino acid insertion
Supplementary Figure 1: Hsp60 / IEC mice are embryonically lethal (A) Light microscopic pictures show mouse embryos at developmental stage E12.
 Light microscopic pictures show mouse embryos at developmental stage E12.") Supplementary Figure 1: Hsp60 / IEC mice are embryonically lethal (A) Light microscopic pictures show mouse embryos at developmental stage E12.5 and E13.5 prepared from uteri of dams and subsequently genotyped.
Supplementary Figure 1: Hsp60 / IEC mice are embryonically lethal (A) Light microscopic pictures show mouse embryos at developmental stage E12.5 and E13.5 prepared from uteri of dams and subsequently genotyped.
Supplementary Figure 1 IMQ-Induced Mouse Model of Psoriasis. IMQ cream was
 Supplementary Figure 1 IMQ-Induced Mouse Model of Psoriasis. IMQ cream was painted on the shaved back skin of CBL/J and BALB/c mice for consecutive days. (a, b) Phenotypic presentation of mouse back skin
SUPPLEMENTARY INFORMATION
 Supplementary Figures Supplementary Figure S1. Binding of full-length OGT and deletion mutants to PIP strips (Echelon Biosciences). Supplementary Figure S2. Binding of the OGT (919-1036) fragments with
Expanded View Figures
 Expanded View Figures A B C D E F G H I J K L Figure EV1. The dysregulated lipid metabolic phenotype of mouse models of metabolic dysfunction is most pronounced in the fasted state. A L Male 12-weeks-old
Supplementary Figure 1
 Supplementary Figure 1 how HFD how HFD Epi WT p p Hypothalamus p p Inguinal WT T Liver Lean mouse adipocytes p p p p p p Obese mouse adipocytes Kidney Muscle Spleen Heart p p p p p p p p Extracellular
SUPPLEMENTARY DATA. Nature Medicine: doi: /nm.4171
 SUPPLEMENTARY DATA Supplementary Figure 1 a b c PF %Change - -4-6 Body weight Lean mass Body fat Tissue weight (g).4.3.2.1. PF GC iwat awat BAT PF d e f g week 2 week 3 NEFA (mmol/l) 1..5. PF phsl (Ser565)
Identified proteins interacting with TMBIM1 by mass spectrometry
 Supplementary Information Journal: Nature Medicine Article Title: Corresponding Author: A novel multivesicular body regulator TMBIM1 protects against non-alcoholic fatty liver disease in mice and monkeys
Metabolic ER stress and inflammation in white adipose tissue (WAT) of mice with dietary obesity.
 of mice with dietary obesity.") Supplementary Figure 1 Metabolic ER stress and inflammation in white adipose tissue (WAT) of mice with dietary obesity. Male C57BL/6J mice were fed a normal chow (NC, 10% fat) or a high-fat diet (HFD,
Supplementary Figure 1 Metabolic ER stress and inflammation in white adipose tissue (WAT) of mice with dietary obesity. Male C57BL/6J mice were fed a normal chow (NC, 10% fat) or a high-fat diet (HFD,
Supplementary Information
 Supplementary Information Notch deficiency decreases hepatic lipid accumulation by induction of fatty acid oxidation No-Joon Song,#, Ui Jeong Yun,#, Sunghee Yang, Chunyan Wu, Cho-Rong Seo, A-Ryeong Gwon,,
IL-6Rα IL-6RαT-KO KO. IL-6Rα f/f bp. f/f 628 bp deleted 368 bp. 500 bp
 STD H 2 O WT KO IL-6Rα f/f IL-6Rα IL-6RαT-KO KO 1000 bp 500 bp f/f 628 bp deleted 368 bp Supplementary Figure 1 Confirmation of T-cell IL-6Rα deficiency. (a) Representative histograms and (b) quantification
A synergistic anti-obesity effect by a combination of capsinoids and cold temperature through the promotion of beige adipocyte biogenesis
 A synergistic anti-obesity effect by a combination of capsinoids and cold temperature through the promotion of beige adipocyte biogenesis Kana Ohyama, 1,2 Yoshihito Nogusa, 1 Kosaku Shinoda, 2 Katsuya
SUPPLEMENTARY INFORMATION. Supplementary Figures S1-S9. Supplementary Methods
 SUPPLEMENTARY INFORMATION SUMO1 modification of PTEN regulates tumorigenesis by controlling its association with the plasma membrane Jian Huang 1,2#, Jie Yan 1,2#, Jian Zhang 3#, Shiguo Zhu 1, Yanli Wang
(A) PCR primers (arrows) designed to distinguish wild type (P1+P2), targeted (P1+P2) and excised (P1+P3)14-
 PCR primers (arrows) designed to distinguish wild type (P1+P2), targeted (P1+P2) and excised (P1+P3)14-") 1 Supplemental Figure Legends Figure S1. Mammary tumors of ErbB2 KI mice with 14-3-3σ ablation have elevated ErbB2 transcript levels and cell proliferation (A) PCR primers (arrows) designed to distinguish
1 Supplemental Figure Legends Figure S1. Mammary tumors of ErbB2 KI mice with 14-3-3σ ablation have elevated ErbB2 transcript levels and cell proliferation (A) PCR primers (arrows) designed to distinguish
Supplemental Information. Metabolic Maturation during Muscle Stem Cell. Differentiation Is Achieved by mir-1/133a-mediated
 Cell Metabolism, Volume 27 Supplemental Information Metabolic Maturation during Muscle Stem Cell Differentiation Is Achieved by mir-1/133a-mediated Inhibition of the Dlk1-Dio3 Mega Gene Cluster Stas Wüst,
Supplementary methods:
 Supplementary methods: Primers sequences used in real-time PCR analyses: β-actin F: GACCTCTATGCCAACACAGT β-actin [11] R: AGTACTTGCGCTCAGGAGGA MMP13 F: TTCTGGTCTTCTGGCACACGCTTT MMP13 R: CCAAGCTCATGGGCAGCAACAATA
a Supplementary Figure 1 Celastrol Withaferin A Individual drugs
 Supplementary Figure 1 a 17 27 HSPA1A SLC7A11 HMOX1 GSTA1 DUSP4 GML CHAC1 CDKN1A GSTA4 CA6 BHLHE41 NR1D1 HSPB1 PTX3 HP NFKBIA VDR MVD HAS2 ANGPT1 WDR6 TGFB3 IDI1 VCAM1 H1F HMGCS1 CXCL5 STEAP4 NOS2 b Enrichment
Supplemental Materials. STK16 regulates actin dynamics to control Golgi organization and cell cycle
 Supplemental Materials STK16 regulates actin dynamics to control Golgi organization and cell cycle Juanjuan Liu 1,2,3, Xingxing Yang 1,3, Binhua Li 1, Junjun Wang 1,2, Wenchao Wang 1, Jing Liu 1, Qingsong
Supplementary Figure S1. Effect of Glucose on Energy Balance in WT and KHK A/C KO
 Supplementary Figure S1. Effect of Glucose on Energy Balance in WT and KHK A/C KO Mice. WT mice and KHK-A/C KO mice were provided drinking water containing 10% glucose or tap water with normal chow ad
Table 1. Oligonucleotides and RT-PCR conditions Supplementary Material and Methods Fig. 1
 Table 1. Oligonucleotides and RT-PCR conditions. Overview of PCR templates, gene accession number of sequences used as template, product size, annealing temperatures and optimal cycles, cdna and MgCl 2
SUPPLEMENTARY INFORMATION
 SUPPLEMENTARY INFORMATION FOR Liver X Receptor α mediates hepatic triglyceride accumulation through upregulation of G0/G1 Switch Gene 2 (G0S2) expression I: SUPPLEMENTARY METHODS II: SUPPLEMENTARY FIGURES
A Central Role of MG53 in Metabolic Syndrome. and Type-2 Diabetes
 A Central Role of MG53 in Metabolic Syndrome and Type-2 Diabetes Yan Zhang, Chunmei Cao, Rui-Ping Xiao Institute of Molecular Medicine (IMM) Peking University, Beijing, China Accelerated Aging in China
Supplementary Table 1. Metabolic parameters in GFP and OGT-treated mice
 Supplementary Table 1. Metabolic parameters in GFP and OGT-treated mice Fasted Refed GFP OGT GFP OGT Liver G6P (mmol/g) 0.03±0.01 0.04±0.02 0.60±0.04 0.42±0.10 A TGs (mg/g of liver) 20.08±5.17 16.29±0.8
SUPPLEMENTARY INFORMATION
 SUPPLEMENTARY INFORMATION doi:10.1038/nature11429 S1a 6 7 8 9 Nlrc4 allele S1b Nlrc4 +/+ Nlrc4 +/F Nlrc4 F/F 9 Targeting construct 422 bp 273 bp FRT-neo-gb-PGK-FRT 3x.STOP S1c Nlrc4 +/+ Nlrc4 F/F casp1
Up-Regulation of Mitochondrial Activity and Acquirement of Brown Adipose Tissue-Like Property in the White Adipose Tissue of Fsp27 Deficient Mice
 Up-Regulation of Mitochondrial Activity and Acquirement of Brown Adipose Tissue-Like Property in the White Adipose Tissue of Fsp27 Deficient Mice Shen Yon Toh 1,2,3., Jingyi Gong 2., Guoli Du 2., John
TBP (H) CACAGTGAATCTTGGTTGTAAACTTGA AAACCGCTTGGGATTATATTCG ANGPTL8 (H) CTGGGCCCTGCCTACCGAGA CCGATGCTGCTGTGCCACCA [1]
![TBP (H) CACAGTGAATCTTGGTTGTAAACTTGA AAACCGCTTGGGATTATATTCG ANGPTL8 (H) CTGGGCCCTGCCTACCGAGA CCGATGCTGCTGTGCCACCA [1]](/thumbs/89/99233308.jpg "TBP (H) CACAGTGAATCTTGGTTGTAAACTTGA AAACCGCTTGGGATTATATTCG ANGPTL8 (H) CTGGGCCCTGCCTACCGAGA CCGATGCTGCTGTGCCACCA [1]") ESM Table 1. Immunoblot antibodies. Primary Supplier Dilution Antibody Akt Cell Signaling 1:1000 Technology Phosphorylated Cell Signaling 1:1000 Akt (Ser 473) Technology PKCε Cell Signaling 1:1000 Technology
ESM Table 1. Immunoblot antibodies. Primary Supplier Dilution Antibody Akt Cell Signaling 1:1000 Technology Phosphorylated Cell Signaling 1:1000 Akt (Ser 473) Technology PKCε Cell Signaling 1:1000 Technology
Serum Amyloid A3 Gene Expression in Adipocytes is an Indicator. of the Interaction with Macrophages
 Serum Amyloid A3 Gene Expression in Adipocytes is an Indicator of the Interaction with Macrophages Yohei Sanada, Takafumi Yamamoto, Rika Satake, Akiko Yamashita, Sumire Kanai, Norihisa Kato, Fons AJ van
Supplementary Material for
 Supplementary Material for Parathyroid Hormone Signaling through Low-density-lipoprotein-related Protein 6 Mei Wan, Chaozhe Yang, Jun Li, Xiangwei Wu, Hongling Yuan, Hairong Ma, Xi He, Shuyi Nie, Chenbei
Supplementary Figure S1 Targeted disruption and overexpression of Gpr43 in mice. (a) A targeting vector was constructed by ligation of 3 fragments:
 A targeting vector was constructed by ligation of 3 fragments:") Supplementary Figure S1 Targeted disruption and overexpression of Gpr43 in mice. (a) A targeting vector was constructed by ligation of 3 fragments: the 5' and 3' homology recombination arms and a fragment
Supplementary Figure S1 Targeted disruption and overexpression of Gpr43 in mice. (a) A targeting vector was constructed by ligation of 3 fragments: the 5' and 3' homology recombination arms and a fragment
perk/erk STAT5B
 pakt/akt relative to saline (fold).5.5.5 control perk/erk relative to saline (fold).6.4..8.6.4. p=.6 control db/+ Hsp6 VDAC Hsp6/VDAC (relative to db/+) 8 6 4 db/+ C db/+ Hsp6 Hsp6/actin (relative to db/+)
Supplementary Figure 1.
 Supplementary Figure 1. Increased β cell mass and islet diameter in βtsc2 -/- mice up to 35 weeks A: Reconstruction of multiple anti-insulin immunofluorescence images showing differences in β cell mass
Supplemental Material:
 Supplemental Material: MATERIALS AND METHODS RNA interference Mouse CHOP sirna (ON-TARGETplus SMARTpool Cat# L-062068-00) and control sirna (ON-TARGETplus Control) were purchased from Dharmacon. Transfection
Supplemental Figure S1. RANK expression on human lung cancer cells.
 Supplemental Figure S1. RANK expression on human lung cancer cells. (A) Incidence and H-Scores of RANK expression determined from IHC in the indicated primary lung cancer subgroups. The overall expression
Supplementary fig. 1. Crystals induce necroptosis does not involve caspases, TNF receptor or NLRP3. A. Mouse tubular epithelial cells were pretreated
 Supplementary fig. 1. Crystals induce necroptosis does not involve caspases, TNF receptor or NLRP3. A. Mouse tubular epithelial cells were pretreated with zvad-fmk (10µM) and exposed to calcium oxalate
Supplemental Table 1. Plasma NEFA and liver triglyceride levels in ap2-hif1ako and ap2-hif2ako mice under control and high fat diets.
 Supplemental Table 1. Plasma NEFA and liver triglyceride levels in Hif1aKO and Hif2aKO mice under control and high fat diets. Hif1a (n=6) Hif1aK O (n=6) Hif2a Hif2aK O Hif1a (n=5) Hif1aKO (n=5) Hif2a Hif2aK
Relative Rates. SUM159 CB- 839-Resistant *** n.s Intracellular % Labeled by U- 13 C-Asn 0.
 A Relative Growth Rates 1.2 1.8.6.4.2 B Relative Rates 1.6 1.4 1.2 1.8.6.4.2 LPS2 Parental LPS2 Q-Independent SUM159 Parental SUM159 CB-839-Resistant LPS2 Parental LPS2 Q- Independent SUM159 Parental SUM159
Rescue of mutant rhodopsin traffic by metformin-induced AMPK activation accelerates photoreceptor degeneration Athanasiou et al
 Supplementary Material Rescue of mutant rhodopsin traffic by metformin-induced AMPK activation accelerates photoreceptor degeneration Athanasiou et al Supplementary Figure 1. AICAR improves P23H rod opsin
Supplementary Figure 1.TRIM33 binds β-catenin in the nucleus. a & b, Co-IP of endogenous TRIM33 with β-catenin in HT-29 cells (a) and HEK 293T cells
 and HEK 293T cells") Supplementary Figure 1.TRIM33 binds β-catenin in the nucleus. a & b, Co-IP of endogenous TRIM33 with β-catenin in HT-29 cells (a) and HEK 293T cells (b). TRIM33 was immunoprecipitated, and the amount of
Supplementary Figure 1.TRIM33 binds β-catenin in the nucleus. a & b, Co-IP of endogenous TRIM33 with β-catenin in HT-29 cells (a) and HEK 293T cells (b). TRIM33 was immunoprecipitated, and the amount of
Supplementary Figures
 Supplementary Figures mir-150 regulates obesityassociated insulin resistance by controlling B cell functions Wei Ying, Alexander Tseng, Richard Cheng-An Chang, Haiqing Wang, Yu-lieh Lin, Srikanth Kanameni,
RayBio KinaseSTAR TM Akt Activity Assay Kit
 Activity Assay Kit User Manual Version 1.0 March 13, 2015 RayBio KinaseSTAR TM Akt Activity Kit Protocol (Cat#: 68AT-Akt-S40) RayBiotech, Inc. We Provide You With Excellent Support And Service Tel:(Toll
Figure S1A. Blood glucose levels in mice after glucose injection
 ## Figure S1A. Blood glucose levels in mice after glucose injection Blood glucose (mm/l) 25 2 15 1 5 # 15 3 6 3+3 Time after glucose injection (min) # Figure S1B. α-kg levels in mouse livers after glucose
A. One to three months of age. Anterior Lens (Mean ± SEM) Posterior Lens (Mean ± SEM) Mid Lens (Mean ± SEM) Cornea (Mean ± SEM) Genotype
 Posterior Lens (Mean ± SEM) Mid Lens (Mean ± SEM) Cornea (Mean ± SEM) Genotype") Supplementary Table 1. Location of lens opacification in Aldh1a1(-/-), Aldh3a1(-/-) single and Aldh1a1(-/-)/Aldh3a1(-/-) double knockout mice (DKO) at different ages. A. One to three months of age Genotype
Supplementary Table 1. Location of lens opacification in Aldh1a1(-/-), Aldh3a1(-/-) single and Aldh1a1(-/-)/Aldh3a1(-/-) double knockout mice (DKO) at different ages. A. One to three months of age Genotype
Supplemental Fig. 1. Relative mrna Expression. Relative mrna Expression WT KO WT KO RT 4 0 C
 Supplemental Fig. 1 A 1.5 1..5 Hdac11 (ibat) n=4 n=4 n=4 n=4 n=4 n=4 n=4 n=4 WT KO WT KO WT KO WT KO RT 4 C RT 4 C Supplemental Figure 1. Hdac11 mrna is undetectable in KO adipose tissue. Quantitative
Supplementary Figure 1 hlrrk2 promotes CAP dependent protein translation.
 ` Supplementary Figure 1 hlrrk2 promotes CAP dependent protein translation. (a) Overexpression of hlrrk2 in HeLa cells enhances total protein synthesis in [35S] methionine/cysteine incorporation assays.
University of California, San Diego La Jolla CA 92093
 AD Award Number: W81XWH-11-1-0131 TITLE: Role of Inflammation and Insulin Resistance in Mouse Models of Breast Cancer PRINCIPAL INVESTIGATOR: Jerrold Olefsky, M.D. CONTRACTING ORGANIZATION: University
Supporting Information. Supporting Tables. S-Table 1 Primer pairs for RT-PCR. Product size. Gene Primer pairs
 Supporting Information Supporting Tables S-Table 1 Primer pairs for RT-PCR. Gene Primer pairs Product size (bp) FAS F: 5 TCTTGGAAGCGATGGGTA 3 429 R: 5 GGGATGTATCATTCTTGGAC 3 SREBP-1c F: 5 CGCTACCGTTCCTCTATCA
Supplementary Figure 1
 Combination index (CI) Supplementary Figure 1 2. 1.5 1. Ishikawa AN3CA Nou-1 Hec-18.5...2.4.6.8 1. Fraction affected (Fa) Supplementary Figure 1. The synergistic effect of PARP inhibitor and PI3K inhibitor
Over-expression of MKP-3 and knockdown of MKP-3 and FOXO1 in primary rat. day, cells were transduced with adenoviruses expressing GFP, MKP-3 or shgfp,
 SUPPLEMENTAL METHODS Over-expression of MKP-3 and knockdown of MKP-3 and FOXO1 in primary rat hepatocytes Primary rat hepatocytes were seeded as described in experimental procedures. The next day, cells
Supplemental material for Hernandez et al. Dicoumarol downregulates human PTTG1/Securin mrna expression. through inhibition of Hsp90
 Supplemental material for Hernandez et al. Dicoumarol downregulates human PTTG1/Securin mrna expression through inhibition of Hsp90 Dicoumarol-Sepharose co-precipitation. Hsp90 inhibitors can co-precipitate
BRaf V600E cooperates with Pten silencing to elicit metastatic melanoma (Nature Genetics Supplementary Information)
") BRaf V600E cooperates with Pten silencing to elicit metastatic melanoma (Nature Genetics Supplementary Information) David Dankort, David P. Curley, Robert A. Cartlidge, Betsy Nelson, Anthony N. Karnezis,
BRaf V600E cooperates with Pten silencing to elicit metastatic melanoma (Nature Genetics Supplementary Information) David Dankort, David P. Curley, Robert A. Cartlidge, Betsy Nelson, Anthony N. Karnezis,
For pair feeding, mice were fed 2.7g of HFD containing tofogliflozin
 Materials and Methods Pair Feeding Experiment For pair feeding, mice were fed 2.7g of HFD containing tofogliflozin (0.005%), which is average daily food intake of mice fed control HFD ad libitum at week
Supplementary Figures
 Supplementary Figures Supplementary Figure 1 Characterization of stable expression of GlucB and sshbira in the CT26 cell line (a) Live cell imaging of stable CT26 cells expressing green fluorescent protein
Supplementary Materials for. c-abl Activation Plays a Role in α-synucleinopathy Induced Neurodegeneration
 Supplementary Materials for c-abl Activation Plays a Role in α-synucleinopathy Induced Neurodegeneration Saurav Brahmachari, Preston Ge, Su Hyun Lee, Donghoon Kim, Senthilkumar S. Karuppagounder, Manoj
Supplementary Figure 1
 Supplementary Figure 1 A B mir-141, human cell lines mir-2c, human cell lines mir-141, hepatocytes mir-2c, hepatocytes Relative RNA.1.8.6.4.2 Relative RNA.3.2.1 Relative RNA 1.5 1..5 Relative RNA 2. 1.5
A Hepatocyte Growth Factor Receptor (Met) Insulin Receptor hybrid governs hepatic glucose metabolism SUPPLEMENTARY FIGURES, LEGENDS AND METHODS
 Insulin Receptor hybrid governs hepatic glucose metabolism SUPPLEMENTARY FIGURES, LEGENDS AND METHODS") A Hepatocyte Growth Factor Receptor (Met) Insulin Receptor hybrid governs hepatic glucose metabolism Arlee Fafalios, Jihong Ma, Xinping Tan, John Stoops, Jianhua Luo, Marie C. DeFrances and Reza Zarnegar
A Hepatocyte Growth Factor Receptor (Met) Insulin Receptor hybrid governs hepatic glucose metabolism Arlee Fafalios, Jihong Ma, Xinping Tan, John Stoops, Jianhua Luo, Marie C. DeFrances and Reza Zarnegar
Male 30. Female. Body weight (g) Age (weeks) Age (weeks) Atg7 f/f Atg7 ΔCD11c
 Age (weeks) Age (weeks) Atg7 f/f Atg7 ΔCD11c") ody weight (g) ody weight (g) 34 3 Male 3 27 Female 26 24 22 18 7 9 11 13 15 17 19 21 23 21 18 15 7 9 11 13 15 17 19 21 23 Age (weeks) Age (weeks) Supplementary Figure 1. Lean phenotypes in mice regardless
ody weight (g) ody weight (g) 34 3 Male 3 27 Female 26 24 22 18 7 9 11 13 15 17 19 21 23 21 18 15 7 9 11 13 15 17 19 21 23 Age (weeks) Age (weeks) Supplementary Figure 1. Lean phenotypes in mice regardless
Supplementary Information
 Supplementary Information Akt regulates hepatic metabolism by suppressing a Foxo1 dependent global inhibition of adaptation to nutrient intake Mingjian Lu 1, Min Wan 1, Karla F. Leavens 1, Qingwei Chu
Figure S1. Sorting nexin 9 (SNX9) specifically binds psmad3 and not psmad 1/5/8. Lysates from AKR-2B cells untreated (-) or stimulated (+) for 45 min
 specifically binds psmad3 and not psmad 1/5/8. Lysates from AKR-2B cells untreated (-) or stimulated (+) for 45 min") Figure S1. Sorting nexin 9 (SNX9) specifically binds psmad3 and not psmad 1/5/8. Lysates from AKR2B cells untreated () or stimulated () for 45 min with 5 ng/ml TGFβ or 10 ng/ml BMP4 were incubated with
Figure S1. Sorting nexin 9 (SNX9) specifically binds psmad3 and not psmad 1/5/8. Lysates from AKR2B cells untreated () or stimulated () for 45 min with 5 ng/ml TGFβ or 10 ng/ml BMP4 were incubated with
Supplementary Figure S1 Supplementary Figure S2
 Supplementary Figure S A) The blots shown in Figure B were qualified by using Gel-Pro analyzer software (Rockville, MD, USA). The ratio of LC3II/LC3I to actin was then calculated. The data are represented
Nature Neuroscience: doi: /nn Supplementary Figure 1
 Supplementary Figure 1 EGFR inhibition activates signaling pathways (a-b) EGFR inhibition activates signaling pathways (a) U251EGFR cells were treated with erlotinib (1µM) for the indicated times followed