A Focus on Nutrition Key Findings of the 2008/09 New Zealand Adult Nutrition Survey
|
|
|
- Nancy Willis
- 6 years ago
- Views:
Transcription
1 A Focus on Nutrition Key Findings of the 2008/09 New Zealand Adult Nutrition Survey
 HP 5412 This document is available on the Ministry of Health s website:")
2 Citation: University of Otago and Ministry of Health A Focus on Nutrition: Key findings of the 2008/09 New Zealand Adult Nutrition Survey. Wellington: Ministry of Health. Published in September 2011 by the Ministry of Health PO Box 5013, Wellington, New Zealand ISBN (online) HP 5412 This document is available on the Ministry of Health s website:
3 Foreword I am pleased to bring to you this report, A Focus on Nutrition, Key findings of the 2008/09 New Zealand Adult Nutrition Survey. The Government s overarching goal for health is to enable New Zealanders to live longer, healthier and more independent lives. Lifelong good nutrition is needed to achieve this. The 2008/09 New Zealand Adult Nutrition Survey provides us with a wealth of reliable and up-to-date information about the nutritional health of adult New Zealanders. There is good news in the survey. Compared to the 1997 National Nutrition Survey, there was a decline in the contribution of saturated fat to total energy intake, a decrease in total blood cholesterol, and an increase in eating the recommended two or more servings of fruit per day. However, the survey also identified areas we need to work on: since 1997, there has been an increase in the prevalence of obesity, and an increase in the prevalence of low food security. Over time, the survey results will contribute to the development and evaluation of policy, the development of the Ministry of Health Food and Nutrition Guidelines and the review of Nutrient Reference Values. Survey data can also be used in monitoring diabetes, providing information when developing food standards, and monitoring changes in the food supply. This report represents a significant undertaking by a large group of people over a long period of time. I congratulate the research teams and External Technical Group, and thank them for their time and commitment to this project. I especially want to thank the 4721 New Zealanders who gave their time to take part in the survey it would not have been possible without them. Signed by A Focus on Nutrition: Key Findings of the 2008/09 New Zealand Adult Nutrition Survey iii
4 Acknowledgements First, thank you to the 4721 New Zealanders who opened their homes to the interviewers and made the 2008/09 New Zealand Adult Nutrition Survey possible. The survey was funded by the Ministry of Health and conducted by the University of Otago. CBG Health Research Ltd recruited participants into the survey. The survey was managed in the Ministry of Health, initially by Kirsten McLachlan and then from December 2008 by Sally Mackay. We are grateful to the many colleagues in the Health and Disability Intelligence Unit of the Ministry of Health and across the Ministry who contributed to the development, implementation and analysis of this survey. The Nutrition Director for the survey was Associate Professor Winsome Parnell of the University of Otago. John Harvey, Project Manager, handled the day-to-day co-ordination of the survey during the data collection phase. The survey would not have been completed without the dedication of a number of people. These include members of the External Technical Group; the regional supervisors and field staff who collected the data; the University of Otago project office staff who checked and analysed the data; and the members of the academic staff of the Department of Human Nutrition who provided expert advice. Particular thanks go to Professor David Russell and Dr Noela Wilson for their advice and encouragement throughout the survey, and for their expert editorial assistance in the drafting of the descriptive report. The Institute of Plant and Food Research Ltd (Palmerston North) provided food composition data and assisted with nutrient matching. The contribution made by Dr Lee Huffmann was crucial in resolving many complex issues. Canterbury Health Laboratories were responsible for collecting and analysing the biological samples. Special thanks go to Kevin Taylor, who assumed responsibility for this work after the sudden death of Barrie Edwards. Appendix 1 outlines in more detail the many people who assisted throughout the survey. iv A Focus on Nutrition: Key Findings of the 2008/09 New Zealand Adult Nutrition Survey
5 Authors Authorship of individual chapters was as follows. Chapter 1 Chapter 2 Chapter 3 Chapter 4 Chapter 5 Chapter 6 Chapter 7 Chapter 8 Chapter 9 Sally Mackay, Ministry of Health; Associate Professor Winsome Parnell, University of Otago Dr Anne-Louise Heath, Dr Rachel Brown, Associate Professor Winsome Parnell, Dr Noela Wilson, Andrew Gray, University of Otago; Maria Turley, Sally Mackay, Dr Deepa Weerasekera, Ministry of Health Associate Professor Winsome Parnell, Liz Fleming, University of Otago Associate Professor Winsome Parnell, Liz Fleming, University of Otago Associate Professor Winsome Parnell, Liz Fleming, University of Otago Sally Mackay, Ministry of Health Associate Professor Winsome Parnell, University of Otago Associate Professor Winsome Parnell, Dr Noela Wilson, Professor Christine Thomson, University of Otago; Sally Mackay, Dr Niki Stefanogiannis, Maria Turley, Ministry of Health Associate Professor Winsome Parnell, University of Otago; Maria Turley, Dr Niki Stefanogiannis, Ministry of Health A Focus on Nutrition: Key Findings of the 2008/09 New Zealand Adult Nutrition Survey v
6
7 Contents Foreword Acknowledgements Authors Glossary Abbreviations Executive Summary iii iv v xv xix xxi 1 Introduction Overview Background Further information 2 2 Methodology Overview of survey design Data collection Instruments Analysis of nutrient data Weighting estimation Response rates How to interpret the results 16 3 Nutrient Intakes and Dietary Sources: Energy and Macronutrients Explanatory notes Energy Protein Total fat Types of fat and cholesterol Total carbohydrate Sugars Dietary fibre Alcohol 106 A Focus on Nutrition: Key Findings of the 2008/09 New Zealand Adult Nutrition Survey vii
8 4 Nutrient Intakes and Dietary Sources: Micronutrients Explanatory notes Vitamin A Vitamin C Vitamin E The B vitamins Calcium Iron Zinc Potassium Selenium Dietary Supplements Use in the last year Types of supplements consumed Dietary Habits Having breakfast every day Eating from the four major food groups Food preparation and cooking practices Fast foods and takeaways Drinks Food Security The eight facets of food security Categories of household food security Nutrition-related Health Outcomes Body size Blood pressure Iron status Cholesterol Folate status Diabetes and HbA1c Iodine status Have We Changed? Energy and macronutrient intakes Selected nutrient intakes Vegetable and fruit intake Body size Total and HDL cholesterol Iron status Food security 311 References 313 viii A Focus on Nutrition: Key Findings of the 2008/09 New Zealand Adult Nutrition Survey
9 Appendices 317 Appendix 1: Personnel involved 317 Appendix 2: Participant feedback 322 Appendix 3: Analytical techniques for nutrients in the New Zealand Food Composition Database (NZFCDB) 323 Appendix 4: Nutrient matching 325 Appendix 5: Cell sizes 329 List of Tables Table 2.1: Blood and urine samples 9 Table 2.2: Food groups used in the 2008/09 New Zealand Adult Nutrition Survey 12 Table 2.3: Estimated average requirements (EARs) per day used in the probability analysis 15 Table 3.1: Energy intake, by age group, ethnic group, NZDep2006 and sex 25 Table 3.2: Energy sources, percent (95% CI), by age group, sex and food group 27 Table 3.3: Protein intake (g) and % energy from protein, by age group, ethnic group, NZDep2006 and sex 32 Table 3.4: Protein sources, percent (95% CI), by age group, sex and food group 35 Table 3.5: Total fat intake, by age group, ethnic group, NZDep2006 and sex 40 Table 3.6: Total fat sources, percent (95% CI), by age group, sex and food group 42 Table 3.7: Saturated fat intake, by age group, ethnic group, NZDep2006 and sex 47 Table 3.8: SAFA sources, percent (95% CI), by age group, sex and food group 49 Table 3.9: Monounsaturated fat intake, by age group, ethnic group, NZDep2006 and sex 53 Table 3.10: Monounsaturated fat sources, percent (95% CI), by age group, sex and food group 55 Table 3.11: Polyunsaturated fat intake, by age group, ethnic group, NZDep2006 and sex 59 Table 3.12: Polyunsaturated fat sources, percent (95% CI), by age group, sex and food group 61 Table 3.13: Cholesterol intake, by age group, ethnic group, NZDep2006 and sex 65 Table 3.14: Cholesterol sources, percent (95% CI), by age group, sex and food group 67 Table 3.15: Carbohydrate intake, by age group, ethnic group, NZDep2006 and sex 72 Table 3.16: Carbohydrate sources, percent (95% CI), by age group, sex and food group 74 Table 3.17: Total sugars intake, by age group, ethnic group, NZDep2006 and sex 78 Table 3.18: Total sugars sources, percent (95% CI), by age group, sex and food group 80 Table 3.19: Sucrose intake, by age group, ethnic group, NZDep2006 and sex 84 Table 3.20: Sucrose sources, percent (95% CI), by age group, sex and food group 86 Table 3.21: Fructose intake, by age group, ethnic group, NZDep2006 and sex 90 Table 3.22: Fructose sources, percent (95% CI), by age group, sex and food group 92 Table 3.23: Lactose intake, by age group, ethnic group, NZDep2006 and sex 96 Table 3.24: Lactose sources, percent (95% CI), by age group, sex and food group 98 Table 3.25: Total dietary fibre intake, by age group, ethnic group, NZDep2006 and sex 102 Table 3.26: Total dietary fibre sources, percent (95% CI), by age group, sex and food group 104 Table 3.27: Alcohol intake, by age group, ethnic group, NZDep2006 and sex 107 Table 3.28: Alcohol sources, percent (95% CI), by age group, sex and food group 110 Table 4.1: Vitamin A equivalents intake, by age group, ethnic group, NZDep2006 and sex 116 Table 4.2: Vitamin A equivalent sources, percent (95% CI), by age group, sex and food group 118 Table 4.3: β-carotene intake, by age group, ethnic group, NZDep2006 and sex 122 Table 4.4: β-carotene sources, percent (95% CI), by age group, sex and food group 124 A Focus on Nutrition: Key Findings of the 2008/09 New Zealand Adult Nutrition Survey ix
10 Table 4.5: Retinol intake, by age group, ethnic group, NZDep2006 and sex 128 Table 4.6: Retinol sources, percent (95% CI), by age group, sex and food group 130 Table 4.7: Vitamin C intake, by age group, ethnic group, NZDep2006 and sex 134 Table 4.8: Vitamin C sources, percent (95% CI), by age group, sex and food group 136 Table 4.9: Vitamin E intake, by age group, ethnic group, NZDep2006 and sex 140 Table 4.10: Vitamin E sources, percent (95% CI), by age group, sex and food group 142 Table 4.11: Thiamin intake, by age group, ethnic group, NZDep2006 and sex 146 Table 4.12: Thiamin sources, percent (95% CI), by age group, sex and food group 148 Table 4.13: Riboflavin intake, by age group, ethnic group, NZDep2006 and sex 151 Table 4.14: Riboflavin sources, percent (95% CI), by age group, sex and food group 153 Table 4.15: Niacin equivalents intake, by age group, ethnic group, NZDep2006 and sex 157 Table 4.16: Niacin equivalent sources, percent (95% CI), by age group, sex and food group 159 Table 4.17: Vitamin B 6 intake, by age group, ethnic group, NZDep2006 and sex 163 Table 4.18: Vitamin B 6 sources, percent (95% CI), by age group, sex and food group 165 Table 4.19: Vitamin B 12 intake, by age group, ethnic group, NZDep2006 and sex 169 Table 4.20: Vitamin B 12 sources, percent (95% CI), by age group, sex and food group 171 Table 4.21: Calcium intake, by age group, ethnic group, NZDep2006 and sex 176 Table 4.22: Calcium sources, percent (95% CI), by age group, sex and food group 178 Table 4.23: Iron intake, by age group, ethnic group, NZDep2006 and sex 182 Table 4.24: Iron sources, percent (95% CI), by age group, sex and food group 184 Table 4.25: Zinc intake, by age group, ethnic group, NZDep2006 and sex 188 Table 4.26: Zinc sources, percent (95% CI), by age group, sex and food group 190 Table 4.27: Potassium intake, by age group, ethnic group, NZDep2006 and sex 194 Table 4.28: Potassium sources, percent (95% CI), by age group, sex and food group 196 Table 4.29: Selenium intake, by age group, ethnic group, NZDep2006 and sex 200 Table 4.30: Selenium sources, percent (95% CI), by age group, sex and food group 202 Table 5.1: Dietary supplement use, by age group, ethnic group, NZDep2006 and sex 209 Table 5.2: Prevalence of use by type of dietary supplement, by age group, ethnic group, NZDep2006 and sex 211 Table 6.1: Frequency of eating breakfast per week, by age group, NZDep2006 and sex 217 Table 6.2: Number of servings of vegetables consumed per day, by age group, NZDep2006 and sex 220 Table 6.3: Number of servings of fruit consumed per day, by age group, NZDep2006 and sex 222 Table 6.4: Type of bread consumed most of the time, by age group, NZDep2006 and sex 225 Table 6.5: Type of milk used most of the time, by age group, NZDep2006 and sex 228 Table 6.6: Frequency of eating red meat, by age group, NZDep2006 and sex 230 Table 6.7: Frequency of eating chicken, by age group, NZDep2006 and sex 231 Table 6.8: Frequency of eating fresh or frozen seafood (fish or shellfish), by age group, NZDep2006 and sex 233 Table 6.9: Frequency of eating canned seafood (fish or shellfish), by age group, NZDep2006 and sex 234 Table 6.10: Frequency of eating battered seafood (fish or shellfish), by age group, NZDep2006 and sex 235 Table 6.11: Frequency of eating processed meat, by age group, NZDep2006 and sex 236 Table 6.12: Frequency of removal of excess fat from meat, and removal of skin from chicken, by age group, NZDep2006 and sex 240 Table 6.13: Type of spread used most of the time, by age group, NZDep2006 and sex 243 Table 6.14: Cooking oil, salt, low-fat, low-salt foods, by age group, NZDep2006 and sex 249 Table 6.15: Use of iodised salt, by age group, NZDep2006 and sex 250 x A Focus on Nutrition: Key Findings of the 2008/09 New Zealand Adult Nutrition Survey
11 Table 6.16: Frequency of fast food, hot chips, fruit juice/fruit drinks and soft drinks/energy drinks, by age group, NZDep2006 and sex 258 Table 7.1: Household food security over the last year, by age group, ethnic group, NZDep2006 and sex 264 Table 7.2: Categories of household food security, by age group, ethnic group, NZDep2006 and sex 272 Table 8.1: Body size, by age group, ethnic group, NZDep2006 and sex 278 Table 8.2: Blood pressure, by age group, ethnic group, NZDep2006 and sex 283 Table 8.3: Iron status measures 285 Table 8.4: Ferritin and haemoglobin, by age group, ethnic group, NZDep2006 and sex 286 Table 8.5: Prevalence of iron deficiency, by age group, ethnic group, NZDep2006 and sex 288 Table 8.6: Cholesterol, by age group, ethnic group, NZDep2006 and sex 292 Table 8.7: Folate, by age group, ethnic group, NZDep2006 and sex 296 Table 8.8: HbA1c, by age group, ethnic group, NZDep2006 and sex 299 Table 8.9: Urinary iodine, by age group, ethnic group, NZDep2006 and sex 302 Table 9.1: Summary of design and methods of the adult nutrition surveys 305 Table 9.2: Energy intake and contribution from macronutrients, by sex, 1997 and 2008/ Table 9.3: Median usual daily nutrient intakes, by sex, 1997 and 2008/ Table 9.4: Vegetable and fruit intake, by sex, 1997 and 2008/ Table 9.5: Body size, by sex, 1997 and 2008/ Table 9.6: Mean total and HDL cholesterol concentration, by sex, 1997 and 2008/ Table 9.7: Iron status, by sex, 1997 and 2008/ Table 9.8: Categories of food security, by sex, 1997 and 2008/ Table A4.1: Analytical techniques for nutrients 323 Table A5.1: Number of respondents for each component of the survey, by age group, sex, ethnic group and NZDep List of Figures Figure 3.1: Median energy intake (kj), by age group and sex 23 Figure 3.2: Percent energy from bread, by age group and sex 24 Figure 3.3: Median protein intake (g), by age group and sex 29 Figure 3.4: Mean percent energy from protein, by age group and sex 30 Figure 3.5: Percent protein from poultry, by age group and sex 31 Figure 3.6: Median total fat intake (g), by age group, and sex 37 Figure 3.7: Percent energy from total fat, by age group and sex 38 Figure 3.8: Percent total fat from Potatoes, kumara and taro, by age group and sex 39 Figure 3.9: Median SAFA intake (g), by age group and sex 44 Figure 3.10: Percent energy from SAFA, by age group and sex 45 Figure 3.11: Percent SAFA from Potatoes, kumara and taro, by age group and sex 46 Figure 3.12: Median MUFA intake (g), by age group and sex 51 Figure 3.13: Percent MUFA from Butter and margarine, by age group and sex 52 Figure 3.14: Median PUFA intake (g), by age group and sex 57 Figure 3.15: Percent PUFA from Butter and margarine, by age group and sex 58 Figure 3.16: Median cholesterol intake (mg), by age group and sex 63 Figure 3.17: Percent cholesterol from Eggs and egg dishes, by age group and sex 64 Figure 3.18: Median carbohydrate intake (g), by age group and sex 69 A Focus on Nutrition: Key Findings of the 2008/09 New Zealand Adult Nutrition Survey xi
12 Figure 3.19: Percent energy from carbohydrate, by age group and sex 70 Figure 3.20: Percent carbohydrate from non-alcoholic beverages, by age group and sex 71 Figure 3.21: Median intake of total sugars (g), by age group and sex 76 Figure 3.22: Percent total sugars from Non-alcoholic beverages, by age group and sex 77 Figure 3.23: Median sucrose intake (g), by age group and sex 82 Figure 3.24: Percent sucrose from non-alcoholic beverages, by age group and sex 83 Figure 3.25: Median fructose intake (g), by age group and sex 88 Figure 3.26: Percent fructose from Fruit, by age group and sex 89 Figure 3.27: Median lactose intake (g), by age group and sex 94 Figure 3.28: Percent lactose from Milk, by age group and sex 95 Figure 3.29: Median dietary fibre intake (g), by age group and sex 100 Figure 3.30: Percent dietary fibre from Vegetables, by age group and sex 101 Figure 4.1: Median vitamin A equivalents intake (μg RE), by age group and sex 114 Figure 4.2: Percent vitamin A from Vegetables, by age group and sex 115 Figure 4.3: Median b-carotene intake (μg), by age group and sex 120 Figure 4.4: Percent b-carotene from Vegetables, by age group and sex 121 Figure 4.5: Median retinol intake (μg), by age group and sex 126 Figure 4.6: Percent retinol from Butter and margarine, by age group and sex 127 Figure 4.7: Median vitamin C intake (mg), by age group and sex 132 Figure 4.8: Percent vitamin C from non-alcoholic beverages, by age group and sex 133 Figure 4.9: Median vitamin E intake (mg), by age group and sex 138 Figure 4.10: Percent vitamin E from Butter and margarine, by age group and sex 139 Figure 4.11: Median thiamin intake (mg), by age group and sex 144 Figure 4.12: Percent thiamin from Breakfast cereals, by age group and sex 145 Figure 4.13: Median riboflavin intake (mg), by age group and sex 150 Figure 4.14: Percent riboflavin from Milk, by age group and sex 151 Figure 4.15: Median niacin intake (mg), by age group and sex 155 Figure 4.16: Percent niacin from bread, by age group and sex 156 Figure 4.17: Median vitamin B 6 intake (mg), by age group and sex 161 Figure 4.18: Percent vitamin B 6 from Fruit, by age group and sex 162 Figure 4.19: Median vitamin B 12 intake (μg), by age group and sex 167 Figure 4.20: Percent vitamin B 12 from Beef and veal, by age group and sex 168 Figure 4.21: Median calcium intake (mg), by age group and sex 173 Figure 4.22: Percent calcium intake from Milk, by age group and sex 175 Figure 4.23: Median iron intake (mg), by age group and sex 180 Figure 4.24: Percent iron from breakfast cereals, by age group and sex 181 Figure 4.25: Median zinc intake (mg), by age group and sex 186 Figure 4.26: Percent zinc from Beef and veal, by age group and sex 187 Figure 4.27: Median potassium intake (mg), by age group and sex 192 Figure 4.28: Percent potassium from vegetables, by age group and sex 193 Figure 4.29: Median selenium intake (μg), by age group and sex 198 Figure 4.30: Percent selenium from Fish and seafood, by age group and sex 199 Figure 5.1: Percent Any supplement use, by age group and sex 205 Figure 5.2: Percent Regular supplement use, by age group and sex 206 Figure 5.3: Types of supplements, by sex 207 Figure 6.1: Percent eating breakfast daily, by age group and sex 216 Figure 6.2: Consumption of 3+ servings of vegetables a day, by age group and sex 219 xii A Focus on Nutrition: Key Findings of the 2008/09 New Zealand Adult Nutrition Survey
13 Figure 6.3: Consumption of 2+ servings of fruit per day, by age group and sex 221 Figure 6.4: Type of bread chosen most of the time, by sex 223 Figure 6.5: Light- or heavy-grain bread eaten most of the time, by age group and sex 224 Figure 6.6: Type of milk used most of the time, by sex 226 Figure 6.7: Reduced-fat or trim milk chosen most of the time, by age group and sex 227 Figure 6.8: Type of seafood eaten at least once a week, by sex 232 Figure 6.9: Frequency of removal of excess fat from meat, by sex 237 Figure 6.10: Frequency of removal of skin from chicken, by sex 238 Figure 6.11: Remove excess fat from meat regularly or always, by age group and sex 239 Figure 6.12: Remove skin from chicken regularly or always, by sex and age group 239 Figure 6.13: Spread used most of the time, by sex 241 Figure 6.14: Choice of low or reduced-fat varieties of food, by sex 245 Figure 6.15: Addition of salt to food after cooking or preparation, by sex 247 Figure 6.16: Choice of low- or reduced-salt varieties of food, by sex 248 Figure 6.17: Frequency of eating fast food or takeaways, by sex 251 Figure 6.18: Fast food or takeaways eaten 3 or more times a week, by age group and sex 252 Figure 6.19: Frequency of eating hot chips, French fries, wedges or kumara chips, by sex 253 Figure 6.20: Hot chips, French fries, wedges or kumara chips eaten 3 or more times a week, by age group and sex 254 Figure 6.21: Frequency of drinking fruit juice and fruit drinks, by sex 255 Figure 6.22: Frequency of drinking soft drinks and energy drinks, by sex 256 Figure 6.23: Soft drink intake 3+ days a week, by age group and sex 257 Figure 7.1: Food security categories, by sex 263 Figure 8.1: BMI category, by sex 276 Figure 8.2: Prevalence of obesity, by age group and sex 277 Figure 8.3: Mean systolic blood pressure (mmhg), by age group and sex 282 Figure 8.4: Mean total blood cholesterol (mmol/l), by age group and sex 290 Figure 8.5: Mean HDL cholesterol (mmol/l), by age group and sex 291 Figure 8.6: Mean red blood cell folate (nmol/l), by age group and sex 295 Figure A4.1: Matching foods to nutrient lines from food composition databases 325 Figure A4.2: 2008/09 NZ Adult Nutrition Survey recipes 326 Figure A4.3: Brand and product name nutrient matching 327 Figure A4.4: Food amounts converted to grams 328 A Focus on Nutrition: Key Findings of the 2008/09 New Zealand Adult Nutrition Survey xiii
14
15 Glossary 24-hour recall A dietary assessment method that collects information on all foods and drinks consumed in a 24-hour period. 95% confidence interval An indicator of the accuracy of a survey estimate. The 95% confidence interval (95% CI) is the interval that would be expected to contain the true population value 95% of the time, if many samples were taken. In this report, 95% confidence intervals have been presented in parentheses in tables, and as error bars in graphs. Acceptable macronutrient distribution range (AMDR) Adjustment Anthropometry Bioavailability Blood pressure Body mass index (BMI) Crude data Dietary supplements Estimated average requirement (EAR) Fatty acid An estimate of the range of intake for each macronutrient (expressed as percent contribution to energy), which would allow for an adequate intake of all the other nutrients while maximising good health (applies only to adults and young people aged 14 years and over). This is where rates or results have been adjusted to take account of differences in the distribution of other factors (such as age) between different groups (eg, ethnic groups). The measurement of body size (eg, height and weight). The degree to which a nutrient (eg, iron) or drug becomes available for use in the body after ingestion or administration. The pressure exerted by circulating blood on the walls of blood vessels. Blood pressure is measured as maximum (systolic) and minimum (diastolic) blood pressure. A measure of weight adjusted for height used to classify people as underweight, normal, overweight or obese. BMI is calculated by dividing weight in kilograms by height in metres squared (kg/m 2 ). An estimate that has not been adjusted for other factors (such as age or ethnicity). Products containing vitamins, minerals, herbs or botanicals, amino acids and various other dietary substances that are intended to supplement the diet rather than be an entire meal or diet. They are intended for ingestion as a pill, capsule, tablet or liquid and do not usually resemble conventional foods. A daily nutrient level estimated to meet the requirements of half of the healthy individuals in a particular life stage and gender group. A component of fat consisting of a hydrocarbon chain with a methyl group at one end and a carboxyl group at the other. The three main types of fatty acids in the diet are: saturated, monounsaturated and polyunsaturated. A Focus on Nutrition: Key Findings of the 2008/09 New Zealand Adult Nutrition Survey xv
16 Folate Folic acid Food security FOODfiles Fortification Glycated haemoglobin (HbA1c) Haemoglobin LINZ LINZ24 Lipoproteins Macronutrients Meshblock Micronutrients Monounsaturated fatty acid (MUFA) Neighbourhood deprivation Neural tube defects (NTDs) A generic term for the various forms of folate found in food. Folate is involved in the metabolism of nucleic and amino acids, and hence the synthesis of deoxyribonucleic acid (DNA), ribonucleic acid and proteins. A synthetic form of folate, which is found in supplements and fortified foods and beverages. It is more bioavailable and stable than folate in food. Access to adequate, safe, affordable and acceptable food. In contrast, food insecurity occurs when the availability of nutritionally adequate and safe foods, or the ability to acquire such foods, is limited or uncertain. An electronic subset of the New Zealand Food Composition Database. The addition of permitted nutrients to food. Nutrients can be added to correct a demonstrated deficiency in the population, to replace nutrients lost during processing, storage or handling, or for other reasons. A measure of average blood glucose over the past four to six weeks. HBA1c is measured as a percentage The protein that carries oxygen in the red blood cells. Life in New Zealand Nutrition and Activity Research Unit, University of Otago. The data capture software package of the LINZ Nutrition and Activity Research Unit, University of Otago. Clusters of lipids associated with proteins that serve as transport vehicles for lipids in the lymph and blood. Dietary fats circulate in the blood bound to lipoproteins. Nutrients needed in larger quantities, such as protein, carbohydrate and fat. The smallest geographic unit for which statistical data are collected by Statistics New Zealand. Meshblocks vary in size from part of a city block to large areas of rural land. Each meshblock abuts another to cover all of New Zealand. Nutrients needed in small amounts, such as vitamins and minerals. A type of unsaturated fatty acid in which there is one double bond. A measure of the socioeconomic status of an area (see New Zealand Deprivation Index 2006). A group of birth defects in which the brain, spinal cord or covering of these organs has not developed properly. xvi A Focus on Nutrition: Key Findings of the 2008/09 New Zealand Adult Nutrition Survey
17 New Zealand Deprivation Index 2006 (NZDep2006) New Zealand Food Composition Database Nutrient reference values (NRVs) Obesity PC-SIDE Polyunsaturated fatty acid (PUFA) Prevalence Retinol equivalent Saturated fatty acid (SAFA) Total response ethnic group Trans fatty acids An area-based index of deprivation, which measures the level of socioeconomic deprivation for each neighbourhood (meshblock) according to a combination of the following 2006 census variables: income, benefit receipt, transport (access to car), household crowding, home ownership, employment status, qualifications, support (sole-parent families), and access to a telephone. In this report, results are presented as quintiles (each quintile contains approximately 20% of the population). A database containing data on the nutrient composition of foods and drinks commonly consumed in New Zealand. A set of recommendations for intakes of energy and nutrients aimed at avoiding deficiency and excess/toxicity. They also include guidance on the dietary patterns needed to reduce the risk of chronic disease. Excess weight for height to the extent that health may be affected. Computer software used to estimate distribution of usual nutrient intake for a group. An unsaturated fatty acid with two or more double bonds. Dietary sources include most plant oils, particularly sunflower, soybean, safflower and corn, as well as most margarines and spreads. The proportion of people with a health-related state (typically a disease or risk factor) at a specific period of time within a specific population. It is defined as the total number of cases in the population, divided by the number of individuals in the population. The recommendation for vitamin A intake is expressed as micrograms of retinol equivalents. Retinol equivalents account for the conversion of some β-carotene to retinol. One microgram (1 µg) of retinol equivalent equals 1 µg of retinol, or 6 µg of β-carotene. A fatty acid in which there are no double bonds between the carbon atoms of the fatty acid chain. Diets high in saturated fatty acids increase the risk of atherosclerosis and coronary heart disease. A categorisation of ethnicity whereby each person is assigned to all those ethnicities they identify with. Total response ethnicity has been used in this publication. Unsaturated fatty acids with one or more double bonds in the trans configuration. These occur naturally in some ruminant foods, but are also produced by partial hydrogenation of polyunsaturated fats in food processing. A Focus on Nutrition: Key Findings of the 2008/09 New Zealand Adult Nutrition Survey xvii
18 Usual intake The distribution of observed intakes from a single 24-hour recall, adjusted to remove the effects of within-person (or intraindividual) variability. This can be achieved by collecting two 24-hour recalls from a representative sub-sample of the group. xviii A Focus on Nutrition: Key Findings of the 2008/09 New Zealand Adult Nutrition Survey
19 Abbreviations AMDR BMI CAPI CI acceptable macronutrient distribution range body mass index computer-assisted personal interview confidence interval CNS National Children s Nutrition Survey (2002) CURF DFE EAR HDL ICCIDD LDL LINZ LINZ24 MUFA NHANES confidentialised unit record file dietary folate equivalent estimated average requirement high-density lipoprotein cholesterol International Council for Control of Iodine Deficiency Disorders low-density lipoprotein cholesterol Life in New Zealand Nutrition and Activity Research Unit, University of Otago data capture software package of the LINZ Nutrition and Activity Research Unit, University of Otago monounsaturated fatty acid United States National Health and Nutrition Examination Survey NNS National Nutrition Survey (1997) NRV NTDs nutrient reference value neural tube defects NZANS New Zealand Adult Nutrition Survey (2008/09) NZDep2006 New Zealand Deprivation Index 2006 NZEO NZFCDB PUFA RE SAFA USDA New Zealand European and Others ethnic group New Zealand Food Composition Database polyunsaturated fatty acid retinol equivalent saturated fatty acid United States Department of Agriculture A Focus on Nutrition: Key Findings of the 2008/09 New Zealand Adult Nutrition Survey xix
20
21 Executive Summary Introduction The 2008/09 New Zealand Adult Nutrition Survey (NZANS) was carried out from October 2008 to October 2009, collecting information from 4721 adult New Zealanders aged 15 years and over. The 2008/09 NZANS assessed self-reported food and nutrient intake, dietary habits and eating patterns, dietary supplement use, household food security, and nutritionrelated health conditions and risk factors. The survey also included measurements (height, weight, waist circumference and blood pressure) and the collection of blood and urine samples. A final response rate of 61% was achieved (44% for blood and urine samples). These response rates are considered good for a national nutrition survey. All results have been weighted in order to be representative of New Zealand s estimated resident population aged 15 years and over living in permanent private dwellings at 31 June Nutrition is an important determinant of health. This survey provides valuable information for the development, implementation and monitoring of nutrition policies and programmes to improve the health of New Zealanders. Knowledge of New Zealanders dietary habits, body size and nutrition-related health will assist health professionals to provide nutrition advice that is relevant and will help with planning services for diabetes and cardiovascular disease. Survey data can also be used to inform the development of food standards and monitor changes in the food supply. The analyses presented in this report are only a small proportion of those that could be undertaken, and in many ways pose more questions than they answer. The Ministry of Health encourages researchers to use 2008/09 NZANS data sets to explore topics of interest. Additional descriptive results are available in the online data tables. Reports presenting results for Māori compared to non-māori and Pacific compared to non- Pacific will be released in late Energy and macronutrient intake Energy Energy is required in the body for metabolic processes, physiological functions, muscular activity, heat production, growth and the synthesis of new tissues. The macronutrients protein, carbohydrate, fat and alcohol from food and drinks are the only sources of energy for humans. The median daily energy intake from foods and beverages was 10,380 kj for males and 7448 kj for females. The Bread group was the main contributor to energy intake (11%), followed by Grains and pasta (7%) and Potatoes, kumara and taro (6%). A Focus on Nutrition: Key Findings of the 2008/09 New Zealand Adult Nutrition Survey xxi
22 The reported energy intake of New Zealanders aged 15 years and over has dropped since 1997, although the decrease for females was not significant. The increase in body weight, body mass index and the prevalence of obesity in the intervening period suggests that the energy equation continues to be unbalanced, with energy in exceeding energy out. The survey did not assess energy expenditure, so further research is needed to explore the underlying reasons for the reported decrease in energy intake from 1997 to 2008/09. Protein Protein is necessary to build, maintain and repair tissue and to synthesise hormones, enzymes and antibodies. Proteins are made up of 20 amino acids, some of which the body can synthesise, but others must be obtained from food. The median usual daily intake was 102 g of protein for males and 71 g for females, with most people (98%) meeting the recommended average protein requirement. Protein provided 16.4% and 16.5% of energy for males and females, respectively; this falls within the recommended range of 15 25% energy from protein. The single biggest contributor of protein in the diet was the Bread group (11%), followed by the groups Poultry and Milk (each 9%). The contribution of protein to energy has increased from 1997 to 2008/09 for both males and females. Fat Fats are the most concentrated sources of energy. Dietary fats also help in the absorption of fat-soluble vitamins, are the precursors of many hormones, and are an important structural component of cell membranes. There are three main types of fatty acids in the diet: saturated, monounsaturated and polyunsaturated. The median usual daily intake of total fat was 95 g for males and 67 g for females. Total fat provided 33.7% and 33.8% of energy for males and females, respectively; this falls within the recommended range of 20 35% energy from total fat. The biggest single contributor to total fat in the diet was the group Butter and margarine (9%), followed by Potatoes, kumara and taro, Bread-based dishes and Poultry (each 6%). The contribution of total fat to energy has decreased from 1997 to 2008/09 for males and females, although the decrease was not significant for females. The median usual daily intake of saturated fat was 36.5 g for males and 25.8 g for females. Saturated fat was provided by the following groups: Butter and margarine and Milk (each 8%), Bread-based dishes, Cheese and Potatoes, kumara and taro (each 6%). From 1997 to 2008/09 there was a decline in the contribution of saturated fat to daily energy intake for both males (15.1% to 13.1%) and females (14.7% to 13.1%). However, this contribution is still above the recommended 10% contribution of saturated fat to total energy. The median usual daily intake of monounsaturated fat was 35.1 g for males and 24.3 g for females. The Butter and margarine group provided 10% of monounsaturated fat, Poultry and Potatoes, kumara and taro each provided 7%, and Bread-based dishes and Beef and veal each provided 6%. From 1997 to 2008/09 the proportion of energy from xxii A Focus on Nutrition: Key Findings of the 2008/09 New Zealand Adult Nutrition Survey
23 monounsaturated fat increased for both males (11.8% to 12.4%) and females (11.4% to 12.3%). The median usual daily intake of polyunsaturated fat was 13.1 g for males and 9.6 g for females. Polyunsaturated fat provided 4.8% and 4.9% of energy for males and females, respectively. The Butter and margarine group provided 12% of polyunsaturated fat, Bread 9%, Bread-based dishes and Potatoes, kumara and taro each 7%, and Vegetables and Poultry each 6%. There was no change in polyunsaturated fat intake from 1997 to 2008/09. Carbohydrate Carbohydrates are a diverse group of substances with varied chemical and physiological properties with varying importance to health. They include the sugars, starches and fibres. The median usual daily intake was 278 g of carbohydrate for males and 207 g for females. The mean contribution of carbohydrate to daily energy intake was 46.0% for males and 47.1% for females; this falls within the recommended range of 45 65% energy from carbohydrate. Bread was the biggest single contributor to carbohydrate intake (17%). There was no change in the contribution of carbohydrate to daily energy from 1997 to 2008/09. The median usual daily intake of total sugars was 120 g for males and 96 g for females. Sucrose was the major contributor to total sugars, followed by fructose, glucose, lactose and maltose. Almost one-quarter of the sucrose came from the group Sugars and sweets (23%), followed by Non-alcoholic beverages and Fruit (each 16%). Dietary fibre intake was 22.1 g and 17.5 g per day for males and females, respectively. Bread (17%) and Vegetables (16%) were the main contributors to dietary fibre intake, followed by Potatoes, kumara and taro, and Fruit (each 12%). Micronutrient intake Micronutrients are nutrients needed in small amounts, such as vitamins and minerals. The survey measured intakes of vitamins A, B, C and E and the minerals calcium, iron, zinc, potassium and selenium. Where appropriate, micronutrient intakes were compared to nutrient reference values to estimate the prevalence of inadequate intake. Estimates of vitamin and mineral intake are from food and beverages only, and do not include micronutrients from supplements (other than supplements providing energy, eg meal replacements). Vitamins Forty-two percent of vitamin A in the diet came from retinol (animal-based foods) and the remainder from carotenoids (plant-based foods). The estimated prevalence of inadequate vitamin A intake was higher for males (22.7%) than for females (12.1%). There was a decrease in vitamin A intake from 1997 to 2008/09 for both males and females. A Focus on Nutrition: Key Findings of the 2008/09 New Zealand Adult Nutrition Survey xxiii
24 The B vitamins thiamin, riboflavin, niacin, vitamin B6 and vitamin B12 appear to be adequate for many males and females, but intakes in some age groups were less than optimal. Vitamin C intakes were adequate for almost all New Zealanders aged 15 years and over. The predominant sources of vitamin C were Vegetables (28%), Fruit (22%), Non-alcoholic beverages (15%) and Potatoes, kumara and taro (13%). Minerals Most New Zealanders aged 15 years and over do not meet the recommendations for calcium intake. However, the adequacy of calcium intake is difficult to interpret given the high recommended levels to which they are compared and because calcium intake is only one of many factors that affect bone health. Experts worldwide are not agreed on optimal intakes because although calcium is of major importance to attaining and maintaining bone health, many other factors such as vitamin D status, physical activity levels and habitual levels of intake also influence bone health. One in four (24.7%) New Zealanders aged 15 years and over had an inadequate intake of zinc (males 39.1%; females 11.2%). Beef and veal (10%), Bread (10%) and Grains and pasta (9%) were the largest contributors of zinc to the diet. There was a decrease in zinc intake from 1997 to 2008/09 for both males and females. Selenium intakes increased from 1997 to 2008/09, but intakes were still inadequate for about one-third of males (31.5%) and over half (58.2%) of females. The Bread group was the largest single contributor of selenium to the diet (15%), followed by Fish and seafood (12%), and Poultry (10%). Dietary supplements Although the energy nutrient intakes of the population have been calculated without adding nutrients from supplements (other than supplements providing energy), information about the use of dietary supplements was collected. Oils (fish oils and plant oils) was the supplement group used most often by New Zealanders aged 15 years and over. The Regular use of supplements was more frequent among older New Zealanders and Occasional use more frequent among younger age groups. Dietary habits Dietary habits and patterns are associated with diet quality and nutrition-related health status. Participants were asked about key behaviours such as breakfast consumption, the frequency of eating certain foods and food groups, food preparation and cooking practices (eg, removal of excess fat, addition of salt), and choosing low fat or reducedsalt foods. xxiv A Focus on Nutrition: Key Findings of the 2008/09 New Zealand Adult Nutrition Survey
25 Breakfast was eaten daily by two-thirds of New Zealanders aged 15 years and over (males 64.5%; females 69.1%). Those aged 51+ years were more likely to have eaten breakfast daily than younger age groups. Three-fifths (59.3%) of males and 72.2% of females reported eating the recommended three or more servings of vegetables each day, and 54.6% of males and 65.8% of females reported eating the recommended two or more servings of fruit each day. From 1997 to 2008/09 there was an increase in the proportion of males and females who reported eating the recommended number of servings of fruit, with no change in the proportion who reported eating the recommended number of servings of vegetables. Whole-grain bread (heavy or light grain) was chosen most often by 60.4% of males and 65.9% of females. The proportion of males and females choosing whole-grain bread increased with increasing age. Reduced-fat or trim milk was chosen most of the time by 44.5% of males and 51.9% of females. The use of reduced-fat or trim milk increased with increasing age for both males and females. The excess fat was regularly or always removed from meat by 56.5% of males and 67.4% of females. Chicken skin was regularly or always removed by 42.3% of males and 53.5% of females. Two-thirds of males (68.4%) and females (68.8%) reported choosing margarine as a spread most of the time, and one-fifth (20.1%) chose butter. Oil was used most often when cooking by 89.7% of males and 90.1% of females. Almost all (98%) males and females used salt in the home. Of those who used salt in the home, 85.7% used iodised salt. Food security Food security is an internationally recognised term that encompasses the ready availability of nutritionally adequate and safe foods, and the assured ability to acquire personally acceptable foods in a socially acceptable way. Based on responses to a series of eight statements, 59.1% of households were classified as being Fully/almost food secure, 33.7% were classified as being Moderately food secure, and 7.3% were classified as having Low food security. From 1997 to 2008/09 the proportion of households classified as having Low food security increased for males (1.6% to 5.6%) and females (3.8% to 8.8%). Nutrition-related health outcomes A range of anthropometric, biochemical and clinical measures were used to assess nutrition-related health status. A Focus on Nutrition: Key Findings of the 2008/09 New Zealand Adult Nutrition Survey xxv
26 Body size and obesity A healthy body size is important for good health and wellbeing. Obesity is associated with a long list of health conditions, including: cardiovascular disease (ischaemic heart disease, high blood pressure and stroke), various types of cancer, type 2 diabetes, osteoarthritis, sleep apnoea, and psychological and social problems. Mean BMI was 27.6 kg/m 2 for both males and females. From 1997 to 2008/09 there was an increase in mean BMI in both males and females. The prevalence of obesity was 27.7% in males and 27.8% in females, an increase since 1997 (males 17.0%, females 20.6%). Data from the 2002/03 and 2006/07 New Zealand Health Surveys have previously shown that the prevalence of obesity had increased since Blood pressure Mean systolic blood pressure was 130 mmhg in males and 122 mmhg in females. Systolic blood pressure was highest in those aged 71+ years. Iron status The prevalence of iron deficiency among females aged 15 years and over increased from 2.9% in 1997 to 7.2% in 2008/09. Folate status It was not possible to reliably determine dietary folate intake, but biochemical measures indicate folate status is satisfactory for most New Zealanders aged 15 years and over. Four percent of women of childbearing age had red blood cell folate levels associated with a high risk of having a baby affected by neural tube defects (NTDs), such as spina bifida. Twenty-seven percent had levels associated with a low risk of NTDs ( 906 nmol/l). Iodine status The New Zealand population aged 15 years and over is classified as mildly iodine deficient because the median urinary iodine concentration of 53 µg/l falls within the range defined by the International Council for the Control of Iodine Deficiency Disorders as mild iodine deficiency (50 99 µg/l). This survey took place before the implementation of mandatory fortification of bread with iodised salt (to reduce the prevalence of iodine deficiency) in September Blood cholesterol From 1997 to 2008/09 total cholesterol levels decreased in males (5.70 to 5.09 mmol/l) and females (5.73 to 5.17 mmol/l), while HDL cholesterol levels have increased slightly. Although it is likely that dietary factors, such as the decrease in saturated fat intake, contributed to the decline in total cholesterol, the increased prescribing of lipidlowering drugs is also likely to have played a role. xxvi A Focus on Nutrition: Key Findings of the 2008/09 New Zealand Adult Nutrition Survey
27 Diabetes Glycated haemoglobin (HbA1c) was measured in blood samples to allow the prevalence of undiagnosed diabetes to be estimated. Overall, 7.1% of New Zealanders aged 15 years and over have diabetes. Of these, just over one-quarter (2.0% of the total population) had not reported being told by a doctor that they had diabetes but had HbA1c levels 6.5%, which is indicative of undiagnosed diabetes. HbA1c levels also give an indication of blood glucose management among those who have been diagnosed with diabetes. Just under one-half (48.5%) of those with known diabetes had good diabetes control (HbA1c levels < 7.0%). A Focus on Nutrition: Key Findings of the 2008/09 New Zealand Adult Nutrition Survey xxvii
28
29 1 Introduction 1.1 Overview The 2008/09 New Zealand Adult Nutrition Survey (NZANS) was carried out from October 2008 to October 2009, collecting information from 4721 New Zealanders aged 15 years and over. The 2008/09 NZANS assessed self-reported food and nutrient intake, dietary habits and eating patterns, dietary supplement use, food security, and nutrition-related health conditions and risk factors. The survey also included an examination component, comprising anthropometric measures (height, weight and waist circumference), blood pressure measurement, and the collection of blood and urine samples. A final response rate of 61% was achieved. All results have been weighted in order to be representative of New Zealand s estimated resident population aged 15 years and over living in permanent private dwellings at 31 June The Statement of Intent sets out the Ministry of Health s strategic direction for 2011 to 2014 (Ministry of Health 2011). The Government s overarching goal for health is to enable New Zealanders to live longer, healthier and more independent lives. Lifelong good nutrition and appropriate physical activity are the key elements needed to achieve this. The 2008/09 NZANS will provide valuable information for the monitoring, development and implementation of the Ministry s nutrition policies and programmes, and the monitoring of inequalities. In particular, the results from this survey will provide guidance for health professionals working towards meeting the Government s health target related to better diabetes and cardiovascular services. Knowledge of New Zealanders dietary habits, body size and nutrition-related health will assist health professionals to provide nutrition advice that is relevant and will help with planning the type and amount of services required for diabetes and cardiovascular disease. The Government introduced mandatory fortification of bread with iodised salt in September The 2008/09 NZANS will provide baseline data for monitoring the impact of fortification by providing an overview of the iodine status of the New Zealand population. The survey data can also be used to inform the development of food standards and monitoring of changes in the food supply. 1.2 Background The 2008/09 NZANS is a component of the New Zealand Health Monitor, an integrated programme of household surveys and cohort studies managed by the Ministry of Health, and is a key element of the cross-sector programme of Official Social Statistics. The 2008/09 NZANS is the fourth national population-based nutrition survey in adults and the second funded by the Ministry of Health. Earlier surveys were the 1977 National Diet Survey (Birkbeck 1983), the 1989 Life in New Zealand Survey (Russell and Wilson 1991) and the 2002 National Nutrition Survey (Russell et al 1999). A Focus on Nutrition: Key Findings of the 2008/09 New Zealand Adult Nutrition Survey 1
30 As a signatory to the Protocols of Official Statistics (Statistics New Zealand 1998), the Ministry of Health employed best-practice survey techniques in the 2008/09 NZANS to produce high-quality data. Standard frameworks and classifications with validated questions were utilised, where possible, to allow for the integration of 2008/09 NZANS data with data from other sources. Ethical approval for the 2008/09 NZANS was gained through the Multi-Region Ethics Committee. Objectives of the 2008/09 NZ Adult Nutrition Survey The objectives of the 2008/09 NZANS were to: 1. assess the consumption of food and food groups, and their contribution to nutrient intake, and where possible to compare the results with the New Zealand Food and Nutrition Guidelines for Healthy Adults and the Food and Nutrition Guidelines for Healthy Older People 2. assess the nutrient intakes of the population and assess dietary adequacy against the nutrient reference values for Australia and New Zealand 3. assess the consumption of dietary supplements 4. assess the nutritional status of the adult population using a range of anthropometric, biochemical and clinical measures 5. examine factors associated with dietary intake, including food security and dietary patterns 6. estimate the prevalence of nutrition-related chronic diseases, such as cardiovascular disease and diabetes 7. estimate the prevalence of risk factors that influence dietary intake and nutritional status. 1.3 Further information The Ministry of Health hopes this report stimulates interest in the dietary patterns and health of New Zealanders and generates more research, both through additional use of the 2008/09 NZANS data and by informing future research directions and priorities. There are several ways to access further information and data from the 2008/09 NZANS: through the online data tables through the confidentialised unit record files (CURFs) by contacting Health and Disability Intelligence at the Ministry of Health. The analyses presented in this report are only a small proportion of those that could be undertaken, and in many ways pose more questions than they answer. The Ministry of Health encourages researchers to use 2008/09 NZANS data sets to explore topics of interest. Online data tables, which contain data for additional descriptive results, are available online in Excel format: 2 A Focus on Nutrition: Key Findings of the 2008/09 New Zealand Adult Nutrition Survey
31 Confidentialised unit record files (CURFs) are potentially available for statistical purposes to bona fide public good researchers, subject to certain conditions. The NZANS CURFs, with accompanying documentation and user guides, will be available in early For more information on accessing CURFs, and to download an application form, please go to The survey questionnaire, methodology report and additional publications will be made available on Health and Disability Intelligence can be contacted: by mail: Health and Disability Intelligence Ministry of Health PO Box 5013 Wellington by phone: by hdi@moh.govt.nz, or to contact staff directly, firstname_lastname@moh.govt.nz A Focus on Nutrition: Key Findings of the 2008/09 New Zealand Adult Nutrition Survey 3
32 2 Methodology A brief overview of the methodology is presented in this chapter. This should be sufficient to enable a general understanding of the sample design, recruitment of participants, instruments used, analysis and presentation of results. A full account of the methodology is provided in the Methodology Report for the 2008/09 New Zealand Adult Nutrition Survey, which is available on the Ministry of Health website at Overview of survey design Target population The target population for the 2008/09 NZANS was the usually resident civilian population aged 15 years and over living in permanent private dwellings in New Zealand. Sample design The 2008/09 NZANS used a multi-stage, stratified, probability-proportional-to-size (PPS) sample design, with increased sampling of some ethnic groups and age groups, primarily through a screened sample. A three-step process was used to achieve the sample: a sample of 607 meshblocks was selected a sample of dwellings was selected from each meshblock one eligible adult (aged 15 years and over, if any) was selected from each selected dwelling. Participant recruitment Recruiters from CBG Health Research Limited (CBG) visited each selected dwelling, assessed the eligibility of prospective participants, informed prospective participants about the survey, and gathered consents from those who agreed to be contacted by a University of Otago interviewer. Recruiters collected information on the age and ethnicity of all occupants (adults aged 15 years and over) in the household. The eligible prospective participant was informed about the study verbally, and given a copy of the information pamphlet about the survey (see and an opportunity to ask questions. Contact details were collected to facilitate the transition to the University of Otago interviewer team. Participation was voluntary, with no inducement to participate. Consent was obtained in two parts: consent to be contacted by an interviewer to arrange a survey interview (collected with electronically recorded signature by the recruiter at first contact), and consent to participate in the survey (collected in hard copy by the interviewer at the survey interview). 4 A Focus on Nutrition: Key Findings of the 2008/09 New Zealand Adult Nutrition Survey
33 Prospective participants were first given the survey information pamphlet by the recruiter. The pamphlet was available in English, Māori, Samoan, Tongan, Chinese, Korean, Hindi and Punjabi. The information pamphlet was provided again by the interviewer. 2.2 Data collection The 2008/09 NZANS was carried out from October 2008 to October 2009, collecting information from a sample of New Zealanders aged 15 years and over. Contact details collected by CBG recruiters were transferred to the University of Otago project office via a secure connection. A University of Otago interviewer arranged interview dates and times. The aim was to achieve a relatively even spread of interviews by day of week, with a minimum of 10% of interviews on both Saturday and Sunday. The survey interviews and measurements were carried out in the participant s home by a University of Otago interviewer utilising customised data collection software. If required, an interviewer was accompanied by an interpreter. Interviewer training The interviewers attended a two-week training programme in October 2008 and were provided with a detailed interviewer training manual. Interviewer retraining days were conducted in January and June Two regional supervisors received additional training on contact procedures, support of interviewers and quality control. Throughout the survey, interviewers were provided with feedback from project office staff on the accuracy and completeness of their data. Random telephone checks were carried out on approximately 10% of completed interviews to check participant satisfaction and interviewer adherence to the survey protocol. Interview process Data were collected during the approximately 90-minute interview in the following computer-controlled order: initial demographics 24-hour diet recall questionnaires dietary habits, dietary supplement use, nutrition-related health, food security, sociodemographics blood pressure measurement height, weight and waist circumference measurement. Consenting participants were given a specimen collection kit containing materials for blood and urine samples and information on their closest Canterbury Health Laboratory affiliated laboratory, and they were requested to attend within two weeks of the interview. A Focus on Nutrition: Key Findings of the 2008/09 New Zealand Adult Nutrition Survey 5
34 A random sample of 33% of participants was asked to complete a second 24-hour diet recall within a month of the first interview to allow calculation of intra-individual variability in intake of nutrients. All participants received a bag with the survey logo at the time of the interview, whether or not they provided a blood or urine sample. Participants who provided blood and urine samples were posted a $50 grocery voucher when the project office received their blood results from Canterbury Health Laboratories. Participant feedback All participants who provided a blood sample were sent a personalised letter reporting selected results and providing a generic explanation of their significance (see Appendix 2). If any result was outside the expected range, they were advised to approach their doctor to discuss these but an abnormal pattern of results was checked by a registered medical specialist. Where these abnormal patterns indicated presence of a medical condition of serious concern the participant was contacted by the medical specialist. Security of information Any information collected in the survey that could be used to identify individuals has been treated as strictly confidential. Data were transferred from interviewers laptops to the project office via a secure connection. The names and addresses of the people who participated in the survey were not stored with response data. Unit record data were stored in a secure area and were only accessible on a restricted ( need to know ) basis. 2.3 Instruments Multiple-pass 24-hour diet recall A 24-hour diet recall is the dietary assessment method used in most national nutrition surveys because it is more cost-effective and imposes less respondent burden than a diet record. A 24-hour diet recall is used in the United States National Health and Nutrition Examination Survey (NHANES), and was used in the 2004 Canadian Community Health Survey (Nutrition Cycle) and the 1995 Australian National Nutrition Survey. The multiple-pass 24-hour diet recall for the survey was interviewer administered using the LINZ24 module of the Abbey Research software package (LINZ Health and Activity Research Unit, University of Otago, Dunedin, New Zealand). LINZ24 was used for both the 1997 National Nutrition Survey (Parnell et al 2001; Quigley and Watts 1997) and the 2002 National Children s Nutrition Survey (Ministry of Health 2003a). The approach is analogous to the US Department of Agriculture Automated Multiple- Pass Method, which is used to collect dietary data in NHANES without the forgotten foods list step (Blanton et al 2006). 6 A Focus on Nutrition: Key Findings of the 2008/09 New Zealand Adult Nutrition Survey
35 The multiple-pass 24-hour diet recall collected quantitative information on all foods and drinks consumed by the participant in the previous day (from midnight to midnight), including foods and drinks consumed both at and away from home. The 24-hour diet recall was conducted in four stages using a standardised computer-prompted protocol. 1. A quick list of all foods, beverages and dietary supplements consumed during the preceding day (midnight to midnight) was obtained. 2. Detailed descriptions were obtained of all items consumed, using specific questions and prompts, including cooking method, recipe for mixed dishes (where known), any additions made before consumption, brand and product name, time consumed and where the food was sourced. Brand and product name were determined using a bar code scanner for food items where the composition was brand specific and packaging was available. 3. Estimates were made of amounts of items consumed, wherever possible (eg, cups, tablespoons), using food photographs, shape dimensions, food portion assessment aids (eg, dried beans) and packaging information. 4. All items were reviewed in chronological order. Any additions and changes were made at this point. On completion of the 24-hour diet recall, the interviewer asked the participant to show them any container in which salt used by the household was purchased. Once it had been sighted the interviewer recorded whether or not the salt was iodised. Questionnaire The questionnaire collected information on dietary habits, use of dietary supplements, nutrition-related health, food security and sociodemographic information. The interviewer recorded participant responses directly into a laptop computer using computer-assisted personal interview (CAPI) software. Questionnaire modules are briefly outlined below (see the Methodology Report for more detail). The full questionnaire is available at Dietary habits The Dietary Habits Questionnaire consisted of a series of questions on dietary habits associated with diet quality and/or nutritional status. The questionnaire focused on key dietary patterns or habits, particularly those associated with the Ministry of Health s priority areas at the time of the survey design, including the consumption of selected foods and food groups, the use of low-fat and -sodium foods, food preparation and cooking practices, breakfast consumption, and the use of salt. A Focus on Nutrition: Key Findings of the 2008/09 New Zealand Adult Nutrition Survey 7
36 Dietary supplements Dietary supplements were defined as anything the participant considered to be a supplement to their diet. Therefore, supplements included a range of substances, from vitamins and minerals to others such as flaxseed oil, garlic, and spirulina. Participants were asked to recall all dietary supplements consumed in the past 12 months. Each supplement was then classified into one of the following categories: single vitamin, single mineral, multi-vitamin, multi-mineral, multi-vitamin and multi-mineral, oil, or other supplement (eg, ginkgo, St John s Wort, meal replacement). Nutrition-related health The nutrition-related health questionnaire included questions on long-term health conditions and risk factors such as smoking, alcohol consumption and adult weight gain. Participants were asked if they had been diagnosed by a doctor with any of the following long-term health conditions: heart disease, stroke, diabetes, osteoporosis, high blood pressure or high blood cholesterol. Food security Household food security was determined using the series of statements that had been used in the 1997 National Nutrition Survey and the 2002 Children s Nutrition Survey. The statements aimed to determine whether participants considered that their household had a compromised food intake for financial reasons. For example, participants were asked to report how often a statement such as Food runs out in my/our household due to lack of money applied to them. Sociodemographics Sociodemographic information about participants is vital to help analyse the various determinants of health outcomes, and to monitor inequality and changes in health disparities. This module included questions on basic demographics (age, sex and ethnicity), education, personal and household income, income support and employment, labour force status, and household composition. Blood pressure Blood pressure was measured using an OMRON HEM 907 automated instrument. Three measurements of blood pressure were taken for each participant, with the mean of the second and third measurements used to calculate diastolic and systolic blood pressure. Blood pressure was not measured in pregnant women because pregnancy alters a woman s blood pressure. 8 A Focus on Nutrition: Key Findings of the 2008/09 New Zealand Adult Nutrition Survey
37 Anthropometric measurements Anthropometric measurements were made using professional equipment and standardised protocols (see the Methodology Report for more detail). Two measurements of weight, height and waist circumference were made on each participant (excluding pregnant women). If the first two measurements of height, weight and waist circumference differed by more than 1%, the interviewer was prompted to take a third measurement. Body measurements were made in the home, so measurements were made with the participant wearing light clothing and without shoes. Height was measured to the nearest 0.1 cm using a portable stadiometer (Seca 214). Weight was measured to the nearest 0.1 kg using electronic weighting scales (Tanita HD-351). Waist circumference was measured to the nearest 0.1 cm using a tape measure (W606PM anthropometric measuring tape). Blood and urine samples Participants gave specific consent at the interview to provide blood and urine samples. Each participant who gave informed consent to provide blood and urine samples was provided with a specimen collection kit and a list of Canterbury Health Laboratory affiliated laboratories in their area. The blood and urine indices measured are listed in Table 2.1. Table 2.1: Blood and urine samples Nutritional indicators Indices Blood lipids Total cholesterol, HDL cholesterol Iron status Serum ferritin, C-reactive protein, zinc protoporphyrin, transferrin saturation Folate status Whole blood folate, serum folate, red blood cell folate Diabetes HbA1c Electrolytes Urinary sodium, potassium and creatinine Iodine status Urinary iodine, thyroglobulin Vitamin D status Serum 25-hydroxyvitamin D, parathyroid hormone Analysis is not complete at the time of report writing. 2.4 Analysis of nutrient data Conversion of foods/beverages to nutrient intakes Foods and beverages from the 24-hour diet recall were matched to food composition data to calculate nutrient intake. The main source of food composition data was the New Zealand Food Composition Database (NZFCDB), which includes more than 2740 foods and complete data for 55 core nutrients. The Ministry of Health contracts the New Zealand Institute of Plant and Food Research Ltd to maintain and develop the NZFCDB. FOODfiles (August 2010), an electronic subset of data from the NZFCDB, was used to calculate nutrient intake and additional nutrient lines were added as required. Analytical techniques for nutrients in the NZFCDB are summarised in Appendix 3. A Focus on Nutrition: Key Findings of the 2008/09 New Zealand Adult Nutrition Survey 9
38 Key steps for matching food composition data to nutrient data are briefly outlined below. See the Methodology Report for more detailed information on the food/nutrient matching process and Appendix 4 for the summary flowcharts. Matching foods to a nutrient line in a food composition database Direct match to a nutrient line in FOODfiles. Foods commonly consumed in the 2008/09 NZANS but not included in FOODfiles were prioritised for analysis as part of the ongoing development of the NZFCDB. If the food could not be analysed, a recipe was created (see below). Where appropriate, foods were matched to a nutrient line from an overseas database, including databases from Australia, the United States, Britain, Asia and the Pacific. Creating a composite nutrient line or recipe When a food or beverage was not completely described by the participant (eg, type of milk), it was matched to a composite nutrient line based on data from FOODfiles, weighted to reflect use in the survey. If a food was a single ingredient, it was matched to a raw ingredient in FOODfiles and a recipe was created based on the cooking method (allowing for fat added during cooking, and weight and nutrient loss during cooking). If the food was a mixed food item, it was matched to a recipe and the nutrient composition of the recipe was calculated using data from FOODfiles (allowing for fat added during cooking, and weight and nutrient loss during cooking). Fortified foods If fortificant values in FOODfiles were not based on up-to-date analytical data, then fortificant information was sourced from the 2008 Manufactured Food Database. If foods were not included in the Manufactured Food Database, fortificant information was sourced from product packaging and/or food manufacturers. Food composition data are presented as the nutrient amount per 100 g of food. Therefore, all food intake data were converted to intakes in grams (see Appendix 4, Figure A4.4). Food intake data were converted from volume to grams by applying a density factor. Accuracy of nutrient estimates The accuracy of nutrient estimates depends on two factors: the accuracy of information provided by the participants in the 24-hour recall, and the accuracy of the food composition data. Key considerations related to these two potential sources of error are outlined below. 10 A Focus on Nutrition: Key Findings of the 2008/09 New Zealand Adult Nutrition Survey
39 Misreporting of a food intake, especially under-reporting, is a well-known problem in all types of dietary surveys regardless of the dietary assessment method used. If food intake is under-reported, energy and nutrient intakes may also be underestimated, and estimates of inadequate intake may be overestimated. It is difficult to quantify underreporting, but research shows that the degree of under-reporting varies according to personal characteristics and across types of foods. For example, under-reporting is more common in those with a high BMI, in females, and in some groups (Livingstone and Black 2003). Certain foods are more likely to be under-reported, especially those perceived as less healthy (eg, cakes, biscuits, desserts, fats). The NZFCDB includes more than 2740 foods and 55 core nutrients. Approximately 70% of foods in the NZFCDB are sampled from New Zealand sources and 50% of nutrient values are New Zealand analytical values (actual or derived), with the remaining values derived from other sources such as overseas databases. During the 2008/09 NZANS, the University of Otago worked closely with Plant and Food Research Ltd to match food consumption data to an appropriate nutrient line. Where food composition data were considered insufficiently reliable or incomplete (as was the case for iodine, folate, sodium and vitamin D), nutrient intake data have not been presented in this report. Nutrients from food groups In order to calculate sources of nutrients by food type, food items reported in the 24-hour diet recall were allocated to food groups (Table 2.2). A Focus on Nutrition: Key Findings of the 2008/09 New Zealand Adult Nutrition Survey 11
40 Table 2.2: Food groups used in the 2008/09 New Zealand Adult Nutrition Survey Food group Grains and pasta Bread Breakfast cereals Biscuits* Cakes and muffins* Bread-based dishes Puddings and desserts Milk Dairy products Cheese Butter and margarine Fats and oils Eggs and egg dishes Beef and veal Lamb and mutton Pork Poultry Other meat Sausages and processed meats Pies and pasties Fish and seafood Vegetables Potatoes, kumara and taro Snack foods Fruit Nuts and seeds Sugar and sweets Soups and stocks Savoury sauces and condiments Examples of food items included Rice (boiled, fried, risotto, sushi, salad), flour, pasta/noodles, bran, cereal-based products and dishes (pasta and sauce, lasagne, pasta salad, noodle soup, chow mein) All types of bread (rolls, pita, foccacia, garlic), bagels, crumpets, sweet buns All types (muesli, wheat biscuits, porridge, puffed/flaked/extruded cereals) Sweet biscuits (plain, chocolate coated, fruit filled, cream filled), crackers All cakes and muffins, slices, scones, pancakes, doughnuts, pastry Sandwiches, filled rolls, hamburgers, hotdogs, pizza, nachos, doner kebabs, wontons, spring rolls, stuffings Milk puddings, cheesecake, fruit crumbles, mousse, steamed sponges, sweet pies, pavlova, meringues All milk (cow, soy, rice, goat and flavoured milk), milkshakes, milk powder Cream, sour cream, yoghurt, dairy food, ice-cream, dairy-based dips Cheddar, edam, specialty (blue, brie, feta, etc), ricotta, cream cheese, cottage cheese, processed cheese Butter, margarine, butter/margarine blends, reduced-fat spreads Canola, olive, sunflower and vegetable oils, dripping, lard Poached, boiled, scrambled and fried eggs, omelettes, self-crusting quiches, egg stir-fries All muscle meats (steak, mince, corned beef, roast, schnitzel, etc), stews, stir-fries All muscle meats (chops, roast, mince, etc), stews, stir-fries, curries All muscle meats (roast, chop, steak, schnitzel, etc), bacon, ham, stews, stir-fries All chicken, duck, turkey and muttonbird muscle meats and processed meat, stews and stir-fries Venison, rabbit, goat, liver (lambs fry), pâté (liver), haggis Sausages, luncheon, frankfurters, saveloys/cheerios, salami, meatloaf and patties All pies including potato top, pasties, savouries, sausage rolls, quiche with pastry All fish (fresh, frozen, smoked, canned, battered, fingers, etc), shellfish, squid, crab, fish/seafood dishes (pies, casseroles and fritters), fish/seafood products All vegetables (fresh, frozen, canned) including mixes, coleslaw, tomatoes, green salads, legumes and pulses, legume products and dishes (baked beans, hummus, tofu), vegetable dishes Mashed, boiled, baked potatoes and kumara, hot chips, crisps, hash browns, wedges, potato dishes (stuffed, scalloped potatoes), taro roots and stalks Corn chips, popcorn, extruded snacks (burger rings etc), grain crisps All fruit, fresh, canned, cooked and dried Peanuts, almonds, sesame seeds, peanut butter, chocolate/nut spreads, coconut (including milk and cream), nut-based dips (pestos) Sugars, syrups, confectionery, chocolate, jam, honey, jelly, sweet toppings and icing, ice-blocks, artificial sweeteners All instant and homemade soups (excluding noodle soups), stocks and stock powder Gravy, tomato and cream-based sauces, soy, tomato and other sauces, cheese sauces, mayonnaise, oil & vinegar dressings, chutney, marmite 12 A Focus on Nutrition: Key Findings of the 2008/09 New Zealand Adult Nutrition Survey
41 Food group Non-alcoholic beverages Alcoholic beverages Supplements providing energy* Snack bars* Examples of food items included All teas, coffee and substitutes, hot chocolate drinks, juices, cordial, soft drinks, water, powdered drinks, sports and energy drinks Wine, beer, spirits, liqueurs and cocktails, ready-to-drink alcoholic sodas (RTDs) Meal replacements, protein supplements (powders and bars) Muesli bars, wholemeal fruit bars, puffed cereal bars, nut and seed bars Some foods may not be assigned to the same food groups as in the 1997 National Nutrition Survey so care should be taken when making direct comparisons. For example, Muesli bars were assigned to biscuits in the 1997 National Nutrition Survey, but to snack bars in the 2008/09 New Zealand Adult Nutrition Survey. * Comparable with 2002 National Children s Nutrition Survey but not comparable with 1997 National Nutrition Survey. Mixed dishes were classified as follows. If the participant was able to provide a recipe or detailed description for a mixed dish, then the individual ingredients were assigned to their separate food groups. If no recipe or detailed description could be provided, a generic recipe that most closely matched the description of the food was used and the dish was assigned to the food group of its main ingredient. For example, macaroni cheese would be assigned to Grains and pasta, because pasta is its main ingredient, although it contains cheese and milk. Determining usual intake distribution An individual s day-to-day diet is likely to be highly variable, so the distribution of intake for a dietary component measured on a single day will be wider than the distribution for their Usual daily intake. To determine the distribution of usual intakes for a group, the distribution of observed intakes from a single 24-hour diet recall needs to be adjusted to remove the effects of within-person (or intra-individual) variability. This can be achieved by collecting two 24-hour recalls from a representative sub-sample of the group. In the 2008/09 NZANS, a random sample of 33% of participants was asked to complete a second 24-hour diet recall within a month of the first interview. One-quarter (1180) of the participants completed a repeat 24-hour diet recall, slightly more than the expected 20%. The software package PC-SIDE (Version 1.0, developed by Iowa State University) was used to estimate the distribution of usual intakes of dietary components. This software can be used when daily intake observations are repeated at least once on a subsample of individuals in the survey population. PC-SIDE carries out four main steps when estimating usual intake distributions for dietary components: preliminary data adjustments, semi-parametric transformation to normality, estimation of within and between individual variances for intakes, and finally back transformation into the original scale. PC-SIDE adjusts for day of the week. Detailed information describing the PC-SIDE methodology can be found in Nusser et al 1996, Dodd 1996 and Carriquiry A Focus on Nutrition: Key Findings of the 2008/09 New Zealand Adult Nutrition Survey 13
42 Determining nutrient adequacy For the 2008/09 NZANS, reference values to determine nutrient adequacy were sourced from the nutrient reference values (NRVs) for Australia and New Zealand (NHMRC 2006). The NRVs are presented as a range of recommendations for nutrient and energy intake aimed at avoiding deficiency and excess/toxicity, as well as guidance on the dietary patterns needed to reduce the risk of chronic disease. Estimated average requirements (EARs) were used as the yardstick to determine the adequacy of nutrient intake in the 2008/09 NZANS (Table 2.3). The EAR is a daily nutrient level estimated to meet the requirements of half of the healthy individuals in a particular life stage and gender group. The adequacy of protein, vitamin A, riboflavin, vitamin C, thiamin, niacin, vitamin B 6, vitamin B 12, iron, calcium, zinc and selenium intakes were evaluated by probability analysis (Subcommittee on Interpretation and Uses of Dietary Reference Intakes and the Standing Committee on the Scientific Evaluation of Dietary Reference Intakes, Food and Nutrition Board, Institute of Medicine 2000). Comparison with the EAR (shortcut probability approach) was used to evaluate nutrient intake in all populations, except iron intakes in women aged years. Iron requirements for these women were assumed to be highly skewed as a result of menstruation, so the iron intake of this age group was evaluated using full probability analysis. Probability analysis compares nutrient intakes with the corresponding requirement distribution and calculates the likelihood (probability) that a particular nutrient intake would fail to meet the requirement. Lower nutrient intakes are associated with a higher probability of inadequacy because they are less likely to meet the requirement, while higher nutrient intakes have a low probability of inadequacy. This approach is preferable to making direct comparisons with recommended intakes because the variation in requirement between individuals is taken into account: an individual may meet their own requirement but not consume the recommended intake. The probability of intake being inadequate was calculated using nutrient intakes, adjusted to remove the effects of day-to-day (intra-individual) variation using PC-SIDE software, as described above. This is important because on any given day a number of people will have low or high intakes that do not reflect their usual intake. Nutrient requirements, however, represent the required long-term average (usual) intakes, not amounts that must be consumed each day. Without adjusting for intra-individual variation the prevalence of inadequate intakes would be over- or underestimated depending on where the intake distribution lies in relation to the requirement distribution. 14 A Focus on Nutrition: Key Findings of the 2008/09 New Zealand Adult Nutrition Survey
43 Table 2.3: Estimated average requirements (EARs) per day used in the probability analysis Nutrient Age group (years) Protein (g) Vitamin A (µg RE) Vitamin C (mg) M EAR F Thiamin (mg) Riboflavin (mg) Niacin (mg NE) Vitamin B 6 (mg) Vitamin B 12 (µg) Folate (µg DFE) Calcium (mg) Iron (mg) Zinc (mg) Selenium (µg) Source: Nutrient reference values for Australia and New Zealand (NHMRC 2006). 2.5 Weighting estimation Most national surveys have complex sample designs, such that different groups have different chances of being selected in the survey. To ensure that no group is under- or over-represented in estimates from the survey, weights are calculated for every survey participant. The weights are designed to: reflect the probabilities of selection of each respondent make use of external population benchmarks (typically obtained from a population census) to correct for any discrepancies between the sample and the population benchmarks this improves the precision of estimates and reduces bias due to nonresponse. A Focus on Nutrition: Key Findings of the 2008/09 New Zealand Adult Nutrition Survey 15
44 A method called calibrated weighting (Deville and Sarndal 1992) was used for the 2008/09 NZANS. The benchmarks used were the estimated resident population aged 15 years and over living in permanent private dwellings at 30 June The Methodology Report contains more information on weighting in the 2008/09 NZANS. 2.6 Response rates The final weighted response rate for the 2008/09 NZANS was 61%. The refusal and non-contact rates were 31% and 8%, respectively. Because the number of respondents who gave blood and urine samples was lower, the final weighted response rates were calculated separately for the blood and urine samples, and they were both 44%. These response rates are considered good for a national nutrition survey, which imposes high respondent burden. Note that it was not possible to calculate the overall response rate by demographic subgroups such as sex, ethnic group, age group and NZDep2006 due to the unavailability of such information for some participants at the recruitment stage. However, partial response rates by demographic subgroups are presented in the Methodology Report. 2.7 How to interpret the results This report presents key descriptive results from the 2008/09 NZANS. Explanatory notes for the results are outlined below. Weighting Weights were used in all analyses so that estimates of means, medians, percentiles and proportions presented in this report can be said to be representative of the total resident population (aged 15 years and over) of New Zealand. Small numbers Small sample numbers can affect both the reliability and the confidentiality of results. Problems with reliability occur when the sample becomes too small to adequately represent the population from which it has been drawn. Problems with confidentiality can occur when it becomes possible to identify an individual, usually someone in a subgroup of the population within a small geographical area. The study has been designed so that there are approximately 30 or more people in each of the key categories analysed in this report. Generally speaking this ensures the survey data presented are reliable and also protects the confidentiality of the participants. In addition, for the estimates which are the focus of the commentary confidence intervals are published. This gives readers a more explicit assessment on the level of sampling error affecting these key measures. 16 A Focus on Nutrition: Key Findings of the 2008/09 New Zealand Adult Nutrition Survey
45 There are some exceptions to this quality assurance practice which are explained below: There were 29 respondents who were Pacific males aged years. Although this was strictly below the sample size minimum, results were included in the report because the key estimates have confidence intervals presented, so that readers can judge when these estimates are affected by large sample errors. There were only 13 Pacific male respondents aged years and 15 Pacific female respondents aged years who gave blood samples. This was judged to be too small a sample to use, so results were suppressed. For the estimates of the inadequate intake proportions a method for consistently producing plausible confidence intervals was not available. Instead an asterisk (*) is displayed where the estimates were considered to be imprecise due to a large relative sampling error (Note: if the estimates were close to zero and had a standard error less than 2.5% they were not asterisked as in these cases the readers can be confident the estimated proportion with inadequate intake is less than 5%). There were a very small number of estimates where no standard error could be produced. This can occur when some of the model assumptions in the usual intake analysis are violated, which can be due to daily intakes being very skewed or variable. In these cases the estimates were marked with a hash (#). For the dietary habits section, results have not been output for ethnic group (stratified by age group and sex) or for NZDep2006 (stratified by sex). This was because for many of the questions there were up to eight response options. When there were no specific recommendations regarding the amount or frequency of consumption of a particular food or drink, it was not possible to aggregate responses in a meaningful way. Without aggregating categories, the number of responses for each response category was often too small to present results by the full range of sociodemographic variables used in other sections of this report. For estimates which are not presented with a confidence interval or are not estimated inadequate intake proportions, readers can make some assessment of the reliability by looking at the sample size underpinning the different categories analysed (see Table A5.1), and also by taking into account that these sample sizes are likely to be affected by the clustering and weighting processes used for this study. Generally speaking it is sensible to assume a design effect of 2 for these sorts of complex survey designs. This means that the effective sample sizes are about half the actual sample sizes given in Table A5.1. Confidence intervals In tables, 95% confidence intervals are shown in parentheses after the point estimate (for key estimates only). In graphs, 95% confidences are shown as error bars. Differences in means, medians and proportions between subgroups were considered to be statistically significant if the 95% confidence intervals surrounding the two estimates did not overlap. It should be noted that testing for a significant difference between two subgroups using the above method is conservative compared to testing at the twosided 0.05 level. A Focus on Nutrition: Key Findings of the 2008/09 New Zealand Adult Nutrition Survey 17
46 Only statistically significant differences have been discussed in the text. However, if there was no statistically significant difference between subgroups, this does not necessarily mean that there were no differences; it could be because the sample size was too small to detect a significant difference at the 95% level based on nonoverlapping confidence intervals. Age groups Age was derived from date of birth and the interview start date, or reported age. Age was grouped according to the NRVs for Australia and New Zealand (NHMRC 2006) age groups: 15 18, 19 30, 31 50, 51 70, and 71+ years. For analyses by ethnic group, the latter two age groups were aggregated to 51+ years to account for the small numbers of Māori and Pacific adults aged 71+ years. For comparability this was also done for the New Zealand European and Other (NZEO) ethnic group. Ethnic group Ethnicity was output to the following three ethnic groups: NZEO, Māori, and Pacific. The Other ethnic group (comprising mainly Asian, Middle-Eastern, Latin-American and African ethnic groups) has been combined with European due to small numbers. The total response standard output was used to classify ethnicity, with participants counted in each of the three output ethnic groups they identified with. As a result, the sum of the ethnic group populations exceeds the total New Zealand population. Using total response standard output means ethnic groups overlap, so it is not appropriate to make comparisons between ethnic groups. Comments in the text are limited to age group differences within ethnic groups. No comments were made with respect to the New Zealand European and Other ethnic group because this is similar to the total population. Supplementary reports presenting results for Māori compared to non-māori and Pacific compared to non-pacific will be released in late Neighbourhood deprivation Neighbourhood deprivation refers to the New Zealand Index of Deprivation 2006, which measures the level of socioeconomic deprivation for each neighbourhood (meshblock) according to a combination of the following 2006 census variables: income, benefit receipt, transport (access to car), household crowding, home ownership, employment status, qualifications, support (sole-parent families), and access to a telephone (Salmond et al 2007). Results are presented for NZDep2006 quintiles. Quintile 1 represents the 20% of areas with the lowest levels of deprivation (least deprived areas) and quintile 5 represents the 20% of areas with the highest level of deprivation (most deprived areas). 18 A Focus on Nutrition: Key Findings of the 2008/09 New Zealand Adult Nutrition Survey
47 Differences between NZDep2006 quintiles were examined and discussed in the text if the 95% confidence intervals surrounding the two estimates did not overlap. In addition to examining significant differences between NZDep2006 quintiles, the data from all quintiles were used to calculate a line of best fit (regression line), adjusted for age group, sex and ethnic group. This additional analysis was undertaken because ethnicity (and to a lesser extent age) confounds the relationship between socioeconomic deprivation and nutrition outcomes. By also adjusting for sex, this method gave an overall test for trend (gradient) by neighbourhood socioeconomic deprivation. For nutrient intake, comparisons between NZDep2006 quintiles are adjusted for intraindividual variation using PC-SIDE, whereas to simplify analyses the overall test for trend (gradient) is not adjusted for intra-individual variation. Note that this shortcut method gave the same results when tested for selected nutrients. Time trends Where possible, comparisons between the 2008/09 NZANS and 1997 National Nutrition Survey have been reported in the Have we Changed? chapter. Time trend analyses were restricted to nutrition indicators that were considered comparable across surveys (see Chapter 9 for more information). Crude data are presented in the tables. Changes in nutrition indicators from 1997 to 2008/09 are summarised in the table as follows: no change (nc), significant increase ( ), or significant decrease ( ). Because the age and ethnic structure of the New Zealand population has changed since 1997, time trends were re-examined after adjusting for age group and ethnic group. In most cases this adjustment did not affect the results. However, for a few indicators, adjusting for age and ethnicity meant time trends were no longer statistically significant or became statistically significant. When this occurred, a table note is added. A Focus on Nutrition: Key Findings of the 2008/09 New Zealand Adult Nutrition Survey 19
48 3 Nutrient Intakes and Dietary Sources: Energy and Macronutrients New Zealanders obtain the energy and nutrients they require from a wide variety of foods and beverages, and in some cases from dietary supplements as well. This chapter on energy and macronutrients presents the intake of energy and nutrients from food and beverages, without adding the nutrients from supplements (other than supplements providing energy, eg meal replacements). 3.1 Explanatory notes Usual intake distributions Using repeat 24-hour diet recalls on a subsample (25%) of participants, nutrient intakes for each subgroup were adjusted for intra-individual variability using the PC-SIDE programme to obtain usual intake distributions. Nutrient ratios (eg, percent energy from protein) presented in this section were not adjusted for intra-individual variation because the only methods that have been developed for ratios use multiple day repeats. Note that comparisons between NZDep2006 quintiles are based on nutrient intake, adjusted for intra-individual variation using PC-SIDE, whereas the overall test for trend (gradient) by neighbourhood deprivation is not adjusted for intra-individual variation. Accuracy of energy and nutrient intake estimates The accuracy of nutrient estimates depend on two factors: the accuracy of information provided by participants in the 24-hour diet recall and the accuracy of the food composition data. These two potential sources of error are briefly outlined briefly below (see Chapter 2 and the Methodology Report for more information). Misreporting of a food intake, especially under-reporting, is a well-known problem in all types of dietary surveys. If food intake is under-reported, energy and nutrient intakes may also be underestimated, and the prevalence of inadequate intake may be overestimated. The New Zealand Food Composition Database (NZFCDB) was the main source of nutrient data for the survey. The NZFCDB includes approximately 2740 foods, and an additional 5000 nutrient lines were created for the survey based on data from the NZFCDB and other sources (eg, overseas databases). Nutrient adequacy For protein, the probability of inadequate intake was estimated by comparing the usual intake distribution to the estimated average requirement (EAR) from the Nutrient Reference Values (NRV) for Australia and New Zealand (NHMRC 2006). Nutrient adequacy could not be determined if there was no EAR for a nutrient. When interpreting the prevalence of inadequate intakes it is important to note the following. 20 A Focus on Nutrition: Key Findings of the 2008/09 New Zealand Adult Nutrition Survey
49 Nutrient intake estimates are from food and drinks only and exclude intake from dietary supplements (other than supplements providing energy, eg meal replacements). Nutrient intake estimates depend on the accuracy of the information provided by participants in the 24-hour diet recall and the accuracy of the food composition data. The prevalence of inadequate intakes partly reflects the criterion on which the requirement is based. For example, if the requirement for nutrient X is based on maintaining body stores (assuming normal losses), and it is estimated that 15% of the population have inadequate intakes, this indicates that 15% are not consuming enough nutrient X to maintain body stores but does not indicate functional impairment or a deficiency disorder. It also does not indicate which specific individuals in the population have inadequate intakes to maintain their body stores. A cautionary comment on the interpretation of adequacy of intake for a nutrient has been made when the derivation of the reference value is either unclear or scientifically debatable. Accurate assessment of nutrient status requires a combination of dietary, anthropometric, biochemical and clinical measurements (Gibson 2005). Adequacy or inadequacy of nutrient status cannot be determined from dietary data alone. Dietary sources For each nutrient, the percentage contribution from different food groups is presented. In this way, the adequacy of nutrient intake can be understood in the context of the foods from which each was sourced. It is important to understand how foods were classified when interpreting information on dietary sources. If a participant was able to provide a detailed description for a mixed dish, then the individual ingredients were assigned to their separate food groups. However, if a detailed description could be provided, then the dish was assigned to the food group of its main ingredient. For example, macaroni cheese would be assigned to the Grains and pasta group because pasta is its main ingredient, even though it contains milk and cheese. Food group descriptors are written in italics to indicate these are food groups rather than foods per se. Details of the food groups used and the types of foods included within each group are summarised in Chapter 2 (Table 2.2). It is important to review the foods included in each group rather than simply focusing on the food group descriptor, which was created for the 1997 National Nutrition Survey. The order of foods listed as examples does not necessarily reflect current consumption patterns. For example, the Butter and margarine group includes more margarine than butter. A Focus on Nutrition: Key Findings of the 2008/09 New Zealand Adult Nutrition Survey 21
50 In this report, comments in the text are restricted to the top 10 dietary sources for each nutrient. Note that the largest single contributor to nutrient intake (sometimes referred to as the principal source) partly depends on how foods are grouped and how many participants consumed items within each group. Foods frequently consumed (eg, Bread) are more likely to feature in the top 10 dietary sources than food groups consumed by only a small proportion of participants (eg, Fats and oils and Other meat). Note that most fats and oils added during food preparation and cooking are included in the foods to which they were added (eg, Potatoes, kumara and taro) rather than in the Fats and oils group. Sex differences Males have a higher body weight and a greater proportion of lean body mass than females. They therefore require more food (energy) to maintain their body mass and to meet their requirements for exercise. Therefore, daily energy intake, on average, for males will exceed that for females, as will their intake of macronutrients. Percent energy from macronutrients Percent energy from macronutrients per day was calculated from day 1 of recall as follows (NHMRC 2006): percent energy from fat = (fat (g/day) x 37.7 kj/g) / energy (kj/day) percent energy from carbohydrate = (carbohydrate (g/day) x 16.7 kj/g) / energy (kj/day) percent energy from protein = (protein (g/day) x 16.7 kj/g) / energy (kj/day) percent energy from alcohol = (alcohol (g/day) x 29.3 kj/g) / energy (kj/day). 3.2 Energy Energy is required in the body for metabolic processes, physiological functions, muscular activity, heat production, growth and the synthesis of new tissues. Food components release energy through oxidation during the digestive process. Protein, carbohydrate, fat and alcohol (the macronutrients) from food and drinks are the only sources of energy for humans. Energy requirements can vary widely according to sex, body size and physical activity (NHMRC 2006). Energy intake The median usual daily energy intake was 10,380 kj for males and 7448 kj for females (Table 3.1). Males aged 51+ years and females aged 71+ years had lower usual daily energy intakes than younger males and females (Figure 3.1). 22 A Focus on Nutrition: Key Findings of the 2008/09 New Zealand Adult Nutrition Survey
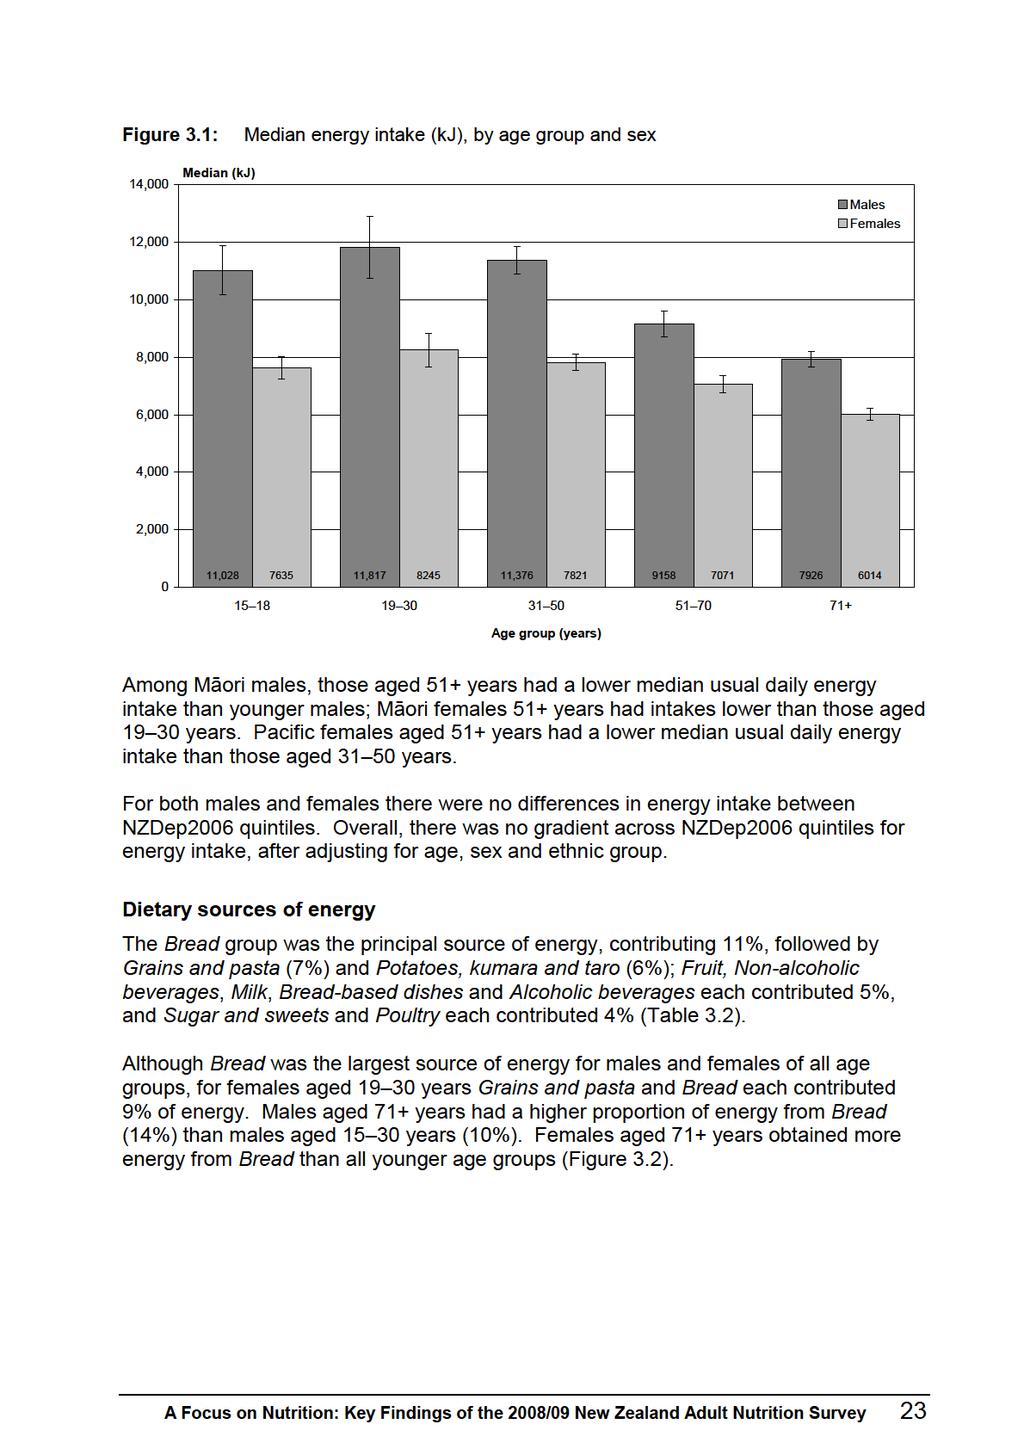
51
52
53 Table 3.1: Energy intake, by age group, ethnic group, NZDep2006 and sex Energy (kj) 1 Mean 10th 2 Median (50th), 2 95% CI 90th 2 Total population (15 years+) ( ) 12,750 By age group (years) Males , ,028 (10,171 11,885) 14, , ,817 (10,733 12,901) 14, , ,376 (10,908 11,844) 14, ( ) 12, ( ) 10,334 Total 10, ,380 (10,053 10,707) 14,268 Females ( ) 10, ( ) 11, ( ) ( ) ( ) 7906 Total ( ) 10,220 Māori Males , ,513 ( ,152) 16, , ,290 (11,051 13,529) 17, , ,769 (10,807 12,731) 14, ( ) 11,956 Total 11, ,449 (10,839 12,059) 14,669 Females ( ) 10, ( ) 11, ( ) 10, ( ) 8752 Total ( ) 10,976 Pacific Males , ,008 # 13, , ,563 ( ,150) 16, , ,858 ( ,816) 14, ( ,017) 12,991 Total 11, ,711 ( ,579) 15,496 Females ( ) 10, ( ) 13, ( ) 12, ( ) 9974 Total ( ) 11,540 A Focus on Nutrition: Key Findings of the 2008/09 New Zealand Adult Nutrition Survey 25
54 Energy (kj) 1 Mean 10th 2 Median (50th), 2 95% CI 90th 2 NZEO Males , ,933 ( ,903) 14, , ,242 (10,274 12,210) 15, , ,416 (10,883 11,949) 13, ( ) 11,855 Total 10, ,375 ( ,865) 13,901 Females ( ) 10, ( ) 11, ( ) ( ) 9121 Total ( ) 10,073 By NZDep2006 quintile Males 1 10, ,301 ( ,993) 14, , ,955 (10,157 11,753) 14, , ,205 ( ,024) 12, , ,049 ( ,811) 13, , ,530 ( ,238) 14,941 Females ( ) ( ) ( ) ( ) 10, ( ) 10,395 1 Usual daily intake. These data were adjusted for intra-individual variation using PC-SIDE. 2 Percentiles. # Confidence interval could not be calculated. Estimate should be interpreted with caution. 26 A Focus on Nutrition: Key Findings of the 2008/09 New Zealand Adult Nutrition Survey
55 Table 3.2: Energy sources, percent (95% CI), 1 by age group, sex and food group Food group Total population Males Females Total Total Bread 11.0 ( ) Grains and pasta 6.8 ( ) Potatoes, kumara and taro 6.4 ( ) Fruit 5.4 ( ) Non-alcoholic beverages 5.0 ( ) Milk 5.0 ( ) Bread-based dishes 5.0 ( ) Alcoholic beverages 4.9 ( ) Sugar and sweets 4.2 ( ) Poultry 3.8 ( ) 10.2 ( ) 7.0 ( ) 8.8 ( ) 3.4 ( ) 7.6 ( ) 4.5 ( ) 10.6 ( ) 2.5 ( ) 3.1 ( ) 4.5 ( ) 9.7 ( ) 9.4 ( ) 6.3 ( ) 3.6 ( ) 7.6 ( ) 3.7 ( ) 9.3 ( ) 6.0 ( ) 4.5 ( ) 4.1 ( ) 11.8 ( ) 6.8 ( ) 6.2 ( ) 4.0 ( ) 4.5 ( ) 4.6 ( ) 5.3 ( ) 6.0 ( ) 4.4 ( ) 4.5 ( ) 11.7 ( ) 6.5 ( ) 6.3 ( ) 4.8 ( ) 3.6 ( ) 5.2 ( ) 4.6 ( ) 6.1 ( ) 3.9 ( ) 3.3 ( ) 13.9 ( ) 4.7 ( ) 6.3 ( ) 7.0 ( ) 2.2 ( ) 5.8 ( ) 1.7 ( ) 5.3 ( ) 4.3 ( ) 2.0 ( ) 11.4 ( ) 7.1 ( ) 6.5 ( ) 4.3 ( ) 4.9 ( ) 4.7 ( ) 6.0 ( ) 5.7 (5 6.4) 4.2 ( ) 3.9 ( ) 9.8 (8.7 11) 7.9 ( ) 8.2 ( ) 4.3 ( ) 8.1 ( ) 4.0 ( ) 8.9 ( ) 2.3 ( ) 4.9 ( ) 4.1 ( ) 8.6 ( ) 8.7 ( ) 7.4 ( ) 4.8 ( ) 7.0 ( ) 4.2 ( ) 4.9 ( ) 4.9 ( ) 4.7 ( ) 4.7 ( ) 10.5 ( ) 7.1 ( ) 6.1 ( ) 5.8 ( ) 4.7 ( ) 5.8 ( ) 4.4 ( ) 4.6 ( ) 4.8 ( ) 4.1 ( ) 11.0 ( ) 5.2 ( ) 5.4 ( ) 7.8 ( ) 4.1 ( ) 5.2 ( ) 2.2 ( ) 4.1 ( ) 3.6 ( ) 2.9 ( ) 14.4 ( ) 4.1 ( ) 5.6 ( ) 8.8 ( ) 2.7 ( ) 6.2 ( ) 1.7 ( ) 3.1 ( ) 3.1 ( ) 2.5 ( ) Vegetables Cakes and muffins Breakfast cereals Beef and veal Butter and margarine Fish and seafood Biscuits Pies and pasties Dairy products Sausages and processed meats Cheese Pork Eggs and egg dishes ( ) 6.6 ( ) 6.3 ( ) 6.3 ( ) 5.0 ( ) 5.2 ( ) 4.0 ( ) 4.2 ( ) 4.3 ( ) 3.7 ( ) A Focus on Nutrition: Key Findings of the 2008/09 New Zealand Adult Nutrition Survey 27
56 Food group Total population Males Females Total Total Savoury sauces and condiments Nuts and seeds Lamb and mutton Puddings and desserts Soups and stocks Snack bars Snack foods Fats and oils Supplements providing energy Other meat Proportion of total nutrient intake obtained from each food group. Results for Māori, Pacific, NZEO and NZDep2006 are in the online data tables. For full food group definitions, see Table % confidence intervals are presented only for the top 10 food groups. 28 A Focus on Nutrition: Key Findings of the 2008/09 New Zealand Adult Nutrition Survey
57
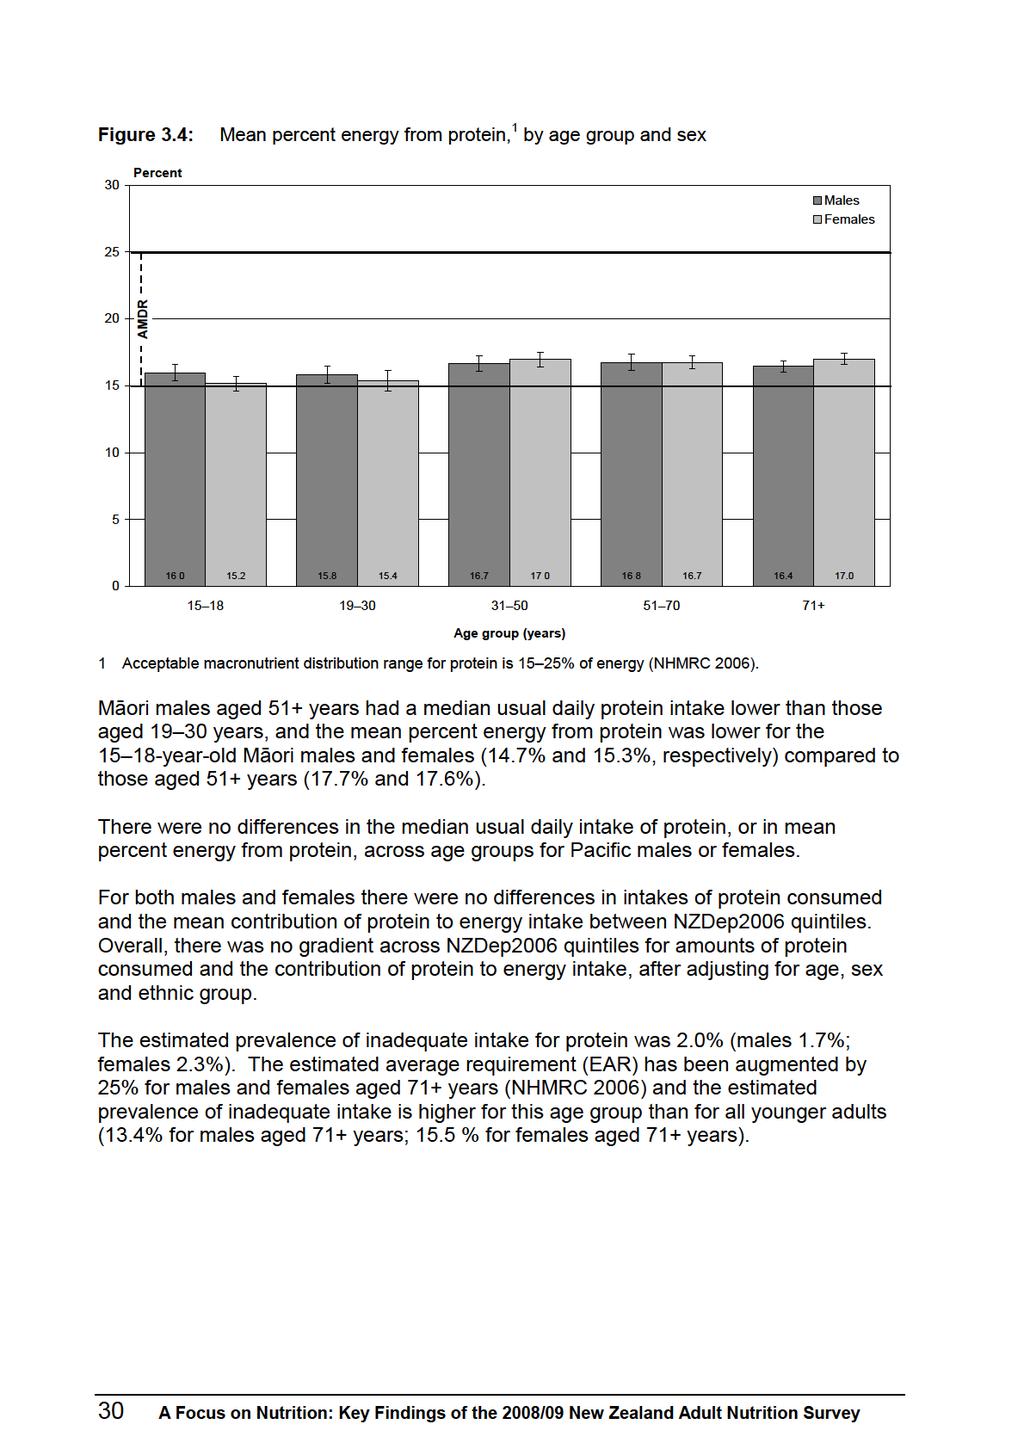
58
59
60 Table 3.3: Protein intake (g) 1 Protein intake (g) and % energy from protein, by age group, ethnic group, NZDep2006 and sex Mean 10th 2 Median (50th), 2 (95% CI) 90th 2 Inadequate intake: percent (95% CI) 3 Total population (82 86) By age group (years) Males (97 117) (99 123) ( ) (83 95) * (74 81) * Total (98 106) Females (63 71) * (67 77) * (73 81) (66 72) * (58 62) Total (69 73) Māori Males (83 113) * ( ) ( ) (79 105) * Total ( ) Females (51 75) * (71 87) (67 79) * (62 72) * Total (70 76) * Pacific Males (89 145) * (79 133) * # * (70 96) * Total (95 115) * Females (49 81) * (67 91) * (75 95) (59 77) * Total (71 83) * NZEO Males (94 116) (97 121) ( ) (81 93) * Total (97 105) A Focus on Nutrition: Key Findings of the 2008/09 New Zealand Adult Nutrition Survey
61 Mean 10th 2 Median (50th), 2 (95% CI) 90th 2 Inadequate intake: percent (95% CI) 3 Females (63 71) * (64 76) * (73 81) (63 69) Total (69 73) By NZDep2006 quintile Males (89 109) (97 111) (88 104) (89 105) (96 114) 154 Females (67 75) (68 77) (68 76) (67 75) (65 73) Percent energy from protein 5 Mean (95% CI) 10th 2 Median (50th) 2 90th 2 Total population 16.5 ( ) By age group (years) Males ( ) ( ) ( ) ( ) ( ) Total 16.4 ( ) Females ( ) ( ) ( ) ( ) ( ) Total 16.5 ( ) Māori Males ( ) ( ) ( ) ( ) Total 16.8 ( ) Females ( ) ( ) ( ) ( ) Total 16.3 ( ) A Focus on Nutrition: Key Findings of the 2008/09 New Zealand Adult Nutrition Survey 33
62 Mean (95% CI) 10th 2 Median (50th) 2 90th 2 Pacific Males ( ) ( ) ( ) ( ) Total 16.8 ( ) Females ( ) ( ) ( ) ( ) Total 16.9 ( ) NZEO Males ( ) ( ) ( ) ( ) Total 16.4 ( ) Females ( ) ( ) ( ) ( ) Total 16.4 ( ) By NZDep2006 quintile Males ( ) ( ) ( ) ( ) ( ) Females ( ) ( ) ( ) ( ) ( ) Usual daily intake. These data were adjusted for intra-individual variation using PC-SIDE. 2 Percentiles. 3 Calculated by probability analysis (see Chapter 2). * Coefficient of variation of estimated inadequate intake is greater than 50% and confidence interval lies outside range (0 5%). Estimate should be interpreted with caution due to the high level of imprecision relative to the estimate. # Confidence interval could not be calculated. Estimate should be interpreted with caution. 4 NZDep2006 quintiles consist of a range of age groups. Because the requirements differ for each age group, an overall figure was not calculated. 5 These data were not adjusted for intra-individual variation because the only methods that have been developed for ratios use multiple day repeats. Percent energy from protein for each participant was calculated as the energy from protein (conversion factor = 16.7 kj/g) divided by the total energy intake. 34 A Focus on Nutrition: Key Findings of the 2008/09 New Zealand Adult Nutrition Survey
63 Table 3.4: Protein sources, percent (95% CI), 1 by age group, sex and food group Food group Total population Males Females Total Total Bread 11.1 ( ) Poultry 8.8 ( ) Milk 8.8 ( ) Beef and veal 7.8 ( ) Grains and pasta 6.8 ( ) Bread-based dishes 6.6 ( ) Fish and seafood 6.0 ( ) Pork 4.5 ( ) Vegetables 4.3 ( ) Potatoes, kumara and taro Sausages and processed meats 3.2 (3 3.4) 9.9 ( ) 10.5 ( ) 7.2 ( ) 7.2 ( ) 7.3 ( ) 14.1 ( ) 3.5 ( ) 4.8 ( ) 2.4 ( ) 4.6 ( ) 10.0 ( ) 9.1 ( ) 6.1 ( ) 6.5 ( ) 9.4 ( ) 12.9 ( ) 3.6 ( ) 5.9 ( ) 2.8 ( ) 2.9 ( ) 11.7 ( ) 10.1 ( ) 7.7 ( ) 8.6 ( ) 6.8 ( ) 6.7 ( ) 6.5 ( ) 4.1 ( ) 3.7 ( ) 3.0 ( ) 11.5 ( ) 7.7 ( ) 9.7 ( ) 8.6 ( ) 6.5 ( ) 5.4 ( ) 6.1 ( ) 6.0 ( ) 3.7 ( ) 3.2 ( ) 14.3 ( ) 5.1 ( ) 10.8 ( ) 10.1 ( ) 4.7 ( ) 2.1 ( ) 7.0 ( ) 6.0 ( ) 5.0 ( ) 3.4 ( ) 11.4 ( ) 8.8 (7.7 10) 8.1 ( ) 8.2 ( ) 7.1 ( ) 7.8 ( ) 5.6 ( ) 5.2 ( ) 3.5 ( ) 3.2 ( ) 10.8 ( ) 9.8 ( ) 6.6 ( ) 6.0 ( ) 9.2 ( ) 12.6 ( ) 2.8 ( ) 3.3 ( ) 2.8 ( ) 4.2 ( ) 9.0 ( ) 11.5 ( ) 7.7 ( ) 4.6 ( ) 9.7 ( ) 7.7 ( ) 5.2 ( ) 3.3 ( ) 4.7 ( ) 4.2 ( ) 10.4 ( ) 9.3 ( ) 9.9 ( ) 7.7 ( ) 6.7 ( ) 5.8 ( ) 6.4 ( ) 3.9 ( ) 4.5 ( ) 3.1 ( ) 11.2 ( ) 7.0 ( ) 9.8 ( ) 8.5 ( ) 4.4 ( ) 2.6 ( ) 8.1 ( ) 4.2 ( ) 6.3 ( ) 2.6 ( ) 14.2 ( ) 6.0 ( ) 11.5 ( ) 9.3 ( ) 4.2 ( ) 1.9 ( ) 6.0 ( ) 4.3 ( ) 5.5 ( ) 2.9 ( ) Cheese Eggs and egg dishes Breakfast cereals Pies and pasties Non-alcoholic beverages Lamb and mutton Dairy products Cakes and muffins Fruit Nuts and seeds Biscuits Soups and stocks ( ) 8.8 ( ) 9.4 ( ) 7.3 ( ) 6.6 ( ) 5.4 ( ) 6.3 ( ) 3.9 ( ) 5.0 ( ) 3.2 ( ) A Focus on Nutrition: Key Findings of the 2008/09 New Zealand Adult Nutrition Survey 35
64 Food group Total population Males Females Total Total Sugar and sweets Savoury sauces and condiments Alcoholic beverages Puddings and desserts Other meat Snack bars Supplements providing energy Snack foods Butter and margarine Fats and oils Proportion of total nutrient intake obtained from each food group. Results for Māori, Pacific, NZEO and NZDep2006 are in the online data tables. For full food group definitions, see Table % confidence intervals are presented only for the top 10 food groups. 36 A Focus on Nutrition: Key Findings of the 2008/09 New Zealand Adult Nutrition Survey
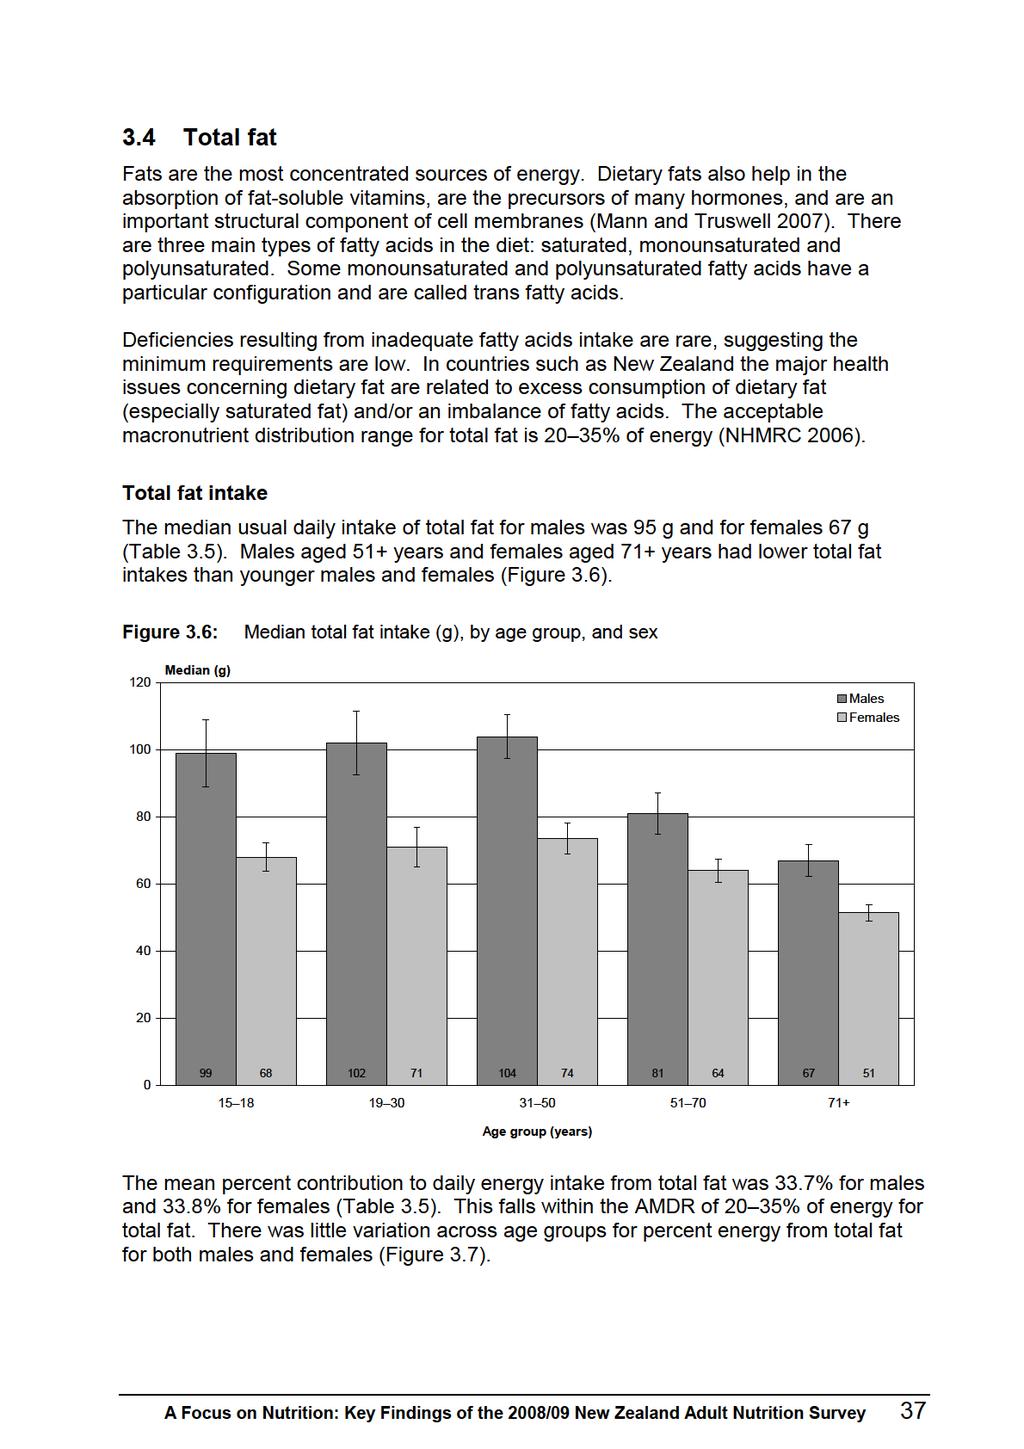
65
66
67
68 Table 3.5: Total fat intake, by age group, ethnic group, NZDep2006 and sex Total fat (g) 1 Percent energy from total fat 2 Mean 10th 3 Median (50th) (95% CI) 3 90th 3 Mean (95% CI) 10th 3 Median 90th 3 (50th) 3 Total population (77 81) ( ) By age group (years) Males (89 109) ( ) (93 111) ( ) (98 110) ( ) (75 87) ( ) (62 72) ( ) Total (92 98) ( ) Females (64 72) ( ) (65 77) ( ) (69 78) ( ) (61 67) ( ) (49 54) ( ) Total (65 69) ( ) Māori Males (82 124) ( ) ( ) ( ) ( ) ( ) (81 103) ( ) Total ( ) ( ) Females (53 81) ( ) (72 88) ( ) (63 83) ( ) (56 68) ( ) Total (67 77) ( ) Pacific Males (70 138) ( ) (78 146) ( ) (75 109) ( ) (49 81) ( ) Total (87 111) ( ) Females (50 76) ( ) (64 86) ( ) (70 86) ( ) (53 67) ( ) Total (68 80) ( ) A Focus on Nutrition: Key Findings of the 2008/09 New Zealand Adult Nutrition Survey
69 Total fat (g) 1 Percent energy from total fat 2 Mean 10th 3 Median (50th) (95% CI) 3 90th 3 Mean (95% CI) 10th 3 Median 90th 3 (50th) 3 NZEO Males (90 112) ( ) (91 110) ( ) (97 109) ( ) (74 82) ( ) Total (90 96) ( ) Females (63 73) ( ) By NZDep2006 quintile (64 76) ( ) (68 78) ( ) (57 63) ( ) Total (65 69) ( ) Males (82 98) ( ) (91 110) ( ) ( ) ( ) (82 98) ( ) (88 104) ( ) Females (61 71) ( ) (62 72) ( ) (62 72) ( ) (61 71) ( ) (64 72) ( ) Usual daily intake. These data were adjusted for intra-individual variation using PC-SIDE. 2 These data were not adjusted for intra-individual variation because the only methods that have been developed for ratios use multiple day repeats. Percent energy from fat for each participant was calculated as the energy from fat (conversion factor = 37.7 kj/g) divided by the total energy intake. 3 Percentiles. A Focus on Nutrition: Key Findings of the 2008/09 New Zealand Adult Nutrition Survey 41
70 Table 3.6: Total fat sources, percent (95% CI), 1 by age group, sex and food group Food group Total population Males Females Total Total Butter and margarine Potatoes, kumara and taro Bread-based dishes 9.3 ( ) 6.3 ( ) 6.3 ( ) Poultry 5.7 ( ) Milk 5.0 ( ) Beef and veal 4.8 ( ) Bread 4.4 ( ) Cakes and muffins 4.2 ( ) Cheese 4.1 ( ) Grains and pasta 4.1 ( ) Sausages and processed meats 5.6 ( ) 10.0 ( ) 12.3 ( ) 6.9 ( ) 5.2 ( ) 4.8 ( ) 4.0 ( ) 2.1 ( ) 3.2 ( ) 5.1 ( ) 6.3 ( ) 7.6 ( ) 11.4 ( ) 6.7 ( ) 4.5 ( ) 4.6 ( ) 4.5 ( ) 2.9 ( ) 4.1 ( ) 6.1 ( ) 9.0 ( ) 6.5 ( ) 6.8 ( ) 6.6 ( ) 4.9 ( ) 5.3 ( ) 4.9 ( ) 4.3 ( ) 4.4 ( ) 3.7 ( ) 11.9 ( ) 5.5 ( ) 6.0 ( ) 5.1 ( ) 5.0 ( ) 5.2 ( ) 4.4 ( ) 4.4 ( ) 3.4 ( ) 3.8 ( ) 15.8 ( ) 4.3 ( ) 2.1 ( ) 2.9 ( ) 5.5 ( ) 6.1 ( ) 5.5 ( ) 4.0 ( ) 3.2 ( ) 3.0 ( ) 9.6 ( ) 6.5 ( ) 7.5 ( ) 5.9 ( ) 4.9 ( ) 5.1 ( ) 4.7 ( ) 3.8 ( ) 3.9 ( ) 4.3 ( ) 5.5 ( ) 10.1 ( ) 11.4 ( ) 6.2 ( ) 4.6 ( ) 3.7 ( ) 4.4 ( ) 4.9 ( ) 3.9 ( ) 5.6 ( ) 6.7 ( ) 8.2 ( ) 6.3 ( ) 7.5 ( ) 4.5 ( ) 3.1 ( ) 3.4 ( ) 4.9 ( ) 3.0 ( ) 5.8 ( ) 8.1 ( ) 6.1 ( ) 5.7 ( ) 5.7 ( ) 5.6 ( ) 4.8 ( ) 3.9 ( ) 3.7 ( ) 5.2 ( ) 4.3 ( ) 10.3 ( ) 4.3 ( ) 2.9 ( ) 4.2 ( ) 4.7 ( ) 4.9 ( ) 4.1 ( ) 5.3 ( ) 4.0 ( ) 2.2 ( ) 15.0 ( ) 3.3 ( ) 2.1 ( ) 3.8 ( ) 5.8 ( ) 5.7 ( ) 5.7 ( ) 5.5 ( ) 4.3 ( ) 2.5 ( ) Vegetables Fish and seafood Pies and pasties Dairy products Biscuits Eggs and egg dishes Nuts and seeds Pork Fruit Sugar and sweets Lamb and mutton Savoury sauces and condiments ( ) 6.0 ( ) 5.1 ( ) 5.5 ( ) 5.1 ( ) 4.5 ( ) 4.1 ( ) 4.6 ( ) 4.3 ( ) 3.9 ( ) 42 A Focus on Nutrition: Key Findings of the 2008/09 New Zealand Adult Nutrition Survey
71 Food group Total population Males Females Total Total Breakfast cereals Non-alcoholic beverages Puddings and desserts Fats and oils Snack bars Snack foods Soups and stocks Other meat Supplements providing energy Alcoholic beverages Proportion of total nutrient intake obtained from each food group. Results for Māori, Pacific, NZEO and NZDep2006 are in the online data tables. For full food group definitions, see Table % confidence intervals are presented only for the top 10 food groups. A Focus on Nutrition: Key Findings of the 2008/09 New Zealand Adult Nutrition Survey 43
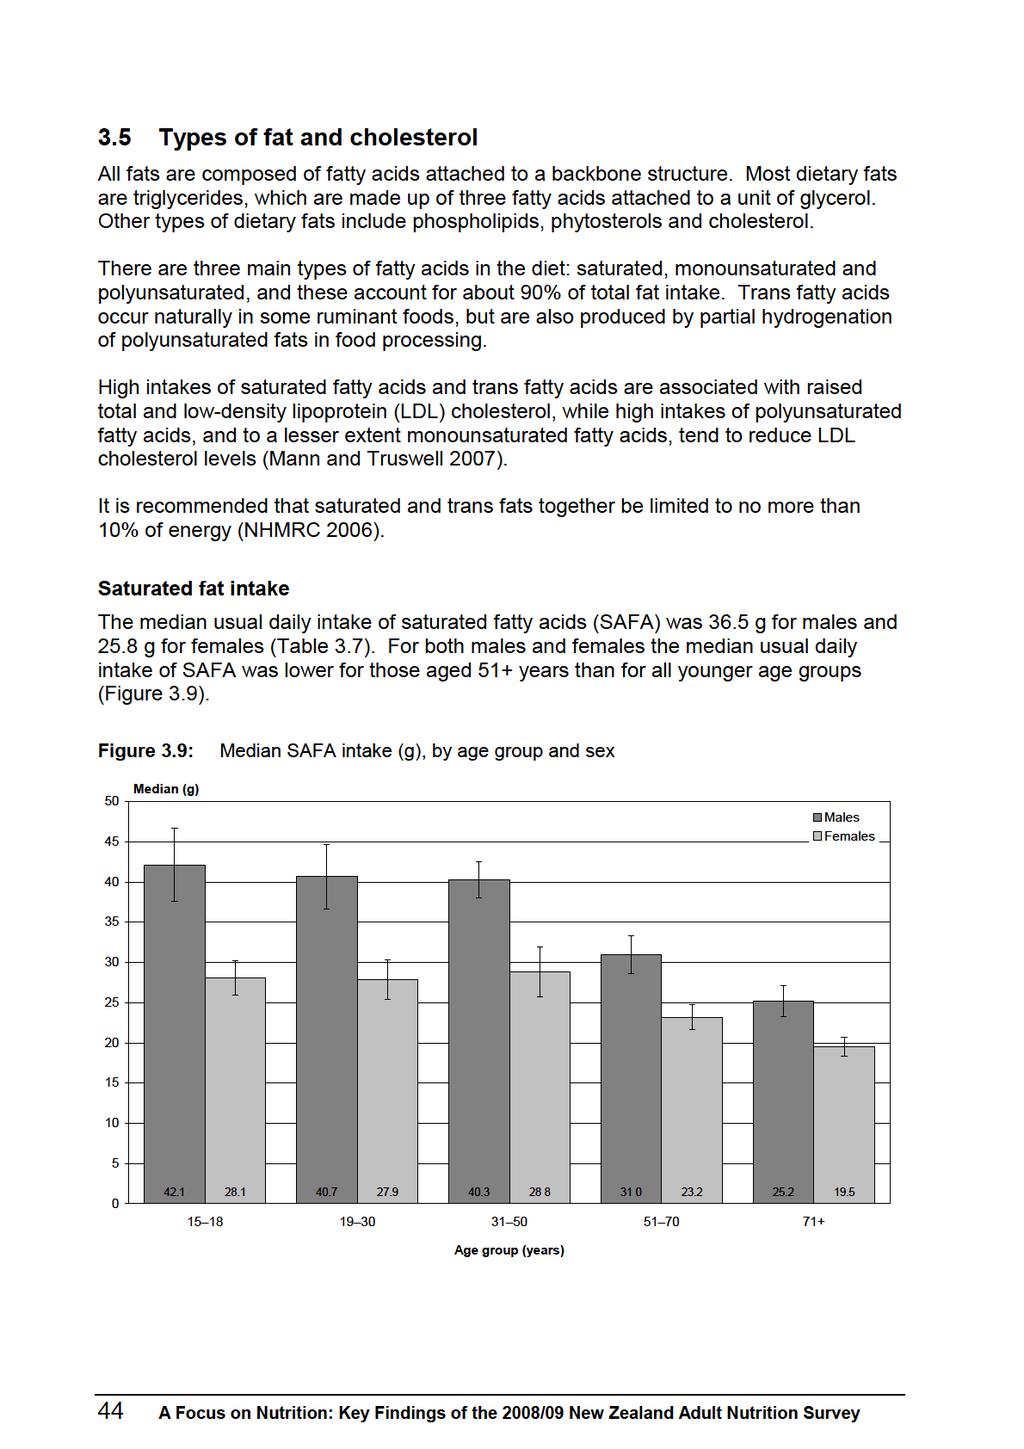
72
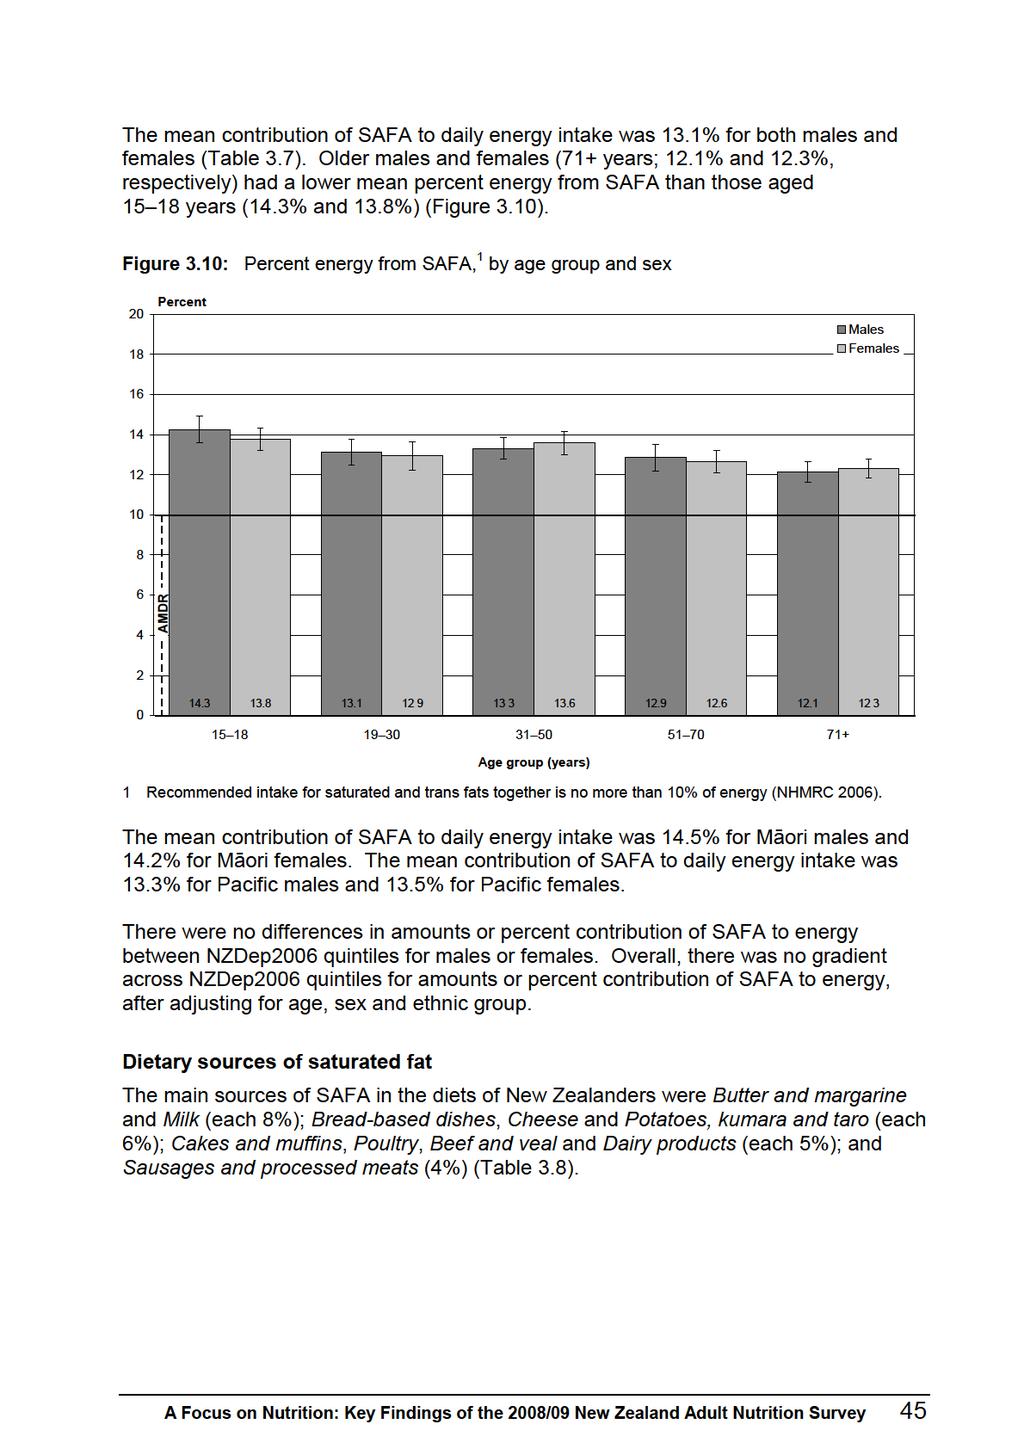
73
74
75 Table 3.7: Saturated fat intake, by age group, ethnic group, NZDep2006 and sex Saturated fat (g) 1 Percent energy from saturated fat 2 Mean (95% CI) 10th 3 Median 90th 3 Mean (50th) 3 (95% CI) 10th 3 Median 90th 3 (50th) 3 Total population ( ) ( ) By age group (years) Males ( ) ( ) ( ) ( ) ( ) ( ) ( ) ( ) ( ) ( ) Total ( ) ( ) Females ( ( ) ( ) ( ) ( ) ( ) ( ) ( ) ( ) ( ) Total ( ) ( ) Māori Males ( ) ( ) ( ) ( ) ( ) ( ) ( ) ( ) Total ( ) ( ) Females ( ) ( ) ( ) ( ) ( ) ( ) ( ) ( ) Total ( ) ( ) Pacific Males ( ) ( ) ( ) ( ) ( ) ( ) ( ) ( ) Total ( ) ( ) Females ( ) ( ) ( ) ( ) ( ) ( ) ( ) ( ) Total ( ) ( ) A Focus on Nutrition: Key Findings of the 2008/09 New Zealand Adult Nutrition Survey 47
76 Saturated fat (g) 1 Percent energy from saturated fat 2 Mean (95% CI) 10th 3 Median 90th 3 Mean (50th) 3 (95% CI) 10th 3 Median 90th 3 (50th) 3 NZEO Males ( ) ( ) ( ) ( ) ( ) ( ) ( ) ( ) Total ( ) ( ) Females ( ) ( ) By NZDep2006 quintile ( ) ( ) ( ) ( ) ( ) ( ) Total ( ) ( ) Males ( ) ( ) ( ) ( ) ( ) ( ) ( ( ) ( ) ( ) Females ( ) ( ) ( ) ( ) ( ) ( ) ( ) ( ) ( ) ( ) These data were not adjusted for intra-individual variation because the only methods that have been developed for ratios use multiple day repeats. 2 These data were not adjusted for intra-individual variation because the only methods that have been developed for ratios use multiple day repeats. Percent energy from fat for each participant was calculated as the energy from fat (conversion factor = 37.7 kj/g) divided by the total energy intake. 3 Percentiles. 48 A Focus on Nutrition: Key Findings of the 2008/09 New Zealand Adult Nutrition Survey
77 Table 3.8: SAFA sources, percent (95% CI), 1 by age group, sex and food group Food group Total population Male Females Total Total Butter and margarine 8.5 ( ) Milk 7.6 ( ) Bread-based dishes 6.4 ( ) Cheese 6.3 ( ) Potatoes, kumara and taro Cakes and muffins 5.8 ( ) 5.1 ( ) Poultry 5.0 ( ) Beef and veal 5.0 ( ) Dairy products 4.7 ( ) Sausages and processed meats 4.4 ( ) 5.1 ( ) 7.6 ( ) 12.5 ( ) 4.6 ( ) 9.7 ( ) 2.5 ( ) 5.7 ( ) 4.7 ( ) 4.6 ( ) 4.4 ( ) 5.0 ( ) 7.2 ( ) 11.9 ( ) 6.4 ( ) 6.5 ( ) 3.4 ( ) 6.0 ( ) 4.5 ( ) 2.9 ( ) 5.1 ( ) 8.4 ( ) 7.8 ( ) 7.0 ( ) 6.9 ( ) 6.5 ( ) 4.8 ( ) 5.7 ( ) 5.3 ( ) 3.9 ( ) 4.9 ( ) 10.7 ( ) 7.7 ( ) 6.1 ( ) 5.4 ( ) 4.8 ( ) 5.4 ( ) 4.6 ( ) 5.2 ( ) 5.8 ( ) 4.1 ( ) 14.6 ( ) 8.6 ( ) 2.1 ( ) 5.1 ( ) 3.8 ( ) 4.9 ( ) 2.4 ( ) 6.6 ( ) 6.1 ( ) 4.4 ( ) 8.6 ( ) 7.7 ( ) 7.7 ( ) 6.0 ( ) 6.0 ( ) 4.5 ( ) 5.2 ( ) 5.2 ( ) 4.5 ( ) 4.6 ( ) 4.9 ( ) 6.3 ( ) 11.3 ( ) 5.5 ( ) 9.2 ( ) 5.7 ( ) 5.3 ( ) 3.6 ( ) 5.7 ( ) 4.9 ( ) 6.3 ( ) 6.9 ( ) 6.1 ( ) 4.5 ( ) 7.7 ( ) 5.4 ( ) 6.7 ( ) 3.1 ( ) 5.0 ( ) 4.5 ( ) 7.8 ( ) 8.0 ( ) 5.7 ( ) 8.1 ( ) 5.6 ( ) 4.7 ( ) 5.0 ( ) 5.1 ( ) 4.0 ( ) 4.2 ( ) 9.6 ( ) 7.0 ( ) 3.1 ( ) 6.4 ( ) 4.2 ( ) 6.8 ( ) 3.9 ( ) 5.6 ( ) 5.7 ( ) 4.0 ( ) 13.3 ( ) 9.0 ( ) 2.1 ( ) 6.8 ( ) 2.8 ( ) 6.6 ( ) 3.5 ( ) 6.1 ( ) 6.1 ( ) 3.8 ( ) Pies and pasties Biscuits Grains and pasta Sugar and sweets Fish and seafood Pork Vegetables Bread Lamb and mutton Eggs and egg dishes ( ) 7.5 ( ) 5.1 ( ) 6.6 ( ) 5.6 ( ) 5.6 ( ) 4.9 ( ) 4.9 ( ) 5.0 ( ) 4.2 ( ) Non-alcoholic beverages A Focus on Nutrition: Key Findings of the 2008/09 New Zealand Adult Nutrition Survey 49
78 Food group Total population Male Females Total Total Nuts and seeds Savoury sauces and condiments Fruit Puddings and desserts Breakfast cereals Snack bars Soups and stocks Snack foods Fats and oils Other meat Supplements providing energy Alcoholic beverages Proportion of total nutrient intake obtained from each food group. Results for Māori, Pacific, NZEO and NZDep2006 are in the online data tables. For full food group definitions, see Table % confidence intervals are presented only for the top 10 food groups. 50 A Focus on Nutrition: Key Findings of the 2008/09 New Zealand Adult Nutrition Survey
79
80
81 Table 3.9: Monounsaturated fat intake, by age group, ethnic group, NZDep2006 and sex Monounsaturated fat (g) 1 Percent energy from monounsaturated fat 2 Mean 10th 3 Median (50th), (95% CI) 3 90th 3 Mean (95% CI) 10th 3 Median 90th 3 (50th) 3 Total population ( ) ( ) By age group (years) Males ( ) ( ) ( ) ( ) ( ) ( ) ( ) ( ) ( ) ( ) Total ( ) ( ) Females ( ) ( ) ( ) ( ) ( ) ( ) ( ) ( ) ( ) ( ) Total ( ) ( ) Māori Males ( ) ( ) ( ) ( ) ( ) ( ) ( ) ( ) Total ( ) ( ) Females ( ) ( ) ( ) ( ) ( ) ( ) ( ) ( ) Total ( ) ( ) Pacific Males ( ) ( ) ( ) ( ) ( ) ( ) ( ) ( ) Total ( ) ( ) Females ( ) ( ) ( ) ( ) ( ) ( ) ( ) ( ) Total ( ) ( ) A Focus on Nutrition: Key Findings of the 2008/09 New Zealand Adult Nutrition Survey 53
82 Monounsaturated fat (g) 1 Percent energy from monounsaturated fat 2 Mean 10th 3 Median (50th), (95% CI) 3 90th 3 Mean (95% CI) 10th 3 Median 90th 3 (50th) 3 NZEO Males ( ) ( ) ( ) ( ) ( ) ( ) ( ) ( ) Total ( ) ( ) Females ( ) ( ) By NZDep quintile ( ) ( ) ( ) ( ) ( ) ( ) Total ( ) ( ) Males ( ) ( ) ( ) ( ) ( ) ( ) ( ) ( ) ( ) ( ) Females ( ) ( ) ( ) ( ) ( ) ( ) ( ) ( ) ( ) ( ) Usual daily intake. These data were adjusted for intra-individual variation using PC-SIDE. 2 These data were not adjusted for intra-individual variation because the only methods that have been developed for ratios use multiple day repeats. Percent energy from fat for each participant was calculated as the energy from fat (conversion factor = 37.7 kj/g) divided by the total energy intake. 3 Percentiles. 54 A Focus on Nutrition: Key Findings of the 2008/09 New Zealand Adult Nutrition Survey
83 Table 3.10: Monounsaturated fat sources, percent (95% CI), 1 by age group, sex and food group Food group Total population Male Females Total Total Butter and margarine 9.7 ( ) Poultry 7.2 ( ) Potatoes, kumara and taro Bread-based dishes 7.0 ( ) 6.3 ( ) Beef and veal 5.8 ( ) Sausages and processed meats 4.4 ( ) Fish and seafood 4.3 ( ) Vegetables 4.2 ( ) Grains and pasta 4.0 ( ) Cakes and muffins 3.8 ( ) 5.7 ( ) 8.7 ( ) 11.0 ( ) 12.5 ( ) 6.0 ( ) 4.5 ( ) 2.3 ( ) 2.3 ( ) 5.0 ( ) 2.0 ( ) 7.0 ( ) 8.0 ( ) 8.9 ( ) 11.6 ( ) 5.5 ( ) 5.0 ( ) 2.5 ( ) 2.7 ( ) 6.0. ( ) 2.5 ( ) 9.3 ( ) 8.3 ( ) 7.1 ( ) 6.8 ( ) 6.3 ( ) 5.0 ( ) 5.1 ( ) 3.0 ( ) 3.8 ( ) 4.0 ( ) 12.8 ( ) 6.4 ( ) 6.0 ( ) 6.0 ( ) 6.3 ( ) 4.2 ( ) 4.7 ( ) 4.5 ( ) 3.6 ( ) 3.9 ( ) 16.8 ( ) 3.8 ( ) 4.5 ( ) 2.2 ( ) 7.7 ( ) 4.3 ( ) 5.3 ( ) 5.0 ( ) 2.1 ( ) 3.8 ( ) 10.1 ( ) 7.4 ( ) 7.2 ( ) 7.6 ( ) 6.2 ( ) 4.7 ( ) 4.2 ( ) 3.5 ( ) 4.1 ( ) 3.5 ( ) 5.7 ( ) 7.9 ( ) 11.9 ( ) 11.4 ( ) 4.3 ( ) 5.1 ( ) 1.7 ( ) 3.0 ( ) 5.6 ( ) 4.6 ( ) 6.8 ( ) 9.5 ( ) 9.2 ( ) 6.7 ( ) 3.8 ( ) 4.3 ( ) 3.3 ( ) 3.4 ( ) 5.7 ( ) 4.7 ( ) 8.4 ( ) 7.2 ( ) 6.9 ( ) 5.8 ( ) 5.7 ( ) 4.2 ( ) 4.8 ( ) 4.2 ( ) 4.3 ( ) 3.2 ( ) 10.8 ( ) 5.3 ( ) 4.7 ( ) 2.9 ( ) 5.8 ( ) 3.9 ( ) 5.2 ( ) 7.2 ( ) 2.0 ( ) 4.6 ( ) 16.1 ( ) 5.0 ( ) 3.6 ( ) 2.2 ( ) 6.9 ( ) 3.9 ( ) 4.6 ( ) 5.0 ( ) 2.2 ( ) 5.0 ( ) Milk Pies and pasties Bread Eggs and egg dishes Nuts and seeds Pork Cheese Biscuits Dairy products Fruit Lamb and mutton Savoury sauces and condiments Sugar and sweets ( ) 7.0 ( ) 6.8 ( ) 5.2 ( ) 5.4 ( ) 4.2 ( ) 4.4 ( ) 4.8 ( ) 3.8 ( ) 4.1 ( ) A Focus on Nutrition: Key Findings of the 2008/09 New Zealand Adult Nutrition Survey 55
84 Food group Total population Male Females Total Total Breakfast cereals Fats and oils Puddings and desserts Non-alcoholic beverages Snack foods Soups and stocks Snack bars Other meat Supplements providing energy Alcoholic beverages Proportion of total nutrient intake obtained from each food group. Results for Māori, Pacific, NZEO and NZDep2006 are in the online data tables. For full food group definitions, see Table % confidence intervals are presented only for the top 10 food groups. 56 A Focus on Nutrition: Key Findings of the 2008/09 New Zealand Adult Nutrition Survey
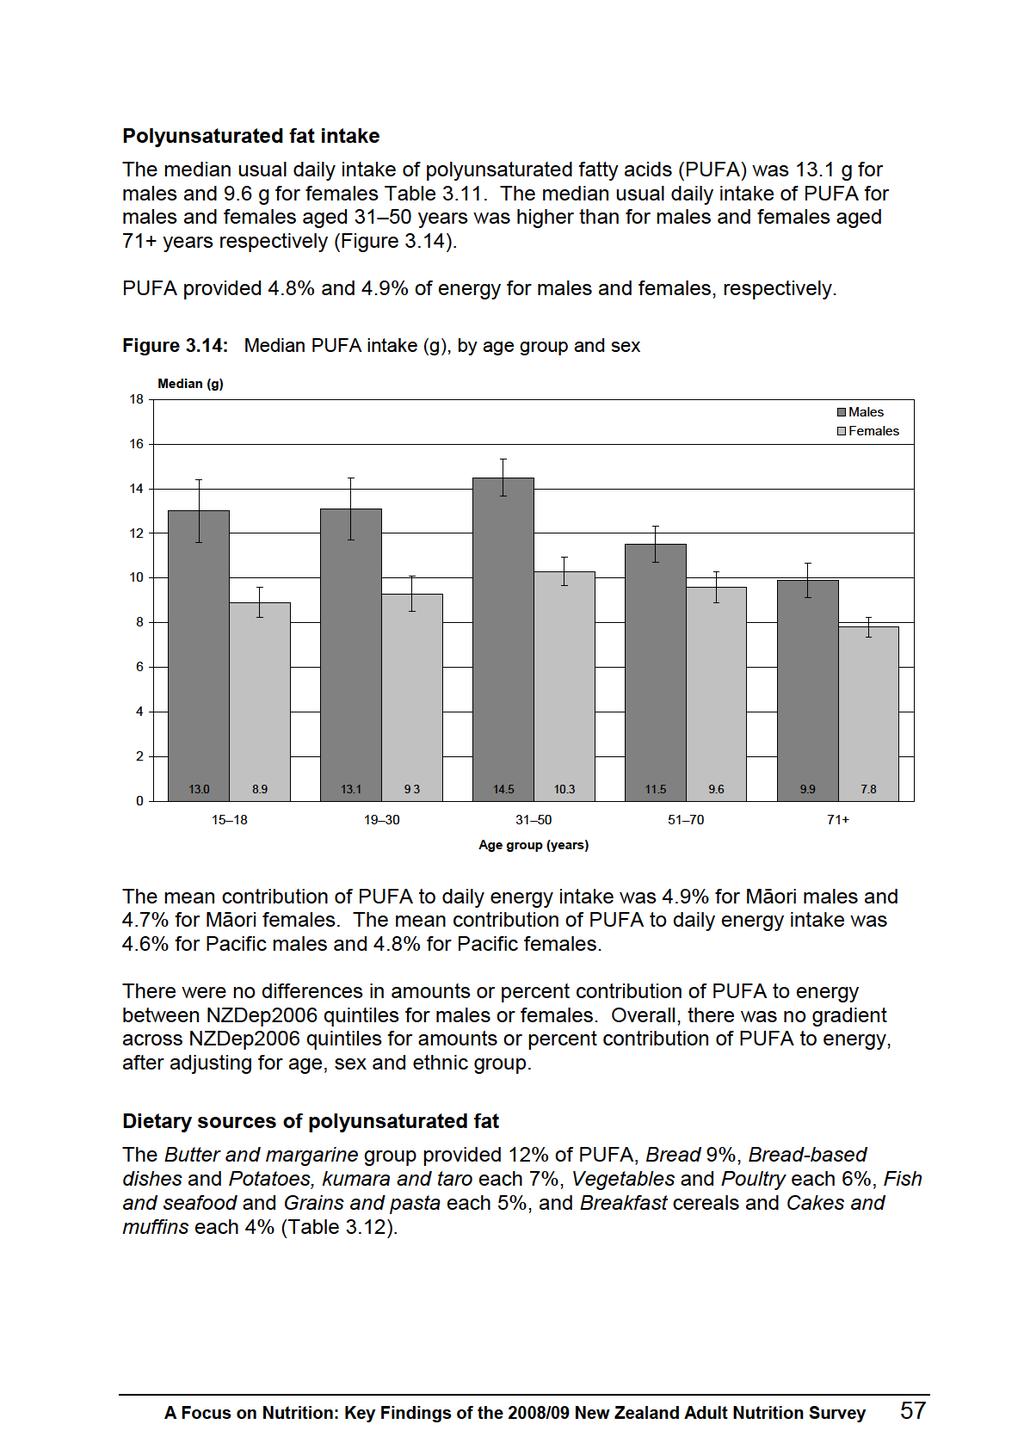
85
86
87 Table 3.11: Polyunsaturated fat intake, by age group, ethnic group, NZDep2006 and sex Polyunsaturated fat (g) 1 Percent energy from polyunsaturated fat 2 Mean 10th 3 Median (50th), 3 (95% CI) 90th 3 Mean (95% CI) 10th 3 Median 90th 3 (50th) 3 Total population ( ) ( ) By age group (years) Males ( ) ( ) ( ) ( ) ( ) ( ) ( ) ( ) ( ) ( ) Total ( ) ( ) Females ( ) ( ) Māori ( ) ( ) ( ) ( ) ( ) ( ) ( ) ( ) Total ( ) ( ) Males ( ) ( ) ( ) ( ) ( ) ( ) ( ) ( ) Total ( ) ( ) Females ( ) ( ) Pacific ( ) ( ) ( ) ( ) ( ) ( ) Total ( ) ( ) Males # ( ) ( ) ( ) ( ) ( ) ( ) ( ) Total ( ) ( ) Females ( ) ( ) ( ) ( ) ( ) ( ) ( ) ( ) Total ( ) ( ) A Focus on Nutrition: Key Findings of the 2008/09 New Zealand Adult Nutrition Survey 59
88 NZEO Polyunsaturated fat (g) 1 Percent energy from polyunsaturated fat 2 Mean 10th 3 Median (50th), 3 (95% CI) 90th 3 Mean (95% CI) 10th 3 Median 90th 3 (50th) 3 Males ( ) ( ) ( ) ( ) ( ) ( ) ( ) ( ) Total ( ) ( ) Females ( ) ( ) By NZDep2006 quintile ( ) ( ) ( ) ( ) ( ) ( ) Total ( ) ( ) Males ( ) ( ) ( ) ( ) ( ) ( ) ( ) ( ) ( ) ( ) Females ( ) ( ) ( ) ( ) ( ) ( ) ( ) ( ) ( ) ( ) Usual daily intake. These data were adjusted for intra-individual variation using PC-SIDE. 2 These data were not adjusted for intra-individual variation because the only methods that have been developed for ratios use multiple day repeats. Percent energy from fat for each participant was calculated as the energy from fat (conversion factor = 37.7 kj/g) divided by the total energy intake. 3 Percentiles. # Confidence interval could not be calculated. Estimate should be interpreted with caution. 60 A Focus on Nutrition: Key Findings of the 2008/09 New Zealand Adult Nutrition Survey
89 Table 3.12: Polyunsaturated fat sources, percent (95% CI), 1 by age group, sex and food group Food group Total population Males Females Total Total Butter and margarine 12.1 ( ) Bread 8.6 ( ) Bread-based dishes Potatoes, kumara and taro 6.6 ( ) 6.5 ( ) Vegetables 6.4 ( ) Poultry 5.5 ( ) Fish and seafood 5.2 ( ) Grains and pasta 5.0 ( ) Breakfast cereals Cakes and muffins 3.9 ( ) 3.8 ( ) 7.9 ( ) 7.4 ( ) 12.5 ( ) 9.7 ( ) 3.7 ( ) 7.8 ( ) 3.3 ( ) 5.2 ( ) 2.5 ( ) 1.9 ( ) 10.2 ( ) 8.1 ( ) 11.5 ( ) 7.7 ( ) 4.2 ( ) 7.3 ( ) 3.3 ( ) 6.9 ( ) 2.2 ( ) 2.4 ( ) 11.7 ( ) 9.5 ( ) 6.8 ( ) 6.2 ( ) 5.0 ( ) 6.6 ( ) 6.2 ( ) 4.7 ( ) 3.3 ( ) 4.4 ( ) 15.2 ( ) 8.8 ( ) 6.6 ( ) 6.5 ( ) 6.6 ( ) 4.1 ( ) 5.2 ( ) 4.9 ( ) 5.5 ( ) 4.1 ( ) 19.5 ( ) 10.6 ( ) 2.4 ( ) 5.3 ( ) 7.2 ( ) 2.8 ( ) 5.7 ( ) 4.9 ( ) 4.4 ( ) 3.9 ( ) 12.8 ( ) 9.0 ( ) 7.7 ( ) 6.8 ( ) 5.4 ( ) 5.8 ( ) 5.1 ( ) 5.3 ( ) 3.7 ( ) 3.7 ( ) 7.8 ( ) 8.9 ( ) 12.3 ( ) 9.8 ( ) 5.0 ( ) 6.5 ( ) 2.3 ( ) 6.1 ( ) 2.1 ( ) 4.5 ( ) 8.8 ( ) 7.0 ( ) 7.0 ( ) 8.2 ( ) 5.6 ( ) 6.9 ( ) 4.5 ( ) 6.5 ( ) 2.7 ( ) 4.5 ( ) 10.3 ( ) 8.0 ( ) 6.1 ( ) 6.6 ( ) 6.6 ( ) 5.7 ( ) 6.0 ( ) 4.9 ( ) 4.4 ( ) 3.0 ( ) 13.1 ( ) 8.2 ( ) 3.0 ( ) 4.4 ( ) 9.7 ( ) 3.6 ( ) 5.6 ( ) 3.4 ( ) 4.8 ( ) 4.3 ( ) 19.2 ( ) 11.3 ( ) 2.4 ( ) 4.3 ( ) 7.8 ( ) 3.3 ( ) 5.2 ( ) 3.6 ( ) 5.3 ( ) 5.1 ( ) Nuts and seeds Savoury sauces and condiments Fruit Beef and veal Eggs and egg dishes Sausages and processed meats Biscuits Pies and pasties Pork Milk Sugar and sweets Fats and oils ( ) 8.3 ( ) 5.5 ( ) 6.3 ( ) 7.2 ( ) 5.2 ( ) 5.3 ( ) 4.8 ( ) 4.1 ( ) 3.9 ( ) A Focus on Nutrition: Key Findings of the 2008/09 New Zealand Adult Nutrition Survey 61
90 Food group Total population Males Females Total Total Snack bars Cheese Snack foods Dairy products Lamb and mutton Soups and stocks Non alcoholic beverages Puddings and desserts Supplements providing energy Other meat Proportion of total nutrient intake obtained from each food group. Results for Māori, Pacific, NZEO and NZDep2006 are in the online data tables. For full food group definitions, see Table % confidence intervals are presented only for the top 10 food groups. 62 A Focus on Nutrition: Key Findings of the 2008/09 New Zealand Adult Nutrition Survey
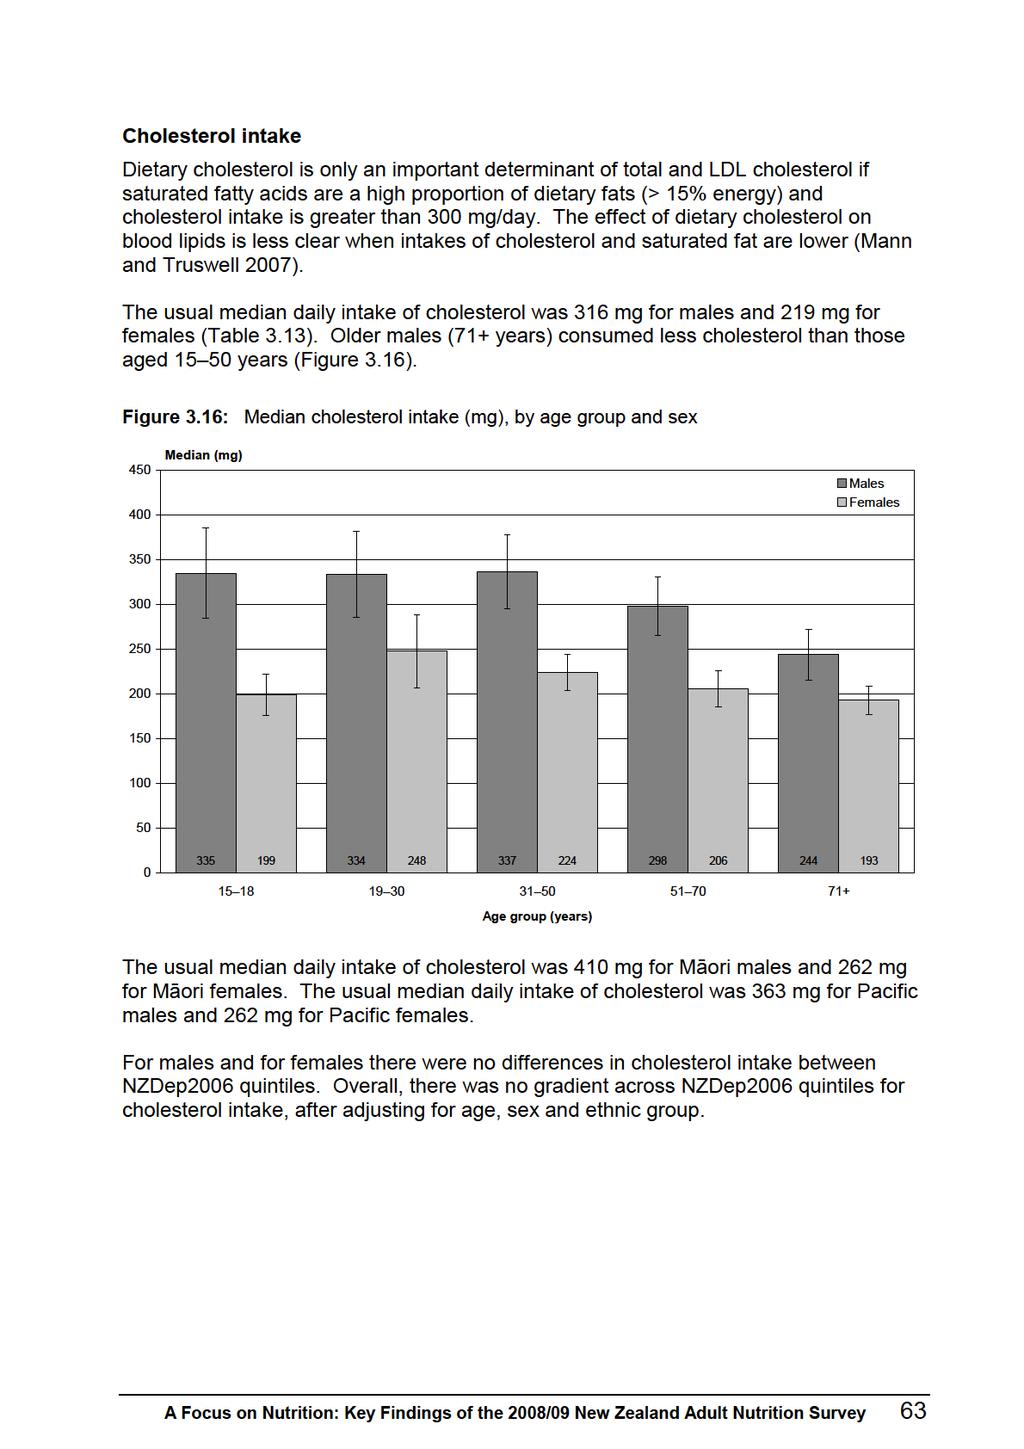
91
92
93 Table 3.13: Cholesterol intake, by age group, ethnic group, NZDep2006 and sex Cholesterol (mg) 1 Mean 10th 2 Median (50th), 2 (95% CI) 90th 2 Total population ( ) 430 By age group (years) Males ( ) ( ) ( ) ( ) ( ) 351 Total ( ) 489 Females ( ) ( ) ( ) ( ) ( ) 266 Total ( ) 348 Māori Males ( ) ( ) ( ) ( ) 605 Total ( ) 607 Females ( ) ( ) ( ) ( ) 401 Total ( ) 412 Pacific Males ( ) ( ) ( ) ( ) 513 Total ( ) 585 Females ( ) ( ) ( ) ( ) 351 Total ( ) 407 A Focus on Nutrition: Key Findings of the 2008/09 New Zealand Adult Nutrition Survey 65
94 Cholesterol (mg) 1 Mean 10th 2 Median (50th), 2 (95% CI) 90th 2 NZEO Males ( ) ( ) ( ) ( ) 411 Total ( ) 449 Females ( ) ( ) ( ) ( ) 308 Total ( ) 330 By NZDep2006 quintile Males ( ) ( ) ( ) ( ) ( ) 540 Females ( ) ( ) ( ) ( ) ( ) Usual daily intake. These data were adjusted for intra-individual variation using PC-SIDE. 2 Percentiles. 66 A Focus on Nutrition: Key Findings of the 2008/09 New Zealand Adult Nutrition Survey
95 Table 3.14: Cholesterol sources, percent (95% CI), 1 by age group, sex and food group Food group Total population Males Females Total Total Eggs and egg dishes 13.0 ( ) Poultry 12.3 ( ) Beef and veal 9.0 ( ) Milk 8.0 ( ) Fish and seafood 7.9 ( ) Bread-based dishes 7.0 ( ) Pork 5.1 ( ) Cakes and muffins Sausages and processed meats 4.3 ( ) 3.9 ( ) Grains and pasta 3.8 ( ) 12.2 ( ) 14.9 ( ) 7.8 ( ) 6.9 ( ) 4.4 ( ) 13.6 ( ) 5.0 ( ) 2.2 ( ) 4.1 ( ) 5.0 ( ) 9.3 ( ) 13.4 ( ) 7.2 ( ) 7.2 ( ) 4.2 ( ) 15.3 ( ) 6.7 ( ) 2.4 ( ) 4.4 ( ) 6.0 ( ) 12.7 ( ) 13.3 ( ) 9.6 ( ) 7.5 ( ) 8.3 ( ) 7.1 ( ) 4.2 ( ) 4.6 ( ) 4.3 ( ) 3.5 ( ) 15.7 ( ) 11.5 ( ) 8.5 ( ) 9.0 ( ) 7.9 ( ) 4.7 ( ) 6.4 ( ) 4.0 ( ) 4.1 ( ) 3.7 ( ) 14.6 ( ) 7.3 ( ) 12.3 ( ) 8.9 ( ) 8.1 ( ) 2.5 ( ) 8.2 ( ) 5.1 ( ) 4.4 ( ) 1.8 ( ) 13.0 ( ) 12.4 ( ) 8.9 ( ) 7.9 ( ) 7.0 ( ) 8.2 ( ) 5.7 ( ) 3.8 ( ) 4.3 ( ) 4.0 ( ) 8.0 ( ) 14.1 ( ) 6.6 ( ) 6.9 ( ) 3.5 ( ) 13.0 ( ) 4.0 ( ) 6.2 ( ) 4.5 ( ) 6.1 ( ) 15.8 ( ) 15.8 ( ) 4.6 ( ) 7.0 ( ) 6.7 ( ) 7.3 ( ) 2.9 ( ) 4.3 ( ) 4.3 ( ) 5.8 ( ) 11.5 ( ) 12.7 ( ) 9.5 ( ) 8.5 ( ) 9.2 ( ) 6.4 ( ) 4.4 ( ) 4.1 ( ) 3.4 ( ) 4.0 ( ) 13.2 ( ) 9.3 ( ) 10.9 ( ) 8.2 ( ) 11.2 ( ) 3.7 ( ) 5.4 ( ) 5.1 ( ) 3.2 ( ) 1.5 ( ) 16.0 ( ) 9.0 ( ) 12.5 ( ) 9.5 ( ) 7.7 ( ) 2.0 ( ) 5.4 ( ) 6.0 ( ) 3.8 ( ) 2.1 ( ) Dairy products Pies and pasties Lamb and mutton Cheese Butter and margarine Potatoes, kumara and taro Puddings and desserts Non-alcoholic beverages Biscuits Soups and stocks ( ) 12.1 ( ) 9.0 ( ) 8.1 ( ) 8.7 ( ) 5.9 ( ) 4.4 ( ) 4.7 ( ) 3.6 ( ) 3.6 ( ) A Focus on Nutrition: Key Findings of the 2008/09 New Zealand Adult Nutrition Survey 67
96 Food group Total population Males Females Total Total Vegetables Bread Other meat Sugar and sweets Savoury sauces and condiments Supplements providing energy Snack foods Snack bars Breakfast cereals Alcoholic beverages Nuts and seeds Fats and oils Fruit Proportion of total nutrient intake obtained from each food group. Results for Māori, Pacific, NZEO and NZDep2006 are in the online data tables. For full food group definitions, see Table % confidence intervals are presented only for the top 10 food groups. 68 A Focus on Nutrition: Key Findings of the 2008/09 New Zealand Adult Nutrition Survey
97
98
99
100 Table 3.15: Carbohydrate intake, by age group, ethnic group, NZDep2006 and sex Carbohydrate (g) 1 Percent energy from carbohydrate 2 Mean 10th 3 Median (50th), 3 (95% CI) 90th 3 Mean (95% CI) 10th 3 Median 90th 3 (50th) 3 Total population ( ) ( ) By age group (years) Males ( ) ( ) ( ) ( ) ( ) ( ) ( ) ( ) ( ) ( ) Total ( ) ( ) Females ( ) ( ) Māori ( ) ( ) ( ) ( ) ( ) ( ) ( ) ( ) Total ( ) ( ) Males ( ) ( ) ( ) ( ) ( ) ( ) ( ) ( ) Total ( ) ( ) Females ( ) ( ) Pacific ( ) ( ) ( ) ( ) ( ) ( ) Total ( ) ( ) Males # ( ) ( ) ( ) ( ) ( ) ( ) ( ) Total ( ) ( ) Females ( ) ( ) ( ) ( ) ( ) ( ) ( ) ( ) Total ( ) ( ) A Focus on Nutrition: Key Findings of the 2008/09 New Zealand Adult Nutrition Survey
101 NZEO Carbohydrate (g) 1 Percent energy from carbohydrate 2 Mean 10th 3 Median (50th), 3 (95% CI) 90th 3 Mean (95% CI) 10th 3 Median 90th 3 (50th) 3 Males ( ) ( ) ( ) ( ) ( ) ( ) ( ) ( ) Total ( ) ( ) Females ( ) ( ) By NZDep2006 quintile ( ) ( ) ( ) ( ) ( ) ( ) Total ( ) ( ) Males ( ) ( ) ( ) ( ) ( ) ( ) ( ) ( ) ( ) ( ) Females ( ) ( ) ( ) ( ) ( ) ( ) ( ) ( ) ( ) ( ) Usual daily intake. These data were adjusted for intra-individual variation using PC-SIDE. 2 These data were not adjusted for intra-individual variation because the only methods that have been developed for ratios use multiple day repeats. Percent energy from carbohydrate for each participant was calculated as the energy from carbohydrate (conversion factor = 16.7 kj/g) divided by the total energy intake. 3 Percentiles. # Confidence interval could not be calculated. Estimate should be interpreted with caution. A Focus on Nutrition: Key Findings of the 2008/09 New Zealand Adult Nutrition Survey 73
102 Table 3.16: Carbohydrate sources, percent (95% CI), 1 by age group, sex and food group Food group Total population Males Females Total Total Bread 17.2 ( ) Grains and pasta 9.3 ( ) Fruit 8.9 ( ) Non-alcoholic beverages Potatoes, kumara and taro Sugar and sweets Breakfast cereals Cakes and muffins 8.6 ( ) 8.4 ( ) 7.1 ( ) 5.2 ( ) 4.4 ( ) Milk 4.2 ( ) Bread-based dishes 4.2 ( ) 15.2 ( ) 8.3 ( ) 6.0 ( ) 14.3 ( ) 10.8 ( ) 4.7 ( ) 5.0 ( ) 1.9 ( ) 3.6 ( ) 9.5 ( ) 14.4 ( ) 12.1 ( ) 5.7 ( ) 14.1 ( ) 7.8 ( ) 6.5 ( ) 3.9 ( ) 2.7 ( ) 3.0 ( ) 7.4 ( ) 18.9 ( ) 9.8 ( ) 6.8 ( ) 8.0 ( ) 8.0 ( ) 8.0 ( ) 4.2 ( ) 4.6 ( ) 4.1 ( ) 4.5 ( ) 18.7 ( ) 9.1 ( ) 8.3 ( ) 6.2 ( ) 9.2 ( ) 7.3 ( ) 7.3 ( ) 4.7 ( ) 4.5 ( ) 4.3 ( ) 21.1 ( ) 6.2 ( ) 11.7 ( ) 3.7 ( ) 9.4 ( ) 8.3 ( ) 6.2 ( ) 4.4 ( ) 4.9 ( ) 1.5 ( ) 17.8 ( ) 9.6 ( ) 7.4 ( ) 8.9 ( ) 8.6 ( ) 7.3 ( ) 5.2 ( ) 4.0 ( ) 4.0 ( ) 5.2 ( ) 14.0 ( ) 9.4 ( ) 6.9 ( ) 14.3 ( ) 8.5 ( ) 6.8 ( ) 3.5 ( ) 4.9 ( ) 3.1 ( ) 7.0 ( ) 13.0 ( ) 11.3 ( ) 7.8 ( ) 12.0 ( ) 8.7 ( ) 7.6 ( ) 3.8 ( ) 4.4 ( ) 3.3 ( ) 4.1 ( ) 17.0 ( ) 9.6 ( ) 9.4 ( ) 7.7 ( ) 8.0 ( ) 7.7 ( ) 5.1 ( ) 4.2 ( ) 5.1 ( ) 3.9 ( ) 17.1 ( ) 7.5 ( ) 12.9 ( ) 6.6 ( ) 7.9 ( ) 5.9 ( ) 6.1 ( ) 5.6 ( ) 4.6 ( ) 2.0 ( ) 21.7 ( ) 5.3 ( ) 14.5 ( ) 4.3 ( ) 8.5 ( ) 5.5 ( ) 6.4 ( ) 5.9 ( ) 5.1 ( ) 1.5 ( ) Vegetables Biscuits Alcoholic beverages Dairy products Pies and pasties Savoury sauces and condiments Puddings and desserts Fish and seafood Soups and stocks Snack bars Sausages and processed meats ( ) 8.9 ( ) 10.4 ( ) 8.3 ( ) 8.2 ( ) 6.9 ( ) 5.1 ( ) 4.8 ( ) 4.5 ( ) 3.4 ( ) 74 A Focus on Nutrition: Key Findings of the 2008/09 New Zealand Adult Nutrition Survey
103 Food group Total population Males Females Total Total Poultry Snack foods Beef and veal Nuts and seeds Supplements providing energy Pork Eggs and egg dishes Lamb and mutton Other meat Cheese Butter and margarine Fats and oils Proportion of total nutrient intake obtained from each food group. Results for Māori, Pacific, NZEO and NZDep2006 are in the online data tables. For full food group definitions, see Table % confidence intervals are presented only for the top 10 food groups. A Focus on Nutrition: Key Findings of the 2008/09 New Zealand Adult Nutrition Survey 75
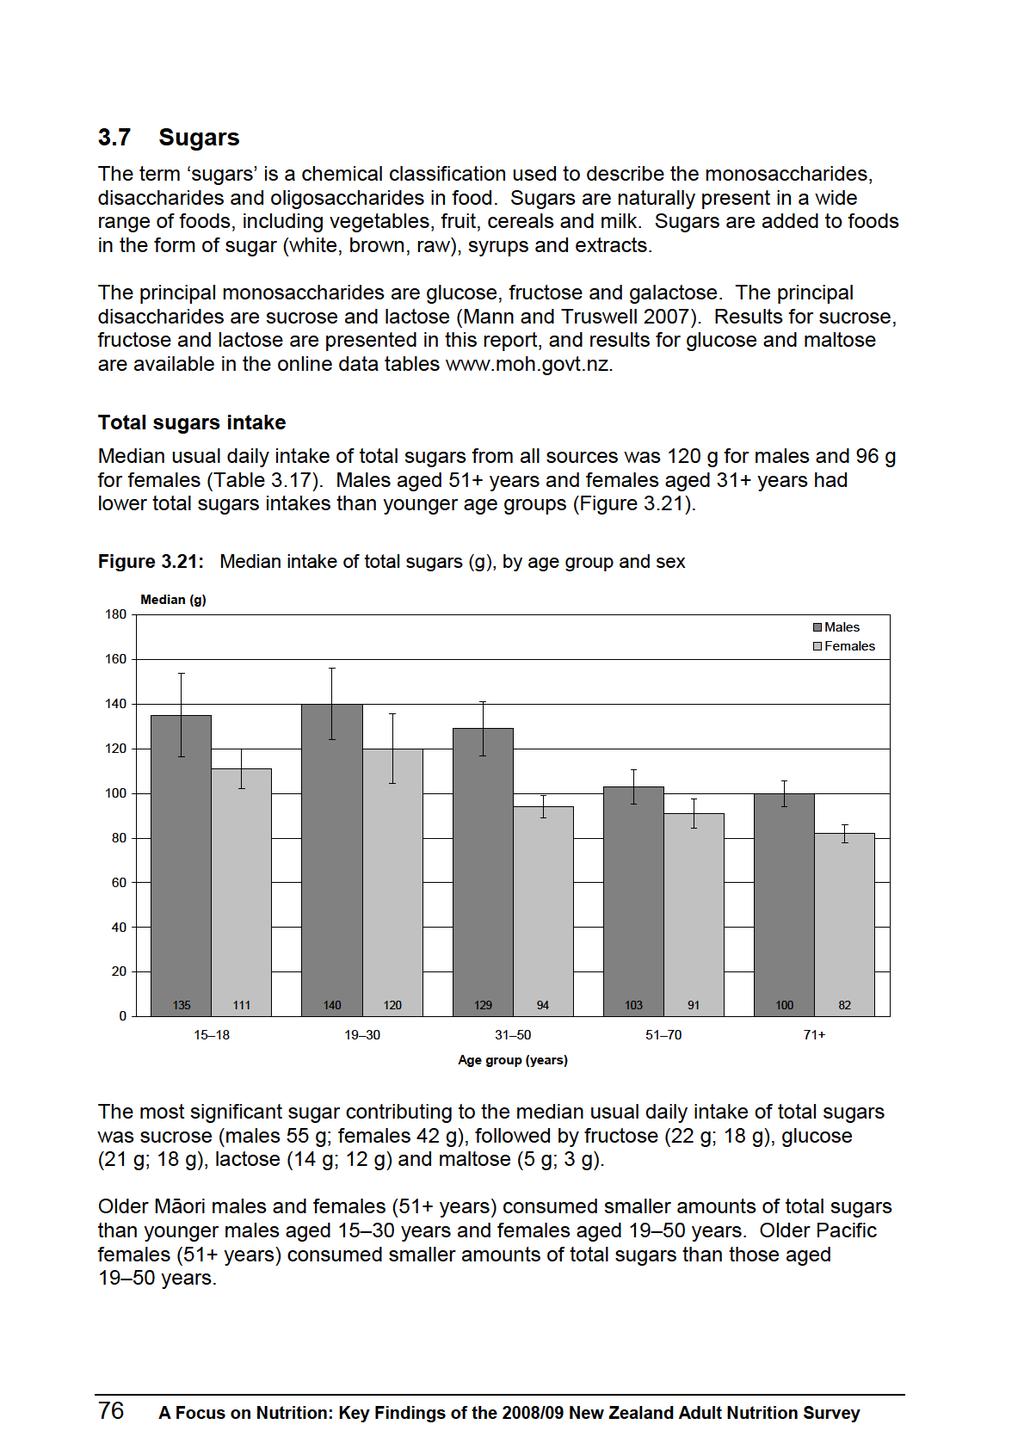
104
105
106 Table 3.17: Total sugars intake, by age group, ethnic group, NZDep2006 and sex Total sugars (g) 1 Mean 10th 2 Median (50th), 2 (95% CI) 90th 2 Total population ( ) 175 By age group (years) Males ( ) ( ) ( ) (95 111) (94 106) 153 Total ( ) 194 Females ( ) ( ) (89 99) (84 98) (78 86) 120 Total (91 101) 153 Māori Males ( ) ( ) (96 132) (69 97) 141 Total ( ) 195 Females (78 127) ( ) (90 114) (67 89) 130 Total (96 110) 172 Pacific Males # (97 181) (79 111) (68 128) 142 Total ( ) 213 Females (83 139) (86 144) (89 109) (47 83) 138 Total (90 106) A Focus on Nutrition: Key Findings of the 2008/09 New Zealand Adult Nutrition Survey
107 Total sugars (g) 1 Mean 10th 2 Median (50th), 2 (95% CI) 90th 2 NZEO Males ( ) ( ) ( ) (96 108) 161 Total ( ) 194 Females ( ) ( ) (88 98) (85 93) 136 Total (92 100) 149 By NZDep2006 quintile Males ( ) ( ) ( ) ( ) ( ) 182 Females (86 102) (90 106) (94 112) (86 100) (87 101) Usual daily intake. These data were adjusted for intra-individual variation using PC-SIDE. 2 Percentiles. # Confidence interval could not be calculated. Estimate should be interpreted with caution. A Focus on Nutrition: Key Findings of the 2008/09 New Zealand Adult Nutrition Survey 79
108 Table 3.18: Total sugars sources, percent (95% CI), 1 by age group, sex and food group Food group Total population Males Females Total Total Fruit 17.8 ( ) Non-alcoholic beverages 16.7 ( ) Sugar and sweets 14.6 ( ) Milk 9.7 ( ) Vegetables 6.0 ( ) Cakes and muffins 4.7 ( ) Bread 4.4 ( ) Dairy products 4.2 ( ) Alcoholic beverages 3.5 ( ) Breakfast cereals 2.7 ( ) 12.9 ( ) 29.1 ( ) 9.9 ( ) 9.2 ( ) 2.5 ( ) 2.1 ( ) 4.3 ( ) 4.9 ( ) 2.1 ( ) 2.1 ( ) 12.2 ( ) 28.8 ( ) 13.3 ( ) 7.8 ( ) 3.8 ( ) 2.6 ( ) 3.5 ( ) 3.5 ( ) 5.1 ( ) 1.8 ( ) 14.0 ( ) 16.0 ( ) 17.5 ( ) 9.9 ( ) 5.2 ( ) 5.1 ( ) 5.5 ( ) 4.0 ( ) 3.9 ( ) 2.1 ( ) 17.2 ( ) 11.6 ( ) 16.8 ( ) 10.9 ( ) 6.7 ( ) 4.7 ( ) 5.1 ( ) 3.6 ( ) 3.6 ( ) 3.7 ( ) 22.9 ( ) 6.9 ( ) 17.6 ( ) 10.9 ( ) 6.5 ( ) 4.8 ( ) 5.4 ( ) 3.9 ( ) 2.5 ( ) 2.4 ( ) 15.2 ( ) 17.6 ( ) 15.9 ( ) 9.8 ( ) 5.2 ( ) 4.2 ( ) 4.9 ( ) 3.9 ( ) 3.8 ( ) 2.5 ( ) 13.6 ( ) 27.4 ( ) 12.5 ( ) 6.8 ( ) 3.3 ( ) 5.4 ( ) 3.4 ( ) 4.9 ( ) 2.8 ( ) 1.7 ( ) 15.0 ( ) 22.9 ( ) 14.2 ( ) 6.9 ( ) 5.5 ( ) 4.0 ( ) 3.2 ( ) 5.4 ( ) 5.7 ( ) 2.3 ( ) 18.9 ( ) 14.8 ( ) 15.1 ( ) 10.8 ( ) 6.2 ( ) 4.8 ( ) 4.0 ( ) 3.6 ( ) 3.5 ( ) 3.2 ( ) 24.3 ( ) 12.3 ( ) 11.5 ( ) 10.0 ( ) 8.5 ( ) 5.9 ( ) 4.1 ( ) 4.6 ( ) 1.9 ( ) 3.0 ( ) 28.5 ( ) 8.0 ( ) 11.3 ( ) 11.0 ( ) 7.6 ( ) 6.2 ( ) 5.0 ( ) 4.9 ( ) 1.3 ( ) 3.1 ( ) Biscuits Savoury sauces and condiments Puddings and desserts Bread-based dishes Potatoes, kumara and taro Grains and pasta Snack bars Soups and stocks Poultry Beef and veal Nuts and seeds Pies and pasties ( ) 15.9 ( ) 13.4 ( ) 9.6 ( ) 6.6 ( ) 5.1 ( ) 4.0 ( ) 4.4 ( ) 3.3 ( ) 2.9 ( ) 80 A Focus on Nutrition: Key Findings of the 2008/09 New Zealand Adult Nutrition Survey
109 Food group Total population Males Females Total Total Fish and seafood Supplements providing energy Snack foods Pork Eggs and egg dishes Sausages and processed meats Lamb and mutton Cheese Butter and margarine Other meat Fats and oils Proportion of total nutrient intake obtained from each food group. Results for Māori, Pacific, NZEO and NZDep2006 are in the online data tables. For full food group definitions, see Table % confidence intervals are presented only for the top 10 food groups. A Focus on Nutrition: Key Findings of the 2008/09 New Zealand Adult Nutrition Survey 81
110
111
112 Table 3.19: Sucrose intake, by age group, ethnic group, NZDep2006 and sex Sucrose (g) 1 Mean 10th 2 Median (50th), 2 (95% CI) 90th 2 Total population ( ) 92.0 By age group (years) Males ( ) ( ) ( ) ( ) ( ) 75.0 Total ( ) Females ( ) ( ) ( ) ( ) ( ) 51.4 Total ( ) 81.0 Māori Males ( ) ( ) ( ) ( ) 71.0 Total ( ) Females ( ) ( ) ( ) ( ) 65.0 Total ( ) 97.0 Pacific Males # ( ) ( ) ( ) Total ( ) Females ( ) ( ) ( ) ( ) 80.0 Total ( ) A Focus on Nutrition: Key Findings of the 2008/09 New Zealand Adult Nutrition Survey
113 Sucrose (g) 1 Mean 10th 2 Median (50th), 2 (95% CI) 90th 2 NZEO Males ( ) ( ) ( ) ( ) 77.0 Total ( ) 99.0 Females ( ) ( ) ( ) ( ) 61.0 Total ( ) 77.0 By NZDep2006 quintile Males ( ) ( ) ( ) ( ) ( ) Females ( ) ( ) ( ) ( ) ( ) Usual daily intake. These data were adjusted for intra-individual variation using PC-SIDE. 2 Percentiles. # Confidence interval could not be calculated. Estimate should be interpreted with caution. A Focus on Nutrition: Key Findings of the 2008/09 New Zealand Adult Nutrition Survey 85
114 Table 3.20: Sucrose sources, percent (95% CI), 1 by age group, sex and food group Food group Total population Males Females Total Total Sugar and sweets Non-alcoholic beverages 23.2 ( ) 16.4 ( ) Fruit 16.4 ( ) Cakes and muffins 7.1 ( ) Dairy products 5.6 ( ) Biscuits 5.0 ( ) Vegetables 4.3 ( ) Breakfast cereals Savoury sauces and condiments Alcoholic beverages Puddings and desserts Potatoes, kumara and taro 3.2 ( ) 2.8 ( ) 2.6 ( ) 15.6 ( ) 30.8 ( ) 12.4 ( ) 3.2 ( ) 6.1 ( ) 4.5 ( ) 1.9 ( ) 2.9 ( ) 3.7 ( ) 1.8 ( ) 21.9 ( ) 30.1 ( ) 11.8 ( ) 3.4 ( ) 4.5 ( ) 2.0 ( ) 2.6 ( ) 1.9 ( ) 3.4 ( ) 4.3 ( ) 27.3 ( ) 15.2 ( ) 12.3 ( ) 7.8 ( ) 5.4 ( ) 4.4 ( ) 3.8 ( ) 2.2 ( ) 3.3 ( ) 2.5 ( ) 26.7 ( ) 12.0 ( ) 16.6 ( ) 6.6 ( ) 4.9 ( ) 5.5 ( ) 5.0 ( ) 3.9 ( ) 3.0 ( ) 1.8 ( ) 27.2 ( ) 6.3 ( ) 20.6 ( ) 7.2 ( ) 5.7 ( ) 8.3 ( ) 4.8 ( ) 3.1 ( ) 2.5 ( ) 1.4 ( ) 25.1 ( ) 17.8 ( ) 14.1 ( ) 6.2 ( ) 5.2 ( ) 4.6 ( ) 3.8 ( ) 2.7 ( ) 3.2 ( ) 2.5 ( ) 18.1 ( ) 27.2 ( ) 11.3 ( ) 7.7 ( ) 6.0 ( ) 7.1 ( ) 2.2 ( ) 2.6 ( ) 3.0 ( ) 2.9 ( ) 22.6 ( ) 22.9 ( ) 11.8 ( ) 5.6 ( ) 7.3 ( ) 4.5 ( ) 3.5 ( ) 2.5 ( ) 2.7 ( ) 5.6 ( ) 25.1 ( ) 13.8 ( ) 17.4 ( ) 7.7 ( ) 4.7 ( ) 4.8 ( ) 4.6 ( ) 4.0 ( ) 2.6 ( ) 2.5 ( ) 17.3 ( ) 11.1 ( ) 23.3 ( ) 9.2 ( ) 6.8 ( ) 5.7 ( ) 6.3 ( ) 3.8 ( ) 2.4 ( ) 1.2 ( ) 18.0 ( ) 7.9 ( ) 27.7 ( ) 9.6 ( ) 6.6 ( ) 7.0 ( ) 5.9 ( ) 3.7 ( ) 2.0 ( ) 0.6 ( ) Bread Grains and pasta Snack bars Milk Nuts and seeds Bread-based dishes Soups and stocks Poultry Beef and veal Snack foods ( ) 15.2 ( ) 18.5 ( ) 7.9 ( ) 6.0 ( ) 5.4 ( ) 4.8 ( ) 3.5 ( ) 2.5 ( ) 2.6 ( ) 86 A Focus on Nutrition: Key Findings of the 2008/09 New Zealand Adult Nutrition Survey
115 Food group Total population Males Females Total Total Fish and seafood Supplements providing energy Pies and pasties Pork Sausages and processed meats Lamb and mutton Eggs and egg dishes Other meat Cheese Butter and margarine Fats and oils Proportion of total nutrient intake obtained from each food group. Results for Māori, Pacific, NZEO and NZDep2006 are in the online data tables. For full food group definitions, see Table % confidence intervals are presented only for the top 10 food groups. A Focus on Nutrition: Key Findings of the 2008/09 New Zealand Adult Nutrition Survey 87
116
117
118 Table 3.21: Fructose intake, by age group, ethnic group, NZDep2006 and sex Fructose (g) 1 Mean 10th 2 Median (50th), 2 (95% CI) 90th 2 Total population ( ) 34.6 By age group (years) Males ( ) ( ) ( ) ( ) ( ) 31.8 Total ( ) 38.2 Females ( ) ( ) ( ) ( ) ( ) 27.3 Total ( ) 30.7 Māori Males ( ) ( ) ( ) ( ) 25.8 Total ( ) 36.1 Females ( ) ( ) ( ) ( ) 26.4 Total ( ) 31.5 Pacific Males ( ) ( ) ( ) ( ) 19.7 Total ( ) 34.3 Females ( ) ( ) ( ) ( ) 25.9 Total ( ) A Focus on Nutrition: Key Findings of the 2008/09 New Zealand Adult Nutrition Survey
119 Fructose (g) 1 Mean 10th 2 Median (50th), 2 (95% CI) 90th 2 NZEO Males ( ) ( ) ( ) ( ) 33.4 Total ( ) 38.7 Females ( ) ( ) ( ) ( ) 31.3 Total ( ) 30.6 By NZDep2006 quintile Males ( ) ( ) ( ) ( ) ( ) 33.0 Females ( ) ( ) ( ) ( ) ( ) Usual daily intake. These data were adjusted for intra-individual variation using PC-SIDE. 2 Percentiles. A Focus on Nutrition: Key Findings of the 2008/09 New Zealand Adult Nutrition Survey 91
120 Table 3.22: Fructose sources, percent (95% CI), 1 by age group, sex and food group Food group Total population Males Females Total Total Fruit 29.2 ( ) Non-alcoholic beverages 17.7 ( ) Vegetables 12.5 ( ) Sugar and sweets Alcoholic beverages Savoury sauces and condiments Breakfast cereals 6.7 ( ) 4.9 ( ) 4.0 ( ) 3.9 ( ) Bread 3.4 ( ) Bread-based dishes Cakes and muffins Potatoes, kumara and taro 2.6 ( ) 2.4 ( ) 20.8 ( ) 32.0 ( ) 5.9 ( ) 4.0 ( ) 2.3 ( ) 5.9 ( ) 3.3 ( ) 3.3 ( ) 5.4 ( ) 0.8 ( ) 19.8 ( ) 32.2 ( ) 8.5 ( ) 3.2 ( ) 5.9 ( ) 5.0 ( ) 3.0 ( ) 2.9 ( ) 5.0 ( ) 1.5 ( ) 24.3 ( ) 17.1 ( ) 12.9 ( ) 7.5 ( ) 5.8 ( ) 5.4 ( ) 3.3 ( ) 5.0 ( ) 3.0 ( ) 1.9 ( ) 27.8 ( ) 12.2 ( ) 14.0 ( ) 9.3 ( ) 5.3 ( ) 3.4 ( ) 5.2 ( ) 3.3 ( ) 2.6 ( ) 3.3 ( ) 36.2 ( ) 8.2 ( ) 12.9 ( ) 12.5 ( ) 4.0 ( ) 2.5 ( ) 3.2 ( ) 3.8 ( ) 0.7 ( ) 3.8 ( ) 25.1 ( ) 19.2 ( ) 11.7 ( ) 7.3 ( ) 5.3 ( ) 4.6 ( ) 3.8 ( ) 3.9 ( ) 3.3 ( ) 2.3 ( ) 24.7 ( ) 31.7 ( ) 8.3 ( ) 5.4 ( ) 2.8 ( ) 4.1 ( ) 2.0 ( ) 2.7 ( ) 4.4 ( ) 1.8 ( ) 27.8 ( ) 23.4 ( ) 10.5 ( ) 5.6 ( ) 6.5 ( ) 4.8 ( ) 3.5 ( ) 2.7 ( ) 2.1 ( ) 1.5 ( ) 31.3 ( ) 14.9 ( ) 13.5 ( ) 5.5 ( ) 5.7 ( ) 4.1 ( ) 4.8 ( ) 3.3 ( ) 2.4 ( ) 2.3 ( ) 36.8 ( ) 12.0 ( ) 16.1 ( ) 7.4 ( ) 3.1 ( ) 2.3 ( ) 4.0 ( ) 2.8 ( ) 0.8 ( ) 3.1 ( ) 45.1 ( ) 8.6 ( ) 13.5 ( ) 7.8 ( ) 2.5 ( ) 1.6 ( ) 3.8 ( ) 2.7 ( ) 0.6 ( ) 3.9 ( ) Grains and pasta Dairy products Snack bars Beef and veal Poultry Soups and stocks Biscuits Puddings and desserts Pork Pies and pasties Fish and seafood ( ) 16.3 ( ) 13.2 ( ) 6.2 ( ) 4.6 ( ) 3.5 ( ) 4.0 ( ) 3.0 ( ) 1.9 ( ) 2.5 ( ) 92 A Focus on Nutrition: Key Findings of the 2008/09 New Zealand Adult Nutrition Survey
121 Food group Total population Males Females Total Total Sausages and processed meats Milk Eggs and egg dishes Snack foods Nuts and seeds Lamb and mutton Other meat Cheese Supplements providing energy Butter and margarine Fats and oils Proportion of total nutrient intake obtained from each food group. Results for Māori, Pacific, NZEO and NZDep2006 are in the online data tables. For full food group definitions, see Table % confidence intervals are presented only for the top 10 food groups. A Focus on Nutrition: Key Findings of the 2008/09 New Zealand Adult Nutrition Survey 93
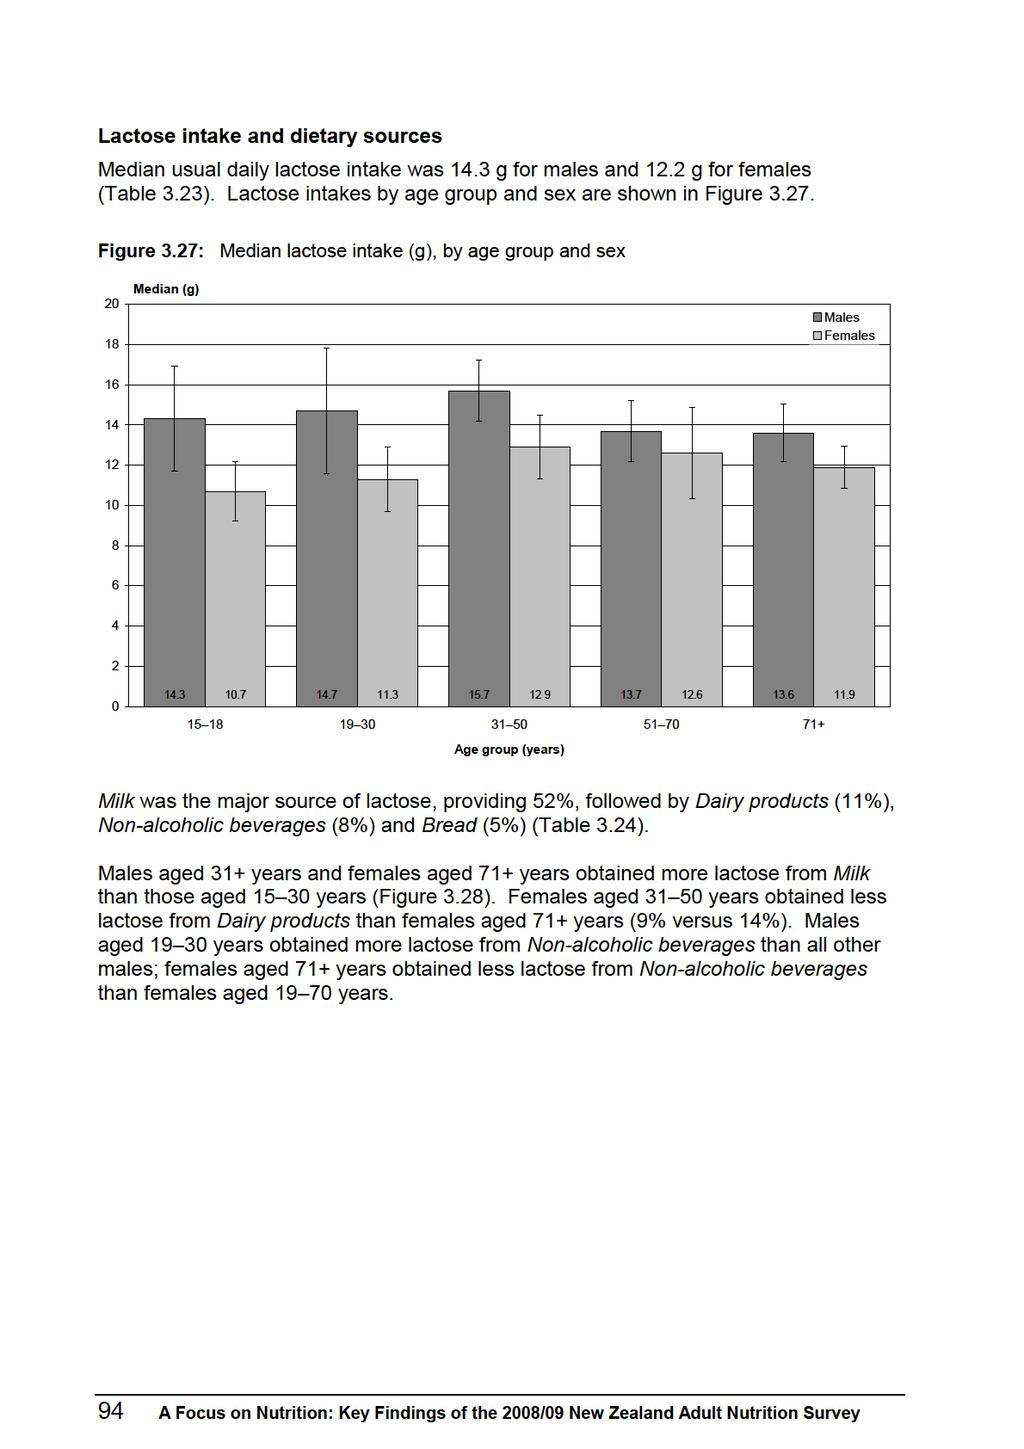
122
123
124 Table 3.23: Lactose intake, by age group, ethnic group, NZDep2006 and sex Lactose (g) 1 Mean 10th 2 Median (50th), 2 (95% CI) 90th 2 Total population ( ) 25.6 By age group (years) Males ( ) ( ) ( ) ( ) ( ) 24.6 Total ( ) 27.8 Females ( ) ( ) ( ) ( ) ( ) 21.7 Total ( ) 23.2 Māori Males ( ) ( ) ( ) ( ) 23.5 Total ( ) 23.4 Females ( ) ( ) ( ) ( ) 19.6 Total ( ) 23.1 Pacific Males ( ) ( ) ( ) ( ) 17.1 Total ( ) 25.4 Females ( ) ( ) ( ) ( ) 13.8 Total ( ) A Focus on Nutrition: Key Findings of the 2008/09 New Zealand Adult Nutrition Survey
125 Lactose (g) 1 Mean 10th 2 Median (50th), 2 (95% CI) 90th 2 NZEO Males ( ) ( ) ( ) ( ) 25.7 Total ( ) 26.8 Females ( ) ( ) ( ) ( ) 21.8 Total ( ) 22.6 By NZDep2006 quintile Males ( ) ( ) ( ) ( ) ( ) 24.8 Females ( ) ( ) ( ) ( ) ( ) Usual daily intake. These data were adjusted for intra-individual variation using PC-SIDE. 2 Percentiles. A Focus on Nutrition: Key Findings of the 2008/09 New Zealand Adult Nutrition Survey 97
126 Table 3.24: Lactose sources, percent (95% CI), 1 by age group, sex and food group Food group Total population Males Females Total Total Milk 51.7 ( ) Dairy products 10.6 ( ) Non-alcoholic beverages 8.1 ( ) Bread 5.2 ( ) Sugar and sweets Cakes and muffins 3.3 ( ) 3.1 ( ) Biscuits 1.6 ( ) Grains and pasta 1.6 ( ) Potatoes, kumara and taro Puddings and desserts Bread-based dishes Eggs and egg dishes Alcoholic beverages Savoury sauces and condiments 1.5 ( ) 1.5 ( ) 45.2 ( ) 10.4 ( ) 4.2 ( ) 6.1 ( ) 2.4 ( ) 2.1 ( ) 2.4 ( ) 3.2 ( ) 2.2 ( ) 0.9 ( ) 40.5 ( ) 8.5 ( ) 13.9 ( ) 4.4 ( ) 5.8 ( ) 2.5 ( ) 1.4 ( ) 4.2 ( ) 0.7 ( ) 0.5 ( ) 55.5 ( ) 10.2 ( ) 7.0 ( ) 5.6 ( ) 3.4 ( ) 3.7 ( ) 1.0 ( ) 0.9 ( ) 1.1 ( ) 1.5 ( ) 58.4 ( ) 9.3 ( ) 5.5 ( ) 6.0 ( ) 1.8 ( ) 3.1 ( ) 1.6 ( ) 1.3 ( ) 1.6 ( ) 0.6 ( ) 63.6 ( ) 9.4 ( ) 2.3 ( ) 4.5 ( ) 0.9 ( ) 2.0 ( ) 2.3 ( ) 0.6 ( ) 1.9 ( ) 3.4 ( ) 53.1 ( ) 9.6 ( ) 7.4 ( ) 5.4 ( ) 3.2 ( ) 3.0 ( ) 1.5 ( ) 1.8 ( ) 1.3 ( ) 1.2 ( ) 35.5 ( ) 13.5 ( ) 7.2 ( ) 5.9 ( ) 6.0 ( ) 5.5 ( ) 4.3 ( ) 3.3 ( ) 1.4 ( ) 1.6 ( ) 40.5 ( ) 13.4 ( ) 9.3 ( ) 5.5 ( ) 4.5 ( ) 3.7 ( ) 2.0 ( ) 2.3 ( ) 1.4 ( ) 2.6 ( ) 53.9 ( ) 8.9 ( ) 9.6 ( ) 3.5 ( ) 4.2 ( ) 2.5 ( ) 1.6 ( ) 1.4 ( ) 2.0 ( ) 1.6 ( ) 53.5 ( ) 12.8 ( ) 9.2 ( ) 6.1 ( ) 1.7 ( ) 3.7 ( ) 1.4 ( ) 0.2 ( ) 1.3 ( ) 1.3 ( ) 58.7 ( ) 13.6 ( ) 4.7 ( ) 5.7 ( ) 1.4 ( ) 2.9 ( ) 1.1 ( ) 1.1 ( ) 1.6 ( ) 1.6 ( ) Fish and seafood Supplements providing energy Pies and pasties Snack bars Breakfast cereals ( ) 11.6 ( ) 8.7 ( ) 5.0 ( ) 3.4 ( ) 3.3 ( ) 1.7 ( ) 1.4 ( ) 1.6 ( ) 1.7 ( ) 98 A Focus on Nutrition: Key Findings of the 2008/09 New Zealand Adult Nutrition Survey
127 Food group Total population Males Females Total Total Soups and stocks Cheese Butter and margarine Snack foods Poultry Vegetables Nuts and seeds Lamb and mutton Sausages and processed meats Beef and veal Pork Other meat Fruit Fats and oils Proportion of total nutrient intake obtained from each food group. Results for Māori, Pacific, NZEO and NZDep2006 are in the online data tables. For full food group definitions, see Table % confidence intervals are presented only for the top 10 food groups. A Focus on Nutrition: Key Findings of the 2008/09 New Zealand Adult Nutrition Survey 99
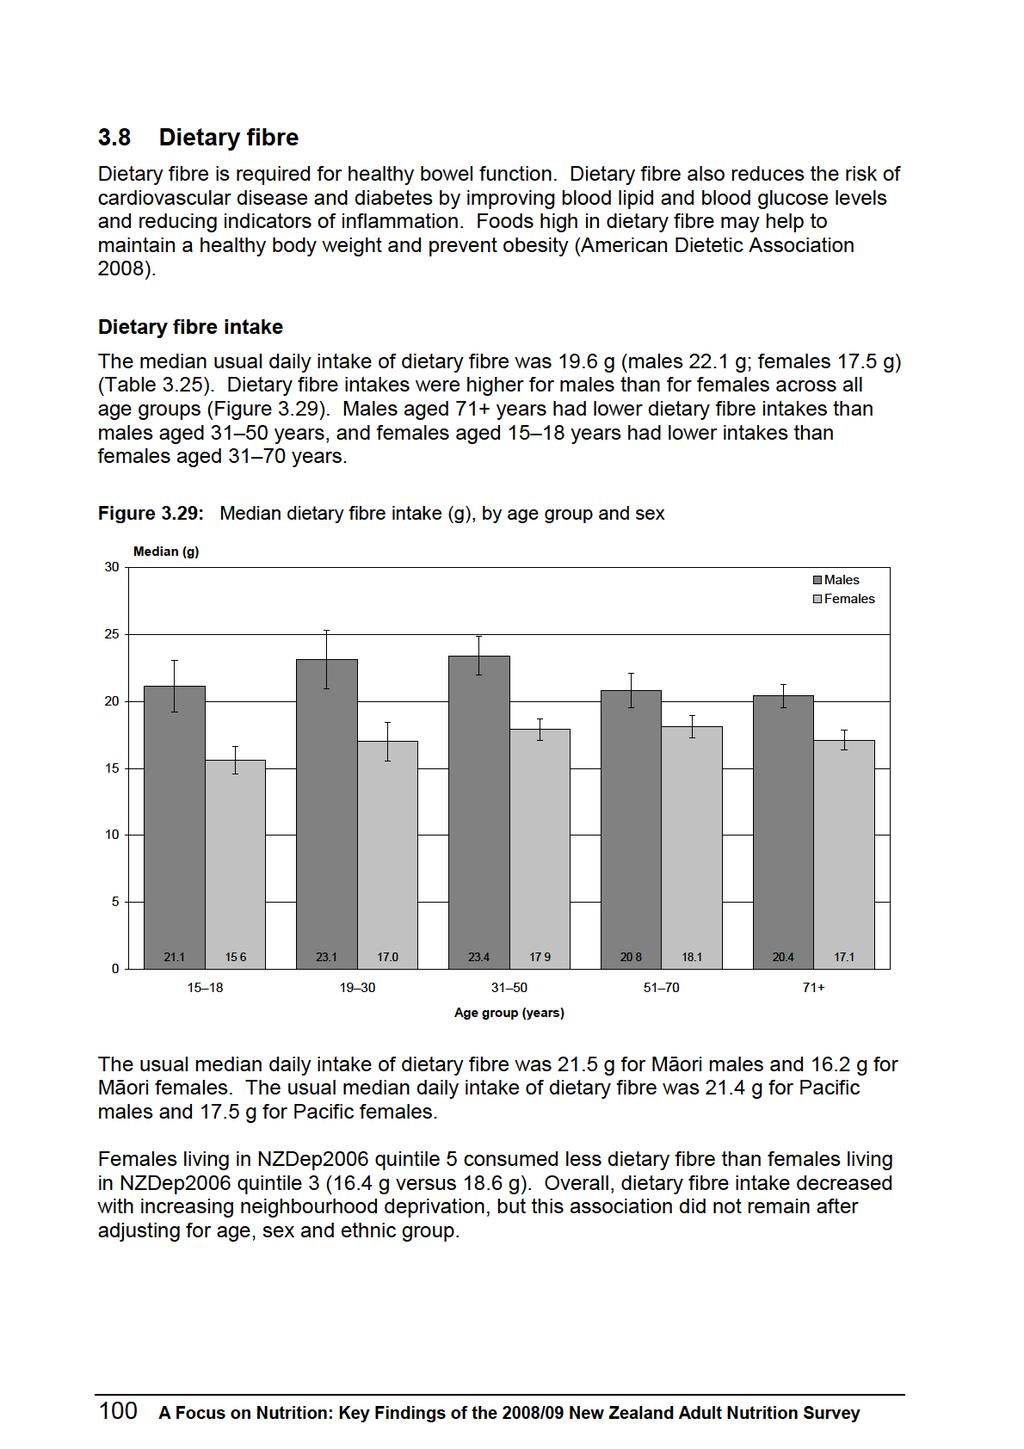
128
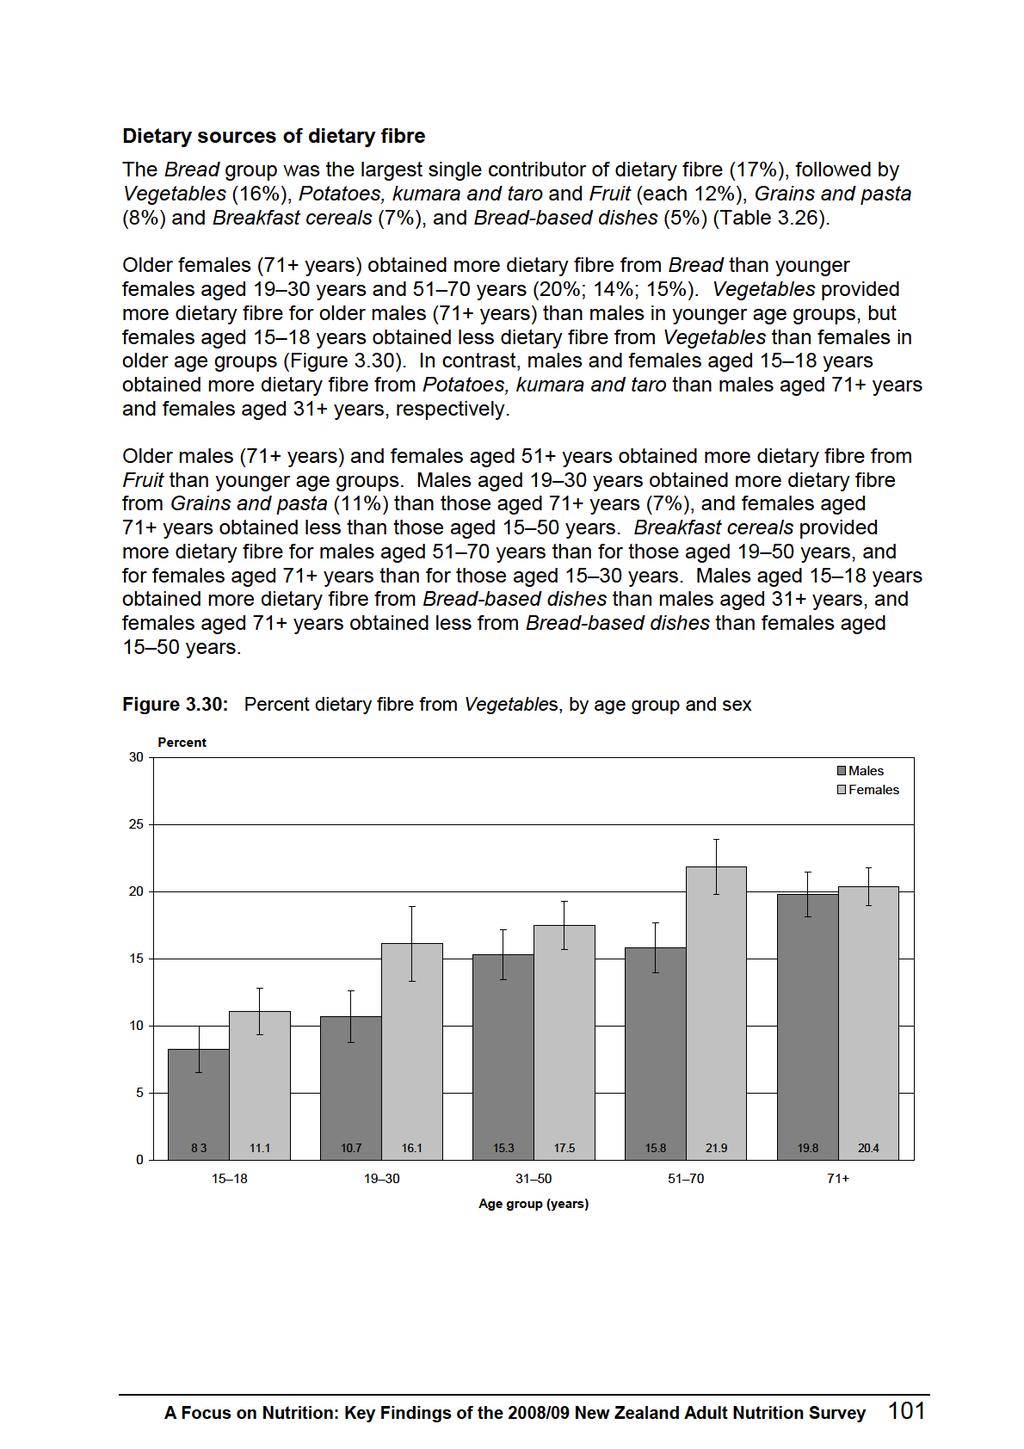
129
130 Table 3.25: Total dietary fibre intake, by age group, ethnic group, NZDep2006 and sex Dietary fibre (g) 1 2 Mean 10th 3 Median (50th), 3 (95%CI) 90th 3 Total population ( ) 28.5 By age group (years) Males ( ) ( ) ( ) ( ) ( ) 28.9 Total ( ) 31.5 Females ( ) ( ) ( ) ( ) ( ) 23.8 Total ( ) 24.5 Māori Males ( ) ( ) ( ) ( ) 28.4 Total ( ) 31.1 Females ( ) ( ) ( ) ( ) 23.2 Total ( ) 22.4 Pacific Males # ( ) ( ) ( ) 32.4 Total ( ) 29.3 Females ( ) ( ) ( ) ( ) 22.9 Total ( ) A Focus on Nutrition: Key Findings of the 2008/09 New Zealand Adult Nutrition Survey
131 Dietary fibre (g) 1 2 Mean 10th 3 Median (50th), 3 (95%CI) 90th 3 NZEO Males ( ) ( ) ( ) ( ) 29.0 Total ( ) 31.4 Females ( ) 23.2 By NZDep2006 quintile ( ) ( ) ( ) 25.4 Total ( ) 25.0 Males ( ) ( ) ( ) ( ) ( ) 32.1 Females ( ) ( ) ( ) ( ) ( ) Usual daily intake. These data were adjusted for intra-individual variation using PC-SIDE. 2 Dietary fibre is estimated using the Englyst method, which measures non-starch polysaccharides and does not include resistant starch. 3 Percentiles. # Confidence interval could not be calculated. Estimate should be interpreted with caution. A Focus on Nutrition: Key Findings of the 2008/09 New Zealand Adult Nutrition Survey 103
132 Table 3.26: Total dietary fibre sources, percent (95% CI), 1 by age group, sex and food group Food group Total population Males Females Total Total Bread 17.1 ( ) Vegetables 16.4 ( ) Potatoes, kumara and taro 11.7 ( ) Fruit 11.5 ( ) Grains and pasta 8.3 ( ) Breakfast cereals 7.2 ( ) Bread-based dishes Non-alcoholic beverages 5.1 ( ) 3.7 ( ) Cakes and muffins 2.3 ( ) Pies and pasties 2.1 ( ) 16.4 ( ) 8.3 ( ) 15.6 ( ) 9.0 ( ) 8.4 ( ) 7.2 ( ) 11.9 ( ) 1.2 ( ) 1.1 ( ) 3.6 ( ) 16.2 ( ) 10.7 ( ) 12.7 ( ) 8.3 ( ) 11.1 ( ) 6.1 ( ) 8.9 ( ) 3.3 ( ) 1.6 ( ) 4.4 ( ) 19.3 ( ) 15.3 ( ) 12.2 ( ) 8.8 ( ) 8.6 ( ) 6.7 ( ) 5.2 ( ) 4.0 ( ) 2.2 ( ) 2.6 ( ) 18.6 ( ) 15.8 ( ) 11.6 ( ) 10.2 ( ) 8.0 ( ) 10.3 ( ) 5.1 ( ) 4.2 ( ) 2.9 ( ) 1.4 ( ) 20.2 ( ) 19.8 ( ) 11.2 ( ) 13.7 ( ) 6.9 ( ) 8.4 ( ) 1.6 ( ) 2.6 ( ) 2.0 ( ) 1.3 ( ) 18.3 ( ) 14.4 ( ) 12.3 ( ) 9.5 ( ) 8.8 ( ) 7.7 ( ) 6.1 ( ) 3.6 ( ) 2.2 ( ) 2.6 ( ) 15.7 ( ) 11.1 ( ) 14.9 ( ) 10.8 ( ) 8.9 ( ) 5.5 ( ) 8.7 ( ) 1.8 ( ) 2.7 ( ) 2.3 ( ) 14.4 ( ) 16.1 ( ) 13.7 ( ) 11.7 ( ) 10.6 ( ) 4.7 ( ) 5.4 ( ) 3.3 ( ) 3.1 ( ) 2.4 ( ) 16.3 ( ) 17.5 ( ) 10.8 ( ) 12.1 ( ) 8.1 ( ) 6.7 ( ) 4.4 ( ) 5.1 ( ) 1.8 ( ) 1.7 ( ) 15.3 ( ) 21.9 ( ) 9.1 ( ) 15.4 ( ) 6.2 ( ) 7.8 ( ) 2.3 ( ) 3.3 ( ) 2.7 ( ) 1.3 ( ) 19.8 ( ) 20.4 ( ) 9.4 ( ) 17.7 ( ) 5.3 ( ) 8.1 ( ) 1.6 ( ) 2.7 ( ) 2.7 ( ) 0.9 ( ) Biscuits Sausages and processed meats Soups and stocks Nuts and seeds Poultry Sugar and sweets Savoury sauces and condiments Beef and veal Snack foods Snack bars Puddings and desserts Dairy products Fish and seafood ( ) 18.2 ( ) 11.1 ( ) 13.4 ( ) 7.8 ( ) 6.7 ( ) 4.1 ( ) 3.8 ( ) 2.4 ( ) 1.7 ( ) 104 A Focus on Nutrition: Key Findings of the 2008/09 New Zealand Adult Nutrition Survey
133 Food group Total population Males Females Total Total Pork Lamb and mutton Milk Eggs and egg dishes Supplements providing energy Alcoholic beverages Other meat Cheese Butter and margarine Fats and oils Proportion of total nutrient intake obtained from each food group. Results for Māori, Pacific, NZEO and NZDep2006 are in the online data tables. For full food group definitions, see Table % confidence intervals are presented only for the top 10 food groups. A Focus on Nutrition: Key Findings of the 2008/09 New Zealand Adult Nutrition Survey 105
134 3.9 Alcohol Alcohol is a concentrated source of energy, providing 29 kj per gram (Mann and Truswell 2007). Alcohol has both a direct and an indirect effect on energy intake: it contributes to energy intake and can also affect food intake (Mann and Truswell 2007; Foster and Harriott 2006). Alcohol intake Alcohol was not consumed by all individuals on the day of the 24-hour diet recall. Therefore the median intakes of alcohol (0.0 g) do not provide meaningful information, but the levels of 90th percentiles of intake and mean intakes do provide useful information on the alcohol intakes of the New Zealand population. Unlike data for energy and nutrients, alcohol intake data are not adjusted for intraindividual variation since on any particular day zero intake would not be uncommon. Because the data are extremely skewed, no statistical comparisons can be undertaken. The mean daily intake of alcohol was 14.0 g (males 18.4 g; females 9.9 g) (Table 3.27). Dietary sources of alcohol The largest contributors of alcohol to the diet among those who were consumers were Wine (42%) and Beer (37%), followed by Spirits (11%), and Other alcoholic beverages, which were primarily ready-to-drink beverages (RTDs) (8%) (Table 3.28). For all categories of alcoholic beverages there was marked variation among the age groups and between sexes. There were some differences, however. Females consuming alcohol obtained much more of their alcohol from Wine than males (66% versus 24%). Younger males aged years and females aged years obtained 11% or less of their alcohol from Wine, much lower than the proportions of alcohol from Wine among older males and females. In contrast, males obtained much more of their alcohol from Beer than females (56% versus 11%). Within all ethnic groups, males obtained more of their alcohol from Beer than females. The category Other alcoholic beverages (predominantly RTDs) was the single largest source of alcohol for females aged years (55%). Females aged years obtained more alcohol from this category than females aged 51+ years. 106 A Focus on Nutrition: Key Findings of the 2008/09 New Zealand Adult Nutrition Survey
135 Table 3.27: Alcohol intake, by age group, ethnic group, NZDep2006 and sex Alcohol (g) 1 Percent energy from alcohol 2 Mean (95% CI) 10th 3 Median 90th 3 Mean (50th) 3 (95% CI) 10th 3 Median 90th 3 (50th) 3 Total population 14.0 ( ) By age group (years) Males ( ) ( ) ( ) ( ) ( ) Total 18.4 ( Females ( ) Māori ( ) ( ) ( ) ( ) Total 9.9 ( ) ( ) ( ) ( ) ( ) ( ) ( ) ( ) ( ) ( ) ( ) ( ) ( ) ( ) Male # # ( ) ( ) ( ) Total 16.8 ( ) Female ( ) ( ) ( ) ( ) Total 6.7 ( ) ( ) ( ) ( ) ( ) ( ) ( ) ( ) ( ) ( ) A Focus on Nutrition: Key Findings of the 2008/09 New Zealand Adult Nutrition Survey 107
136 Alcohol (g) 1 Percent energy from alcohol 2 Mean (95% CI) 10th 3 Median 90th 3 Mean (50th) 3 (95% CI) 10th 3 Median 90th 3 (50th) 3 Pacific Males # # ( ) ( ) ( ) ( ) # ( ) Total 11.4 ( ) ( ) Females # # NZEO ( ) ( ) ( ) ( ) # # Total 4.9 ( ) ( ) Males ( ) ( ) ( ) ( ) Total 19.0 ( ) Females ( ) ( ) ( ) ( ) Total 10.5 ( ) ( ) ( ) ( ) ( ) ( ) ( ) ( ) ( ) ( ) ( ) A Focus on Nutrition: Key Findings of the 2008/09 New Zealand Adult Nutrition Survey
137 Alcohol (g) 1 Percent energy from alcohol 2 Mean (95% CI) 10th 3 Median 90th 3 Mean (50th) 3 (95% CI) 10th 3 Median 90th 3 (50th) 3 By NZDep2006 quintile Males ( ) ( ) ( ) ( ) ( ) Females ( ) ( ) ( ) ( ) ( ) ( ) ( ) ( ) ( ) ( ) ( ) ( ) ( ) ( ) ( ) These data were not adjusted for intra-individual variation because intake clusters at zero. 2 These data were not adjusted for intra-individual variation because the only methods that have been developed for ratios use multiple day repeats. Percent energy from alcohol for each participant was calculated as the energy from alcohol (conversion factor = 29.3kJ/g) divided by the total energy intake. 3 Percentiles. # Confidence interval could not be calculated. Estimate should be interpreted with caution. A Focus on Nutrition: Key Findings of the 2008/09 New Zealand Adult Nutrition Survey 109
138 Table 3.28: Alcohol sources, percent (95% CI), 1 by age group, sex and food group Food group Total population Males Females Total Total Wine 42.0 ( ) Beer 36.9 ( ) Spirits 10.6 ( ) Other, eg, RTDs Liqueurs and cocktails 7.5 ( ) 1.6 ( ) 7.3 ( ) 69.4 ( ) 6.8 ( ) 9.8 ( ) 6.6 ( ) 1.9 ( ) 68.5 ( ) 12.8 ( ) 14.7 ( ) 0.3 ( ) 26.3 ( ) 58.0 ( ) 8.9 ( ) 5.8 ( ) 0.2 ( ) 33.2 ( ) 48.9 ( ) 15.0 ( ) 1.6 ( ) 0.1 ( ) 35.1 ( ) 42.9 ( ) 16.9 ( ) 2.3 ( ) 0.6 ( ) 24.2 ( ) 55.9 ( ) 12.3 ( ) 5.9 ( ) 0.4 ( ) 10.9 ( ) 13.9 ( ) 19.3 ( ) 54.5 ( ) 1.4 ( ) 51.2 ( ) 9.1 ( ) 4.2 ( ) 26.7 ( ) 7.8 ( ) 64.4 ( ) 18.6 ( ) 5.8 ( ) 7.8 ( ) 2.8 ( ) 78.1 ( ) 4.1 ( ) 9.3 ( ) 3.4 ( ) 2.2 ( ) 66.5 ( ) 9.0 ( ) 19.5 ( ) 2.5 ( ) 1.1 ( ) 65.9 ( ) 11.4 ( ) 8.5 ( ) 9.6 ( ) 3.1 ( ) 1 Proportion of total nutrient intake obtained from each food sub-group of Alcoholic beverages for consumers of alcohol only. 110 A Focus on Nutrition: Key Findings of the 2008/09 New Zealand Adult Nutrition Survey
139 4 Nutrient Intakes and Dietary Sources: Micronutrients New Zealanders obtain the energy and nutrients they require from a wide variety of foods and beverages, and in some cases from dietary supplements as well. This chapter on micronutrients presents the intake of nutrients from food and beverages, without adding the nutrients from supplements (other than supplements providing energy). 4.1 Explanatory notes Usual intake distributions Using repeat 24-hour diet recalls on a subsample (25%) of participants, nutrient intakes for each subgroup were adjusted for intra-individual variability using the PC-SIDE programme to obtain usual intake distributions. Note that comparisons between NZDep2006 quintiles are based on nutrient intake, adjusted for intra-individual variation using PC-SIDE, whereas the overall test for trend (gradient) by neighbourhood deprivation is not adjusted for intra-individual variation. Accuracy of nutrient intake estimates The accuracy of nutrient estimates depend on two factors: the accuracy of information provided by participants in the 24-hour diet recall and the accuracy of the food composition data. These two potential sources of error are briefly outlined briefly below (see Chapter 2 and the Methodology Report for more information). Misreporting of a food intake, especially under-reporting, is a well-known problem in all types of dietary surveys. If food intake is under-reported, nutrient intakes may also be underestimated, and the prevalence of inadequate intake may be overestimated. The New Zealand Food Composition Database (NZFCDB) was the main source of nutrient data for the survey. The NZFCDB includes approximately 2740 foods, and an additional 5000 nutrient lines were created for the survey based on data from the NZFCDB and other sources (eg, overseas databases). Where food composition data were considered insufficiently reliable (ie, iodine, folate, sodium and vitamin D), nutrient intake data have not been presented in this report (see the Methodology Report for more information). Nutrient adequacy For selected nutrients, the probability of inadequate intake was estimated by comparing the usual intake distribution to the estimated average requirement (EAR) from the Nutrient Reference Values (NRV) for Australia and New Zealand (NHMRC 2006). Nutrient adequacy could not be determined if there was no EAR for a nutrient. When interpreting the prevalence of inadequate intakes it is important to note the following. A Focus on Nutrition: Key Findings of the 2008/09 New Zealand Adult Nutrition Survey 111
140 Nutrient intake estimates are from food and drinks only and exclude intake from dietary supplements (other than supplements providing energy, eg, meal replacements). Nutrient intake estimates depend on the accuracy of the information provided by participants in the 24-hour diet recall and the accuracy of the food composition data. The prevalence of inadequate intakes partly reflects the criterion on which the requirement is based. For example, if the requirement for nutrient X is based on maintaining body stores (assuming normal losses), and it is estimated that 15% of the population have inadequate intakes, this indicates that 15% are not consuming enough nutrient X to maintain body stores but does not indicate functional impairment or a deficiency disorder. It also does not indicate which specific individuals in the population have inadequate intakes to maintain their body stores. A cautionary comment on the interpretation of adequacy of intake for a nutrient has been made when the derivation of the reference value is either unclear or scientifically debatable. Accurate assessment of nutritional status requires a combination of dietary, anthropometric, biochemical and clinical measurements (Gibson 2005). Adequacy or inadequacy of nutritional status cannot be determined from dietary data alone. Dietary sources For each nutrient, the percentage contribution from different food groups is presented. In this way, the adequacy of nutrient intake can be understood in the context of the foods from which each was sourced. It is important to understand how foods were classified when interpreting information on dietary sources. If a participant was able to provide a detailed description for a mixed dish, then the individual ingredients were assigned to their separate food groups. However, if a detailed description could be provided, then the dish was assigned to the food group of its main ingredient. For example, macaroni cheese would be assigned to the Grains and pasta group because pasta is its main ingredient, even though it contains milk and cheese. Food group descriptors are written in italics to indicate these are food groups rather than foods per se. Details of the food groups used and the types of foods included within each group are summarised in Chapter 2 (Table 2.2). It is important to review the foods included in each group rather than simply focusing on the food group descriptor, which was created for the 1997 National Nutrition Survey. The order of foods listed as examples does not necessarily reflect current consumption patterns. For example, the Butter and margarine group includes more margarine than butter. In this report, comments in the text are restricted to the top 10 dietary sources for each nutrient. Note that the largest single contributor to nutrient intake partly depends on how foods are grouped and how many participants consumed items within each group. Foods frequently consumed (eg, Bread) are more likely to feature in the top 10 dietary sources than food groups consumed by only a small proportion of participants (eg, Fats and oils and Other meat). Note that most fats and oils added during food preparation 112 A Focus on Nutrition: Key Findings of the 2008/09 New Zealand Adult Nutrition Survey
141 and cooking are included in the foods to which they were added (eg, Potatoes, kumara and taro) rather than in the Fats and oils group. 4.2 Vitamin A Vitamin A is a generic term which describes retinol and related structures and the pro-vitamin A carotenoids. The activity of retinol is described by retinol equivalents (RE), whereby 1 µg RE is equivalent to 1 µg retinol, 6 µg of β-carotene or 12 µg of other carotenoids (Mann and Truswell 2007). The major roles of vitamin A in the body include: maintaining healthy corneas, the epithelial cells and mucous membranes of the eye supporting reproduction and growth maintaining the health of the epithelial tissues and the skin through its role in protein synthesis and cell differentiation (Mann and Truswell 2007; Rolfes et al 2009). Animal foods such as liver, milk, butter, cheese, egg yolk, some fatty fish and table margarine (which is usually fortified with vitamin A to a similar level to that found in butter) provide retinol. The pro-vitamin A carotenoids come from plant foods such as dark green leafy vegetables and some yellow or orange-coloured fruits and vegetables (Mann and Truswell 2007; Rolfes et al 2009). Vitamin A intake The median usual daily vitamin A intake was 846 µg RE for males and 727 µg RE for females (Table 4.1). Less than half (42%) of vitamin A intake was from retinol and the remainder came from carotenoids. β-carotene and retinol are concentrated in relatively few foods, so estimates (even after adjusting for intra-individual variation) have wide confidence intervals. A Focus on Nutrition: Key Findings of the 2008/09 New Zealand Adult Nutrition Survey 113
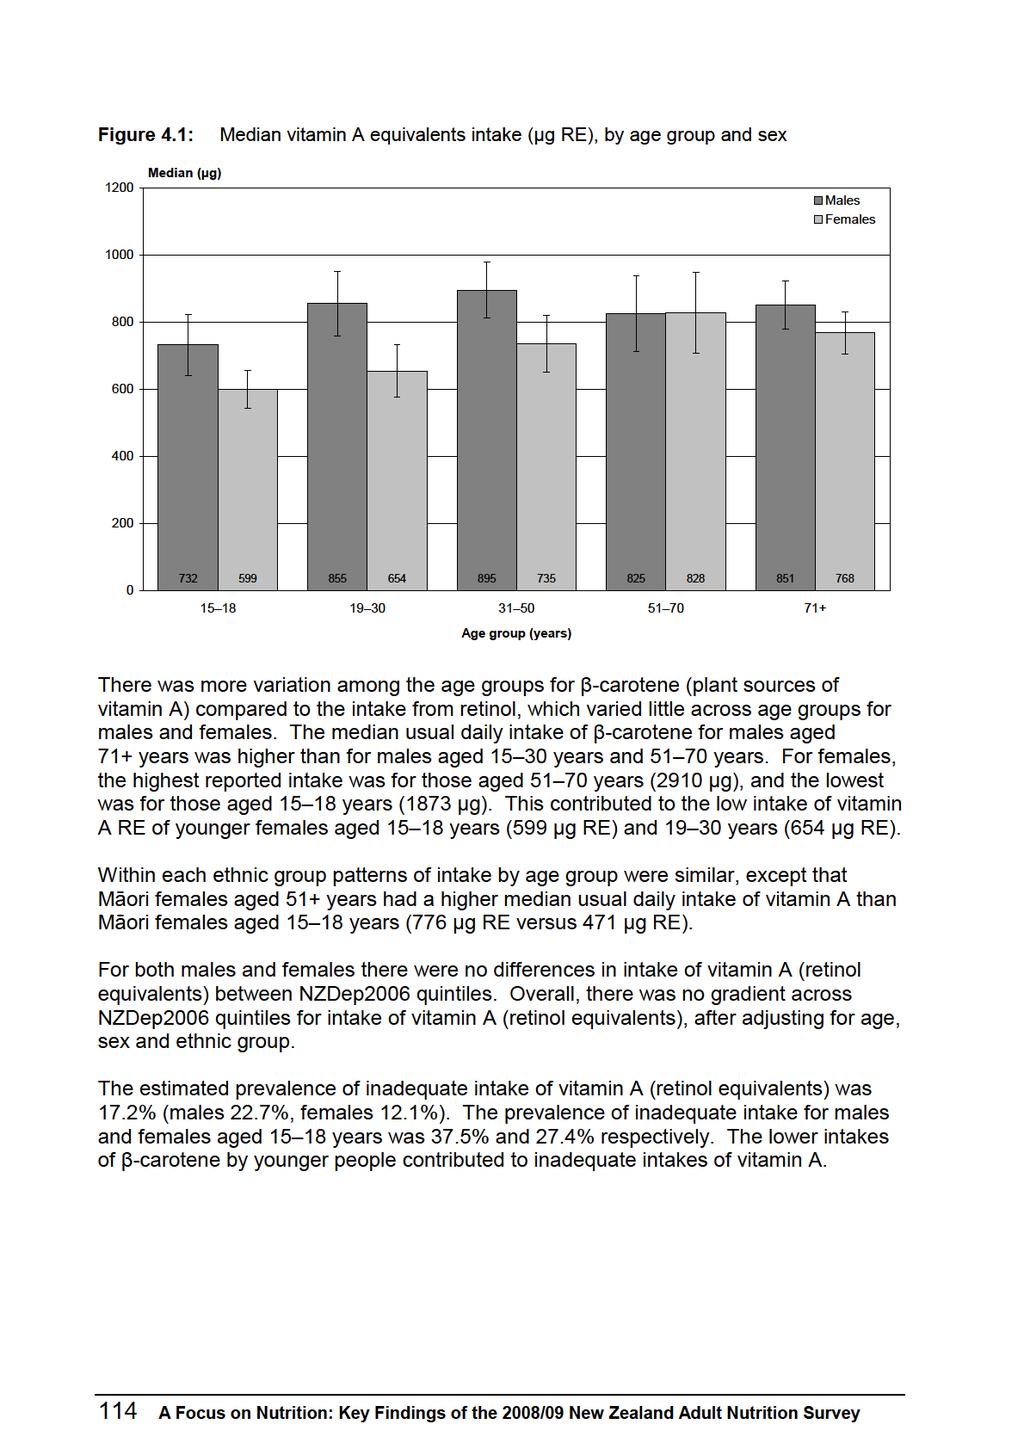
142
143
144 Table 4.1: Vitamin A equivalents intake, by age group, ethnic group, NZDep2006 and sex Vitamin A equivalents (μg RE) 1,2 Mean 10th 3 Median (50th), 3 (95% CI) 90th 3 Inadequate intake (%), (95% CI) 4 Total population ( ) By age group (years) Males ( ) ( ) * ( ) ( ) ( ) Total ( ) Females ( ) Māori ( ) * ( ) * ( ) * ( ) Total ( ) Males ( ) ( ) ( ) * ( ) * Total ( ) Females ( ) Pacific ( ) ( ) * ( ) * Total ( ) Males ( ) * ( ) ( ) * ( ) Total ( ) Females ( ) ( ) ( ) * ( ) Total ( ) * 116 A Focus on Nutrition: Key Findings of the 2008/09 New Zealand Adult Nutrition Survey
145 NZEO Vitamin A equivalents (μg RE) 1,2 Mean 10th 3 Median (50th), 3 (95% CI) 90th 3 Inadequate intake (%), (95% CI) 4 Males ( ) ( ) ( ) ( ) Total ( ) Females ( ) * By NZDep2006 quintile ( ) ( ) * ( ) * Total ( ) Males ( ) ( ) ( ) ( ) ( ) 1513 Females ( ) ( ) ( ) ( ) ( ) Usual daily intake. These data were adjusted for intra-individual variation using PC-SIDE. As this nutrient is concentrated in relatively few foods, one-day intake distributions are highly skewed. Therefore these estimates of usual intakes have large confidence intervals. 2 For conversion factors to vitamin A equivalents, see Appendix 3. 3 Percentiles. 4 Calculated by probability analysis (see Chapter 2). 5 NZDep2006 quintiles consist of a range of age groups. Because the requirements differ for each age group, an overall figure was not calculated. * Coefficient of variation of estimated inadequate intake is greater than 50% and confidence interval lies outside range (0 5%). Estimate should be interpreted with caution due to the high level of imprecision relative to the estimate. # Confidence interval could not be calculated. Estimate should be interpreted with caution A Focus on Nutrition: Key Findings of the 2008/09 New Zealand Adult Nutrition Survey 117
146 Table 4.2: Vitamin A equivalent sources, percent (95% CI), 1 by age group, sex and food group Food group Total population Males Females Total Total Vegetables 27.2 ( ) Butter and margarine 10.5 ( ) Milk 6.2 ( ) Bread-based dishes Eggs and egg dishes 5.9 ( ) 4.9 ( ) Cheese 4.9 ( ) Fruit 4.3 ( ) Dairy products 4.2 ( ) Grains and pasta 4.2 ( ) Poultry 3.5 ( ) Non-alcoholic beverages Soups and stocks Cakes and muffins 12.9 ( ) 8.6 ( ) 9.0 ( ) 13.2 ( ) 6.1 ( ) 4.6 ( ) 3.2 ( ) 4.7 ( ) 6.1 ( ) 5.6 ( ) 17.8 ( ) 9.5 ( ) 7.1 ( ) 11.1 ( ) 4.0 ( ) 6.4 ( ) 3.1 ( ) 2.8 ( ) 6.5 ( ) 4.0 ( ) 24.7 ( ) 10.6 ( ) 6.5 ( ) 6.3 ( ) 5.7 ( ) 5.9 ( ) 2.8 ( ) 3.9 ( ) 4.2 ( ) 4.4 ( ) 27.2 ( ) 12.5 ( ) 6.6 ( ) 5.1 ( ) 5.8 ( ) 3.7 ( ) 4.1 ( ) 4.4 ( ) 3.1 ( ) 3.5 ( ) 35.2 ( ) 15.2 ( ) 5.3 ( ) 1.8 ( ) 4.5 ( ) 3.0 ( ) 5.1 ( ) 4.1 ( ) 1.5 ( ) 1.2 ( ) 24.0 ( ) 11.2 ( ) 6.8 ( ) 7.1 ( ) 5.3 ( ) 5.0 ( ) 3.4 ( ) 3.9 ( ) 4.3 ( ) 3.9 ( ) 19.4 ( ) 7.9 ( ) 6.1 ( ) 11.6 ( ) 3.3 ( ) 4.9 ( ) 4.7 ( ) 5.2 ( ) 6.0 ( ) 4.8 ( ) 23.6 ( ) 8.5 ( ) 5.7 ( ) 6.2 ( ) 6.2 ( ) 3.2 ( ) 4.1 ( ) 5.5 ( ) 7.3 ( ) 4.3 ( ) 29.9 ( ) 9.6 ( ) 6.5 ( ) 4.8 ( ) 3.9 ( ) 6.4 ( ) 5.1 ( ) 3.8 ( ) 4.6 ( ) 3.2 ( ) 36.4 ( ) 10.6 ( ) 4.9 ( ) 3.1 ( ) 4.4 ( ) 4.0 ( ) 5.7 ( ) 4.6 ( ) 1.4 ( ) 2.1 ( ) 35.0 ( ) 14.1 ( ) 5.3 ( ) 1.5 ( ) 5.2 ( ) 3.6 ( ) 6.3 ( ) 4.4 ( ) 1.6 ( ) 1.4 ( ) Fish and seafood Pies and pasties Savoury sauces and condiments Beef and veal Potatoes, kumara and taro Biscuits Puddings and desserts ( ) 10.0 ( ) 5.8 ( ) 4.8 ( ) 4.6 ( ) 4.8 ( ) 5.1 ( ) 4.5 ( ) 4.1 ( ) 3.1 ( ) 118 A Focus on Nutrition: Key Findings of the 2008/09 New Zealand Adult Nutrition Survey
147 Food group Total population Males Females Total Total Sugar and sweets Other meat Sausages and processed meats Bread Pork Supplements providing energy Lamb and mutton Breakfast cereals Snack bars Snack foods Alcoholic beverages Nuts and seeds Fats and oils Proportion of total nutrient intake obtained from each food group. Results for Māori, Pacific, NZEO and NZDep2006 are in the online data tables. For full food group definitions, see Table 2.2. A Focus on Nutrition: Key Findings of the 2008/09 New Zealand Adult Nutrition Survey 119
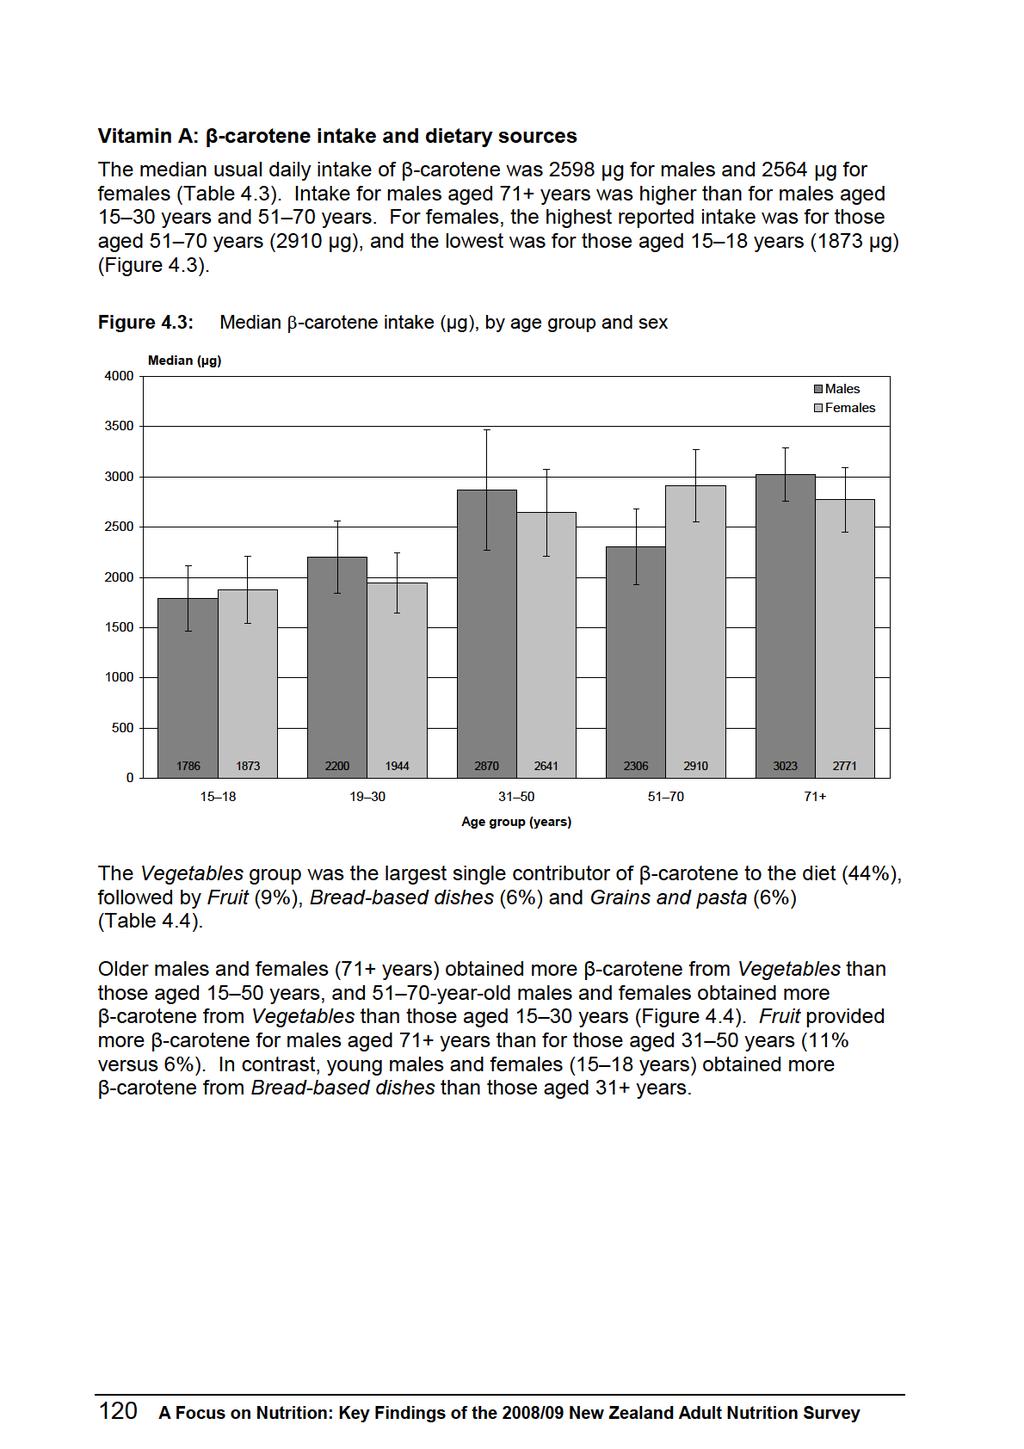
148
149
150 Table 4.3: β-carotene intake, by age group, ethnic group, NZDep2006 and sex β-carotene (μg) 1, 2 Mean 10th 3 Median (50th), 3 (95% CI) 90th 3 Total population ( ) 4643 By age group (years) Males ( ) ( ) ( ) ( ) ( ) 4910 Total ( ) 4921 Females ( ) ( ) ( ) ( ) ( ) 4445 Total ( ) 4380 Māori Males ( ) ( ) ( ) ( ) 3014 Total ( ) 4662 Females ( ) ( ) ( ) ( ) 4430 Total ( ) 4189 Pacific Males ( ) ( ) ( ) ( ) 6230 Total ( ) 4333 Females ( ) ( ) ( ) ( ) 3162 Total ( ) A Focus on Nutrition: Key Findings of the 2008/09 New Zealand Adult Nutrition Survey
151 β-carotene (μg) 1, 2 Mean 10th 3 Median (50th), 3 (95% CI) 90th 3 NZEO Males ( ) ( ) ( ) ( ) 4599 Total ( ) 4868 Females ( ) 3380 NZDep ( ) ( ) ( ) 4963 Total ( ) 4302 Males ( ) ( ) ( ) ( ) ( ) 5437 Females ( ) ( ) ( ) ( ) ( ) Usual daily intake. These data were adjusted for intra-individual variation using PC-SIDE. Because this nutrient is concentrated in relatively few foods, one-day intake distributions are highly skewed. Therefore these estimates of usual intakes have large confidence intervals. 2 For conversion factors to vitamin A equivalents, see Appendix 3. 3 Percentiles. A Focus on Nutrition: Key Findings of the 2008/09 New Zealand Adult Nutrition Survey 123
152 Table 4.4: β-carotene sources, percent (95% CI), 1 by age group, sex and food group Food group Total population Males Females Total Total Vegetables 43.9 ( ) Fruit 9.2 ( ) Bread-based dishes 5.8 ( ) Grains and pasta 5.6 ( ) Butter and margarine 4.3 ( ) Soups and stocks 3.9 ( ) Milk 3.1 ( ) Savoury sauces and condiments Non-alcoholic beverages 3.0 ( ) 2.6 ( ) Beef and veal 2.5 ( ) 22.9 ( ) 8.4 ( ) 14.7 ( ) 8.4 ( ) 4.0 ( ) 0.9 ( ) 5.7 ( ) 5.1 ( ) 3.3 ( ) 3.4 ( ) 31.1 ( ) 7.5 ( ) 11.5 ( ) 8.9 ( ) 2.8 ( ) 4.0 ( ) 2.6 ( ) 3.0 ( ) 3.6 ( ) 4.9 ( ) 41.9 ( ) 6.3 ( ) 6.2 ( ) 5.9 ( ) 5.0 ( ) 2.6 ( ) 3.4 ( ) 4.2 ( ) 2.9 ( ) 3.0 ( ) 47.2 ( ) 8.4 ( ) 5.3 ( ) 4.5 ( ) 5.7 ( ) 1.9 ( ) 3.4 ( ) 2.9 ( ) 2.7 ( ) 2.0 ( ) 55.6 ( ) 10.7 ( ) 1.2 ( ) 1.7 ( ) 4.9 ( ) 6.7 ( ) 2.1 ( ) 1.2 ( ) 2.1 ( ) 3.2 ( ) 40.9 ( ) 7.7 ( ) 7.3 ( ) 6.0 ( ) 4.7 ( ) 2.9 ( ) 3.3 ( ) 3.4 ( ) 3.0 ( ) 3.2 ( ) 31.7 ( ) 10.3 ( ) 10.4 ( ) 6.8 ( ) 3.3 ( ) 3.5 ( ) 3.4 ( ) 4.5 ( ) 3.8 ( ) 2.7 ( ) 37.2 ( ) 9.2 ( ) 6.4 ( ) 9.7 ( ) 3.9 ( ) 4.2 ( ) 2.8 ( ) 4.1 ( ) 3.0 ( ) 1.7 ( ) 47.0 ( ) 10.7 ( ) 4.4 ( ) 5.5 ( ) 3.8 ( ) 4.6 ( ) 3.6 ( ) 2.3 ( ) 1.6 ( ) 1.5 ( ) 53.9 ( ) 11.0 ( ) 2.9 ( ) 2.4 ( ) 3.6 ( ) 5.6 ( ) 2.0 ( ) 1.6 ( ) 2.3 ( ) 2.1 ( ) 54.6 ( ) 12.0 ( ) 1.2 ( ) 1.8 ( ) 5.2 ( ) 6.0 ( ) 2.5 ( ) 1.6 ( ) 1.7 ( ) 2.0 ( ) Poultry Cheese Pies and pasties Dairy products Cakes and muffins Potatoes, kumara and taro Sausages and processed meats Biscuits Pork Fish and seafood Sugar and sweets Puddings and desserts ( ) 10.6 ( ) 4.5 ( ) 5.2 ( ) 3.9 ( ) 4.8 ( ) 2.9 ( ) 2.5 ( ) 2.2 ( ) 1.8 ( ) 124 A Focus on Nutrition: Key Findings of the 2008/09 New Zealand Adult Nutrition Survey
153 Food group Total population Males Females Total Total Breakfast cereals Bread Eggs and egg dishes Snack foods Lamb and mutton Snack bars Nuts and seeds Alcoholic beverages Supplements providing energy Other meat Fats and oils Proportion of total nutrient intake obtained from each food group. Results for Māori, Pacific, NZEO and NZDep2006 are in the online data tables. For full food group definitions, see Table % confidence intervals are presented only for the top 10 food groups. A Focus on Nutrition: Key Findings of the 2008/09 New Zealand Adult Nutrition Survey 125
154
155
156 Table 4.5: Retinol intake, by age group, ethnic group, NZDep2006 and sex Retinol (μg) 1, 2 Mean 10th 3 Median (50th), 3 (95% CI) 90th 3 Total population ( ) 639 By age group (years) Males ( ) ( ) ( ) ( ) ( ) 1560 Total ( ) 781 Females ( ) ( ) ( ) ( ) ( ) 631 Total ( ) 507 Māori Males ( ) ( ) ( ) ( ) 678 Total ( ) 728 Females ( ) ( ) ( ) ( ) 619 Total ( ) 538 Pacific Males ( ) ( ) (33 871) ( ) 491 Total ( ) 729 Females ( ) ( ) ( ) ( ) 394 Total ( ) A Focus on Nutrition: Key Findings of the 2008/09 New Zealand Adult Nutrition Survey
157 Retinol (μg) 1, 2 Mean 10th 3 Median (50th), 3 (95% CI) 90th 3 NZEO Males ( ) ( ) ( ) ( ) 974 Total ( ) 747 Females ( ) 340 By NZDep2006 quintile ( ) ( ) ( ) 605 Total ( ) 500 Males ( ) ( ) ( ) ( ) ( ) 701 Females ( ) ( ) ( ) ( ) ( ) Usual daily intake. These data were adjusted for intra-individual variation using PC-SIDE. Because this nutrient is concentrated in relatively few foods, one-day intake distributions are highly skewed. Therefore these estimates of usual intakes have large confidence intervals. 2 For conversion factors to vitamin A equivalents, see Appendix 3. 3 Percentiles. A Focus on Nutrition: Key Findings of the 2008/09 New Zealand Adult Nutrition Survey 129
158 Table 4.6: Retinol sources, percent (95% CI), 1 by age group, sex and food group Food group Total population Males Females Total Total Butter and margarine 18.1 ( ) Milk 12.1 ( ) Cheese 8.5 ( ) Eggs and egg dishes 8.4 ( ) Dairy products 7.7 ( ) Bread-based dishes Cakes and muffins 7.1 ( ) 5.0 ( ) Poultry 4.9 ( ) Fish and seafood 4.2 ( ) Non-alcoholic beverages 3.1 ( ) 11.8 ( ) 13.2 ( ) 6.3 ( ) 8.4 ( ) 6.4 ( ) 13.4 ( ) 2.5 ( ) 7.0 ( ) 2.3 ( ) 2.3 ( ) 15.9 ( ) 12.8 ( ) 9.3 ( ) 5.9 ( ) 4.5 ( ) 12.6 ( ) 3.3 ( ) 5.4 ( ) 2.7 ( ) 4.2 ( ) 16.7 ( ) 12.6 ( ) 9.5 ( ) 8.7 ( ) 6.6 ( ) 7.5 ( ) 5.2 ( ) 5.3 ( ) 4.3 ( ) 3.4 ( ) 20.1 ( ) 12.4 ( ) 6.5 ( ) 9.7 ( ) 7.9 ( ) 6.4 ( ) 5.4 ( ) 4.5 ( ) 4.7 ( ) 2.0 ( ) 29.2 ( ) 12.3 ( ) 6.8 ( ) 8.5 ( ) 7.9 ( ) 2.7 ( ) 4.3 ( ) 2.2 ( ) 4.8 ( ) 1.6 ( ) 18.2 ( ) 12.6 ( ) 8.2 ( ) 8.4 ( ) 6.6 ( ) 8.3 ( ) 4.6 ( ) 5.0 ( ) 4.0 ( ) 3.0 ( ) 12.2 ( ) 10.2 ( ) 7.0 ( ) 5.3 ( ) 8.8 ( ) 14.0 ( ) 6.4 ( ) 5.6 ( ) 1.9 ( ) 3.2 ( ) 13.9 ( ) 11.0 ( ) 5.9 ( ) 11.4 ( ) 9.1 ( ) 6.6 ( ) 5.0 ( ) 6.9 ( ) 4.2 ( ) 2.9 ( ) 16.4 ( ) 12.2 ( ) 11.5 ( ) 7.1 ( ) 7.4 ( ) 6.5 ( ) 4.7 ( ) 5.2 ( ) 4.5 ( ) 3.7 ( ) 21.5 ( ) 11.8 ( ) 8.1 ( ) 8.2 ( ) 9.5 ( ) 4.2 ( ) 6.4 ( ) 3.4 ( ) 5.3 ( ) 2.9 ( ) 26.0 ( ) 11.4 ( ) 7.2 ( ) 9.4 ( ) 10.2 ( ) 2.4 ( ) 6.0 ( ) 2.9 ( ) 3.7 ( ) 2.3 ( ) Grains and pasta Pies and pasties Biscuits Potatoes, kumara and taro Savoury sauces and condiments Sugar and sweets Puddings and desserts Vegetables Bread Other meat Beef and veal ( ) 11.7 ( ) 8.8 ( ) 8.4 ( ) 8.7 ( ) 6.0 ( ) 5.4 ( ) 4.9 ( ) 4.3 ( ) 3.2 ( ) 130 A Focus on Nutrition: Key Findings of the 2008/09 New Zealand Adult Nutrition Survey
159 Food group Total population Males Females Total Total Sausages and processed meats Lamb and mutton Supplements providing energy Soups and stocks Snack bars Breakfast cereals Pork Alcoholic beverages Nuts and seeds Fruit Snack foods Fats and oils Proportion of total nutrient intake obtained from each food group. Results for Māori, Pacific, NZEO and NZDep2006 are in the online data tables. For full food group definitions, see Table % confidence intervals are presented only for the top 10 food groups. A Focus on Nutrition: Key Findings of the 2008/09 New Zealand Adult Nutrition Survey 131
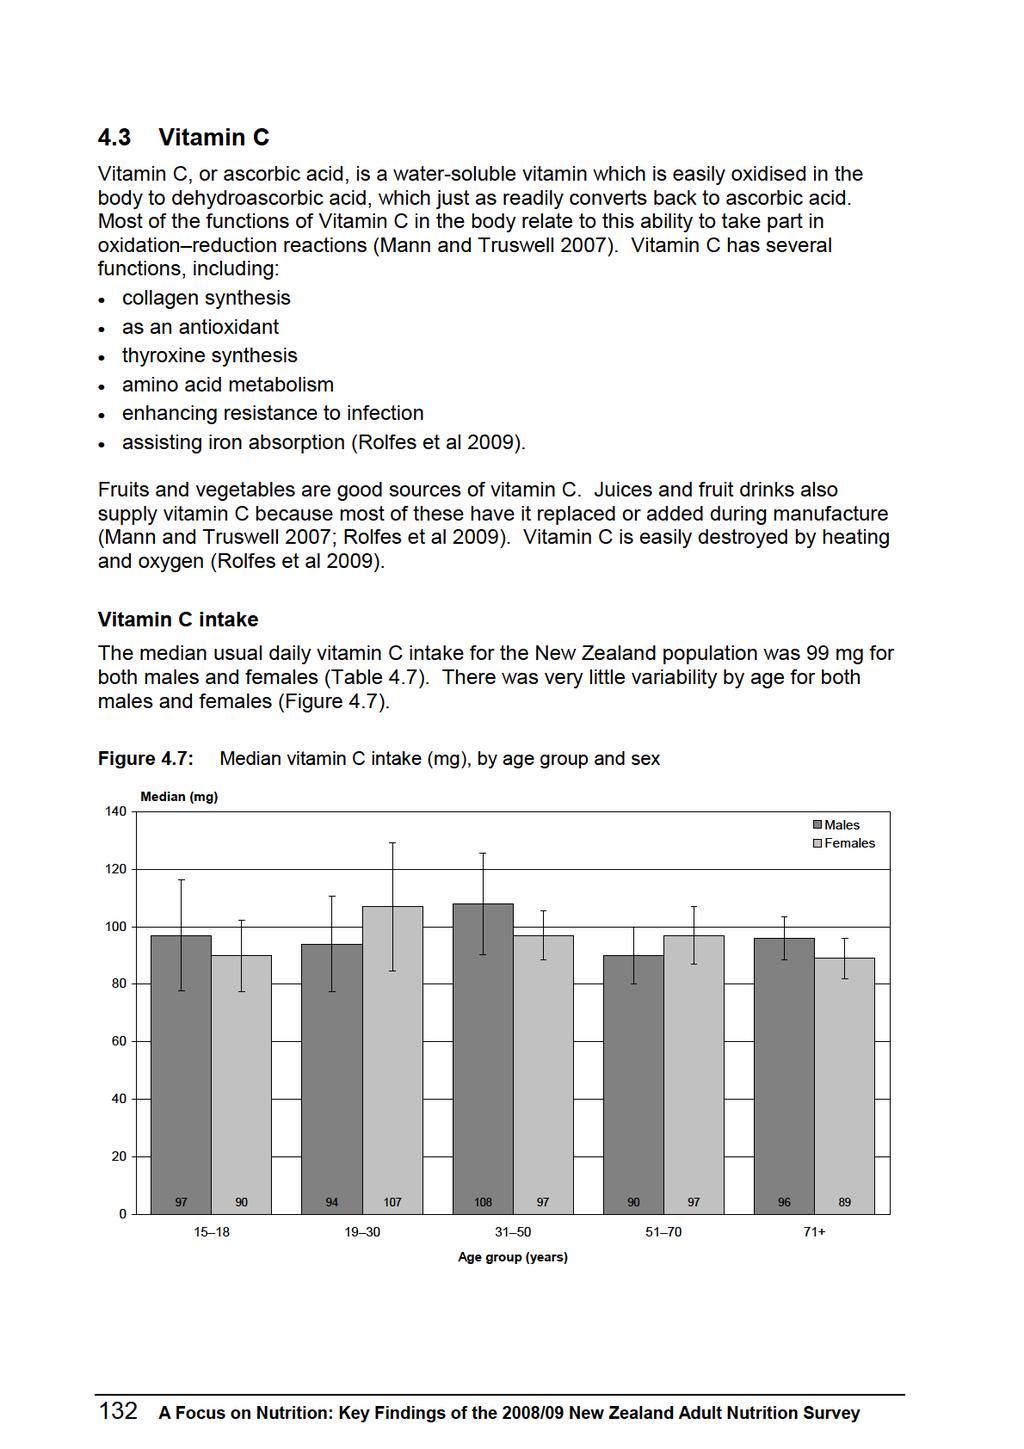
160
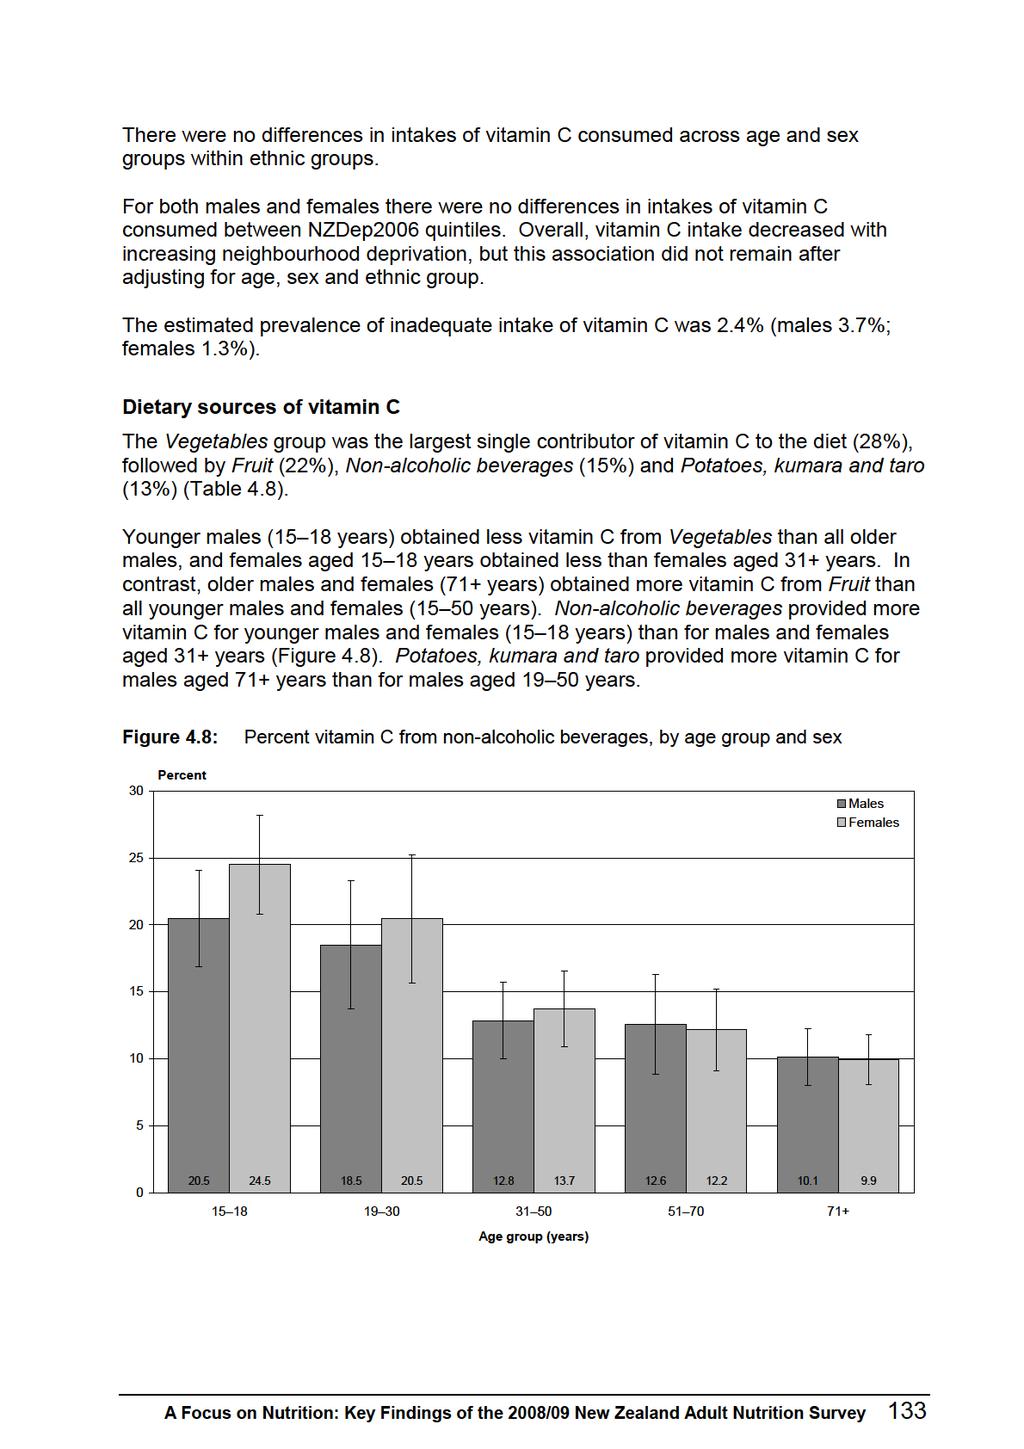
161
162 Table 4.7: Vitamin C intake, by age group, ethnic group, NZDep2006 and sex Vitamin C (mg) 1 Mean 10th 2 Median (50th), 2 (95% CI) 90th 2 Inadequate intake (%), (95% CI) 3 Total population (95 103) By age group (years) Males (78 116) * (77 111) * (90 126) * (80 100) (88 104) * Total (93 105) Females (78 102) * Māori (85 129) * (88 106) * (87 107) * (82 96) Total (93 105) Males (49 129) * (68 128) * (57 95) (43 99) * Total (80 110) Females (33 97) Pacific (61 97) * (71 95) * (59 87) * Total (72 88) Males (82 226) * (39 91) * (70 114) * (47 111) * Total (78 112) Females (34 78) * (70 116) (78 118) (58 110) * Total (82 112) A Focus on Nutrition: Key Findings of the 2008/09 New Zealand Adult Nutrition Survey
163 NZEO Vitamin C (mg) 1 Mean 10th 2 Median (50th), 2 (95% CI) 90th 2 Inadequate intake (%), (95% CI) 3 Males (77 113) * (74 120) * (93 121) * (86 102) Total (93 107) * Females (76 108) * By NZDep2006 quintile (83 133) * (88 110) (90 104) Total (94 106) Males (92 126) (87 115) (89 117) (72 108) (81 105) 178 Females (86 114) (92 112) (94 120) (83 117) (76 100) Usual daily intake. These data were adjusted for intra-individual variation using PC-SIDE. 2 Percentiles. 3 Calculated by probability analysis (see Chapter 2). 4 NZDep2006 quintiles consist of a range of age groups. Because the requirements differ for each age group, an overall figure was not calculated. * Coefficient of variation of estimated inadequate intake is greater than 50% and confidence interval lies outside range (0 5%). Estimate should be interpreted with caution due to the high level of imprecision relative to the estimate A Focus on Nutrition: Key Findings of the 2008/09 New Zealand Adult Nutrition Survey 135
164 Table 4.8: Vitamin C sources, percent (95% CI), 1 by age group, sex and food group Food group Total population Males Females Total Total Vegetables 28.1 ( ) Fruit 22.4 ( ) Non-alcoholic beverages Potatoes, kumara and taro Bread-based dishes 14.6 ( ) 12.8 ( ) 3.5 ( ) Grains and pasta 2.9 ( ) Milk 2.0 ( ) Poultry 1.7 ( ) Savoury sauces and condiments 1.7 ( ) Soups and stocks 1.6 ( ) 11.9 ( ) 17.6 ( ) 20.5 ( ) 14.5 ( ) 9.3 ( ) 3.2 ( ) 3.0 ( ) 2.2 ( ) 2.9 ( ) 0.7 ( ) 22.8 ( ) 15.8 ( ) 18.5 ( ) 11.4 ( ) 9.0 ( ) 4.2 ( ) 1.6 ( ) 2.1 ( ) 3.0 ( ) 1.4 ( ) 29.5 ( ) 18.2 ( ) 12.8 ( ) 12.0 ( ) 3.1 ( ) 3.6 ( ) 2.8 ( ) 3.1 ( ) 2.5 ( ) 1.4 ( ) 28.8 ( ) 20.7 ( ) 12.6 ( ) 15.9 ( ) 2.8 ( ) 1.9 ( ) 2.6 ( ) 1.9 ( ) 1.6 ( ) 1.1 ( ) 31.7 ( ) 27.8 ( ) 10.1 ( ) 16.7 ( ) 0.9 ( ) 0.5 ( ) 1.5 ( ) 0.4 ( ) 0.7 ( ) 2.7 ( ) 26.8 ( ) 19.2 ( ) 14.3 ( ) 13.6 ( ) 4.5 ( ) 3.0 ( ) 2.4 ( ) 2.3 ( ) 2.2 ( ) 1.4 ( ) 17.7 ( ) 21.3 ( ) 24.5 ( ) 10.4 ( ) 6.7 ( ) 3.3 ( ) 1.3 ( ) 2.6 ( ) 2.5 ( ) 1.2 ( ) 24.3 ( ) 20.5 ( ) 20.5 ( ) 13.6 ( ) 3.3 ( ) 4.3 ( ) 1.4 ( ) 1.7 ( ) 1.5 ( ) 2.0 ( ) 29.5 ( ) 24.7 ( ) 13.7 ( ) 11.9 ( ) 3.1 ( ) 3.3 ( ) 2.1 ( ) 1.1 ( ) 1.3 ( ) 1.6 ( ) 34.3 ( ) 27.7 ( ) 12.2 ( ) 11.2 ( ) 1.2 ( ) 1.5 ( ) 1.1 ( ) 1.1 ( ) 0.9 ( ) 2.0 ( ) 33.1 ( ) 32.7 ( ) 9.9 ( ) 12.6 ( ) 0.5 ( ) 0.5 ( ) 1.2 ( ) 0.5 ( ) 0.6 ( ) 1.8 ( ) Beef and veal Pies and pasties Fish and seafood Breakfast cereals Pork Sugar and sweets Dairy products Sausages and processed meats Cakes and muffins Puddings and desserts Snack bars Supplements providing energy ( ) 25.3 ( ) 15.0 ( ) 12.1 ( ) 2.6 ( ) 2.7 ( ) 1.6 ( ) 1.2 ( ) 1.2 ( ) 1.8 ( ) 136 A Focus on Nutrition: Key Findings of the 2008/09 New Zealand Adult Nutrition Survey
165 Food group Total population Males Females Total Total Alcoholic beverages Other meat Lamb and mutton Nuts and seeds Bread Snack foods Biscuits Eggs and egg dishes Butter and margarine Cheese Fats and oils Proportion of total nutrient intake obtained from each food group. Results for Māori, Pacific, NZEO and NZDep2006 are in the online data tables. For full food group definitions, see Table % confidence intervals are presented only for the top 10 food groups. A Focus on Nutrition: Key Findings of the 2008/09 New Zealand Adult Nutrition Survey 137
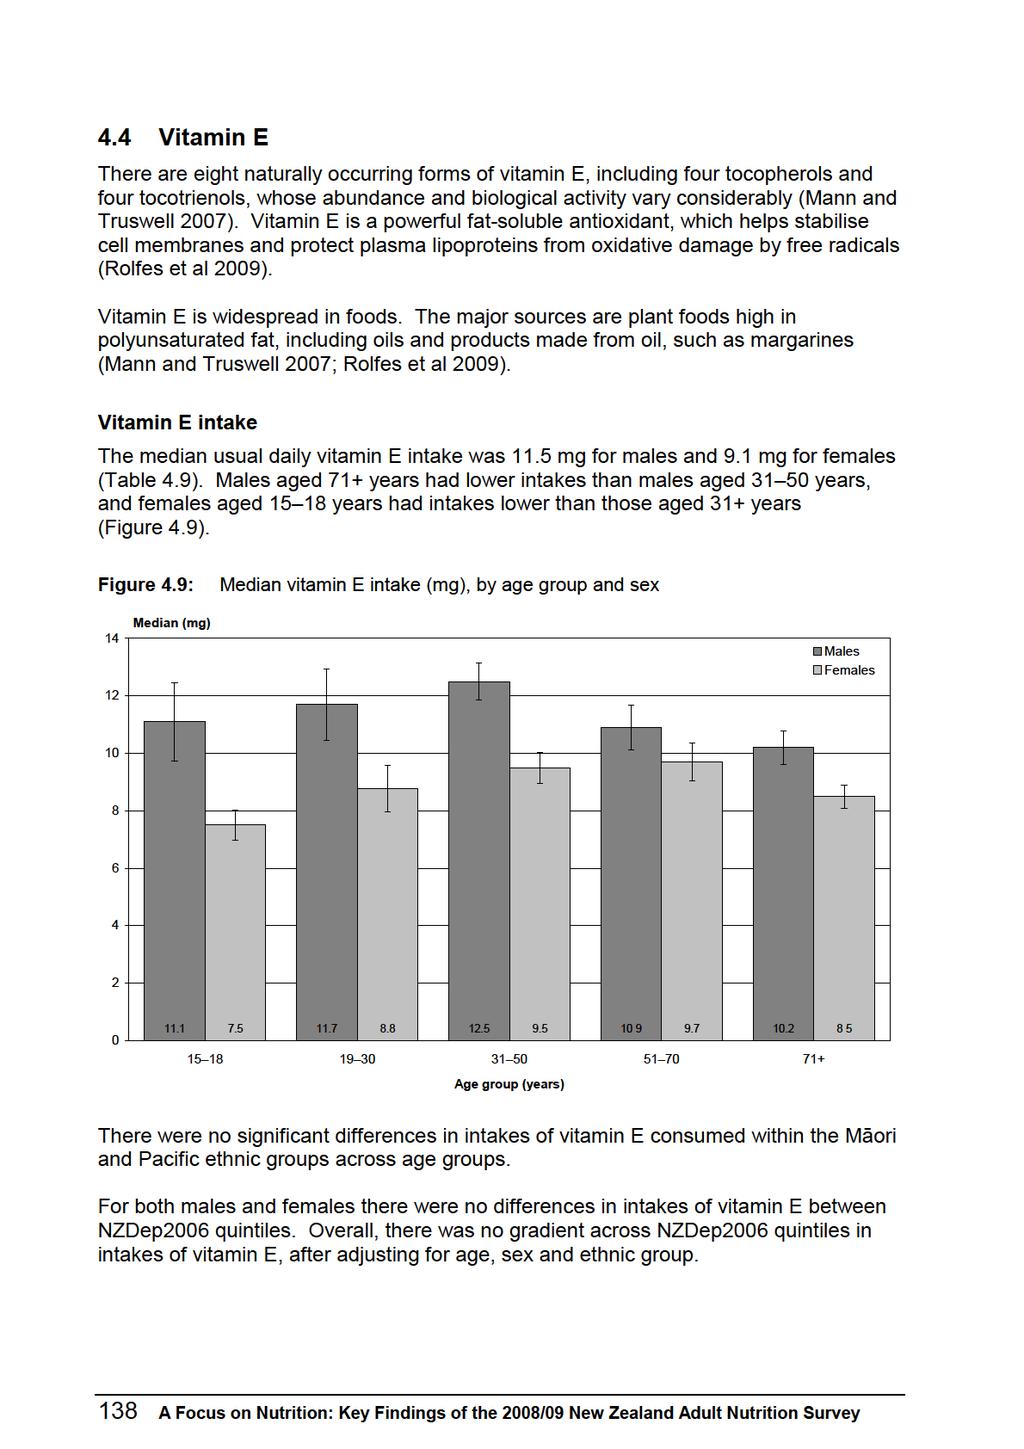
166
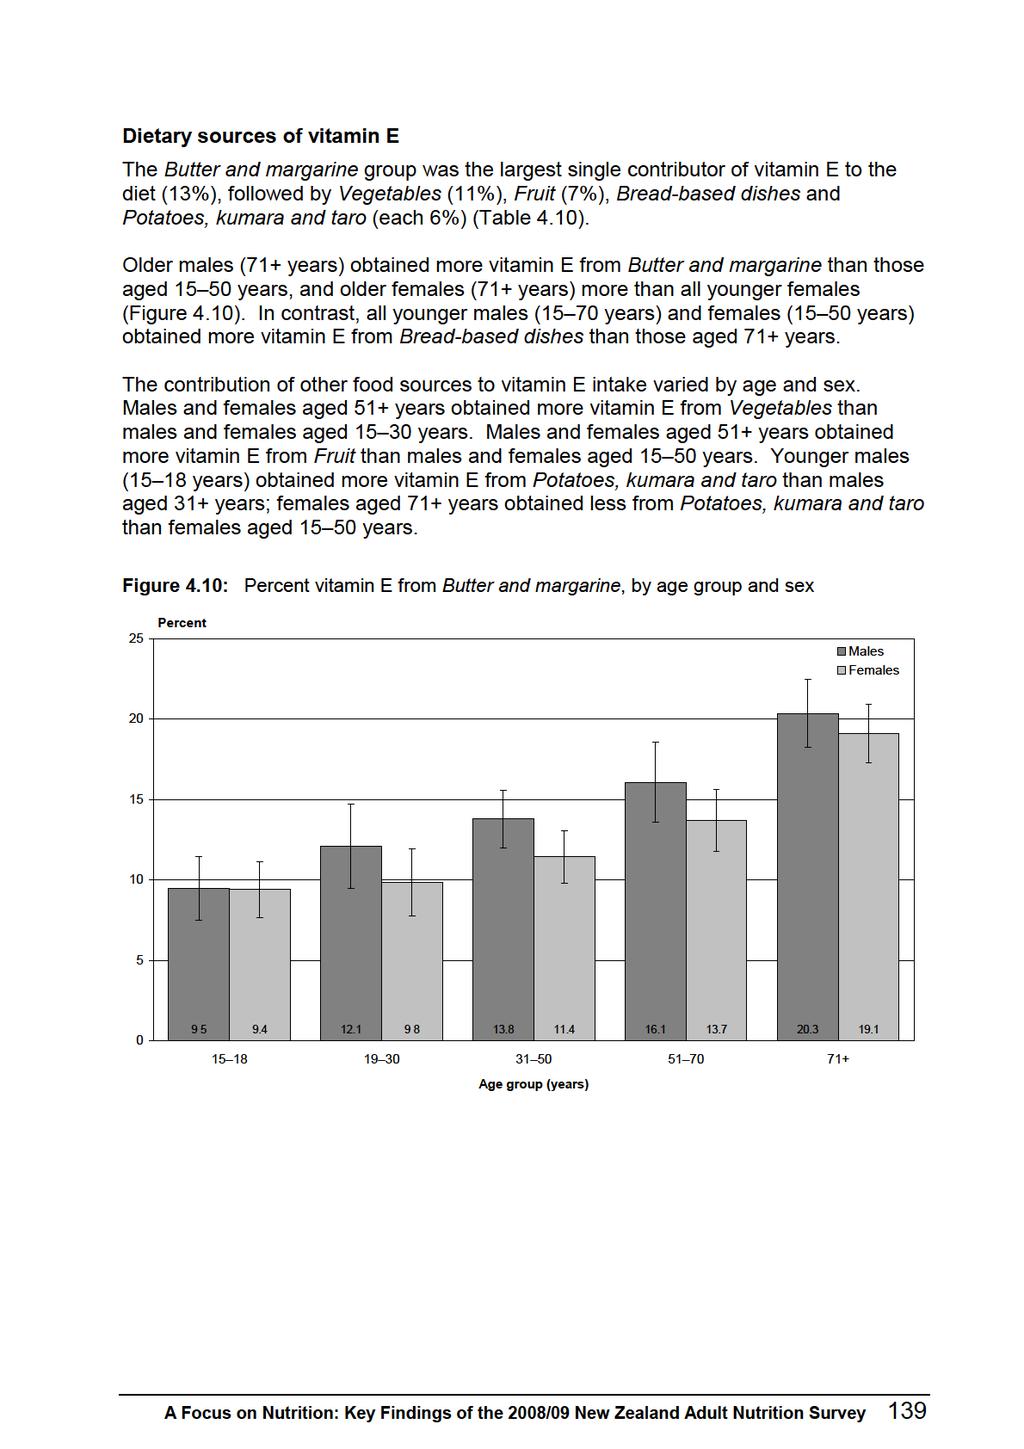
167
168 Table 4.9: Vitamin E intake, by age group, ethnic group, NZDep2006 and sex Vitamin E (mg) 1 Mean 10th 2 Median (50th), 2 (95% CI) 90th 2 Total population ( ) 14.9 By age group (years) Males ( ) ( ) ( ) ( ) ( ) 14.3 Total ( ) 16.5 Females ( ) ( ) ( ) ( ) ( ) 11.4 Total ( ) 12.8 Māori Males ( ) ( ) ( ) ( ) 15.5 Total ( ) 17.7 Females ( ) ( ) ( ) ( ) 10.8 Total ( ) 11.6 Pacific Males ( ) ( ) ( ) ( ) 17.2 Total ( ) 18.7 Females ( ) ( ) ( ) ( ) 13.0 Total ( ) A Focus on Nutrition: Key Findings of the 2008/09 New Zealand Adult Nutrition Survey
169 Vitamin E (mg) 1 Mean 10th 2 Median (50th), 2 (95% CI) 90th 2 NZEO Males ( ) ( ) ( ) ( ) 14.9 Total ( ) 16.0 Females ( ) ( ) ( ) ( ) 13.7 Total ( ) 12.9 By NZDep2006 quintile Males ( ) ( ) ( ) ( ) ( ) 18.6 Females ( ) ( ) ( ) ( ) ( ) Usual daily intake. These data were adjusted for intra-individual variation using PC-SIDE. 2 Percentiles. A Focus on Nutrition: Key Findings of the 2008/09 New Zealand Adult Nutrition Survey 141
170 Table 4.10: Vitamin E sources, percent (95% CI), 1 by age group, sex and food group Food group Total population Male Females Total Total Butter and margarine 13.3 ( ) Vegetables 11.3 ( ) Fruit 7.2 ( ) Bread-based dishes 5.9 ( ) Potatoes, kumara and taro Non-alcoholic beverages 5.8 ( ) 4.5 ( ) Bread 4.4 ( ) Poultry 4.3 ( ) Fish and seafood 4.1 ( ) Savoury sauces and condiments 4.0 ( ) 9.5 ( ) 5.1 ( ) 4.6 ( ) 11.3 ( ) 9.1 ( ) 1.4 ( ) 5.0 ( ) 6.2 ( ) 2.8 ( ) 5.6 ( ) 12.1 ( ) 7.1 ( ) 5.2 ( ) 10.9 ( ) 6.3 ( ) 2.7 ( ) 4.7 ( ) 4.9 ( ) 2.5 ( ) 5.1 ( ) 13.8 ( ) 10.6 ( ) 4.9 ( ) 6.0 ( ) 6.0 ( ) 3.4 ( ) 4.9 ( ) 5.5 ( ) 5.2 ( ) 4.4 ( ) 16.1 ( ) 11.7 ( ) 5.9 ( ) 6.2 ( ) 5.8 ( ) 5.9 ( ) 4.5 ( ) 3.3 ( ) 4.3 ( ) 2.9 ( ) 20.3 ( ) 14.0 ( ) 8.5 ( ) 2.1 ( ) 4.4 ( ) 6.4 ( ) 4.8 ( ) 1.9 ( ) 4.4 ( ) 1.8 ( ) 14.3 ( ) 10.0 ( ) 5.5 ( ) 7.1 ( ) 6.1 ( ) 4.0 ( ) 4.7 ( ) 4.5 ( ) 4.2 ( ) 4.0 ( ) 9.4 ( ) 7.4 ( ) 7.5 ( ) 10.1 ( ) 8.0 ( ) 2.4 ( ) 4.9 ( ) 5.7 ( ) 1.8 ( ) 5.0 ( ) 9.8 ( ) 9.9 ( ) 7.2 ( ) 6.0 ( ) 7.7 ( ) 3.4 ( ) 3.5 ( ) 5.9 ( ) 3.7 ( ) 4.7 ( ) 11.4 ( ) 11.5 ( ) 8.2 ( ) 5.1 ( ) 5.7 ( ) 4.7 ( ) 4.3 ( ) 4.2 ( ) 4.4 ( ) 4.3 ( ) 13.7 ( ) 16.5 ( ) 9.9 ( ) 2.9 ( ) 3.9 ( ) 6.1 ( ) 3.6 ( ) 2.6 ( ) 4.5 ( ) 3.4 ( ) 19.1 ( ) 14.0 ( ) 11.0 ( ) 1.7 ( ) 3.4 ( ) 6.9 ( ) 5.1 ( ) 2.3 ( ) 3.9 ( ) 2.2 ( ) Grains and pasta Cakes and muffins Eggs and egg dishes Beef and veal Breakfast cereals Nuts and seeds Biscuits Pies and pasties Sausages and processed meats Milk Soups and stocks Sugar and sweets Dairy products Fats and oils ( ) 12.5 ( ) 8.7 ( ) 4.7 ( ) 5.5 ( ) 4.9 ( ) 4.1 ( ) 4.0 ( ) 4.0 ( ) 4.0 ( ) 142 A Focus on Nutrition: Key Findings of the 2008/09 New Zealand Adult Nutrition Survey
171 Food group Total population Male Females Total Total Snack foods Pork Snack bars Cheese Puddings and desserts Lamb and mutton Supplements providing energy Other meat Alcoholic beverages Proportion of total nutrient intake obtained from each food group. Results for Māori, Pacific, NZEO and NZDep2006 are in the online data tables. For full food group definitions see Table % confidence intervals are presented only for the top 10 food groups. A Focus on Nutrition: Key Findings of the 2008/09 New Zealand Adult Nutrition Survey 143
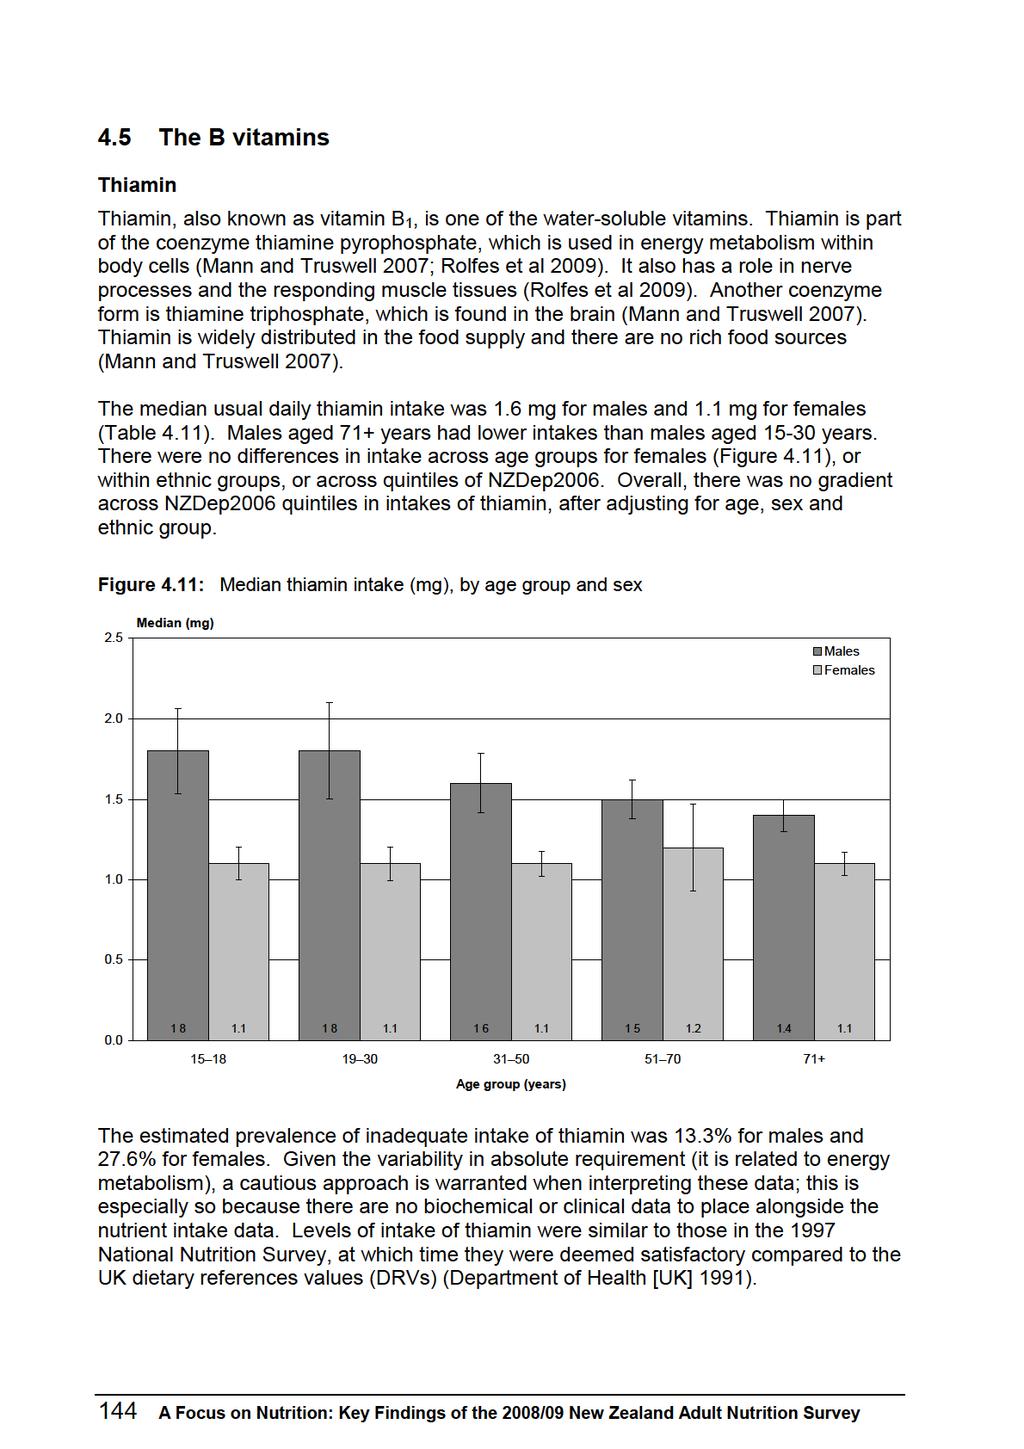
172
173
174 Table 4.11: Thiamin intake, by age group, ethnic group, NZDep2006 and sex Thiamin (mg) 1 Mean 10th 2 Median (50th), 2 (95% CI) 90th 2 Inadequate intake (%), (95% CI) 3 Total population ( ) By age group (years) Males ( ) * ( ) * ( ) ( ) ( ) Total ( ) Females ( ) Māori ( ) ( ) ( ) * ( ) Total ( ) Males ( ) * ( ) * ( ) ( ) Total ( ) Females ( ) Pacific ( ) ( ) ( ) Total ( ) Males ( ) * ( ) * ( ) ( ) Total ( ) * Females ( ) ( ) ( ) ( ) Total ( ) A Focus on Nutrition: Key Findings of the 2008/09 New Zealand Adult Nutrition Survey
175 NZEO Thiamin (mg) 1 Mean 10th 2 Median (50th), 2 (95% CI) 90th 2 Inadequate intake (%), (95% CI) 3 Males ( ) * ( ) * ( ) ( ) Total ( ) Females ( ) By NZDep2006 quintile ( ) * ( ) ( ) Total ( ) Males ( ) ( ) ( ) ( ) ( ) 2.9 Females ( ) ( ) ( ) ( ) ( ) Usual daily intake. These data were adjusted for intra-individual variation using PC-SIDE. 2 Percentiles. 3 Calculated by probability analysis (see Chapter 2). 4 NZDep2006 quintiles consist of a range of age groups. Because the requirements differ for each age group, an overall figure was not calculated. * Coefficient of variation of estimated inadequate intake is greater than 50% and confidence interval lies outside range (0 5%). Estimate should be interpreted with caution due to the high level of imprecision relative to the estimate A Focus on Nutrition: Key Findings of the 2008/09 New Zealand Adult Nutrition Survey 147
176 Table 4.12: Thiamin sources, percent (95% CI), 1 by age group, sex and food group Food group Total population Male Females Total Total Bread 16.6 ( ) Breakfast cereals 13.9 ( ) Vegetables 7.3 ( ) Bread-based dishes 5.8 ( ) Milk 5.6 ( ) Potatoes, kumara and taro 5.5 ( ) Grains and pasta 5.4 ( ) Savoury sauces and condiments 5.2 ( ) Pork 4.5 ( ) Fruit 3.9 ( ) Non-alcoholic beverages 14.0 ( ) 16.8 ( ) 3.4 ( ) 11.4 ( ) 4.8 ( ) 8.0 ( ) 5.0 ( ) 3.9 ( ) 4.8 ( ) 3.0 ( ) 15.5 ( ) 13.1 ( ) 4.7 ( ) 10.2 ( ) 4.0 ( ) 6.1 ( ) 6.8 ( ) 4.4 ( ) 6.2 ( ) 2.8 ( ) 17.8 ( ) 12.7 ( ) 6.6 ( ) 6.3 ( ) 5.5 ( ) 5.6 ( ) 5.3 ( ) 4.9 ( ) 4.6 ( ) 3.0 ( ) 16.7 ( ) 18.5 ( ) 6.9 ( ) 5.6 ( ) 5.4 ( ) 4.5 ( ) 5.3 ( ) 4.7 ( ) 5.7 ( ) 3.1 ( ) 19.6 ( ) 19.1 ( ) 7.1 ( ) 2.0 ( ) 6.0 ( ) 4.1 ( ) 6.5 ( ) 5.0 ( ) 4.8 ( ) 4.4 ( ) 16.9 ( ) 15.2 ( ) 6.1 ( ) 6.9 ( ) 5.2 ( ) 5.4 ( ) 5.7 ( ) 4.7 ( ) 5.3 ( ) 3.1 ( ) 14.7 ( ) 12.2 ( ) 4.8 ( ) 10.2 ( ) 4.1 ( ) 7.7 ( ) 5.7 ( ) 5.3 ( ) 3.1 ( ) 3.3 ( ) 14.0 ( ) 9.9 ( ) 8.4 ( ) 6.9 ( ) 5.0 ( ) 7.4 ( ) 6.9 ( ) 4.6 ( ) 3.1 ( ) 3.9 ( ) 16.6 ( ) 12.3 ( ) 8.0 ( ) 5.0 ( ) 6.7 ( ) 5.3 ( ) 5.1 ( ) 5.7 ( ) 4.1 ( ) 4.7 ( ) 16.5 ( ) 14.1 ( ) 9.9 ( ) 2.9 ( ) 6.2 ( ) 4.4 ( ) 3.8 ( ) 6.0 ( ) 3.9 ( ) 5.2 ( ) 19.9 ( ) 16.6 ( ) 8.6 ( ) 1.8 ( ) 6.7 ( ) 3.7 ( ) 4.4 ( ) 6.7 ( ) 3.6 ( ) 4.9 ( ) Beef and veal Poultry Cakes and muffins Fish and seafood Dairy products Pies and pasties Biscuits Eggs and egg dishes Soups and stocks Alcoholic beverages Nuts and seeds ( ) 12.7 ( ) 8.4 ( ) 4.8 ( ) 6.0 ( ) 5.5 ( ) 5.1 ( ) 5.6 ( ) 3.7 ( ) 4.6 ( ) 148 A Focus on Nutrition: Key Findings of the 2008/09 New Zealand Adult Nutrition Survey
177 Food group Total population Male Females Total Total Lamb and mutton Sausages and processed meats Snack bars Sugar and sweets Snack foods Cheese Puddings and desserts Supplements providing energy Other meat Butter and margarine Fats and oils Proportion of total nutrient intake obtained from each food group. Results for Māori, Pacific, NZEO and NZDep2006 are in the online data tables. For full food group definitions, see Table % confidence intervals are presented only for the top 10 food groups. A Focus on Nutrition: Key Findings of the 2008/09 New Zealand Adult Nutrition Survey 149
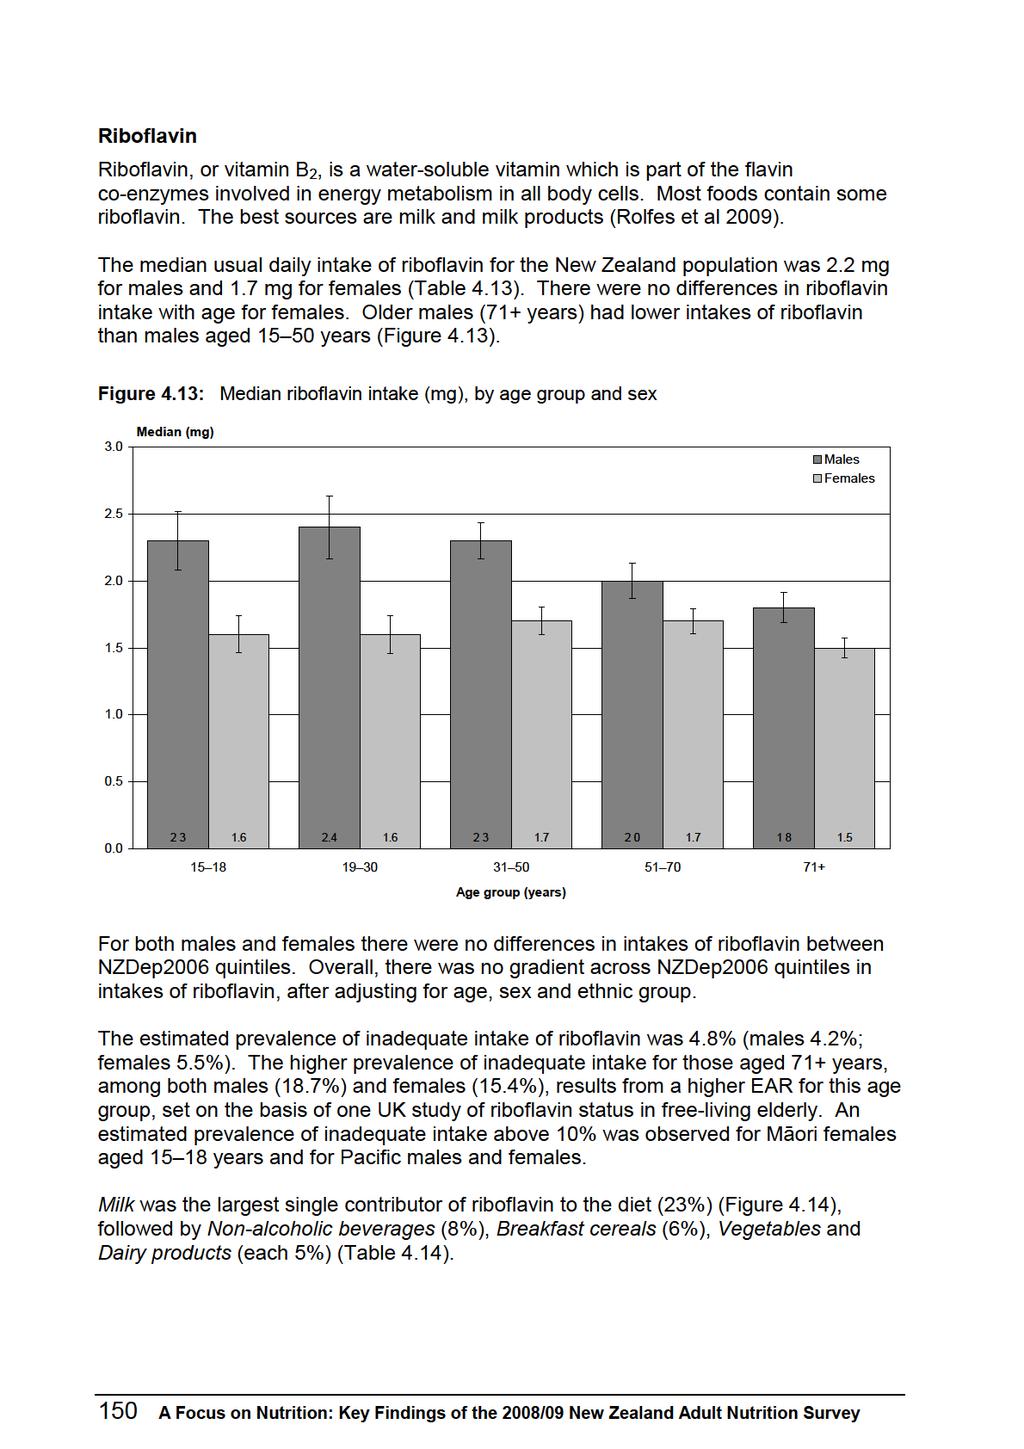
178
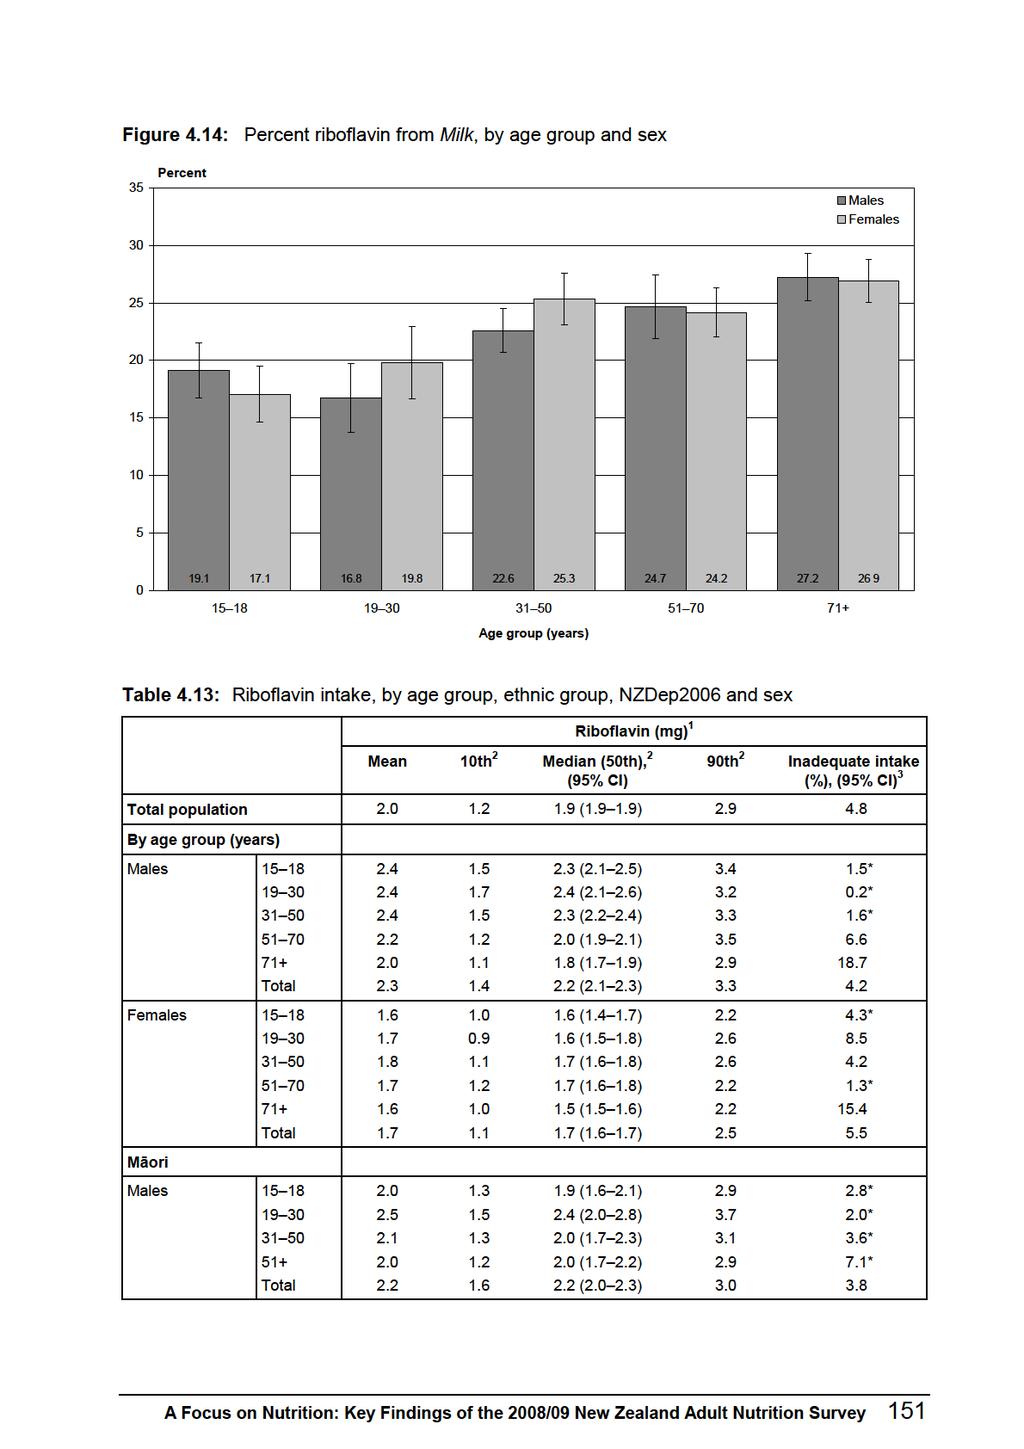
179
180 Riboflavin (mg) 1 Mean 10th 2 Median (50th), 2 (95% CI) 90th 2 Inadequate intake (%), (95% CI) 3 Females ( ) * ( ) * ( ) * ( ) * Total ( ) Pacific Males ( ) * ( ) * ( ) * ( ) Total ( ) Females ( ) * ( ) ( ) * ( ) * Total ( ) NZEO Males ( ) * ( ) ( ) * ( ) Total ( ) Females ( ) * ( ) * ( ) * ( ) * Total ( ) By NZDep2006 quintile Males ( ) ( ) ( ) ( ) ( ) 3.5 Females ( ) ( ) ( ) ( ) ( ) Usual daily intake. These data were adjusted for intra-individual variation using PC-SIDE. 2 Percentiles. 3 Calculated by probability analysis (see Chapter 2). 4 NZDep2006 quintiles consist of a range of age groups. Because the requirements differ for each age group, an overall figure was not calculated. * Coefficient of variation of estimated inadequate intake is greater than 50% and confidence interval lies outside range (0 5%). Estimate should be interpreted with caution due to the high level of imprecision relative to the estimate A Focus on Nutrition: Key Findings of the 2008/09 New Zealand Adult Nutrition Survey
181 Table 4.14: Riboflavin sources, percent (95% CI), 1 by age group, sex and food group Food group Total population Male Females Total Total Milk 22.9 ( ) Non-alcoholic beverages 8.1 ( ) Breakfast cereals 6.0 ( ) Vegetables 5.1 ( ) Dairy products 4.8 ( ) Grains and pasta 4.2 ( ) Bread 4.2 ( ) Eggs and egg dishes 4.1 ( ) Savoury sauces and condiments 4.0 ( ) Bread-based dishes 3.9 ( ) 19.1 ( ) 5.0 ( ) 8.4 ( ) 2.5 ( ) 4.5 ( ) 5.5 ( ) 4.0 ( ) 4.2 ( ) 3.5 ( ) 8.9 ( ) 16.8 ( ) 10.1 ( ) 5.5 ( ) 3.0 ( ) 3.6 ( ) 6.6 ( ) 3.9 ( ) 3.2 ( ) 3.4 ( ) 7.8 ( ) 22.6 ( ) 7.1 ( ) 5.3 ( ) 4.8 ( ) 4.1 ( ) 3.7 ( ) 4.7 ( ) 4.3 ( ) 3.6 ( ) 4.0 ( ) 24.7 ( ) 6.8 ( ) 8.3 ( ) 4.3 ( ) 4.1 ( ) 3.9 ( ) 4.2 ( ) 4.8 ( ) 3.8 ( ) 3.0 ( ) 27.2 ( ) 4.9 ( ) 8.5 ( ) 5.4 ( ) 4.0 ( ) 2.7 ( ) 5.4 ( ) 4.7 ( ) 4.2 ( ) 1.0 ( ) 22.1 ( ) 7.3 ( ) 6.7 ( ) 4.2 ( ) 4.0 ( ) 4.4 ( ) 4.4 ( ) 4.3 ( ) 3.6 ( ) 4.6 ( ) 17.1 ( ) 7.2 ( ) 5.4 ( ) 3.2 ( ) 6.2 ( ) 6.8 ( ) 4.2 ( ) 2.7 ( ) 4.5 ( ) 8.5 ( ) 19.8 ( ) 10.0 ( ) 4.5 ( ) 5.3 ( ) 6.3 ( ) 6.3 ( ) 3.4 ( ) 5.6 ( ) 3.5 ( ) 4.4 ( ) 25.3 ( ) 9.1 ( ) 5.1 ( ) 5.5 ( ) 4.1 ( ) 4.1 ( ) 3.9 ( ) 3.5 ( ) 4.2 ( ) 3.2 ( ) 24.2 ( ) 8.8 ( ) 5.6 ( ) 7.3 ( ) 6.1 ( ) 2.3 ( ) 3.9 ( ) 3.8 ( ) 4.6 ( ) 1.6 ( ) 26.9 ( ) 6.5 ( ) 6.6 ( ) 6.4 ( ) 6.4 ( ) 2.4 ( ) 5.3 ( ) 4.5 ( ) 5.0 ( ) 0.9 ( ) Fruit Poultry Beef and veal Cheese Potatoes, kumara and taro Alcoholic beverages Pork Cakes and muffins Fish and seafood Pies and pasties Lamb and mutton Sausages and processed meats Sugar and sweets ( ) 8.8 ( ) 5.3 ( ) 5.9 ( ) 5.4 ( ) 4.1 ( ) 4.0 ( ) 4.0 ( ) 4.3 ( ) 3.2 ( ) A Focus on Nutrition: Key Findings of the 2008/09 New Zealand Adult Nutrition Survey 153
182 Food group Total population Male Females Total Total Puddings and desserts Soups and stocks Biscuits Nuts and seeds Other meat Snack bars Supplements providing energy Snack foods Butter and margarine Fats and oils Proportion of total nutrient intake obtained from each food group. Results for Māori, Pacific, NZEO and NZDep2006 are in the online data tables. For full food group definitions see Table % confidence intervals are presented only for the top 10 food groups. 154 A Focus on Nutrition: Key Findings of the 2008/09 New Zealand Adult Nutrition Survey
183
184
185 Table 4.15: Niacin equivalents intake, by age group, ethnic group, NZDep2006 and sex Niacin equivalents (mg) 1 Mean 10th 2 Median (50th) 2 (95% CI) 90th 2 Inadequate intake (%, 95% CI) 3 Total population ( ) By age group (years) Males ( ) ( ) ( ) ( ) ( ) Total ( ) Females ( ) Māori ( ) ( ) ( ) ( ) Total ( ) Male ( ) * ( ) ( ) ( ) * Total ( ) Female ( ) * Pacific ( ) ( ) ( ) Total ( ) Males ( ) * ( ) * ( ) ( ) Total ( ) Females ( ) * ( ) ( ) * ( ) * Total ( ) A Focus on Nutrition: Key Findings of the 2008/09 New Zealand Adult Nutrition Survey 157
186 Niacin equivalents (mg) 1 Mean 10th 2 Median (50th) 2 (95% CI) 90th 2 Inadequate intake (%, 95% CI) 3 NZEO Males ( ) ( ) ( ) ( ) Total ( ) Females ( ) ( ) ( ) ( ) Total ( ) By NZDep2006 quintile Males ( ) ( ) ( ) ( ) ( ) 65.2 Females ( ) ( ) ( ) ( ) ( ) Usual daily intake. These data were adjusted for intra-individual variation using PC-SIDE. 2 Percentiles. 3 Calculated by probability analysis (see Chapter 2). 4 NZDep2006 quintiles consist of a range of age groups. Because the requirements differ for each age group, an overall figure was not calculated. * Coefficient of variation of estimated inadequate intake is greater than 50% and confidence interval lies outside range (0 5%). Estimate should be interpreted with caution due to the high level of imprecision relative to the estimate. 158 A Focus on Nutrition: Key Findings of the 2008/09 New Zealand Adult Nutrition Survey
187 Table 4.16: Niacin equivalent sources, percent (95% CI), 1 by age group, sex and food group Food group Total population Male Females Total Total Poultry 9.3 ( ) Bread 8.2 ( ) Non-alcoholic beverages 7.6 ( ) Beef and veal 7.2 ( ) Potatoes, kumara and taro 6.2 ( ) Fish and seafood 5.8 ( ) Bread-based dishes 5.7 ( ) Grains and pasta 5.7 ( ) Vegetables 5.2 ( ) Milk 5.0 ( ) 10.9 ( ) 7.3 ( ) 4.8 ( ) 6.5 ( ) 8.3 ( ) 3.1 ( ) 12.0 ( ) 5.7 ( ) 2.5 ( ) 4.1 ( ) 9.0 ( ) 6.8 ( ) 9.6 ( ) 5.8 ( ) 5.6 ( ) 3.3 ( ) 10.9 ( ) 8.0 ( ) 3.4 ( ) 3.4 ( ) 10.7 ( ) 8.7 ( ) 7.0 ( ) 8.1 ( ) 5.7 ( ) 6.0 ( ) 5.8 ( ) 6.0 ( ) 4.6 ( ) 4.4 ( ) 8.2 ( ) 8.4 ( ) 7.0 ( ) 8.0 ( ) 6.2 ( ) 5.5 ( ) 4.7 ( ) 4.8 ( ) 4.5 ( ) 5.5 ( ) 5.2 ( ) 10.7 ( ) 5.2 ( ) 9.3 ( ) 7.3 ( ) 6.6 ( ) 1.9 ( ) 3.7 ( ) 6.0 ( ) 6.2 ( ) 9.2 ( ) 8.3 ( ) 7.2 ( ) 7.6 ( ) 6.1 ( ) 5.1 ( ) 6.7 ( ) 5.8 ( ) 4.3 ( ) 4.6 ( ) 10.2 ( ) 8.0 ( ) 7.5 ( ) 5.5 ( ) 7.8 ( ) 2.9 ( ) 10.6 ( ) 7.4 ( ) 3.5 ( ) 4.1 ( ) 11.9 ( ) 6.7 ( ) 8.8 ( ) 4.5 ( ) 7.8 ( ) 5.1 ( ) 6.6 ( ) 8.3 ( ) 5.4 ( ) 4.5 ( ) 9.9 ( ) 7.9 ( ) 8.7 ( ) 7.1 ( ) 5.6 ( ) 6.6 ( ) 5.3 ( ) 5.6 ( ) 5.6 ( ) 5.8 ( ) 7.6 ( ) 8.4 ( ) 6.9 ( ) 7.8 ( ) 5.7 ( ) 8.0 ( ) 2.4 ( ) 3.5 ( ) 7.6 ( ) 5.5 ( ) 6.4 ( ) 11.1 ( ) 6.2 ( ) 8.4 ( ) 6.5 ( ) 5.9 ( ) 1.7 ( ) 3.5 ( ) 6.9 ( ) 6.7 ( ) Breakfast cereals Pork Fruit Pies and pasties Sausages and processed meats Eggs and egg dishes Lamb and mutton Savoury sauces and condiments Cheese Nuts and seeds Cakes and muffins Alcoholic beverages Dairy products ( ) 8.1 ( ) 7.9 ( ) 6.8 ( ) 6.3 ( ) 6.3 ( ) 4.8 ( ) 5.5 ( ) 6.1 ( ) 5.4 ( ) A Focus on Nutrition: Key Findings of the 2008/09 New Zealand Adult Nutrition Survey 159
188 Food group Total population Male Females Total Total Biscuits Soups and stocks Sugar and sweets Snack bars Other meat Supplements providing energy Puddings and desserts Snack foods Butter and margarine Fats and oils Proportion of total nutrient intake obtained from each food group. Results for Māori, Pacific, NZEO and NZDep2006 are in the online data tables. For full food group definitions, see Table % confidence intervals are presented only for the top 10 food groups. 160 A Focus on Nutrition: Key Findings of the 2008/09 New Zealand Adult Nutrition Survey
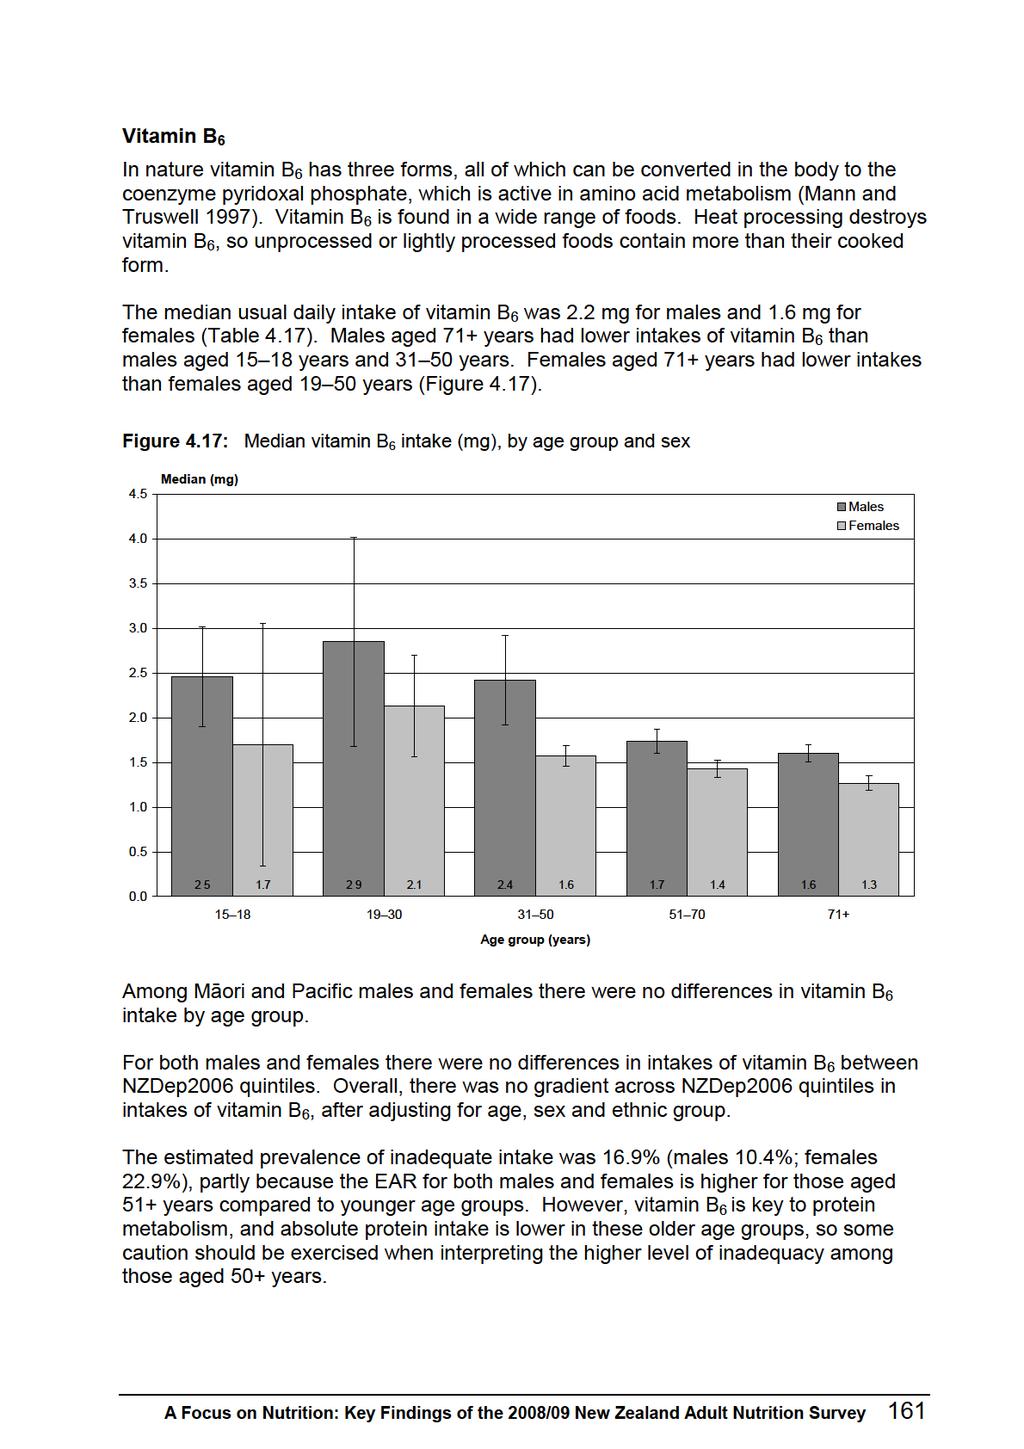
189
190
191 Table 4.17: Vitamin B 6 intake, by age group, ethnic group, NZDep2006 and sex Vitamin B 6 (mg) 1 Mean 10th 2 Median (50th), 2 (95% CI) 90th 2 Inadequate intake (%, 95% CI) 2 Total population ( ) By age group (years) Males ( ) * ( ) * ( ) * ( ) ( ) Total ( ) Females ( ) Māori ( ) * ( ) ( ) ( ) Total ( ) Males ( ) * ( ) ( ) * ( ) Total ( ) Females ( ) Pacific ( ) ( ) ( ) Total ( ) Males ( ) * ( ) * ( ) ( ) Total ( ) * Females ( ) ( ) ( ) * ( ) Total ( ) A Focus on Nutrition: Key Findings of the 2008/09 New Zealand Adult Nutrition Survey 163
192 NZEO Vitamin B 6 (mg) 1 Mean 10th 2 Median (50th), 2 (95% CI) 90th 2 Inadequate intake (%, 95% CI) 2 Males ( ) ( ) * ( ) ( ) Total ( ) Females ( ) * By NZDep2006 quintile ( ) * ( ) ( ) Total ( ) Males ( ) ( ) ( ) ( ) ( ) 3.7 Females ( ) ( ) ( ) ( ) ( ) Usual daily intake. These data were adjusted for intra-individual variation using PC-SIDE. 2 Percentiles. 3 Calculated by probability analysis (see Chapter 2). 4 NZDep2006 quintiles consist of a range of age groups. Because the requirements differ for each age group, an overall figure was not calculated. * Coefficient of variation of estimated inadequate intake is greater than 50% and confidence interval lies outside range (0 5%). Estimate should be interpreted with caution due to the high level of imprecision relative to the estimate A Focus on Nutrition: Key Findings of the 2008/09 New Zealand Adult Nutrition Survey
193 Table 4.18: Vitamin B 6 sources, percent (95% CI), 1 by age group, sex and food group Food group Total population Male Females Total Total Fruit 12.5 ( ) Vegetables 10.1 ( ) Potatoes, kumara and taro 10.0 ( ) Poultry 7.2 ( ) Breakfast cereals 6.4 ( ) Bread 5.4 ( ) Non-alcoholic beverages 5.1 ( ) Grains and pasta 5.1 ( ) Beef and veal 4.9 ( ) Milk 4.3 ( ) 7.4 ( ) 4.4 ( ) 11.3 ( ) 9.8 ( ) 8.8 ( ) 5.4 ( ) 6.4 ( ) 5.0 ( ) 5.4 ( ) 3.7 ( ) 9.5 ( ) 6.8 ( ) 7.8 ( ) 7.2 ( ) 5.5 ( ) 4.8 ( ) 11.9 ( ) 7.3 ( ) 4.3 ( ) 3.1 ( ) 9.4 ( ) 9.6 ( ) 9.4 ( ) 8.9 ( ) 5.6 ( ) 5.8 ( ) 5.2 ( ) 5.5 ( ) 5.9 ( ) 3.9 ( ) 12.1 ( ) 9.0 ( ) 11.7 ( ) 6.2 ( ) 8.8 ( ) 5.8 ( ) 2.9 ( ) 4.6 ( ) 5.4 ( ) 4.6 ( ) 17.6 ( ) 11.8 ( ) 13.0 ( ) 3.4 ( ) 8.5 ( ) 6.7 ( ) 0.9 ( ) 2.9 ( ) 5.4 ( ) 4.9 ( ) 10.7 ( ) 8.6 ( ) 10.2 ( ) 7.4 ( ) 7.0 ( ) 5.6 ( ) 5.7 ( ) 5.3 ( ) 5.3 ( ) 4.0 ( ) 8.5 ( ) 6.6 ( ) 10.8 ( ) 8.5 ( ) 6.1 ( ) 5.9 ( ) 8.6 ( ) 7.0 ( ) 3.9 ( ) 3.7 ( ) 11.3 ( ) 10.0 ( ) 11.7 ( ) 8.6 ( ) 4.2 ( ) 3.9 ( ) 9.1 ( ) 7.2 ( ) 3.0 ( ) 3.7 ( ) 12.5 ( ) 11.1 ( ) 9.1 ( ) 7.8 ( ) 6.0 ( ) 5.1 ( ) 3.9 ( ) 5.2 ( ) 5.1 ( ) 5.3 ( ) 17.8 ( ) 13.8 ( ) 8.6 ( ) 5.8 ( ) 6.6 ( ) 5.5 ( ) 2.4 ( ) 3.0 ( ) 4.7 ( ) 4.6 ( ) 19.6 ( ) 12.7 ( ) 11.1 ( ) 4.1 ( ) 7.3 ( ) 7.0 ( ) 1.8 ( ) 2.6 ( ) 4.3 ( ) 5.2 ( ) Bread-based dishes Fish and seafood Alcoholic beverages Pork Dairy products Savoury sauces and condiments Pies and pasties Lamb and mutton Sausages and processed meats Soups and stocks Cakes and muffins Cheese Sugar and sweets ( ) 11.5 ( ) 9.8 ( ) 7.1 ( ) 5.9 ( ) 5.2 ( ) 4.6 ( ) 4.9 ( ) 4.4 ( ) 4.7 ( ) A Focus on Nutrition: Key Findings of the 2008/09 New Zealand Adult Nutrition Survey 165
194 Food group Total population Male Females Total Total Biscuits Nuts and seeds Eggs and egg dishes Snack foods Snack bars Puddings and desserts Supplements providing energy Other meat Butter and margarine Fats and oils Proportion of total nutrient intake obtained from each food group. Results for Māori, Pacific, NZEO and NZDep2006 are in the online data tables. For full food group definitions, see Table % confidence intervals are presented only for the top 10 food groups. 166 A Focus on Nutrition: Key Findings of the 2008/09 New Zealand Adult Nutrition Survey
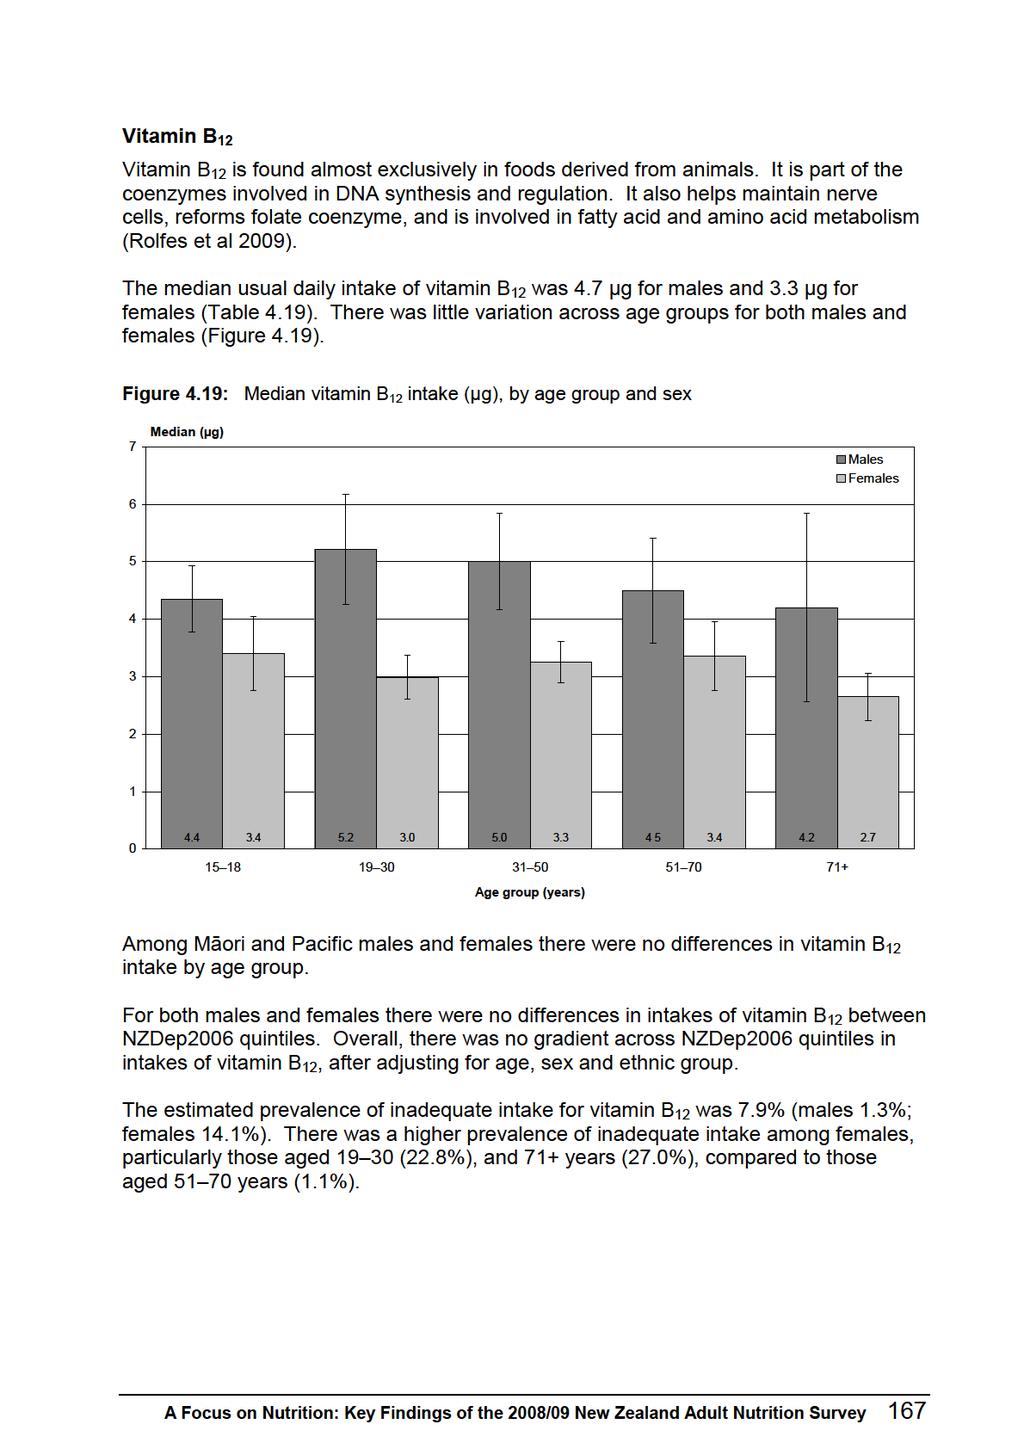
195
196
197 Table 4.19: Vitamin B 12 intake, by age group, ethnic group, NZDep2006 and sex Vitamin B 12 (μg) 1 Mean 10th 2 Median (50th), 2 (95% CI) 90th 2 Inadequate intake (%), (95% CI) 3 Total population ( ) By age group (years) Males ( ) * ( ) ( ) * ( ) * ( ) * Total ( ) * Females ( ) * Māori ( ) ( ) ( ) * ( ) Total ( ) Males ( ) * ( ) * ( ) * ( ) Total ( ) Females ( ) * Pacific ( ) ( ) * ( ) * Total ( ) Males ( ) * ( ) * ( ) ( ) * Total ( ) Females ( ) * ( ) ( ) ( ) * Total ( ) A Focus on Nutrition: Key Findings of the 2008/09 New Zealand Adult Nutrition Survey 169
198 NZEO Vitamin B 12 (μg) 1 Mean 10th 2 Median (50th), 2 (95% CI) 90th 2 Inadequate intake (%), (95% CI) 3 Males ( ) * ( ) ( ) ( ) * Total ( ) Females ( ) * By NZDep2006 quintile ( ) * ( ) ( ) * Total ( ) Males ( ) ( ) ( ) ( ) ( ) 7.6 Females ( ) ( ) ( ) ( ) ( ) Usual daily intake. These data were adjusted for intra-individual variation using PC-SIDE. 2 Percentiles. 3 Calculated by probability analysis (see Chapter 2). 4 NZDep2006 quintiles consist of a range of age groups. Because the requirements differ for each age group, an overall figure was not calculated. * Coefficient of variation of estimated inadequate intake is greater than 50% and confidence interval lies outside range (0 5%). Estimate should be interpreted with caution due to the high level of imprecision relative to the estimate A Focus on Nutrition: Key Findings of the 2008/09 New Zealand Adult Nutrition Survey
199 Table 4.20: Vitamin B 12 sources, percent (95% CI), 1 by age group, sex and food group Food group Total population Male Females Total Total Milk 20.6 ( ) Beef and veal 10.7 ( ) Fish and seafood 9.6 ( ) Eggs and egg dishes 6.4 ( ) Bread-based dishes 6.2 ( ) Poultry 5.9 ( ) Non-alcoholic beverages 5.4 ( ) Cheese 4.7 ( ) Dairy products 4.2 ( ) Grains and pasta 4.1 ( ) 16.2 ( ) 9.7 ( ) 5.2 ( ) 5.9 ( ) 13.5 ( ) 7.5 ( ) 5.3 ( ) 3.5 ( ) 4.7 ( ) 4.8 ( ) 15.1 ( ) 8.8 ( ) 5.0 ( ) 4.4 ( ) 12.5 ( ) 5.6 ( ) 10.1 ( ) 5.3 ( ) 2.6 ( ) 6.9 ( ) 19.4 ( ) 12.0 ( ) 9.5 ( ) 6.0 ( ) 6.6 ( ) 6.7 ( ) 5.2 ( ) 4.7 ( ) 3.3 ( ) 3.8 ( ) 22.7 ( ) 11.2 ( ) 10.5 ( ) 7.0 ( ) 4.4 ( ) 6.2 ( ) 3.4 ( ) 3.5 ( ) 4.1 ( ) 3.4 ( ) 26.1 ( ) 14.1 ( ) 10.1 ( ) 8.0 ( ) 2.2 ( ) 3.7 ( ) 1.2 ( ) 3.4 ( ) 3.8 ( ) 1.5 ( ) 19.8 ( ) 11.2 ( ) 8.6 ( ) 6.1 ( ) 7.4 ( ) 6.1 ( ) 5.4 ( ) 4.3 ( ) 3.5 ( ) 4.2 ( ) 15.5 ( ) 7.9 ( ) 5.3 ( ) 3.9 ( ) 11.9 ( ) 7.1 ( ) 7.1 ( ) 4.9 ( ) 6.0 ( ) 6.6 ( ) 17.8 ( ) 5.5 ( ) 7.6 ( ) 9.7 ( ) 6.9 ( ) 7.9 ( ) 8.4 ( ) 3.2 ( ) 5.5 ( ) 6.6 ( ) 22.1 ( ) 11.1 ( ) 11.4 ( ) 5.2 ( ) 5.7 ( ) 5.3 ( ) 5.6 ( ) 6.9 ( ) 3.5 ( ) 4.2 ( ) 22.9 ( ) 11.8 ( ) 13.2 ( ) 6.4 ( ) 2.5 ( ) 5.1 ( ) 4.0 ( ) 4.3 ( ) 5.3 ( ) 1.7 ( ) 25.5 ( ) 13.8 ( ) 9.4 ( ) 8.1 ( ) 1.3 ( ) 4.5 ( ) 2.3 ( ) 4.5 ( ) 5.7 ( ) 2.3 ( ) Sausages and processed meats Lamb and mutton Pork Pies and pasties Savoury sauces and condiments Cakes and muffins Other meat Soups and stocks Butter and margarine Puddings and desserts Vegetables ( ) 10.3 ( ) 10.5 ( ) 6.6 ( ) 5.1 ( ) 5.8 ( ) 5.5 ( ) 5.1 ( ) 4.7 ( ) 4.0 ( ) A Focus on Nutrition: Key Findings of the 2008/09 New Zealand Adult Nutrition Survey 171
200 Food group Total population Male Females Total Total Potatoes, kumara and taro Supplements providing energy Sugar and sweets Bread Biscuits Snack bars Breakfast cereals Snack foods Alcoholic beverages Nuts and seeds Fruit Fats and oils Proportion of total nutrient intake obtained from each food group. Results for Māori, Pacific, NZEO and NZDep2006 are in the online data tables. For full food group definitions, see Table % confidence intervals are presented only for the top 10 food groups. 172 A Focus on Nutrition: Key Findings of the 2008/09 New Zealand Adult Nutrition Survey
201
202 Calcium intakes were lower for Māori females aged years than for those aged years. Pacific females aged 51+ years had lower usual daily median calcium intakes than Pacific females aged years. For both males and females there were no differences in intakes of calcium between NZDep2006 quintiles. Overall, there was no gradient across NZDep2006 quintiles in intakes of calcium, after adjusting for age, sex and ethnic group. The estimated prevalence of inadequate intake of calcium was 59% (males 45%; females 73%). The prevalence for Māori and Pacific females aged 51+ years was over 90%, and for those aged years it was over 95%. Interpretation of these data requires a cautionary approach because the EAR values have been augmented by 320 mg to take into account unspecified low absorption that occurs at about 500 mg/day (NHMRC 2006). Also, the addition of 260 mg/day to the EAR for adults aged 71+ years, to account for further decreases in absorption with age, is high and is reflected in the higher prevalence of inadequate intake for older age groups in all ethnic groups. While calcium is of major importance for attaining and maintaining bone health, other factors such as vitamin D intakes, exercise levels and habitual levels of intake all influence bone health. Dietary sources of calcium Milk was the largest single contributor of calcium to the diet (27%), followed by Bread and Non-alcoholic beverages (each 10%), Cheese (8%), Vegetables and Dairy products (each 6%) and Bread-based dishes (5%) (Table 4.22). Males aged 51+ years and females aged 31+ years obtained more calcium from Milk than younger males and females aged years (Figure 4.22). Older males and females (71+ years) consumed more calcium from Bread (both 12%) than those aged years (9% males, 8% females). Non-alcoholic beverages contributed less calcium for males and females aged 71+ years than for all younger adults. Vegetables contributed more calcium for males aged 31+ years and females aged 51+ years than for those aged years. 174 A Focus on Nutrition: Key Findings of the 2008/09 New Zealand Adult Nutrition Survey
203
204 Table 4.21: Calcium intake, by age group, ethnic group, NZDep2006 and sex Calcium (mg) 1 Mean 10th 2 Median (50th), 2 (95% CI) 90th 2 Inadequate intake (%), (95% CI) 3 Total population ( ) Age group (years) Males ( ) ( ) ( ) ( ) ( ) Total ( ) Females ( ) Māori ( ) ( ) ( ) ( ) Total ( ) Males ( ) ( ) ( ) ( ) Total ( ) Females ( ) Pacific ( ) ( ) ( ) Total ( ) Males ( ) ( ) ( ) ( ) Total ( ) Females ( ) ( ) ( ) ( ) Total ( ) A Focus on Nutrition: Key Findings of the 2008/09 New Zealand Adult Nutrition Survey
205 NZEO Calcium (mg) 1 Mean 10th 2 Median (50th), 2 (95% CI) 90th 2 Inadequate intake (%), (95% CI) 3 Males ( ) ( ) * ( ) ( ) Total ( ) Females ( ) By NZDep2006 quintile ( ) ( ) ( ) Total ( ) Males ( ) ( ) ( ) ( ) ( ) 1382 Females ( ) ( ) ( ) ( ) ( ) Usual daily intake. These data were adjusted for intra-individual variation using PC-SIDE. 2 Percentiles. 3 Calculated by probability analysis (see Chapter 2). 4 NZDep2006 quintiles consist of a range of age groups. Because the requirements differ for each age group, an overall figure was not calculated. * Coefficient of variation of estimated inadequate intake is greater than 50% and confidence interval lies outside range (0 5%). Estimate should be interpreted with caution due to the high level of imprecision relative to the estimate A Focus on Nutrition: Key Findings of the 2008/09 New Zealand Adult Nutrition Survey 177
206 Table 4.22: Calcium sources, percent (95% CI), 1 by age group, sex and food group Food group Total population Males Females Total Total Milk 26.8 ( ) Bread 9.9 ( ) Non-alcoholic beverages 9.6 ( ) Cheese 7.7 ( ) Vegetables 5.8 ( ) Dairy products 5.8 ( ) Bread-based dishes 5.0 ( ) Grains and pasta 3.6 ( ) Fruit 2.5 ( ) Cakes and muffins 2.2 ( ) 23.2 ( ) 10.1 ( ) 8.3 ( ) 6.6 ( ) 3.0 ( ) 5.2 ( ) 12.6 ( ) 4.6 ( ) 2.3 ( ) 1.1 ( ) 21.2 ( ) 8.8 ( ) 11.2 ( ) 9.2 ( ) 3.7 ( ) 4.3 ( ) 9.6 ( ) 6.0 ( ) 1.6 ( ) 1.7 ( ) 26.1 ( ) 10.9 ( ) 9.2 ( ) 8.8 ( ) 5.2 ( ) 5.1 ( ) 5.5 ( ) 2.9 ( ) 1.8 ( ) 2.4 ( ) 30.0 ( ) 11.1 ( ) 7.5 ( ) 6.4 ( ) 5.7 ( ) 5.0 ( ) 4.4 ( ) 3.4 ( ) 2.1 ( ) 2.7 ( ) 34.0 ( ) 12.4 ( ) 5.0 ( ) 6.2 ( ) 7.0 ( ) 4.8 ( ) 1.3 ( ) 2.5 ( ) 3.4 ( ) 2.0 ( ) 26.7 ( ) 10.6 ( ) 8.7 ( ) 7.8 ( ) 5.0 ( ) 4.9 ( ) 6.2 ( ) 3.8 ( ) 2.0 ( ) 2.2 ( ) 18.9 ( ) 10.0 ( ) 9.8 ( ) 7.2 ( ) 4.2 ( ) 7.2 ( ) 10.3 ( ) 5.7 ( ) 2.5 ( ) 3.1 ( ) 21.8 ( ) 8.3 ( ) 11.5 ( ) 4.9 ( ) 6.3 ( ) 7.4 ( ) 5.3 ( ) 5.4 ( ) 2.6 ( ) 2.5 ( ) 28.0 ( ) 8.6 ( ) 11.2 ( ) 9.5 ( ) 5.7 ( ) 5.0 ( ) 4.2 ( ) 3.4 ( ) 2.6 ( ) 1.9 ( ) 29.2 ( ) 9.4 ( ) 10.5 ( ) 7.4 ( ) 8.3 ( ) 7.5 ( ) 2.0 ( ) 1.6 ( ) 3.3 ( ) 2.2 ( ) 31.7 ( ) ( ) 6.5 ( ) 6.7 ( ) 7.4 ( ) 7.8 ( ) 1.4 ( ) 2.4 ( ) 3.7 ( ) 2.8 ( ) Fish and seafood Breakfast cereals Sugar and sweets Potatoes, kumara and taro Pies and pasties Eggs and egg dishes Alcoholic beverages Savoury sauces and condiments Poultry Soups and stocks Puddings and desserts ( ) 9.2 ( ) 10.5 ( ) 7.6 ( ) 6.5 ( ) 6.6 ( ) 4.0 ( ) 3.4 ( ) 2.9 ( ) 2.3 ( ) 178 A Focus on Nutrition: Key Findings of the 2008/09 New Zealand Adult Nutrition Survey
207 Food group Total population Males Females Total Total Biscuits Beef and veal Sausages and processed meats Supplements providing energy Nuts and seeds Pork Snack bars Snack foods Lamb and mutton Butter and margarine Other meat Fats and oils Proportion of total nutrient intake obtained from each food group. Results for Māori, Pacific, NZEO and NZDep2006 are in the online data tables. For full food group definitions, see Table % confidence intervals are presented only for the top 10 food groups. A Focus on Nutrition: Key Findings of the 2008/09 New Zealand Adult Nutrition Survey 179
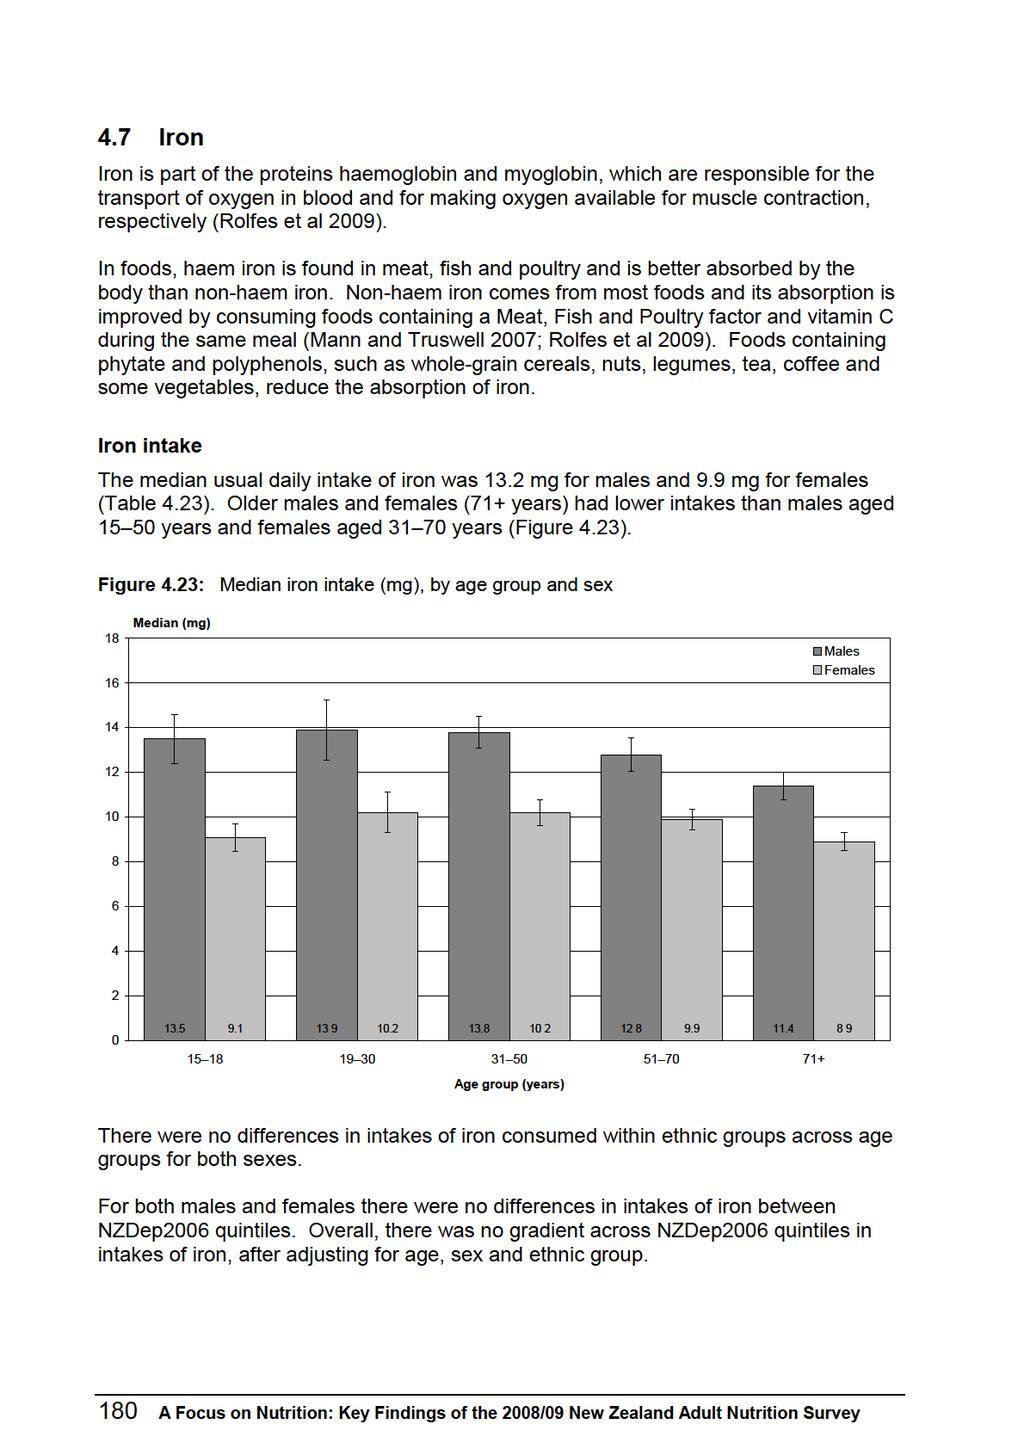
208
209
210 Table 4.23: Iron intake, by age group, ethnic group, NZDep2006 and sex Iron (mg) 1 Mean 10th 2 Median (50th), 2 (95% CI) 90th 2 Inadequate intake (%), (95% CI) 3 Total population ( ) By age group (years) Males ( ) * ( ) * ( ) ( ) ( ) * Total ( ) Females ( ) Māori ( ) * ( ) ( ) ( ) * Total ( ) Males ( ) * ( ) ( ) * ( ) * Total ( ) Females ( ) Pacific ( ) * ( ) ( ) * Total ( ) Males ( ) * ( ) * ( ) * ( ) * Total ( ) Females ( ) ( ) ( ) * ( ) * Total ( ) A Focus on Nutrition: Key Findings of the 2008/09 New Zealand Adult Nutrition Survey
211 NZEO Iron (mg) 1 Mean 10th 2 Median (50th), 2 (95% CI) 90th 2 Inadequate intake (%), (95% CI) 3 Males ( ) * ( ) ( ) * ( ) Total ( ) Females ( ) By NZDep2006 quintile ( ) ( ) * ( ) Total ( ) Males ( ) ( ) ( ) ( ) ( ) 21.4 Females ( ) ( ) ( ) ( ) ( ) Usual daily intake. These data were adjusted for intra-individual variation using PC-SIDE. 2 Percentiles. 3 Calculated by probability analysis (see Chapter 2). 4 NZDep2006 quintiles consist of a range of age groups. Because the requirements differ for each age group, an overall figure was not calculated. * Coefficient of variation of estimated inadequate intake is greater than 50% and confidence interval lies outside range (0 5%). Estimate should be interpreted with caution due to the high level of imprecision relative to the estimate A Focus on Nutrition: Key Findings of the 2008/09 New Zealand Adult Nutrition Survey 183
212 Table 4.24: Iron sources, percent (95% CI), 1 by age group, sex and food group Food group Total population Male Females Total Total Bread 11.5 ( ) Breakfast cereals 10.4 ( ) Vegetables 7.7 ( ) Grains and pasta 7.0 ( ) Beef and veal 6.8 ( ) Potatoes, kumara and taro 6.0 ( ) Bread-based dishes 5.3 ( ) Non-alcoholic beverages 5.2 ( ) Fruit 4.4 ( ) Poultry 4.0 ( ) 10.1 ( ) 11.8 ( ) 3.8 ( ) 6.5 ( ) 6.5 ( ) 8.4 ( ) 11.6 ( ) 4.0 ( ) 2.8 ( ) 5.1 ( ) 10.6 ( ) 8.8 ( ) 5.3 ( ) 9.3 ( ) 6.5 ( ) 6.0 ( ) 10.6 ( ) 4.7 ( ) 3.1 ( ) 4.7 ( ) 12.7 ( ) 8.7 ( ) 7.0 ( ) 7.3 ( ) 8.0 ( ) 6.0 ( ) 5.7 ( ) 4.3 ( ) 3.0 ( ) 4.9 ( ) 11.9 ( ) 14.3 ( ) 6.6 ( ) 6.6 ( ) 7.3 ( ) 5.7 ( ) 4.6 ( ) 4.8 ( ) 3.7 ( ) 3.4 ( ) 14.0 ( ) 13.2 ( ) 8.6 ( ) 7.1 ( ) 7.9 ( ) 5.8 ( ) 1.7 ( ) 4.0 ( ) 5.3 ( ) 1.9 ( ) 12.0 ( ) 10.9 ( ) 6.5 ( ) 7.4 ( ) 7.4 ( ) 6.1 ( ) 6.5 ( ) 4.5 ( ) 3.4 ( ) 4.2 ( ) 10.8 ( ) 9.2 ( ) 4.8 ( ) 7.9 ( ) 5.2 ( ) 7.5 ( ) 9.5 ( ) 5.4 ( ) 3.6 ( ) 5.1 ( ) 9.2 ( ) 7.9 ( ) 7.6 ( ) 8.6 ( ) 4.1 ( ) 7.2 ( ) 5.8 ( ) 6.3 ( ) 4.1 ( ) 4.9 ( ) 11.2 ( ) 9.7 ( ) 8.6 ( ) 6.6 ( ) 7.0 ( ) 5.7 ( ) 4.5 ( ) 6.4 ( ) 5.1 ( ) 4.0 ( ) 11.2 ( ) 11.2 ( ) 10.6 ( ) 4.9 ( ) 7.0 ( ) 4.9 ( ) 2.1 ( ) 5.3 ( ) 6.4 ( ) 2.8 ( ) 14.4 ( ) 12.7 ( ) 9.4 ( ) 5.6 ( ) 7.1 ( ) 5.0 ( ) 1.4 ( ) 5.2 ( ) 6.9 ( ) 2.2 ( ) Fish and seafood Savoury sauces and condiments Eggs and egg dishes Cakes and muffins Pork Pies and pasties Sausages and processed meats Sugar and sweets Biscuits Soups and stocks Lamb and mutton Nuts and seeds Alcoholic beverages ( ) 10.0 ( ) 8.8 ( ) 6.5 ( ) 6.3 ( ) 5.8 ( ) 4.1 ( ) 5.9 ( ) 5.3 ( ) 3.8 ( ) 184 A Focus on Nutrition: Key Findings of the 2008/09 New Zealand Adult Nutrition Survey
213 Food group Total population Male Females Total Total Snack bars Other meat Milk Puddings and desserts Snack foods Supplements providing energy Dairy products Cheese Butter and margarine Fats and oils Proportion of total nutrient intake obtained from each food group. Results for Māori, Pacific, NZEO and NZDep2006 are in the online data tables. For full food group definitions, see Table % confidence intervals are presented only for the top 10 food groups. A Focus on Nutrition: Key Findings of the 2008/09 New Zealand Adult Nutrition Survey 185
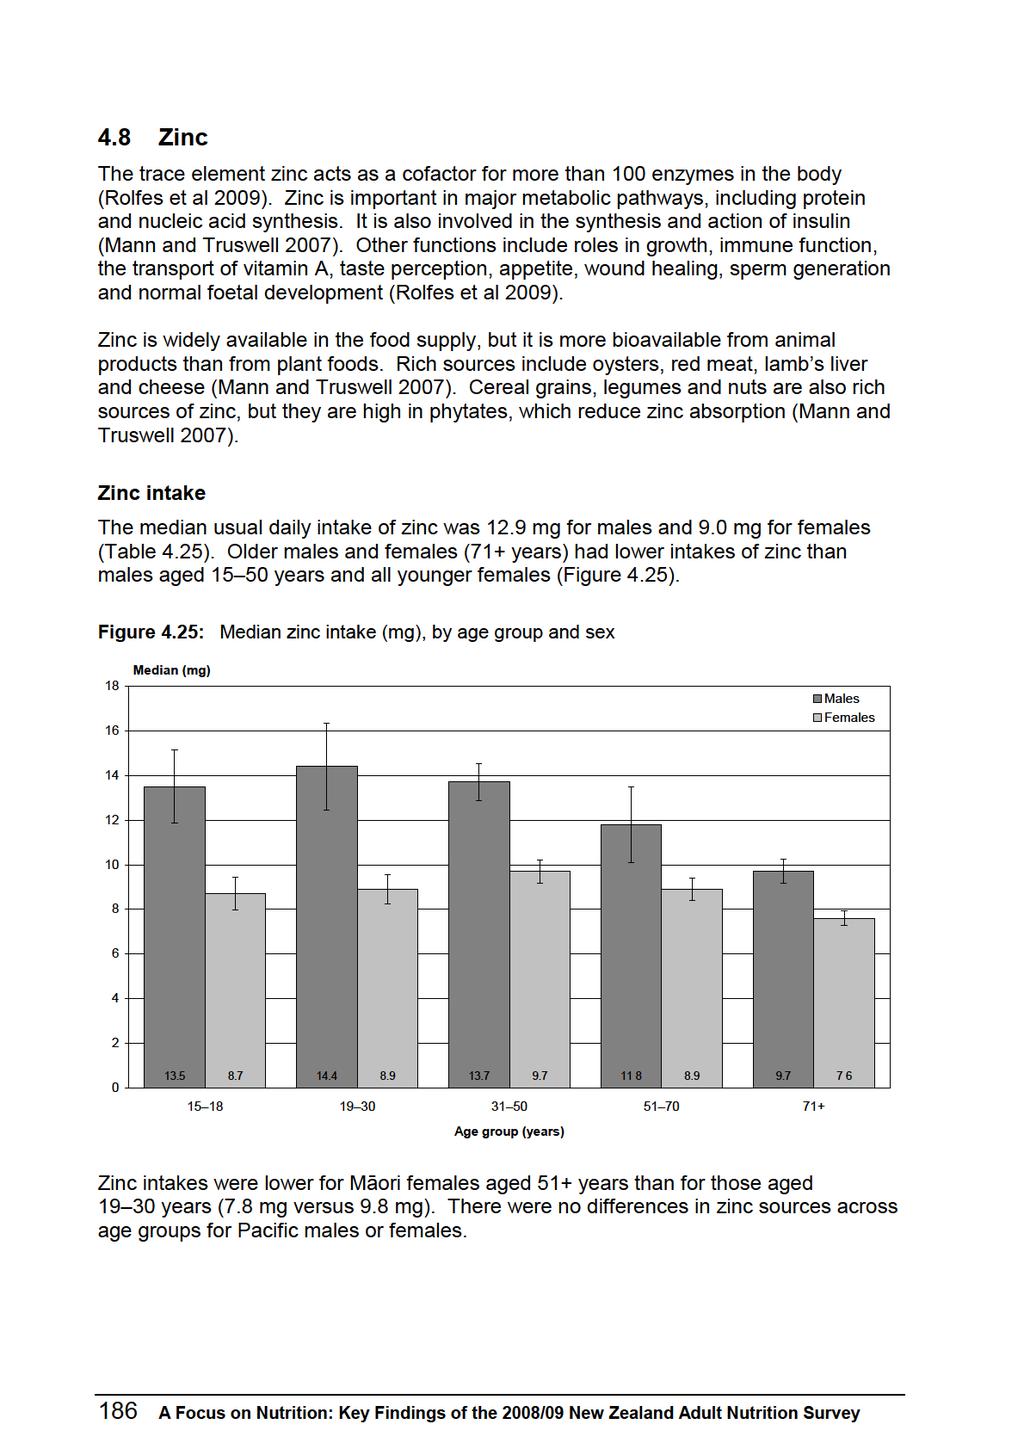
214
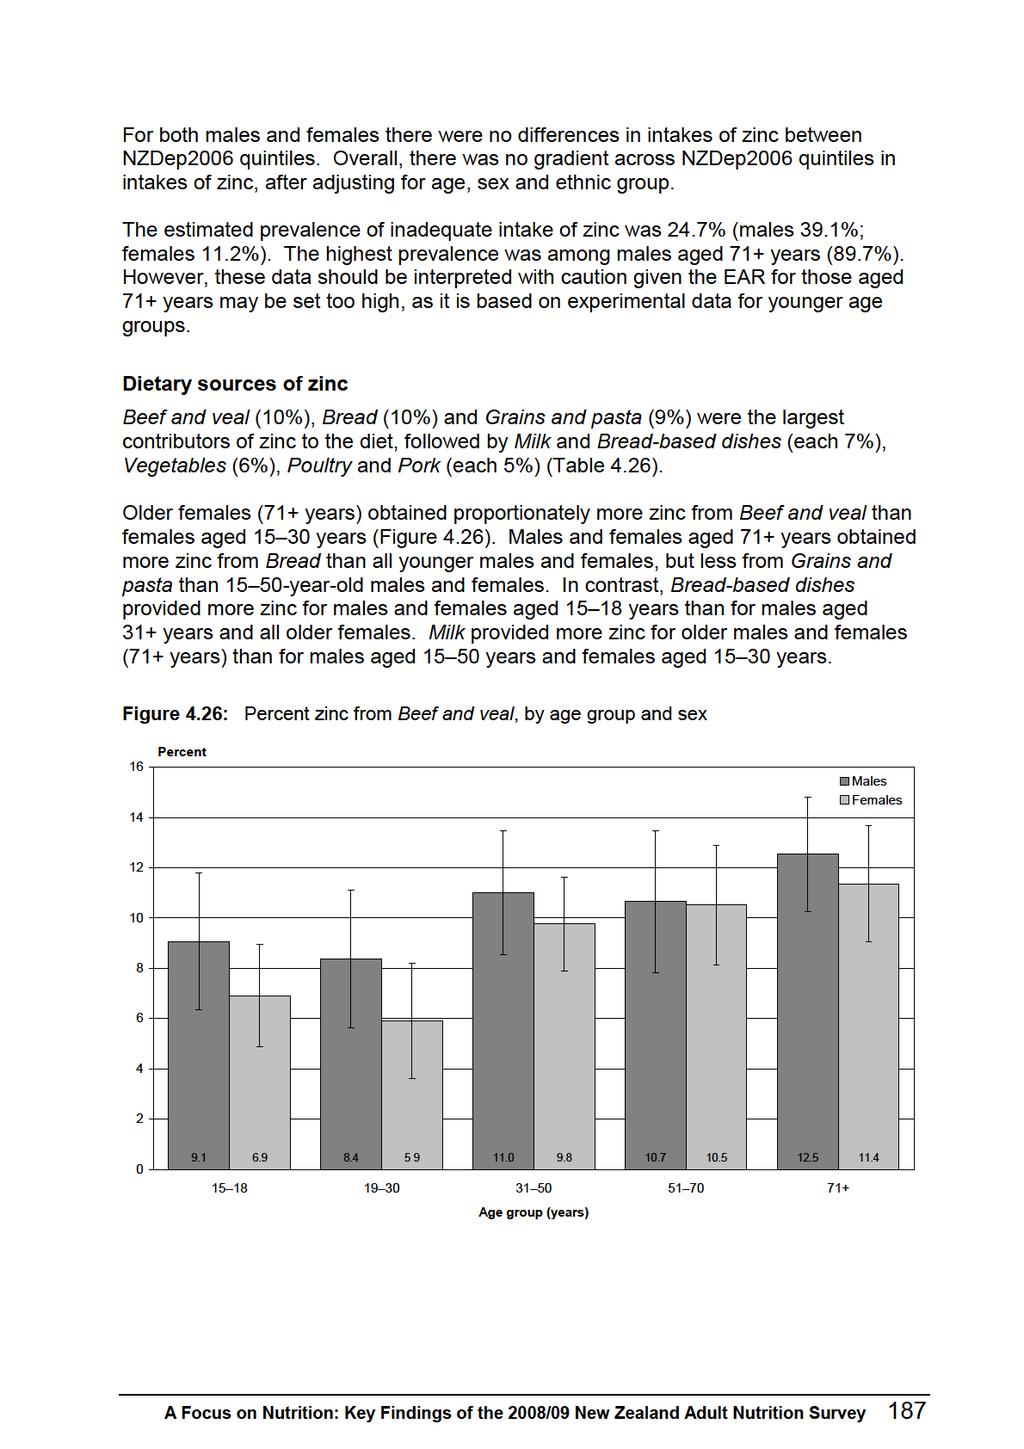
215
216 Table 4.25: Zinc intake, by age group, ethnic group, NZDep2006 and sex Zinc (mg) 1 Mean 10th 2 Median (50th), 2 (95% CI) 90th 2 Inadequate intake (%), (95% CI) 3 Total population ( ) By age group (years) Males ( ) * ( ) * ( ) ( ) ( ) Total ( ) Females ( ) * Māori ( ) ( ) * ( ) * ( ) Total ( ) Males ( ) ( ) * ( ) ( ) Total ( ) Females ( ) Pacific ( ) * ( ) ( ) * Total ( ) Males ( ) * ( ) ( ) ( ) Total ( ) Females ( ) * ( ) ( ) * ( ) * Total ( ) A Focus on Nutrition: Key Findings of the 2008/09 New Zealand Adult Nutrition Survey
217 Zinc (mg) 1 Mean 10th 2 Median (50th), 2 (95% CI) 90th 2 Inadequate intake (%), (95% CI) 3 NZEO Males ( ) * ( ) * ( ) ( ) Total ( ) Females ( ) * ( ) ( ) * ( ) Total ( ) By NZDep2006 quintile Males ( ) ( ) ( ) ( ) ( ) 21.2 Females ( ) ( ) ( ) ( ) ( ) Usual daily intake. These data were adjusted for intra-individual variation using PC-SIDE. 2 Percentiles. 3 Calculated by probability analysis (see Chapter 2). 4 NZDep2006 quintiles consist of a range of age groups. Because the requirements differ for each age group, an overall figure was not calculated. * Coefficient of variation of estimated inadequate intake is greater than 50% and confidence interval lies outside range (0 5%). Estimate should be interpreted with caution due to the high level of imprecision relative to the estimate. A Focus on Nutrition: Key Findings of the 2008/09 New Zealand Adult Nutrition Survey 189
218 Table 4.26: Zinc sources, percent (95% CI), 1 by age group, sex and food group Food group Total population Male Females Total Total Beef and veal 9.8 ( ) Bread 9.5 ( ) Grains and pasta 9.3 ( ) Milk 7.4 ( ) Bread-based dishes 6.6 ( ) Vegetables 5.6 ( ) Poultry 5.4 ( ) Pork 4.5 ( ) Potatoes, kumara and taro Non-alcoholic beverages 4.3 ( ) 3.7 ( ) 9.1 ( ) 8.2 ( ) 9.6 ( ) 6.1 ( ) 14.3 ( ) 2.8 ( ) 6.5 ( ) 4.7 ( ) 5.7 ( ) 2.9 ( ) 8.4 ( ) 8.0 ( ) 13.0 ( ) 5.1 ( ) 13.0 ( ) 3.5 ( ) 5.2 ( ) 5.6 ( ) 4.0 ( ) 3.4 ( ) 11.0 ( ) 10.1 ( ) 9.5 ( ) 6.7 ( ) 7.2 ( ) 5.2 ( ) 6.4 ( ) 4.2 ( ) 4.3 ( ) 3.0 ( ) 10.7 ( ) 10.1 ( ) 8.6 ( ) 8.1 ( ) 5.3 ( ) 4.8 ( ) 4.8 ( ) 6.2 ( ) 4.4 ( ) 3.3 ( ) 12.5 ( ) 12.8 ( ) 5.3 ( ) 9.3 ( ) 2.1 ( ) 6.9 ( ) 3.2 ( ) 6.4 ( ) 4.4 ( ) 2.9 ( ) 10.4 ( ) 9.8 ( ) 9.6 ( ) 6.9 ( ) 8.0 ( ) 4.7 ( ) 5.4 ( ) 5.3 ( ) 4.4 ( ) 3.2 ( ) 6.9 ( ) 8.8 ( ) 12.1 ( ) 5.3 ( ) 12.6 ( ) 3.3 ( ) 6.0 ( ) 3.2 ( ) 5.3 ( ) 3.8 ( ) 5.9 ( ) 7.6 ( ) 12.9 ( ) 6.6 ( ) 7.4 ( ) 5.3 ( ) 6.9 ( ) 3.6 ( ) 5.3 ( ) 4.3 ( ) 9.8 ( ) 9.0 ( ) 9.2 ( ) 8.1 ( ) 5.5 ( ) 6.0 ( ) 5.4 ( ) 3.8 ( ) 4.0 ( ) 4.4 ( ) 10.5 ( ) 9.6 ( ) 6.5 ( ) 8.5 ( ) 2.7 ( ) 8.2 ( ) 4.3 ( ) 4.1 ( ) 3.4 ( ) 4.2 ( ) 11.4 ( ) 12.8 ( ) 5.1 ( ) 9.7 ( ) 1.8 ( ) 7.2 ( ) 3.9 ( ) 4.3 ( ) 3.8 ( ) 4.0 ( ) Breakfast cereals Cheese Sausages and processed meats Pies and pasties Fish and seafood Lamb and mutton Fruit Eggs and egg dishes Dairy products Cakes and muffins Nuts and seeds Biscuits Sugar and sweets ( ) 9.3 ( ) 9.0 ( ) 7.9 ( ) 5.2 ( ) 6.4 ( ) 5.3 ( ) 3.9 ( ) 4.2 ( ) 4.2 ( ) 190 A Focus on Nutrition: Key Findings of the 2008/09 New Zealand Adult Nutrition Survey
219 Food group Total population Male Females Total Total Savoury sauces and condiments Soups and stocks Snack bars Other meat Alcoholic beverages Puddings and desserts Snack foods Supplements providing energy Butter and margarine Fats and oils Proportion of total nutrient intake obtained from each food group. Results for Māori, Pacific, NZEO and NZDep2006 are in the online data tables. For full food group definitions, see Table % confidence intervals are presented only for the top 10 food groups. A Focus on Nutrition: Key Findings of the 2008/09 New Zealand Adult Nutrition Survey 191
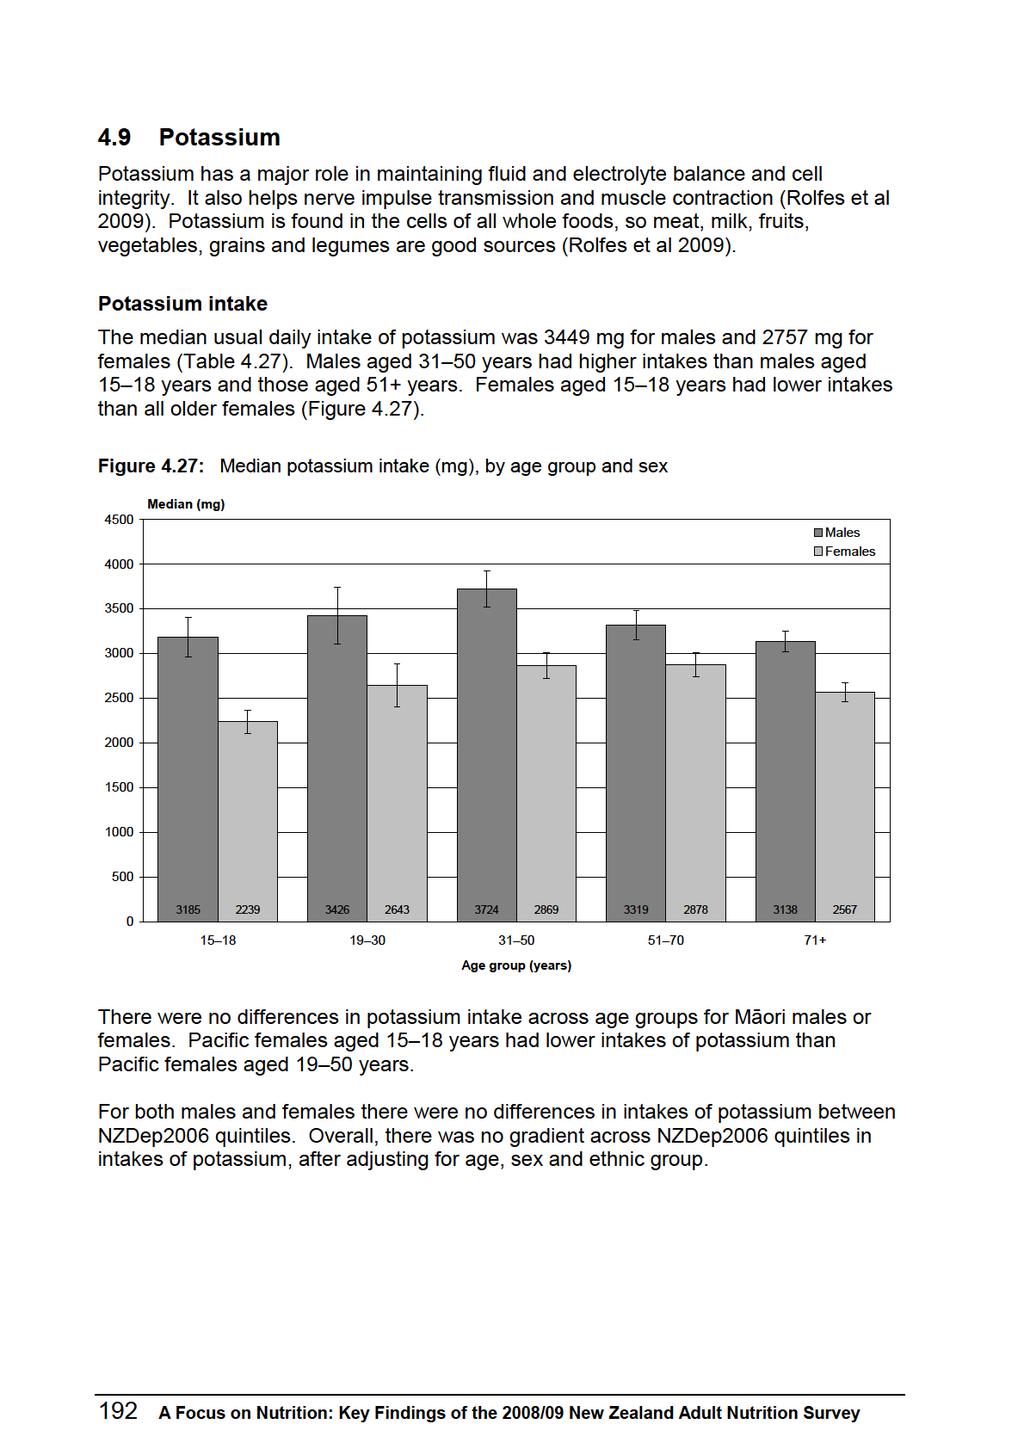
220
221
222 Table 4.27: Potassium intake, by age group, ethnic group, NZDep2006 and sex Potassium (mg) 1 Mean 10th 2 Median (50th), 2 (95% CI) 90th 2 Total population ( ) 4317 By age group (years) Males ( ) ( ) ( ) ( ) ( ) 4134 Total ( ) 4690 Females ( ) ( ) ( ) ( ) ( ) 3564 Total ( ) 3751 Māori Males ( ) ( ) ( ) ( ) 4168 Total ( ) 4137 Females ( ) ( ) ( ) ( ) 3538 Total ( ) 3708 Pacific Males ( ) ( ) ( ) ( ) 5095 Total ( ) 5239 Females ( ) ( ) ( ) ( ) 3861 Total ( ) A Focus on Nutrition: Key Findings of the 2008/09 New Zealand Adult Nutrition Survey
223 Potassium (mg) 1 Mean 10th 2 Median (50th), 2 (95% CI) 90th 2 NZEO Males ( ) ( ) ( ) ( ) 4376 Total ( ) 4652 Females ( ) ( ) ( ) ( ) 3793 Total ( ) 3802 By NZDep2006 quintile Males ( ) ( ) ( ) ( ) ( ) 4760 Females ( ) ( ) ( ) ( ) ( ) Usual daily intake. These data were adjusted for the intra-individual variation using PC-SIDE. 2 Percentiles. A Focus on Nutrition: Key Findings of the 2008/09 New Zealand Adult Nutrition Survey 195
224 Table 4.28: Potassium sources, percent (95% CI), 1 by age group, sex and food group Food group Total population Male Females Total Total Potatoes, kumara and taro 12.7 ( ) Vegetables 11.6 ( ) Non-alcoholic beverages 9.9 ( ) Milk 9.8 ( ) Fruit 9.8 ( ) Bread 5.5 ( ) Grains and pasta 3.9 ( ) Bread-based dishes 3.7 ( ) Beef and veal 3.6 ( ) Poultry 3.5 ( ) 17.6 ( ) 5.3 ( ) 4.9 ( ) 9.7 ( ) 7.2 ( ) 5.8 ( ) 4.8 ( ) 9.3 ( ) 4.0 ( ) 4.8 ( ) 13.1 ( ) 7.9 ( ) 8.9 ( ) 8.0 ( ) 7.2 ( ) 5.2 ( ) 6.0 ( ) 8.0 ( ) 4.1 ( ) 4.2 ( ) 12.5 ( ) 10.8 ( ) 9.8 ( ) 9.3 ( ) 7.6 ( ) 6.4 ( ) 4.0 ( ) 3.7 ( ) 4.5 ( ) 4.5 ( ) 13.0 ( ) 10.8 ( ) 10.4 ( ) 10.6 ( ) 8.8 ( ) 5.6 ( ) 3.5 ( ) 3.2 ( ) 4.0 ( ) 3.1 ( ) 14.0 ( ) 13.5 ( ) 8.0 ( ) 11.0 ( ) 12.5 ( ) 6.5 ( ) 2.7 ( ) 1.0 ( ) 3.9 ( ) 1.6 (1.2 2) 13.3 ( ) 10.0 ( ) 9.2 ( ) 9.6 ( ) 8.2 ( ) 5.9 ( ) 4.2 ( ) 4.7 ( ) 4.2 ( ) 3.8 ( ) 16.1 ( ) 7.6 ( ) 7.4 ( ) 8.5 ( ) 9.0 ( ) 5.6 ( ) 5.0 ( ) 7.3 ( ) 3.2 ( ) 4.6 ( ) 14.8 ( ) 11.4 ( ) 9.2 ( ) 8.3 ( ) 9.2 ( ) 4.6 ( ) 5.7 ( ) 4.0 ( ) 2.3 ( ) 4.3 ( ) 11.5 ( ) 12.2 ( ) 11.8 ( ) 10.8 ( ) 10.1 ( ) 5.0 ( ) 3.7 ( ) 3.1 ( ) 3.4 ( ) 3.4 ( ) 10.3 ( ) 16.2 ( ) 10.6 ( ) 9.9 ( ) 13.3 ( ) 4.8 ( ) 2.1 ( ) 1.3 ( ) 3.4 ( ) 2.3 ( ) 11.5 ( ) 14.5 ( ) 9.4 ( ) 11.1 ( ) 14.6 ( ) 6.5 ( ) 2.3 ( ) 0.8 ( ) 3.0 ( ) 1.7 ( ) Fish and seafood Pork Dairy products Breakfast cereals Alcoholic beverages Savoury sauces and condiments Soups and stocks Cakes and muffins Pies and pasties ( ) 13.0 ( ) 10.4 ( ) 9.9 ( ) 11.2 ( ) 5.1 ( ) 3.6 ( ) 2.8 ( ) 3.1 ( ) 3.2 ( ) Sugar and sweets Sausages and processed meats Eggs and egg dishes A Focus on Nutrition: Key Findings of the 2008/09 New Zealand Adult Nutrition Survey
225 Food group Total population Male Females Total Total Nuts and seeds Biscuits Lamb and mutton Puddings and desserts Snack bars Cheese Supplements providing energy Snack foods Other meat Butter and margarine Fats and oils Proportion of total nutrient intake obtained from each food group. Results for Māori, Pacific, NZEO and NZDep2006 are in the online data tables. For full food group definitions see Table % confidence intervals are presented only for the top 10 food groups. A Focus on Nutrition: Key Findings of the 2008/09 New Zealand Adult Nutrition Survey 197
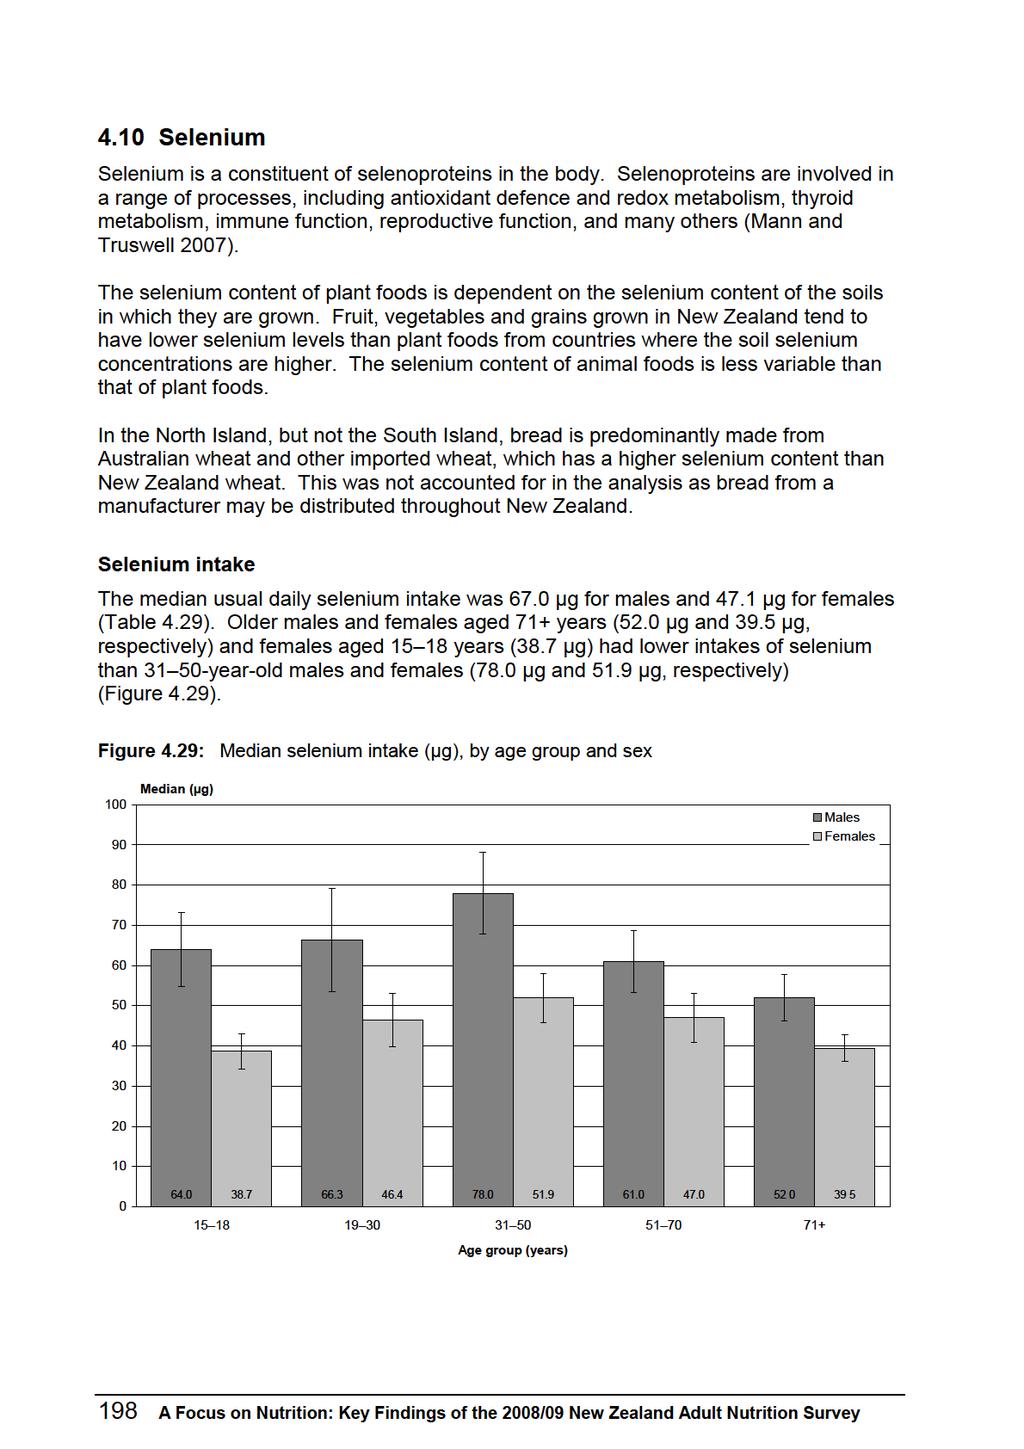
226
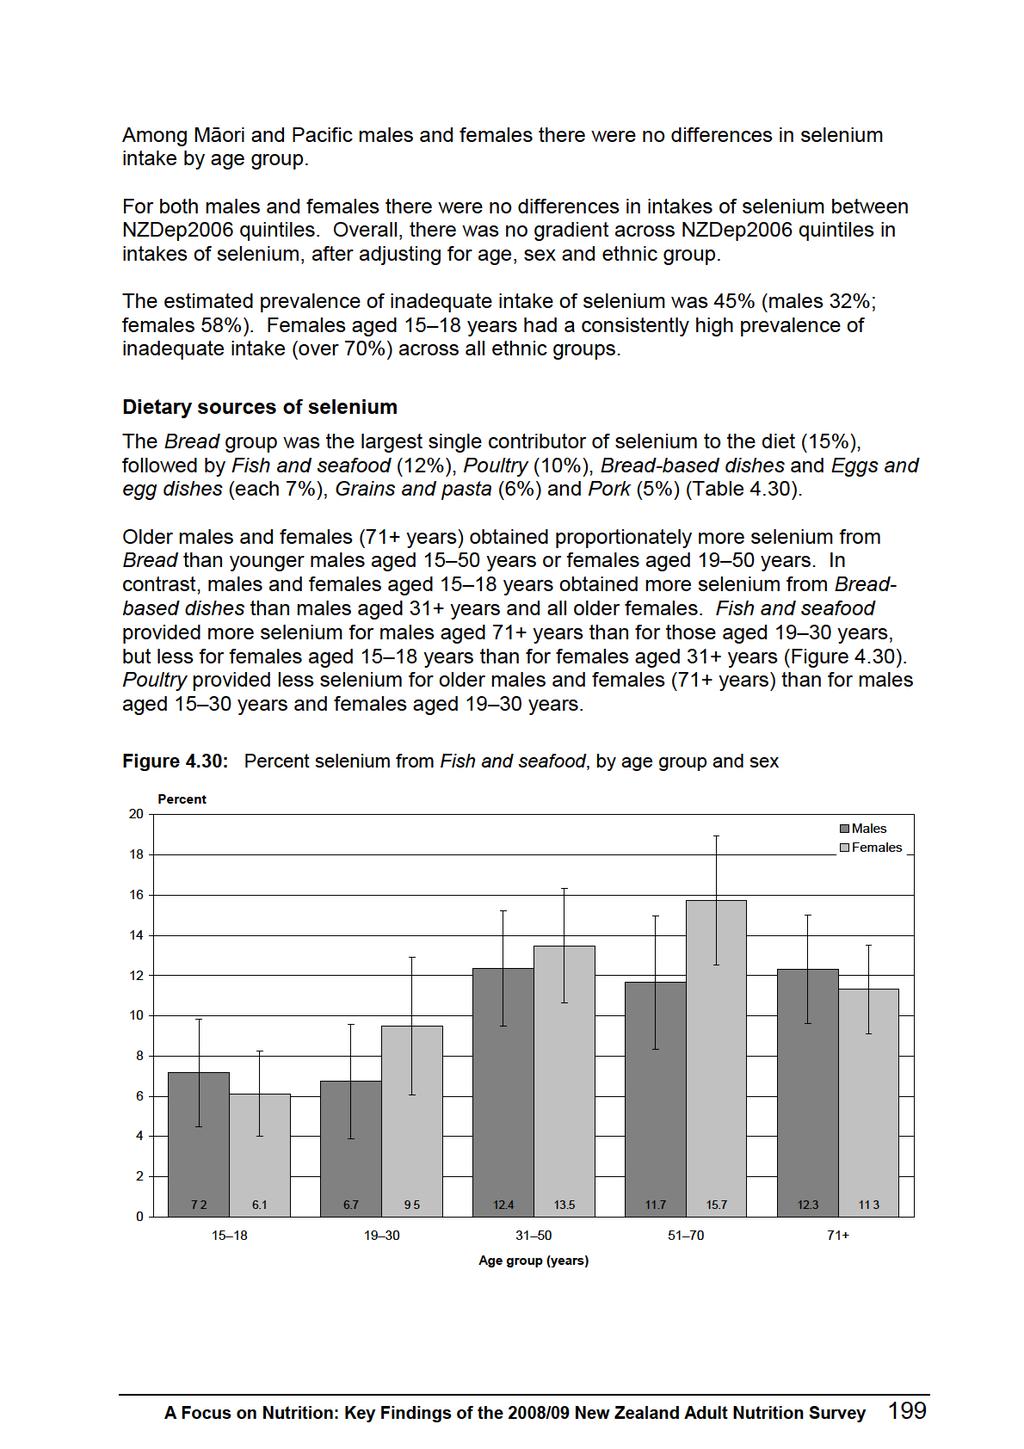
227
228 Table 4.29: Selenium intake, by age group, ethnic group, NZDep2006 and sex Selenium (mg) 1 Mean 10th 2 Median (50th), 2 (95% CI) 90th 2 Inadequate intake (%), (95% CI) 3 Total population ( ) By age group (years) Males ( ) ( ) * ( ) * ( ) ( ) Total ( ) Females ( ) Māori ( ) ( ) ( ) ( ) Total ( ) Males ( ) ( ) ( ) ( ) * Total ( ) * Females ( ) Pacific ( ) ( ) ( ) Total ( ) Males ( ) * ( ) ( ) ( ) Total ( ) Females ( ) ( ) ( ) ( ) Total ( ) A Focus on Nutrition: Key Findings of the 2008/09 New Zealand Adult Nutrition Survey
229 NZEO Selenium (mg) 1 Mean 10th 2 Median (50th), 2 (95% CI) 90th 2 Inadequate intake (%), (95% CI) 3 Males ( ) ( ) ( ) * ( ) Total ( ) Females ( ) By NZDep2006 quintile ( ) ( ) ( ) Total ( ) Males ( ) ( ) ( ) ( ) ( ) Females ( ) ( ) ( ) ( ) ( ) Usual daily intake. These data were adjusted for intra-individual variation using PC-SIDE. 2 Percentiles. 3 Calculated by probability analysis (see Chapter 2). 4 NZDep2006 quintiles consist of a range of age groups. Because the requirements differ for each age group, an overall figure was not calculated. * Coefficient of variation of estimated inadequate intake is greater than 50% and confidence interval lies outside range (0 5%). Estimate should be interpreted with caution due to the high level of imprecision relative to the estimate A Focus on Nutrition: Key Findings of the 2008/09 New Zealand Adult Nutrition Survey 201
230 Table 4.30: Selenium sources, percent (95% CI), 1 by age group, sex and food group Food group Total population Male Females Total Total Bread 15.1 ( ) Fish and seafood 11.6 ( ) Poultry 9.6 ( ) Bread-based dishes 6.7 ( ) Eggs and egg dishes 6.6 ( ) Grains and pasta 5.7 ( ) Pork 5.2 ( ) Milk 4.4 ( ) Beef and veal 3.9 ( ) Vegetables 3.2 ( ) 14.4 ( ) 7.2 ( ) 11.6 (9 14.3) 14.0 ( ) 6.2 ( ) 5.8 ( ) 5.2 ( ) 3.7 ( ) 3.5 ( ) 2.7 ( ) 14.4 ( ) 6.7 ( ) 10.9 ( ) 12.0 ( ) 4.9 ( ) 8.4 ( ) 7.4 ( ) 3.2 ( ) 3.2 ( ) 1.8 ( ) 15.3 ( ) 12.4 ( ) 11.2 ( ) 6.5 ( ) 6.6 ( ) 5.5 ( ) 4.9 ( ) 3.8 ( ) 4.4 ( ) 3.6 ( ) 15.9 ( ) 11.7 ( ) 8.2 ( ) 6.3 ( ) 7.6 ( ) 4.9 ( ) 6.2 ( ) 4.7 (4 5.4) 4.5 ( ) 2.1 ( ) 19.6 ( ) 12.3 ( ) 5.2 ( ) 2.7 ( ) 7.3 ( ) 3.2 ( ) 6.3 ( ) 5.1 ( ) 5.2 ( ) 3.4 ( ) 15.6 ( ) 10.6 ( ) 9.8 ( ) 7.8 ( ) 6.6 ( ) 5.7 ( ) 5.9 ( ) 4.0 ( ) 4.2 ( ) 2.8 ( ) 16.0 ( ) 6.1 ( ) 11.0 ( ) 12.9 ( ) 4.1 ( ) 8.8 ( ) 4.2 ( ) 4.2 ( ) 3.5 ( ) 2.0 ( ) 12.5 ( ) 9.5 ( ) 12.8 ( ) 7.3 ( ) 8.2 ( ) 8.1 ( ) 3.3 ( ) 4.3 ( ) 2.3 ( ) 3.8 ( ) 13.5 ( ) 13.5 ( ) 9.7 ( ) 6.1 ( ) 5.6 ( ) 6.2 ( ) 4.8 ( ) 5.2 ( ) 3.9 ( ) 3.7 ( ) 15.8 ( ) 15.7 ( ) 6.9 ( ) 3.0 ( ) 6.8 ( ) 3.3 ( ) 4.9 ( ) 4.8 ( ) 3.8 ( ) 3.8 ( ) 19.2 ( ) 11.3 ( ) 6.5 ( ) 2.0 ( ) 8.2 ( ) 3.1 ( ) 5.5 ( ) 5.2 ( ) 4.7 ( ) 3.8 ( ) Breakfast cereals Non-alcoholic beverages Pies and pasties Sausages and processed meats Cakes and muffins Cheese Fruit Potatoes, kumara and taro Nuts and seeds Lamb and mutton Soups and stocks Dairy products ( ) 12.6 ( ) 9.3 ( ) 5.6 ( ) 6.6 ( ) 5.6 ( ) 4.6 ( ) 4.8 ( ) 3.6 ( ) 3.7 ( ) 202 A Focus on Nutrition: Key Findings of the 2008/09 New Zealand Adult Nutrition Survey
231 Food group Total population Male Females Total Total Savoury sauces and condiments Biscuits Alcoholic beverages Puddings and desserts Sugar and sweets Other meat Snack bars Butter and margarine Snack foods Supplements providing energy Fats and oils Proportion of total nutrient intake obtained from each food group. Results for Māori, Pacific, NZEO and NZDep2006 are in the online data tables. For full food group definitions, see Table % confidence intervals are presented only for the top 10 food groups. A Focus on Nutrition: Key Findings of the 2008/09 New Zealand Adult Nutrition Survey 203
232 5 Dietary Supplements For the purposes of this survey, dietary supplements were products the participant considered or intended as a supplement to their diet. This included both prescribed and self-selected supplements in a variety of forms, such as tablets, capsules, powders and liquid preparations. Supplements included, individually or in combination: vitamins, minerals, herbal and botanical preparations, oils such as fish oil, and products providing glucosamine and/or chondroitin. Participants were asked to recall the supplements they had consumed at any time in the past year. Details of each supplement were recorded using the product container whenever possible to enable a detailed description. For each supplement the frequency with which it was consumed was also recorded. Using label information and/or website product information, supplements were grouped into the following categories: oils includes fish oils, omega 3 products (alone or plus omega 6 and 9), flax/linseed oil, evening primrose oil multi-vitamins and multi-minerals herbal-plus (vitamin and/or mineral) includes echinacea plus vitamin C, gingko plus multi-vitamins/multi-minerals, nettle plus B vitamins and iron single vitamin single mineral botanicals includes garlic, echinacea, gingko, ginseng, guarana; plant extracts (from, eg, parsley, thistle, hops, motherwort); roots (of, eg, ginger, gentian, black cohosh); seaweeds and algae (eg, kelp, spirulina) multi-vitamins multi-minerals glucosamine/chrondroitin bee products sport supplements weight management other supplements includes green mussel powder, co-enzyme Q10, deer velvet, colloidal silver, freeze-dried stag blood. Participants were considered Regular users if they had consumed at least one supplement: daily, more than once per week or once per week. Any consumption less than once per week was classified as Occasional use. 204 A Focus on Nutrition: Key Findings of the 2008/09 New Zealand Adult Nutrition Survey
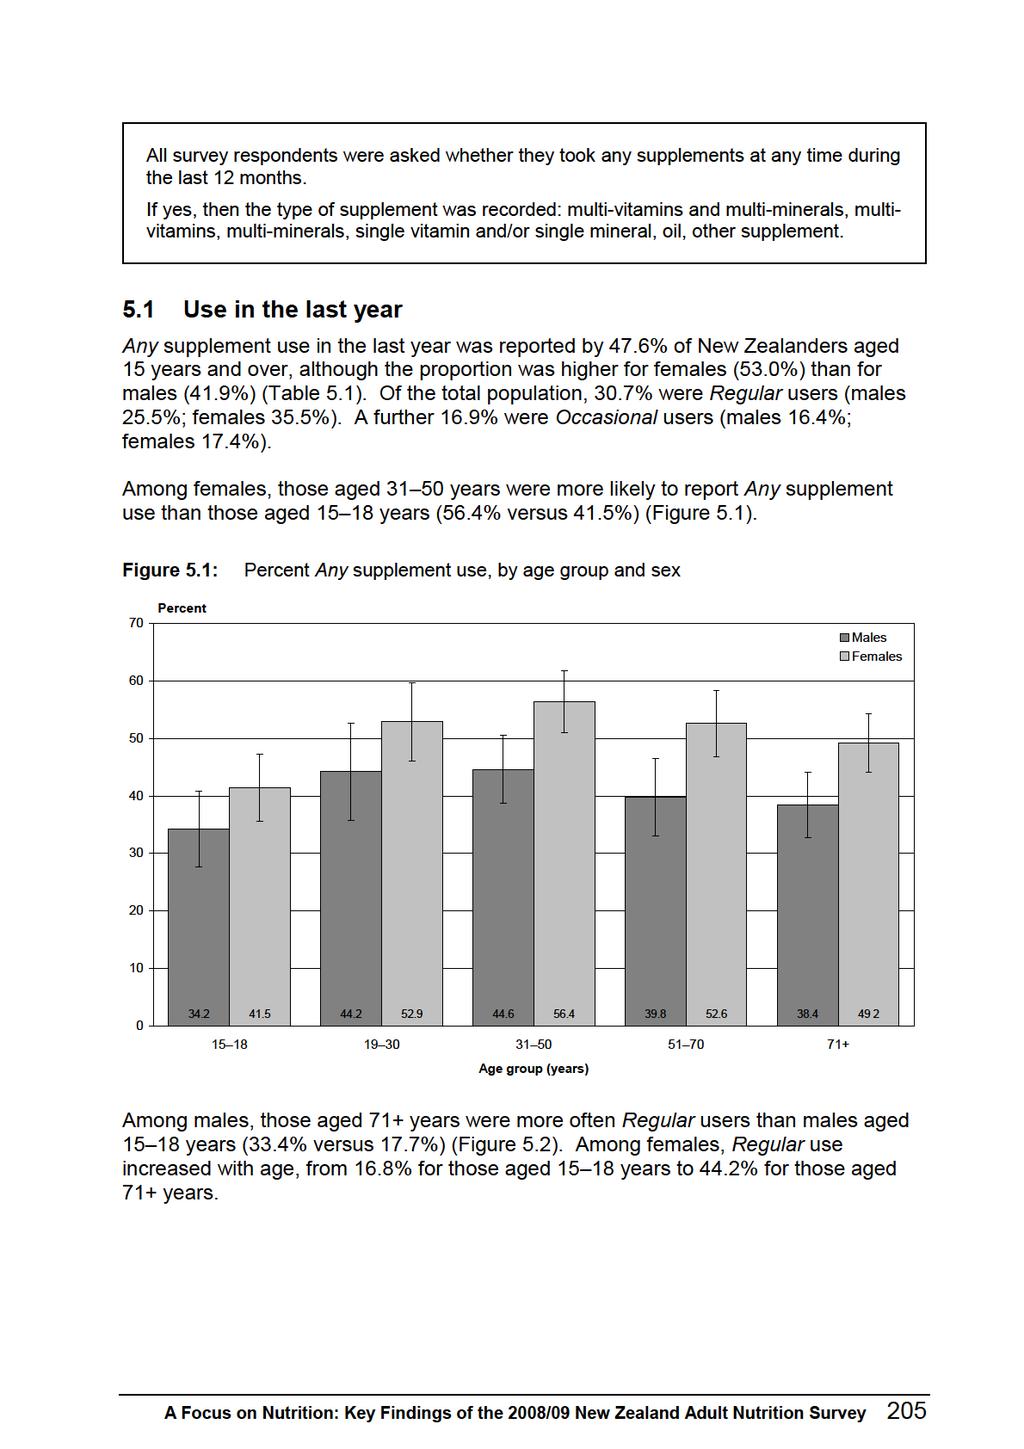
233
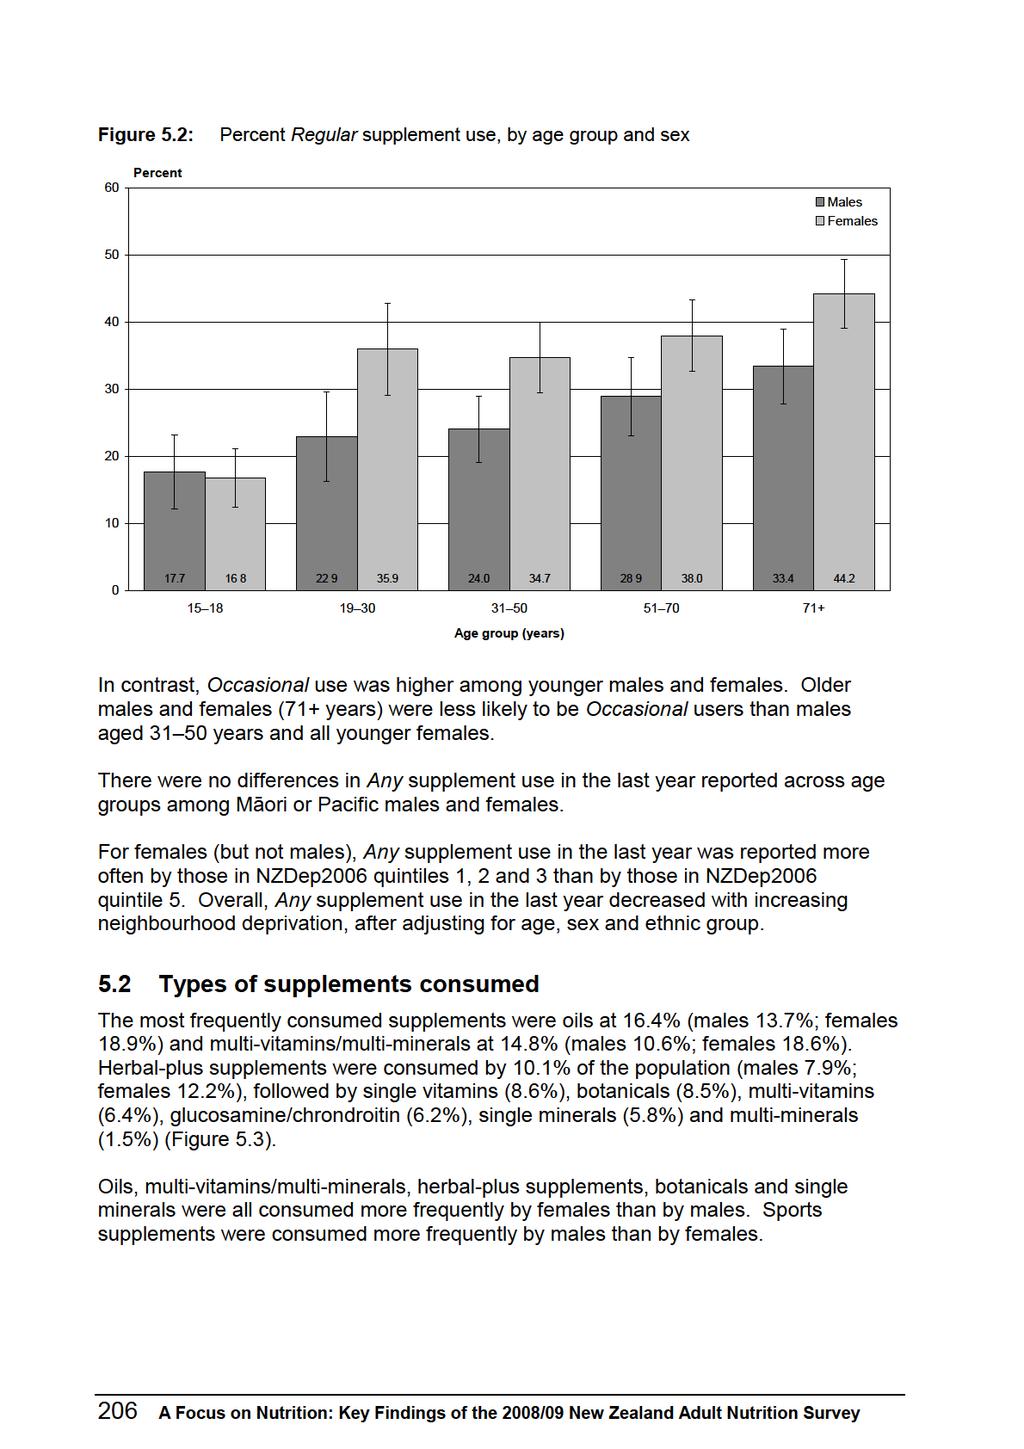
234
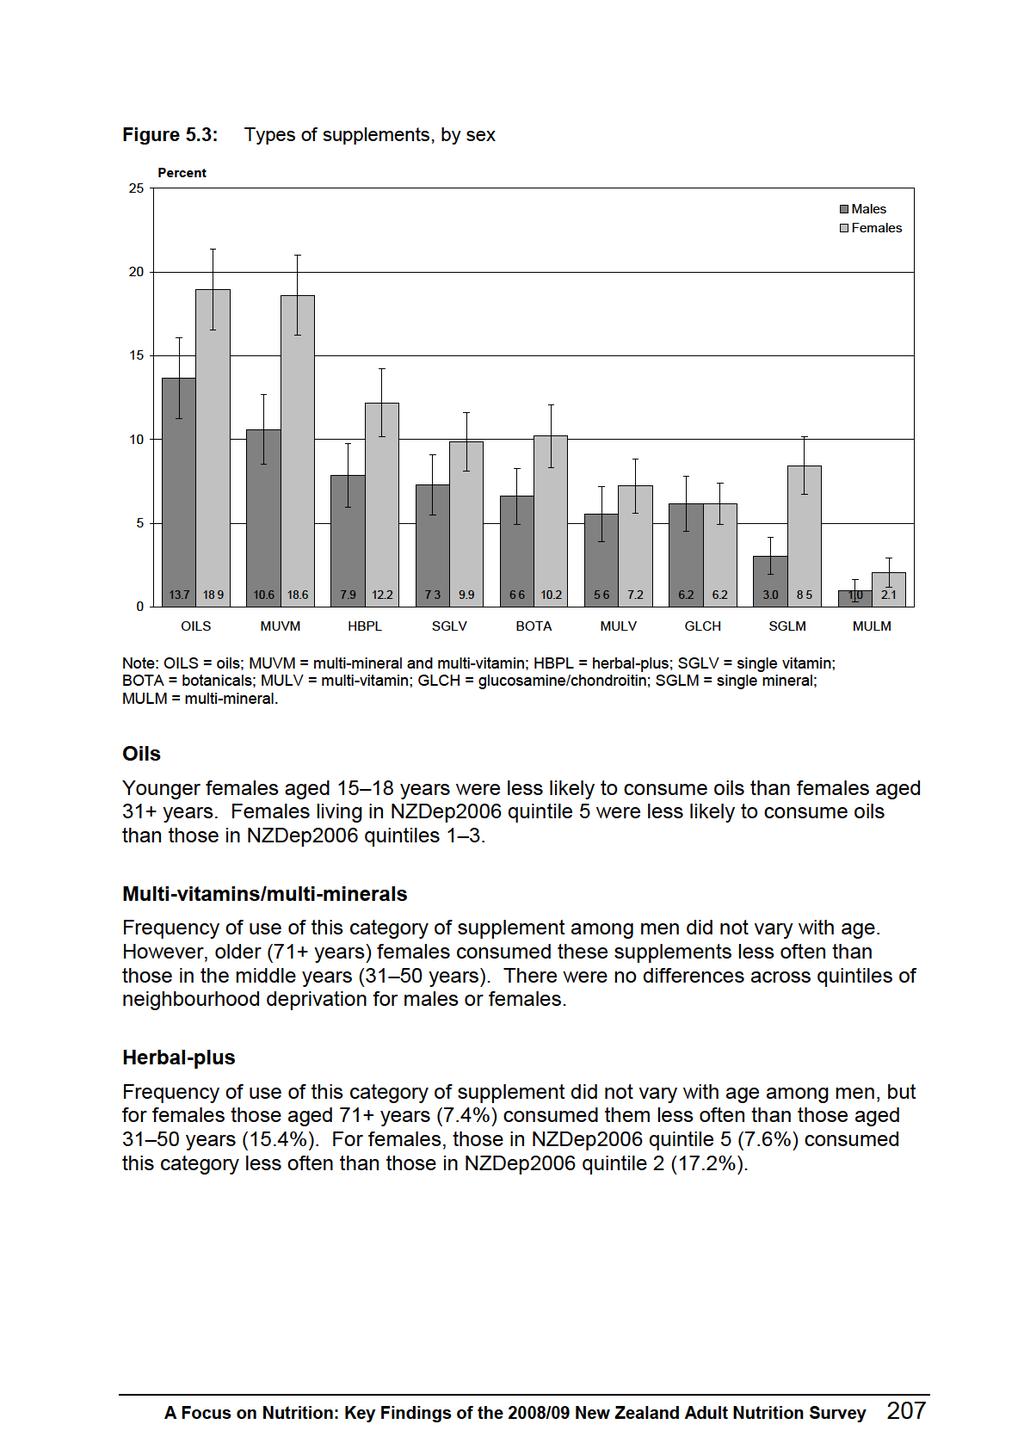
235
236 Single vitamins Frequency of use by males did not vary across age groups, but females aged 71+ years (5.5%) consumed them less frequently than females aged years (11.6%). Among females, those living in NZDep2006 quintile 5 consumed them less frequently than those in NZDep2006 quintiles 2 4. Botanicals Frequency of use by males did not vary across age groups. Females aged years consumed botanicals less frequently than females aged years. There were no differences for females or males across NZDep2006 quintiles. Multi-vitamins Frequency of use by males aged 71+ years (2.2%) was less than for men aged years (7.1%). There were no differences across age groups for females, or across NZDep2006 quintiles for males or females. Glucosamine/chrondroitin This category of supplements was consumed more frequently by older age groups. Among males, those aged 71+ years consumed them more frequently than males aged years. Among females, those aged 51+ years consumed them more frequently than did all younger females. There were no differences in the use of this category of supplements across NZDep2006 quintiles. Single minerals There were no differences across age groups for males or females. Males living in NZDep2006 quintile 5 (0.5%) consumed single minerals less frequently than males living in NZDep2006 quintile 3 (5.9%). Females living in NZDep2006 quintile 4 consumed single minerals less frequently than those in all other NZDep2006 quintiles. Multi-minerals Males aged years consumed multi-minerals more frequently than males aged years, but there were no differences across age groups among females. Females living in NZDep2006 quintile 2 (3.8%) consumed multi-minerals more frequently than those living in NZDep2006 quintile 5 (0.6%). 208 A Focus on Nutrition: Key Findings of the 2008/09 New Zealand Adult Nutrition Survey
237 Table 5.1: Dietary supplement use, by age group, ethnic group, NZDep2006 and sex Frequency of supplement use (%), (95% CI) Consumers in last year 1 Regular 2 Occasional 3 Total population 47.6 ( ) 30.7 ( ) 16.9 ( ) By age group (years) Males ( ) 17.7 ( ) 16.5 ( ) ( ) 22.9 ( ) 21.3 ( ) ( ) 24.0 ( ) 20.6 ( ) ( ) 28.9 ( ) 10.9 ( ) ( ) 33.4 ( ) 5.0 ( ) Total 41.9 ( ) 25.5 ( ) 16.4 ( ) Females ( ) 16.8 ( ) 24.6 ( ) ( ) 35.9 ( ) 17.0 ( ) ( ) 34.7 ( ) 21.7 ( ) ( ) 38.0 ( ) 14.6 ( ) ( ) 44.2 ( ) 5.0 ( ) Total 53.0 ( ) 35.5 ( ) 17.4 ( ) Māori Males ( ) 10.3 ( ) 10.2 ( ) ( ) 8.2 ( ) 15.8 ( ) ( ) 23.0 ( ) 14.7 ( ) ( ) 23.5 ( ) 13.1 ( ) Total 31.4 ( ) 17.3 ( ) 14.1 ( ) Females ( ) 10.2 ( ) 20.4 ( ) ( ) 24.9 ( ) 17.3 ( ) ( ) 21.5 ( ) 18.2 ( ) ( ) 24.3 ( ) 9.9 ( ) Total 38.2 ( ) 21.7 ( ) 16.4 ( ) Pacific Males ( ) 11.4 ( ) 17.9 ( ) ( ) 11.4 ( ) 9.1 ( ) ( ) 9.1 ( ) 8.3 ( ) ( ) 3.0 ( ) 9.3 ( ) Total 19.0 ( ) 8.9 ( ) 10.1 ( ) Females ( ) 7.7 ( ) 7.5 ( ) ( ) 9.9 ( ) 7.2 ( ) ( ) 13.8 ( ) 9.0 ( ) ( ) 12.2 ( ) 2.6 ( ) Total 18.6 ( ) 11.5 ( ) 7.0 ( ) A Focus on Nutrition: Key Findings of the 2008/09 New Zealand Adult Nutrition Survey 209
238 Frequency of supplement use (%), (95% CI) Consumers in last year 1 Regular 2 Occasional 3 NZEO Males ( ) 20.3 ( ) 18.4 ( ) ( ) 25.0 ( ) 24.0 ( ) ( ) 25.3 ( ) 22.4 ( ) ( ) 31.5 ( ) 9.5 ( ) Total 44.8 ( ) 27.3 ( ) 17.6 ( ) Females ( ) 18.9 ( ) 26.2 ( ) ( ) 40.0 ( ) 17.9 ( ) ( ) 37.5 ( ) 22.9 ( ) ( ) 41.4 ( ) 12.3 ( ) Total 56.4 ( ) 38.2 ( ) 18.2 ( ) By NZDep2006 quintile Males ( ) 25.4 ( ) 21.4 ( ) ( ) 30.3 ( ) 13.7 ( ) ( ) 24.8 ( ) 18.9 ( ) ( ) 27.7 ( ) 13.2 ( ) ( ) 18.4 ( ) 13.5 ( ) Females ( ) 37.2 ( ) 17.0 ( ) ( ) 39.8 ( ) 19.8 ( ) ( ) 41.3 ( ) 18.2 ( ) ( ) 33.6 ( ) 16.7 ( ) ( ) 24.4 ( ) 14.7 ( ) 1 Any consumption over the past year. 2 At least one supplement consumed daily, more than once per week or once per week. 3 Any consumption less than once per week. 210 A Focus on Nutrition: Key Findings of the 2008/09 New Zealand Adult Nutrition Survey
239 Table 5.2: Prevalence of use by type of dietary supplement, 1 by age group, ethnic group, NZDep2006 and sex Age OILS MUVM HBPL SGLV BOTA MULV GLCH SGLM OTHER MULM SPTS WMGT BEEP Total population 16.4 ( ) 14.8 ( ) 10.1 ( ) 8.6 ( ) 8.5 ( ) 6.4 ( ) 6.2 ( ) 5.8 ( ) 5.8 ( ) 1.5 ( ) 1.9 ( ) 1.2 ( ) 0.7 ( ) Males ( ) ( ) ( ) ( ) ( ) Total 13.7 ( ) 8.1 ( ) 11.9 ( ) 12.7 ( ) 8.1 ( ) 9.3 ( ) 10.6 ( ) 6.0 ( ) 7.4 ( ) 8.4 ( ) 8.7 ( ) 6.0 ( ) 7.9 ( ) 5.8 ( ) 8.5 ( ) 8.4 ( ) 6.5 ( ) 4.1 ( ) 7.3 ( ) 4.4 ( ) 5.7 ( ) 6.7 ( ) 7.4 ( ) 8.3 ( ) 6.6 ( ) 3.8 ( ) 4.8 ( ) 7.1 ( ) 5.8 ( ) 2.2 ( ) 5.6 ( ) 0.3 ( ) 3.9 ( ) 4.1 ( ) 10.0 ( ) 13.0 ( ) 6.2 ( ) 2.1 ( ) 2.6 ( ) 1.8 ( ) 4.1 ( ) 6.7 ( ) 3.0 ( ) 4.2 ( ) 3.5 ( ) 3.6 ( ) 8.2 ( ) 5.9 ( ) 5.1 ( ) ( ) 0.1 ( ) 0.6 ( ) 2.2 ( ) 2.0 ( ) 1.0 ( ) 5.9 ( ) 2.6 ( ) 1.0 ( ) ( ) 1.5 ( ) 0.3 ( ) ( ) 2.9 ( ) 0.9 ( ) ( ) 0.1 ( ) 2.2 ( ) 0.5 ( ) Females ( ) ( ) ( ) ( ) ( ) Total 18.9 ( ) 13.7 ( ) 20.5 ( ) 22.0 ( ) 16.2 ( ) 12.2 ( ) 18.6 ( ) 11.5 ( ) 11.6 ( ) 15.4 ( ) 10.1 ( ) 7.4 ( ) 12.2 ( ) 8.3 ( ) 8.3 ( ) 11.6 ( ) 10.7 ( ) 5.5 ( ) 9.9 ( ) 5.2 ( ) 8.0 ( ) 11.9 ( ) 11.5 ( ) 8.4 ( ) 10.2 ( ) 4.0 ( ) 10.1 ( ) 7.5 ( ) 5.4 ( ) 7.7 ( ) 7.2 ( ) 0.4 ( ) 0.1 ( ) 3.4 ( ) 12.5 ( ) 15.4 ( ) 6.2 ( ) 5.4 ( ) 10.3 ( ) 8.1 ( ) 7.8 ( ) 9.9 ( ) 8.5 ( ) 4.4 ( ) 6.1 ( ) 6.0 ( ) 7.4 ( ) 7.4 ( ) 6.4 ( ) 0.7 ( ) 1.1 ( ) 1.7 ( ) 4.0 ( ) 1.1 ( ) 2.1 ( ) 0.8 ( ) 1.6 ( ) 1.2 ( ) 0.7 ( ) 0.2 ( ) 1.0 ( ) 2.2 ( ) 2.1 ( ) 1.5 ( ) 0.8 ( ) 0.4 ( ) 1.4 ( ) ( ) 0.5 ( ) 2.1 ( ) 0.7 ( ) 0.8 ( ) Māori Male ( ) ( ) ( ) ( ) Total 7.7 ( ) 13.1 ( ) 11.7 ( ) 8.1 ( ) 11.9 ( ) 10.6 ( ) 2.4 ( ) 3.9 ( ) 8.8 ( ) 5.8 ( ) 6.0 ( ) 2.8 ( ) 1.2 ( ) 4.8 ( ) 3.3 ( ) 3.2 ( ) 8.6 ( ) 3.5 ( ) 2.2 ( ) 2.6 ( ) 3.5 ( ) 1.0 ( ) 0.6 ( ) 6.4 ( ) 4.8 ( ) 3.8 ( ) ( ) ( ) 1.0 ( ) 10.0 ( ) 2.5 ( ) 1.3 ( ) 1.7 ( ) 0.8 ( ) 5.1 ( ) 6.8 ( ) 4.7 ( ) ( ) 0.4 ( ) 6.7 ( ) ( ) 0.6 ( ) 0.2 ( ) ( ) 0.7 ( ) ( ) 5.1 ( ) 1.3 ( ) ( ) 0.1 ( ) A Focus on Nutrition: Key Findings of the 2008/09 New Zealand Adult Nutrition Survey 211
240 Age OILS MUVM HBPL SGLV BOTA MULV GLCH SGLM OTHER MULM SPTS WMGT BEEP Female ( ) Pacific ( ) ( ) ( ) Total 8.0 ( ) Males ( ) ( ) ( ) ( ) Total 4.6 ( ) Females (0.0 23) ( ) ( ) ( ) Total 4.5 ( ) 4.9 ( ) 18.2 ( ) 10.8 ( ) 2.7 ( ) 10.5 ( ) 5.9 ( ) 4.3 ( ) 2.3 ( ) 3.4 ( ) 3.6 ( ) 6.0 ( ) 4.3 ( ) 6.3 ( ) 3.5 ( ) 5.1 ( ) 5.6 ( ) 10.8 ( ) 13.7 ( ) 5.9 ( ) 10.3 ( ) 9.3 ( ) 6.0 ( ) 3.7 ( ) 6.9 ( ) 5.7 ( ) 1.0 ( ) 1.7 ( ) 9.3 ( ) 2.4 ( ) 4.7 ( ) 2.3 ( ) 8.5 ( ) 4.3 ( ) 6.2 (2.3 13) 5.6 ( ) ( ) 0.4 ( ) 1.3 ( ) 6.5 ( ) 2.0 ( ) 6.6 ( ) 3.8 ( ) 3.8 ( ) 4.6 ( ) 2.6 ( ) 3.1 ( ) 3.0 ( ) 1.5 ( ) 2.7 ( ) ( ) 3.7 ( ) 2.2 ( ) 1.6 ( ) 2.2 ( ) 7.6 ( ) 4.0 ( ) 2.5 ( ) 2.3 ( ) 3.5 ( ) 2.3 ( ) 3.1 ( ) 6.5 ( ) 3.1 ( ) 1.8 ( ) 1.8 ( ) 2.6 ( ) 2.5 ( ) ( ) 2.2 ( ) ( ) 1.2 ( ) ( ) 4.7 ( ) 1.9 ( ) 2.6 ( ) 2.6 ( ) 2.1 ( ) 3.2 ( ) 1.1 ( ) 2.5 ( ) 1.7 ( ) 2.4 ( ) 2.5 ( ) 3.8 ( ) 1.3 ( ) 0.8 ( ) 0.6 ( ) ( ) 0.3 ( ) ( ) ( ) 1.0 ( ) ( ) 2.5 ( ) 0.7 ( ) 5.5 ( ) 2.2 ( ) 4.8 ( ) 1.2 ( ) 7.6 ( ) 0.7 ( ) 0.5 ( ) ( ) 0.4 ( ) 2.0 ( ) 2.5 ( ) 1.4 ( ) 4.1 ( ) 0.6 ( ) 0.6 ( ) 1.5 ( ) ( ) 0.7 ( ) 0.6 ( ) 7.4 ( ) 1.9 ( ) 3.3 ( ) 1.1 ( ) 0.5 ( ) 1.9 ( ) ( ) 0.9 ( ) ( ) ( ) 0.9 ( ) ( ) 0.4 ( ) 4.2 ( ) 0.7 ( ) 4.2 ( ) 0.8 ( ) 0.2 ( ) ( ) ( ) 0.7 ( ) 1.5 ( ) ( ) ( ) 0.7 ( ) 1.3 ( ) 0.8 ( ) 0.2 ( ) 212 A Focus on Nutrition: Key Findings of the 2008/09 New Zealand Adult Nutrition Survey
241 Age OILS MUVM HBPL SGLV BOTA MULV GLCH SGLM OTHER MULM SPTS WMGT BEEP NZEO Males ( ) ( ) ( ) ( ) Total 14.7 ( ) 8.7 ( ) 13.3 ( ) 14.0 ( ) 8.7 ( ) 11.5 ( ) 7.4 ( ) 8.4 ( ) 8.8 ( ) 8.3 ( ) 8.4 ( ) 7.1 ( ) 9.9 ( ) 9.3 ( ) 6.0 ( ) 8.0 ( ) 5.4 ( ) 6.3 ( ) 7.3 ( ) 8.1 ( ) 7.3 ( ) 4.7 ( ) 5.3 ( ) 7.5 ( ) 5.1 ( ) 6.0 ( ) 0.4 ( ) 4.6 ( ) 4.6 ( ) 11.3 ( ) 6.8 ( ) 2.6 ( ) 3.1 ( ) 1.9 ( ) 5.0 ( ) 3.4 ( ) 5.0 ( ) 4.0 ( ) 3.7 ( ) 8.1 ( ) 5.5 ( ) ( ) ( ) 0.6 ( ) 2.3 ( ) 1.1 ( ) 2.3 ( ) 0.8 ( ) 2.7 ( ) ( ) 1.6 ( ) 0.2 ( ) 0.9 ( ) ( ) 0.6 ( ) 0.6 ( ) Females ( ) ( ) ( ) ( ) Total 20.8 ( ) 14.9 ( ) 22.7 ( ) 24.1 ( ) 16.0 ( ) 20.1 ( ) 12.9 ( ) 13.4 ( ) 16.8 ( ) 9.7 ( ) 13.2 ( ) 9.2 ( ) 8.9 ( ) 13.0 ( ) 9.8 ( ) 10.8 ( ) 5.9 ( ) 9.4 ( ) 12.6 ( ) 11.3 ( ) 11.1 ( ) 4.2 ( ) 10.4 ( ) 8.0 ( ) 6.1 ( ) 7.5 ( ) 0.5 ( ) 6.2 ( ) ( ) 3.8 ( ) 14.1 ( ) 6.8 ( ) 8.8 ( ) 8.7 ( ) 9.1 ( ) 4.1 ( ) 7.1 ( ) 6.5 ( ) 8.0 ( ) 7.0 ( ) 0.4 ( ) 1.3 ( ) 1.8 ( ) 3.4 ( ) 2.2 ( ) 0.9 ( ) 2.0 ( ) 1.1 ( ) 0.6 ( ) 1.1 ( ) 1.6 ( ) 2.0 ( ) 1.5 ( ) 0.7 ( ) 1.3 ( ) ( ) 0.5 ( ) 1.8 ( ) 0.9 ( ) NZDep2006 Males ( ) ( ) ( ) ( ) ( ) 9.0 ( ) 13.2 ( ) 11.2 ( ) 9.0 ( ) 10.6 ( ) 9.2 ( ) 9.8 ( ) 9.1 ( ) 5.2 ( ) 5.3 ( ) 7.8 ( ) 10.1 ( ) 8.4 ( ) 5.2 ( ) 4.2 ( ) 7.7 ( ) 7.1 ( ) 6.2 ( ) 9.3 ( ) 2.4 ( ) 8.0 ( ) 5.3 ( ) 5.5 ( ) 5.1 ( ) 3.4 ( ) 6.9 ( ) 6.6 ( ) 8.6 ( ) 5.4 ( ) 2.8 ( ) 2.9 ( ) 3.2 ( ) 5.9 ( ) 2.4 ( ) 0.5 ( ) 5.4 ( ) 5.3 ( ) 4.0 ( ) 6.6 ( ) 3.9 ( ) 0.7 ( ) 1.6 ( ) 1.3 ( ) 1.3 ( ) 2.5 ( ) 4.4 ( ) 4.1 ( ) 1.2 ( ) ( ) ( ) 1.3 ( ) 1.4 ( ) 1.2 ( ) 1.1 ( ) 0.1 ( ) 1.1 ( ) 0.1 ( ) 0.2 ( ) A Focus on Nutrition: Key Findings of the 2008/09 New Zealand Adult Nutrition Survey 213
242 Age OILS MUVM HBPL SGLV BOTA MULV GLCH SGLM OTHER MULM SPTS WMGT BEEP Females ( ) 16.4 ( ) 12.8 ( ) 10.0 ( ) 10.4 ( ) 7.3 ( ) 7.1 ( ) 11.5 ( ) 6.0 ( ) 1.7 ( ) 2.9 ( ) 0.5 ( ) 1.0 ( ) ( ) 21.5 ( ) 17.2 ( ) 11.8 ( ) 13.3 ( ) 6.5 ( ) 8.1 ( ) 11.4 ( ) 7.9 ( ) 3.8 ( ) 1.2 ( ) 1.3 ( ) 0.8 ( ) ( ) 19.9 ( ) 9.4 ( ) 12.6 ( ) 9.8 ( ) 10.8 ( ) 5.7 ( ) 9.3 ( ) 8.7 ( ) 2.7 ( ) 0.1 ( ) 1.7 ( ) 0.9 ( ) ( ) 21.1 ( ) 13.4 ( ) 9.9 ( ) 10.0 ( ) 6.3 ( ) 5.3 ( ) 2.5 ( ) 5.2 ( ) 1.2 ( ) 0.3 ( ) 0.6 ( ) 0.7 ( ) ( ) 13.1 ( ) 7.6 ( ) 4.3 ( ) 7.0 ( ) 5.0 ( ) 4.4 ( ) 7.6 ( ) 3.8 ( ) 0.6 ( ) 0.9 ( ) 2.8 ( ) 0.6 ( ) Notes: OILS = oils; MUVM = multi-mineral and multi-vitamin; HBPL = herbal-plus; SGLV = single vitamin; BOTA = botanicals; MULV = multi-vitamin; GLCH = glucosamine/chondroitin; SGLM = single mineral; MULM = multi-mineral; SPTS = sports; WMGT = weight management; BEEP = bee products. 1 Prevalence of supplement use among the total population aged 15 years and over (includes those who used supplements and those who did not use supplements). 214 A Focus on Nutrition: Key Findings of the 2008/09 New Zealand Adult Nutrition Survey
243 6 Dietary Habits The Dietary Habits Questionnaire consisted of a series of questions on key dietary patterns and habits associated with diet quality and/or nutritional status. Participants were asked about key behaviours such as breakfast consumption, the frequency of eating certain foods, food preparation and cooking practices (eg, removal of excess fat, addition of salt), and choosing low fat or reduced-salt foods. Frequency of intake focused on the major food groups, which are important for assessing diet quality, such as vegetables and fruit, breads, meat and seafood, takeaways, sugary drinks and confectionery. Questions on specific foods focused primarily on dietary fat intake by examining the type of milk, spreads and cooking fats usually used. Most of these questions included five or more response options. Where possible, the responses to these questions were combined to make comparisons against specific nutritional guidelines or recommendations, or to aid interpretation of the results. The number of participants in each response category was often too small to present the results for each ethnic group stratified by age group and sex. Therefore, detailed results for Māori, Pacific and New Zealand European and Other ethnic groups are presented in the online data tables ( As with all self-reported dietary data, results may be influenced by social desirability (ie, a tendency to over-report healthy foods and under-report less healthy foods). 6.1 Having breakfast every day Eating breakfast regularly is associated with the prevention of weight gain and a lower body mass index (BMI) compared to skipping breakfast (Cho et al 2003; Ma et al 2003; van der Heijden et al 2007). Survey question How many days in an average week do you have something to eat for breakfast? You may have eaten at home, in a car, at work or in a café. Breakfast was eaten daily by 66.9% of the total population aged 15 years and over, and a further 18.8% ate breakfast three to six times a week. Six percent did not usually eat breakfast (Table 6.1). Overall, the proportion of both males and females who reported eating breakfast daily increased with increasing age, except that males aged years were less likely to have eaten breakfast daily (39.3%) compared to males aged years (55.4%) (Figure 6.1). A Focus on Nutrition: Key Findings of the 2008/09 New Zealand Adult Nutrition Survey 215
244
245 Table 6.1: Frequency of eating breakfast per week, by age group, NZDep2006 and sex 0 2 times per week (prevalence), (95% CI) 3 6 times per week (prevalence), (95% CI) 7 times per week (prevalence), (95% CI) NZ population (aged 15+) 14.4 ( ) 18.8 ( ) 66.9 ( ) By age group (years) Males ( ) 30.7 ( ) 55.4 ( ) ( ) 33.7 ( ) 39.3 ( ) ( ) 20.7 ( ) 60.4 ( ) ( ) 10.0 ( ) 81.1 ( ) ( ) 2.8 ( ) 95.5 ( ) Total 15.9 ( ) 19.6 ( ) 64.5 ( ) Females ( ) 34.5 ( ) 44.5 ( ) ( ) 29.6 ( ) 48.7 ( ) ( ) 18.8 ( ) 66.6 ( ) ( ) 10.1 ( ) 83.3 ( ) ( ) 1.8 ( ) 96.9 ( ) Total 13.0 ( ) 17.9 ( ) 69.1 ( ) By NZDep2006 quintile Males ( ) 16.0 ( ) 72.0 ( ) ( ) 17.6 ( ) 69.0 ( ) ( ) 18.6 ( ) 64.9 ( ) ( ) 23.2 ( ) 58.8 ( ) ( ) 24.0 ( ) 54.8 ( ) Females ( ) 12.3 ( ) 79.0 ( ) ( ) 14.3 ( ) 77.3 ( ) ( ) 18.9 ( ) 69.5 ( ) ( ) 21.9 ( ) 62.6 ( ) ( ) 22.0 ( ) 56.6 ( ) Notes: Frequency for never, 1, 2, 3, 4, 5, 6, 7 times per week are presented in the online data tables. Results for Māori, Pacific and NZEO are presented in the online data tables. 6.2 Eating from the four major food groups The Food and Nutrition Guidelines for Healthy Adults (Ministry of Health 2003b) recommend that people consume a variety of nutritious foods from each of the four major food groups each day. These are: vegetables and fruit breads and cereals, preferably whole-grain milk and milk products, preferably reduced- or low-fat options lean meat, poultry, seafood, eggs or alternatives. A Focus on Nutrition: Key Findings of the 2008/09 New Zealand Adult Nutrition Survey 217
246 Vegetables and fruit Vegetables and fruit are highly nutritious and have been shown to protect against heart disease, stroke and high blood pressure (World Health Organization 2003). There is also evidence that vegetables and fruit protect against cancers of the mouth, larynx, pharynx, oesophagus and stomach, and that fruit also protects against lung cancer (World Cancer Research Fund and American Institute for Cancer Research 2007). In New Zealand it is recommended that adults eat at least three servings of vegetables and at least two servings of fruit each day (Ministry of Health 2003b). Note that this recommendation allows up to one serving of juice to be counted, whereas the survey question excluded juice. The Food and Nutrition Guidelines recommend limiting the consumption of fruit juice because of the high sugar content. Survey questions On average, how many servings of fruit (fresh, frozen, canned or stewed) do you eat a day? Do not include fruit juice or dried fruit. (A serving is the same as a medium piece of fruit like an apple or two small pieces of fruit like two apricots, or half a cup of stewed fruit). On average, how many servings of vegetables (fresh, frozen or canned) do you eat a day? Do not include vegetable juices. (A serving is the same as one potato, half a cup of peas or a cup of salad). The recommended three or more servings of vegetables each day was eaten by 66.0% of the total population aged 15 years and over (Table 6.2). The recommended two or more servings of fruit each was eaten by 60.4% of the total population aged 15 years and over (Table 6.3). Recommended vegetable intake The recommended three or more servings of vegetables each day was eaten by 72.2% of females and 59.3% of males (Table 6.2). Females aged and years were more likely than males in these age groups to have reported eating at least three servings of vegetables a day (Figure 6.2). There were no differences between males and females for the other age groups. Younger females (15 30 years) were less likely to report eating at least three servings of vegetables a day compared to females of other ages, with those aged 51+ years most likely to report consuming the recommended intake. Younger males (15 30 years) were less likely to report eating at least three servings of vegetables a day compared to males aged 51+ years. 218 A Focus on Nutrition: Key Findings of the 2008/09 New Zealand Adult Nutrition Survey
247
248 Table 6.2: Number of servings of vegetables consumed per day, by age group, NZDep2006 and sex < 1 serving a day (prevalence), (95% CI) 1 serving a day (prevalence), (95% CI) 2 servings a day (prevalence), (95% CI) 3+ servings a day (prevalence), (95% CI) Total population 2.8 ( ) 10.1 ( ) 20.9 ( ) 66.0 ( ) By age group (years) Males ( ) 17.5 ( ) 26.5 ( ) 50.9 ( ) ( ) 21.1 ( ) 27.0 ( ) 47.1 ( ) ( ) 13.0 ( ) 25.2 ( ) 58.6 ( ) ( ) 10.1 ( ) 20.4 ( ) 66.1 ( ) ( ) 4.8 ( ) 16.3 ( ) 76.9 ( ) Total 3.5 ( ) 13.5 ( ) 23.6 ( ) 59.3 ( ) Females ( ) 8.1 ( ) 26.4 ( ) 61.5 ( ) ( ) 13.1 ( ) 27.9 ( ) 56.2 ( ) ( ) 6.4 ( ) 18.3 ( ) 72.2 ( ) ( ) 3.6 ( ) 11.5 ( ) 83.3 ( ) ( ) 5.1 ( ) 12.6 ( ) 81.4 ( ) Total 2.2 ( ) 7.0 ( ) 18.4 ( ) 72.2 ( ) By NZDep2006 quintile Males ( ) 9.7 ( ) 21.4 ( ) 65.6 ( ) ( ) 10.1 ( ) 21.4 ( ) 66.7 ( ) ( ) 13.2 ( ) 28.7 ( ) 54.7 ( ) ( ) 20.0 ( ) 23.7 ( ) 52.9 ( ) ( ) 16.0 ( ) 22.8 ( ) 54.4 ( ) Females ( ) 3.4 ( ) 13.5 ( ) 82.2 ( ) ( ) 3.6 ( ) 19.9 ( ) 74.0 ( ) ( ) 7.3 ( ) 15.7 ( ) 75.6 ( ) ( ) 9.1 ( ) 20.1 ( ) 67.1 ( ) ( ) 11.5 ( ) 22.2 ( ) 62.4 ( ) Notes: Never eat vegetables = 0.2%, and so was not recorded in the table. Results for 3, 4, 5+ servings a day are presented in the online data tables. Results for Māori, Pacific and NZEO are presented in the online data tables. Recommended fruit intake The recommended two or more servings of fruit each day was reported to be eaten by 54.6% of males and 65.8% of females (Table 6.3). This did not include fruit juice. Females aged and years were more likely to report eating the recommended number of servings compared to males in the same age groups (Figure 6.3). There were no differences between males and females for the other age groups. 220 A Focus on Nutrition: Key Findings of the 2008/09 New Zealand Adult Nutrition Survey
249
250 Table 6.3: Number of servings of fruit consumed per day, by age group, NZDep2006 and sex Never (prevalence), (95% CI) < 1 serving a day (prevalence), (95% CI) 1 serving a day (prevalence), (95% CI) 2+ servings a day (prevalence), (95% CI) Total population 2.6 ( ) 14.8 ( ) 22.2 ( ) 60.4 ( ) By age group (years) Males ( ) 16.8 ( ) 18.7 ( ) 61.2 ( ) ( ) 25.6 ( ) 27.5 ( ) 42.1 ( ) ( ) 18.1 ( ) 24.1 ( ) 54.2 ( ) ( ) 14.0 ( ) 23.7 ( ) 59.9 ( ) ( ) 10.4 ( ) 24.4 ( ) 62.6 ( ) Total 3.4 ( ) 17.7 ( ) 24.3 ( ) 54.6 ( ) Females ( ) 11.7 ( ) 21.6 ( ) 65.0 ( ) ( ) 14.4 ( ) 21.7 ( ) 60.6 ( ) ( ) 14.2 ( ) 22.3 ( ) 61.4 ( ) ( ) 10.1 ( ) 15.4 ( ) 73.4 ( ) ( ) 5.9 ( ) 21.0 ( ) 72.4 ( ) Total 1.9 ( ) 12.1 ( ) 20.2 ( ) 65.8 ( ) By NZDep2006 quintile Males ( ) 11.9 ( ) 20.6 ( ) 66.0 ( ) ( ) 16.7 ( ) 26.8 ( ) 54.3 ( ) ( ) 14.7 ( ) 24.6 ( ) 57.8 ( ) ( ) 22.2 ( ) 23.7 ( ) 48.6 ( ) ( ) 25.3 ( ) 26.4 ( ) 42.8 ( ) Females ( ) 11.3 ( ) 15.1 ( ) 73.6 ( ) ( ) 10.7 ( ) 15.3 ( ) 72.5 ( ) ( ) 11.6 ( ) 24.4 ( ) 61.8 ( ) ( ) 12.4 ( ) 21.5 ( ) 63.5 ( ) ( ) 15.0 ( ) 24.4 ( ) 57.4 ( ) Notes: Results for 2, 3, 4+ servings a day are presented in the online data tables. Results for Māori, Pacific and NZEO are presented in the online data tables. Bread The Food and Nutrition Guidelines recommend that adults eat at least six servings of breads and cereals each day, preferably whole-grain varieties. This report comments on the type of bread chosen. Survey question What type of bread, rolls or toast do you eat most of? Response options: White, high-fibre white, light grain, heavy grain, other. 222 A Focus on Nutrition: Key Findings of the 2008/09 New Zealand Adult Nutrition Survey
251
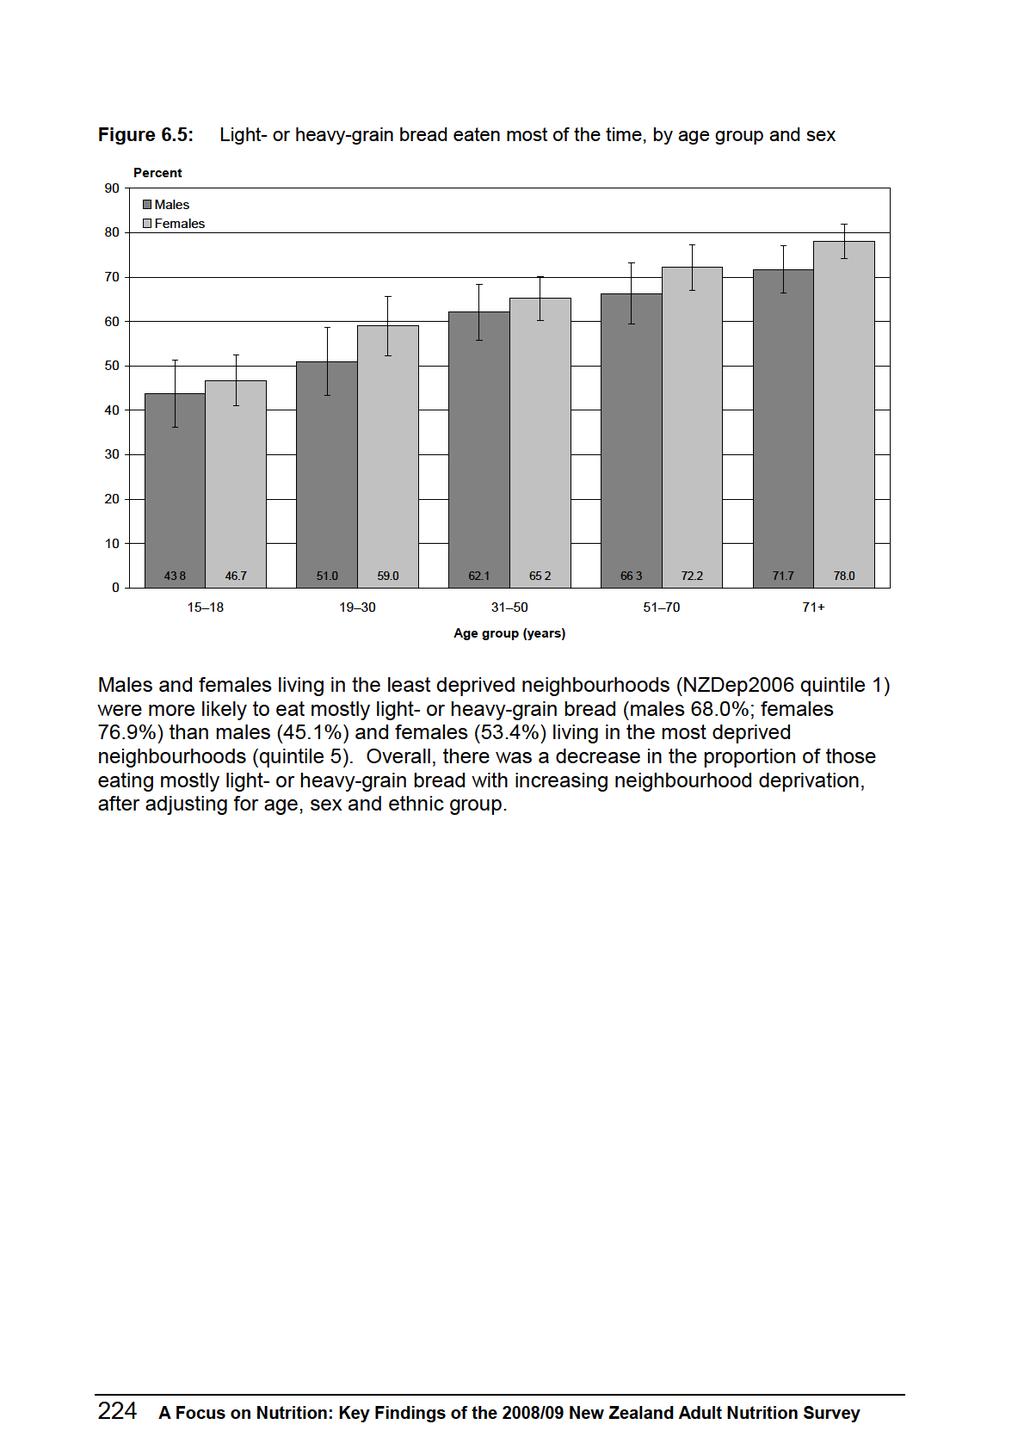
252
253 Table 6.4: Type of bread consumed most of the time, by age group, NZDep2006 and sex White (prevalence), (95% CI) High-fibre white (prevalence), (95% CI) Light or heavy grain bread (prevalence), (95% CI) Other type of bread (prevalence), (95% CI) Total population 28.9 ( ) 4.6 ( ) 63.3 ( ) 3.0 ( ) By age group (years) Males ( ) 5.2 ( ) 43.8 ( ) 1.3 ( ) ( ) 5.1 ( ) 51.0 ( ) 1.7 ( ) ( ) 3.9 ( ) 62.1 ( ) 2.8 ( ) ( ) 6.6 ( ) 66.3 ( ) 2.6 ( ) ( ) 3.8 ( ) 71.7 ( ) 3.2 ( ) Total 32.0 ( ) 5.0 ( ) 60.4 ( ) 2.4 ( ) Females ( ) 2.5 ( ) 46.7 ( ) 1.8 ( ) ( ) 5.7 ( ) 59.0 ( ) 1.3 ( ) ( ) 4.1 ( ) 65.2 ( ) 2.8 ( ) ( ) 3.8 ( ) 72.2 ( ) 6.6 ( ) ( ) 4.4 ( ) 78.0 ( ) 3.9 ( ) Total 26.1 ( ) 4.3 ( ) 65.9 ( ) 3.5 ( ) By NZDep2006 quintile Males ( ) 6.8 ( ) 68.0 ( ) 2.5 ( ) ( ) 4.8 ( ) 63.9 ( ) 3.7 ( ) ( ) 4.1 ( ) 63.1 ( ) 2.8 ( ) ( ) 4.8 ( ) 58.9 ( ) 1.5 ( ) ( ) 3.9 ( ) 45.1 ( ) 1.4 ( ) Females ( ) 3.0 ( ) 76.9 ( ) 2.7 ( ) ( ) 4.7 ( ) 68.8 ( ) 5.9 ( ) ( ) 5.4 ( ) 64.4 ( ) 4.0 ( ) ( ) 3.3 ( ) 66.4 ( ) 2.6 ( ) ( ) 4.8 ( ) 53.4 ( ) 2.1 ( ) Notes: Other type of bread = 3.0%, and so was not recorded in the table. Results for Māori, Pacific and NZEO are presented in the online data tables. A Focus on Nutrition: Key Findings of the 2008/09 New Zealand Adult Nutrition Survey 225
254
255
256 Table 6.5: Type of milk used most of the time, by age group, NZDep2006 and sex Whole/ standard (prevalence), (95% CI) Reduced fat (prevalence), (95% CI) Skim or trim (prevalence), (95% CI) Soy milk (prevalence), (95% CI) None (prevalence), (95% CI) Reduced fat or skim or trim (prevalence), (95% CI) Total population 43.3 ( ) 21.4 ( ) 26.9 ( ) 2.4 ( ) 4.8 ( ) 48.4 ( ) By age group (years) Males ( ) 21.7 ( ) 11.7 ( ) 1.0 ( ) 2.0 ( ) 33.4 ( ) ( ) 22.4 ( ) 17.9 ( ) 1.8 ( ) 2.6 ( ) 40.3 ( ) ( ) 23.9 ( ) 19.6 ( ) 0.8 ( ) 4.0 ( ) 43.5 ( ) ( ) 20.8 ( ) 27.7 ( ) 2.1 ( ) 7.7 ( ) 48.5 ( ) ( ) 26.2 ( ) 29.5 ( ) 1.4 ( ) 3.9 ( ) 55.8 ( ) Total 48.6 ( ) 22.8 ( ) 21.7 ( ) 1.4 ( ) 4.5 ( ) 44.5 ( ) Females ( ) 21.6 ( ) 17.3 ( ) 3.9 ( ) 5.6 ( ) 38.9 ( ) ( ) 16.7 ( ) 27.2 ( ) 4.2 ( ) 4.3 ( ) 43.9 ( ) ( ) 20.1 ( ) 30.6 ( ) 2.6 ( ) 3.5 ( ) 50.7 ( ) ( ) 20.5 ( ) 38.9 ( ) 4.7 ( ) 7.8 ( ) 59.3 ( ) ( ) 25.7 ( ) 36.2 ( ) 0.9 ( ) 4.7 ( ) 61.8 ( ) Total 38.4 ( ) 20.2 ( ) 31.7 ( ) 3.4 ( ) 5.0 ( ) 51.9 ( ) By NZDep2006 quintile Males ( ) 26.2 ( ) 28.5 ( ) 1.7 ( ) 2.2 ( ) 54.7 ( ) ( ) 20.3 ( ) 23.4 ( ) 0.7 ( ) 4.0 ( ) 43.6 ( ) ( ) 20.8 ( ) 24.9 ( ) 1.6 ( ) 6.9 ( ) 45.7 ( ) ( ) 26.2 ( ) 16.5 ( ) 1.9 ( ) 5.6 ( ) 42.6 ( ) ( ) 20.1 ( ) 12.7 ( ) 1.3 ( ) 4.2 ( ) 32.9 ( ) Females ( ) 21.0 ( ) 35.5 ( ) 4.8 ( ) 7.4 ( ) 56.5 ( ) ( ) 21.1 ( ) 38.0 ( ) 5.3 ( ) 5.4 ( ) 59.1 ( ) ( ) 21.8 ( ) 36.1 ( ) 2.1 ( ) 3.2 ( ) 57.9 ( ) ( ) 19.5 ( ) 24.8 ( ) 2.6 ( ) 5.5 ( ) 44.3 ( ) ( ) 17.2 ( ) 23.3 ( ) 2.1 ( ) 4.0 ( ) 40.5 ( ) Notes: Other category = 1.1%, and so was not recorded in the table. Results for Māori, Pacific and NZEO are presented in the online data tables. 228 A Focus on Nutrition: Key Findings of the 2008/09 New Zealand Adult Nutrition Survey
257 Meat, chicken, seafood, and processed meat The Food and Nutrition Guidelines recommend that adults consume at least one serving a day of lean meat, poultry, chicken, seafood, eggs, nuts and seeds, or legumes. Survey questions In the past four weeks, which of the following have you eaten at all? Response options: Red meat; chicken; seafood; none of these foods. How often do you eat red meat? (Includes beef, pork, mutton, lamb, goat) How often do you eat chicken? (Chicken breast, drumsticks, whole chicken, not nuggets or chicken roll) How often do you eat fresh or frozen fish or shellfish? Do not include battered/fried or canned fish or seafood. How often do you eat battered or fried fish or shellfish? This may include battered or deep-fried fish bought from the Fish and Chip shop. How often do you eat canned fish or shellfish? Canned fish includes products such as tuna, salmon and sardines. Response options: Never; less than once per week; 1 2 times per week; 3 4 times per week; 5 6 times per week; 7 or more times per week. Red meat or chicken Most of the total population aged 15 years and over (94.5%) reported eating red meat in the past four weeks, with red meat eaten one to two times per week by 30.1% and three to four times per week by 45.4% (Table 6.6). Most of the total population aged 15 years and over (93.4%) reported eating chicken in the past four weeks. Most reported eating chicken either one to two times per week (56.4%) or three to four times per week (24.2%) (Table 6.7). Patterns of red meat and chicken consumption were similar across quintiles of neighbourhood deprivation. A Focus on Nutrition: Key Findings of the 2008/09 New Zealand Adult Nutrition Survey 229
258 Table 6.6: Frequency of eating red meat, by age group, NZDep2006 and sex Never or not consumed in past 4 weeks Prevalence (95% CI) Less than 1 time per week Prevalence (95% CI) 1 2 times per week Prevalence (95% CI) 3 4 times per week Prevalence (95% CI) 5+ times per week Prevalence (95% CI) Total population 5.5 ( ) 4.5 ( ) 30.1 ( ) 45.4 ( ) 14.4 ( ) By age group (years) Males ( ) 3.2 ( ) 34.3 ( ) 45.4 ( ) 13.5 ( ) ( ) 3.0 ( ) 26.9 ( ) 46.9 ( ) 20.0 ( ) ( ) 2.5 ( ) 28.0 ( ) 48.6 ( ) 15.1 ( ) ( ) 5.3 ( ) 31.6 ( ) 47.0 ( ) 12.1 ( ) ( ) 5.5 ( ) 25.7 ( ) 43.8 ( ) 21.4 ( ) Total 4.4 ( ) 3.7 ( ) 29.0 ( ) 47.1 ( ) 15.7 ( ) Females ( ) 7.8 ( ) 31.8 ( ) 40.5 ( ) 11.5 ( ) ( ) 7.5 ( ) 34.9 ( ) 34.8 ( ) 15.0 ( ) ( ) 4.7 ( ) 31.8 ( ) 45.2 ( ) 11.9 ( ) ( ) 3.5 ( ) 27.9 ( ) 50.4 ( ) 11.8 ( ) ( ) 5.8 ( ) 28.9 ( ) 42.0 ( ) 18.9 ( ) Total 6.6 ( ) 5.3 ( ) 31.1 ( ) 43.8 ( ) 13.2 ( ) By NZDep2006 quintile Males ( ) 2.4 ( ) 28.8 ( ) 53.0 ( ) 13.2 ( ) ( ) 2.9 ( ) 29.5 ( ) 47.6 ( ) 15.7 ( ) ( ) 5.6 ( ) 30.3 ( ) 45.1 ( ) 14.0 ( ) ( ) 3.2 ( ) 30.9 ( ) 45.3 ( ) 17.7 ( ) ( ) 4.6 ( ) 25.3 ( ) 43.3 ( ) 19.1 ( ) Females ( ) 5.0 ( ) 36.9 ( ) 40.9 ( ) 10.9 ( ) ( ) 5.2 ( ) 28.5 ( ) 48.4 ( ) 12.5 ( ) ( ) 5.6 ( ) 27.5 ( ) 42.8 ( ) 17.0 ( ) ( ) 4.7 ( ) 31.6 ( ) 46.4 ( ) 10.8 ( ) ( ) 5.9 ( ) 32.5 ( ) 39.5 ( ) 14.3 ( ) Note: Results for Māori, Pacific and NZEO are presented in the online data tables. 230 A Focus on Nutrition: Key Findings of the 2008/09 New Zealand Adult Nutrition Survey
259 Table 6.7: Frequency of eating chicken, by age group, NZDep2006 and sex Never or not consumed in past 4 weeks Prevalence (95% CI) Less than 1 time per week Prevalence (95% CI) 1 2 times per week Prevalence (95% CI) 3 4 times per week Prevalence (95% CI) 5+ times per week Prevalence (95% CI) Total population 6.6 ( ) 8.3 ( ) 56.4 ( ) 24.2 ( ) 4.5 ( ) By age group (years) Males ( ) 11.0 ( ) 50.6 ( ) 27.3 ( ) 7.7 ( ) ( ) 8.5 ( ) 49.5 ( ) 30.9 ( ) 6.3 ( ) ( ) 5.5 ( ) 61.5 ( ) 23.6 ( ) 3.9 ( ) ( ) 9.2 ( ) 60.4 ( ) 16.4 ( ) 3.9 ( ) ( ) 12.3 ( ) 59.3 ( ) 10.7 ( ) 1.1 ( ) Total 7.4 ( ) 8.2 ( ) 57.7 ( ) 22.3 ( ) 4.4 ( ) Females ( ) 6.9 ( ) 46.2 ( ) 33.5 ( ) 6.0 ( ) ( ) 3.2 ( ) 54.1 ( ) 31.7 ( ) 5.9 ( ) ( ) 8.9 ( ) 54.8 ( ) 27.3 ( ) 6.0 ( ) ( ) 9.3 ( ) 56.4 ( ) 23.6 ( ) 2.4 ( ) ( ) 14.3 ( ) 61.1 ( ) 12.3 ( ) 2.0 ( ) Total 5.8 ( ) 8.3 ( ) 55.1 ( ) 26.1 ( ) 4.7 ( ) By NZDep2006 quintile Males ( ) 4.0 ( ) 63.7 ( ) 18.2 ( ) 7.6 ( ) ( ) 10.2 ( ) 58.0 ( ) 22.4 ( ) 2.6 ( ) ( ) 8.0 ( ) 58.9 ( ) 25.8 ( ) 2.8 ( ) ( ) 9.3 ( ) 52.4 ( ) 24.1 ( ) 5.5 ( ) ( ) 10.2 ( ) 53.8 ( ) 21.6 ( ) 3.2 ( ) Females ( ) 8.6 ( ) 58.7 ( ) 25.9 ( ) 3.0 ( ) ( ) 9.5 ( ) 58.0 ( ) 23.2 ( ) 3.1 ( ) ( ) 8.1 ( ) 55.6 ( ) 26.9 ( ) 4.0 ( ) ( ) 6.0 ( ) 53.8 ( ) 28.1 ( ) 6.7 ( ) ( ) 9.5 ( ) 49.4 ( ) 26.5 ( ) 6.6 ( ) Note: Results for Māori, Pacific and NZEO are presented in the online data tables. Seafood (fish and shellfish) Eighty percent of the total population aged 15 years and over reported eating seafood in the past four weeks. The proportion eating seafood was highest for those aged 31 years and over, and lowest in those aged years, for both males and females. Fresh or frozen seafood was eaten by 41.6% of the total population aged 15 years and over one or more times a week, and by 30.0% less than once a week. Fresh or frozen seafood was not eaten in the past four weeks, or never, by 28.4% of the adult population (Table 6.8). Canned seafood was eaten by 29.2% of the total population aged 15 years and over one or more times a week, and by 29.2% less than once a week. Canned seafood was not eaten in the past four weeks, or never, by 41.6% (Table 6.9). A Focus on Nutrition: Key Findings of the 2008/09 New Zealand Adult Nutrition Survey 231
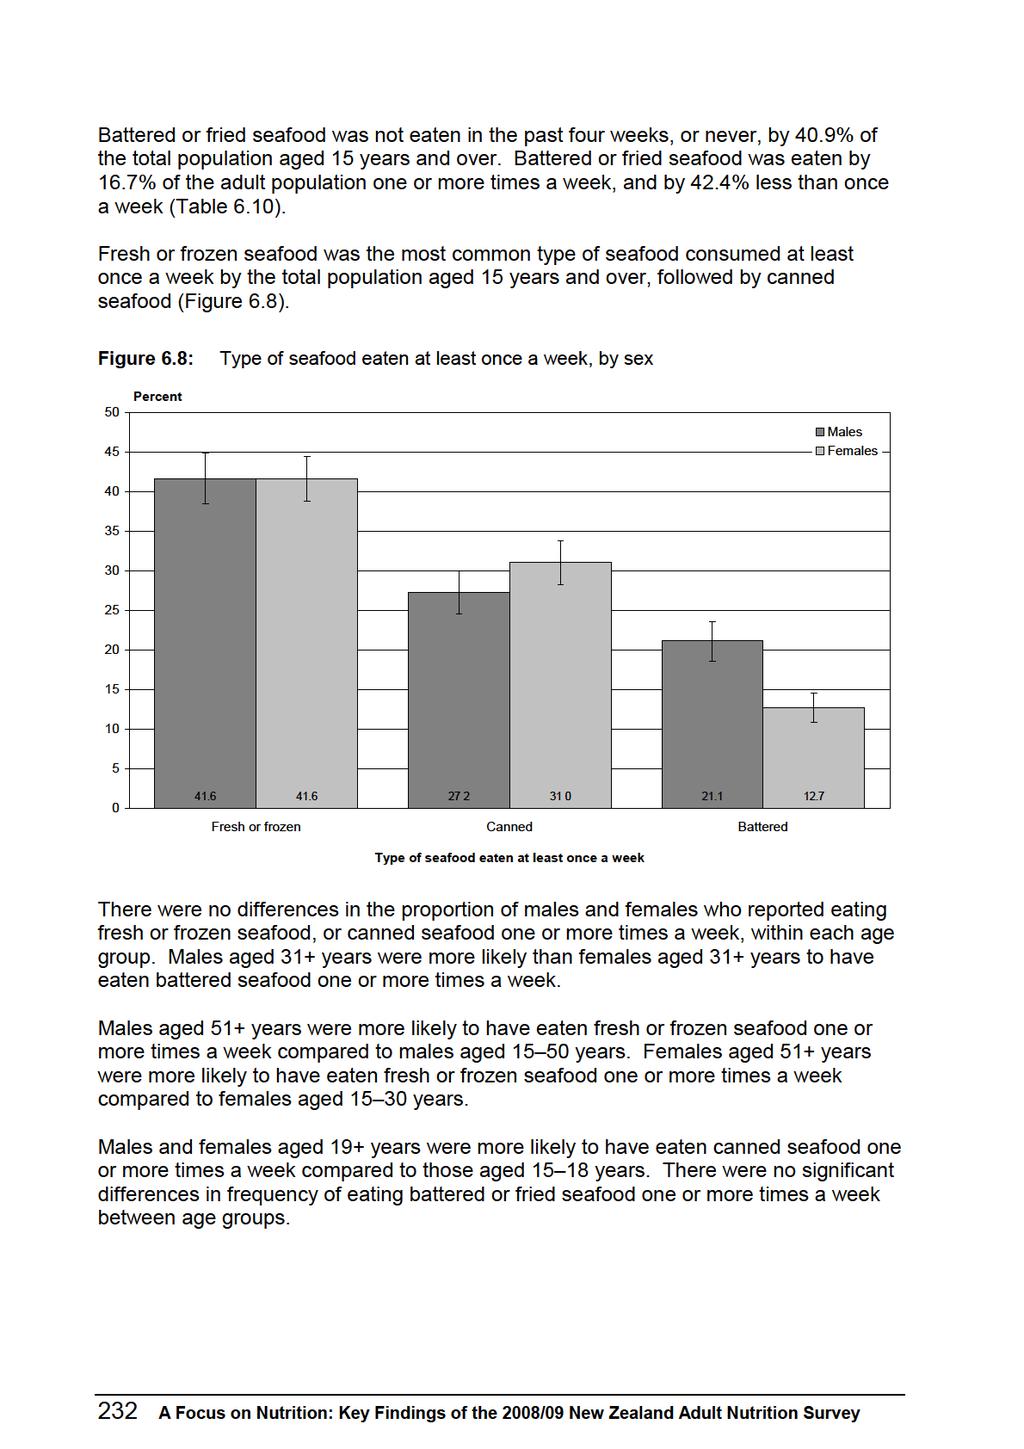
260
261 There were no differences in the reported frequency of consumption of frozen seafood or canned seafood by neighbourhood deprivation. More people living in the most deprived neighbourhoods ate battered or fried fish one or more times a week (NZDep2006 quintile 5: males 27.2%; females 17.8%) than people living in the least deprived neighbourhoods (quintile 1: males 16.0%; females 9.5%). Table 6.8: Frequency of eating fresh or frozen seafood (fish or shellfish), by age group, NZDep2006 and sex Never, or not consumed in past 4 weeks (prevalence), (95% CI) Less than 1 time per week (prevalence), (95% CI) 1+ times per week (prevalence), (95% CI) Total population 28.4 ( ) 30.0 ( ) 41.6 ( ) By age group (years) Males ( ) 23.8 ( ) 25.3 ( ) ( ) 32.7 ( ) 34.9 ( ) ( ) 35.8 ( ) 36.3 ( ) ( ) 23.2 ( ) 56.0 ( ) ( ) 22.9 ( ) 48.8 ( ) Total 28.7 ( ) 29.7 ( ) 41.6 ( ) Females ( ) 23.2 ( ) 24.4 ( ) ( ) 31.0 ( ) 32.2 ( ) ( ) 33.7 ( ) 40.4 ( ) ( ) 29.3 ( ) 49.6 ( ) ( ) 23.9 ( ) 54.6 ( ) Total 28.2 ( ) 30.3 ( ) 41.6 ( ) By NZDep2006 quintile Males ( ) 27.2 ( ) 48.4 ( ) ( ) 35.2 ( ) 38.1 ( ) ( ) 31.4 ( ) 41.4 ( ) ( ) 27.0 ( ) 37.6 ( ) ( ) 27.3 ( ) 41.1 ( ) Females ( ) 28.8 ( ) 50.9 ( ) ( ) 33.6 ( ) 44.8 ( ) ( ) 35.1 ( ) 34.3 ( ) ( ) 25.7 ( ) 39.6 ( ) ( ) 27.1 ( ) 39.5 ( ) Note: Results for Māori, Pacific and NZEO are presented in online data tables. A Focus on Nutrition: Key Findings of the 2008/09 New Zealand Adult Nutrition Survey 233
262 Table 6.9: Frequency of eating canned seafood (fish or shellfish), by age group, NZDep2006 and sex Never, or not consumed in past 4 weeks (prevalence), (95% CI) Less than 1 time per week (prevalence), (95% CI) 1+ times per week (prevalence), (95% CI) Total population 41.6 ( ) 29.2 ( ) 29.2 ( ) By age group (years) Males ( ) 14.6 ( ) 11.0 ( ) ( ) 25.0 ( ) 24.0 ( ) ( ) 27.4 ( ) 30.1 ( ) ( ) 31.8 ( ) 31.0 ( ) ( ) 35.5 ( ) 26.0 ( ) Total 45.0 ( ) 27.8 ( ) 27.2 ( ) Females ( ) 17.4 ( ) 13.0 ( ) ( ) 25.7 ( ) 23.3 ( ) ( ) 32.1 ( ) 34.7 ( ) ( ) 31.7 ( ) 36.6 ( ) ( ) 39.8 ( ) 30.0 ( ) Total 38.5 ( ) 30.5 ( ) 31.0 ( ) By NZDep2006 quintile Males ( ) 27.4 ( ) 30.2 ( ) ( ) 28.4 ( ) 26.9 ( ) ( ) 31.8 ( ) 19.5 ( ) ( ) 24.2 ( ) 32.9 ( ) ( ) 26.7 ( ) 26.8 ( ) Females ( ) 31.4 ( ) 33.8 ( ) ( ) 30.7 ( ) 34.9 ( ) ( ) 32.4 ( ) 31.0 ( ) ( ) 31.0 ( ) 26.3 ( ) ( ) 26.7 ( ) 28.9 ( ) Note: Results for Māori, Pacific and NZEO are presented in the online data tables. 234 A Focus on Nutrition: Key Findings of the 2008/09 New Zealand Adult Nutrition Survey
263 Table 6.10: Frequency of eating battered seafood (fish or shellfish), by age group, NZDep2006 and sex Never, or not consumed in past 4 weeks (prevalence), (95% CI) Less than 1 time per week (prevalence), (95% CI) 1+ times per week (prevalence), (95% CI) Total population 40.9 ( ) 42.4 ( ) 16.7 ( ) By age group (years) Males ( ) 32.5 ( ) 15.1 ( ) ( ) 41.9 ( ) 19.7 ( ) ( ) 43.5 ( ) 22.1 ( ) ( ) 43.6 ( ) 22.4 ( ) ( ) 34.5 ( ) 22.4 ( ) Total 37.3 ( ) 41.5 ( ) 21.1 ( ) Females ( ) 27.1 ( ) 12.6 ( ) ( ) 43.2 ( ) 12.0 ( ) ( ) 48.2 ( ) 13.7 ( ) ( ) 43.0 ( ) 10.5 ( ) ( ) 35.9 ( ) 15.5 ( ) Total 44.2 ( ) 43.1 ( ) 12.7 ( ) By NZDep2006 quintile Males ( ) 52.4 ( ) 16.0 ( ) ( ) 40.6 ( ) 23.8 ( ) ( ) 41.9 ( ) 17.8 ( ) ( ) 36.7 ( ) 22.5 ( ) ( ) 33.1 ( ) 27.2 ( ) Females ( ) 48.5 ( ) 9.5 ( ) ( ) 43.1 ( ) 12.6 ( ) ( ) 45.5 ( ) 10.0 ( ) ( ) 43.0 ( ) 13.4 ( ) ( ) 35.7 ( ) 17.8 ( ) Note: Results for Māori, Pacific and NZEO are presented in the online data tables. Processed meat The World Cancer Research Fund and American Institute for Cancer Research (2007) recommends avoiding processed meat due to convincing evidence that as more processed meat is consumed there is an increased risk of colorectal cancer. Processed meat is also likely to be relatively high in saturated fatty acids and sodium. A Focus on Nutrition: Key Findings of the 2008/09 New Zealand Adult Nutrition Survey 235
264 Survey questions In the past four weeks, which of the following have you eaten at all? Red meat; chicken; processed meats; seafood; none of these foods. How often do you eat processed meats? (Includes ham, bacon, sausages, luncheon, canned corned beef, pastrami, salami). Processed meat was eaten in the past four weeks by 87.3% of the total population aged 15 years and over (Table 6.11). Most reported eating processed meat either less than once a week (16.6%), one to two times per week (41.8%) or three to four times per week (20.4%). Males (90.0%) were more likely than females (84.9%) to have eaten processed meat in the past four weeks. Table 6.11: Frequency of eating processed meat, by age group, NZDep2006 and sex Never, or not consumed in past 4 weeks (prevalence), (95% CI) Less than 1 time per week (prevalence), (95% CI) 1 2 times per week (prevalence), (95% CI) 3 4 times per week (prevalence), (95% CI) 5+ times per week (prevalence), (95% CI) Total population 12.7 ( ) 16.6 ( ) 41.8 ( ) 20.4 ( ) 8.6 ( ) By age group (years) Males ( ) 9.2 ( ) 36.5 ( ) 31.8 ( ) 15.5 ( ) ( ) 12.4 ( ) 38.9 ( ) 21.8 ( ) 15.9 ( ) ( ) 10.8 ( ) 39.7 ( ) 29.0 ( ) 12.3 ( ) ( ) 17.8 ( ) 45.7 ( ) 16.2 ( ) 9.4 ( ) ( ) 14.0 ( ) 47.7 ( ) 16.5 ( ) 7.2 ( ) Total 10.0 ( ) 13.2 ( ) 41.6 ( ) 23.1 ( ) 12.0 ( ) Females ( ) 17.8 ( ) 34.9 ( ) 24.4 ( ) 10.9 ( ) ( ) 17.6 ( ) 42.6 ( ) 17.5 ( ) 5.0 ( ) ( ) 17.6 ( ) 43.6 ( ) 19.7 ( ) 5.8 ( ) ( ) 22.4 ( ) 40.8 ( ) 16.4 ( ) 3.8 ( ) ( ) 25.7 ( ) 43.2 ( ) 11.0 ( ) 4.9 ( ) Total 15.1 ( ) 19.7 ( ) 42.0 ( ) 17.8 ( ) 5.4 ( ) By NZDep2006 quintile Males ( ) 15.6 ( ) 40.1 ( ) 21.5 ( ) 11.7 ( ) ( ) 11.5 ( ) 43.3 ( ) 21.9 ( ) 17.6 ( ) ( ) 13.6 ( ) 39.8 ( ) 26.1 ( ) 11.5 ( ) ( ) 13.3 ( ) 43.6 ( ) 24.5 ( ) 8.7 ( ) ( ) 11.4 ( ) 41.6 ( ) 22.0 ( ) 10.0 ( ) Females ( ) 23.8 ( ) 43.9 ( ) 14.7 ( ) 5.4 ( ) ( ) 16.9 ( ) 45.9 ( ) 21.4 ( ) 2.8 ( ) ( ) 19.3 ( ) 37.5 ( ) 17.9 ( ) 6.7 ( ) ( ) 19.8 ( ) 42.2 ( ) 15.9 ( ) 6.4 ( ) ( ) 19.7 ( ) 40.6 ( ) 18.4 ( ) 6.0 ( ) Note: Results for Māori, Pacific and NZEO are presented in the online data tables. 236 A Focus on Nutrition: Key Findings of the 2008/09 New Zealand Adult Nutrition Survey
265
266
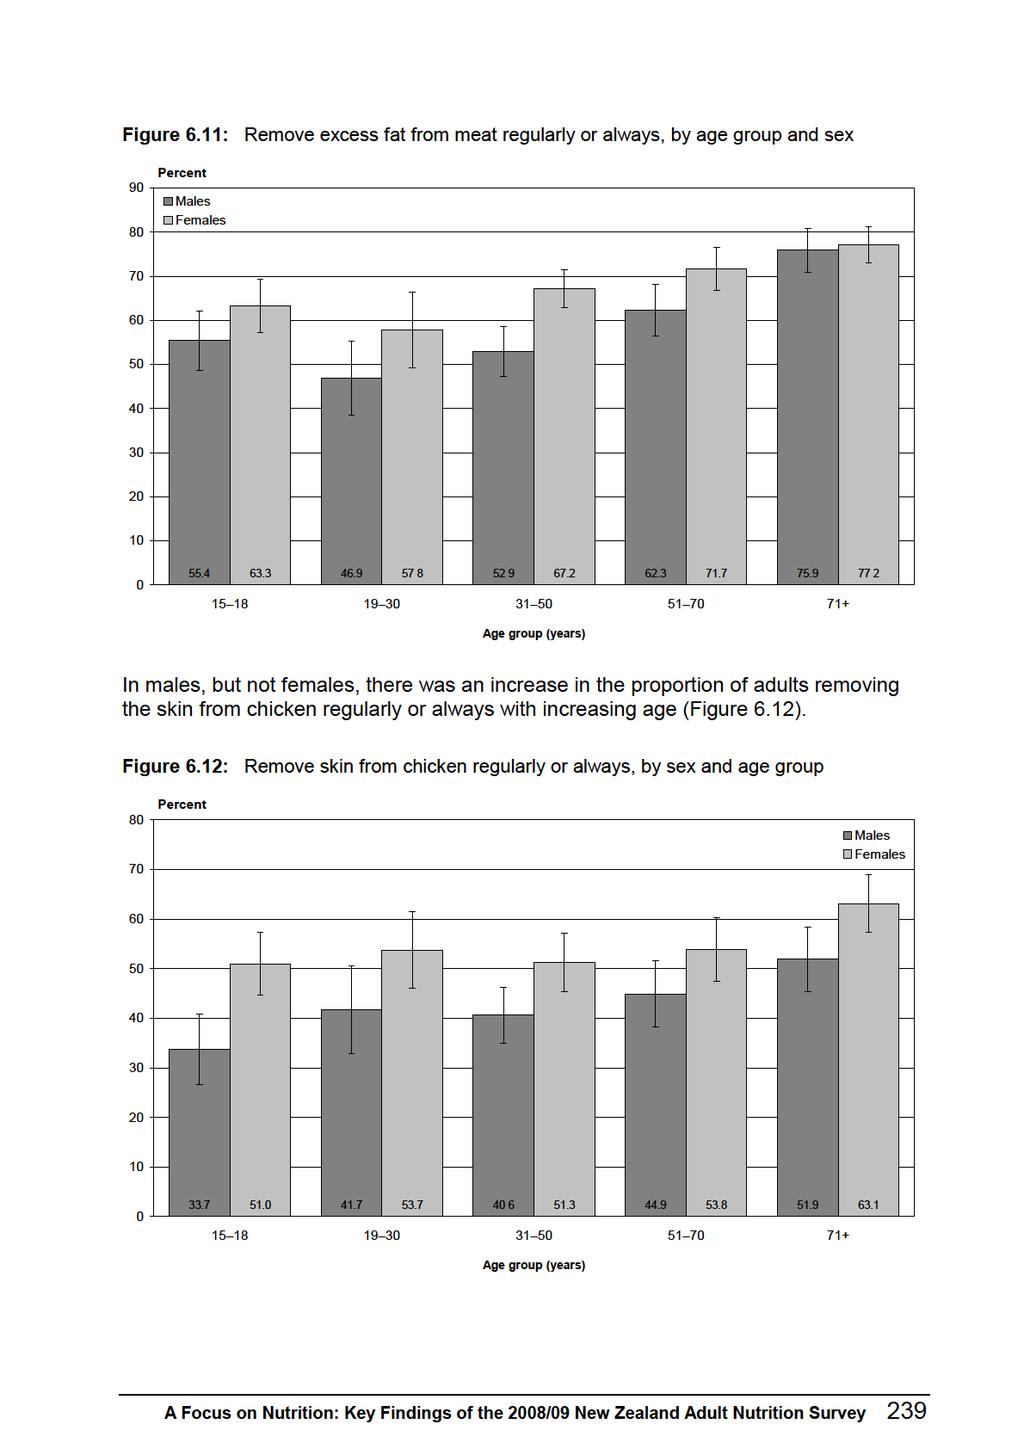
267
268 Overall, there was a decrease in those regularly or always removing the excess fat off meat, and in those regularly or always removing the skin off chicken with increasing neighbourhood deprivation, after adjusting for age, sex and ethnic group. Table 6.12: Frequency of removal of excess fat from meat, and removal of skin from chicken, by age group, NZDep2006 and sex Removal of excess fat from meat regularly/always (prevalence), (95% CI) Removal of chicken skin regularly/always (prevalence), (95% CI) Total population 62.1 ( ) 48.2 ( ) By age group (years) Males ( ) 33.7 ( ) ( ) 41.7 ( ) ( ) 40.6 ( ) ( ) 44.9 ( ) ( ) 51.9 ( ) Total 56.5 ( ) 42.3 ( ) Females ( ) 51.0 ( ) ( ) 53.7 ( ) ( ) 51.3 ( ) ( ) 53.8 ( ) ( ) 63.1 ( ) Total 67.4 ( ) 53.5 ( ) By NZDep2006 quintile Males ( ) 46.0 ( ) ( ) 41.4 ( ) ( ) 46.9 ( ) ( ) 42.5 ( ) ( ) 32.7 ( ) Females ( ) 57.4 ( ) ( ) 57.6 ( ) ( ) 56.5 ( ) ( ) 50.4 ( ) ( ) 44.9 ( ) Notes: Results for Māori, Pacific and NZEO are presented in the online data tables. Results for additional response options are presented in the online data tables. 240 A Focus on Nutrition: Key Findings of the 2008/09 New Zealand Adult Nutrition Survey
269
270 Use of spread was similar among males and females in most age groups, except that males aged years were less likely to use reduced-fat margarine (26.0%) than females of the same age group (37.6%). Use of spread was similar across age groups, except for a higher use of plant sterol margarine by those aged years compared to younger age groups. Males living in the most deprived neighbourhoods were less likely to use light or reduced-fat margarine (NZDep2006 quintile 5: 18.9%) than males living in the least deprived neighbourhoods (quintile 1: 38.0%) and more likely to use full-fat margarine (quintile 5: 47.5%; quintile 1: 27.7%). Females living in the most deprived neighbourhoods (quintile 5) were less likely to use butter (14.2%) than females living in the least deprived neighbourhoods (quintile 1: 31.5%), and more likely to use any type of margarine (full-fat or reduced-fat) (quintile 5: 76.0%; quintile 1: 58.6%). Females living in the most deprived neighbourhoods (quintile 5) were more likely to use full-fat margarine (49.0 %) than females living in the least deprived neighbourhoods (quintile 1: 18.3 %). Overall, there was an increase in those choosing any type of margarine across increasing neighbourhood deprivation, after adjusting for age, sex and ethnic group. 242 A Focus on Nutrition: Key Findings of the 2008/09 New Zealand Adult Nutrition Survey
271 Table 6.13: Type of spread used most of the time, by age group, NZDep2006 and sex Butter Prevalence (95% CI) Butter/margarine blend Prevalence (95% CI) Full-fat margarine Prevalence (95% CI) Light or reducedfat margarine Prevalence (95% CI) Plant sterol margarine Prevalence (95% CI) None Prevalence (95% CI) Margarine full-fat or light/reduced-fat Prevalence (95% CI) Total population 20.1 ( ) 3.6 ( ) 35.7 ( ) 28.5 ( ) 4.4 ( ) 7.7 ( ) 68.6 ( ) By age group (years) Males ( ) 3.0 ( ) 42.3 ( ) 20.9 ( ) 2.1 ( ) 8.0 ( ) 65.3 ( ) ( ) 2.0 ( ) 40.3 ( ) 25.8 ( ) 2.3 ( ) 12.3 ( ) 68.4 ( ) ( ) 5.4 ( ) 36.4 ( ) 27.6 ( ) 2.0 ( ) 6.7 ( ) 66.0 ( ) ( ) 3.1 ( ) 35.7 ( ) 26.0 ( ) 8.8 ( ) 6.9 ( ) 70.5 ( ) ( ) 2.5 ( ) 39.6 ( ) 28.7 ( ) 5.7 ( ) 4.4 ( ) 74.0 ( ) Total 20.2 ( ) 3.7 ( ) 37.8 ( ) 26.4 ( ) 4.2 ( ) 7.8 ( ) 68.4 ( ) Females ( ) 2.5 ( ) 44.9 ( ) 28.5 ( ) 0.3 ( ) 6.6 ( ) 73.8 ( ) ( ) 2.8 ( ) 37.5 ( ) 29.4 ( ) 2.3 ( ) 9.6 ( ) 69.2 ( ) ( ) 3.3 ( ) 36.9 ( ) 24.6 ( ) 2.3 ( ) 8.9 ( ) 63.9 ( ) ( ) 4.8 ( ) 24.7 ( ) 37.6 ( ) 9.8 ( ) 6.2 ( ) 72.1 ( ) ( ) 2.8 ( ) 31.7 ( ) 36.4 ( ) 5.6 ( ) 4.2 ( ) 73.6 ( ) Total 20.1 ( ) 3.5 ( ) 33.8 ( ) 30.5 ( ) 4.5 ( ) 7.7 ( ) 68.8 ( ) By NZDep2006 quintile Males ( ) 3.2 ( ) 27.7 ( ) 38.0 ( ) 4.7 ( ) 5.1 ( ) 70.4 ( ) ( ) 4.0 ( ) 40.5 ( ) 19.5 ( ) 4.5 ( ) 9.3 ( ) 64.4 ( ) ( ) 4.5 ( ) 36.3 ( ) 27.8 ( ) 5.2 ( ) 7.6 ( ) 69.2 ( ) ( ) 5.1 ( ) 39.7 ( ) 25.0 ( ) 3.6 ( ) 8.5 ( ) 68.3 ( ) ( ) 1.5 ( ) 47.5 ( ) 18.9 ( ) 3.0 ( ) 9.0 ( ) 69.4 ( ) Females ( ) 4.7 ( ) 18.3 ( ) 33.2 ( ) 7.1 ( ) 5.2 ( ) 58.6 ( ) ( ) 2.8 ( ) 31.6 ( ) 33.5 ( ) 4.7 ( ) 6.1 ( ) 69.9 ( ) ( ) 4.5 ( ) 32.1 ( ) 31.3 ( ) 4.8 ( ) 11.0 ( ) 68.2 ( ) ( ) 2.3 ( ) 37.0 ( ) 30.0 ( ) 3.0 ( ) 9.1 ( ) 70.0 ( ) ( ) 3.3 ( ) 49.0 ( ) 24.0 ( ) 3.0 ( ) 6.5 ( ) 76.0 ( ) Note: Results for Māori, Pacific and NZEO are presented in the online data tables. A Focus on Nutrition: Key Findings of the 2008/09 New Zealand Adult Nutrition Survey 243
272 Type of fat or oil used for cooking The Food and Nutrition Guidelines recommend using less fat in cooking, and when using fat, choosing a vegetable oil or oil high in monounsaturated fat (such as olive or canola oil). Survey question What type of fat or oil do you use most often when cooking? Response options: None, butter, margarine, oil, dripping or lard, other. Oil was used most often when cooking by 89.9% of the total population aged 15 years and over. There were no differences in type of oil used by males and females, or by age group (Table 6.14). There was no gradient across NZDep2006 quintiles in the proportion of the total population aged 15 years and over choosing less saturated fats (oil or margarine), after adjusting for age, sex and ethnic group. Use of low or reduced-fat varieties of food Survey question How often do you choose low or reduced-fat varieties of foods instead of the standard variety? Low or reduced-fat varieties of food were chosen regularly or always by 38.3%, sometimes by 26.0%, and never or rarely by 35.7% of the population (Table 6.14). Females aged years and years were more likely to have chosen low or reduced-fat varieties regularly or always compared to males of these age groups. The proportion of the total population aged 15 years and over who regularly or always chose low or reduced-fat varieties of foods increased with increasing age, then levelled off in those aged 51+ years. 244 A Focus on Nutrition: Key Findings of the 2008/09 New Zealand Adult Nutrition Survey
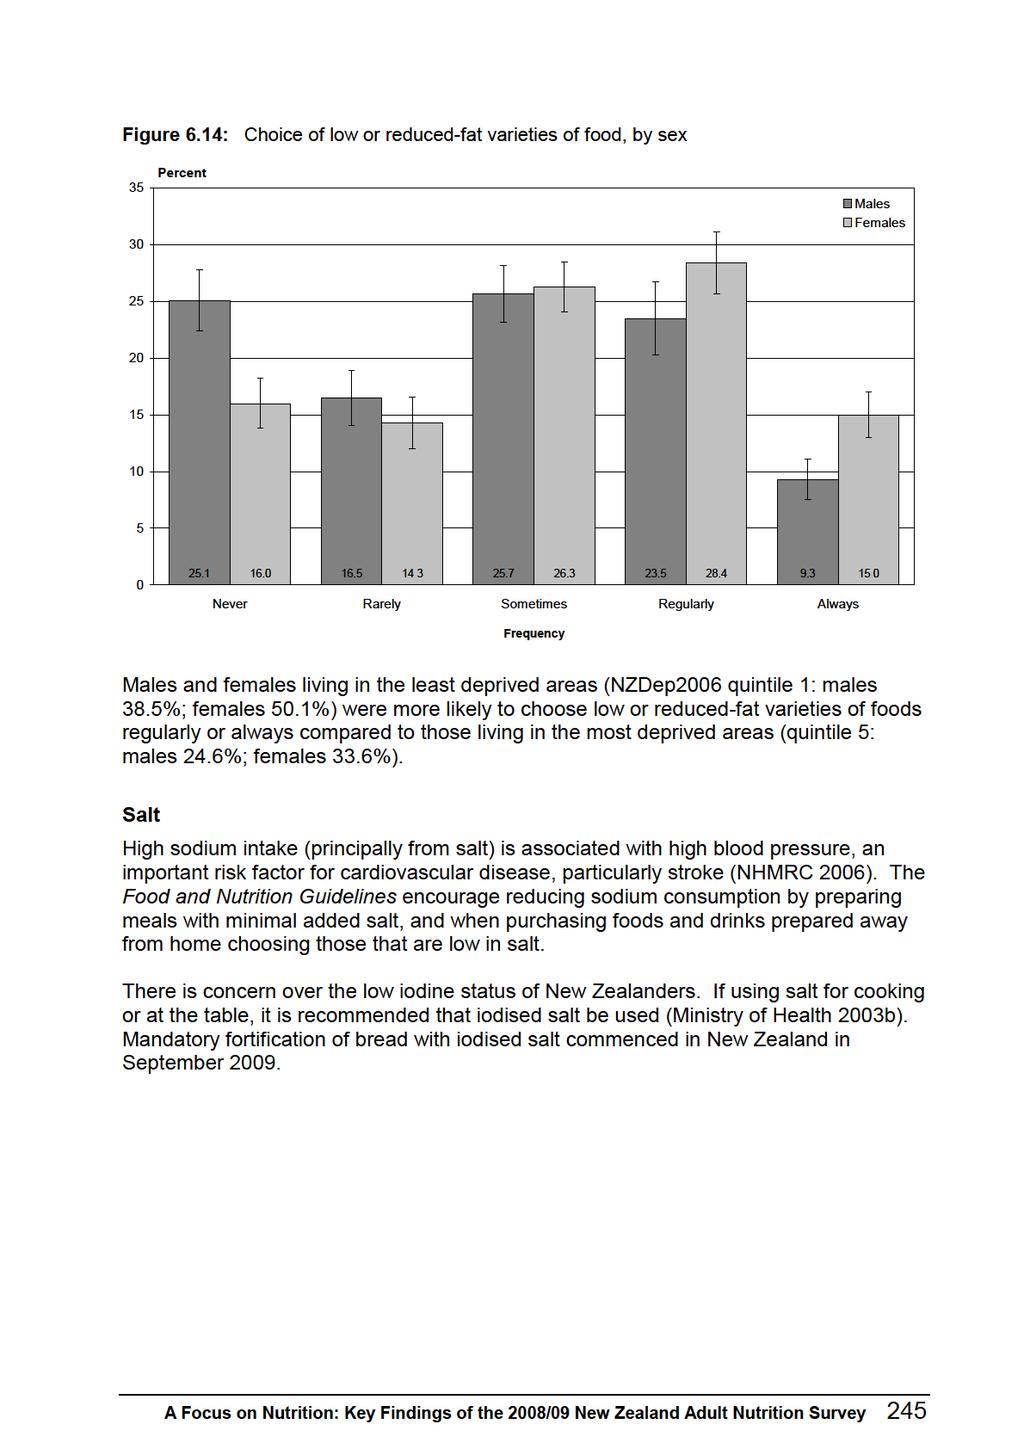
273
274 Survey question We are interested in whether or not your household uses any iodised salt. Not all salt is iodised, so it is best to view the packet. How often do you add salt to your food after it has been cooked or prepared? How often do you choose low- or reduced-salt varieties of foods instead of the standard variety? Adding salt to food and use of iodised salt Use of iodised salt Most of the total population aged 15 years and over (84.2%) used iodised salt at home, while 13.6% did not use iodised salt and 2.2% did not use any salt at home (Table 6.15). There were similar patterns of use of iodised salt among males and females and across age groups. Of those who used salt at home, 85.7% used iodised salt. Overall, there was no gradient across NZDep2006 quintiles of those who used iodised salt, after adjusting for age, sex and ethnic group. Addition of salt to food Salt was never or rarely added to food after it has been cooked or prepared by 47.9% of the total population aged 15 years and over (Table 6.14; Figure 6.15). There were similar patterns of addition of salt to food across age groups. 246 A Focus on Nutrition: Key Findings of the 2008/09 New Zealand Adult Nutrition Survey
275
276
277 Table 6.14: Cooking oil, salt, low-fat, low-salt foods, by age group, NZDep2006 and sex Oil used in cooking most of the time (prevalence), (95% CI) Low- or reduced-fat varieties of foods chosen regularly/ always (prevalence), (95% CI) Never/rarely add salt to food after it has been cooked or prepared (prevalence), (95% CI) Low- or reducedsalt varieties of foods chosen regularly/always (prevalence), (95% CI) Total population 89.9 ( ) 38.3 ( ) 47.9 ( ) 14.3 ( ) By age group (years) Males ( ) 11.7 ( ) 48.4 ( ) 5.4 ( ) ( ) 23.4 ( ) 43.1 ( ) 7.9 ( ) ( ) 32.2 ( ) 41.4 ( ) 11.3 ( ) ( ) 42.0 ( ) 43.5 ( ) 15.8 ( ) ( ) 46.6 ( ) 44.3 ( ) 21.7 ( ) Total 89.7 ( ) 32.8 ( ) 43.1 ( ) 12.3 ( ) Females ( ) 21.8 ( ) 56.9 ( ) 8.0 ( ) ( ) 37.0 ( ) 55.6 ( ) 11.0 ( ) ( ) 40.6 ( ) 50.4 ( ) 14.2 ( ) ( ) 55.6 ( ) 50.5 ( ) 25.0 ( ) ( ) 48.5 ( ) 53.6 ( ) 16.8 ( ) Total 90.1 ( ) 43.4 ( ) 52.2 ( ) 16.2 ( ) By NZDep2006 quintile Males ( ) 38.5 ( ) 45.3 ( ) 13.6 ( ) ( ) 34.6 ( ) 40.3 ( ) 17.1 ( ) ( ) 36.7 ( ) 48.5 ( ) 11.3 ( ) ( ) 27.2 ( ) 42.1 ( ) 8.7 ( ) ( ) 24.6 ( ) 38.6 ( ) 9.8 ( ) Females ( ) 50.1 ( ) 50.3 ( ) 16.8 ( ) ( ) 46.0 ( ) 52.0 ( ) 17.7 ( ) ( ) 47.0 ( ) 52.3 ( ) 16.0 ( ) ( ) 39.9 ( ) 56.8 ( ) 15.3 ( ) ( ) 33.6 ( ) 49.2 ( ) 15.2 ( ) Notes: Results for additional response options are presented in the online data tables. Results for Māori, Pacific and NZEO are presented in the online data tables. A Focus on Nutrition: Key Findings of the 2008/09 New Zealand Adult Nutrition Survey 249
278 Table 6.15: Use of iodised salt, by age group, NZDep2006 and sex Yes (prevalence), (95% CI) No (prevalence), (95% CI) Do not use salt (prevalence), (95% CI) NZ population (aged 15+) 84.2 ( ) 13.6 ( ) 2.2 ( ) By age group (years) Males ( ) 16.1 ( ) 0.8 ( ) ( ) 12.5 ( ) 1.7 ( ) ( ) 14.0 ( ) 1.7 ( ) ( ) 13.4 ( ) 4.0 ( ) ( ) 9.1 ( ) 5.0 ( ) Total 84.2 ( ) 13.2 ( ) 2.5 ( ) Females ( ) 16.5 ( ) 3.4 ( ) ( ) 13.2 ( ) 1.0 ( ) ( ) 18.0 ( ) 1.8 ( ) ( ) 10.0 ( ) 2.8 ( ) ( ) 8.4 ( ) 1.5 ( ) Total 84.2 ( ) 13.9 ( ) 2.0 ( ) By NZDep2006 quintile Males ( ) 14.5 ( ) 2.3 ( ) ( ) 11.4 ( ) 2.3 ( ) ( ) 11.2 ( ) 3.7 ( ) ( ) 15.9 ( ) 1.6 ( ) ( ) 13.3 ( ) 2.7 ( ) Females ( ) 15.0 ( ) 1.5 ( ) ( ) 12.8 ( ) 2.0 ( ) ( ) 12.5 ( ) 0.3 ( ) ( ) 16.1 ( ) 3.2 ( ) ( ) 13.0 ( ) 3.0 ( ) Notes: 1152 respondents did not know if the salt used in the home was iodised. Results for Māori, Pacific and NZEO are presented in the online data tables. 250 A Focus on Nutrition: Key Findings of the 2008/09 New Zealand Adult Nutrition Survey
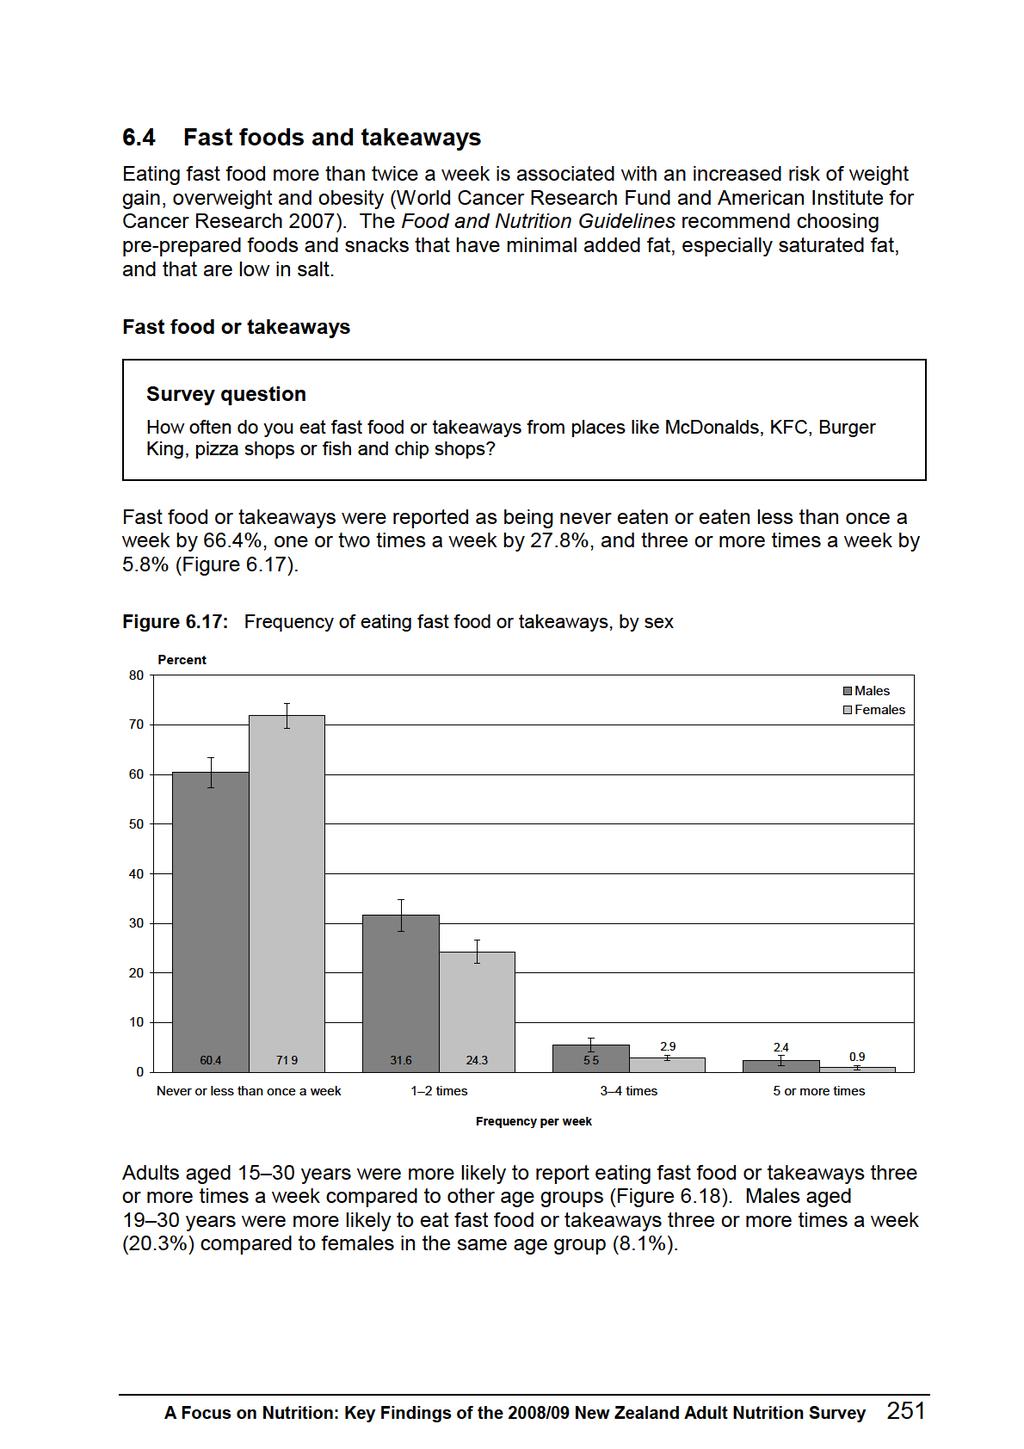
279
280
281
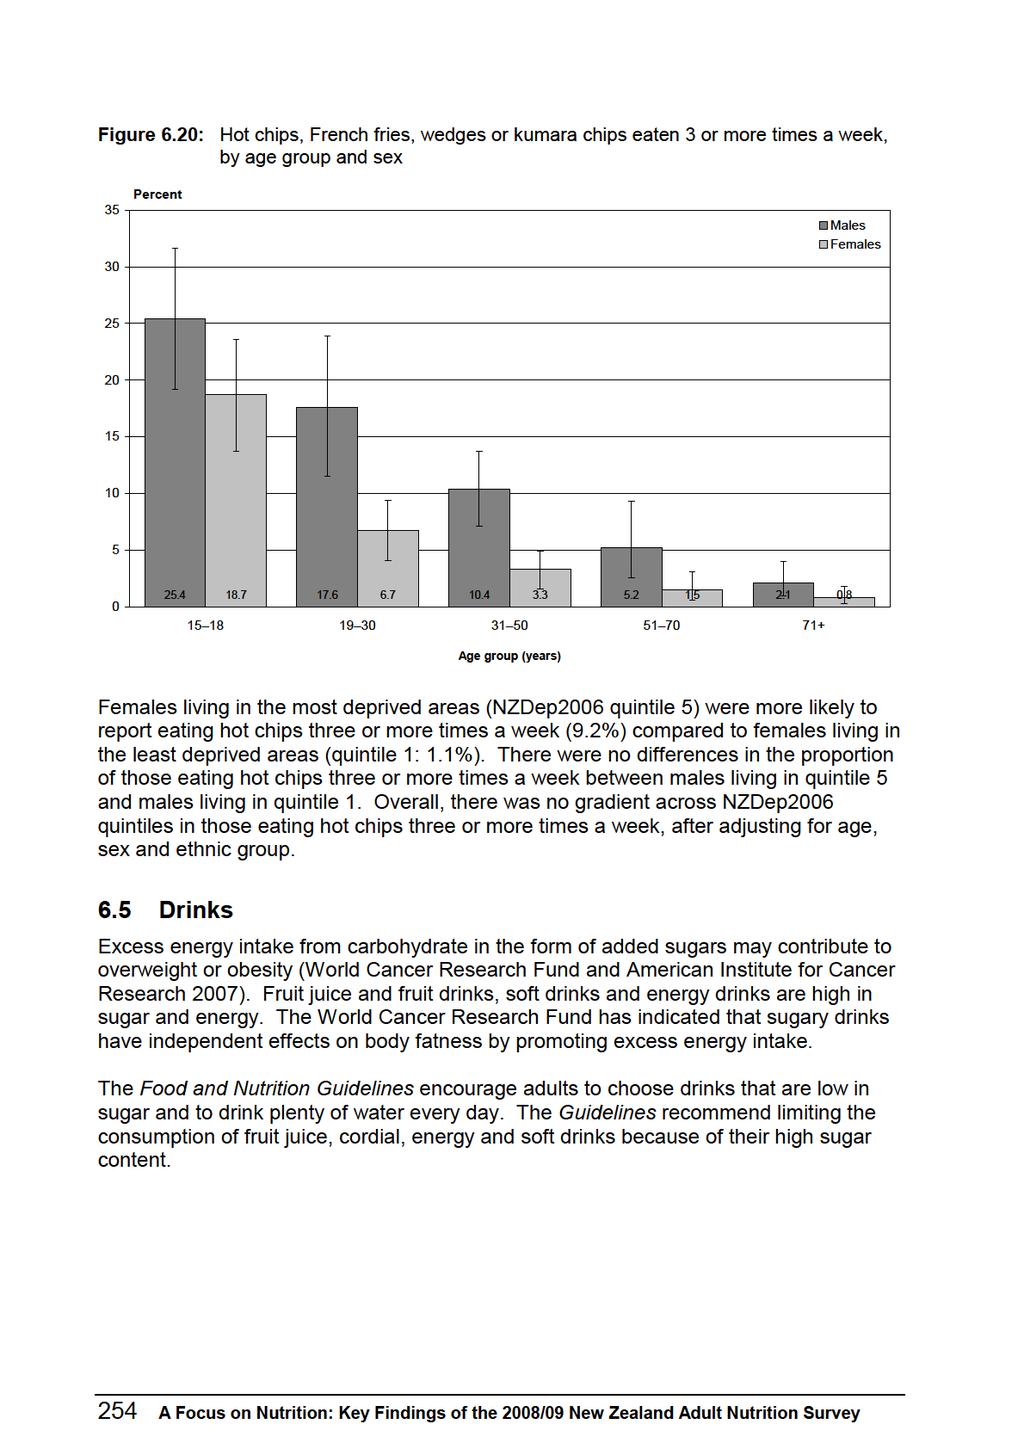
282
283
284
285
286 Table 6.16: Frequency of fast food, hot chips, fruit juice/fruit drinks and soft drinks/energy drinks, by age group, NZDep2006 and sex Fast food or takeaways eaten 3+ times a week (prevalence), (95% CI) Hot chips etc eaten 3+ times a week (prevalence), (95% CI) Fruit juice or fruit drinks consumed 3+ times a week (prevalence), (95% CI) Soft drinks or energy drinks consumed 3+ times a week (prevalence), (95% CI) Total population 5.8 ( ) 7.5 ( ) 36.6 ( ) 23.7 ( ) By age group (years) Males ( ) 25.4 ( ) 43.9 ( ) 52.5 ( ) ( ) 17.6 ( ) 48.6 ( ) 53.2 ( ) ( ) 10.4 ( ) 37.3 ( ) 28.7 ( ) ( ) 5.2 ( ) 34.9 ( ) 15.8 ( ) ( ) 2.1 ( ) 31.1 ( ) 11.5 ( ) Total 7.9 ( ) 10.9 ( ) 38.9 ( ) 30.5 ( ) Females ( ) 18.7 ( ) 48.5 ( ) 39.6 ( ) ( ) 6.7 ( ) 42.2 ( ) 27.8 ( ) ( ) 3.3 ( ) 31.2 ( ) 14.0 ( ) ( ) 1.5 ( ) 30.1 ( ) 11.3 ( ) ( ) 0.8 ( ) 33.3 ( ) 10.7 ( ) Total 3.8 ( ) 4.3 ( ) 34.5 ( ) 17.4 ( ) By NZDep2006 quintile Males ( ) 8.6 ( ) 41.9 ( ) 25.9 ( ) ( ) 10.6 ( ) 42.9 ( ) 32.1 ( ) ( ) 11.4 ( ) 39.6 ( ) 25.4 ( ) ( ) 11.5 ( ) 37.5 ( ) 33.8 ( ) ( ) 13.2 ( ) 31.0 ( ) 37.2 ( ) Females ( ) 1.1 ( ) 33.7 ( ) 13.9 ( ) ( ) 3.5 ( ) 38.9 ( ) 12.4 ( ) ( ) 3.5 ( ) 31.5 ( ) 16.8 ( ) ( ) 4.2 ( ) 36.0 ( ) 19.8 ( ) ( ) 9.2 ( ) 31.5 ( ) 24.8 ( ) Notes: Hot chips includes French fries, wedges and kumara chips. Fruit juices and drinks does not include diet or diabetic varieties. Soft drinks and energy drinks does not include diet varieties. 258 A Focus on Nutrition: Key Findings of the 2008/09 New Zealand Adult Nutrition Survey
287 7 Food Security Food security is an internationally recognised term that encompasses the ready availability of nutritionally adequate and safe foods, and the assured ability to acquire personally acceptable foods in a socially acceptable way (Radimer 2002). Participants responded to eight statements on behalf of themselves (if they lived alone) or their households. Each of these statements about food provides information on a particular facet of food security and relates to the issue of affordability; that is, the response was to be made in light of whether or not the participant felt they had enough money. As well as presenting results for eight facets of household food security, data for three categories of food security are presented: fully/almost food secure, moderately food secure and low food security. 7.1 The eight facets of food security Survey questions I/we can afford to eat properly. Food runs out in my/our household due to lack of money. I/we eat less because of lack of money. The variety of foods I am (we are) able to eat is limited by a lack of money. I/we rely on others to provide food and/or money for food, for my/our household, when I/we don t have enough money. I/we make use of special food grants or food banks when I/we do not have enough money for food. I feel stressed because of not having enough money for food. I feel stressed because I can t provide the food I want for social occasions. For the first statement, respondents were able to choose from the options: always, sometimes, never, don t know. For the remaining statements, respondents were able to choose from the options: often, sometimes, never, don t know. I/we can afford to eat properly Eighty percent of the New Zealand population aged 15 years and over reported they could always afford to eat properly (males 82.3%, females 78.3%) while 16.4% could only do this sometimes (Table 7.1). Being able to always afford to eat properly increased with increasing age, as reported by both males and females. Over 92% of males and females aged 71+ years said their household could always afford to eat properly, a higher proportion than men aged years and all younger women. A Focus on Nutrition: Key Findings of the 2008/09 New Zealand Adult Nutrition Survey 259
288 Being able to always afford to eat properly was reported least often by males and females living in NZDep2006 quintile 5, less than for those living in NZDep2006 quintiles 1 3. Food runs out in my/our household due to lack of money Food running out in the household due to lack of money was reported to occur often in 2.5% of New Zealand households and sometimes in 11.5% of households (Table 7.1). Females aged 71+ years were less likely than females aged years to report that their household often or sometimes ran out of food due to lack of money. Running out of food in the household due to lack of money was reported most frequently by those living in NZDep2006 quintile 5, compared to those living in less deprived neighbourhoods. Males living in NZDep2006 quintile 5 households were more likely to report that their household sometimes ran out of food due to lack of money than those in other quintiles. Females living in NZDep2006 quintiles 4 and 5 were more likely than all others to report that sometimes their household ran out of food due to lack of money. I/we eat less because of lack of money Eating less because of lack of money was reported to occur often in 2.9% of households and sometimes in 12.5% of households (Table 7.1). Both older males and older females (71+ years) were less likely than males aged years or females aged years to report that their household sometimes ate less because of lack of money. The proportion reporting sometimes eating less because of lack of money increased five-fold across quintiles of deprivation, and both males and females in the most deprived area (NZDep2006 quintile 5) reported that their household experienced this sometimes more often than males in all other areas and females living in NZDep2006 quintiles 1 3. The variety of food I am (we are) able to eat is limited by lack of money Having a variety of food was sometimes an issue for 22.8% of New Zealand households and was often an issue for 7.6% (Table 7.1). Males aged 51+ years and females aged 71+ years reported less frequently that this sometimes occurred than those aged years. Limiting the variety of food due to lack of money was reported often most frequently by males and females living in NZDep2006 quintile 5 (16.3% and 16.5%, respectively) compared to those living in NZDep2006 quintiles A Focus on Nutrition: Key Findings of the 2008/09 New Zealand Adult Nutrition Survey
289 I/we rely on others to provide food and/or money for food for my/our household when I/we don t have enough money This was reported to occur often in only 1.1% of New Zealand households, but sometimes in 7.7% of households (Table 7.1). Males and females aged years reported more frequently that this was often an issue for their household compared to all other males and females aged 31+ years. However, females aged years reported that this was sometimes an issue (17.2%), a more frequent occurrence than that reported by females aged 51+ years. I/we make use of special food grants or food banks when I/we do not have enough money for food Although less than 1% of the New Zealand population reported that this was often an issue for their household, 5.4% (males 5.0%; females 5.7%) said that it was sometimes an issue (Table 7.1). Males and females aged years reported more frequently experiencing the need for their household to sometimes use food grants/banks when money ran out than those aged 51+ years. Households in NZDep2006 quintile 5 were reported by both males and females to be more likely to use food grants/banks sometimes than households in NZDep2006 quintiles 1 3. I feel stressed because of not having enough money for food The experience of feeling stressed because of not having enough money for food was reported to occur sometimes in 12.4% of New Zealand households and often in 3.3% of households (Table 7.1). Both males and females aged years were sometimes stressed about lack of money for food more frequently than older people (71+ years). Households in NZDep2006 quintile 5 (males 19.1%; females 19.6%) were more likely to sometimes feel stressed because of not having enough money for food, an issue less frequently reported by males living in NZDep2006 quintiles 1 3 and by females living in NZDep2006 quintiles 1 and 2. I feel stressed because I can t provide the food I want for social occasions Among the New Zealand population aged 15 years and over this was reported to be an issue sometimes in 11.8% of households (males 8.9%; females 14.6%) (Table 7.1). Only 2.4% of households were reported to experience this often. Older males and females (71+ years) reported less frequently that their household experienced this sometimes compared to males aged years and females aged years. Males living in NZDep2006 quintile 5 were sometimes stressed about providing food for social occasions (16.2%) more often than those in NZDep2006 quintiles 1, 3 and 4. Females living in NZDep2006 quintile 5 reported experiencing this (25.4%) more often than those in NZDep2006 quintiles 1 3. A Focus on Nutrition: Key Findings of the 2008/09 New Zealand Adult Nutrition Survey 261
290 7.2 Categories of household food security Rasch analyses were performed using BIGSTEPS 2.82 (a DOS-based Rasch measurement program; Linacre & Wright 1998) to generate a measure of the severity of food insecurity for each participant. The statement I/we can afford to eat properly was anchored at 0, with values being assigned by Rasch analysis according to the number and severity of the indices the participant responded to positively (Parnell 2005). Based on the distribution of the respondents tendency to affirm these statements (ability scores in the Rasch model), and considering the meanings of these scores in terms of item responses (including the item difficulty scores in the Rasch model), households were then assigned to the following three categories: fully/almost fully food secure this included households providing no affirmative response to any of the eight statements and households responding to only one statement, which was most likely to be the variety of food is limited low food security this included households most likely to report relying on others for food or money for food and using special food grants or food banks to acquire the food they needed moderate food security this included households likely to respond positively to the remaining five statements. Fully/almost food secure In the New Zealand population 59.1% of households were classified as being fully/almost food secure (males 61.7%; females 56.6%) (Table 7.2; Figure 7.1). Households with those aged 71+ years were more frequently classified as fully/almost food secure than households of males aged years and females aged years. For Māori households, older males and females (51+ years) were classified more frequently as being fully/almost food secure than those aged years. There were no differences across age groups for Pacific households. Across quintiles of NZDep2006, the proportion of households classified as fully/almost food secure decreased, with households in NZDep2006 quintile 5 having the lowest proportion (males 41.4%; females 39.9%). Overall, the proportion of households classified as fully/almost food secure decreased with increasing neighbourhood deprivation, after adjusting for age, sex and ethnic group. Moderately food secure In the New Zealand population, 33.7% of households were classified as being moderately food secure (males 32.6%; females 34.6%) (Table 7.2; Figure 7.1). Males and females aged 71+ years were less frequently classified as moderately food secure than those aged years. 262 A Focus on Nutrition: Key Findings of the 2008/09 New Zealand Adult Nutrition Survey
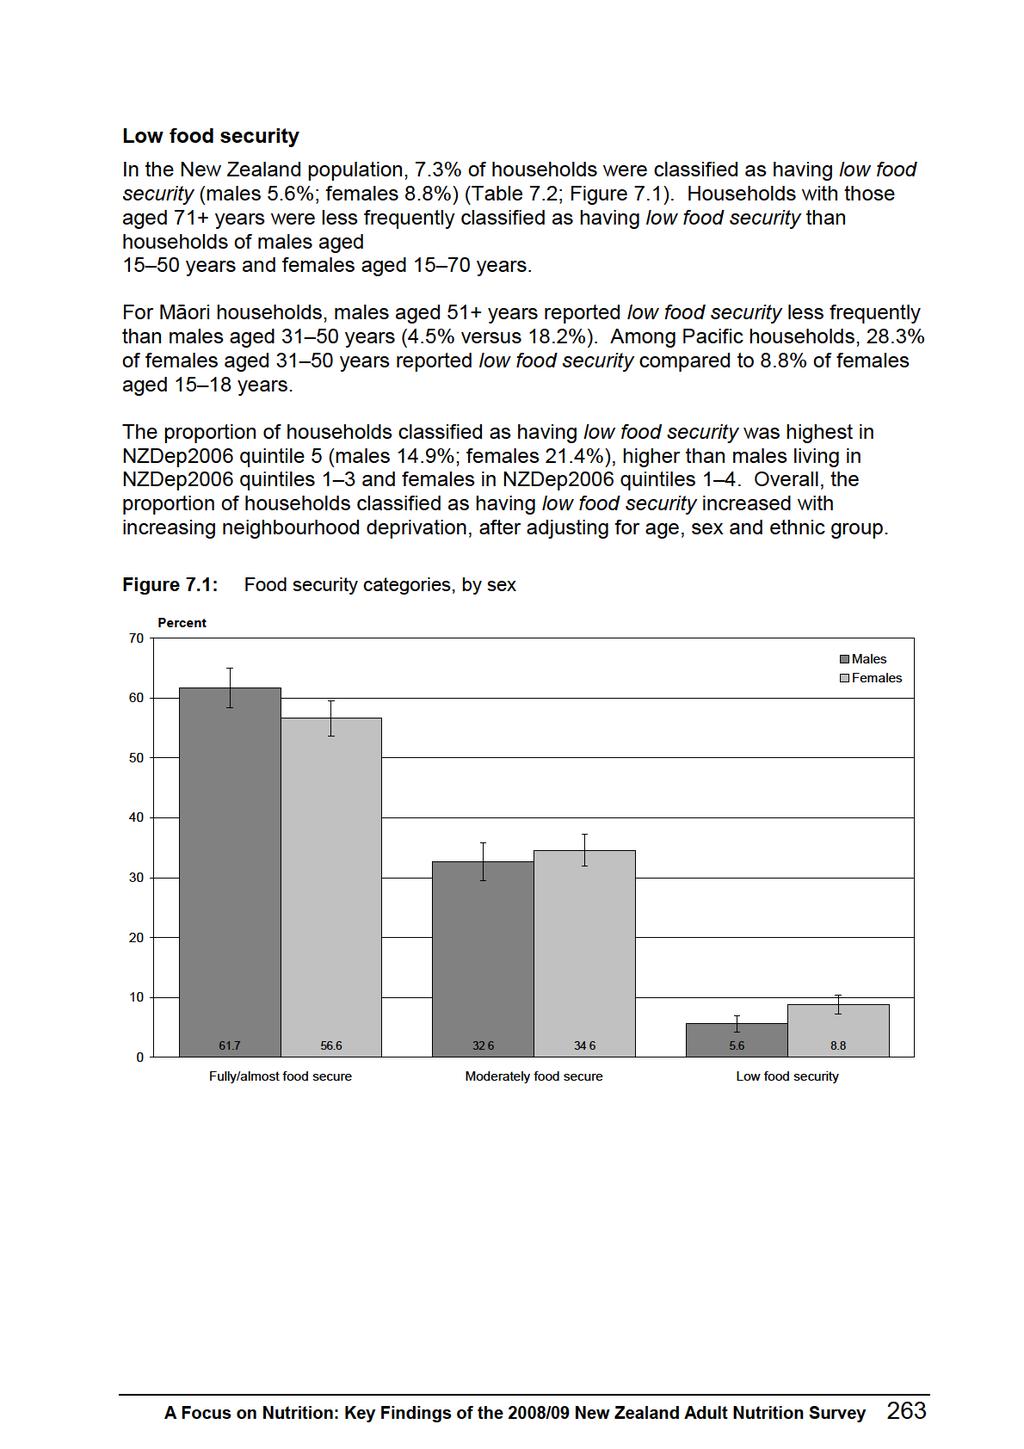
291
292 Table 7.1: Household food security over the last year, by age group, ethnic group, NZDep2006 and sex The household: 1 Because of lack of money, the household: 1 Can afford to eat properly Runs out of food Eats less Has a limited variety of foods Always Sometimes Never Often Sometimes Never Often Sometimes Never Often Sometimes Never Total population 80.2 ( ) 16.4 ( ) 3.4 ( ) 2.5 ( ) 11.5 ( ) 85.9 ( ) 2.9 ( ) 12.5 ( ) 84.7 ( ) 7.6 ( ) 22.8 ( ) 69.6 ( ) By age group (years) Males ( ) ( ) ( ) ( ) ( ) Total 82.3 ( ) 21.4 ( ) 21.7 ( ) 14.4 ( ) 10.3 ( ) 4.5 ( ) 14.4 ( ) 5.5 ( ) 5.2 ( ) 2.2 ( ) 2.9 ( ) 2.9 ( ) 3.3 ( ) 3.0 ( ) 1.9 ( ) 3.1 ( ) 0.9 ( ) 0.8 ( ) 2.0 ( ) 18.8 ( ) 18.7 ( ) 9.0 ( ) 7.8 ( ) 3.2 ( ) 10.8 ( ) 78.2 ( ) 79.5 ( ) 88.0 ( ) 91.3 ( ) 95.9 ( ) 87.1 ( ) 5.2 ( ) 3.8 ( ) 2.4 ( ) 0.7 ( ) 1.0 ( ) 2.3 ( ) 12.1 ( ) 17.4 ( ) 14.0 ( ) 8.5 ( ) 3.8 ( ) 12.1 ( ) 82.7 ( ) 78.8 ( ) 83.6 ( ) 90.8 ( ) 95.2 ( ) 85.6 ( ) 7.3 ( ) 9.9 ( ) 7.3 ( ) 5.2 ( ) 2.5 ( ) 6.8 ( ) 21.7 ( ) 33.7 ( ) 23.1 ( ) 11.5 ( ) 10.1 ( ) 20.8 ( ) 71.0 ( ) 56.4 ( ) 69.6 ( ) 83.3 ( ) 87.3 ( ) 72.3 ( ) Females ( ) ( ) ( ) ( ) ( ) Total 78.3 ( ) 20.7 ( ) 29.4 ( ) 20.8 ( ) 11.0 ( ) 4.8 ( ) 18.2 ( ) 6.2 ( ) 3.2 ( ) 3.2 ( ) 3.7 ( ) 3.2 ( ) 3.5 ( ) 2.7 ( ) 3.8 ( ) 4.2 ( ) 1.9 ( ) 0.4 ( ) 3.0 ( ) 16.9 ( ) 18.2 ( ) 13.6 ( ) 8.5 ( ) 2.8 ( ) 12.2 ( ) 80.4 ( ) 78.0 ( ) 82.2 ( ) 89.6 ( ) 96.8 ( ) 84.8 ( ) 1.3 ( ) 3.8 ( ) 5.3 ( ) 2.0 ( ) 0.4 ( ) 3.4 ( ) 16.5 ( ) 18.4 ( ) 14.1 ( ) 9.4 ( ) 4.1 ( ) 12.8 ( ) 82.2 ( ) 77.8 ( ) 80.6 ( ) 88.6 ( ) 95.4 ( ) 83.8 ( ) 6.0 ( ) 12.3 ( ) 10.7 ( ) 5.2 ( ) 1.5 ( ) 8.3 ( ) 30.2 ( ) 29.1 ( ) 29.3 ( ) 18.9 ( ) 10.6 ( ) 24.6 ( ) 63.9 ( ) 58.6 ( ) 60.0 ( ) 76.0 ( ) 87.9 ( ) 67.1 ( ) 264 A Focus on Nutrition: Key Findings of the 2008/09 New Zealand Adult Nutrition Survey
293 The household: 1 Because of lack of money, the household: 1 Can afford to eat properly Runs out of food Eats less Has a limited variety of foods Always Sometimes Never Often Sometimes Never Often Sometimes Never Often Sometimes Never Māori Males ( ) ( ) ( ) ( ) Total 65.6 ( ) 25.8 ( ) 36.4 ( ) 29.4 ( ) 22.0 ( ) 29.3 ( ) 9.2 ( ) 7.3 ( ) 3.8 ( ) 2.2 ( ) 5.0 ( ) 11.3 ( ) 4.1 ( ) 6.3 ( ) 1.7 ( ) 5.2 ( ) 28.0 ( ) 36.2 ( ) 23.5 ( ) 13.1 ( ) 25.3 ( ) 60.7 ( ) 59.6 ( ) 70.2 ( ) 85.3 ( ) 69.5 ( ) 11.4 ( ) 4.8 ( ) 4.5 ( ) 1.9 ( ) 4.8 ( ) 25.6 ( ) 34.6 ( ) 24.1 ( ) 17.5 ( ) 25.8 ( ) 63.1 ( ) 60.6 ( ) 71.4 ( ) 80.6 ( ) 69.4 ( ) 25.0 ( ) 22.4 ( ) 16.5 ( ) 1.2 ( ) 15.7 ( ) 26.6 ( ) 31.7 ( ) 36.8 ( ) 27.2 ( ) 32.1 ( ) 48.3 ( ) 45.9 ( ) 46.7 ( ) 71.5 ( ) 52.2 ( ) Females ( ) ( ) ( ) ( ) Total 57.4 ( ) 30.9 ( ) 52.3 ( ) 35.4 ( ) 34.9 ( ) 39.5 ( ) 7.9 ( ) 1.6 ( ) 2.3 ( ) 4.1 ( ) 3.1 ( ) 5.0 ( ) 9.2 ( ) 9.5 ( ) 4.2 ( ) 7.8 ( ) 27.1 ( ) 26.4 ( ) 23.0 ( ) 21.6 ( ) 24.1 ( ) 67.9 ( ) 64.4 ( ) 67.5 ( ) 74.2 ( ) 68.1 ( ) 3.0 ( ) 4.3 ( ) 9.8 ( ) 4.0 ( ) 6.2 ( ) 23.7 ( ) 24.0 ( ) 21.8 ( ) 20.6 ( ) 22.4 ( ) 73.3 ( ) 71.7 ( ) 68.5 ( ) 75.4 ( ) 71.4 ( ) 8.6 ( ) 16.6 ( ) 20.0 ( ) 11.1 ( ) 15.9 ( ) 40.2 ( ) 33.7 ( ) 30.2 ( ) 33.0 ( ) 32.9 ( ) 51.2 ( ) 49.7 ( ) 49.8 ( ) 56.0 ( ) 51.2 ( ) Pacific Males ( ) ( ) ( ) ( ) Total 55.9 ( ) 52.3 ( ) 35.7 ( ) 42.2 ( ) 38.2 ( ) 40.7 ( ) ( ) 1.9 ( ) 2.4 ( ) 9.6 ( ) 3.4 ( ) 1.8 ( ) 4.8 ( ) 9.0 ( ) 4.7 ( ) 48.8 ( ) 35.5 ( ) 34.2 ( ) 39.8 ( ) 37.5 ( ) 46.5 ( ) 62.7 ( ) 61.0 ( ) 51.2 ( ) 57.8 ( ) ( ) 2.3 ( ) 2.8 ( ) 3.9 ( ) 2.5 ( ) 39.5 ( ) 39.6 ( ) 37.4 ( ) 38.5 ( ) 65.7 ( ) 58.2 ( ) 57.5 ( ) 58.7 ( ) 59.0 ( ) 7.2 ( ) 12.1 ( ) 10.9 ( ) 18.2 ( ) 12.2 ( ) 45.2 ( ) 27.4 ( ) 53.3 ( ) 37.7 ( ) 41.4 ( ) 47.6 ( ) 60.5 ( ) 35.8 ( ) 44.1 ( ) 46.4 ( ) A Focus on Nutrition: Key Findings of the 2008/09 New Zealand Adult Nutrition Survey 265
294 The household: 1 Because of lack of money, the household: 1 Can afford to eat properly Runs out of food Eats less Has a limited variety of foods Always Sometimes Never Often Sometimes Never Often Sometimes Never Often Sometimes Never Females ( ) ( ) ( ) ( ) Total 51.0 ( ) 51.6 ( ) 47.6 ( ) 42.5 ( ) 46.8 ( ) 45.9 ( ) ( ) 3.1 ( ) 4.4 ( ) 2.3 ( ) 3.1 ( ) 6.5 ( ) 5.7 ( ) 7.2 ( ) 5.8 ( ) 36.1 ( ) 28.7 ( ) 48.5 ( ) 52.5 ( ) 42.0 ( ) 62.0 ( ) 64.8 ( ) 45.8 ( ) 40.3 ( ) 52.1 ( ) 4.7 ( ) 8.5 ( ) 8.9 ( ) 7.3 ( ) 8.0 ( ) 29.2 ( ) 27.9 ( ) 35.1 ( ) 43.6 ( ) 34.0 ( ) 66.1 ( ) 63.6 ( ) 56.0 ( ) 49.1 ( ) 58.1 ( ) 11.5 ( ) 10.7 ( ) 15.0 ( ) 9.8 ( ) 12.2 ( ) 40.1 ( ) 54.4 ( ) 46.1 ( ) 53.0 ( ) 49.3 ( ) 48.4 ( ) 34.9 ( ) 38.9 ( ) 37.2 ( ) 38.4 ( ) NZEO Males ( ) ( ) ( ) ( ) Total 84.9 ( ) 19.5 ( ) 19.7 ( ) 11.2 ( ) 7.4 ( ) 12.0 ( ) 4.7 ( ) 4.9 ( ) 2.1 ( ) 2.7 ( ) 3.1 ( ) 1.9 ( ) 1.6 ( ) 2.6 ( ) 0.6 ( ) 1.6 ( ) 14.2 ( ) 15.8 ( ) 6.0 ( ) 5.2 ( ) 8.2 ( ) 83.9 ( ) 82.5 ( ) 91.5 ( ) 94.2 ( ) 90.2 ( ) 5.0 ( ) 4.0 ( ) 2.1 ( ) 0.7 ( ) 2.1 ( ) 9.2 ( ) 13.8 ( ) 11.3 ( ) 5.8 ( ) 9.6 ( ) 85.9 ( ) 82.2 ( ) 86.6 ( ) 93.5 ( ) 88.3 ( ) 4.5 ( ) 8.4 ( ) 5.7 ( ) 4.3 ( ) 5.6 ( ) 20.4 ( ) 34.4 ( ) 20.6 ( ) 9.4 ( ) 19.1 ( ) 75.1 ( ) 57.2 ( ) 73.7 ( ) 86.3 ( ) 75.3 ( ) Females ( ) ( ) ( ) ( ) Total 81.9 ( ) 16.0 ( ) 24.5 ( ) 17.8 ( ) 6.6 ( ) 14.6 ( ) 5.7 ( ) 3.3 ( ) 3.2 ( ) 3.7 ( ) 3.6 ( ) 2.6 ( ) 2.2 ( ) 3.4 ( ) 1.3 ( ) 2.3 ( ) 13.4 ( ) 15.8 ( ) 10.9 ( ) 4.5 ( ) 9.5 ( ) 84.0 ( ) 82.0 ( ) 85.7 ( ) 94.2 ( ) 88.2 ( ) 1.0 ( ) 3.3 ( ) 4.7 ( ) 1.4 ( ) 2.9 ( ) 13.5 ( ) 16.2 ( ) 12.2 ( ) 6.0 ( ) 10.6 ( ) 85.5 ( ) 80.4 ( ) 83.2 ( ) 92.6 ( ) 86.5 ( ) 5.1 ( ) 11.6 ( ) 9.5 ( ) 3.6 ( ) 7.3 ( ) 27.6 ( ) 26.4 ( ) 28.0 ( ) 14.5 ( ) 22.5 ( ) 67.4 ( ) 62.0 ( ) 62.5 ( ) 81.9 ( ) 70.2 ( ) 266 A Focus on Nutrition: Key Findings of the 2008/09 New Zealand Adult Nutrition Survey
295 The household: 1 Because of lack of money, the household: 1 Can afford to eat properly Runs out of food Eats less Has a limited variety of foods Always Sometimes Never Often Sometimes Never Often Sometimes Never Often Sometimes Never By NZDep2006 quintile Males ( ) ( ) ( ) ( ) ( ) 6.4 ( ) 14.5 ( ) 9.0 ( ) 17.5 ( ) 27.6 ( ) 4.7 ( ) 1.0 ( ) 1.4 ( ) 4.8 ( ) 4.8 ( ) 0.6 ( ) 1.1 ( ) 0.6 ( ) 3.3 ( ) 5.3 ( ) 5.5 ( ) 7.7 ( ) 6.6 ( ) 12.1 ( ) 24.9 ( ) 94.0 ( ) 91.2 ( ) 92.8 ( ) 84.6 ( ) 69.8 ( ) 1.7 ( ) 1.1 ( ) 1.1 ( ) 2.7 ( ) 5.7 ( ) 4.8 ( ) 9.8 ( ) 10.1 ( ) 13.2 ( ) 25.5 ( ) 93.6 ( ) 89.1 ( ) 88.8 ( ) 84.1 ( ) 68.8 ( ) 4.0 ( ) 2.7 ( ) 4.6 ( ) 8.4 ( ) 16.3 ( ) 16.0 ( ) 20.0 ( ) 19.1 ( ) 21.8 ( ) 29.2 ( ) 80.0 ( ) 77.4 ( ) 76.3 ( ) 69.8 ( ) 54.5 ( ) Females ( ) ( ) ( ) ( ) ( ) 8.0 ( ) 9.9 ( ) 14.2 ( ) 25.4 ( ) 34.3 ( ) 4.9 ( ) 4.3 ( ) 1.6 ( ) 4.0 ( ) 3.2 ( ) 1.0 ( ) 2.5 ( ) 2.4 ( ) 2.6 ( ) 6.7 ( ) 5.2 ( ) 4.6 ( ) 7.6 ( ) 18.3 ( ) 26.7 ( ) 93.9 ( ) 92.9 ( ) 90.0 ( ) 79.0 ( ) 66.6 ( ) 1.1 ( ) 3.8 ( ) 1.0 ( ) 3.3 ( ) 7.8 ( ) 4.5 ( ) 6.1 ( ) 11.7 ( ) 19.4 ( ) 22.6 ( ) 94.4 ( ) 90.2 ( ) 87.3 ( ) 77.3 ( ) 69.6 ( ) 1.9 ( ) 6.6 ( ) 6.6 ( ) 9.8 ( ) 16.5 ( ) 18.6 ( ) 16.1 ( ) 27.6 ( ) 29.2 ( ) 31.8 ( ) 79.5 ( ) 77.3 ( ) 65.8 ( ) 61.0 ( ) 51.7 ( ) 1 Option Don t know is not included in the analysis. A Focus on Nutrition: Key Findings of the 2008/09 New Zealand Adult Nutrition Survey 267
296 Total population 1.1 ( ) By age group (years) Males ( ) ( ) ( ) ( ) ( ) Total 0.8 ( ) Females ( ) ( ) ( ) ( ) ( ) Total 1.4 ( ) Because of lack of money, the household: 1 The household: 1 Relies on others for food Uses food grants/banks Is stressed about lack of money for food Is stressed when no food for social occasions Often Sometimes Never Often Sometimes Never Often Sometimes Never Often Sometimes Never 7.7 ( ) 6.2 ( ) 10.5 ( ) 8.0 ( ) 2.3 ( ) 2.0 ( ) 6.3 ( ) 7.4 ( ) 17.2 ( ) 9.9 ( ) 5.1 ( ) 1.5 ( ) 9.0 ( ) 91.2 ( ) 87.1 ( ) 89.2 ( ) 91.4 ( ) 97.4 ( ) 97.8 ( ) 92.9 ( ) 87.1 ( ) 80.0 ( ) 89.0 ( ) 94.5 ( ) 98.4 ( ) 89.6 ( ) 0.4 ( ) 1.0 ( ) 5.4 ( ) 5.8 ( ) ( ) 0.6 ( ) 6.7 ( ) ( ) 0.4 ( ) 0.3 ( ) 0.9 ( ) 1.0 ( ) 0.7 ( ) 0 ( ) 2.2 ( ) 5.0 ( ) 8.4 ( ) 9.3 ( ) 6.1 ( ) 4.0 ( ) ( ) 0.5 ( ) 5.7 ( ) 94.2 ( ) 93.1 ( ) 93.1 ( ) 92.6 ( ) 98.1 ( ) 97.4 ( ) 94.7 ( ) 90.8 ( ) 89.7 ( ) 93.2 ( ) 96.0 ( ) 99.5 ( ) 93.8 ( ) 3.3 ( ) 2.0 ( ) 2.1 ( ) 3.6 ( ) 1.6 ( ) 0.7 ( ) 2.4 ( ) 3.2 ( ) 5.5 ( ) 5.0 ( ) 3.6 ( ) 0.6 ( ) 4.2 ( ) 12.4 ( ) 13.0 ( ) 12.6 ( ) 13.5 ( ) 5.8 ( ) 3.1 ( ) 10.3 ( ) 14.0 ( ) 22.4 ( ) 18.4 ( ) 7.5 ( ) 3.2 ( ) 14.4 ( ) 84.3 ( ) 85.0 ( ) 85.2 ( ) 82.8 ( ) 92.6 ( ) 96.2 ( ) 87.3 ( ) 82.8 ( ) 72.1 ( ) 76.5 ( ) 88.8 ( ) 96.3 ( ) 81.4 ( ) 2.4 ( ) 3.3 ( ) 2.7 ( ) 1.9 ( ) 0.4 ( ) 1.1 ( ) 1.7 ( ) 2.5 ( ) 3.1 ( ) 4.3 ( ) 2.6 ( ) 0.3 ( ) 3.1 ( ) 11.8 ( ) 8.8 ( ) 11.7 ( ) 11.9 ( ) 5.2 ( ) 1.6 ( ) 8.9 ( ) 11.4 ( ) 17.1 ( ) 20.1 ( ) 9.4 ( ) 4.9 ( ) 14.6 ( ) 85.7 ( ) 87.9 ( ) 85.6 ( ) 86.2 ( ) 94.4 ( ) 97.3 ( ) 89.4 ( ) 86.1 ( ) 79.8 ( ) 75.6 ( ) 87.9 ( ) 94.8 ( ) 82.3 ( ) 268 A Focus on Nutrition: Key Findings of the 2008/09 New Zealand Adult Nutrition Survey
297 Māori Males ( ) ( ) ( ) ( ) Total 2.9 ( ) Females ( ) Pacific ( ) ( ) ( ) Total 3.3 ( ) Males ( ) ( ) ( ) ( ) Total 4.0 ( ) Because of lack of money, the household: 1 The household: 1 Relies on others for food Uses food grants/banks Is stressed about lack of money for food Is stressed when no food for social occasions Often Sometimes Never Often Sometimes Never Often Sometimes Never Often Sometimes Never 8.1 ( ) 18.8 ( ) 18.5 ( ) 6.7 ( ) 14.8 ( ) 14.3 ( ) 30.7 ( ) 19.7 ( ) 12.8 ( ) 20.7 ( ) 18.8 ( ) 20.3 ( ) 25.1 ( ) 23.4 ( ) 22.5 ( ) 82.8 ( ) 80.6 ( ) 77.2 ( ) 92.9 ( ) 82.3 ( ) 82.4 ( ) 65.8 ( ) 76.1 ( ) 85.8 ( ) 76.0 ( ) 73.7 ( ) 77.8 ( ) 72.2 ( ) 69.3 ( ) 73.5 ( ) 3.8 ( ) 11.3 ( ) ( ) 2.2 ( ) 19.1 ( ) ( ) 1.3 ( ) 2.7 ( ) 1.3 ( ) 3.5 ( ) 13.6 ( ) 11.4 ( ) 24.2 ( ) 17.3 ( ) ( ) 2.0 ( ) 18.5 ( ) ( ) ( ) 1.0 ( ) 2.0 ( ) 0.8 ( ) 23.3 ( ) 24.0 ( ) 18.5 ( ) 84.9 ( ) 84.7 ( ) 78.7 ( ) 96.7 ( ) 85.1 ( ) 86.0 ( ) 74.5 ( ) 79.2 ( ) 83.1 ( ) 79.5 ( ) 95.6 ( ) 85.6 ( ) 75.8 ( ) 74.0 ( ) 80.7 ( ) 8.0 ( ) 6.3 ( ) 7.2 ( ) 1.7 ( ) 5.8 ( ) 5.7 ( ) 10.4 ( ) 13.6 ( ) 6.3 ( ) 10.3 ( ) 5 ( ) 7.8 ( ) 4.9 ( ) 10.1 ( ) 6.8 ( ) 34.2 ( ) 19.9 ( ) 27.2 ( ) 13.4 ( ) 22.8 ( ) 16.5 ( ) 31.0 ( ) 21.3 ( ) 16.2 ( ) 22.3 ( ) 27 ( ) 33.0 ( ) 39.5 ( ) 32.0 ( ) 34.5 ( ) 57.8 ( ) 73.8 ( ) 65.7 ( ) 84.9 ( ) 71.4 ( ) 77.8 ( ) 58.5 ( ) 65.1 ( ) 77.6 ( ) 67.3 ( ) 68.0 ( ) 59.2 ( ) 55.7 ( ) 57.9 ( ) 58.7 ( ) 15.5 ( ) 3.8 ( ) 5.8 ( ) 2.5 ( ) 5.6 ( ) 4.3 ( ) 6.9 ( ) 9.5 ( ) 6.3 ( ) 7.5 ( ) 3.1 ( ) 3.3 ( ) 7.0 ( ) 8.0 ( ) 5.6 ( ) 11.4 ( ) 22.2 ( ) 19.5 ( ) 5.0 ( ) 16.1 ( ) 18.8 ( ) 31.3 ( ) 23.3 ( ) 17.9 ( ) 23.9 ( ) 36.1 ( ) 26.2 ( ) 32.7 ( ) 33.1 ( ) 31.2 ( ) 73.1 ( ) 74.0 ( ) 74.7 ( ) 92.4 ( ) 78.3 ( ) 76.9 ( ) 61.8 ( ) 67.2 ( ) 75.8 ( ) 68.6 ( ) 60.8 ( ) 70.5 ( ) 60.3 ( ) 58.9 ( ) 63.3 ( ) A Focus on Nutrition: Key Findings of the 2008/09 New Zealand Adult Nutrition Survey 269
298 Females ( ) NZEO ( ) ( ) ( ) Total 4.4 ( ) Males ( ) Because of lack of money, the household: 1 The household: 1 Relies on others for food Uses food grants/banks Is stressed about lack of money for food Is stressed when no food for social occasions Often Sometimes Never Often Sometimes Never Often Sometimes Never Often Sometimes Never 7.7 ( ) 20.3 ( ) 22.2 ( ) 23.1 ( ) 20.2 ( ) 4.1 ( ) ( ) ( ) ( ) Total 0.4 ( ) Females ( ) ( ) ( ) ( ) Total 1.0 ( ) 1.3 ( ) 4.5 ( ) 5.7 ( ) 15.6 ( ) 8.2 ( ) 2.9 ( ) 7.3 ( ) 82.1 ( ) 76.8 ( ) 73.4 ( ) 73.3 ( ) 75.4 ( ) 90.4 ( ) 91.7 ( ) 94.1 ( ) 98.7 ( ) 95.1 ( ) 89.1 ( ) 82.1 ( ) 91.3 ( ) 96.9 ( ) 91.7 ( ) 6.4 ( ) 1.5 ( ) 3.1 ( ) 1.2 ( ) 2.6 ( ) 0.5 ( ) 11.8 ( ) 18.6 ( ) 19.9 ( ) 16.8 ( ) 18.0 ( ) 4.4 ( ) ( ) 0.4 ( ) 0.1 ( ) 0.2 ( ) 0.4 ( ) 1.0 ( ) 0.3 ( ) 4.5 ( ) 1.2 ( ) 3.3 ( ) 6.0 ( ) 5.9 ( ) 4.4 ( ) ( ) 0.3 ( ) 3.7 ( ) 81.8 ( ) 80.0 ( ) 77.0 ( ) 81.9 ( ) 79.4 ( ) 95.1 ( ) 95.1 ( ) 95.2 ( ) 98.7 ( ) 96.5 ( ) 93.6 ( ) 93.1 ( ) 95.4 ( ) 98.3 ( ) 96.0 ( ) 5.7 ( ) 10.6 ( ) 13.4 ( ) 10.8 ( ) 11.2 ( ) 0.6 ( ) 1.3 ( ) 3.1 ( ) 1.1 ( ) 1.8 ( ) 2.9 ( ) 4.0 ( ) 3.7 ( ) 2.4 ( ) 3.2 ( ) 24.1 ( ) 25.5 ( ) 29.7 ( ) 46.7 ( ) 31.3 ( ) 10.5 ( ) 10.2 ( ) 11.1 ( ) 3.8 ( ) 8.1 ( ) 12.2 ( ) 21.2 ( ) 17.5 ( ) 4.5 ( ) 12.8 ( ) 70.2 ( ) 63.9 ( ) 56.9 ( ) 42.4 ( ) 57.6 ( ) 88.9 ( ) 88.5 ( ) 85.8 ( ) 95.1 ( ) 90.1 ( ) 84.9 ( ) 74.8 ( ) 78.8 ( ) 93.1 ( ) 84.0 ( ) 5.4 ( ) 7.6 ( ) 11.5 ( ) 8.5 ( ) 9.0 ( ) 1.7 ( ) 2.5 ( ) 1.1 ( ) 0.2 ( ) 1.1 ( ) 2.0 ( ) 2.1 ( ) 3.4 ( ) 1.7 ( ) 2.4 ( ) 15.5 ( ) 30.1 ( ) 27.5 ( ) 48.8 ( ) 31.3 ( ) 6.5 ( ) 9.3 ( ) 10.1 ( ) 3.4 ( ) 7.2 ( ) 10.2 ( ) 13.7 ( ) 19.3 ( ) 6.1 ( ) 12.6 ( ) 79.1 ( ) 62.3 ( ) 61.0 ( ) 42.6 ( ) 59.7 ( ) 91.9 ( ) 88.2 ( ) 88.9 ( ) 96.4 ( ) 91.8 ( ) 87.8 ( ) 84.2 ( ) 77.3 ( ) 92.2 ( ) 85 ( ) 270 A Focus on Nutrition: Key Findings of the 2008/09 New Zealand Adult Nutrition Survey
299 By NZDep2006 quintile Males ( ) ( ) ( ) ( ) ( ) Females ( ) ( ) ( ) ( ) ( ) Because of lack of money, the household: 1 The household: 1 Relies on others for food Uses food grants/banks Is stressed about lack of money for food Is stressed when no food for social occasions Often Sometimes Never Often Sometimes Never Often Sometimes Never Often Sometimes Never 5.0 ( ) 2.6 ( ) 4.8 ( ) 5.7 ( ) 14.4 ( ) 3.7 ( ) 3.5 ( ) 6.4 ( ) 11.8 ( ) 20.3 ( ) 1 Option Don t know is not included in the analysis ( ) 97.1 ( ) 95.0 ( ) 94.0 ( ) 82.9 ( ) 95.2 ( ) 96.1 ( ) 92.5 ( ) 86.9 ( ) 76.1 ( ) 0.1 ( ) 0.1 ( ) 0.3 ( ) 0.5 ( ) 0.9 ( ) 1.2 ( ) 0.7 ( ) 3.7 ( ) 7.8 ( ) 13.4 ( ) ( ) 0.1 ( ) 0.2 ( ) 0.9 ( ) 1.6 ( ) 0.5 ( ) 3.8 ( ) 8.3 ( ) 16.4 ( ) 98.8 ( ) 99.2 ( ) 96.0 ( ) 91.8 ( ) 85.7 ( ) 99.8 ( ) 99.4 ( ) 96.0 ( ) 90.8 ( ) 82.0 ( ) 1.2 ( ) 1.7 ( ) 1.1 ( ) 2.3 ( ) 6.5 ( ) 0.2 ( ) 2.4 ( ) 3.2 ( ) 4.6 ( ) 10.6 ( ) 4.9 ( ) 10.1 ( ) 7.1 ( ) 12.3 ( ) 19.1 ( ) 7.0 ( ) 10.0 ( ) 16.4 ( ) 18.7 ( ) 19.6 ( ) 93.9 ( ) 88.3 ( ) 91.8 ( ) 85.5 ( ) 74.4 ( ) 92.8 ( ) 87.6 ( ) 80.4 ( ) 76.7 ( ) 69.8 ( ) 0.7 ( ) 6.4 ( ) ( ) 0.7 ( ) 2.8 ( ) 4.9 ( ) 0.1 ( ) 2.6 ( ) 2.8 ( ) 4.0 ( ) 5.8 ( ) 5.9 ( ) 7.1 ( ) 16.2 ( ) 8.9 ( ) 8.4 ( ) 11.3 ( ) 19.7 ( ) 25.4 ( ) 93.0 ( ) 89.9 ( ) 93.4 ( ) 90.2 ( ) 78.8 ( ) 91.0 ( ) 89.0 ( ) 85.9 ( ) 76.4 ( ) 68.8 ( ) A Focus on Nutrition: Key Findings of the 2008/09 New Zealand Adult Nutrition Survey 271
300 Table 7.2: Categories of household food security, 1 by age group, ethnic group, NZDep2006 and sex Fully/almost food secure (%, 95% CI) Moderately food secure (%, 95% CI) Low food security (%, 95% CI) Total population 59.1 ( ) 33.7 ( ) 7.3 ( ) By age group (years) Males ( ) 38.5 ( ) 9.0 ( ) ( ) 53.3 ( ) 6.1 ( ) ( ) 32.1 ( ) 7.5 ( ) ( ) 22.3 ( ) 3.0 ( ) ( ) 14.4 ( ) 2.2 ( ) Total 61.7 ( ) 32.6 ( ) 5.6 ( ) Females ( ) 47.3 ( ) 6.8 ( ) ( ) 44.7 ( ) 13.1 ( ) ( ) 38.3 ( ) 11.2 ( ) ( ) 25.0 ( ) 5.8 ( ) ( ) 19.0 ( ) 0.8 ( ) Total 56.6 ( ) 34.6 ( ) 8.8 ( ) Māori Male ( ) 45.6 ( ) 19.9 ( ) ( ) 60.4 ( ) 12.8 ( ) ( ) 47.8 ( ) 18.2 ( ) ( ) 36.0 ( ) 4.5 ( ) Total 37.6 ( ) 48.5 ( ) 13.9 ( ) Female ( ) 50.1 ( ) 16.0 ( ) ( ) 58.3 ( ) 20.9 ( ) ( ) 44.0 ( ) 21.0 ( ) ( ) 42.2 ( ) 11.7 ( ) Total 33.3 ( ) 48.3 ( ) 18.4 ( ) Pacific Males ( ) 66.1 ( ) 11.9 ( ) ( ) 43.0 ( ) 19.0 ( ) ( ) 55.5 ( ) 20.0 ( ) ( ) 41.2 ( ) 27.9 ( ) Total 29.6 ( ) 50.2 ( ) 20.2 ( ) Females ( ) 63.2 ( ) 8.8 ( ) ( ) 61.2 ( ) 19.7 ( ) ( ) 51.4 ( ) 28.3 ( ) ( ) 55.6 ( ) 23.6 ( ) Total 21.0 ( ) 56.6 ( ) 22.4 ( ) 272 A Focus on Nutrition: Key Findings of the 2008/09 New Zealand Adult Nutrition Survey
301 Fully/almost food secure (%, 95% CI) Moderately food secure (%, 95% CI) Low food security (%, 95% CI) NZEO Males ( ) 36.1 ( ) 6.6 ( ) ( ) 53.3 ( ) 4.4 ( ) ( ) 29.7 ( ) 5.6 ( ) ( ) 18.7 ( ) 1.9 ( ) Total 65.4 ( ) 30.6 ( ) 4.0 ( ) Females ( ) 44.6 ( ) 5.1 ( ) ( ) 41.9 ( ) 10.5 ( ) ( ) 36.8 ( ) 9.2 ( ) ( ) 21.2 ( ) 3.4 ( ) Total 60.8 ( ) 32.2 ( ) 7.0 ( ) By NZDep2006 quintile Males ( ) 26.4 ( ) 2.3 ( ) ( ) 31.9 ( ) 2.7 ( ) ( ) 31.3 ( ) 2.3 ( ) ( ) 32.0 ( ) 7.6 ( ) ( ) 43.7 ( ) 14.9 ( ) Females ( ) 31.6 ( ) 1.0 ( ) ( ) 26.2 ( ) 5.3 ( ) ( ) 35.5 ( ) 5.1 ( ) ( ) 41.5 ( ) 11.4 ( ) ( ) 38.8 ( ) 21.4 ( ) 1 Categories derived from Rasch analysis (see Chapter 7.2). A Focus on Nutrition: Key Findings of the 2008/09 New Zealand Adult Nutrition Survey 273
302 8 Nutrition-related Health Outcomes Nutrition-related health status was also assessed using a range of anthropometric, clinical and biochemical measures. These objective measures are not influenced by self-report and provide valuable information on nutritional status. While some of the indicators (eg, blood pressure and cholesterol) are influenced by a range of lifestyle factors, they have been included here because diet is a key modifiable determinant. At the end of the 24-hour dietary recall and questionnaires, participants (excluding pregnant women) had their blood pressure measured and their height, weight and waist measured (see the Methodology Report for details). Overall, 4407 and 4503 participants had valid blood pressure and anthropometric measurements taken, respectively. Participants were also asked to provide a blood and urine sample. Consenting participants were provided with a specimen collection kit and asked to visit a Canterbury Health Laboratory affiliated laboratory in their area within two weeks of the interview. Overall, 70% of participants (44% of those sampled) provided a blood and urine sample (see the Methodology Report for more information). Overall 3359 and 3315 participants had valid blood and urine samples, respectively 8.1 Body size A healthy body size is important for good health and wellbeing. Obesity is associated with a long list of health conditions, including: cardiovascular disease (ischaemic heart disease, high blood pressure and stroke), various types of cancer, type 2 diabetes, osteoarthritis, sleep apnoea, and psychological and social problems (World Health Organization 2000; World Cancer Research Fund and American Institute for Cancer Research 2007). Body measurements were made in the home, with the participant wearing light clothing and no shoes. Height was measured to the nearest 0.1 cm using a portable stadiometer (Seca 214). Weight was measured to the nearest 0.1 kg using electronic weighting scales (Tanita HD-351). Waist circumference was measured to the nearest 0.1 cm using a tape measure (W606PM anthropometric measuring tape). Body mass index (BMI) is a measure of weight, adjusted for height, and is calculated by dividing weight in kilograms by height in metres squared (kg/m 2 ). BMI is used internationally to classify underweight, normal, overweight and obesity. Since BMI does not distinguish between weight associated with muscle and weight associated with fat, it provides only a crude measure of body fatness in individuals. However, it does provide a good estimate of the proportion of the population with increased risk of health conditions associated with obesity (World Health Organization 2000). 274 A Focus on Nutrition: Key Findings of the 2008/09 New Zealand Adult Nutrition Survey
303 The following World Health Organization (2007) BMI cut-off points were used to define weight status for adults aged 19 years and over: underweight: BMI < kg/m 2 normal weight: BMI kg/m 2 overweight: BMI kg/m 2 obese: BMI kg/m 2. For participants aged years, the sex and age-specific BMI cut-off points developed by the International Obesity Taskforce (IOTF) were used to define underweight, normal range, overweight and obesity (Cole et al 2000; Cole et al 2007). The IOTF BMI cut-off points coincide with the World Health Organization BMI cut-off points for adults at age 18 years. Height and weight Males on average were 13.5 cm taller and 12.5 kg heavier than females. Males and females aged 71+ years had the lowest mean height (males cm; females cm) (Table 8.1). Younger males (15 30 years) were lighter than males aged years. Females aged years and females aged 71+ years were lighter than females aged years. Body mass index Mean BMI was 27.6 kg/m 2 for both males and females (Table 8.1). For males, those aged years had the lowest mean BMI (23.4 kg/m 2 ). Males aged years had a lower mean BMI than males in all older age groups. Among females, those aged years also had the lowest mean BMI (24.6 kg/m 2 ). Mean BMI was higher in males and females living in NZDep2006 quintile 5 than those living in quintile 1. Overall, mean BMI increased with increasing neighbourhood deprivation, after adjusting for age, sex and ethnic group. BMI category Among New Zealanders aged 15 years and over, 1.2% were classified as underweight (males 0.8%; females 1.5%), 34.1% were classified as normal weight (males 30.2%; females 37.9%), 37.0% were classified as overweight (males 41.3%; females 32.8%), and 27.8% were classified as obese (males 27.7%; females 27.8%) (Table 8.1; Figure 8.1). A Focus on Nutrition: Key Findings of the 2008/09 New Zealand Adult Nutrition Survey 275
304
305
306 Table 8.1: Body size, by age group, ethnic group, NZDep2006 and sex Height (cm) Weight (kg) BMI (kg/m 2 ) Weight status 1 Mean (95% CI) Mean (95% CI) Mean (95% CI) Under-weight % (95% CI) Normal % (95% CI) Over-weight% (95% CI) Obese% (95% CI) Total population ( ) 78.7 ( ) 27.6 ( ) 1.2 ( ) 34.1 ( ) 37.0 ( ) 27.8 ( ) Age group (years) Males ( ) 73.3 ( ) 23.4 ( ) 2.5 ( ) 63.5 ( ) 23.2 ( ) 10.8 ( ) ( ) 81.9 ( ) 25.9 ( ) 0.1 ( ) 46.8 ( ) 35.7 ( ) 17.4 ( ) ( ) 89.4 ( ) 28.4 ( ) 1.0 ( ) 24.2 ( ) 42.0 ( ) 32.8 ( ) ( ) 86.8 ( ) 28.8 ( ) 0.4 ( ) 17.9 ( ) 46.6 ( ) 35.1 ( ) ( ) 80.8 ( ) 27.7 ( ) 0.5 ( ) 23.2 ( ) 51.9 ( ) 24.4 ( ) Total ( ) 85.1 ( ) 27.6 ( ) 0.8 ( ) 30.2 ( ) 41.3 ( ) 27.7 ( ) Females ( ) 66.6 ( ) 24.6 ( ) 1.4 ( ) 58.1 ( ) 26.9 ( ) 13.6 ( ) ( ) 71.4 ( ) 26.4 ( ) 4.1 ( ) 48.4 ( ) 22.4 ( ) 25.1 ( ) ( ) 74.7 ( ) 27.9 ( ) 0.4 ( ) 36.4 ( ) 35.3 ( ) 27.9 ( ) ( ) 73.9 ( ) 28.8 ( ) 0.8 ( ) 28.4 ( ) 36.1 ( ) 34.6 ( ) ( ) 67.7 ( ) 27.2 ( ) 2.6 ( ) 34.0 ( ) 39.1 ( ) 24.4 ( ) Total ( ) 72.6 ( ) 27.6 ( ) 1.5 ( ) 37.9 ( ) 32.8 ( ) 27.8 ( ) Māori Male ( ) 75.2 ( ) 24.4 ( ) ( ) 28.2 ( ) 9.4 ( ) ( ) 89.3 ( ) 28.8 ( ) ( ) 44.0 ( ) 31.9 ( ) ( ) 99.9 ( ) 32.2 ( ) ( ) 36.6 ( ) 53.0 ( ) ( ) 91.4 ( ) 30.9 ( ) ( ) 24.5 ( ) 51.8 ( ) Total ( ) 91.6 ( ) 29.9 ( ) ( ) 34.9 ( ) 40.7 ( ) Female ( ) 69.5 ( ) 25.5 ( ) 0.9 ( ) 46.2 ( ) 35.7 ( ) 17.2 ( ) ( ) 82.0 ( ) 30.0 ( ) ( ) 30.0 ( ) 43.4 ( ) ( ) 85.3 ( ) 31.8 ( ) 0.5 ( ) 15.0 ( ) 32.1 ( ) 52.4 ( ) ( ) 81.7 ( ) 32.3 ( ) 1.0 ( ) 14.5 ( ) 21.2 ( ) 63.3 ( ) Total ( ) 81.8 ( ) 30.7 ( ) 0.5 ( ) 21.7 ( ) 29.7 ( ) 48.1 ( ) 278 A Focus on Nutrition: Key Findings of the 2008/09 New Zealand Adult Nutrition Survey
307 Height (cm) Weight (kg) BMI (kg/m 2 ) Weight status 1 Mean (95% CI) Mean (95% CI) Mean (95% CI) Under-weight % (95% CI) Normal % (95% CI) Over-weight% (95% CI) Obese% (95% CI) Pacific Males ( ) 83.7 ( ) 26.5 ( ) ( ) 35.3 ( ) 22.6 ( ) ( ) 99.7 ( ) 31.3 ( ) ( ) 29.9 ( ) 57.2 ( ) ( ) ( ) 33.1 ( ) 0.5 ( ) 8.1 ( ) 26.3 ( ) 65.2 ( ) ( ) 96.7 ( ) 32.3 ( ) ( ) 36.6 ( ) 60.9 ( ) Total ( ) 98.0 ( ) 31.5 ( ) 0.2 ( ) 13.1 ( ) 30.5 ( ) 56.2 ( ) Females ( ) 77.3 ( ) 27.8 ( ) ( ) 37.4 ( ) 28.3 ( ) ( ) 88.5 ( ) 32.1 ( ) 0.8 ( ) 15.3 ( ) 25.7 ( ) 58.3 ( ) ( ) 91.9 ( ) 34.4 ( ) ( ) 23.6 ( ) 66.1 ( ) ( ) 89.3 ( ) 34.7 ( ) ( ) 26.7 ( ) 68.0 ( ) Total ( ) 88.6 ( ) 33.0 ( ) 0.2 ( ) 13.7 ( ) 26.5 ( ) 59.5 ( ) NZEO Males ( ) 72.0 ( ) 22.9 ( ) 3.1 ( ) 66.1 ( ) 21.2 ( ) 9.5 ( ) ( ) 79.9 ( ) 25.3 ( ) 0.1 ( ) 51.4 ( ) 35.6 ( ) 12.9 ( ) ( ) 87.7 ( ) 27.8 ( ) 1.1 ( ) 26.5 ( ) 43.8 ( ) 28.6 ( ) ( ) 84.6 ( ) 28.2 ( ) 0.5 ( ) 19.8 ( ) 49.4 ( ) 30.3 ( ) Total ( ) 83.9 ( ) 27.1 ( ) 0.8 ( ) 31.7 ( ) 42.6 ( ) 24.8 ( ) Females ( ) 65.1 ( ) 24.1 ( ) 1.7 ( ) 61.1 ( ) 26.3 ( ) 10.9 ( ) ( ) 68.5 ( ) 25.4 ( ) 4.8 ( ) 54.2 ( ) 21.4 ( ) 19.5 ( ) ( ) 72.4 ( ) 27.0 ( ) 0.4 ( ) 40.4 ( ) 36.7 ( ) 22.5 ( ) ( ) 71.2 ( ) 27.9 ( ) 1.4 ( ) 31.6 ( ) 38.0 ( ) 29.0 ( ) Total ( ) 70.7 ( ) 26.9 ( ) 1.7 ( ) 41.0 ( ) 33.7 ( ) 23.7 ( ) A Focus on Nutrition: Key Findings of the 2008/09 New Zealand Adult Nutrition Survey 279
308 Height (cm) Weight (kg) BMI (kg/m 2 ) Weight status 1 Mean (95% CI) Mean (95% CI) Mean (95% CI) Under-weight % (95% CI) Normal % (95% CI) Over-weight% (95% CI) Obese% (95% CI) By NZDep2006 quintile Males ( ) 84.8 ( ) 27.2 ( ) 0.4 ( ) 31.5 ( ) 40.8 ( ) 27.3 ( ) ( ) 83.5 ( ) 27.0 ( ) 0.5 ( ) 32.9 ( ) 42.6 ( ) 24.1 ( ) ( ) 83.2 ( ) 27.0 ( ) ( ) 42.9 ( ) 23.7 ( ) ( ) 86.6 ( ) 27.9 ( ) 1.9 ( ) 27.5 ( ) 39.2 ( ) 31.4 ( ) ( ) 88.1 ( ) 28.8 ( ) 1.3 ( ) 24.3 ( ( ) 33.4 ( ) Females ( ) 68.3 ( ) 25.7 ( ) 1.6 ( ) 48.5 ( ) 33.5 ( ) 16.5 ( ) ( ) 70.0 ( ) 26.7 ( ) 2.4 ( ) 39.6 ( ) 39.7 ( ) 18.3 ( ) ( ) 73.3 ( ) 27.9 ( ) 0.4 ( ) 37.3 ( ) 31.7 ( ) 30.6 ( ) ( ) 73.2 ( ) 27.8 ( ) 2.3 ( ) 37.7 ( ) 27.4 ( ) 32.5 ( ) ( ) 78.0 ( ) 29.6 ( ) 1.0 ( ) 26.8 ( ) 31.0 ( ) 41.2 ( ) years: Cole et al 2007 BMI cut-offs. 19+ years: underweight BMI < kg/m 2 ; normal BMI kg/m 2 ; overweight BMI kg/m 2 ; obese BMI 30 kg/m 2 (World Health Organization 2000). 280 A Focus on Nutrition: Key Findings of the 2008/09 New Zealand Adult Nutrition Survey
309 8.2 Blood pressure High blood pressure is an important risk factor for heart disease, as well as for stroke and renal failure. The relationship between blood pressure and cardiovascular disease is continuous, with the risk increasing as blood pressure increases even among those within the normal range. Systolic blood pressure is a better predictor of cardiovascular disease risk than diastolic blood pressure (Prospective Studies Collaboration 2002; Neaton and Wentworth 1992). Blood pressure was measured using an OMRON HEM 907 instrument. Blood pressure was not measured in pregnant women because pregnancy alters a woman s blood pressure. Three measurements were taken for each participant, with the mean of the second and third measurements used to calculate diastolic and systolic blood pressure. Note that the results presented below are for all participants, regardless of whether or not they were taking prescribed blood pressure medication. Systolic blood pressure Mean systolic blood pressure was 126 mmhg (males 130 mmhg; females 122 mmhg) (Table 8.2). Systolic blood pressure increased with age and was highest for males and females aged 71+ years (141 mmhg and 143 mmhg, respectively) (Figure 8.3). This pattern was similar for Māori and Pacific males and females, with those aged 51+ years having higher systolic blood pressure than younger age groups. There were no differences in mean systolic blood pressure by NZDep2006 quintile for either males or females. Overall, there was no gradient in mean systolic blood pressure across NZDep2006 quintiles after adjusting for age, sex and ethnic group. A Focus on Nutrition: Key Findings of the 2008/09 New Zealand Adult Nutrition Survey 281
310
311 Table 8.2: Blood pressure, by age group, ethnic group, NZDep2006 and sex Systolic (mmhg) Mean 1 (95% CI) Diastolic (mmhg) Mean 1 (95% CI) Total population 126 ( ) 74 (73 75) By age group (years) Males ( ) 64 (62 65) ( ) 71 (69 72) ( ) 78 (76 79) ( ) 79 (77 80) ( ) 71 (70 73) Total 130 ( ) 75 (74 76) Females ( ) 65 (64 66) ( ) 70 (69 72) ( ) 74 (73 76) ( ) 76 (75 77) ( ) 73 (72 75) Total 122 ( ) 73 (73 74) Māori Male ( ) 66 (62 70) ( ) 74 (71 77) ( ) 81 (78 84) ( ) 83 (79 87) Total 131 ( ) 77 (76 79) Female ( ) 67 (65 69) ( ) 71 (69 73) ( ) 79 (76 81) ( ) 81 (77 84) Total 120 ( ) 76 (74 77) Pacific Males ( ) 62 (59 66) ( ) 71 (69 73) ( ) 80 (77 82) ( ) 79 (76 82) Total 127 ( ) 75 (73 76) Females ( ) 65 (62 68) ( ) 71 (69 74) ( ) 76 (73 78) ( ) 77 (74 80) Total 117 ( ) 73 (72 75) A Focus on Nutrition: Key Findings of the 2008/09 New Zealand Adult Nutrition Survey 283
312 Systolic (mmhg) Mean 1 (95% CI) Diastolic (mmhg) Mean 1 (95% CI) NZEO Males ( ) 63 (62 65) ( ) 70 (68 72) ( ) 77 (76 78) ( ) 76 (75 78) Total 130 ( ) 74 (74 75) Females ( ) 65 (64 67) ( ) 70 (68 72) ( ) 74 (73 75) ( ) 75 (74 76) Total 122 ( ) 73 (72 74) By NZDep2006 quintile Males ( ) 74 (72 76) ( ) 74 (72 76) ( ) 76 (74 78) ( ) 74 (72 76) ( ) 75 (73 77) Females ( ) 73 (71 75) ( ) 72 (70 73) ( ) 73 (72 75) ( ) 73 (72 75) ( ) 75 (74 76) 1 Systolic and diastolic pressures are the means of the participants second and third readings. 8.3 Iron status Iron is an essential component of haemoglobin, the part of red blood cells that transports oxygen. Iron also has an important role in cognitive development. Iron needs are higher in women of child-bearing age (to replace iron lost during menstruation) and during pregnancy (to replace iron lost to the developing foetus and during delivery) (Mann and Truswell 2007). Iron deficiency is the most frequently encountered nutritional deficiency world-wide (Mann and Truswell 2007). There are three stages of iron deficiency. In the first stage, body iron stores start to become depleted but red cell production is not affected. In the second stage (iron deficiency without anaemia), body iron stores are depleted and levels of circulating iron start to fall, although blood haemoglobin concentrations are maintained. In the final stage (iron deficiency anaemia), body iron stores are severely depleted and the amount of iron circulating is very low, which results in reduced red cell production and low haemoglobin concentrations. Iron-deficiency anaemia is associated with decreased work capacity, fatigue, and some specific cognitive learning effects (Mann and Truswell 2007). 284 A Focus on Nutrition: Key Findings of the 2008/09 New Zealand Adult Nutrition Survey
313 A range of biochemical indices are needed to assess all stages of iron deficiency. The cut-offs used to indicate iron status are shown in Table 8.3. Note that iron-deficiency anaemia is a subset of iron deficiency. Table 8.3: Status Iron status measures Measures and cut-offs Low serum ferritin Low haemoglobin Iron deficiency (with or without anaemia) Iron-deficiency anaemia Serum ferritin < 12 µg/l Haemoglobin: < 136 g/l (15 19 years male) < 137 g/l (20 49 years male) < 133 g/l (50 69 years male) < 124 g/l (70+ years male) < 120 g/l (15 69 years female) < 118 g/l (70+ years female) Serum ferritin < 12 µg/l and zinc protoporphyrin > 60 µmol/mol Serum ferritin < 12 µg/l and zinc protoporphyrin > 60 µmol/mol and low haemoglobin Notes: References for cut-offs are as follows: serum ferritin (Looker et al 1997); zinc protoporphyrin (Hastka et al 1996); haemoglobin (Looker et al 1997). Participants with a serum C-reactive protein > 8 mg/l were not included in calculations of mean serum ferritin, low serum ferritin or iron deficiency (Martinez and Coli 1987). Ferritin Serum ferritin is an indicator of iron stores. Mean serum ferritin concentration was 177 µg/l for males and 80 µg/l for females (Table 8.4). There was a marked upward trend in mean serum ferritin concentrations in both males and females, from years (61 µg/l and 39 µg/l, respectively) to years (216 µg/l and 129 µg/l, respectively). Five percent of the New Zealand population had low iron stores, as indicated by serum ferritin concentrations of < 12 µg/l (males 1.5%; females 8.4%). Haemoglobin Mean haemoglobin concentration was 149 g/l for males and 133 g/l for females (Table 8.4). Among males, those aged 71+ years (139 g/l) had lower concentrations of haemoglobin than all other age groups. Among females, those aged 71+ years (131 g/l) and years (also 131 g/l) had lower concentrations than those aged years (135 g/l). A Focus on Nutrition: Key Findings of the 2008/09 New Zealand Adult Nutrition Survey 285
314 Iron deficiency Overall, the prevalence of iron deficiency was 4.2% and the prevalence of irondeficiency anaemia was 2.0% (Table 8.5). Iron deficiency was more common in females (7.2% and 3.5% for iron deficiency and iron-deficiency anaemia, respectively) than males (1.1%; 0.6%). Across age groups, the prevalence of iron deficiency and iron-deficiency anaemia was greatest in females aged years (10.6% and 4.9%, respectively) and years (12.1% and 6.0%, respectively). The prevalence of iron deficiency among Māori reflected that among the whole population, with the highest prevalence in females aged years and years. Overall, there was no gradient across NZDep2006 quintiles in the prevalence of iron deficiency or the prevalence of iron-deficiency anaemia, after adjusting for age, sex and ethnic group. Table 8.4: Ferritin and haemoglobin, by age group, ethnic group, NZDep2006 and sex Mean (95% CI) Ferritin (μg/l) % Low iron stores 1 (95% CI) Mean (95% CI) (95% CI) Haemoglobin (g/l) % Low 2 (95% CI) Total population 127 ( ) 5.0 ( ) 141 ( ) 7.6 ( ) By age group (years) Males (55 68) 0.6 ( ) 150 ( ) 6.0 ( ) ( ) 2.0 ( ) 152 ( ) 3.8 ( ) ( ) 1.9 ( ) 151 ( ) 4.7 ( ) ( ) 1.3 ( ) 148 ( ) 6.7 ( ) ( ) 0.4 ( ) 139 ( ) 26.0 ( ) Total 177 ( ) 1.5 ( ) 149 ( ) 7.1 ( ) Females (34 43) 12.2 ( ) 133 ( ) 6.9 ( ) (46 58) 7.7 ( ) 134 ( ) 4.8 ( ) (53 66) 13.4 ( ) 131 ( ) 10.2 ( ) ( ) 2.9 ( ) 135 ( ) 7.0 ( ) ( ) 1.7 ( ) 131 ( ) 10.8 ( ) Total 79 (75 84) 8.4 ( ) 133 ( ) 8.1 ( ) Māori Male (54 78) ( ) 5.7 ( ) ( ) ( ) 19.1 ( ) ( ) 0.7 ( ) 151 ( ) 2.6 ( ) ( ) ( ) 7.2 ( ) Total 187 ( ) 0.2 ( ) 150 ( ) 8.6 ( ) Female (28 49) 14.6 ( ) 131 ( ) 15.2 ( ) (43 60) 10.8 ( ) 133 ( ) 5.3 ( ) (59 85) 12.9 ( ) 134 ( ) 6.0 ( ) ( ) 1.3 ( ) 133 ( ) 10.9 ( ) Total 77 (66 88) 10.1 ( ) 133 ( ) 7.9 ( ) 286 A Focus on Nutrition: Key Findings of the 2008/09 New Zealand Adult Nutrition Survey
315 Ferritin (μg/l) Haemoglobin (g/l) Mean (95% CI) % Low iron stores 1 (95% CI) Mean (95% CI) (95% CI) % Low 2 (95% CI) Pacific Males Females NZEO ( ) ( ) ( ) ( ) 4.7 ( ) ( ) ( ) 5.4 ( ) Total 255 ( ) ( ) 2.3 ( ) (43 74) 10.2 ( ) 131 ( ) 15.5 ( ) (58 112) 12.6 ( ) 131 ( ) 14.6 ( ) ( ) ( ) 15.9 ( ) Total 94 (78 109) 9.8 ( ) 131 ( ) 14.5 ( ) Males (52 66) 0.7 ( ) 149 ( ) 7.3 ( ) ( ) 2.4 ( ) 153 ( ) 2.2 ( ) ( ) 2.0 ( ) 151 ( ) 4.9 ( ) ( ) 1.2 ( ) 145 ( ) 11.8 ( ) Total 169 ( ) 1.7 ( ) 149 ( ) 7.2 ( ) Females (33 42) 12.9 ( ) 133 ( ) 6.9 ( ) By NZDep2006 quintile (46 59) 6.7 ( ) 134 ( ) 3.4 ( ) (49 64) 13.6 ( ) 131 ( ) 10.3 ( ) ( ) 2.7 ( ) 134 ( ) 7.8 ( ) Total 78 (73 83) 8.2 ( ) 133 ( ) 7.8 ( ) Males ( ) 0.2 ( ) 149 ( ) 6.9 ( ) ( ) 0.2 ( ) 150 ( ) 4.6 ( ) ( ) 0.6 ( ) 149 ( ) 6.5 ( ) ( ) 3.7 ( ) 149 ( ) 10.0 ( ) ( ) 3.2 ( ) 149 ( ) 7.5 ( ) Females 1 83 (70 97) 12.7 ( ) 132 ( ) 8.2 ( ) 2 86 (76 97) 5.6 ( ) 132 ( ) 7.7 ( ) 3 72 (63 81) 8.8 ( ) 133 ( ) 8.5 ( ) 4 75 (67 84) 8.0 ( ) 133 ( ) 8.1 ( ) 5 81 (72 90) 7.7 ( ) 133 ( ) 8.3 ( ) 1 Serum ferritin < 12 μg/l. Serum ferritin concentration data for participants with serum C-reactive protein > 8 mg/l were not included in calculations of either serum ferritin or iron status. 2 < 136 g/l males years; < 137g/L males years; < 133g/L males years; < 124 g/l males 70+ years; < 120 g/l females years; < 118 g/l females 70+ years. 3 Results not reported due to small sample size. A Focus on Nutrition: Key Findings of the 2008/09 New Zealand Adult Nutrition Survey 287
316 Table 8.5: Prevalence of iron deficiency, by age group, ethnic group, NZDep2006 and sex With or without anaemia 1 (%), (95% CI) With anaemia 2 (%), (95% CI) Total population 4.2 ( ) 2.1 ( ) By age group (years) Males ( ) ( ) 1.3 ( ) ( ) 0.3 ( ) ( ) 0.4 ( ) Total 1.1 ( ) 0.6 ( ) Females ( ) 5.2 ( ) ( ) 1.2 ( ) ( ) 6.3 ( ) ( ) 2.1 ( ) ( ) 0.4 ( ) Total 7.2 ( ) 3.5 ( ) Māori Males ( ) 0.7 ( ) Total 0.2 ( ) 0.2 ( ) Females ( ) 10.9 ( ) ( ) 5.1 ( ) ( ) 4.9 ( ) ( ) 0.7 ( ) Total 9.4 ( ) 4.8 ( ) Pacific Males Females Total ( ) 4.7 ( ) ( ) 11.1 ( ) Total 9.4 ( ) 6.9 ( ) 288 A Focus on Nutrition: Key Findings of the 2008/09 New Zealand Adult Nutrition Survey
317 With or without anaemia 1 (%), (95% CI) With anaemia 2 (%), (95% CI) NZEO Males ( ) ( ) 1.4 ( ) ( ) 0.3 ( ) Total 1.2 ( ) 0.6 ( ) Females ( ) 5.3 ( ) By NZDep2006 quintile ( ) ( ) 6.2 ( ) ( ) 1.7 ( ) Total 6.9 ( ) 3.2 ( ) Males ( ) ( ) 0.6 ( ) ( ) 2.5 ( ) ( ) 0.0 Females ( ) 7.1 ( ) ( ) 2.2 ( ) ( ) 3.1 ( ) ( ) 3.1 ( ) ( ) 2.8 ( ) 1 Serum ferritin < 12 μg/l and zinc protoporphyrin > 60 μmol/mol. 2 Serum ferritin < 12 μg/l and zinc protoporphyrin > 60 μmol/mol and haemoglobin < 136 g/l males years; < 137 g/l males years; < 133g/L males years; < 124 g/l males 70+ years; < 120 g/l females years; < 118 g/l females 70+ years. 3 Results not reported due to small sample size. 8.4 Cholesterol Blood cholesterol is an important risk factor for cardiovascular disease, particularly ischaemic heart disease. The relationship between cholesterol and cardiovascular disease is continuous, with the risk increasing as cholesterol increases, even among those within the normal range. Modifiable determinants of blood cholesterol include diet (in particular dietary fat intake), body weight and physical activity levels. Blood cholesterol concentrations can also be influenced by lipid-lowering medications. Total cholesterol consists largely of the cholesterol in low-density lipoprotein particles (LDL cholesterol) plus the cholesterol in high-density lipoprotein (HDL cholesterol). LDL cholesterol is associated with a higher risk of cardiovascular disease and HDL with a lower risk (Mann and Truswell 2007). The ratio of total:hdl cholesterol is also a strong predictor of vascular disease mortality (Prospective Studies Collaboration et al 2007; Erqou et al 2009), with the optimum ratio < 4.5 (New Zealand Guidelines Group 2003). Because blood samples in the 2008/09 NZANS were non-fasting, LDL cholesterol could not be measured. A Focus on Nutrition: Key Findings of the 2008/09 New Zealand Adult Nutrition Survey 289
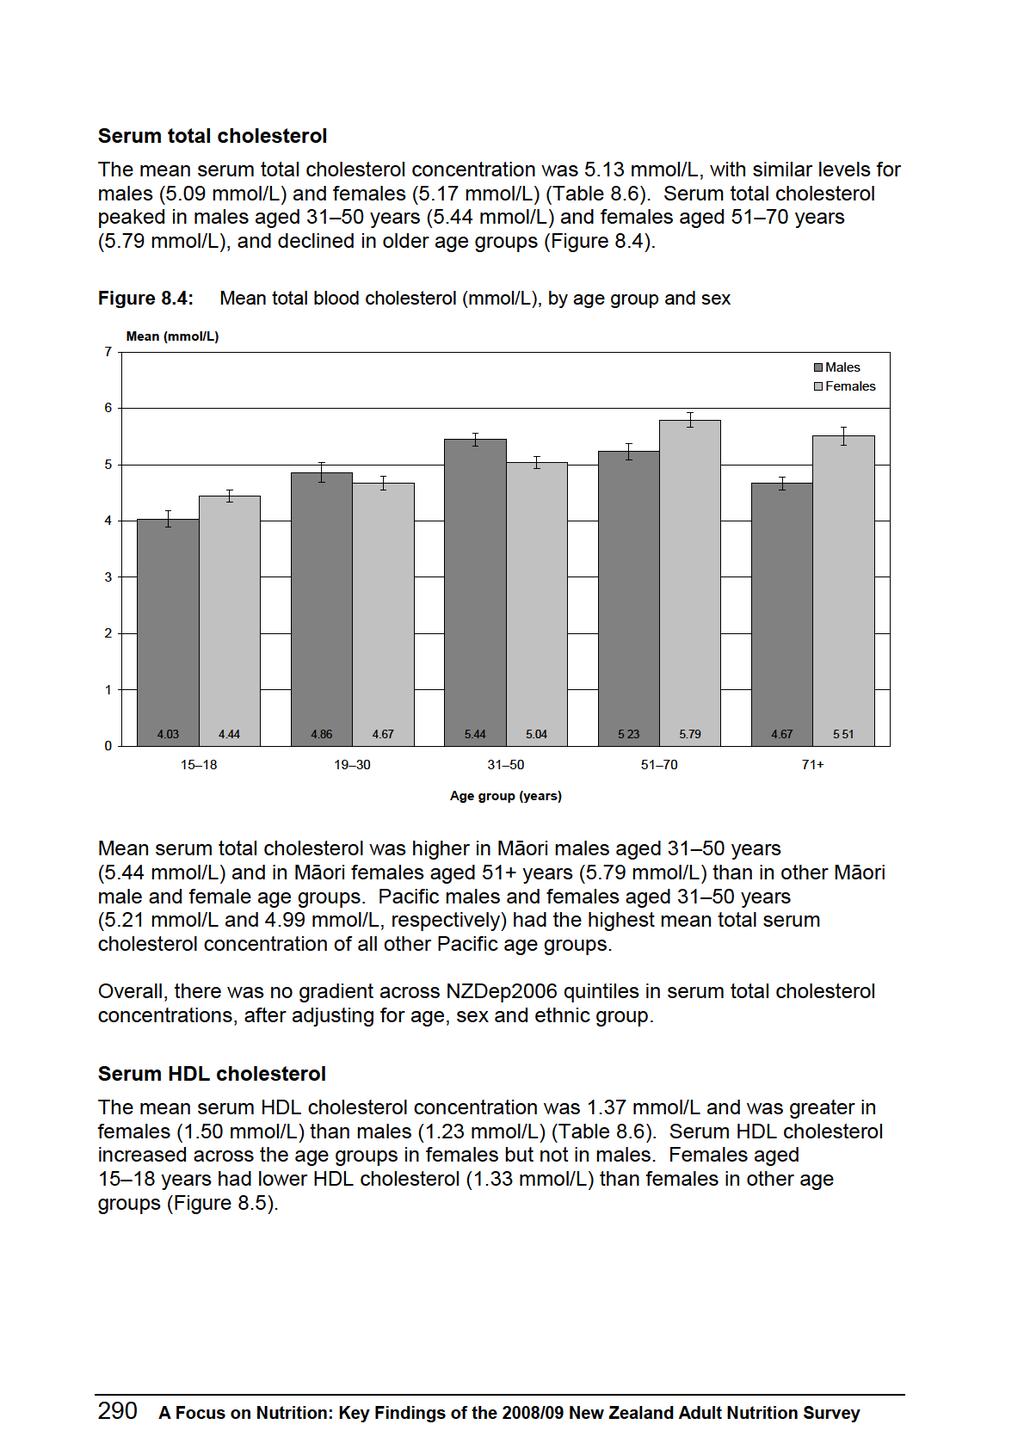
318
319
320 Table 8.6: Cholesterol, by age group, ethnic group, NZDep2006 and sex Total cholesterol (mmol/l) Mean (95% CI) HDL cholesterol (mmol/l) Mean (95% CI) Total:HDL ratio Mean (95% CI) Total population 5.13 ( ) 1.37 ( ) 3.95 ( ) By age group (years) Males ( ) 1.21 ( ) 3.44 ( ) ( ) 1.24 ( ) 4.07 ( ) ( ) 1.23 ( ) 4.65 ( ) ( ) 1.25 ( ) 4.41 ( ) ( ) 1.22 ( ) 4.05 ( ) Total 5.09 ( ) 1.23 ( ) 4.32 ( ) Females ( ) 1.33 ( ) 3.43 ( ) ( ) 1.44 ( ) 3.39 ( ) ( ) 1.48 ( ) 3.56 ( ) ( ) 1.60 ( ) 3.85 ( ) ( ) 1.53 ( ) 3.74 ( ) Total 5.17 ( ) 1.50 ( ) 3.61 ( ) Māori Male ( ) 1.24 ( ) 3.63 ( ) ( ) 1.19 ( ) 4.36 ( ) ( ) 1.17 ( ) 5.00 ( ) ( ) 1.32 ( ) 4.19 ( ) Total 5.17 ( ) 1.22 ( ) 4.47 ( ) Female ( ) 1.33 ( ) 3.21 ( ) ( ) 1.39 ( ) 3.30 ( ) ( ) 1.34 ( ) 3.80 ( ) ( ) 1.41 ( ) 4.08 ( ) Total 4.81 ( ) 1.37 ( ) 3.65 ( ) Pacific Males Females ( ) 1.13 ( ) 4.70 ( ) ( ) 1.29 ( ) 4.30 ( ) ( ) 1.16 ( ) 4.53 ( ) Total 4.97 ( ) 1.20 ( ) 4.38 ( ) ( ) 1.24 ( ) 3.75 ( ) ( ) 1.24 ( ) 4.16 ( ) ( ) 1.32 ( ) 3.84 ( ) Total 4.68 ( ) 1.27 ( ) 3.84 ( ) 292 A Focus on Nutrition: Key Findings of the 2008/09 New Zealand Adult Nutrition Survey
321 Total cholesterol (mmol/l) Mean (95% CI) HDL cholesterol (mmol/l) Mean (95% CI) Total:HDL ratio Mean (95% CI) NZEO Males ( ) 1.22 ( ) 3.45 ( ) ( ) 1.25 ( ) 3.96 ( ) ( ) 1.23 ( ) 4.63 ( ) ( ) 1.24 ( ) 4.32 ( ) Total 5.09 ( ) 1.24 ( ) 4.30 ( ) Females ( ) 1.34 ( ) 3.46 ( ) ( ) 1.46 ( ) 3.38 ( ) ( ) 1.51 ( ) 3.50 ( ) ( ) 1.60 ( ) 3.81 ( ) Total 5.22 ( ) 1.52 ( ) 3.59 ( ) By NZDep2006 quintile Males ( ) 1.26 ( ) 4.19 ( ) ( ) 1.24 ( ) 4.33 ( ) ( ) 1.29 ( ) 4.18 ( ) ( ) 1.22 ( ) 4.31 ( ) ( ) 1.16 ( ) 4.60 ( ) Females ( ) 1.62 ( ) 3.38 ( ) ( ) 1.54 ( ) 3.61 ( ) ( ) 1.52 ( ) 3.61 ( ) ( ) 1.43 ( ) 3.68 ( ) ( ) 1.39 ( ) 3.75 ( ) 1 Results not reported due to small sample size. 8.5 Folate status Folate 1 is essential for DNA synthesis, and is especially important during periods of increased cell replication and growth. Folate has a role in erythropoiesis (red blood cell formation/production), and therefore a deficiency in this vitamin can result in megaloblastic anaemia (Mann and Truswell 2007). In addition, inadequate folic acid levels during pregnancy have been associated with an increased risk of neural tube defects (NTDs), a major group of birth defects in the developing foetus (MRC Vitamin Study Research Group 1991). To reduce the incidence of NTDs, the Ministry of Health recommends that women of child-bearing age who plan to become pregnant take 800 µg of folic acid daily for at least four weeks prior to conception and for 12 weeks after conceiving. 1 Folate is a generic term for compounds that have a common vitamin activity (COMA 2000) and includes both folic acid (a synthetic compound) and naturally occurring compounds in food. A Focus on Nutrition: Key Findings of the 2008/09 New Zealand Adult Nutrition Survey 293
322 Since 1996 voluntary fortification of selected foods (eg, breakfast cereals, flour, breads) with folic acid has been permitted. A standard for the mandatory fortification of bread with folic acid was to come into effect in September 2009, but the implementation of the standard was deferred for review in May In the interim, the bread industry has agreed to increase the fortification of bread with folic acid voluntarily. Because the 2008/09 NZANS took place before any increase in uptake of voluntary folic acid fortification, the results presented in this report will provide a baseline to which the effects of this increased voluntary fortification can be compared. Reliable data on intake of naturally occurring folate and of folic acid (from fortified foods) are not available due to limitations in analytical techniques and because data for folic acid is largely based on the manufacturer s information on product labels, which is often higher than analytical values. However, folate status can be assessed by direct measurement of folate in serum and red blood cells. Red blood folate concentration is an indicator of long-term status, while serum folate indicates folate status at the time the blood sample was drawn. Red blood folate concentration was calculated using measurements of whole blood folate, serum folate and haematocrit, as follows (Senti and Pilch 1985): RBC folate (units) = WB folate (units) (serum folate (units) x (1 Hct)) Hct Measures of low folate status were defined as follows (Wright et al 1998): low red blood folate: < 317 nmol/l low serum folate: < 6.8 mmol/l. Red blood folate The mean red blood folate concentration in the New Zealand population was 900 nmol/l, with similar levels in males (899 nmol/l) and females (901 nmol/l) (Table 8.7). Mean red blood folate increased in males from 784 nmol/l (15 18 years) to 1018 nmol/l (71+ years), and in females from 758 nmol/l (15 18 years) to 1064 nmol/l (71+ years) (Figure 8.6). 294 A Focus on Nutrition: Key Findings of the 2008/09 New Zealand Adult Nutrition Survey
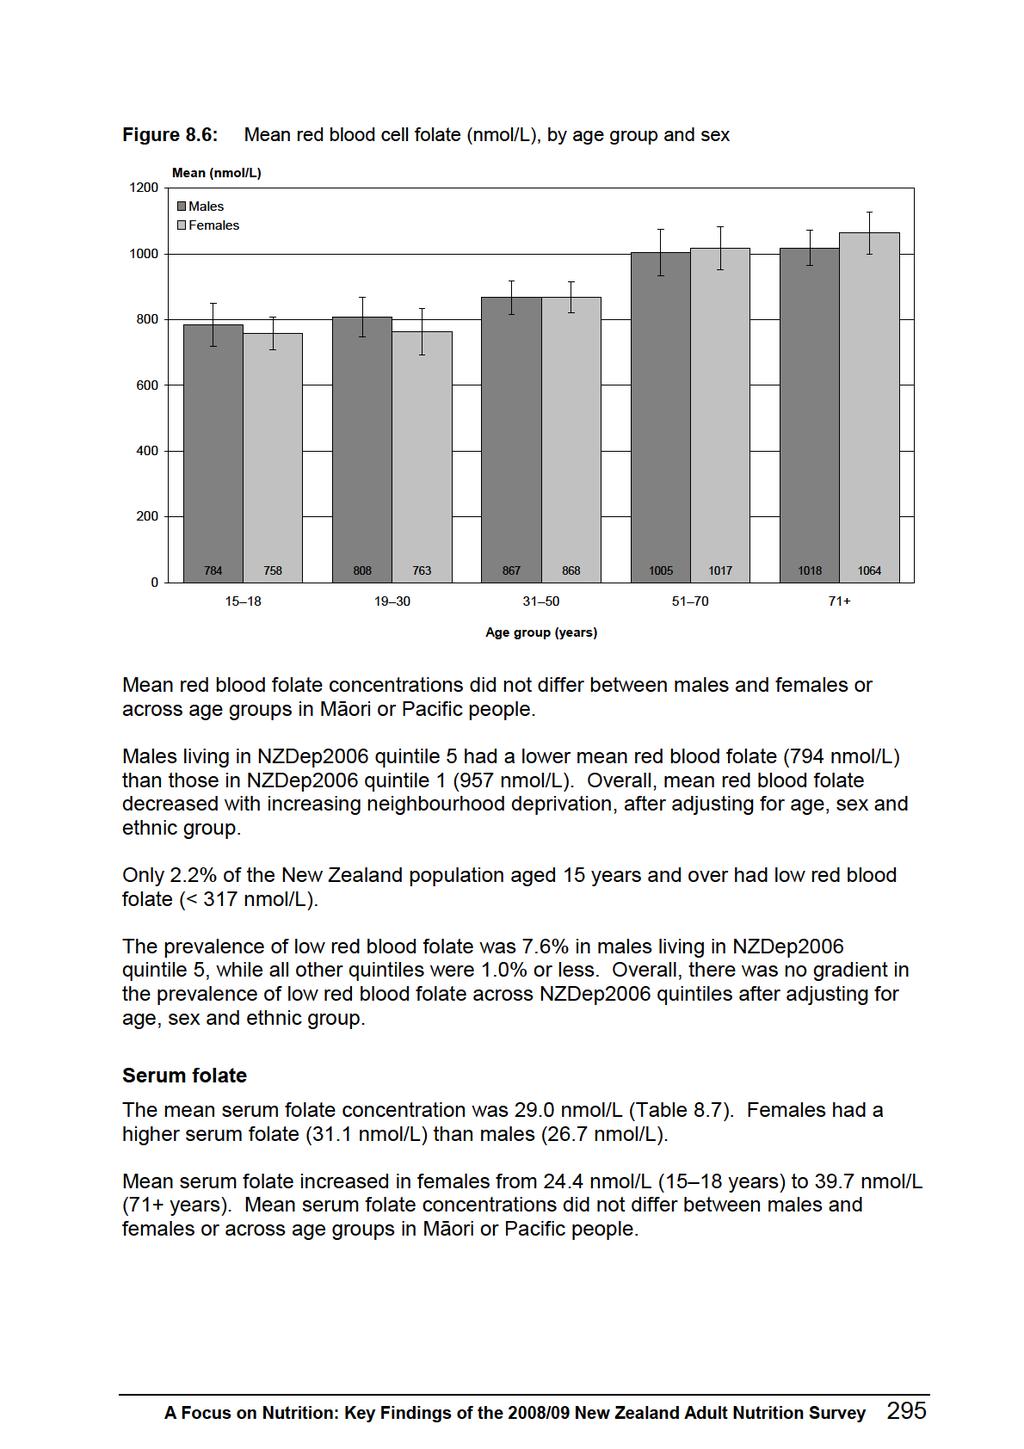
323
A Focus on Māori Nutrition Findings from the 2008/09 New Zealand Adult Nutrition Survey
 A Focus on Nutrition Findings from the 2008/09 New Zealand Adult Nutrition Survey Authors This report was written by Sally Mackay, Dr Niki Stefanogiannis and Maria Turley, with statistical analyses conducted
4 Nutrient Intakes and Dietary Sources: Micronutrients
 Nutrient Intakes and Dietary Sources: Micronutrients New Zealanders obtain the energy and nutrients they require from a wide variety of foods and beverages, and in some cases from dietary supplements as
Janis Baines Section Manager, Food Data Analysis, Food Standards Australia New Zealand. Paul Atyeo Assistant Director, ABS Health Section
 ILSI SEAR Australasia March 2015 Nutrition information from the Australian Health Survey Background and selected results Janis Baines Section Manager, Food Data Analysis, Food Standards Australia New Zealand
Methodology Report for the 2008/09 New Zealand Adult Nutrition Survey
 Methodology Report for the 2008/09 New Zealand Adult Nutrition Survey Citation: University of Otago and Ministry of Health. 2011. Methodology Report for the 2008/09 New Zealand Adult Nutrition Survey.
Dietary Fat Guidance from The Role of Lean Beef in Achieving Current Dietary Recommendations
 Dietary Fat Guidance from 1980-2006 The Role of Lean Beef in Achieving Current Dietary Recommendations Penny Kris-Etherton, Ph.D., R.D. Department of Nutritional Sciences Pennsylvania State University
Chapter 2. Planning a Healthy Diet
 Chapter 2 Planning a Healthy Diet Principles and Guidelines Diet Planning Principles Adequacy Sufficient energy Adequate nutrients for healthy people Balance Enough but not too much kcalorie (energy) control
ABLE TO READ THE LABEL?
 ARE ABLE TO READ THE LABEL? A Consumer s Guide to Navigating Food Labels Food and Drug Safety Program Consumer and Environmental Health Services Phone: 609-826-4935 Fax: 609-826-4990 http://nj.gov/health/eoh/foodweb/
Lisa Sasson Clinical Assistant Professor NYU Dept Nutrition and Food Studies
 Lisa Sasson Clinical Assistant Professor NYU Dept Nutrition and Food Studies Introduction Nutrients Components of food required for the body s functioning Roles: Provide energy Building material Maintenance
BNF looks at years 7 and 8 of the National Diet and Nutrition Survey (NDNS) Rolling Programme (2014/ /2016)
 Rolling Programme (2014/ /2016)") BNF looks at years 7 and 8 of the National Diet and Nutrition Survey (NDNS) Rolling Programme (2014/2015-2015/2016) Contents 1 Introduction... 1 2. NDNS findings on intake compared to nutrient-based recommendations...
BNF looks at years 7 and 8 of the National Diet and Nutrition Survey (NDNS) Rolling Programme (2014/2015-2015/2016) Contents 1 Introduction... 1 2. NDNS findings on intake compared to nutrient-based recommendations...
The Nutritional Information Panel is a pretty technical looking piece of artwork and the main question people ask about it WHAT DOES IT ALL MEAN?
 The Nutritional Information Panel is a pretty technical looking piece of artwork and the main question people ask about it is WHAT DOES IT ALL MEAN? Well, we want you to understand it as well as we do.
Nutrition for Health. Nutrients. Before You Read
 CHAPTER 10 LESSON 2 Nutrition for Health Nutrients BIG Idea Each nutrient in your diet plays a unique and essential role in keeping you healthy. Before You Read Sometimes figuring out what to eat can be
OBJECTIVE. that carbohydrates, fats, and proteins play in your body.
 OBJECTIVE Describe the roles that carbohydrates, fats, and proteins play in your body. JOurnall How was your weekend? What did you do? Did you practice any of the lessons you have learned thus far? What
CHEMISTRY OF LIFE 30 JANUARY 2013
 CHEMISTRY OF LIFE 30 JANUARY 2013 Lesson Description In this lesson, we will: Investigate the structure and function of molecules that are essential for life. Key Concepts Terminology A molecule is any
A Closer Look at The Components Of a Balanced Diet
 A Closer Look at The Components Of a Balanced Diet The essential nutrients are carbohydrates, fats, proteins, vitamins, minerals, dietary fibre and water. These nutrients will ensure that the systems and
Chapter 3: Macronutrients. Section 3.1 Pages 52-55
 Chapter 3: Macronutrients Section 3.1 Pages 52-55 Diet Terms Nutrients The substances in food that gives us structural materials and energy. Macronutrients Nutrients that are required in large amounts.
Lifelong Nutrition. Jemma O Hanlon BHlthSc(Nutr & Diet) APD AN Accredited Practising Dietitian Accredited Nutritionist
 APD AN Accredited Practising Dietitian Accredited Nutritionist") Lifelong Nutrition Jemma O Hanlon BHlthSc(Nutr & Diet) APD AN Accredited Practising Dietitian Accredited Nutritionist Outline a Macronutrients a Micronutrients a Glycaemic Index a NHPAs The Australian
Lifelong Nutrition Jemma O Hanlon BHlthSc(Nutr & Diet) APD AN Accredited Practising Dietitian Accredited Nutritionist Outline a Macronutrients a Micronutrients a Glycaemic Index a NHPAs The Australian
Chapter Why do we eat & Nutrition and Nutrients
 Chapter 15.1 Why do we eat & Nutrition and Nutrients Why do we eat? Physical Needs: Nutrients chemicals found in food, the body needs to function properly. Nutrition study of foods and the way your body
Chapter 4: Nutrition. ACE Personal Trainer Manual Third Edition
 Chapter 4: Nutrition ACE Personal Trainer Manual Third Edition Introduction SCAN group of dieticians who practice in sports and cardiovascular nutrition [SCAN]; locate local SCAN dieticians by contacting
SCHOOL OF HEALTH SCIENCES DIVISION OF DIETETICS, NUTRITION AND BIOLOGICAL SCIENCES, PHYSIOTHERAPY, PODIATRY, RADIOGRAPHY LEVEL 2 / DIET 1
 SCHOOL OF HEALTH SCIENCES DIVISION OF DIETETICS, NUTRITION AND BIOLOGICAL SCIENCES, PHYSIOTHERAPY, PODIATRY, RADIOGRAPHY LEVEL 2 / DIET 1 D2143/ Nutrition DATE: 28/04/2014 WRITING TIME: 120 minutes TIME:
Name Hour. Nutrition Notes
 Calorie: Measure of Name Hour Nutrition Notes = 9 calories per gram Carbohydrates and Protein = calories per gram. If you consume more calories than you use up, it will be stored as. Carbohydrates (CHO)
4. Which of the following is not likely to contain cholesterol? (a) eggs (b) vegetable shortening (c) fish (d) veal
 eggs (b) vegetable shortening (c) fish (d) veal") Sample Test Questions Chapter 6: Nutrition Multiple Choice 1. The calorie is a measure of (a) the fat content of foods. (b) the starch content of foods. (c) the energy value of foods. (d) the ratio of
Sample Test Questions Chapter 6: Nutrition Multiple Choice 1. The calorie is a measure of (a) the fat content of foods. (b) the starch content of foods. (c) the energy value of foods. (d) the ratio of
When people don t eat enough complex carbohydrates they don t have enough energy and feel tired and less alert. They also may not get enough fiber.
 Carbohydrates Carbohydrates are compounds that come from plants and contain carbon, hydrogen, and oxygen. These nutrients supply energy, which all living things need. Carbohydrates are the body s most
NUTRITION: THE STUDY OF HOW THE BODY UTILIZES THE FOOD WE EAT
 NUTRITION: THE STUDY OF HOW THE BODY UTILIZES THE FOOD WE EAT NUTRIENT: a chemical found in food that is needed for life and growth, & the building blocks to make your body function correctly! WHAT DO
Six Nutrients. Nutrients: substances in food that your body needs to stay healthy. Carbohydrates Protein Fat Minerals Vitamins Water
 Nutrients Six Nutrients Nutrients: substances in food that your body needs to stay healthy Carbohydrates Protein Fat Minerals Vitamins Water Water Function: most essential nutrient Helps digest and absorb
What is food made of?
 What is food made of? Food: Nutrients and Food Any substance that is ingested (eaten) and sustains life Meat, fish, nuts, fruits, vegetables, grain products, etc. Nutrients: Food is broken down into substances
Module 1 An Overview of Nutrition. Module 2. Basics of Nutrition. Main Topics
 Module 1 An Overview of Nutrition Module 2 What is Nutrition? What Are Nutrients? Units of Energy Why we need energy? Maintaining energy balance Daily energy requirements Calorie Requirements for Different
The Food Guide Pyramid
 The Food Guide Pyramid In this lesson, you will Learn About n What influences a person s food choices. n How to use the Food Guide Pyramid to make healthful food choices. The Foods You Choose The foods
Module 1 Nutrition Basics. Exam 1 B
 Module 1-2 Test 1B 1 Module 1 Nutrition Basics PLEASE DO NOT MARK ON THIS COPY. USE YOUR SCANTRONS TO MARK UNSWERS. True/False Exam 1 B 1. Appetite is defined as the psychological desire for food. 2. Cellulose
3. A diet high in saturated fats can be linked to which of the following? A: kidney failure B: bulimia C: anorexia D: cardiovascular disease
 Nutrition and Health 1. A substance needed by the body for growth, energy, repair and maintenance is called a. A: nutrient B: carbohydrate C: calorie D: fatty acid 2. All of the following are nutrients
A Fact Sheet for Parents and Carers Healthy Eating for Diabetes
 A Fact Sheet for Parents and Carers Healthy Eating for Diabetes Healthy eating is important for children of all ages, including those living with diabetes. Children and teenagers with diabetes have the
BCH 445 Biochemistry of nutrition Dr. Mohamed Saad Daoud
 BCH 445 Biochemistry of nutrition Dr. Mohamed Saad Daoud 1 Energy Needs & Requirements Food is the only source of body which undergoes Metabolism and liberate / Generates Energy required for vital activities
Classes of Nutrients A Diet
 Ch. 7 Notes Section 1: What is Nutrition? is the science or study of food and the ways the body uses food. are substances in food that provide energy or help form body tissues and are necessary for life
1.3.1 Function of Food. Why do we need food?
 1.3.1 Function of Food Why do we need food? Need to know The Function of Food Three reasons for requiring food 2 Food is needed for: 1.Energy 2.Growth of new cells and Repair of existing cells, tissues,
1.1.1 Protein. 1 Quiz: Protein. 1. The main reason why the body needs protein is for growth, repair and maintenance.
 1 Quiz: Protein 1.1.1 Protein 1. The main reason why the body needs protein is for growth, repair and maintenance. 2. An example of a protein alternative is mycoprotein, e.g. Quorn. 3. An example of a
STAYING HEART HEALTHY PAVAN PATEL, MD CONSULTANT CARDIOLOGIST FLORIDA HEART GROUP
 STAYING HEART HEALTHY PAVAN PATEL, MD CONSULTANT CARDIOLOGIST FLORIDA HEART GROUP What is Heart Disease Cardiovascular Disease (CVD): Heart or Blood vessels are not working properly. Most common reason
Lipids. PBHL 211 Darine Hachem, MS, LD
 Lipids PBHL 211 Darine Hachem, MS, LD Outline Functions of lipids in our body Types of lipids Sources of lipids Recommendation of fat intake Fat association with heart diseases Provide energy (9Kcal/g
Nutrition Glossary for Healthy Food & Special Diet
 Nutrition Glossary for Healthy Food & Special Diet The nutrition glossary is a tool to help you understand the basics of nutrition through an understanding of the key terminology used throughout the food
2. food groups: Categories of similar foods, such as fruits or vegetables.
 Chapter 2 Nutrition Guidelines: Tools for a Healthy Diet Key Terms 1. nutrient density: A description of the healthfulness of foods. 2. food groups: Categories of similar foods, such as fruits or vegetables.
Nutrients. The food you eat is a source of nutrients. Nutrients are defined as the substances found in food that keep your body functioning.
 Nutrients The food you eat is a source of nutrients. Nutrients are defined as the substances found in food that keep your body functioning. Your body needs nutrients to Provide energy. Build and repair
Nutrition Notes website.notebook October 19, Nutrition
 Nutrition Nutrition Notes website.notebook October 19, 2016 Food is any substance that is ingested ("eaten") and helps sustain life. Food categories: Meats and Alternative Dairy Products Fruits and Vegetables
You Bet Your Weight. Karah Mechlowitz
 You Bet Your Weight Karah Mechlowitz What to Expect for Today n Introduction to macronutrients n Breakdown of each macronutrient n Ways to track macronutrients n Wrap up What are the macronutrients? Carbohydrates
Nutrition policy in Finland
 Nutrition policy in Finland Suvi M. Virtanen, Professor 13.3.2012 20/03/2012 Nutrition policy in Finland / SM Virtanen 1 The top of Europe Four seasons Population 5,4 million Life expectancy at birth:
Nutrition Basics. Australian Institute of Fitness 1 / 10
 Nutrition Basics Australian Institute of Fitness 1 / 10 INTRODUCTION Understanding nutrition is fundamental to good health, performance, weight loss and weight management. Fitness professionals play the
FINAL ASSESSMENT REPORT PROPOSAL P295 CONSIDERATION OF MANDATORY FORTIFICATION WITH FOLIC ACID. Attachments 7a and 7b
 7-06 4 October 2006 FINAL ASSESSMENT REPORT PROPOSAL P295 CONSIDERATION OF MANDATORY FORTIFICATION WITH FOLIC ACID Attachments 7a and 7b 1 Methodology and Results of Dietary Modelling at Final Assessment
How does your body use nutrients?
 How does your body use nutrients? As an energy source To heal, build and repair tissue To sustain growth To help transport oxygen to cells To regulate body functions What are carbohydrates? Starches and
Lecture 3. Nutrition
 Lecture 3 Nutrition, Part 1 1 Nutrition 1.Macronutrients a. Water b. Carbohydrates c. Proteins d. Fats 2.Micronutrients a. Minerals b. Vitamins 2 1 Why is Nutrition Important? Your food choices each day
JIGSAW READING CARBOHYDRATES
 Date: CARBOHYDRATES Carbohydrates provide an important source of energy for our bodies. There are two types of carbohydrates: Sugars are found in foods which taste sweet like candies, jams and desserts.
Dietary intake patterns in older adults. Katherine L Tucker Northeastern University
 Dietary intake patterns in older adults Katherine L Tucker Northeastern University Changes in dietary needs with aging Lower energy requirement Less efficient absorption and utilization of many nutrients
Healthy Eating Pattern Development Proposed Methodology. Pre-conference workshop Canadian Nutrition Society Annual Conference Halifax May 3, 2018
 Healthy Eating Pattern Development Proposed Methodology Pre-conference workshop Canadian Nutrition Society Annual Conference Halifax May 3, 2018 1 Objective of the presentation Share the proposed methodology
Study of how your body takes in and uses food
 Chapter 10 Lesson 1 Study of how your body takes in and uses food Nutrients substances in food that your body needs to grow, repair, and supply energy Calorie unit of heat used to measure the energy your
Exercise Science Section 10: Nutrition for Performance
 Exercise Science Section 10: Nutrition for Performance An Introduction to Health and Physical Education Ted Temertzoglou Paul Challen ISBN 1-55077-132-9 Food Categories Macronutrients v Direct sources
Canada s Food Supply: A Preliminary Examination of Changes,
 Canada s Food Supply: A Preliminary Examination of Changes, 1992-2002 Canada's Food Guide to Healthy Eating, released in 1992, is a key nutrition education tool for Canadians aged four years and over.
Analysis of Dietary Data Collected from Childcare Settings
 Analysis of Dietary Data Collected from Childcare Settings Beth Dixon, PhD, MPH Associate Professor Department of Nutrition, Food Studies and Public Health New York University Big Picture Questions What
An Overview of Nutrition. Assist. Prof Dr. Lujain A. Alkhazrajy
 An Overview of Nutrition Assist. Prof Dr. Lujain A. Alkhazrajy Nutrition: the process by which a living organism assimilates food and uses it for growth and maintenance of tissues Nutrients- components
Become A Health Coach Certification. Pillar 1: Nutrition, Health & Wellness Week 1. Copyright All Rights Reserved. Pillar 1 Week 1 Video 2 1
 Become A Health Coach Certification Pillar 1: Nutrition, Health & Wellness Week 1 1 Essential Nutrition : The Distilled Top 20% Of Nutrition, Health & Wellness Knowledge That Matters For Health Coaches
Note-Taking Strategy. You will receive another guided note sheet to record all notes. Anything that is green should be recorded.
 Note-Taking Strategy You will receive another guided note sheet to record all notes. Anything that is green should be recorded. Giving Your Body What It Needs Each of the six nutrients has a specific job
Challenges and Opportunities for Food Reformulation. Prof. Eileen Gibney
 Challenges and Opportunities for Food Reformulation Prof. Eileen Gibney Outline What is food reformulation? scope, nutrients Opportunities Challenges Case studies PHE Calorie reduction scope and ambition
The eatwell plate is based on the Government s Eight Guidelines for a Healthy Diet, which are:
 The eatwell plate The eatwell plate is a pictorial food guide showing the proportion and types of foods that are needed to make up a healthy balanced diet. The plate has been produced by the Food Standards
Personal Touch Food Service will ensure all consumers have access to varied and nutritious foods consistent with promoting health and wellness.
 Nutrition Guidelines It is well accepted that consumer eating habits are greatly influenced by the types and quantities of foods made available to them. Personal Touch Food Service is committed to supporting
The science of foods and the nutrients and other substances they contain and of their actions within the body
 HLTH 1050 Week 1 The science of foods and the nutrients and other substances they contain and of their actions within the body Including ingestion, digestion, absorption, transport, metabolism and excretion.
Nutrients. Nutrition. Carbohydrates. - ex. Carbs, Fats, Protein, Water. - ex. vitamins, minerals
 Nutrients Nutrition Introduction elements and compounds an organism needs but can not manufacture itself 6 Basic Nutrients carbohydrates fats proteins water vitamins minerals Macronutrients supply energy
NUTRITION GUIDELINES DRAFT - work in progress January 18 th 2016
 GAIN NORDIC PARTNERSHIP NUTRITION GUIDELINES DRAFT - work in progress January 18 th 2016 A MULTI-SECTOR PARTNERSHIP FOR IMPROVED NUTRITION The GAIN Nordic Partnership aims to deliver nutritious foods to
Name Unit # Period Score 159 points possible Dietary Guidelines, Food Pyramid and Nutrients Test
 Name Unit # Period Score 159 points possible Dietary Guidelines, Food Pyramid and Nutrients Test 1. List the ten dietary guidelines recommended for Americans. (10) a. b. c. d. e. f. g. h. i. j. Multiple
Chapter 02 Choose A Healthy Diet
 Chapter 02 Choose A Healthy Diet Multiple Choice Questions 1. The science of food and how the body uses it in health and disease is called: A. the dietary guidelines. B. the food guide pyramid. C. nutrition.
Importance of Nutrition
 The EAT WELL Plate Canada s food guide Food pyramid Importance of Nutrition Energy for body metabolism (nerve impulses, contraction of muscles, repair and replacement of cells Raw materials for building
Josie Grace C. Castillo, M.D.
 Josie Grace C. Castillo, M.D. 2 types of nutrients Macronutrients Carbohydrate Fats Protein Micronutrients Vitamins Minerals 1 Occur when the quantity or quality of food is not sufficient to meet a persons
Choosing Healthful Foods
 LESSON 25 Choosing Healthful Foods Before You Read List some of the healthful foods you eat. What makes these foods healthful choices? What You ll Learn the functions and sources of proteins, carbohydrates,
Lorem ipsum. Do Canadian Adults Meet their Nutrient Requirements through Food Intake Alone? Health Canada, 2012
 Health Canada, 2012 Lorem ipsum Cat. H164-112/3-2012E-PDF ISBN. 978-1-100-20026-2 Do Canadian Adults Meet their Nutrient Requirements through Food Intake Alone? Key findings: Five in 10 women and 7 in
WHY DO WE NEED FOOD? FOOD AND DIET
 WHY DO WE NEED FOOD? FOOD AND DIET Food gives us the energy required for chemical reaction to keep us alive Energy also required for many activities and to maintain body temperature Food also gives us
Recognize the relation between nutrition & health. Understand the types of Classification of nutrients. Provide structural materials
 By the end of this session you ll be able to : Define nutrition, nutrition science Recognize the relation between nutrition & health. Understand the types of Classification of nutrients deal with the Food
MANAGING YOUR CHOLESTEROL
 MANAGING YOUR CHOLESTEROL WHAT IS CHOLESTEROL? Cholesterol is a white waxy substance found in every cell of our bodies. It comes from The liver our body makes most of it from the fat we eat in food A little
VIRGINIA COOPERATIVE EXTENSION SERVICE
 VIRGINIA COOPERATIVE EXTENSION SERVICE VIRGINDl 'IECH VIRGINDl S'Dtt.E Blacksburg, Virginia 24061 Publication 348-337 August 1984 Lesson 3 Diet, Exercise, and Behavior Modification (Weight Control by Mail)
Food Choices. Food Choices. Food Choices. Food Choices. Food Choices. Introduction to Nutrition ALH 1000 Chapter 1 & 2
 Introduction to Nutrition ALH 1000 Chapter 1 & 2 An Overview Of Nutrition And Planning A Healthy Diet Instructor Bonnie Bennett-Campbell, RN MSN Food and Nutrition Play a Significant Role in Life An Individual
Myanmar Food and Nutrition Security Profiles
 Key Indicators Myanmar Food and Nutrition Security Profiles Myanmar has experienced growth in Dietary Energy Supply (DES). Dietary quality remains poor, low on protein and vitamins and with high carbohydrates.
The food that we eat provides us with the energy we need to get us through the day. Our bodies also use that energy to perform necessary functions.
 The food that we eat provides us with the energy we need to get us through the day. Our bodies also use that energy to perform necessary functions. Breathe Maintain body temperature Heart rate Digestion
GUIDELINES ON NUTRITION LABELLING CAC/GL
 GUIDELINES ON NUTRITION LABELLING CAC/GL 2-1985 Adopted in 1985. Revised in 1993 and 2011. Amended in 2003, 2006, 2009, 2010, 2012, 2013, 2015, 2016 and 2017. ANNEX adopted in 2011. Revised in 2013, 2015,
Be a Food Label Detective!
 Be a Food Label Detective! Elyse Kontra Kara Kelly Total Fat Type of fat is more important than total fat Limit total fat intake to 25-35% of your total calories Fat-free Caloriefree http://www.diabetes.org/food-and-fitness/food/what-can-ieat/taking-a-closer-look-at-labels.html
Richard Trim Malcolm Ballantine. Halesworth & District
 Richard Trim Malcolm Ballantine Halesworth & District Setting the Scene Public Health England established 2013 Healthcare vs Health Healthcare responsibility of NHS Health responsibility of PHE Healthcare:
UGRC 145: FOOD AND NUTRITION IN EVERYDAY LIFE
 UGRC 145: FOOD AND NUTRITION IN EVERYDAY LIFE Session 2 MACRONUTRIENTS Lecturer: PROF. MATILDA STEINER-ASIEDU, SBS, CBAS; University of Ghana, Email: tillysteiner@gmail.com College of Education School
PREGNANCY PROJECT RACHEL CRAWFORD
 PART I (I-V): PREGNANCY PROJECT RACHEL CRAWFORD I. Identifying data A. First name: Aija B. Description of the individual: Aija is the wife of a gamer who works at Blizzard entertainment in the customer
HEALTHY EATING. What you need to know for a long and healthy life. March National Nutrition Month
 HEALTHY EATING What you need to know for a long and healthy life March National Nutrition Month 890246 This presentation is for informational purposes only. Material within this presentation should not
Epidemiological evidence linking food, nutrition, physical activity and prostate cancer risk: results from the Continuous Update Project
 Epidemiological evidence linking food, nutrition, physical activity and prostate cancer risk: results from the Continuous Update Project World Cancer Congress, Saturday 6 December 2014 Michael Leitzmann
Student Book. Grains: 5 10 ounces a day (at least half whole grains) Self-Check
 Self-Check") ETR Associates Middle School I read and followed directions. My work is neat and complete. This is my best work. HealthSmart Actions Lesson at a Glance Student Book The HealthSmart Actions student book
ETR Associates Middle School I read and followed directions. My work is neat and complete. This is my best work. HealthSmart Actions Lesson at a Glance Student Book The HealthSmart Actions student book
Supplemental Table 1: List of food groups
 Supplemental Table 1: List of food groups Food groups names Food groups description Serving size definitions - Examples Fruits and vegetables Vegetables Fruits Whole vegetables All vegetables but soups,
147 Kcal / 100g. Banana, Almond, Raw Cocoa & Whey Protein Shake. 152 kcal 501 kcal. 633 kj 2088 kj. 9.4 g 31.1 g. 2.4 g 8 g. 7.2 g 23.7 g.
 Banana, Almond, Raw Cocoa & Whey Protein Shake By Lisa Blair from Nutrition London (www.nutritionlondon.uk) Overview... U / 1403442 147 Kcal / 100g WEIGHT: 19.7% Carbs 22.5% Protein 57.8% Fat Food Labelling...
Nutrients in foods replace those used by the body
 Fundamentals of Nutrition Nutrition: those processes that allow the body to use food for energy, maintenance of health, and growth. Nutritional status: the state of one s nutrition Wellness: state of good
Estimated mean cholestero intake. (mg/day) NHANES survey cycle
 NHANES survey cycle") 320 Estimated mean cholestero intake (mg/day) 300 280 260 240 220 200 2001-02 2003-04 2005-06 2007-08 2009-10 2011-12 2013-14 NHANES survey cycle Figure S1. Estimated mean 1 (95% confidence intervals)
320 Estimated mean cholestero intake (mg/day) 300 280 260 240 220 200 2001-02 2003-04 2005-06 2007-08 2009-10 2011-12 2013-14 NHANES survey cycle Figure S1. Estimated mean 1 (95% confidence intervals)
UGRC 145: FOOD AND NUTRITION IN EVERYDAY LIFE
 UGRC 145: FOOD AND NUTRITION IN EVERYDAY LIFE Session 6 FOOD RESOURCES Lecturer: PROF. MATILDA STEINER-ASIEDU, SBS, CBAS; University of Ghana, Email: tillysteiner@gmail.com College of Education School
The U.S. Department of Agriculture
 What We Eat in America: USDA Surveys Food Consumption Changes Lori Borrud, Cecilia Wilkinson Enns, and Sharon Mickle (301) 734-8457 The U.S. Department of Agriculture (USDA) has conducted food consumption
Vitamins and Minerals
 Eating Right Vitamins and Minerals Many claims about vitamins and minerals may be misleading and confusing. The following lists tell what vitamins and minerals do, where they are found and the current
Tools for Healthy Eating
 Chapter 2 Tools for Healthy Eating Multiple Choice 1. Which of the following is not a key principle of healthy eating? A. availability B. balance C. variety D. moderation REF: 38 2. A diet consisting of
Nutrition Requirements
 Who is responsible for setting nutrition requirements in the UK? In the UK we have a set of Dietary Reference Values (DRVs). DRVs are an estimate of the nutritional requirements of a healthy population.
Essential Nutrients. Lesson. By Carone Fitness. There are six essential nutrients that your body needs to stay healthy.
 Lesson Essential Nutrients By Carone Fitness 6 There are six essential nutrients that your body needs to stay healthy. 1. Water 2. Vitamins 3. Minerals 4. Carbohydrates 5. Protein 6. Fat 1 6 Of these six
Reading Food Labels A few questions before we start. Questions Continued. After this session, you will be able to:
 A few questions before we start Reading Food Labels 1. A healthy food might have lots of: a) Cholesterol b) Sugar c) Fibre d) Saturated fat Questions Continued 2. Fibre is healthy because it: a) Helps
Chapter 11 Nutrition: Food for Thought
 Chapter 11 Nutrition: Food for Thought Do you think about the food that goes into your body and how it affects you? How can you interpret the various nutrition information found in the press? What are
NUTRITION 101: DIETARY GUIDELINES FOR A HEALTHIER YOU!
 NUTRITION 101: DIETARY GUIDELINES FOR A HEALTHIER YOU! OBJECTIVES Participants will be able to: Identify the 5 general guidelines of the Dietary Guidelines for Americans Have a general understanding of
CANADA S NEW FOOD LABELLING REGULATIONS
 CANADA S NEW FOOD LABELLING REGULATIONS an ebook from ESHA Research 2 TABLE OF CONTENTS Introduction... 3 The Nutrition Facts Overview... 4 Changes in Daily Value... 4 Formatting... 5 Nutrient Changes...
The Six Essential Nutrient Groups:
 The Six Essential Nutrient Groups: Water: Water transports other nutrients to cells, carries wastes away, aids digestion and more. It makes up more than half your weight. SOURCES: water; juices and
Chewing the fat about fat!
 Chewing the fat about fat! When we talk about fat, most people think of fatty foods, like fries and fatty meats. But fat is an essential nutrient. It plays an important role in the many functions that
THE CONSUMER COMES FIRST MYTH OR REALITY?
 THE CONSUMER COMES FIRST MYTH OR REALITY? PROFILING SOUTH AFRICA Population: 48+ million Almost 50/50 males to females 35% children