Validation of the Rapid Eating and Activity Assessment. for Diet Quality Measurement in Young Adult Males. Rachael Fawcett
|
|
|
- Fay Francis
- 6 years ago
- Views:
Transcription
1 Validation of the Rapid Eating and Activity Assessment for Diet Quality Measurement in Young Adult Males by Rachael Fawcett A Thesis Presented in Partial Fulfillment of the Requirements for the Degree Master of Science Approved September 2012 by the Graduate Supervisory Committee: Carol Johnston, Chair Sandra Mayol-Kreiser Christopher Wharton ARIZONA STATE UNIVERSITY December 2012
2 ABSTRACT The Rapid Eating and Activity Assessment for Participants Short Version (REAP-S), represents a method for rapid diet quality assessment, however, few studies have tested its validity. The Healthy Eating Index-2005 (HEI-2005) and the Diet Quality Index Revised (DQI-R) are tools that effectively assess diet quality, however, both are complex and time consuming. The objective of this study was to evaluate the validity of the REAP-S against the HEI-2005 and the DQI-R. Fifty males, 18 to 33 years of age, completed the REAP-S as well as a 24- hour diet recall. HEI-2005 and DQI-R scores were determined for each 24-hour recall. Scores from the REAP-S were evaluated against the HEI-2005 and DQI-R scores using Spearman rank order correlations and chi square. Modifications were also made to the original method of scoring the REAP-S to evaluate how the correlations transformed when certain questions were removed. The correlation coefficient for REAP-S and the HEI-2005 was (P=0.009), and the correlation coefficient for REAP-S and the DQI-R was (P=0.022). Chi square determined precision of the REAP-S to the HEI-2005 for overall diet quality at 64% and 62% for the DQI-R and REAP-S. Scores that were considered extreme (n=21) by the HEI-2005 (scores <40 and >60) had 76% precision with REAP-S. The correlation for the modified version of scoring REAP-S with the overall HEI-2005 and DQI-R were (P=0.005) and (P=0.003) respectively. Chi square statistics revealed the REAP-S accurately captured the diets of high quality versus low quality with 64% precision to the HEI-2005 and 62% of the DQI-R. When evaluating the modified REAP-S scores against the i
3 extreme HEI-2005 scores, precision increased to 81%. It appears the REAP-S is an acceptable tool to rapidly assess diet quality. It has a significant, moderate correlation to both the HEI-2005 and the DQI-R, with strong precision as well. Both correlation and precision is strengthened when values are compared to only the extreme scores of the HEI-2005; however, more research studies are needed to evaluate the validity of REAP-S in a more diverse population and to evaluate if changes to select questions can improve its accuracy in assessing diet quality. ii
4 TABLE OF CONTENTS Page LIST OF TABLES... v LIST OF FIGURES... vi CHAPTER 1 INTRODUCTION... 1 Purpose of the Study... 3 Hypothesis... 3 Limitations and Delimitations REVIEW OF LITERATURE... 4 The Dietary Guidelines for Americans... 4 The Development of Dietary Quality Indices The Healthy Eating Index The Healthy Eating Index The Diet Quality Index The Diet Quality Index Revised Evaluation of the Healthy Eating Index Evaluation of the Diet Quality Index-Revised The Rapid Eating and Activity Assessment for Patients Association of Diet Quality Indices and Disease Diet Quality in Young Men Hour Diet Recalls METHODOLOGY iii
5 CHAPTER Page Participant Selection Study Design Scoring the HEI Scoring the DQI-R Scoring the REAP-S Statistical Analysis RESULTS Participant Characteristics Characteristics of Index Scores Correlations between Indices Identifying Poor versus Good Quality Diets Modified REAP-S Correlation between Index Scores and Participant Characteristics DISCUSSION CONCLUSION REFERENCES APPENDIX A CONSENT FORM B INCLUSION CRITERIA C REAP-S D 24-HOUR RECALL iv
6 LIST OF TABLES Table Page 1. The Healthy Eating Index The Healthy Eating Index The Diet Quality Index The Diet Quality Index Revised DQI-R Elements of Diversity DQI-R Dietary Moderation Component Values Correlations of HEI and REAP sub scores Correlations of FFQ nutrients and REAP variables Correlations between REAPS and Block 1998 FFQ variables Participant Characteristics Index Characteristics Relationship of Indices Relationship between Index and Participant Characteristics v
7 LIST OF FIGURES Figure Page 1. DQI-R Distribution of Scores HEI-2005 Distribution of Scores REAP-S Distribution of Scores HEI-2005 to DQI-R Correlation HEI-2005 to REAP-S Correlation DQI-R to REAP-S Correlation vi
8 Chapter 1 INTRODUCTION In the late 1980 s, it was becoming obvious that obesity and chronic disease were a serious public health concern, and despite the extensive research on the links between diet and chronic disease, there had been little research on ways to assess overall diet quality (Kennedy, Ohls, Carlson, & Fleming, 1995). Assessing and quantifying overall diet quality is complex and requires diet analyses beyond nutrient assessment. In an attempt to produce useful methods and standardize the process, governmental organizations developed tools that focused on the quality of complete diets and the Diet Quality Index and Healthy Eating Index were the result (Kant, 1996). The Diet Quality Index (DQI), developed by Paterson et al, and the Healthy Eating Index (HEI), developed by the US Department of Agriculture (Kant, 1996) were developed to assess and quantify overall diet quality on standards set by the Dietary Guidelines for Americans. The Dietary Guidelines for Americans provides scientific-based nutrition information targeted to the general public ages two and up with the purpose of promoting health and reducing chronic disease. Evidence has shown that diets that comply with the Dietary Guidelines may reduce the risk of obesity and associated chronic diseases (Dietary Guidelines Advisory Committee, 2005). As new Dietary Recommendations were released, both the HEI and DQI were updated to reflect current standards. The most updated of each of these indices are the Healthy Eating Index-2005 (HEI-2005) and the Diet Quality Index Revised (DQI-R). 1
9 Both the HEI-2005 and DQI-R are quite complex and time consuming. Once the Nutrition Academic Award (NAA) was developed by the National Heart, Lung and Blood Institute, the need for a practical nutrition assessment tool that was quick and easy to administer was immediately recognized (Pearson et al., 2001). The result was the Rapid Eating and Activity Assessment for Patients (REAP). The intent of creating the REAP was to provide a useful tool for physicians to assess nutrition and facilitate in nutrition counseling (Gans et al., 2003). The diet quality standards of the REAP were established on the guidance set forth by the Food Guide Pyramid and the 2000 U.S. Dietary Guidelines (Gans et al., 2003). The questions on the REAP are intended to assess intake of fat, saturated fat and cholesterol, whole grains, calcium-rich foods, fruits and vegetables, sugary beverages and foods, sodium, alcoholic beverages and physical activity. A series of evaluations conducted on early versions of the REAP indicated that it correlated well with the HEI, had great reliability scores, and reflected intake of nutrients and food groups to the Dietary Guidelines (Gans et al., 2006). In 2003, the 16-item Rapid Eating and Activity Assessment for Patients shortened version (REAP-S), was developed with the intent of having a way to assess dietary quality even more quickly. However, little research has been done to test the validity of this version (Segal-Isaacson, Wylie-Rosett, & Gans, 2004). A validation study of the REAP-S using a food frequency questionnaires revealed it correlated well with fruits, vegetables, and dairy, but added fat and meat were poorly correlated (Segal-Isaacson, Wylie-Rosett, & Gans, 2004). More research is 2
10 needed to establish how well the REAP-S correlates with other validated measures, such as the HEI-2005 and the DQI-R. Purpose of the Study The purpose of this study was to test the validity of the REAP-S using both the HEI-2005 and DQI-R so that a more convenient way to assess overall diet quality can confidently be used. Hypothesis We hypothesized that the REAP-S scores would significantly correlate to the scores of the HEI-2005 and the DQI-R using 24-h recalls from college students. Limitations The small sample size of this study is a limitation. The study used 24 hour dietary recalls collected from 50 male college students. Investigator bias was minimized by using standard defaults for dietary items that were unclear and not in the data base. Delimitations The sample used for this study was male college students (aged y) from the Phoenix-metropolitan area. Therefore, the validation of this study may not pertain to women, younger or older samples, or more diverse populations. 3
11 Chapter 2 REVIEW OF LITERATURE Dietary Guidelines for Americans The Dietary Guidelines for Americans provides scientific-based nutrition information targeted to the general public ages two and up with the purpose of promoting health and reducing chronic disease. These guidelines are reviewed and revised if necessary every five years by the Dietary Guidelines Advisory Committee (DGAC) so that the recommendations reflect the most current research (Dietary Guidelines Advisory Committee, 2005). The DGAC members are appointed by the Secretaries of the U.S. Department of Health and Human Services (HHS) and the U.S. Department of Agriculture (USDA). Some of the concerns the Dietary Guidelines aim to improve are the nation s growing problems with obesity and chronic disease (Dietary Guidelines Advisory Committee, 2005). They do this by providing information for the development of educational materials, development of nutrition-related programs, and the development of authoritative statements. Because poor diets are linked to type 2 diabetes, cardiovascular disease, dyslipidemia, hypertension, overweight and obesity, constipation, osteoporosis, iron deficiency anemia, diverticular disease, oral disease, malnutrition, and some cancers, educational materials are becoming ever more important (Dietary Guidelines Advisory Committee, 2005). Evidence has shown that diets that comply with the Dietary Guidelines may reduce the risk of these diseases (Dietary Guidelines Advisory Committee, 2005). 4
12 The Dietary Guidelines state that nutrient requirements should be met primarily through consuming foods as opposed to supplements (Dietary Guidelines Advisory Committee, 2005). Supplements can be useful if there is a nutrient gap that cannot be met by food intake, but they cannot replace a healthful diet. Foods provide an assortment of nutrients, phytochemicals, antioxidants, carotenoids, flavonoids and isoflavins, protease inhibitors, and other components that are beneficial to health and have shown to possibly reduce the risk of chronic health conditions (Kahlon & Smith, 2004). The Dietary Guidelines also state that foods consumed in the recommended amounts set by the Dietary Guidelines will meet the necessary amount of nutrients needed for growth and health; for example, diets with an adequate intake of whole grains, fruits, and vegetables generally have higher amounts of fiber and other essential nutrients such as vitamin A, vitamin C, and magnesium (Dietary Guidelines Advisory Committee, 2005). In , approximately 36% of adults in the U.S. were obese (Ogden, Carroll, Kit, & Flegal, 2012). Several conditions are related to obesity, including type 2 diabetes, heart disease, stroke, and certain cancers (Ogden, Carroll, Kit, & Flegal, 2012). Poor diet is a major contributor to obesity. Many Americans do not meet recommended intakes for several nutrients, yet they consume more calories than needed (Dietary Guidelines Advisory Committee, 2005). Typically this leads to weight gain and creates an increased risk for poor health outcomes. Limiting calories is accomplished by selecting low-fat forms of foods in each food group (such as dairy and meats) and avoiding foods comprised 5
13 mostly of discretionary calories; calories from alcohol and foods high in saturated fat and added sugars that have little nutritional value. Consuming nutrient-dense foods is the key to a healthful diet. Nutrient-dense foods are those that provide relatively few calories while providing significant amounts of vitamins and minerals (Dietary Guidelines Advisory Committee, 2005). Carbohydrates. The acceptable macronutrient distribution ranges (AMDRs) define the range for macronutrient intakes that are associated with reduced risk of chronic diseases, while providing recommended intakes of essential nutrients (Mahan & Escott-Stump, 2008). The AMDR for carbohydrates is 45-65% of calories daily. Carbohydrates supply energy for the body in the form of glucose which is the preferred energy source for the brain, as well as the nervous system, placenta and fetus, and is the only source of energy for red blood cells (Mahan & Escott-Stump, 2008). Starch represents the main carbohydrate in most American diets, and many Americans also consume more than the recommended amounts of simple sugars. Added sugars should be limited in the diet as they supply calories, but no nutrients. An abundance of extra calories in the diet ultimately leads to weight gain which increases the risk of type 2 diabetes and other chronic disease (Mahan & Escott-Stump, 2008). Fiber comprises a smaller proportion of the carbohydrates consumed by Americans. Fiber is partly composed of nondigestible carbohydrates and it has been shown that intakes of 14 grams per 1,000 calories can have a number of beneficial health effects such as a decreased risk of coronary heart disease, a potentially reduced risk of type 2 diabetes, and improved laxation (Dietary Guidelines Advisory Committee, 2005). Therefore, it is 6
14 important to choose carbohydrates wisely. The food groups that provide carbohydrates are fruits, vegetables, grains, and milk. The Dietary Guidelines put great emphasis on fruits and vegetables because of the scientific evidence of the health benefits of diets that include them in abundance. The effects of the phytochemicals and the potential antioxidant activities found in fruits and vegetables may help reduce the risk of stroke, type 2 diabetes, cardiovascular disease, other chronic diseases, and cancers (Kahlon & Smith, 2004). Studies have found that consistent intakes of fruits and vegetables may also reduce the risk for Alzheimer s disease and cataracts as well (Liu, 2003). Consuming leafy vegetables and their stalks have been reported to lower total cholesterol and very low-density lipoprotein in blood plasma (Fraser et al., 1981). The benefits of lower cholesterol paired with benefits from antioxidants in fruits and vegetables may reduce deaths from cardiovascular disease and myocardial infarction. Gaziano and colleagues compared cardiovascular deaths to the consumption of fruits and vegetables and found that deaths were lower among those within the highest quartile of carotene-containing fruits and vegetables as compared to those with the lowest intakes (relative risk =.54, P = 0.004) (Ganziano et al., 1995). Others have also shown daily intake of fresh fruit to be significantly correlated with reduced mortality from ischemic heart disease (Key, Thorogood, Appleby, & Burr, 1996). The Dietary Guidelines recommend consuming one to two cups of fruit per day, depending on age and gender, and recommend making half of them whole fruit. In addition to stressing the importance of whole fruit, the importance 7
15 of varying the types of vegetables consumed is emphasized as well. It is recommended to consume two to three cups of vegetables daily, depending on age and gender, and to include a variety of dark green and orange vegetables as well as legumes and starchy vegetables (Dietary Guidelines Advisory Committee, 2005). Including a variety ensures a higher likelihood of consuming all essential vitamins and minerals, as each vegetable subgroup provides somewhat different nutrients. Refined grains are grains that have been processed in such a way that part of the germ is removed, resulting in a loss of many nutrients including dietary fiber, vitamins, minerals, and more beneficial compounds. Due to the loss of these nutrients, along with fiber in the refining process, the Dietary Guidelines recommend including whole grains in the diet. By consuming at least half of the grains as whole grains, it is more likely the dietary recommendation for fiber is met (Dietary Guidelines Advisory Committee, 2005). It is recommended that fiveto eight-ounces equivalents of total grains are consumed daily, depending on age and gender. A diet rich in whole grains may reduce the risk of coronary heart disease. Epidemiological cohort studies have shown a consistent, inverse relationship between whole grain intake and cases of cardiovascular disease (Mellen, Walsh, & Herrington, 2007). Studies have shown that intake of whole grains may lower total cholesterol and low-density lipoprotein in blood plasma (Leinonen, Poutanen, & Mykanen, 2000). Other studies have shown a relationship between whole grain intake and amounts of abdominal visceral adiposity; whereas 8
16 increased whole grain intake appeared to be associated with lower visceral adipose tissue, even after adjusting for age, sex, smoking status, total energy and alcohol intake (McKeown et al., 2010). It is suggested that 3 or more ounceequivalents of whole grains daily can help with weight maintenance and decrease the risk for many chronic diseases (Dietary Guidelines Advisory Committee, 2005). Protein. The AMDR for protein is percent daily. Protein is found in many foods, including meat, dairy, grains, and legumes. The Dietary Guidelines recommend adults to consume five- to six-ounce equivalents of meat because it provides a large proportion of protein, iron, and vitamin B12 (Dietary Guidelines Advisory Committee, 2005). Vegetarians need to pay special attention that their food selections provide adequate intake of these nutrients. The Dietary Guidelines recommend including two to three cups of dairy a day, depending on age and gender as it is a rich source of calcium. Dairy provides an abundance of calcium, potassium, vitamin A, magnesium, and vitamin D. For Americans, over 70% of calcium is consumed in the form of dairy products. However, many people choose not to consume milk or milk products for a variety of reasons, so special attention should be made to include these nutrients in the diet through non-dairy sources (Dietary Guidelines Advisory Committee, 2005). Fats. Fats serve many functions in the body, such as providing energy, serving as a carrier for fat soluble vitamins, serving as building blocks of membranes, and promoting other important physiological functions and processes (Mahan & Escott-Stump, 2008). It is an important part of a healthful diet, but it is equally 9
17 important to choose healthy varieties and limit fat to 20-35% of calories, as recommended by the AMDR (Mahan & Escott-Stump, 2008). High intakes of trans- and saturated fats increase the risk of elevated blood lipid levels, which, in turn, may increase the risk of coronary heart disease (Mahan & Escott-Stump, 2008). The Dietary Guidelines recommend limiting total fat to 30% of calories, limiting saturated fat to 10% of calories, and limiting cholesterol to less than 300 mg. These values have been shown to reduce unhealthy cholesterol and the risk of coronary heart disease (Dietary Guidelines Advisory Committee, 2005). The Development of Dietary Quality Indices The history of attempting to quantify diet quality and make correlations to diet quality dates back to the 1930 s when Burke and Stuart examined diets for the level of nutrients in comparison to the optimal intake levels determined at that time (1938). Levels were rated as very poor through excellent and each rating was then assigned a numeric rating. The ratings were then averaged so that each diet had one overall score reflecting its quality. These studies found associations between maternal diet and occurrence of pregnancy complications (Burke & Stuart, 1938). Researchers today still correlate diet quality to health outcomes using individual nutrients. After micronutrients were used to assess diet quality, researchers started looking at macronutrients and energy intake levels. Willett s research suggested that high dietary energy intake correlates with high intakes of micronutrients, which in turn would suggest diets with higher energy intake are higher in quality (1998). This method, however, does not adequately capture overall diet quality. Diets higher in energy are typically higher in fat, which 10
18 would lead to a higher risk for chronic disease (Willett, 1998). Therefore, diets higher in energy intake may actually be of lower diet quality. Instead of examining several individual nutrients or energy intake, researchers began classifying and using food groups out of the need to develop methods to assess dietary quality more quickly. Although studies examining different types of foods and food categories have shown to be helpful in studies relating to specific diseases, they have failed to paint an overall picture of dietary quality (Kant, 1996). One individual nutrient or food group cannot effectively describe overall diet, as health is multi-dimensional. Examining the diet as a whole can provide insight to the effect of combined foods and nutrients on health outcomes (Kant, 2004). In the late 1980 s, it was becoming obvious that obesity and chronic disease were a serious public health concern, and despite the extensive research on the links between diet and chronic disease, there had been little research on ways to assess diet quality as a whole (Kennedy, Ohls, Carlson, & Fleming, 1995). This is when the focus was turned away from individual nutrients and foods, and governmental organizations with mandates to gather data on the food intake of Americans began to develop tools that focused on the quality of complete diets (Kant, 1996). The Diet Quality Index and Healthy Eating Index were the result. The Healthy Eating Index The United States Department of Agriculture s Center for Nutrition Policy and Promotion (CNPP) developed the Healthy Eating Index (HEI) in 1995 to 11
19 monitor and evaluate change in diet quality among the US population (Miller et al., 2010). The objective for the development of the HEI was to create an index of overall diet quality that incorporated both nutrient needs and the Dietary Guidelines into one measure (Kennedy, Ohls, Carlson, & Fleming, 1995). The HEI allows researches and individuals to assess the overall quality of diets, not just isolated dietary components. The intent of creating the HEI was to create measures of diet quality that could be used for monitoring changes in consumption patterns and to serve as a tool for nutrition education and health promotion (Kennedy, Ohls, Carlson, & Fleming, 1995). Components and scoring of the HEI. The Healthy Eating Index is scored on a 100 point scale. It is composed of ten components; each having an equal score worth ten points (Kennedy, Ohls, Carlson, & Fleming, 1995). The HEI components are organized by adequacy components and moderation components. The term adequacy reflects the need for the component to be included in the diet for the diet to be considered healthy (Kennedy, Ohls, Carlson, & Fleming, 1995). The term moderation describes items that should be limited in the diet due to their negative effects on health (Kennedy, Ohls, Carlson, & Fleming, 1995). The first six components of the HEI are the adequacy components, and the last four are moderation components. The first five components of the HEI reflect the Dietary Recommendations for Americans of fruit, vegetables, grains, dairy, and meat. The sixth component reflects dietary variety because the USDA Food Guide Pyramid and the National Academy of Science s diet and health report emphasize the importance of varying 12
20 the types of foods consumed to ensure optimal intake of nutrients (Food and Nutrition Board, 1989). The HEI defines adequate variety as the consumption of 16 different types of foods within a three day time frame (Kennedy, Ohls, Carlson, & Fleming, 1995). A score of 10 is awarded for each component if the recommendation set by the Dietary Guidelines based on their age and gender is met. If no foods were eaten in one of the categories, or if less than six foods were eaten in a three day time frame, a zero is given for that component. Scores for foods consumed between the minimum and maximum values are awarded based on the percentage of the amount consumed. The moderation components include sodium, saturated fat, total fat, and cholesterol. The criteria to receive ten points is to have sodium intake of 2,400 mg or less, cholesterol intake of 300 mg or less, saturated fat at 10% or less of calories, and 30% or less of calories from total fat. There was little data as to how to set a limit for a score of zero for the moderation components (Kennedy, Ohls, Carlson, & Fleming, 1995). The developers consulted with nutrition experts and examined the intake distributions for these components using the 1989 and 1990 data from the Continuing Survey of Food Intake by Individuals (CSFII) and set the cut off at 4,800 mg of sodium, 450 mg of cholesterol, 15% of total kcal for saturated fat, and 45% of total kcal for total fat (US Dept. of Agriculture, 1992). Intakes at or above these values receive a zero. Table 1 displays the HEI components and scoring criteria. 13
21 Table 1. The Healthy Eating Index Component Criteria for 10 points Criteria for 0 points Vegetables 3-5 servings* 0 servings Fruit 2-4 servings* 0 servings Grains 6-11 servings* 0 servings Milk 2-3 servings* 0 servings Meat 2-3 servings* 0 servings Dietary Variety** 16 different food types in 3 days 6 different food types in 3 days Sodium 2,400 mg 4,800mg Saturated Fat 10% total kcal 15% total kcal Total Fat 30% total kcal 45% total kcal Cholesterol 300 mg 450mg *Vary based on age and gender recommendations from the 1990 Dietary Guidelines for Americans ** For one day use 8 and 3 foods for 10 and 0 points respectively The Healthy Eating Index-2005 The basis for the original HEI was the 1995 Dietary Guidelines. Therefore, when new guidelines were released in 2005, there was the need for an updated HEI as well. The Healthy Eating Index-2005 (HEI-2005) was developed to reflect changes in recommendations that emphasized the importance of whole gains, varying types of vegetables, specific types of fat, and the concept of discretionary calories (Guenther, Reedy, & Krebs-Smith, 2008). The goal was to make a tool that measured diet quality in terms of compliance to the 2005 Dietary Guidelines. The components of the HEI-2005 include the major food groups found in MyPyramid; total fruit, total vegetables, total grains, milk, and meat and beans. Beyond the food categories found in MyPyramid, the 2005 Dietary Guidelines make several suggestions and components were added to the HEI-2005 to reflect these suggestions (Guenther, Reedy, & Krebs-Smith, 2008). Emphasis was put on 14
22 the types of fruits, vegetables, and grains eaten, so a whole fruit component, dark green and orange vegetables/legumes component, and whole grain component were added. An oil component was added that includes non-hydrogenated vegetable oils as well as the fatty portions of fish, nuts, and seeds (Guenther, Reedy, & Krebs-Smith, 2008). The concept of discretionary calories was introduced by the 2005 Dietary Guidelines Advisory Committee as the difference between total energy requirements and the energy consumed to meet recommended nutrient intakes (Dietary Guidelines Advisory Committee, 2005). The discretionary calories component includes calories that come from solid fats, alcoholic beverages, and added sugars (Guenther, Reedy, & Krebs-Smith, 2008). Individual food items may count toward more than one component. For example, the lowest fat portions of meat are included in the meat and bean component and the fatty portions are counted as solid fat and contribute to the discretionary calories component (Guenther, Reedy, & Krebs-Smith, 2008). Table 2 displays the components and scoring criteria for the HEI Scoring HEI-2005 adequacy components. Similarly to the HEI, the HEI-2005 is composed of both adequacy and moderation components. The adequacy components consist of total and whole fruit, total vegetables and dark green/orange vegetables, total grains and whole grains, milk, meat and beans, and oils (Guenther, Reedy, & Krebs-Smith, 2008). The Healthy Eating Index-2005 assesses the adequacy of foods and nutrients as a ratio to energy intake, or on a density basis, as opposed to assessing them as absolute values as the original HEI 15
23 did (Guenther, Reedy, & Krebs-Smith, 2008). Adequacy components are scored on a cup, ounce, or gram equivalents per 1,000 calories. Table 2. The Healthy Eating Index-2005 Component Total points Criteria for total points Criteria for 0 points Total fruit cup/1000 kcal 0 Whole fruit cup/1000 kcal 0 Total vegetable cup/1000 kcal 0 Dark green and orange vegetables/legumes cup/1000 kcal 0 Total grains oz./1000 kcal 0 Whole grains oz./1000 kcal 0 Milk cup/1000 kcal 0 Meat and beans oz./1000 kcal 0 Oils 10 12g/1,000 kcal 0 Saturated fat 10 7% total kcal 15% total kcal Sodium g/1,000 kcal 2g/1,000 kcal Solid fats/alcoholic beverages/added sugar 20 20% total kcal 50% total kcal MyPyramid defines the cup, ounce, and gram recommendations for each food group based on calorie levels between 1,000 and 3,200 calories. The adequacy components for the HEI-2005 were based on the 1,200 to 2,400- calorie patterns so that the recommended nutrient intakes for most people were met (Britten, Marcoe, Yamini, & Davis, 2006). When establishing guidelines for how to score the HEI-2005 components, the least restrictive of calorie patterns were chosen as the standard for a maximum score (Guenther, Reedy, & Krebs- Smith, 2008). Intakes at the level of the standard or better are awarded the maximum number of points for that component. If there was no intake for the component, it is given a zero. Intakes between zero and the maximum are awarded proportionately. 16
24 Scoring HEI-2005 moderation components. The 2005 Dietary Guidelines highlights other sources that are consistent with its recommendations; one being MyPyramid, and another being the Dietary Approaches to Stop Hypertension (DASH) Eating Plan developed by the National Heart, Lung, and Blood Institute. These plans have guidelines for saturated fat being less than 7% to 8% of energy (US Health and Human Services and US Department of Agriculture, 2005). The 2006 American Heart Association guidelines also suggest 7% or less of calories from saturated fat (Lichtenstein et al., 2006). When developing the HEI-2005, 7% was chosen as the maximum score of 10 based on those sources (Guenther, Reedy, & Krebs-Smith, 2008). A score of 8, which still indicates a good score, is given to the level of 10% of calories coming from saturated fat, which is the value recognized by the 2005 Dietary Guidelines (Guenther, Reedy, & Krebs-Smith, 2008). The sodium standard was set by the same standard the Institute of Medicine uses to set Dietary Reference Intakes (DRIs). The DRI panel divides the value they set for the DRI by the estimated median energy intake for the given age group and this is the density used to set the DRI (Yates, Schlicker, & Suitor, 1998). When setting the standard for a score of 10, the Adequate Intake (AI) for sodium (1,500mg) was divided by the estimated mean calorie level used by the DRI panel (2,150 kcal), and a value of 700 mg of sodium per 1,000 calories was determined (Guenther, Reedy, & Krebs-Smith, 2008). A score of 8 was determined the same way, but by using the Upper Limit (UL) value (2,300 mg) 17
25 instead of the AI. A value of 1,100 mg of sodium per 1,000 calories was assigned to the value of eight (Guenther, Reedy, & Krebs-Smith, 2008). The maximum score for the discretionary calorie component is based on the recommendations found in MyPyramid. It is the least restrictive of all components, set at 20% of all calories (Guenther, Reedy, & Krebs-Smith, 2008). It is difficult to assign a zero for a moderation component because as levels increase, a lesser score is awarded; therefore, there is no mathematical equivalent for a score of zero as there is for the adequacy components. There is also no scientific evidence to specify which value would deserve a zero. Developers of the HEI-2005 chose a value at the 85 th percentile of the population distribution for the standard of zero for moderation components (Guenther, Reedy, & Krebs-Smith, 2008). The data used to determine these standards was individual 24-hour dietary recalls from 8,650 respondents from the National Health and Nutrition Examination Survey, (National Center for Health Statistics, 2004). The value of 85% was chosen because if the standard were set so that a large part of the population received a zero, detecting differences among individuals and groups would be difficult to detect (Guenther, Reedy, & Krebs- Smith, 2008). Scores between the maximum and minimum standards are awarded points proportionately. Weight of HEI-2005 Components. Like the original HEI, the Healthy Eating Index-2005 is set on a 100 point scale. However, there are 12 categories that range in maximum scores of 5, 10, or 20. Although scores for the HEI-2005 categories range from 5-20, there is relatively equal weighting for each 18
26 component as a whole (Guenther, Reedy, & Krebs-Smith, 2008). Fruit, vegetables, and grains each have two components (total versus whole), but are awarded 5 points each for a total of 10 points per food group, equating to an even weight for each food group. The only component that is weighted more heavily is the discretionary calorie component and it is awarded a maximum of 20 points (Guenther, Reedy, & Krebs-Smith, 2008). This was done for two reasons. First, the 2005 Dietary Guidelines encourages choosing low- fat foods that are free of added sugar; and second, foods in this category may displace nutrient-dense foods, add energy without adding nutrients, and are generally consumed in amounts that far exceed the discretionary calorie allowances (Guenther, Reedy, & Krebs-Smith, 2008). For these reasons, the developers of the HEI-2005 valued this component higher to reflect its contribution to dietary quality. The Diet Quality Index The Diet Quality Index was created with the intent of measuring risk for diet related chronic disease (Patterson, Haines, & Popkin, 1994). It was one of the first indices to reflect food intake recommendations to dietary recommendations set in place by governmental organizations with its basis set on the recommendations from the publication Diet and Health report released in 1989 by the Committee on Diet and Health of the National Research Council Food and Nutrition Board (Food and Nutrition Board, 1989). The DQI consists of eight components, each consisting of equal weight toward the total score. Each component is worth zero, one, or two points for a possible score of The lower the total score, the higher the quality of the diet. 19
27 The National Research Council Food and Nutrition Board lists their recommendations in order of importance, with those listed first being of greater importance than the ones listed last (Patterson, Haines, & Popkin, 1994). The DQI is set up to reflect this by having more components represent higher ranked recommendations (Patterson, Haines, & Popkin, 1994). Three components of the DQI reflect the first recommendation of the National Research Council Food and Nutrition Board, which is fat. The next recommendation is carbohydrates and this is represented with two components in the DQI. The remaining three components of the National Research Council Food and Nutrition Board recommendations are protein, sodium, and calcium, and are each represented with one component in the DQI (Patterson, Haines, & Popkin, 1994). If the recommendation is met or exceeded for positive categories (carbohydrates and calcium), that component receives a zero. The negative components (fat, protein, and sodium) are given a zero if intake is below or at the recommendation (Patterson, Haines, & Popkin, 1994). If the recommendation is not met, there are specified ranges as to whether one or two points are given for each category. Table 3 gives detailed information for how each component is scored. The Diet Quality Index Revised As new dietary guidelines are released, the need for new diet quality indices arises. The original DQI was established on the guidelines of the 1989 Diet and Health recommendations of the National Academy of Sciences (Food and Nutrition Board, 1989). With the release of the 1992 Food Guide Pyramid, the 1995 Dietary Guidelines for Americans, and the initial release of the Dietary 20
28 Reference Intakes, an updated index was developed to reflect the most current dietary recommendations (Haines, Siega-Riz, & Popkin, 1999). Table 3. The Diet Quality Index Component Measure Total fat 30% total kcal 30-40% total kcal >40% total kcal 2 Sat. fat 10% total kcal 10-13% total kcal >13% total kcal 3 Cholesterol 300 mg mg >400 mg 4 Fruit and Veg. 5+ servings* 3-4 servings* 0-2 servings* 5 Starch, complex carb (beans, peas, etc.) 6+ servings* 4-5 servings* 0-3 servings* 6 Protein 0-100% RDA % RDA >150% RDA 7 Sodium 2400 mg >3400 mg mg 8 Calcium 100% RDA % RDA <66.67% RDA (A lower scores denotes a higher quality diet) *Serving size = ½ cup vegetable, fruit, cereal, legumes 1 medium piece of fruit 1 roll, muffin, slice of bread The revised version of the DQI (DQI-R) is based on eating a variety of foods within food categories while using fats and sugars sparingly. It reflects more current dietary guidelines and incorporates a measure of dietary variety and moderation (Haines, Siega-Riz, & Popkin, 1999). The revised version was also expanded to a 100-point scale and was reversed in direction to improve interpretability; a higher score now correlates with better diet quality (Haines, Siega-Riz, & Popkin, 1999). The DQI-R has many uses, including population monitoring, research, and even as a tool for nutrition education and counseling (Snyder, 2007). 21
29 The objectives of the new index were to find a method to measure fruit, vegetable, and grain servings in a more consistent way and to evaluate the nutrition criteria that the index is based on (Haines, Siega-Riz, & Popkin, 1999). The nutrition quality components of the DQI-R are: total fat, saturated fat, dietary cholesterol, servings of fruit, servings of vegetables, servings of grains, calcium, iron, diversity, and moderation. Each component is worth up to 10 points. Table 4 shows each component and the criteria to receive the highest and lowest scores. Table 4. The Diet Quality Index Revised Component 10 points 5 points 0points Total Fat 30% kcal >30% kcal >40% kcal Sat. Fat 10% kcal >10% kcal >13% kcal Cholesterol 300 mg >300 mg >400 mg Fruit 100% rec. 0 Vegetable 100% rec. 0 Grain 100% rec. 0 Calcium 100% AI 0 Iron 100% RDA 0 Dietary 6 <3 Diversity Dietary Moderation 7 <4 Components and scoring of the Diet Quality Index Revised. Components of the DQI-R include macronutrients, micronutrients, food groups, and dietary diversity and moderation (Haines, Siega-Riz, & Popkin, 1999). The DQI-R has three components that reflect fat macronutrient distribution recommendations, including total fat, saturated fat, and cholesterol. These are scored based on three levels: people who meet the recommendation get the full 10 points for that category, people within 30% of the recommendation receive 5 points, and people above 30% get 0 points (Haines, Siega-Riz, & Popkin, 1999). The DQI-R refers 22
30 to the term proportionality as the foods that are recommended to be consumed more than others (Haines, Siega-Riz, & Popkin, 1999). The three components that reflect proportionality are servings of fruits, vegetables, and grains. These are scored based on the percentage of recommended servings consumed, with 10 points being awarded for meeting or exceeding the recommendation, and zero points for not consuming anything in that category. Two of the indicators that reflect intakes of micronutrients are calcium and iron. Calcium was included as opposed to servings of dairy products as many people do not use dairy as sources of calcium due to lactose intolerance or having a dislike for it, and instead use other nondairy sources of calcium (Haines, Siega- Riz, & Popkin, 1999). The scoring criterion for calcium is based on the value designated by the Adequate Intake value. Iron was chosen as a measurement, with the standard being 100% of the RDA, because the developers believed the mineral status would better explain variation in diet quality than the inclusion of meat or protein intakes (Haines, Siega-Riz, & Popkin, 1999). Many components of the DQI-R reflect nutrients of concern in relation to over-nutrition, but iron is a nutrient of concern in populations at risk for under-nutrition such as those with limited resources, children, and pregnant and young women (Haines, Siega-Riz, & Popkin, 1999). The final two components are dietary diversity and moderation. The diversity category was designed so that consumption differences in the 23 broad food group categories would be recognized (Haines, Siega-Riz, & Popkin, 1999). Table 5 shows the food groups that are included in the diversity component. There 23
31 are seven subgroups of grain, vegetable, and meat/dairy components and two subgroups for the fruit component. Food groups were included as opposed to individual foods because it has a higher probability of reflecting actual variability than the measure of specific foods does (Haines, Siega-Riz, & Popkin, 1999). For an item to be counted for one of the food group categories, at least half a serving (as defined by the Food Guide Pyramid) must be consumed during the two day survey period (Haines, Siega-Riz, & Popkin, 1999). Each subgroup of the dietary variety component is worth 2.5 points, so that they are weighted evenly, and for a total component worth of ten points. Within each subgroup, the score reflects the percentage of the total maximum score (Haines, Siega-Riz, & Popkin, 1999). The moderation component is scored according to each of the four subgroups, shown in Table 6. The four elements included are added sugars, discretionary fat, sodium intake, and alcohol intake. These components reflect the discretionary behavior of consumers (Haines, Siega-Riz, & Popkin, 1999). Because total fat, saturated fat, and cholesterol are independent components in the DQI-R, they are not included in the dietary moderation component (Haines, Siega-Riz, & Popkin, 1999). The USDA defines discretionary fat as all excess fat consumed from foods beyond the lowest fat forms (Food Surveys Research Group, 1994). This measure included fats added to foods in preparation or at the table, including margarine, cheese, oil, meat drippings, and chocolate (Food Surveys Research Group, 1994). The USDA defines teaspoons of added sugar as the quantity of sweetener that 24
32 contains the same amount of carbohydrate as one teaspoon of table sugar (Food Surveys Research Group, 1994). Table 5. DQI-R Elements of Dietary Diversity Grains Non-whole-grain breads Quick breads Pasta Whole-grain breads Whole-grain cereals Rice Non-whole-grain cereals Vegetable White potatoes Components Tomato products Dry peas and beans Other starchy vegetables Deep yellow and orange vegetables Dark green and leafy vegetables Other vegetables Fruit Citrus fruit, melons, berries Components Meat/Dairy Components All other fruits and juices Beef, pork, organ meats, lunchmeat Milk Poultry Cheese Eggs Fish Yogurt Table 6. DQI-R Dietary Moderation Component Values 2.5 points 1.5 points 1.0 points 0 points Teaspoons 100% >100% >150% >200% Added Sugar rec. Discretion 25g/d >25g/d >50g/d >75g/d ary fat Sodium 2,400 >2,400 >3,400 mg Alcohol 100% rec. mg mg >100% >150% >200% 25
33 A census for the recommendation of minimum and maximum amounts for the moderation elements are not as easily defined as the other components. The Food Guide Pyramid provides guidelines for sugar as limiting intake to no more than 6 teaspoons for those consuming 1,600 kcal a day, 12 teaspoons for 2,200 kcal a day, and 18 teaspoons for 2,800 kcal a day (The Food Guide Pyramid, 1992). The Dietary Guidelines for Americans recommend men drink no more than two drinks per day and that women drink no more than one (Dietary Guidelines Advisory Committee, 2005). One drink is defined as a 12oz beer or wine cooler, 8 oz. of malt liquor, 5 oz. of wine, or 1.5 oz. of 80 proof liquor (Dietary Guidelines Advisory Committee, 2005). The guideline cited by the Food and Nutrition Board in 1989 for sodium was intakes should be less than 2,400 mg/day, which is the standard for sodium intake in the DQI-R (Food and Nutrition Board, 1989). As with the diversity component, the moderation component is scored according to each of the four subgroups; each subgroup being worth 2.5 points (Haines, Siega-Riz, & Popkin, 1999). As opposed to each of the subgroups being based on a percentage of the maximum for that subgroup, the values possible are 2.5, 1.5, 1.0, and 0. For the sugar and alcohol components, those consuming 100% or less of the recommendation get a score of 2.5 and scores decline so that those consuming more than 200% get 0 points toward the total dietary moderation score. A 2.5 is given if 2,400 mg or less of sodium is consumed, and more than 3,400 mg results in a zero. Those consuming 25g or less of discretionary fat per 26
34 day get 2.5 points and more than 75 grams get a zero (Haines, Siega-Riz, & Popkin, 1999). Evaluation of the Healthy Eating Index-2005 The Healthy Eating Index-2005 went through a series of evaluations to test its validity. Guenther and colleagues assessed the HEI-2005 four different ways (2008). First, they compared the scores to menus developed by experts. The menus used were based on MyPyramid, the DASH Eating Plan, Harvard s Healthy Eating Pyramid, and the American Heart Association s No-Fad Diet (Guenther, Reedy, Krebs-Smith, & Reeve, 2008). The HEI-2005 correlated very high with all of the menus. The only menu with poor correlations for one of the components was Harvard s Healthy Eating Pyramid. As expected, this menu scored poorly on the milk category because consumption of milk and milk products are not encouraged in the Harvard food guide (Guenther, Reedy, Krebs- Smith, & Reeve, 2008). Second, researchers compared HEI-2005 scores of smokers to nonsmokers using 24-hour diet recalls from 8,650 individuals from the National Health and Nutrition Examination Survey, Previous studies have provided a significant distinction between smokers and nonsmokers, in that smokers have poorer diet quality than those who do not smoke (Dallongeville, Marecaux, Fruchart, & Amouyel, 1998). The total mean HEI-2005 score for smokers was 44.7 which was significantly lower than nonsmokers mean score of 55.3 (Guenther, Reedy, Krebs-Smith, & Reeve, 2008). Of the 12 components in the HEI-2005, nine of them were significantly lower for smokers versus non- 27
35 smokers (p<0.01). Meat and beans, saturated fat, and sodium had no differences between the two groups (Guenther, Reedy, Krebs-Smith, & Reeve, 2008). This evaluation revealed that the HEI-2005 may be a more valid tool for assessing diet quality than the original HEI because, for the latter, total mean scores were separated by a narrower margin and only five of the 10 components were significantly different (total fruit, total vegetables, total grains, milk, and variety) (Guenther, Reedy, Krebs-Smith, & Reeve, 2008). Third, they evaluated whether the HEI-2005 measured diet quality independently of energy intake. It was found that the correlations of individual components were independent of energy intake (Guenther, Reedy, Krebs-Smith, & Reeve, 2008). Finally, they examined whether the HEI-2005 had more than one underlying dimension. Evaluations showed that several factors contribute to the HEI-2005 and not a single linear combination of components accounts for the overall HEI-2005 score (Guenther, Reedy, Krebs-Smith, & Reeve, 2008). These evaluations of the HEI-2005 provided strong evidence that it is a valid measure of diet quality for all individuals aged two and up. Not only does it give a strong representation to the key recommendations of the 2005 Dietary Guidelines, it clearly distinguishes between groups with known differences in diet quality and assessed diet quality separately than diet quantity (Guenther, Reedy, Krebs-Smith, & Reeve, 2008). The HEI-2005 is used by the USDA to monitor populations and it has been used by the National Cancer Institute for epidemiologic research (Guenther, Reedy, Krebs-Smith, & Reeve, 2008). In 28
36 addition to population monitoring, the HEI-2005 is also useful for intervention evaluations and research. Evaluation of the Diet Quality Index-Revised The DQI-R was evaluated on several levels for validity. Initially, the distribution of the overall DQI-R scores was examined for significance, and they were found to be meaningful in statistical terms (Haines, Siega-Riz, & Popkin, 1999). Then, the individual component values were compared across the range of the index. As DQI-R scores moved from lowest to highest groupings of scores, there were consistent improvements for all components, both qualitative and quantitative (Haines, Siega-Riz, & Popkin, 1999). These evaluations were completed using two 24-hour diet recalls from a sample of 3,202 individuals aged 18 years and older from the 1994 Continuing Survey of Food Intakes by Individuals (Haines, Siega-Riz, & Popkin, 1999). Newby and colleagues assessed the DIQ-R for reproducibility and validity using 127 male participants aged years (2003). DQI-R scores were computed individually from two separate FFQs administered one year apart, and also from two one-week diet records. Venous blood samples were also collected before the second FFQ was completed. The mean DQI-R scores for the first FFQ were 69.5 and 67.2 for the second FFQ (Newby et al., 2003). The reproducibility correlation for the FFQs was The mean DQI-R scores for the diet records was 62.0 and the correlation scores for diet records to the first FFQ was 0.66 and 0.72 for the second FFQ (Newby et al., 2003). The DQI-R scores were also directly correlated with measurements of plasma biochemical markers (alpha- and 29
37 beta-carotene, lutein, and alpha-tocopherol) and inversely correlated with total cholesterol (Newby et al., 2003). It was concluded that the DQI-R is satisfactory for reproducibility and validity. Overall, the DQI-R is successful at identifying high-quality diets that meet nutrient needs with low intakes of total and saturated fat (Kant, 1996). The DQI-R has also been a helpful tool in serving as a guide in dietary counseling (Snyder, 2007). The Rapid Eating and Activity Assessment for Patients The Nutrition Academic Award (NAA) Program was developed by the National Heart, Lung and Blood Institute (NHLBI) in 1997 with the purpose of improving nutrition training throughout U.S. medical schools (Pearson et al., 2001). The NAA immediately recognized the need for a practical nutrition assessment tool because traditional dietary assessment tools were difficult to use and time consuming (National Academy of Sciences, 1989). It was their goal to create a tool that could easily be used by health care providers, easy for patients to complete, cost effective, and would address national dietary priorities for adults (Gans et al., 2003). The result was the Rapid Eating and Activity Assessment for Patients (REAP). The basis of the REAP was assessing diet quality as defined by the Food Guide Pyramid and the 2000 U.S. Dietary Guidelines (Gans et al., 2003). The questions on the REAP are intended to assess intake of fat, saturated fat and cholesterol, whole grains, calcium-rich foods, fruits and vegetables, sugary beverages and foods, sodium, alcoholic beverages and physical activity. The intent of creating the REAP was to provide a useful tool to physicians to assess nutrition and facilitate in nutrition counseling (Gans et al., 2003). The REAP is 30
38 accompanied by a Physician Key that aids the health provider in discussing the patient s selections and how to appropriately provide information and nutrition counseling (Gans et al., 2003). Since its development, the REAP has been evaluated and revised several times (Gans et al., 2003). A later version of the REAP went through an evaluation that included an implementation feasibility study, calibration and validation study, a cognitive assessment test, a reliability study (Gans et al., 2006). The feasibility evaluation was evaluated with 61 medical students and physicians using the original 32-item REAP questionnaire, and it was rated moderately high for ease of use, length, usefulness, helpfulness, and practicality. After the feasibility evaluation, a validation study was conducted using three day food records from 44 medical students (Gans et al., 2006). The food records were entered into Food Processor Nutrition and Fitness Software. An average of the dietary information from Food Processor was used to calculate the Healthy Eating Index scores. The medical students also completed the 32-item REAP. Correlation analysis indicate that the REAP correlated well with the overall HEI scores (r = 0.49, p = ) (Gans et al., 2006). Correlations for individual sub-scores were performed as well, and fat, saturated fat, cholesterol, fruit, meat, and variety correlated well. Sodium, grains, vegetables, and dairy products were more poorly correlated. Table 7 lists the correlations of sub-scores. 31
39 Table 7. Correlations of HEI and REAP sub-scores Category r value P value Total Fat Saturated Fat Cholesterol Fruit Meat Variety Sodium Grains Vegetables Dairy The cognitive assessment testing was conducted using a convenience sample of 31 multicultural participants and was modified based on the results (Gans et al., 2006). Some of the changes included adding check boxes for responses, changing the font size, and adding more portion-size examples. Questions on sweet and salt consumption were added and questions about the type of ground beef, removing skin and fat from meats, and number of meals eaten per day were removed (Gans et al., 2006). Test-retest reliability testing was done using 94 participants who were recruited through newspaper advertisements and posters (Gans et al., 2006). The participants filled out one survey a week for three weeks (REAP, food frequency questionnaire, REAP). The correlation for the REAP from the first week and the third week was 0.86 (p <.0001) (Gans et al., 2006). The validity of the REAP to the FFQ was also performed and scores significantly correlated with all food groups and nutrients studied with the exception of vitamin C (Gans et al., 2006). R-values are provided in Table 8. 32
40 Table 8. Correlations of FFQ nutrients and REAP variables Category r value P value Calories % Calories as Fat % Calories as Saturated Fat Cholesterol Sodium Sucrose Fiber Fruit Vegetables Vitamin A Vitamin C Calcium Beta Carotene Alcohol These series of evaluations indicated that the earlier version of REAP correlated well with the HEI, had great reliability scores, and reflected intake of nutrients and food groups to the Dietary Guidelines (Gans et al., 2006). A shortened version of the REAP consisting of 16 questions was developed, but little research has been done to test its validity (Segal-Isaacson, Wylie-Rosett, & Gans, 2004). In 2004, Segal-Isaacson and colleagues conducted a validation study of the Rapid Eating and Activity Assessment for Participants Short Version (REAP-S) using the Block 1998 Semi Quantitative Food Frequency 33
41 Questionnaire (Block 1998 FFQ) (Segal-Isaacson, Wylie-Rosett, & Gans, 2004). Medical students completed the Block 1998 FFQ and the REAP-S and Pearson correlations were performed for individual items on each questionnaire that measured similar items. The food groups that correlated well were vegetables, fruits, and dairy (Segal-Isaacson, Wylie-Rosett, & Gans, 2004). Added fat and servings of meat were negatively correlated. Correlations are displayed in Table 9. Table 9. Correlations between REAP-S and Block 1998 FFQ Variables Category r value P value Vegetable Servings Fruit Servings Dairy Servings Added Fat Servings Meat Servings The researchers attributed to poor correlation of the meat category to the strong differences in the way the questions were asked on the two questionnaires (Segal-Isaacson, Wylie-Rosett, & Gans, 2004). The Block 1998 FFQ included eggs and beans in the meat category while REAP-S includes mostly forms of animal protein. The Block 1998 FFQ also asks about number of servings per day while REAP-S asks how often more than 8 ounces per day of meat is eaten in a week (Segal-Isaacson, Wylie-Rosett, & Gans, 2004). Association of Diet Quality Indices and Disease Despite the known relationship between diet quality and disease risk, there is little data available for diet quality indices as related to disease, especially those utilizing the HEI-2005 and DQI-R. A study by McCullough and colleagues 34
42 using an altered version of the HEI (ahei) found significant associations of scores to the risk of chronic disease in men (RR=0.80) (2002). The ahei was created in an attempt to improve upon the original HEI s ability to predict chronic disease (McCullough et al., 2002). The ahei includes many of the original HEI components, but also includes components of nuts and soy protein, the ratio of white to red meat, trans-fat, and cereal fiber (McCullough et al, 2002). These changes were made to better reflect factors that research has shown to be associated with reduced risk of chronic disease. In a five year prospective study investigating diet quality and risk of colorectal cancer, the HEI-2005 was found to effectively estimate risk of cancer (Reedy, Mitrou, Krebs-Smith, Wirfalt, & Flood, 2008). When the number of cancer incidences among the top 20% of HEI-2005 scores was compared to the number of cancer incidences of the bottom 20% of scores, the relative risk for men was 0.72 and was 0.8 for women (Reedy, Mitrou, Krebs-Smith, Wirfalt, & Flood, 2008). A study by McCullough and colleagues also revealed a relationship between index scores and cardiovascular disease, utilizing the original HEI (McCullough et al., 2000). They found that males between the ages of 40 and 75 years who had HEI scores above 80 were 11% less likely to develop cardiovascular disease than those who had HEI scores below 20 during the eight year prospective study (McCullough et al., 2000). Diet Quality in Young Men There have been few studies looking at diet quality of young men as determined by the HEI-2005 or the DQI-R. There have, however, been several 35
43 studies using the original HEI, and all suggest that young males have generally poorer diet quality compared to other populations. Forshee & Storey noted that young males have the lowest HEI scores compared to women and younger and older male cohorts (2006). They reported that men aged 20 to 29 years of age have the poorest diet quality of all age ranges, and it starts to improve with age (Forshee & Storey, 2006). Men scored lower on nearly all components including total and whole fruit, whole grains, total vegetables, dark green and orange vegetables, legumes, and calories from solid fats, alcohol, and added sugar (Forshee & Storey, 2006). Results of a study of French men show that HEI scores positively correlate with age (Drewnowski et al., 2009). In the study, the average HEI score of those over the age of 55 was 67.3 compared to the average of 61.3 for participants younger than 45 years of age (Drewnowski et al., 2009). Furthermore, in a study of 4,356 American male and female subjects, age was related to diet quality (Beydoun & Wang, 2008). In this study, HEI scores were compared for three age groups and the scores increased as age increased. The 20 to 34 age group had an average HEI score of 62.3, the 35 to 54 age group had an average HEI score of 62.9, and the 55 to 65 age group had an average HEI score of 66.1 (Beydoun & Wang, 2008). All these studies suggest that diet quality is poorest among young adult males, and it gradually increases with age. 24-Hour Diet Recalls Several methods to obtain dietary data are available. The 24 hour dietary recall is a method that requires individuals to report the types and amounts of 36
44 foods they consumed in the past 24 hours. Twenty-four hour recalls are a valid method for assessing dietary intake, however many factors can decrease the accuracy (Conway, Ingwersen, & Moshfegh, 2004). Misreporting food intake is one of the main inaccuracies of dietary assessment. A meta-analysis of 37 studies examining the misreporting of dietary food intake using 24 hour recalls and food records found that BMI is the most constant factor for underreporting intakes; as BMI increases, the probability of underreporting generally increases (Poslusna, Ruprich, de Vries, Jakubikova, & van t Veer, 2009). Underreporting was also more likely among women and older subjects, but the finding relating to older subjects was not consistent among all the studies. Those of lower socio-economic status and education levels were also more likely to underreport food intakes (Poslusna, Ruprich, de Vries, Jakubikova, & van t Veer, 2009). Steps can be taken to reduce the likelihood of underreporting. Using the USDA Automated Multiple-Pass Method can greatly reduce bias and accurately estimate nutrient intake (Moshfegh et al., 2008). The five steps of this method include: 1) having subjects quickly recall all foods and beverages consumed the previous 24 hours, 2) the interviewer prompts the subject for foods commonly forgotten, 3) the interviewer asks the time-of-day when foods were eaten as well as the name of the eating occasion, 4) questions of specific detail such as descriptions and portion sizes are asked, and 5) a final probe to ask if anything else was consumed (Blanton, Moshfegh, Baer, & Kretsch, 2006). 37
45 Chapter 3 METHODOLOGY This study will use thirty 24-h dietary recalls and REAP-S surveys that were collected previously. The study was approved by the Arizona State University IRB and all participants provided written consent (Appendix A). The original study examined the effect of vitamin C supplementation on physical and mental health parameters over an eight week period. The 24-h diet recalls and REAP-S were collected from the participants at the baseline visit. In addition to the original thirty 24-h dietary recalls and REAP-S, 20 more were collected to make for a total of 50 participants. Data collection for the additional 20 participants was approved by the Arizona State University IRB and these participants gave consent as well. Participant Selection The inclusion criteria for the study were healthy, non-smoking males aged 18 to 35 years and did not participate in competitive sports. Volunteers were excluded if they had a current disease or illness, ingested vitamin C supplements (>100mg/d), had any condition that contraindicated exercise testing, had a BMI greater than 40 kg/m 2, tended to faint when blood was drawn, and/or participated in physical training that consisted of vigorous exercise more than four times per week (Appendix B). Participants were recruited using flyers, electronic and in class announcements, and word of mouth. Individuals that were interested contacted the study investigators via phone or and were screened for inclusion. 38
46 Study Design The REAP-S questionnaire (Appendix C) was completed at baseline on the same day that the 24-h diet recall (Appendix D) was administered by a trained investigator. In the current study, both the HEI-2005 and DQI-R scores were calculated based on the 24 hour diet recalls that were collected. The dietary recalls were entered into The Food Processor Nutrition and Fitness Software by ESHA Research, Inc. (version 10.8, 2011). The HEI-2005 and DQI-R scores will be compared to the REAP-S scores using correlational analyses. Scoring the HEI-2005 The Healthy Eating Index-2005 (HEI-2005) gives a score on a 100 point scale but consists of 12 categories, each ranging from 5-20 points (Guenther et al, 2008). The categories of the HEI-2005 include: total fruit; whole fruit; total vegetables; dark green and orange vegetables; total grains; whole grains; milk; meat and beans; oils; saturated fat; sodium; and solid fats, alcoholic beverages, and added sugars. Oils include calories from fish, nuts, and seeds, and legumes are included in the dark green and orange vegetable category if the meat category has been fulfilled (Guenther et al, 2008). Although scores for the HEI-2005 range from 5-20, there is relatively equal weighting for each component as a whole. Fruit, vegetables, and grains each have two components, but are awarded 5 points each for a total of 10 points per food group, equating to an even weight for each food group. The only category that is weighted more heavily is the discretionary calorie component (solid fat, alcoholic beverages, and added sugar) that is awarded 20 points. 39
47 Adequacy components are awarded full points for meeting the recommendation for that category, and a zero is given if none were consumed for that category. For the moderation components, it is more difficult for which value to assign a zero because increasing amounts are awarded decreasing scores. The standard for a score of zero was set at the 85 th percentile of the population distribution so that differences among individuals and groups and changes over time at the low end of the scoring range could be detected. Figure 2 lists the 12 categories, the number of points possible for each category, and the criteria for a perfect score as well as a score of zero. Values that fall within each range are given based on the proportion of the criteria met, except for sodium and saturated fat. The 2005 Dietary Guideline for saturated fat indicates a good score of being 10% of total calories. However, a value of 10% is given a score of 8 on the HEI In order for a score of 10 to be given, no more than 7% of the total kcals should come from saturated fat. This value was chosen as the standard because both the DASH plan and the 2006 American Heart Association guidelines call for 7% or less. The 2005 Dietary Guideline for sodium is that 2,300mg/d or less is consumed; however, it is recommended that no more than 1,500mg/d of sodium is consumed for those who are black, have hypertension, are middle-aged, and/or are older adults. Because of these recommendations, a score of 10 on the HEI-2005 is given for consuming 1,500mg/d of sodium. A value of 8 is considered relatively good, and therefore, 2,300mg/d was chosen for this value. The proportional values for the HEI-2005 are shown in table 2. 40
48 Scoring the DQI-R The DQI-R is based on ten categories, each worth ten points, thus making a total score range of points with scores closer to zero indicating lower quality diets. Scores for the fruits, vegetables, and grains are based on the percentage of the recommendation eaten, not on a set number of servings; unlike in the original DQI. The components of the DQI-R include: total fat, saturated fat, cholesterol, fruit, vegetables, grain, calcium, iron, dietary diversity, and dietary moderation. Total fat, saturated fat, and cholesterol are scored based on three levels: people who meet the recommendation get the full 10 points for that category, people within 30% of the recommendation receive 5 points, and people above 30% get 0 points (Haines, Siega-Riz, & Popkin, 1999). Servings of fruits, vegetables, and grains are scored based on the percentage of recommended servings consumed, with 10 points being awarded for meeting or exceeding the recommendation, and zero points for not consuming anything in that category. Table 4 lists the components and scoring criteria for the DQI-R. The diversity category was designed so that consumption differences in the 23 broad food group categories would be recognized (Haines, Siega-Riz, & Popkin, 1999). Table 5 shows the food groups that are included in the diversity component. There are seven subgroups of grain, vegetable, and meat/dairy components and two subgroups for the fruit component. For an item to be counted for one of the food group categories, at least half a serving (as defined by the Food Guide Pyramid) must be consumed during the two day survey period 41
49 (Haines, Siega-Riz, & Popkin, 1999). The diversity element was created with the intent of utilizing dietary data from two days; therefore, reaching those recommendations within one day is unrealistic. For this study, only one day of dietary data was available, so the total number of foods for each category to be consumed for a perfect score was halved. If a person consumed more than half of the foods in a subgroup, they did not receive extra credit and could only get the maximum number of points for that subcategory. Each subgroup of the dietary variety component is worth 2.5 points, so that they are weighted evenly, and for a total component worth of ten points. Within each subgroup, the score reflects the percentage of the total maximum score for the component (Haines, Siega-Riz, & Popkin, 1999). The moderation component is comprised of added sugar, discretionary fat, sodium, and alcohol. As with the diversity component, each moderation subgroup is worth 2.5 points (Haines, Siega-Riz, & Popkin, 1999). As opposed to each of the subgroups being based on a percentage of the maximum for that subgroup, the values possible are 2.5, 1.5, 1.0, and 0. For the sugar and alcohol components, those consuming 100% or less of the recommendation get a score of 2.5 and scores decline so that those consuming more than 200% get 0 points toward the total dietary moderation score. A 2.5 is given if 2,400 mg or less of sodium is consumed, and more than 3,400 mg results in a zero. Those consuming 25g or less of discretionary fat per day get 2.5 points and more than 75 grams get a zero (Haines, Siega-Riz, & Popkin, 1999). The moderation component is displayed in Table 6. 42
50 Scoring the REAP-S The REAP-S is a 16-item questionnaire inquiring about food intake from the previous week that the participant fills out. Answers are given in a 3-point scale (Usually/Often, Sometimes, and Rarely/Never). Three of the questions also have an option for does not apply to me. When scoring the REAP-S, only the first 13 questions were used in this study, as the last three questions do not reflect items as evaluated by the HEI-2005 and DQI-R and two of the three questions are in yes/no form. Questions were scored that usually/often = 1 point, sometimes = 2 points, and rarely/never = 3 points. Answers given as does not apply to me were also given 3 points (n=3) (Segal-Isaacson, Wylie-Rosett, & Gans, 2004). The sum of questions 1 through 13 determined the total REAP-S score. The total possible points range from 13 to 39. Statistical Analysis Data is reported as the mean ± SE. Scores from the REAP-S will be correlated to the original HEI, the HEI-2005, and the DQI. Data was tested for normality and was found to be un-evenly distributed. Spearman rank order correlation was used and all analyses were conducted using SPSS version
51 Chapter 4 RESULTS Participant Characteristics A total of 50 male participants were included in this study. The mean age was 24 years (range of years). The mean weight was pounds (range of pounds), the mean height was 70.6 inches (range of inches) and the mean BMI was 25.4 (range of ). Participant characteristics are shown in Table 10. Table 10. Participant characteristics Characteristics Mean ± SE Minimum Maximum Age, y 23.7 ± Weight, pounds ± Height, inches 70.6 ± BMI 25.4 ± n = 50 SE = standard error. BMI = body mass index (calculated as kg/m²). Characteristics of Index Scores Mean scores were calculated for each index and can be found in Table 11. The mean score for the HEI-2005 was 49.6 (range of 27-79), the mean score for the DQI-R was 67.7 (range of ), and the mean score for REAP-S was 30.7 (range of 22-37). 44

52 Table 11. Index characteristics Index Mean ± SE Minimum Maximum Range* HEI ± DQI-R 67.6 ± REAP-S 30.7 ± n = 50 SE = standard error. * Higher score indicates higher quality diet The scores for each index were tested for normality. The distributions for each index are shown as histograms in Figures 1-3. The skewness for the HEI was 0.42, the skewness for the DQI-R was -0.44, and the skewness for the REAP-S was Figure 1. DQI-R Distribution of Scores 45


53 Figure 2. HEI-2005 Distribution of Scores Figure 3. REAP-S Distribution of Scores 46
54 Correlations between Indices Preliminary analyses revealed violation of normality, therefore, Spearman rank order correlations were used to test the strength of the relationship between each index. The HEI-2005 and DQI-R were strongly correlated with a correlation coefficient of 0.75, significant to the level (p = 0.000). The REAP-S was moderately correlated with the HEI-2005 and DQI-R indices. The correlation coefficient for REAP-S and the HEI-2005 was 0.367, significant to the 0.01 level (p = 0.009), and the correlation coefficient for REAP-S and the DQI-R was 0.323, significant to the 0.05 level (p = 0.022). Table 12 shows the correlation coefficients (r value) and the level of significance (p value) for each of index. These relationships are displayed graphically in Figures 4-6. Table 12. Relationship of Indices. Index r value p value HEI-2005 to DQI-R ** REAP-S to HEI ** REAP-S to DQI-R * **Correlation is significant at the level (2-tailed) *Correlation is significant at the 0.05 level (2-tailed) 47
55 Figure 4. HEI-2005 to DQI-R Correlation Figure 5. HEI-2005 to REAP-S Correlation 48
56 Figure 6. DQI-R to REAP-S Correlation Identifying Poor versus Good Quality Diets In addition to Spearman rank order correlations of the overall scores, various other statistics were performed to determine how well the REAP-S identifies poor versus good quality diets. First, scores for each index were split into two categories; those above the median for diets of good quality, and those below the median for diets of poor quality. Crosstab statistics indicated that HEI and DQI-R had a precision of 82%. The precision of the REAP-S to the HEI-2005 for overall diet quality was 64%. Of the 25 diets that were expected to be in the upper 50 th percentile for good quality by both the REAP-S and HEI- 2005, 19 of the diets were in agreement. Thirteen of the expected 25 were classified below the 50 th percentile by both the REAP-S and HEI The DQI-R and REAP-S had a precision of 62% for overall diet quality. Of the 25 diets that were expected to be in the upper 50 th percentile for good 49
57 quality by both the REAP-S and DQI-R, 18 of the diets were in agreement. Thirteen of the expected 25 were classified below the 50 th percentile by both the REAP-S and DQI-R. Then, scores that were considered extreme (n=21) by the HEI-2005 (scores less than 40 or greater than 60) were compared to the REAP-S scores. The REAP-S had 76% precision to the extreme scores, compared to the precision of 64% overall HEI-2005 scores. Modified REAP-S The REAP-S scoring method was then modified to eliminate questions that poorly reflected components of the HEI-2005 and the DQI-R and Spearman rank order correlations were performed again. The excluded questions were those that inquired about how often breakfast was skipped, how many meals were consumed at restaurants, and meat intake (questions 1, 2 and 7). The correlation for the modified REAP-S with the overall HEI-2005 and DQI-R were r = (p = 0.005) and r = (p = 0.003) respectively with a precision of 62%. However, when comparing the modified REAP-S scores to the extreme HEI-2005 scores, precision increased to 81%. Correlation between Index Score and Participant Characteristic The relationship between each index and participant characteristic were also investigated using Spearman rank order correlation coefficient. There was no correlation between any index and participant characteristics. These are displayed in Table
58 Table 13. Relationship between Index and Participant Characteristics. HEI-2005 DQI-R REAP-S Age r = (p=0.662) r = (p=0.894) r = (p=0.959) Weight r = (p=0.805) r = (p=0.666) r = (p=0.700) Height r = (p=0.123) r = (p=0.387) r = (p=0.190) BMI r = (p=0.712) r = (p=0.983) r = (p=0.674) BMI = body mass index (calculated as kg/m²). 51
59 Chapter 5 DISCUSSION These data indicates that the REAP-S correlates significantly well with both the HEI-2005 (r = 0.367) and the DQI-R (r = 0.323). Furthermore, REAP-S distinguished between poor and good quality of diets with a precision of 62% and 64% for the DQI-R and HEI-2005 respectively. Considering the amount of time required to calculate HEI-2005 and DQI-R scores, the REAP-S represents a method for rapid diet quality assessment; a characteristic especially pertinent when large population sample sizes are used. The HEI-2005 and DQI-R are both labor intensive tools (Kant, 1996). Both require analyzing each food consumed in the given time frame on many levels. Although Food Processor Nutrition and Fitness Software was used in this study, the software could not calculate every component for each index. Teaspoons of added sugar, calories from solid fats, and dietary diversity had to be individually calculated, and estimated at times, for each food item of every subject. After the amount consumed in each component is determined, the point value for that component needs to be calculated. The quantitative estimation of nutrients and food groups introduces possibility of error, thus lowering its interrater reliability. It is very likely that any researcher would find a different value for the same diet. A key benefit to the REAP-S is it has great inter-rater reliability. The subject completes the survey on their own, and the only calculation on the part of the researcher is adding up the total score. An earlier version of the REAP had excellent test-retest reliability with a correlation of
60 (P <.0001). This suggests that the REAP-S could be a more reliable way to assess diet quality than other indices (Gans et al, 2006). Studies have revealed that the extremely low HEI values are related to chronic disease and cancer risk compared to diets with extremely high values. Studies by McCullough and colleagues found the highest 20% of scores were associated with significant reductions in chronic disease risk in men (McCullough et al., 2002). There was a 11% lower risk of cardiovascular disease (CVD) among those scoring above an 80 on the original HEI. Scores of an altered version of the HEI (ahei) had a 39% lower risk of CVD among those with highest quality diets (McCullough et al., 2002). Reedy and colleagues evaluated 492,382 diets from the National Institutes of Health-AARP Diet and Health Study and observed a decreased risk of colorectal cancer at a five year follow up when comparing the highest HEI scores to the lowest (relative risk = 0.72) (Reedy et al, 2008). These studies could suggest that extremely low index values reveal the diets of concern and those falling within mid-range may not be at an elevated risk for chronic disease. Values considered extreme in the previous studies were those less than 20 and greater than 80. The HEI-2005 values in this study ranged between 27 and 79, so values less than 40 and greater than 60 were considered extreme for this study. There were 21 diets that fell in this range, and those HEI-2005 values were evaluated against the REAP-S. The REAP-S displayed a 76% precision for appropriately distinguishing subjects into the high and low risk disease categories, 53
61 as compared to the precision of 64% for overall HEI-2005 scores. This suggests the REAP-S may be a valuable tool at identifying risk for chronic disease. This study also suggests that modifications to the REAP-S could improve how well it can accurately quantify total diet quality. The REAP-S scoring method was modified to eliminate questions that poorly reflected components of the HEI-2005 and the DQI-R and Spearman rank order correlations increased. The HEI-2005 with the modified REAP-S increased from to and the DQI-R with the REAP-S increased from to The excluded questions were those that inquired about how often breakfast was skipped, how many meals were consumed at sit down or takeout restaurants, and meat intake (questions 1, 2 and 7). Although these questions assess diet quality, they do it differently than the HEI-2005 and DQI-R. The HEI-2005 does not include a component that reflects skipping breakfast, and the DQI-R addresses overall dietary variety instead. Both the HEI-2005 and DQI-R include components of discretionary calories and sodium intake; the question on the REAP-S that captures these components asks about eating out at restaurants. Although eating out at restaurants will typically increase ones intake of sodium and saturated fat, it appears this question on the REAP-S does not adequately capture quality of diet in the same way as the HEI-2005 and DQI-R. An obvious difference between the REAP-S and the HEI-2005 and DQI-R is how meat consumption is evaluated. The HEI-2005 gives zero points for no meat consumption, and progressively gives more points as meat consumption increases, until the maximum amount of points are achieved at 2.5 ounce 54
62 equivalents per 1,000 calories. If more is consumed, the full 10 points is maintained. The DQI-R evaluates iron as opposed to meat intake, but is evaluated in a similar manner. If less than 0% of the RDA is consumed, zero points are awarded, and points are increasingly awarded up through ten points for 100% of the RDA. The REAP-S evaluates meat intake in an opposite fashion. The minimum amount of points is awarded if more than 8 ounces of meat, on average, is often consumed per day. The maximum amount is given if meat consumption rarely exceeds more than 8 ounces per day. Although large amounts of meat consumption does not reflect good quality of diet, the HEI-2005 and DQI-R only penalize low intake and reward high intake, regardless of the amount. Removing the three poorly reflected questions of the REAP-S to the HEI and DQI-R increases both correlation and precision. Spearman rank order correlation of the HEI-2005 with the modified REAP-S increased to and the DQI-R with the REAP-S increased to Modifying these questions on the REAP-S could potentially strengthen associations between diet quality measures. When the modified REAP-S scores were evaluated against the extreme HEI-2005 scores, precision increased to 81%. The mean score for the HEI-2005 in this study was This was lower than the national average of 58.2 that was determined using data from the Continuing Survey of Food Intake by Individuals, and the National Health and Nutrition Examination Survey (NHANES), (USDA Nutrition Insight 37). Scores remained the same from and because while some components improved, others declined. The scores of the HEI-2005 are low 55
63 in the components of food groups to encourage. The total grains and meat and beans component received very high scores, while whole fruit, total vegetables, whole grains, and milk are low (USDA Nutrition Insight 37). The USDA study concluded that the quality of American diets needs to be improved. The lower HEI-2005 average in this study was not unexpected due to the demographic of the population. Young adult males typically have poorer diet quality compared to other cohorts (Forshee & Storey, 2006). This study included males aged years, with a mean age of 23.7 years, whereas the CSFII and NHNES surveys used individuals aged >2 years and up. In a later report using data from NHANES , the average HEI-2005 of adults aged 20 years and up was 57.2 (Ervin, 2011). The lowest scores in the study were among the years age group, with an average of This age group had the lowest scores for total fruit, whole fruit, whole grains, total vegetables, dark green and orange vegetables and legumes, and calories from solid fats/alcohol/added sugar (Ervine, 2011). Males, compared to females, also had lower intakes of these components. In addition, males consumed more calories from solid fats, alcoholic beverages, and added sugars than females (Ervine, 2011). These findings suggest that the poor quality of diet among young men cannot be attributed to a single factor, but more likely related to diet as a whole. 56
64 Chapter 6 CONCLUSION In summary, the REAP-S has proven to be an acceptable tool to quickly identify diet quality. It has a significant, moderate correlation to both the HEI and the DQI-R, with strong precision as well. The correlation and precision is strengthened when values are compared to only the extreme scores of the HEI- 2005, which indicates risk for chronic disease. This study used diets from young adult males; therefore, more research studies are needed to evaluate the validity of REAP-S in a more diverse population. Modifications made to the REAP-S could also significantly increase its precision, however further research is needed to discover which changes would most accurately reflect diet quality. 57
65 REFERENCES Beydoun, M.A. & Wang, Y. (2008). Do Nutrition Knowledge and Beliefs Modify the Association of Socio-Economic Factors and Diet Quality among U.S. Adults? Preventative Medicine, 46, Blanton, C.A., Moshfegh, A.J., Baer, D.J., & Kretsch, M.J. (2006). The USDA Automated Multiple-Pass Method Accurately Estimates Group Total Energy and Nutrient Intakes. The Journal of Nutrition, 136, Britten, P., Marcoe, K., Yamini, S., & Davis, C. (2006) Development of Food Intake Patterns for the MyPyramid Food Guidance System. Journal of Nutrition Education and Behavior, 38(S6), S78-S92. Burke, B.S., & Stuart, H.C. (1938). A Method of Diet Analysis. Journal of Pediatrics, 12, Conway, J.M., Ingwersen, L.A., & Moshfegh, A.J. (2004). Accuracy of Dietary Recall Using the USDA Five-Step Multiple-Pass Method in Men: An Observational Validation Study. Journal of the American Dietetic Association, 104(4), Dallongeviel, J., Marecaux, N., Fruchart, J.C., Amouyel, P. (1998). Cigarette Smoking is Associated with Unhealthy Patterns of Nutrient Intake: A Meta-Analysis. Journal of Nutrition, 128, Dietary Guidelines Advisory Committee. (2005). Report of the Dietary Guidelines Advisory Committee on the Dietary Guidelines for Americans. Washington, DC: US Department of Agriculture, Agricultural Research Service. Ervin, R.B. (2001). Healthy Eating Index-2005 Total and Component Scores for Adults Aged 20 and Over: National Health and Nutrition Examination Survey, National Health Statistics Reports; no 44. Hyattsville, MD: National Center for Health Statistics. Food and Nutrition Board. Diet and health: Implications for Reducing Chronic Disease Risk. Washington, DC: National Academy Press; Food Surveys Research Group, ARS. (1994). Continuing Survey of Food Intakes by Individuals (CSFII), Pyramid Servings. Washington, DC: Department of Agriculture, Agriculture Research Service. 58
66 Forshee, R.A. & Storey, M.L. (2006). Demographics, Not Beverage Consumption, is Associated with Diet Quality. International Journal of Food Science Nutrition, 57, Fraser, G.E., Jacobs, D.R. Jr., Anderson, J.T., Foster, N., Palta, M., & Blackburn, H. (1981). The Effect of Various Vegetable Supplements on Serum Cholesterol. The American Journal of Clinical Nutrition, 34(7), Gans, K.M., Risica, P.M., Wylie-Rosett, J., Ross, E.M., Strolla, L.O., McMurray, J., & Eaton, C.B. (2006). Development and Evaluation of the Nutrition Component of the Rapid Eating and Activity Assessment for Patients (REAP): A New Tool for Primary Care Providers. Journal of Nutrition Education and Behavior, 38, Gans, K.M., Ross, E., Barner, C.W., Wylie-Rosett, J., McMurray, J., & Eaton, C. (2003). REAP and WAVE: New Tools to Rapidly Assess/Discuss Nutrition with Patients. Journal of Nutrition,133, 556S-562S. Gaziano, J.M., Manson, J.E., Branch, L.G., Colditz, G.A., Willett, W.C., & Buring, J.E. (1995). A Prospective Study of Consumption of Carotenoids in Fruits and Vegetables and Decreased Cardiovascular Mortality in the Elderly. Annuls of Epidemiology, 5(4), Guenther, P.M., Reedy, J., & Krebs-Smith, S.M. (2008). Development of the Healthy Eating Index Journal of the American Dietetic Association, 108, Guenther, P.M., Reedy, J., Krebs-Smith, S.M., & Reeve, B.B. (2008). Evaluation of the Healthy Eating Index Journal of the American Dietetic Association, (108), Guenther, P.M., Reedy, J., Krebs-Smith, S.M., Reeve, B.B. & Basiotis, P.P. (2007). Development and Evaluation of the Healthy Eating Index-2005: Technical Report. Center for Nutrition Policy and Promotion, U.S. Department of Agriculture. Haines, P.S., Siega-Riz, A.M., & Popkin, B.M. (1999). The Dietary Quality Index Revised: A Measurement Instrument for Populations. Journal of the American Dietetic Association, 99, Kahlon, T.S., & Smith, G.E. (2004). Health Benefits of Grains, Fruits, and Vegetables and the USDA Food Guide Pyramid. Cereal Foods World, 49(5),
67 Kant, A.K. (1996) Indexes of Overall Diet Quality: A Review. Journal of the American Dietetic Association, 96, Kant, A.K. (2004) Dietary Patterns and Health Outcomes. Journal of the American Dietetic Association, 104, Kennedy, E.T., Ohls, J., Carlson, S., & Fleming, K. (1995). The Healthy Eating Index: Design and Applications. Journal of the American Dietetic Association, 95, Key, T.J., Thorogood, M., & Appleby, P.N., & Burr, M.L. (1996). Dietary Habits and Mortality in Vegetarians and Health Conscious People: Results of a 17 Year Follow Up. British Medical Journal, 313(7060), Leinonen, K.S., Poutanen, K.S., & Mykkanen, H.M. (2000). Rye Bread Decreases Serum Total and LDL Cholesterol in Men with Moderately Elevated Serum Cholesterol. Journal of Nutrition, 130(2), Lichtenstein, A.H., Appel, L.J., Brands, M., Carnethon, M., Daniels, S., Franch, H.A., Franklin, B., Kris-Etherton, P., Harris, W.S., Howard, B., Karaja, N., Lefevre, M., Rudel, L., Sacks, F., Van Horn, L., Winston, M., & Wylie-Rosett, J. (2006). Diet and Lifestyle Recommendations Revision 2006: A Scientific Statement from the American Heart Association Nutrition Committee. Circulation, 114, Liu, R.H. (2003). Health Benefits of Fruit and Vegetables are From Additive and Synergistic Combinations of Phytochemicals. American Journal of Clinical Nutrition, 78(3), 517S-520S. Mahan, L.K. & Escott-Stump, S. (2008). Krause s Food & Nutrition Therapy. St. Louis, Missouri: Saunders Elsevier. McCullough, M.L., Feskanich, D., Stampfer, M.J., Giovannucci, E.L., Rimm, E.B., Hu, F.B., Speigelman, D., Hunter, D.J., Colditz, G.A., & Willett, W.C. (2002). Diet Quality and Major Chronic Disease Risk in Men and Women: Moving Toward Improved Dietary Guidance. The American Journal of Clinical Nutrition, 76, McCullough, M.L., Feskanich, D., Stampfer, M.J., Rosner, B.A., Hu, F.B., Hunter. D.J., Variyam, J.N., Colditz, G.A., & Willett, W.C. (2000). Adherence to the Dietary Guidelines for American and Risk of Major Chronic Disease in Men. American Journal of Clinical Nutrition, 72, McKeown, N.M., Troy, L.M., Jacques, P.F., Hoffmann, U., O Donnell, C.J., & Fox, C.S. (2010). Whole- and Refined-Grain Intakes are Differently 60
68 Associated with Abdominal Visceral and Subcutaneous Adiposity in Healthy Adults: the Framingham Heart Study. The American Journal of Clinical Nutrition, 92, Mellen, P.B., Walsh, T.F., & Herrington, D.M. (2007). Whole Grain Intake and Cardiovascular Disease: A Meta-Analysis. Nutrition, Metabolism, and Cardiovascular Disease, 18(4), Miller, P.E., Mitchell, D.C., Harala, P.L., Pettit, J.M., Smiciklas-Wright, H., & Hartman, T.J. (2010). Development and Evaluation of a Method for Calculating the Healthy Eating Index-2005 using the Nutrition Data System for Research. Public Health Nutrition, 14(2), Moshfegh, A.J., Rhodes, D.G., Baer, D.J., Murayi, T., Clemens, J.C., Rumpler, W.V., Paul, D.R., Sebastian, R.S., Kuczynski, K.J., Ingwersen, L.A., Staples, R.C., & Cleveland, L.E. (2008). The US Department of Agriculture Automated Multiple-Pass Method Reduces Bias in the Collection of Energy Intakes. The American Journal of Clinical Nutrition, 88(2), National Center for Health Statistics. NHANES Public Data General Release File Documentation. National Center for Health Statistics Web site. _doc.pdf. Accessed August 19, National Academy of Sciences. (1989). Diet and Health: Implications for Reducing Chronic Disease Risk. Nutrition Review, 47, Newby, P.K., Hu, F.B., Rimm, E.B., Smith-Warner, S.A., Feskanich, D., Sampson, L., & Willett, W.C. (2003) Reproducibility and Validity of the Diet Quality Index Revised as Assessed by use of a Food-Frequency Questionnaire. American Journal of Clinical Nutrition, 78, Ogden, C.L., Carroll, M.D., Kit, B.K., & Flegal, K.M. (2012). Prevalence of Obesity in the United States, NCHS Data Brief, No. 82. Patterson, R.E., Haines, P.S., & Popkin, B.M. (1994). Diet Quality Index: Capturing a multidimensional behavior. Journal of the American Dietetic Association, 59, S306. Pearson, T.A., Stone, E.J., Grundy, S.M., McBride, P.E., Van Hom, L., Tobin, B.W., & NAA Collaborative Group. (2001). Translation of Nutritional Sciences into Medical Education: The Nutrition Academic Award Program. The American Journal of Clinical Nutrition, 74,
69 Poslusna, K., Ruprich, J., de Vries, J.H.M., Jakubikova, M., & van t Veer, P. (2009). Misreporting of Energy and Micronutrient Intake Estimated by Food Records and 24 hour recalls, Control and Adjustment Methods in Practice. British Journal of Nutrition, 101, S73-S85. Reedy, J., Mitrou, P.N., Krebs-Smith, S.M., Wirfalt, E., & Flood, A. (2008). Index-Based Dietary Patterns and Risk of Colorectal Cancer. The NIH- AARP Diet and Health Study. Journal of American Epidemiology, 168, Segal-Isaacson, C.J., Wylie-Rosett,.J, & Gans, K.M. (2004). Validation of a Short Dietary Assessment Questionnaire: The Rapid Eating and Activity Assessment for Participants Short Version (REAP-S). The Diabetes Educator, 30, Snyder, D.C., Sloane, R., Haines, P.S., Miller, P., Clipp, E.C., Morey, M.C., Peiper, C., Cohen, H., & Demark-Wahnefried, W. (2007). The Diet Quality Index-Revised: A Tool to Promote and Evaluate Dietary Change among Older Cancer Survivors Enrolled in a Home-Based Intervention Trial. Journal of the American Dietetic Association, 107, The Food Guide Pyramid. (1992). Washington, DC: US Department of Agriculture, Iluman Nutrition Information Service; Home and Garden Bulletin No USDA Nutrition Insight 37. Diet Quality of Americans in and as Measured by the Healthy Eating Index Retrieved from US Dept. of Agriculture and 1990 Continuing Survey of Food Intakes by Individuals, Computer tapes, accession number PB and PB Agricultural Research Service, USDA, Washington, DC. US Health and Human Services and US Department of Agriculture. (2005). Dietary Guidelines for Americans th ed. Washington, DC: US Government Printing Office. Willett, W. (1990). Nutritional epidemiology: Implications of total energy intake for epidemiologic analysis (2nd ed.). New York, NY: Oxford University Press. Yates, A.A., Schlicker, S.A., & Suitor, C.W. (1998). Dietary Reference Intake: The New Basis for Recommendations for Calcium and Related Nutrients, 62
70 B Vitamins, and Choline. Journal of the American Dietetic Association, 98,
71 APPENDIX A CONSENT FORM 64
72 DIET ASSESSMENT Summer, 2001 Dear Participant: I am a Masters student in nutrition conducting a study for my thesis under the direction of Professor Carol Johnston in the School of Nutrition and Health Promotion. I am examining the validity of different diet recording techniques. I am requesting your participation, which will involve filling out a health history questionnaire and a diet assessment questionnaire. You will also be interviewed about your diet. If you say YES, then your participation will last for approximately 20 minutes at this location. Your participation in this study is voluntary. You can skip questions if you wish. If you choose not to participate or to withdraw from the study at any time, there will be no penalty. You must be years of age to participate. The main benefit of your participation in this study is to contribute to research that may identify new methods for assessing diet. There is no risk to you as a research participant. Your responses will be anonymous. Do not write your name on any of the attached questionnaires. The results of this study may be used in reports, presentation, or publications but your name will not be known. If you have any questions concerning the research study, please contact Dr. Carol Johnston ( ). If you have any questions about your rights as a participant in this study, you can contact the Chair of the Human Subjects Institutional Review Board, through the ASU Office of Research Integrity and Assurance, at (480) Return of the questionnaire will be considered your consent to participate. Thank you very much for your help in this study! Sincerely, Rachael Fawcett Graduate Student School of Nutrition and Health Promotion 65
73 APPENDIX B INCLUSION CRITERIA
74 Nutrient Supplementation and Health Parameters Verbal Script Subject #: Contact (Date, Time): Thank you for your interest in the Nutrient Supplementation and Health Parameters research study. Do you have time to answer 6 short questions to see if you qualify for the trial? How old are you? years How tall are you? inches How much do you weight? pounds 1. Do you currently smoke cigarettes? Yes or No a. If yes: How often? b. If a answered, ask: Approximately how many cigarettes do you smoke [refer to period of time that a was answered in]? c. If a and/or b answered, ask: Do you usually smoke with others in a social scene or alone? 2. Do you currently take vitamin and mineral supplements? a. If yes: Which supplements do you take? 3. Do you currently take any prescriptions? a. If yes: Which prescriptions do you take? 4. Are you currently seeing a doctor for a health condition? a. If yes: What condition are you being seen for? 5. Do you have any limitations regarding physical activity and exercise? 6. Do you participate in physical training consisting of vigorous exercise > than 4x per week. if any of the answers do not meet the requirements for the study, the individual will be excluded. If meets requirements: Based on this information, I would like to invite you to be a participant in a study. The study can take place right now and will take about 15 minutes. If does not meet requirements: Unfortunately, we will not be able to accept you into the study. We appreciate your interest and time. Have a great day! Thank you!
75 APPENDIX C REAP-S
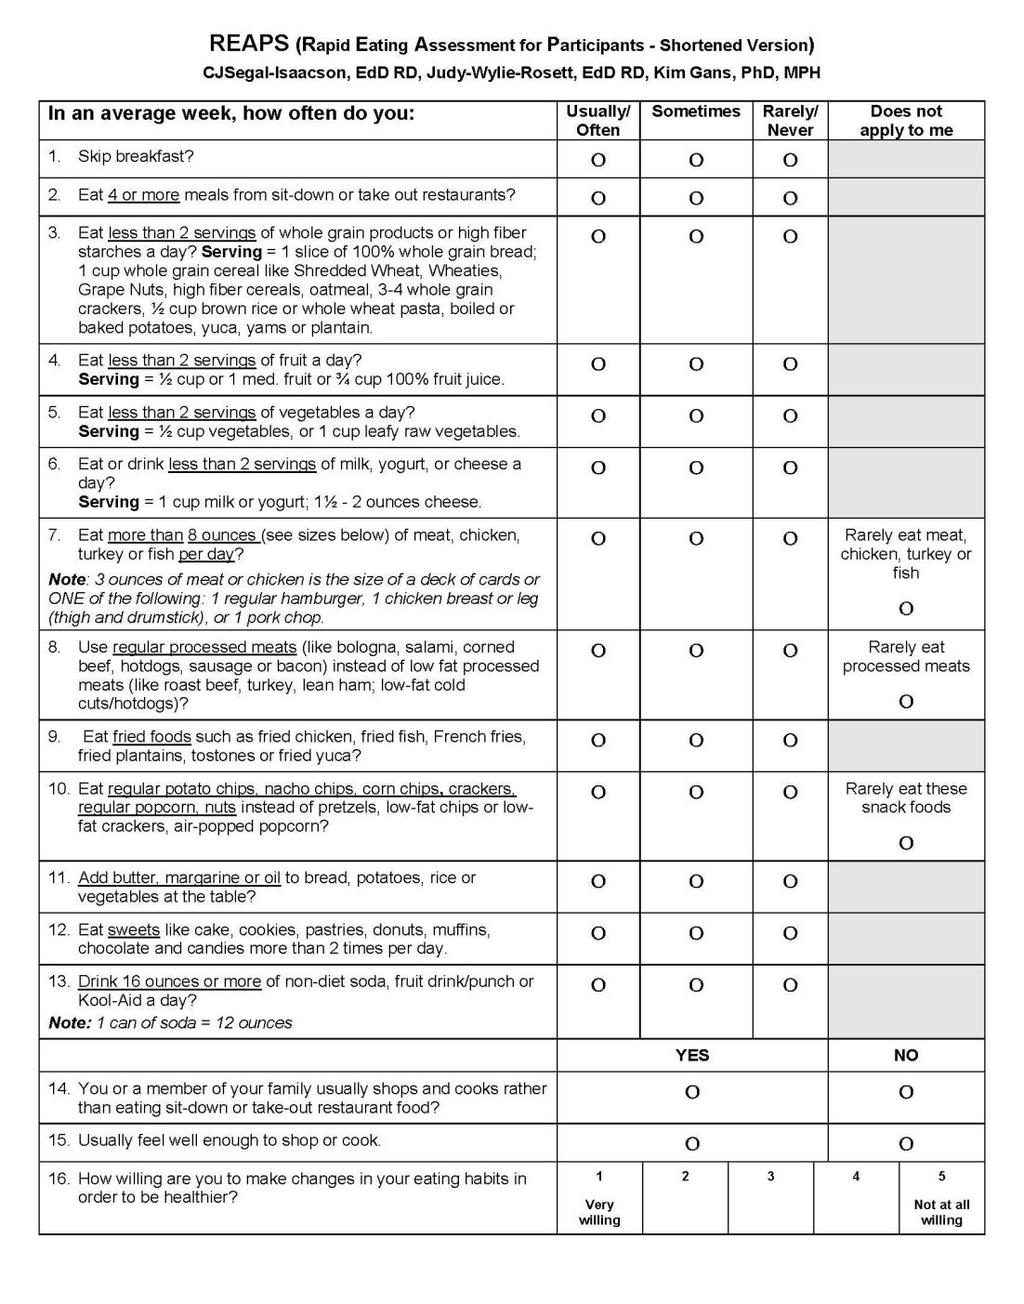
76
Dietary Fat Guidance from The Role of Lean Beef in Achieving Current Dietary Recommendations
 Dietary Fat Guidance from 1980-2006 The Role of Lean Beef in Achieving Current Dietary Recommendations Penny Kris-Etherton, Ph.D., R.D. Department of Nutritional Sciences Pennsylvania State University
USDA Food Patterns. Major points. What are the USDA Food Patterns? Update from the 2015 Dietary Guidelines Advisory Committee (DGAC) Report
 Report") Update from the 215 Dietary Guidelines Advisory Committee (DGAC) Report Trish Britten USDA/Center for Nutrition Policy and Promotion Major points Use of usual intake distributions in determining Food Pattern
Update from the 215 Dietary Guidelines Advisory Committee (DGAC) Report Trish Britten USDA/Center for Nutrition Policy and Promotion Major points Use of usual intake distributions in determining Food Pattern
Dietary Guidelines Executive Summary
 Page 1 of 7 2015-2020 Dietary Guidelines Executive Summary In this section: 1. The Guidelines 2. Key Recommendations Over the past century, deficiencies of essential nutrients have dramatically decreased,
CLASS 1: What You Eat
 CLASS4 UNIT 1: OUR CHOICES MATTER Adapted from Finding Solutions to Hunger: Kids Can Make a Difference by Stephanie Kempf Materials Needed Student Activity Handout: Classroom Narrative ACTIVITY: Keep a
Personal Touch Food Service will ensure all consumers have access to varied and nutritious foods consistent with promoting health and wellness.
 Nutrition Guidelines It is well accepted that consumer eating habits are greatly influenced by the types and quantities of foods made available to them. Personal Touch Food Service is committed to supporting
Analysis of Dietary Data Collected from Childcare Settings
 Analysis of Dietary Data Collected from Childcare Settings Beth Dixon, PhD, MPH Associate Professor Department of Nutrition, Food Studies and Public Health New York University Big Picture Questions What
Diet Analysis Assignment KNH 102 Sections B, C, D Spring 2011
 Diet Analysis Assignment KNH 102 Sections B, C, D Spring 2011 Name: Kathryn Davis 1. Collect the following demographic information from your client. Age 19 Sex Female Ethnicity White Vegetarian? Specify
This presentation was supported, in part, by the University of Utah, where Patricia Guenther has an adjunct appointment.
 1 Like the 2005 version, the Healthy Eating Index-2010 is a result of a collaboration among staff at the USDA Center for Nutrition Policy and Promotion and the National Cancer Institute. This presentation
DIETARY GUIDELINES FOR AMERICANS EIGHTH EDITION
 DIETARY GUIDELINES FOR AMERICANS 2015-2020 EIGHTH EDITION Executive Summary Over the past century, deficiencies of essential nutrients have dramatically decreased, many infectious diseases have been conquered,
MyPlate for Health and Nutritional Adequacy
 MyPlate for Health and Nutritional Adequacy By Joan Thompson, MS, PhD, RDN, CD Professor of Nutrition Department of Health Promotion and Human Performance Weber State University Why diet is the second
Patricia M. Guenther, PhD, RD Center for Nutrition Policy and Promotion US Department of Agriculture
 The Development and Evaluation of the Healthy Eating Index-2005 Patricia M. Guenther, PhD, RD Center for Nutrition Policy and Promotion US Department of Agriculture 1 Background Purpose HEI-2005 Overview
The Science of Nutrition, 4e (Thompson) Chapter 2 Designing a Healthful Diet
 Chapter 2 Designing a Healthful Diet") Science of Nutrition 4th Edition Thompson Test Bank Full Download: http://testbanklive.com/download/science-of-nutrition-4th-edition-thompson-test-bank/ The Science of Nutrition, 4e (Thompson) Chapter
Science of Nutrition 4th Edition Thompson Test Bank Full Download: http://testbanklive.com/download/science-of-nutrition-4th-edition-thompson-test-bank/ The Science of Nutrition, 4e (Thompson) Chapter
The Science of Nutrition, 3e (Thompson) Chapter 2 Designing a Healthful Diet
 Chapter 2 Designing a Healthful Diet") The Science of Nutrition, 3e (Thompson) Chapter 2 Designing a Healthful Diet 1) The four characteristics of a healthful diet are adequacy, balance, moderation, and: A) Calories. B) color. C) value. D)
The Science of Nutrition, 3e (Thompson) Chapter 2 Designing a Healthful Diet 1) The four characteristics of a healthful diet are adequacy, balance, moderation, and: A) Calories. B) color. C) value. D)
Following Dietary Guidelines
 LESSON 26 Following Dietary Guidelines Before You Read List some things you know and would like to know about recommended diet choices. What You ll Learn the different food groups in MyPyramid the Dietary
New Dietary Guidelines Will Help Americans Make Better. Food Choices, Live Healthier Lives
 U.S. Department of Health and Human Services New Dietary Guidelines Will Help Americans Make Better Food Choices, Live Healthier Lives January 12, 2005 Retrieved 01/18/05 from http://www.hhs.gov/news/press/2005pres/20050112.html
Dietary Guidelines for Americans 2005
 Dietary Guidelines for Americans 00 APPENDIX A. EATING PATTERNS Appendix A-1: The DASH Eating Plan at 1,600-,,000-,,600-, and,100-calorie Levels a The DASH eating plan is based on 1,600,,000,,600 and,100
Aligning Food Composition Tables with Current Dietary Guidance for Consumers
 Aligning Food Composition Tables with Current Dietary Guidance for Consumers Suzanne P. Murphy, PhD, RD Professor Emeritus Cancer Center of the University of Hawaii Dietary Guidance for Consumers Several
Chapter 2. Planning a Healthy Diet
 Chapter 2 Planning a Healthy Diet Principles and Guidelines Diet Planning Principles Adequacy Sufficient energy Adequate nutrients for healthy people Balance Enough but not too much kcalorie (energy) control
DIETARY GUIDELINES FOR AMERICANS, ,
 DIETARY GUIDELINES FOR AMERICANS, 2015-2020, AND THE STATE OF THE AMERICAN DIET Vanessa da Silva, PhD, RD Assistant Professor and Nutrition Specialist University of Arizona DIETARY GUIDELINES FOR AMERICANS
Nutrition And You. An Orange a Day
 Nutrition And You Anatomy of The Healthy Eating Pyramid Healthy Eating Pyramid s 9 Food Groups An Orange a Day Anatomy of the Healthy Eating Pyramid. Activity is represented as the foundation of this pyramid.
Diet Quality of Omnivores, Vegans and Vegetarians as. Measured by the Healthy Eating Index 2010 and
 Diet Quality of Omnivores, Vegans and Vegetarians as Measured by the Healthy Eating Index 2010 and the Rapid Eating and Activity Assessment for Participants Short Version by Courtney Bliss A Thesis Presented
Development and Evaluation of the Healthy Eating Index Technical Report
 Development and Evaluation of the Healthy Eating Index-2005 Technical Report Patricia M. Guenther, PhD, RD 1 Jill Reedy, PhD, RD 2 Susan M. Krebs-Smith, PhD, RD 2 Bryce B. Reeve, PhD 2 P. Peter Basiotis,
Dietary Guidelines for Americans 2005
 The DB Brown Research Chair on Obesity from Université Laval presents its Newsletter on Obesity: Dietary Guidelines for Americans 2005 The sixth edition of Dietary Guidelines for Americans was recently
Aim for a healthy weight. Be physically active each day.
 Diet Principles and Dietary these two items should be considered each time we make a choice of what goes into our mouth Guidelines Diet Planning 6 basic diet planning principles adequacy enough energy
Eat and Enjoy a Variety of Fruits and Vegetables on MyPlate
 Joanne Slavin, PhD., RD Professor University of Minnesota Eat and Enjoy a Variety of Fruits and Vegetables on MyPlate Academy of Nutrition & Dietetics DPG School Nutrition Services Webinar February 15,
Meal Menu Approximate Amount Eaten
 Meal Menu Approximate Amount Eaten Myself 16 Year Old Active Male Teen 3 Year Old Female Child ¼ cup 1 slice 70 Year Old Female Breakfast Special K Cereal(red berries) 1 cup 1 Banana (slices) ¼ cup ¾ cup
Tools for Healthy Eating
 Chapter 2 Tools for Healthy Eating Multiple Choice 1. Which of the following is not a key principle of healthy eating? A. availability B. balance C. variety D. moderation REF: 38 2. A diet consisting of
2010 Dietary Guidelines for Americans
 2010 Dietary Guidelines for Americans Mary M. McGrane, PhD Center for Nutrition Policy and Promotion February 25, 2015 Agenda for Commodity Supplemental Food Program (CSFP) Brief history and description
Full file at Designing a Healthful Diet
 THOM.4427.cp02.p008-012_vpdf 10/26/06 7:09 PM Page 8 Chapter 2 Designing a Healthful Diet Chapter Summary A healthful diet provides the proper combination of energy and nutrients and has four characteristics:
Chapter 02 Tools of a Healthy Diet
 Chapter 02 Tools of a Healthy Diet Multiple Choice Questions 1. Which is true about the Dietary Reference Intakes (DRIs)? A. They apply to people in Canada and the U.S. B. They differ by age group. C.
Exploring the Evidence on Dietary Patterns: The Interplay of What We Eat and Health
 NUTRI-BITES Webinar Series Exploring the Evidence on Dietary Patterns: The Interplay of What We Eat and Health January 25, 2018 Presenter: Kellie O. Casavale, PhD, RD Nutrition Advisor, Division of Prevention
You Bet Your Weight. Karah Mechlowitz
 You Bet Your Weight Karah Mechlowitz What to Expect for Today n Introduction to macronutrients n Breakdown of each macronutrient n Ways to track macronutrients n Wrap up What are the macronutrients? Carbohydrates
Dietary intake patterns in older adults. Katherine L Tucker Northeastern University
 Dietary intake patterns in older adults Katherine L Tucker Northeastern University Changes in dietary needs with aging Lower energy requirement Less efficient absorption and utilization of many nutrients
Test Bank For Williams' Essentials of Nutrition and Diet Therapy 10th edittion by Schlenker and Roth
 Test Bank For Williams' Essentials of Nutrition and Diet Therapy 10th edittion by Schlenker and Roth Chapter 01: Nutrition and Health Test Bank MULTIPLE CHOICE 1. The major focus of nutritional recommendations
Name Unit # Period Score 159 points possible Dietary Guidelines, Food Pyramid and Nutrients Test
 Name Unit # Period Score 159 points possible Dietary Guidelines, Food Pyramid and Nutrients Test 1. List the ten dietary guidelines recommended for Americans. (10) a. b. c. d. e. f. g. h. i. j. Multiple
Chapter 2. Tools for Designing a Healthy Diet
 Chapter 2 Tools for Designing a Healthy Diet Fig. 2.p035 Philosophy That Works Consume a variety of foods balanced by a moderate intake of each food Variety choose different foods Balanced do not overeat
The Food Guide Pyramid
 The Food Guide Pyramid In this lesson, you will Learn About n What influences a person s food choices. n How to use the Food Guide Pyramid to make healthful food choices. The Foods You Choose The foods
Six Nutrients. Nutrients: substances in food that your body needs to stay healthy. Carbohydrates Protein Fat Minerals Vitamins Water
 Nutrients Six Nutrients Nutrients: substances in food that your body needs to stay healthy Carbohydrates Protein Fat Minerals Vitamins Water Water Function: most essential nutrient Helps digest and absorb
Topic 12-2 Making Daily Food Choices
 Topic 12-2 Making Daily Food Choices In this topic, you will learn how to choose foods that will supply nutrients, as well as Influences on food choices MyPyramid The Dietary Guidelines for Americans Making
Student Book. Grains: 5 10 ounces a day (at least half whole grains) Self-Check
 Self-Check") ETR Associates Middle School I read and followed directions. My work is neat and complete. This is my best work. HealthSmart Actions Lesson at a Glance Student Book The HealthSmart Actions student book
ETR Associates Middle School I read and followed directions. My work is neat and complete. This is my best work. HealthSmart Actions Lesson at a Glance Student Book The HealthSmart Actions student book
Essential Standard. 8.NPA.1 Apply tools (Body Mass Index, Dietary Guidelines) to plan healthy nutrition and fitness.
 to plan healthy nutrition and fitness.") Essential Standard 8.NPA.1 Apply tools (Body Mass Index, Dietary Guidelines) to plan healthy nutrition and fitness. 8.NPA.1.3 Implement meal plans that are consistent with Dietary Guidelines. Warm Up Without
Essential Standard 8.NPA.1 Apply tools (Body Mass Index, Dietary Guidelines) to plan healthy nutrition and fitness. 8.NPA.1.3 Implement meal plans that are consistent with Dietary Guidelines. Warm Up Without
Dietary Guidelines for Americans & Planning a Healthy Diet. Lesson Objectives. Dietary Guidelines for Americans, 2010
 Dietary Guidelines for Americans & Planning a Healthy Diet NUTR 2050 NUTRITION FOR NURSING PROFESSIONALS MRS. DEBORAH A. HUTCHEON, MS, RD, LD Lesson Objectives At the end of the lesson, the student will
Healthy carbohydrates: Challenges in dietary guidance. Joanne Slavin Professor Department of Food Science and Nutrition October 26, 2015
 Healthy carbohydrates: Challenges in dietary guidance Joanne Slavin Professor Department of Food Science and Nutrition October 26, 2015 From the Science to Me The Science Policy Me There is no perfect
JIGSAW READING CARBOHYDRATES
 Date: CARBOHYDRATES Carbohydrates provide an important source of energy for our bodies. There are two types of carbohydrates: Sugars are found in foods which taste sweet like candies, jams and desserts.
Nutrition for Health. Nutrients. Before You Read
 CHAPTER 10 LESSON 2 Nutrition for Health Nutrients BIG Idea Each nutrient in your diet plays a unique and essential role in keeping you healthy. Before You Read Sometimes figuring out what to eat can be
2012 California Title III-C Menu Planning Guidance Attachment 1 of PM 12-17(P) The overarching differences between the 2010 and 2005 DGAs include:
 The overarching differences between the 2010 and 2005 DGAs include:") Purpose This Guidance provides an overview of the updated Dietary Guidelines for Americans, 2010 (DGAs) and offers information on the application of the DGAs specifically for California s older adult population
Purpose This Guidance provides an overview of the updated Dietary Guidelines for Americans, 2010 (DGAs) and offers information on the application of the DGAs specifically for California s older adult population
Databases for Characterizing Foods in the As Eaten Form
 Databases for Characterizing Foods in the As Eaten Form Elizabeth Condon, M.S., R.D. 36th National Nutrient Databank Conference March 27, 2012 Key Issues Most databases designed for assessing dietary intake
The Six Essential Nutrient Groups:
 The Six Essential Nutrient Groups: Water: Water transports other nutrients to cells, carries wastes away, aids digestion and more. It makes up more than half your weight. SOURCES: water; juices and
Part I: Summary of New Regulations on Nutrition for Group Child Care Services
 NEW YORK CITY DEPARTMENT OF HEALTH AND MENTAL HYGIENE Part I: Summary of New Regulations on Nutrition for Group Child Care Services Effective Date: January 1, 2007 Effective January 1, 2007, Article 47
Nutrition Tips to Manage Your Diabetes
 PATIENT EDUCATION patienteducation.osumc.edu As part of your diabetes treatment plan, it is important to eat healthy, stay active and maintain a healthy body weight. This can help keep your blood sugar
Study of how your body takes in and uses food
 Chapter 10 Lesson 1 Study of how your body takes in and uses food Nutrients substances in food that your body needs to grow, repair, and supply energy Calorie unit of heat used to measure the energy your
NUTRITION: THE STUDY OF HOW THE BODY UTILIZES THE FOOD WE EAT
 NUTRITION: THE STUDY OF HOW THE BODY UTILIZES THE FOOD WE EAT NUTRIENT: a chemical found in food that is needed for life and growth, & the building blocks to make your body function correctly! WHAT DO
3/9/2011. I. Main nutritional requirements. WARM-UP (GRAB A SHEET ON YOUR WAY IN) TERMS STUDENT LEARNING OBJECTIVES OBJECTIVE 1
 TERMS STUDENT LEARNING OBJECTIVES OBJECTIVE 1") (GRAB A SHEET ON YOUR WAY IN) What 7 things make up your favorite salad? (if you don t like salad pick 7 things anyway) What food group do each of them fall under? (the food groups are Grains, Vegetables,
(GRAB A SHEET ON YOUR WAY IN) What 7 things make up your favorite salad? (if you don t like salad pick 7 things anyway) What food group do each of them fall under? (the food groups are Grains, Vegetables,
Live the Mediterranean Lifestyle with Barilla. The Mediterranean Nutrition Model
 Live the Mediterranean Lifestyle with Barilla The Mediterranean Nutrition Model Whole Grains Legumes Live the Mediterranean Lifestyle with Barilla Table of Contents: MEDITERRANEAN NUTRITION MODEL Health
CHFFF Lesson 1 What are some examples of sweetened drinks? CHFFF Lesson 1 Why are 100% fruit juice and flavored milk the only slow drinks?
 CHFFF Lesson 1 What are some examples of sweetened drinks? CHFFF Lesson 1 Why are 100% fruit juice and flavored milk the only slow drinks? CHFFF Lesson 1 What are some concerns about diet drinks? CHFFF
What are the patterns of dietary intake across the lifespan and the opportunities to support healthy aging?
 What are the patterns of dietary intake across the lifespan and the opportunities to support healthy aging? Eve Stoody, PhD Lead Nutritionist U.S. DEPARTMENT OF AGRICULTURE CENTER FOR NUTRITION POLICY
Dietary Guidelines for Americans
 2015-2020 Dietary Guidelines for Americans for Americans. Available at DietaryGuidelines.gov. 1 Presentation Objectives Introduce the 2015-2020 Dietary Guidelines for Americans Highlight the Key Elements
Appendix G. U.S. Nutrition Recommendations and Guidelines. Dietary Guidelines for Americans, Balancing Calories to Manage Weight
 Appendix G U.S. Nutrition Recommendations and Guidelines Dietary Guidelines for Americans, 2010 Balancing Calories to Manage Weight Prevent and/or reduce overweight and obesity through improved eating
Delivering the Diet Information Your Patient Needs. April 6, 2019 Lynda Hesse RD
 Delivering the Diet Information Your Patient Needs April 6, 2019 Lynda Hesse RD Dietary Assessment Tools Dietary assessment help clinicians formulate an individualized treatment plan for patients Self
HEALTHY EATING. What you need to know for a long and healthy life. March National Nutrition Month
 HEALTHY EATING What you need to know for a long and healthy life March National Nutrition Month 890246 This presentation is for informational purposes only. Material within this presentation should not
Youth4Health Project. Student Food Knowledge Survey
 Youth4Health Project Student Food Knowledge Survey Student ID Date Instructions: Please mark your response. 1. Are you a boy or girl? Boy Girl 2. What is your race? Caucasian (White) African American Hispanic
Nutrition for Rehab Patients
 Nutrition for Rehab Patients Michelle Ray, RD Michelle Ray, RD Michelle Ray MS, RD, LDN Making healthcare remarkable Why is nutrition important for our patients? Adequate nutrition protects quality of
Food Choices. Food Choices. Food Choices. Food Choices. Food Choices. Introduction to Nutrition ALH 1000 Chapter 1 & 2
 Introduction to Nutrition ALH 1000 Chapter 1 & 2 An Overview Of Nutrition And Planning A Healthy Diet Instructor Bonnie Bennett-Campbell, RN MSN Food and Nutrition Play a Significant Role in Life An Individual
Nutrition Basics. Chapter McGraw-Hill Higher Education. All rights reserved.
 Nutrition Basics Chapter 12 1 The Body s Nutritional Requirements Essential nutrients The Six Essential Nutrients: Proteins, Fats, Carbohydrates, Vitamins, Minerals, Water Defined as : Nutrients one must
Coach on Call. Thank you for your interest in understanding the new Nutrition Facts labels. I hope you find this tip sheet helpful.
 Coach on Call It was great to talk with you. Thank you for your interest in understanding the new labels. I hope you find this tip sheet helpful. Please give me a call if you have more questions about
Beverage Guidelines: 1 up to 3 Years
 Beverage Guidelines: nutritionally-equivalent nondairy beverages like soy, rice, or lactose-free milks with medical permission). nutritionally-equivalent nondairy beverages like soy, rice, or lactose-free
Chapter 3: Macronutrients. Section 3.1 Pages 52-55
 Chapter 3: Macronutrients Section 3.1 Pages 52-55 Diet Terms Nutrients The substances in food that gives us structural materials and energy. Macronutrients Nutrients that are required in large amounts.
Nutrition - What Should We Eat?
 Nutrition - What Should We Eat? Adapted from the 2010 USDA Dietary Guidelines for Americans www.choosemyplate.gov Nutrition - What Should We Eat? Adapted from the 2010 USDA Dietary Guidelines for Americans
Food Labels Reading Between the Lines
 Food Labels Reading Between the Lines Trying to put the right nutrients into the body is a difficult task in today s consumer environment. It requires knowledge of the body s daily needs in addition to
UNDERSTANDING AND USING MYPLATE* *Includes a section on how Food Processor integrates MyPlate recommendations and visuals.
 UNDERSTANDING AND USING MYPLATE* *Includes a section on how Food Processor integrates MyPlate recommendations and visuals. an ebook from ESHA Research 2 TABLE OF CONTENTS MyPlate: A Visual Tool...3 MyPlate
History of the. Food Guide Systems
 History of the Food Guide Systems 1940 A guide to good eating, the basic 7 Focus on nutritional adequacy, specific servings from each food group 1956-1970 Food For Fitness: Daily Food Guide Basic 4 1979
Nutrition Tools Standards and Guidelines. Chapter 2
 Nutrition Tools Standards and Guidelines Chapter 2 Introduction Eating well is easy in theory Just choose a selection of foods that supplies appropriate amounts of the essential nutrients, fiber, phytochemicals,
Chapter Why do we eat & Nutrition and Nutrients
 Chapter 15.1 Why do we eat & Nutrition and Nutrients Why do we eat? Physical Needs: Nutrients chemicals found in food, the body needs to function properly. Nutrition study of foods and the way your body
Foundations of Personal Fitness. Chapter 4 Nutrition and Your Personal Fitness
 Foundations of Personal Fitness Chapter 4 Nutrition and Your Personal Fitness Lesson 1: The Importance of Nutrition Healthful Eating Taking in the proper amount of nutrients each day Nutrients substances
West Oak Lane Charter School
 West Oak Lane Charter School Meal Patterns and 21- Day Breakfast and Lunch Menus The meal patterns and dietary specifications of the Final Nutrition standards must be met. Meal Pattern Chart (Adapted for
Lecture 3. Nutrition
 Lecture 3 Nutrition, Part 1 1 Nutrition 1.Macronutrients a. Water b. Carbohydrates c. Proteins d. Fats 2.Micronutrients a. Minerals b. Vitamins 2 1 Why is Nutrition Important? Your food choices each day
Facts that you need to know
 NUTRITION This article explores the basic concepts of nutrition and provides useful tips on healthy diet My neighbor walks up to me asking whether I am aware of the nutritional value of a new food product
STAYING HEART HEALTHY PAVAN PATEL, MD CONSULTANT CARDIOLOGIST FLORIDA HEART GROUP
 STAYING HEART HEALTHY PAVAN PATEL, MD CONSULTANT CARDIOLOGIST FLORIDA HEART GROUP What is Heart Disease Cardiovascular Disease (CVD): Heart or Blood vessels are not working properly. Most common reason
The place of plant-based eating in dietary guidelines The Eatwell Guide and beyond
 The place of plant-based eating in dietary guidelines The Eatwell Guide and beyond Ayela Spiro Senior Nutrition Scientist Nutrition Science Manager The Moment for Plant based eating is Now University of
The science of foods and the nutrients and other substances they contain and of their actions within the body
 HLTH 1050 Week 1 The science of foods and the nutrients and other substances they contain and of their actions within the body Including ingestion, digestion, absorption, transport, metabolism and excretion.
Basic Nutrition. The Basics of Nutrition. The Six Basic Nutrients. calories. How it Works. How it works 10/5/16
 Basic Nutrition The Basics of Nutrition Nutrition: The study of how your body uses the food that you eat Nutrient: a chemical substance in food that helps maintain the body The Six Basic Nutrients Carbohydrates
Principles of the DASH Diet
 DASH Diet Lower your blood pressure by changing your eating habits. The DASH diet is based on findings from the "Dietary Approaches to Stop Hypertension" clinical study that found that high blood pressure
Lecture 4 Nutrition Part 2 Nutrition 1. Healthy Diet 2. Sugar 3. Consumer Concerns
 Lecture 4 Nutrition Part 2 1 Nutrition 1. Healthy Diet 2. Sugar 3. Consumer Concerns 2 1 Healthy Diet! 3 Four basic behaviors that constitute a "healthy lifestyle" 1. A good diet, 2. Moderate Exercise,
FINAL EXAM. Review Food Guide Material and Compose/Complete Nutrition Assignment. Orange Green Red Yellow Blue Purple
 NUTRITION ASSIGNMENT-11 th Grade Physical Education FINAL EXAM Review Food Guide Material and Compose/Complete Nutrition Assignment Dietary Guidelines (The Food Guide Pyramid) Orange Green Red Yellow Blue
Essential Nutrients. Lesson. By Carone Fitness. There are six essential nutrients that your body needs to stay healthy.
 Lesson Essential Nutrients By Carone Fitness 6 There are six essential nutrients that your body needs to stay healthy. 1. Water 2. Vitamins 3. Minerals 4. Carbohydrates 5. Protein 6. Fat 1 6 Of these six
eat well, live well: EATING WELL FOR YOUR HEALTH
 eat well, live well: EATING WELL FOR YOUR HEALTH It may seem like information on diet changes daily, BUT THERE IS ACTUALLY A LOT WE KNOW ABOUT HOW TO EAT WELL. Eating well can help you improve your overall
Nutrition and Health Info Sheet: Dietary Guidelines for Americans,
 Nutrition and Health Info Sheet: Dietary Guidelines for Americans, 2015-2020 For Health Professionals Produced by: Ashley A. Thiede Krista Neary, B.A. Sheri Zidenberg-Cherr, PhD Center for Nutrition in
4 Nutrient Intakes and Dietary Sources: Micronutrients
 Nutrient Intakes and Dietary Sources: Micronutrients New Zealanders obtain the energy and nutrients they require from a wide variety of foods and beverages, and in some cases from dietary supplements as
Warm up # 76. What do you think the difference is between fruits and vegetables? Warm up # 77
 Warm up # 76 What do you think the difference is between fruits and vegetables? Warm up # 77 Which of these are vegetables and which of these are fruits? Apples Tomatoes Onions Pumpkin Lettuce Broccoli
How Does Citrus Fit? The 2010 Dietary Guidelines for Americans:
 The 2010 Dietary Guidelines for Americans: How Does Citrus Fit? Gail C. Rampersaud, MS, RD, LDN Associate in Nutrition Research and Education Food Science and Human Nutrition Department IFAS, University
Ready, Set, Start Counting!
 Ready, Set, Start Counting! Carbohydrate Counting a Tool to Help Manage Your Blood Glucose When you have diabetes, keeping your blood glucose in a healthy range can help you feel your best today and in
Lesson 1 Carbohydrates, Fats & Proteins pages
 Lesson 1 Carbohydrates, Fats & Proteins pages 190-201 What are the 3 classes of nutrients that supply your body with energy and how does the body obtain the energy from foods? Describe the roles that carbohydrates,
Nutrients. The food you eat is a source of nutrients. Nutrients are defined as the substances found in food that keep your body functioning.
 Nutrients The food you eat is a source of nutrients. Nutrients are defined as the substances found in food that keep your body functioning. Your body needs nutrients to Provide energy. Build and repair
Tour de Health and Nutrition Facts
 Module 4 Tour de Health and Nutrition Facts Eat Well & Keep Moving From L.W.Y Cheung, H. Dart, S. Kalin, B. Otis, and S.L. Gortmaker, 2016, Eat Well & Keep Moving, 3rd ed. (Champaign, IL: Human Kinetics).
Chapter 5. Building Healthy Eating Patterns
 Chapter 5 Building Healthy Eating Patterns Individuals and families can incorporate the recommendations presented in each of the previous chapters into an overall healthy way to eat a healthy eating pattern.
Eastern Michigan University. Bonnie Farmer. Master's Theses, and Doctoral Dissertations, and Graduate Capstone Projects
 Eastern Michigan University DigitalCommons@EMU Master's Theses and Doctoral Dissertations Master's Theses, and Doctoral Dissertations, and Graduate Capstone Projects 2009 Comparison of nutrient intakes
Dietary Guidelines for Americans :
 Dietary Guidelines for Americans 2015-2020: What Are The Guidelines and Their Scientific Basis, When and Why Do They Change, and How Do They Affect Public Health? Jennifer Seymour, PhD Senior Policy Advisor,
A common sense approach to taking control of your diet
 Welcome Wellness Warriors! Carbohydrate Counting: A common sense approach to taking control of your diet Today we will discuss The different food groups and how they affect blood sugar Which foods increase
Choosing Healthful Foods
 LESSON 25 Choosing Healthful Foods Before You Read List some of the healthful foods you eat. What makes these foods healthful choices? What You ll Learn the functions and sources of proteins, carbohydrates,