Soluble phospho-tau from Alzheimer's disease hippocampus drives. Elisabeth Sanchez-Mejias1,4*, Victoria Navarro2,3,4*, Sebastian Jimenez2,3,4,
|
|
|
- Camron Thompson
- 6 years ago
- Views:
Transcription
1 Soluble phospho-tau from Alzheimer's disease hippocampus drives microglial degeneration Elisabeth Sanchez-Mejias,, Victoria Navarro,,, Sebastian Jimenez,,, Maria Sanchez-Mico,,, Raquel Sanchez-Varo,, Cristina Nuñez-Diaz,, Laura Trujillo-Estrada,, Jose Carlos Davila,, Marisa Vizuete,,, Antonia Gutierrez, and Javier Vitorica,, -Dept. Biologia Celular, Genetica y Fisiologia. Facultad de Ciencias, Universidad de Malaga, 97 Spain -Departamento Bioquímica y Biología Molecular, Facultad de Farmacia, Universidad de Sevilla, Spain. -Instituto de Biomedicina de Sevilla (IBiS)-Hospital Universitario Virgen del Rocío/CSIC/Universidad de Sevilla, Spain. -Centro de Investigación Biomédica en Red sobre Enfermedades Neurodegenerativas (CIBERNED), Madrid, Spain. These authors contributed equally in this work Co-Senior corresponding author Corresponding authors Javier Vitorica Dept. Bioquimica y Biologia Molecular Facultad de Farmacia. Universidad de Sevilla Instituto de Biomedicina de Sevilla (IBiS)-Hospital Universitario Virgen del Rocío/CSIC/Universidad de Sevilla, Spain C/ Prof. Garcia Gonzalez, Sevilla, Spain Telephone:
2 Antonia Gutierrez Dept. Biologia Celular, Genetica y Fisiologia. Facultad de Ciencias, Universidad de Malaga, Spain Telephone: agutierrez@uma.es
3 Supplemental Table. Human and murine Taqman probes used for qpcr Probes Murine Human c/ebpa Hs6997_m Pu. Hs7867_m Iba Mm7986_g Hs69_g CDb Mm55_m Hs55885_m CD5 Mm9577_m Hs897_m CD68 Mm7_m Hs8686_g TREM Mm9_g Hs9_m CD Hs768_m Prx Hs6_m CCR Mm87_m Hs77_s CxCr Mm6_s Hs958_s Pry Mm955_s Hs88698_m GAPDH Mm _g Hs9997_g Beta-actin Mm6958_g Hs999999_m
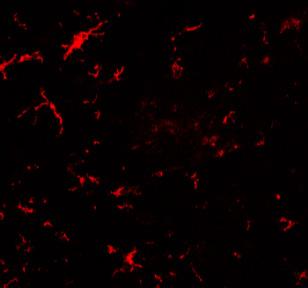
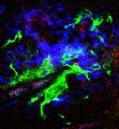
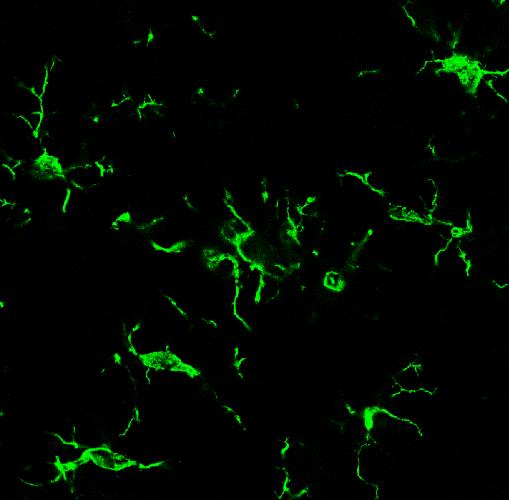
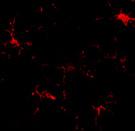
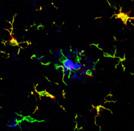
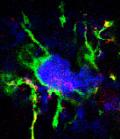
4 Supplemental Figures Supplemental Figure. Microglial activation and pathological characterization of, III-IV and V-VI hippocampus. a) The expression of microglial markers Pu. (a) and c/ebpa (a) was determined by qpcr. The expression of these two markers was increased significantly (Kruskal-Wallis and Dunn post-hoc test, see figure) only in Braak V- VI cases, as compared with Braak or samples. All affected microglial markers showed significant linear correlations using tau-kendall (a-6), corroborating the existence of microglial activation and the implication of a single cell population. b-c) Neuropathological characterization of phospho-tau and Abeta in human hippocampal samples using immunohistochemistry with AT8 (b-6) or G8 (c-6) antibodies. Phospho-tau accumulation was clearly observed in I-IV samples, mainly in CA field (b5) and in both CA (b6) and dentate gyrus (b) in stages. The Abeta plaques affected the CA region and molecular layer of dentate gyrus in I-IV cases (c and c5), however the hilar region was only affected in individuals (c and c6). Alv, alveus; g, granular layer; h, hilus; m, molecular layer; so, stratum oriens; slm, stratum lacunosum-moleculare; sp, stratum pyramidale; sr, stratum radiatum. Scale bars: b-b6 and c-c6, mm. Supplemental Figure. The expression of Pry was reduced in activated microglial cells. a) The co-localization (a and a6) between Iba (a and a) and Pry (a and a5) microglial specific markers was assessed by laser confocal microscopy in samples. Co-localization (a and a6, arrows) between both markers was clearly observed in microglial cells not in direct contact with Abeta plaques (visualized in blue colour). The boxed regions, at higher magnification in insets, showed activated Iba positive and Pry negative microglial cells, closely associated with Abeta plaques (in blue). Furthermore, ex vivo experiments, using isolated adult mice microglia, indicated that the Pry expression was slightly reduced after LPS activation (.5 ±. vs.65 ±.5 relative units for PBS or LPS respectively, n=, two-tailed t-test, t=.8,
5 p=.75). Thus, the expression of Pry receptor was down-regulated after microglial activation g, granular layer. Scale bars: a-a6, 5 µm (insets in a and a6, µm) Supplemental Fig. Microglial response in Abeta (APP/PS) and tau (Thytau) transgenic models. a) APP/PS model displayed a strong age-dependent accumulation of Abetaplaques (a; -month-old mice) and total Abeta (a, representative westernblot using 6E+8E) in the hippocampal formation. This Abeta accumulation was associated with a clear microglial activation. Representative images showing Iba (a, panoramic image; a, high magnification) or CD5 (a5, panoramic image; a6, high magnification) immunostained microglial cells from -month-old mice. The microglial activation was also assessed by determining (qpcr) the expression (a7) of microglial markers (ANOVA and Tukey post hoc test; p<.5). Data (n=5 animals per age) were normalized using 9-month-old WT mice (n=5; not shown) and are mean ± S.D. Quantitative Iba-load determinations at the hilar region (a8), from 6- or -month-old mice, also demonstrated the existence of a significant (ANOVA and Tukey post hoc test; p<.5; n=5/age and genotype) increase in the area covered by Iba- positive cells, as compared with age-matched WT mice. b) Thy-tau transgenic model presented an age-dependent phospho-tau accumulation principally in the CA region, determined by AT8 immunohistochemistry (b) or western-blots (b). This phospho-tau accumulation produced an attenuated microglial response as probed by Iba immunostaining, from -6-month-old WT (b) and Thy-tau (b) mice. Microglial activation was also assessed by qpcr (b5). Only the expression of CD5, CD68 and TREM was slightly but significantly increased (ANOVA and Tukey post hoc test; p<.5). Data (n=5 animals per age) were normalized using 9-month-old WT mice (n=5; not shown) and are mean ± S.D. Quantitative analysis of the microglial domain (b6) demonstrated the existence of a significant decrease (Mann-Whitney U test; p=.; WT n= 75 or Thytau n= cells from or different animals, respectively) in the area covered by the individual microglia cells in aged (-6-month-old) Thy-tau. DG, dentate gyrus; CA- hippocampal subfields. Asterisks indicate amyloid
6 plaques. Scale bars: a, a and a5, 5μm; a and a6, μm; b, μm; b and b, μm Supplemental Figure. Preparation and characterization of the S soluble fractions from, III-IV and V-VI hippocampus. a) Hippocampal samples were fractionated into: S, soluble fraction containing extracellular/cytosolic proteins; S, intracellular vesiculated fraction; S, aggregated proteins, releasable by SDS treatment and P, highly-aggregated proteins, only releasable by SDS-Urea. The presence of phospho-tau species was analyzed by western blots using AT (a) or AT8 (not shown). As expected, I-IV and samples showed a prominent phosphotau accumulation (AT positive tau in the SDS releasable pool (S). This is consistent with the presence of aggregated and phosphorylated tau protein, forming intracellular tangles. We also observed a clear accumulation of AT positive tau protein in the S soluble fraction (extracellular and/or cytosolic) from samples. Total tau in the soluble S fractions was assessed by sandwich ELISA (a). b) Soluble Abeta present in S fractions was quantitatively analyzed by ELISA (b) or dot-blots (b-) using the OC antibody. Supplemental Figure 5. Sarkosyl-insoluble phospho-tau was not toxic for microglial cells and astrocytes were resistant to soluble phospho-tau. a) Representative AT8 western blot of sarkosyl-soluble and sarkosyl-insoluble tau, isolated from two different and samples (a). The toxicity on BV cells of the sarkosyl-insoluble phospho-tau was then tested by Flow Cytometry (a). Although we have assessed three different doses (., and μl of sarkosyl-insluble tau/ μl culture media; equivalent to ten to a hundred times higher dose than S), we did not detect any toxic effect on BV cells (a). Data are mean ± SD of three independent experiments. b) Toxicity (using flow cytometry, b) of S fractions isolated from Braak,, Braak III-IV and samples was also assessed using the astrocytic cell line WJE. As shown (b), no toxicity was observed in any case. Data are mean ± S.D. of three independent experiments.
7 Supplemental Figure 6. Characterization and toxicity of the S soluble fractions prepared from APP/PS and Thy-tau tansgenic models and SH-SY5Y-tau transfected cells. a) S fractions, isolated from APP/PS mice, accumulated oligomeric soluble Abeta (detected by dot-blots using OC, a). S fractions isolated from agematched WT or Thy-tau mice (see below) were used as negative controls. a) Quantitative analysis of BV cell toxicity after treatment with 6- or 8-monthold APP/PS-derived S fractions showing percentage of viable, early apoptotic cell (Annexin V positive) or late apoptotic cells (Annexin V and PI positive cells). Data are mean ± S.D. of three different experiments. b) S fractions isolated from Thy-tau models. The phospho-tau (b, upper panel) or total tau content (b, middle panel) in these fractions was assessed by western blots using AT8 or Tau6 antibodies. As shown, there was an age-dependent increase in the soluble AT8-positive phosho-tau in the S fractions. (b) Quantitative analysis of BV cell viability after treatment with -, 9- or -monthold Thy-tau-derived S fractions. Percentage of viable, early apoptotic cell (Annexin V positive) or late apoptotic cells (Annexin V and PI positive cells) was indicated in the figure. Only S fractions derived from -month-old Thy-tau presented toxicity at the dose used (.μl/μl culture media). Data are mean ± S.D. of three different experiments. c) The presence of soluble phospho-tau in transfected SH-tau cells was also assessed. For these experiments, the cells were disrupted by sonication and the soluble and insoluble fractions isolated by centrifugation at,xg ( min at ºC). Total proteins were isolated using Laemmli-dissociation buffer. As shown, most tau forms (either phosphorylated, AT8-positive, or total, Tau6-positive) were isolated in the soluble fraction. This experiment was repeated twice with similar results.


8 a Relative Units Relative Units a Pu Kruscal-Wallis = p=. Braak I-IV a Cebpa Kruscal-Wallis =.77 p =.7 p<.5 p<.5 CD68 Cebpa 6 5 CD5 vs CD68 Braak I-IV τ =.6 p=. 5 6 CD5 a a CD5 vs Cebpa Braak I-IV PU. Cebpa a5 a5 Braak I-IV CD5 vs Pu. Braak τ=.9 I-IV p=, 5 6 CD5 a6 Pu.-Cebpa Braak I-IV τ =.67 p=. 5 6 CD5 b I-IV τ=.88 p=. Pu DG CA C b b h gm alv so sp sr slm b b5 h g m I-IV alv so sp sr slm b b6 h gm alv so sp sr slm DG CA c h gm al so v sp sr c c c5 c6 slm h g m alv so sp sr c h gm alv so sp sr Supplemental Fig.


9 a Iba- Pry Merge a a a Iba- Pry Merge a a5 a6 Supplemental Fig.


 8 6")


=6.57 p=.")


10 a Abeta a Iba a CD5 CA DG CA DG CA DG a Iba a CD5 M APP/PS 9M M a7 mrna expression (relative units) Iba-positive Iba-positive area (%) 8 6 a CDb M 9 M M WT APP/PS Tukey p<.5 PS-APP APP/PS Hippocampus Iba CD5 Iba-load Iba-load Hilus Hilus ANOVA F(,)=6.57 p=. CD68 CXCR Pry TREM Tukey p<.5 b a5 a6 6 Age (months) AT8 Iba Iba CA DG b b b b Tau WT M 9M M AT8 Tau6 b5 mrna expression (relative units) 8 6 CDb M 9 M M Thy-Tau Hippocampus Iba CD5 CD68 CXCR Pry TREM b6 Microglial domain (μm/cell) Microglial domain p=. WT Thy-Tau Supplemental Fig.


 =7. p=.")
11 a AT a I-IV S S S P S S S P S S S P a 5 a ELISA TAU total 78 5 pg Tau / μg protein S 5 Braak I-IV b pg Aβ / μg protein S b,5,,5,,5 b ANOVA; F(,5)=.78 p=. ELISA Aβ total p<.5 b OC I-IV Relative units (vs ) b b ANOVA, F (,5) =7. p=. Aβ (OC), Braak I-IV I-IV Supplemental Fig.
 8 6 Annexin V Braak I-IV S (.")
12 a a Braak Sarkosyl Soluble Sarkosyl Insoluble II II VI VI II II VI VI a P.I Braak VI Braak VI a Viable cells Annexin V Viable cells (%) 8 6 b b... μl Sarkosyl-insoluble tau / μl b Braak WJE-toxicity Viable cells Annexin positive cells Annexin-PI positive cells P.I I-IV Number of cells (%) 8 6 Annexin V Braak I-IV S (.μg/μl) Supplemental Fig.5


 - -78 S from Thy-Tau Viable cells Annexin")


13 a a WT APP/PS ThyTau OC 6M 6M a S from PSxAPP S from APP/PS a Viable cells Annexin positive cells Annexin-PI positive cells M 9M BV cells (%) 8 6 8M M b b AT8 S-ThyTau M 9M M b PBS WT APP/PS PSxAPP 6M 6M PSxAPP APP/PS 8M S (.μg/μl) S from Thy-Tau Viable cells Annexin positive cells ANOVA F(,)=5. Annexin-PI positive cells p= BV cells (%) 8 6 Tukey p<.5 Tukey p<.5 Tukey p<.5 Tau 6 PBS Thy-Tau M Thy-Tau 9M Thy-Tau M S (.μg/μl) GAPDH c 9 - Total AT8 Soluble Insoluble Tau6 Total Soluble Insoluble Supplemental Fig.6
Supplementary Figure 1
 Supplementary Figure 1 AAV-GFP injection in the MEC of the mouse brain C57Bl/6 mice at 4 months of age were injected with AAV-GFP into the MEC and sacrificed at 7 days post injection (dpi). (a) Brains
In vivo modification of Abeta plaque toxicity as a novel neuroprotective lithium-mediated therapy for Alzheimer s disease pathology
 Trujillo-Estrada et al. Acta Neuropathologica Communications 2013, 1:73 RESEARCH Open Access In vivo modification of Abeta plaque toxicity as a novel neuroprotective lithium-mediated therapy for Alzheimer
ROCK/Cdc42-mediated microglial motility and gliapse formation lead to phagocytosis of degenerating dopaminergic neurons in vivo
 Supplementary Information ROCK/Cdc42-mediated microglial motility and gliapse formation lead to phagocytosis of degenerating dopaminergic neurons in vivo Carlos Barcia* 1,2, Carmen M Ros 1,2, Valentina
Supplementary Materials for. c-abl Activation Plays a Role in α-synucleinopathy Induced Neurodegeneration
 Supplementary Materials for c-abl Activation Plays a Role in α-synucleinopathy Induced Neurodegeneration Saurav Brahmachari, Preston Ge, Su Hyun Lee, Donghoon Kim, Senthilkumar S. Karuppagounder, Manoj
Ghrelin Facilitates GLUT2-, SGLT1- and SGLT2-mediated Intestinal. Glucose Transport in Goldfish (Carassius auratus)
") Ghrelin Facilitates GLUT2-, SGLT1- and SGLT2-mediated Intestinal Glucose Transport in Goldfish (Carassius auratus) Ayelén Melisa Blanco 1,2, Juan Ignacio Bertucci 2,3, Naresh Ramesh 2, María Jesús Delgado
Ghrelin Facilitates GLUT2-, SGLT1- and SGLT2-mediated Intestinal Glucose Transport in Goldfish (Carassius auratus) Ayelén Melisa Blanco 1,2, Juan Ignacio Bertucci 2,3, Naresh Ramesh 2, María Jesús Delgado
Supplementary Figure 1. Nature Neuroscience: doi: /nn.4547
 Supplementary Figure 1 Characterization of the Microfetti mouse model. (a) Gating strategy for 8-color flow analysis of peripheral Ly-6C + monocytes from Microfetti mice 5-7 days after TAM treatment. Living
Nature Neuroscience: doi: /nn.2275
 Supplementary Figure S1. The presence of MeCP2 in enriched primary glial cultures from rat or mouse brains is not neuronal. Western blot analysis of protein extracts from (a) rat glial and neuronal cultures.
Nature Neuroscience: doi: /nn Supplementary Figure 1
 Supplementary Figure 1 Quantification of myelin fragments in the aging brain (a) Electron microscopy on corpus callosum is shown for a 18-month-old wild type mice. Myelin fragments (arrows) were detected
Supplementary Figure 1
 Supplementary Figure 1 Genetic labeling of microglia Male and female 2-3 month-old CreERT2;R26-tdTomato mice or CreERT2;R26-tdTomato;Iba1-eGFP transgenic mice were treated with 1x, 2x (48 h apart), or
GFP/Iba1/GFAP. Brain. Liver. Kidney. Lung. Hoechst/Iba1/TLR9!
 Supplementary information a +KA Relative expression d! Tlr9 5!! 5! NSC Neuron Astrocyte Microglia! 5! Tlr7!!!! NSC Neuron Astrocyte! GFP/Sβ/! Iba/Hoechst Microglia e Hoechst/Iba/TLR9! GFP/Iba/GFAP f Brain
Bone marrow-derived mesenchymal stem cells improve diabetes-induced cognitive impairment by
 Nakano et al. Supplementary information 1. Supplementary Figure 2. Methods 3. References Bone marrow-derived mesenchymal stem cells improve diabetes-induced cognitive impairment by exosome transfer into
mm Distance (mm)
") b a Magnet Illumination Coverslips MPs Objective 2575 µm 1875 µm 1575 µm 1075 µm 875 µm 545 µm 20µm 2 3 0.5 0.3mm 1 1000 100 10 1 0.1 1000 100 10 1 0.1 Field Induction (Gauss) 1.5 0 5 10 15 20 Distance
b a Magnet Illumination Coverslips MPs Objective 2575 µm 1875 µm 1575 µm 1075 µm 875 µm 545 µm 20µm 2 3 0.5 0.3mm 1 1000 100 10 1 0.1 1000 100 10 1 0.1 Field Induction (Gauss) 1.5 0 5 10 15 20 Distance
GPR120 *** * * Liver BAT iwat ewat mwat Ileum Colon. UCP1 mrna ***
 a GPR120 GPR120 mrna/ppia mrna Arbitrary Units 150 100 50 Liver BAT iwat ewat mwat Ileum Colon b UCP1 mrna Fold induction 20 15 10 5 - camp camp SB202190 - - - H89 - - - - - GW7647 Supplementary Figure
Supplementary Figure 1. Normal T lymphocyte populations in Dapk -/- mice. (a) Normal thymic development in Dapk -/- mice. Thymocytes from WT and Dapk
 Normal thymic development in Dapk -/- mice. Thymocytes from WT and Dapk") Supplementary Figure 1. Normal T lymphocyte populations in Dapk -/- mice. (a) Normal thymic development in Dapk -/- mice. Thymocytes from WT and Dapk -/- mice were stained for expression of CD4 and CD8.
Supplementary Figure 1. Normal T lymphocyte populations in Dapk -/- mice. (a) Normal thymic development in Dapk -/- mice. Thymocytes from WT and Dapk -/- mice were stained for expression of CD4 and CD8.
SUPPLEMENTARY INFORMATION
 Supplementary Figure 1. Behavioural effects of ketamine in non-stressed and stressed mice. Naive C57BL/6 adult male mice (n=10/group) were given a single dose of saline vehicle or ketamine (3.0 mg/kg,
Supplemental Information. Menin Deficiency Leads to Depressive-like. Behaviors in Mice by Modulating. Astrocyte-Mediated Neuroinflammation
 Neuron, Volume 100 Supplemental Information Menin Deficiency Leads to Depressive-like Behaviors in Mice by Modulating Astrocyte-Mediated Neuroinflammation Lige Leng, Kai Zhuang, Zeyue Liu, Changquan Huang,
SUPPLEMENTARY INFORMATION
 doi:10.1038/nature10353 Supplementary Figure 1. Mutations of UBQLN2 in patients with ALS and ALS/dementia. (a) A mutation, c.1489c>t (p.p497s), was identified in F#9975. The pedigree is shown on the left
SUPPLEMENTARY INFORMATION
 DOI: 10.1038/ncb2566 Figure S1 CDKL5 protein expression pattern and localization in mouse brain. (a) Multiple-tissue western blot from a postnatal day (P) 21 mouse probed with an antibody against CDKL5.
TAU PATHOLOGY REDUCTION WITH SM07883, A NOVEL, POTENT, AND SELECTIVE ORAL DYRK1A INHIBITOR - A POTENTIAL THERAPEUTIC FOR ALZHEIMER S DISEASE
 TAU PATHOLOGY REDUCTION WITH SM07883, A NOVEL, POTENT, AND SELECTIVE ORAL DYRK1A INHIBITOR - A POTENTIAL THERAPEUTIC FOR ALZHEIMER S DISEASE Benoît Melchior, C. Lai, K. Duong-Polk, A. Tjitro, D.C. Ince,
Supplementary Figure 1: si-craf but not si-braf sensitizes tumor cells to radiation.
 Supplementary Figure 1: si-craf but not si-braf sensitizes tumor cells to radiation. (a) Embryonic fibroblasts isolated from wildtype (WT), BRAF -/-, or CRAF -/- mice were irradiated (6 Gy) and DNA damage
TAU PATHOLOGY REDUCTION WITH SM07883, A NOVEL, POTENT, AND SELECTIVE ORAL DYRK1A INHIBITOR - A POTENTIAL THERAPEUTIC FOR ALZHEIMER S DISEASE
 TAU PATHOLOGY REDUCTION WITH SM07883, A NOVEL, POTENT, AND SELECTIVE ORAL DYRKA INHIBITOR - A POTENTIAL THERAPEUTIC FOR ALZHEIMER S DISEASE Benoît Melchior, Carolyn Lai, Karen Duong-Polk, Amanda Tjitro,
Dietetic supplementation of docosahexaenoic acid (DHA) in non proliferative diabetic retinopathy
 in non proliferative diabetic retinopathy") Dietetic supplementation of docosahexaenoic acid (DHA) in non proliferative diabetic retinopathy A prospective controlled study of macular function using microperimetry Communication presented at XXI CONGRESS
Dietetic supplementation of docosahexaenoic acid (DHA) in non proliferative diabetic retinopathy A prospective controlled study of macular function using microperimetry Communication presented at XXI CONGRESS
Supplementary Figure 1. Deletion of Smad3 prevents B16F10 melanoma invasion and metastasis in a mouse s.c. tumor model.
 A B16F1 s.c. Lung LN Distant lymph nodes Colon B B16F1 s.c. Supplementary Figure 1. Deletion of Smad3 prevents B16F1 melanoma invasion and metastasis in a mouse s.c. tumor model. Highly invasive growth
B220 CD4 CD8. Figure 1. Confocal Image of Sensitized HLN. Representative image of a sensitized HLN
 B220 CD4 CD8 Natarajan et al., unpublished data Figure 1. Confocal Image of Sensitized HLN. Representative image of a sensitized HLN showing B cell follicles and T cell areas. 20 µm thick. Image of magnification
Programmed necrosis, not apoptosis, is a key mediator of cell loss and DAMP-mediated inflammation in dsrna-induced retinal degeneration
 Programmed necrosis, not apoptosis, is a key mediator of cell loss and DAMP-mediated inflammation in dsrna-induced retinal degeneration The Harvard community has made this article openly available. Please
Microglia, Inflammation, and FTD
 FTD Minicourse April, 2009 Microglia, Inflammation, and FTD Li Gan, Ph.D Gladstone Institute of Neurological Disease University of California, San Francisco Outline Why study inflammation in neurodegeneration?
Novel drug developed to treat type 2 diabetes are neuroprotective Alzheimer s disease
 Novel drug developed to treat type 2 diabetes are neuroprotective Alzheimer s disease Prof. Christian Hölscher, PhD Biomed and Life Sciences Faculty of Health and Medicine Lancaster University, UK Alzheimer
COPD lungs show an attached stratified mucus layer that separate. bacteria from the epithelial cells resembling the protective colonic
 COPD lungs show an attached stratified mucus layer that separate bacteria from the epithelial cells resembling the protective colonic mucus SUPPLEMENTARY TABLES AND FIGURES Tables S1 S8, page 1 and separate
Supplemental Materials for. Effects of sphingosine-1-phosphate receptor 1 phosphorylation in response to. FTY720 during neuroinflammation
 Supplemental Materials for Effects of sphingosine-1-phosphate receptor 1 phosphorylation in response to FTY7 during neuroinflammation This file includes: Supplemental Table 1. EAE clinical parameters of
Mary ET Boyle, Ph. D. Department of Cognitive Science UCSD
 ? Mary ET Boyle, Ph. D. Department of Cognitive Science UCSD Christian S Lobsiger & Don W Cleveland (2007) Nature Neuroscience 10, 1355-1360 Astrocytes: interlinked gatekeepers of glutamate astrocytes
Nature Immunology: doi: /ni Supplementary Figure 1. Production of cytokines and chemokines after vaginal HSV-2 infection.
 Supplementary Figure 1 Production of cytokines and chemokines after vaginal HSV-2 infection. C57BL/6 mice were (a) treated intravaginally with 20 µl of PBS or infected with 6.7x10 4 pfu of HSV-2 in the
Supplemental Figures:
 Supplemental Figures: Figure 1: Intracellular distribution of VWF by electron microscopy in human endothelial cells. a) Immunogold labeling of LC3 demonstrating an LC3-positive autophagosome (white arrow)
marker. DAPI labels nuclei. Flies were 20 days old. Scale bar is 5 µm. Ctrl is
 Supplementary Figure 1. (a) Nos is detected in glial cells in both control and GFAP R79H transgenic flies (arrows), but not in deletion mutant Nos Δ15 animals. Repo is a glial cell marker. DAPI labels
(a) Significant biological processes (upper panel) and disease biomarkers (lower panel)
 Significant biological processes (upper panel) and disease biomarkers (lower panel)") Supplementary Figure 1. Functional enrichment analyses of secretomic proteins. (a) Significant biological processes (upper panel) and disease biomarkers (lower panel) 2 involved by hrab37-mediated secretory
Supplementary Figure 1. Functional enrichment analyses of secretomic proteins. (a) Significant biological processes (upper panel) and disease biomarkers (lower panel) 2 involved by hrab37-mediated secretory
SUPPLEMENTARY FIGURES
 SUPPLEMENTARY FIGURES 1 Supplementary Figure 1, Adult hippocampal QNPs and TAPs uniformly express REST a-b) Confocal images of adult hippocampal mouse sections showing GFAP (green), Sox2 (red), and REST
Nature Neuroscience: doi: /nn Supplementary Figure 1. PICALM expression in brain capillary endothelium in human brain and in mouse brain.
 Supplementary Figure 1 PICALM expression in brain capillary endothelium in human brain and in mouse brain. a, Double immunostaining for PICALM (red, left) and lectin positive endothelial profiles (blue,
Doubly Phosphorylated Peptide Vaccines to Protect Transgenic P301S Mice against Alzheimer s Disease Like Tau Aggregation
 , 1-11 manuscripts; doi:10.3390/vaccines20x000x Article OPEN ACCESS vaccines ISSN 2076-393X www.mdpi.com/journal/vaccines Doubly Phosphorylated Peptide Vaccines to Protect Transgenic P301S Mice against
Human Neurology 3-Plex A
 Human Neurology 3-Plex A SUMMARY AND EXPLANATION OF THE TEST The Human N3PA assay is a digital immunoassay for the quantitative determination of total Tau, Aβ42, and Aβ40 in human plasma and CSF. Determination
Nature Neuroscience: doi: /nn Supplementary Figure 1. Large-scale calcium imaging in vivo.
 Supplementary Figure 1 Large-scale calcium imaging in vivo. (a) Schematic illustration of the in vivo camera imaging set-up for large-scale calcium imaging. (b) High-magnification two-photon image from
Supporting Information Table of Contents
 Supporting Information Table of Contents Supporting Information Figure 1 Page 2 Supporting Information Figure 2 Page 4 Supporting Information Figure 3 Page 5 Supporting Information Figure 4 Page 6 Supporting
Overexpression of ABCA1 reduces amyloid deposition in the PDAPP mouse model of Alzheimer disease
 Overexpression of ABCA1 reduces amyloid deposition in the PDAPP mouse model of Alzheimer disease Suzanne E. Wahrle,, Steven M. Paul, David M. Holtzman J Clin Invest. 2008;118(2):671-682. https://doi.org/10.1172/jci33622.
Metformin promotes tau aggregation and exacerbates abnormal behavior in a mouse model of tauopathy
 Barini et al. Molecular Neurodegeneration (2016) 11:16 DOI 10.1186/s13024-016-0082-7 RESEARCH ARTICLE Metformin promotes tau aggregation and exacerbates abnormal behavior in a mouse model of tauopathy
Downregulation of the small GTPase SAR1A: a key event underlying alcohol-induced Golgi fragmentation in hepatocytes
 Downregulation of the small GTPase SAR1A: a key event underlying alcohol-induced Golgi fragmentation in hepatocytes Armen Petrosyan 1*, Pi-Wan Cheng 1,3, Dahn L. Clemens 2,3 & Carol A. Casey 2,3 1 Department
Research Development: Bedside to Bench and Back
 Research Development: Bedside to Bench and Back Matt Bellizzi, MD PhD Department of Neurology University of Rochester School of Medicine and Dentistry Rochester, NY "I can walk down the hall just fine,
Supplementary Figure S I: Effects of D4F on body weight and serum lipids in apoe -/- mice.
 Supplementary Figures: Supplementary Figure S I: Effects of D4F on body weight and serum lipids in apoe -/- mice. Male apoe -/- mice were fed a high-fat diet for 8 weeks, and given PBS (model group) or
Supplementary Figure 1. SDS-FRL localization of CB 1 in the distal CA3 area of the rat hippocampus. (a-d) Axon terminals (t) in stratum pyramidale
 Axon terminals (t) in stratum pyramidale") Supplementary Figure 1. SDS-FRL localization of CB 1 in the distal CA3 area of the rat hippocampus. (a-d) Axon terminals (t) in stratum pyramidale (b) show stronger immunolabeling for CB 1 than those in
Supplementary Figure 1. SDS-FRL localization of CB 1 in the distal CA3 area of the rat hippocampus. (a-d) Axon terminals (t) in stratum pyramidale (b) show stronger immunolabeling for CB 1 than those in
Supplementary Figure 1. Microglia do not show signs of classical immune activation following MD a-b. Images showing immunoreactivity for MHCII (a)
") 1 Supplementary Figure 1. Microglia do not show signs of classical immune activation following MD a-b. Images showing immunoreactivity for MHCII (a) and CD45 (b) in fixed sections of binocular visual cortex
1 Supplementary Figure 1. Microglia do not show signs of classical immune activation following MD a-b. Images showing immunoreactivity for MHCII (a) and CD45 (b) in fixed sections of binocular visual cortex
Supplementary Fig. 1: TBR2+ cells in different brain regions.
 Hip SVZ OB Cere Hypo Supplementary Fig. 1: TBR2 + cells in different brain regions. Three weeks after the last tamoxifen injection, TBR2 immunostaining images reveal a large reduction of TBR2 + cells in
Supplementary Figure 1 Information on transgenic mouse models and their recording and optogenetic equipment. (a) 108 (b-c) (d) (e) (f) (g)
 108 (b-c) (d) (e) (f) (g)") Supplementary Figure 1 Information on transgenic mouse models and their recording and optogenetic equipment. (a) In four mice, cre-dependent expression of the hyperpolarizing opsin Arch in pyramidal cells
Supplementary Figure 1 Information on transgenic mouse models and their recording and optogenetic equipment. (a) In four mice, cre-dependent expression of the hyperpolarizing opsin Arch in pyramidal cells
M2 microglia/ macrophages drive oligodendrocyte differentiation during CNS remyelination
 Supplemental Information Title: M2 microglia/ macrophages drive oligodendrocyte differentiation during CNS remyelination Authors: Veronique E. Miron, Amanda Boyd, Jing-Wei Zhao, Tracy J. Yuen, Julia M.
Potential role of extracellular tau in development and spread of tauopathy: Effects of anti-tau antibodies
 Potential role of extracellular tau in development and spread of tauopathy: Effects of anti-tau antibodies David M. Holtzman, MD Professor and Chair, Dept. of Neurology Washington University School of
Supplementary Table 1. The primers used for quantitative RT-PCR. Gene name Forward (5 > 3 ) Reverse (5 > 3 )
 Reverse (5 > 3 )") 770 771 Supplementary Table 1. The primers used for quantitative RT-PCR. Gene name Forward (5 > 3 ) Reverse (5 > 3 ) Human CXCL1 GCGCCCAAACCGAAGTCATA ATGGGGGATGCAGGATTGAG PF4 CCCCACTGCCCAACTGATAG TTCTTGTACAGCGGGGCTTG
770 771 Supplementary Table 1. The primers used for quantitative RT-PCR. Gene name Forward (5 > 3 ) Reverse (5 > 3 ) Human CXCL1 GCGCCCAAACCGAAGTCATA ATGGGGGATGCAGGATTGAG PF4 CCCCACTGCCCAACTGATAG TTCTTGTACAGCGGGGCTTG
An unconventional role for mirna: let-7 activates Toll-like receptor 7 and causes neurodegeneration
 An unconventional role for mirna: let-7 activates Toll-like receptor 7 and causes neurodegeneration Sabrina M. Lehmann, Christina Krüger, Boyoun Park, Katja Derkow, Karen Rosenberger, Jan Baumgart, Thorsten
GABA from reactive astrocytes impairs memory in mouse models of Alzheimer disease
 SUPPLEMENTARY INFORMATION from reactive astrocytes impairs memory in mouse models of Alzheimer disease Seonmi Jo *, Oleg Yarishkin *, Yu Jin Hwang, Ye Eun Chun, Mijeong Park, Dong Ho Woo, Jin Young Bae,
Increased Spontaneous Central Bleeding and Cognition Impairment in APP/PS1 Mice with Poorly Controlled Diabetes Mellitus
 Mol Neurobiol (2016) 53:2685 2697 DOI 10.1007/s12035-015-9311-2 Increased Spontaneous Central Bleeding and Cognition Impairment in APP/PS1 Mice with Poorly Controlled Diabetes Mellitus Juan José Ramos-Rodriguez
Figure S1. PMVs from THP-1 cells expose phosphatidylserine and carry actin. A) Flow
 Flow") SUPPLEMENTARY DATA Supplementary Figure Legends Figure S1. PMVs from THP-1 cells expose phosphatidylserine and carry actin. A) Flow cytometry analysis of PMVs labelled with annexin-v-pe (Guava technologies)
SUPPLEMENTARY DATA Supplementary Figure Legends Figure S1. PMVs from THP-1 cells expose phosphatidylserine and carry actin. A) Flow cytometry analysis of PMVs labelled with annexin-v-pe (Guava technologies)
condition. Left panel, the HCT-116 cells were lysed with RIPA buffer containing 0.1%
 FIGURE LEGENDS Supplementary Fig 1 (A) sumoylation pattern detected under denaturing condition. Left panel, the HCT-116 cells were lysed with RIPA buffer containing 0.1% SDS in the presence and absence
Rescue of mutant rhodopsin traffic by metformin-induced AMPK activation accelerates photoreceptor degeneration Athanasiou et al
 Supplementary Material Rescue of mutant rhodopsin traffic by metformin-induced AMPK activation accelerates photoreceptor degeneration Athanasiou et al Supplementary Figure 1. AICAR improves P23H rod opsin
T H E J O U R N A L O F C E L L B I O L O G Y
 T H E J O U R N A L O F C E L L B I O L O G Y Supplemental material Amelio et al., http://www.jcb.org/cgi/content/full/jcb.201203134/dc1 Figure S1. mir-24 regulates proliferation and by itself induces
Human SH-SY5Y neuroblastoma cells (A.T.C.C., Manassas, VA) were cultured in DMEM, F-12
 were cultured in DMEM, F-12") SUPPLEMENTARY METHODS Cell cultures Human SH-SY5Y neuroblastoma cells (A.T.C.C., Manassas, VA) were cultured in DMEM, F-12 Ham with 25 mm HEPES and NaHCO 3 (1:1) and supplemented with 10% (v/v) FBS, 1.0
SUPPLEMENTARY METHODS Cell cultures Human SH-SY5Y neuroblastoma cells (A.T.C.C., Manassas, VA) were cultured in DMEM, F-12 Ham with 25 mm HEPES and NaHCO 3 (1:1) and supplemented with 10% (v/v) FBS, 1.0
Supplement Figure S1. Real Time PCR analysis of mrna levels of C/EBPα and PU.1 in wild type (WT) and NQO1-null (NQO1-/-) mice.
 and NQO1-null (NQO1-/-) mice.") competes with 20S proteasome for binding with C/EBP leading to its stabilization and Relative mrna levels Supplement Figure S1. Real Time PCR analysis of mrna levels of C/EBPα and PU.1 in wild type (WT)
competes with 20S proteasome for binding with C/EBP leading to its stabilization and Relative mrna levels Supplement Figure S1. Real Time PCR analysis of mrna levels of C/EBPα and PU.1 in wild type (WT)
Supplementary Information. Tissue-wide immunity against Leishmania. through collective production of nitric oxide
 Supplementary Information Tissue-wide immunity against Leishmania through collective production of nitric oxide Romain Olekhnovitch, Bernhard Ryffel, Andreas J. Müller and Philippe Bousso Supplementary
SUPPLEMENTARY MATERIAL
 SUPPLEMENTARY MATERIAL IL-1 signaling modulates activation of STAT transcription factors to antagonize retinoic acid signaling and control the T H 17 cell it reg cell balance Rajatava Basu 1,5, Sarah K.
Supplementary Figure 1. Efficiency of Mll4 deletion and its effect on T cell populations in the periphery. Nature Immunology: doi: /ni.
 Supplementary Figure 1 Efficiency of Mll4 deletion and its effect on T cell populations in the periphery. Expression of Mll4 floxed alleles (16-19) in naive CD4 + T cells isolated from lymph nodes and
Supplementary Figure 1 IMQ-Induced Mouse Model of Psoriasis. IMQ cream was
 Supplementary Figure 1 IMQ-Induced Mouse Model of Psoriasis. IMQ cream was painted on the shaved back skin of CBL/J and BALB/c mice for consecutive days. (a, b) Phenotypic presentation of mouse back skin
Nature Immunology: doi: /ni eee Supplementary Figure 1
 eee Supplementary Figure 1 Hyphae induce NET release, but yeast do not. (a) NET release by human peripheral neutrophils stimulated with a hgc1 yeast-locked C. albicans mutant (yeast) or pre-formed WT C.
Supplementary Figure 1
 Supplementary Figure 1 The average sigmoid parametric curves of capillary dilation time courses and average time to 50% peak capillary diameter dilation computed from individual capillary responses averaged
Figure S1. Western blot analysis of clathrin RNA interference in human DCs Human immature DCs were transfected with 100 nm Clathrin SMARTpool or
 Figure S1. Western blot analysis of clathrin RNA interference in human DCs Human immature DCs were transfected with 100 nm Clathrin SMARTpool or control nontargeting sirnas. At 90 hr after transfection,
Supplementary Figure 1. The CagA-dependent wound healing or transwell migration of gastric cancer cell. AGS cells transfected with vector control or
 Supplementary Figure 1. The CagA-dependent wound healing or transwell migration of gastric cancer cell. AGS cells transfected with vector control or 3xflag-CagA expression vector were wounded using a pipette
CB 1 Agonist ACEA Protects Neurons and Reduces the Cognitive Impairment of A PP/PS1 Mice
 Journal of Alzheimer s Disease 30 (2012) 439 459 DOI 10.3233/JAD-2012-111862 IOS Press 439 CB 1 Agonist ACEA Protects Neurons and Reduces the Cognitive Impairment of A PP/PS1 Mice Ester Aso a,, Ernest
SUPPLEMENTARY FIGURES AND TABLES
 SUPPLEMENTARY FIGURES AND TABLES Supplementary Figure S1: CaSR expression in neuroblastoma models. A. Proteins were isolated from three neuroblastoma cell lines and from the liver metastasis of a MYCN-non
Postn MCM Smad2 fl/fl Postn MCM Smad3 fl/fl Postn MCM Smad2/3 fl/fl. Postn MCM. Tgfbr1/2 fl/fl TAC
 A Smad2 fl/fl Smad3 fl/fl Smad2/3 fl/fl Tgfbr1/2 fl/fl 1. mm B Tcf21 MCM Tcf21 MCM Smad3 fl/fl Tcf21 MCM Smad2/3 fl/fl Tcf21 MCM Tgfbr1/2 fl/fl αmhc MCM C 1. mm 1. mm D Smad2 fl/fl Smad3 fl/fl Smad2/3
Figure S1. Generation of inducible PTEN deficient mice and the BMMCs (A) B6.129 Pten loxp/loxp mice were mated with B6.
 B6.129 Pten loxp/loxp mice were mated with B6.") Figure S1. Generation of inducible PTEN deficient mice and the BMMCs (A) B6.129 Pten loxp/loxp mice were mated with B6.129-Gt(ROSA)26Sor tm1(cre/ert2)tyj /J mice. To induce deletion of the Pten locus,
Figure S1. Generation of inducible PTEN deficient mice and the BMMCs (A) B6.129 Pten loxp/loxp mice were mated with B6.129-Gt(ROSA)26Sor tm1(cre/ert2)tyj /J mice. To induce deletion of the Pten locus,
Supplementary fig. 1. Crystals induce necroptosis does not involve caspases, TNF receptor or NLRP3. A. Mouse tubular epithelial cells were pretreated
 Supplementary fig. 1. Crystals induce necroptosis does not involve caspases, TNF receptor or NLRP3. A. Mouse tubular epithelial cells were pretreated with zvad-fmk (10µM) and exposed to calcium oxalate
Supplementary Figure 1. IDH1 and IDH2 mutation site sequences on WHO grade III
 Supplementary Materials: Supplementary Figure 1. IDH1 and IDH2 mutation site sequences on WHO grade III patient samples. Genomic DNA samples extracted from punch biopsies from either FFPE or frozen tumor
SUPPLEMENTARY INFORMATION
 doi: 10.1038/nature05772 SUPPLEMENTARY INFORMATION Supplemental figure 1. Enrichment facilitates learning. a. Images showing a home cage and a cage used for environmental enrichment (EE). For EE up to
Intravitreal ranibizumab combined with oral suplementation with docosahexaenoic acid and antioxidants in diabetic macular edema
 Intravitreal ranibizumab combined with oral suplementation with docosahexaenoic acid and antioxidants in diabetic macular edema Results at 36 months of a controlled, randomized, simple blinded clinical
SHREE ET AL, SUPPLEMENTAL MATERIALS. (A) Workflow for tumor cell line derivation and orthotopic implantation.
 Workflow for tumor cell line derivation and orthotopic implantation.") SHREE ET AL, SUPPLEMENTAL MATERIALS SUPPLEMENTAL FIGURE AND TABLE LEGENDS Supplemental Figure 1. Derivation and characterization of TS1-TGL and TS2-TGL PyMT cell lines and development of an orthotopic
SHREE ET AL, SUPPLEMENTAL MATERIALS SUPPLEMENTAL FIGURE AND TABLE LEGENDS Supplemental Figure 1. Derivation and characterization of TS1-TGL and TS2-TGL PyMT cell lines and development of an orthotopic
Supplementary Figure 1. Validation of astrocytes. Primary astrocytes were
 Supplementary Figure 1. Validation of astrocytes. Primary astrocytes were separated from the glial cultures using a mild trypsinization protocol. Anti-glial fibrillary acidic protein (GFAP) immunofluorescent
Supplementary Information
 Supplementary Information Title Degeneration and impaired regeneration of gray matter oligodendrocytes in amyotrophic lateral sclerosis Authors Shin H. Kang, Ying Li, Masahiro Fukaya, Ileana Lorenzini,
Wnt Signaling Pathway and AD
 Center for Cell Regulation and Pathology Joaquín V. Luco (CRCP), Millennium Institute (MIFAB) Center for Aging and Regeneration (CARE). Wnt Signaling Pathway and AD Nibaldo C. Inestrosa European Union
Supplementary Fig. 1
 PDK1-dependent quenching of TACE shedding activity in prion and Alzheimer s diseases Mathéa Pietri, Caroline Dakowski, Samia Hannaoui, Aurélie Alleaume-Butaux, Julia Hernandez-Rapp, Audrey Ragagnin, Sophie
Supplemental Data. Epithelial-Macrophage Interactions Determine Pulmonary Fibrosis Susceptibility in. Hermansky-Pudlak Syndrome
 Page 1 Supplemental Data Epithelial-Macrophage Interactions Determine Pulmonary Fibrosis Susceptibility in Hermansky-Pudlak Syndrome Lisa R. Young, Peter M. Gulleman, Chelsi W. Short, Harikrishna Tanjore,
Supplemental Figure 1. Intracranial transduction of a modified ptomo lentiviral vector in the mouse
 Supplemental figure legends Supplemental Figure 1. Intracranial transduction of a modified ptomo lentiviral vector in the mouse hippocampus targets GFAP-positive but not NeuN-positive cells. (A) Stereotaxic
Supplementary Figure 1: Co-localization of reconstituted L-PTC and dendritic cells
 a CD11c Na + K + ATPase Na + K + ATPase CD11c x-y CD11c Na + K + ATPase Na + K + ATPase CD11c x-z c b x-y view BoNT NAPs CD11c BoNT CD11c NAPs BoNT NAPs CD11c 90 x-z view Apical Basolateral Supplementary
Supplementary Figures
 Supplementary Figures Supplementary Figure 1. NKT ligand-loaded tumour antigen-presenting B cell- and monocyte-based vaccine induces NKT, NK and CD8 T cell responses. (A) The cytokine profiles of liver
Figure S1. (A) SDS-PAGE separation of GST-fusion proteins purified from E.coli BL21 strain is shown. An equal amount of GST-tag control, LRRK2 LRR
 SDS-PAGE separation of GST-fusion proteins purified from E.coli BL21 strain is shown. An equal amount of GST-tag control, LRRK2 LRR") Figure S1. (A) SDS-PAGE separation of GST-fusion proteins purified from E.coli BL21 strain is shown. An equal amount of GST-tag control, LRRK2 LRR and LRRK2 WD40 GST fusion proteins (5 µg) were loaded
Figure S1. (A) SDS-PAGE separation of GST-fusion proteins purified from E.coli BL21 strain is shown. An equal amount of GST-tag control, LRRK2 LRR and LRRK2 WD40 GST fusion proteins (5 µg) were loaded
Zhu et al, page 1. Supplementary Figures
 Zhu et al, page 1 Supplementary Figures Supplementary Figure 1: Visual behavior and avoidance behavioral response in EPM trials. (a) Measures of visual behavior that performed the light avoidance behavior
Figure S1. Reduction in glomerular mir-146a levels correlate with progression to higher albuminuria in diabetic patients.
 Supplementary Materials Supplementary Figures Figure S1. Reduction in glomerular mir-146a levels correlate with progression to higher albuminuria in diabetic patients. Figure S2. Expression level of podocyte
Hippocampal protein kinase C signaling mediates the short-term memory
 Hippocampal protein kinase C signaling mediates the short-term memory impairment induced by delta9-tetrahydrocannabinol Arnau usquets-garcia* 1,2, Maria Gomis-González* 1, Victòria Salgado-Mendialdúa 1,
Product Datasheet. beta Amyloid Antibody (MOAB-2) NBP Unit Size: 0.1 ml
 NBP Unit Size: 0.1 ml") Product Datasheet beta Amyloid Antibody (MOAB-2) NBP2-13075 Unit Size: 0.1 ml Store at 4C short term. Aliquot and store at -20C long term. Avoid freeze-thaw cycles. Publications: 11 Protocols, Publications,
Product Datasheet beta Amyloid Antibody (MOAB-2) NBP2-13075 Unit Size: 0.1 ml Store at 4C short term. Aliquot and store at -20C long term. Avoid freeze-thaw cycles. Publications: 11 Protocols, Publications,
Dementia and Healthy Ageing : is the pathology any different?
 Dementia and Healthy Ageing : is the pathology any different? Professor David Mann, Professor of Neuropathology, University of Manchester, Hope Hospital, Salford DEMENTIA Loss of connectivity within association
Supporting Information
 Supporting Information Chen et al. 10.1073/pnas.0807991106 SI Methods Sucrose Gradient Fractionation. Fractionation by sucrose gradient was performed as described by Gasparini et al. [(2001) J Neurosci
Supplementary Figure 1. Characterization of human carotid plaques. (a) Flash-frozen human plaques were separated into vulnerable (V) and stable (S),
 Flash-frozen human plaques were separated into vulnerable (V) and stable (S),") Supplementary Figure 1. Characterization of human carotid plaques. (a) Flash-frozen human plaques were separated into vulnerable (V) and stable (S), regions which were then quantified for mean fluorescence
Supplementary Figure 1. Characterization of human carotid plaques. (a) Flash-frozen human plaques were separated into vulnerable (V) and stable (S), regions which were then quantified for mean fluorescence
SUPPLEMENTARY INFORMATION
 doi:1.138/nature1554 a TNF-α + in CD4 + cells [%] 1 GF SPF 6 b IL-1 + in CD4 + cells [%] 5 4 3 2 1 Supplementary Figure 1. Effect of microbiota on cytokine profiles of T cells in GALT. Frequencies of TNF-α
Supplementary Figure 1 P53 is degraded following Chlamydia infection independent of the cell lysis and protein sample preparation procedure applied.
 Supplementary Figure 1 P53 is degraded following Chlamydia infection independent of the cell lysis and protein sample preparation procedure applied. (a) Western blotting analysis showing degradation of
Supplementary Figure 1. Confocal immunofluorescence showing mitochondrial translocation of Drp1. Cardiomyocytes treated with H 2 O 2 were prestained
 Supplementary Figure 1. Confocal immunofluorescence showing mitochondrial translocation of Drp1. Cardiomyocytes treated with H 2 O 2 were prestained with MitoTracker (red), then were immunostained with
Acute lung injury in children : from viral infection and mechanical ventilation to inflammation and apoptosis Bern, R.A.
 UvA-DARE (Digital Academic Repository) Acute lung injury in children : from viral infection and mechanical ventilation to inflammation and apoptosis Bern, R.A. Link to publication Citation for published
The Carroll A. Campbell, Jr. Neuropathology Laboratory: A Tool for Dementia Discovery in South Carolina
 The Carroll A. Campbell, Jr. Neuropathology Laboratory: A Tool for Dementia Discovery in South Carolina Pathology in the Cerebral Cortex H&E stain of mature neuritic plaque Modified Bielschowsky stain
Procaspase-3. Cleaved caspase-3. actin. Cytochrome C (10 M) Z-VAD-fmk. Procaspase-3. Cleaved caspase-3. actin. Z-VAD-fmk
 Z-VAD-fmk. Procaspase-3. Cleaved caspase-3. actin. Z-VAD-fmk") A HeLa actin - + + - - + Cytochrome C (1 M) Z-VAD-fmk PMN - + + - - + actin Cytochrome C (1 M) Z-VAD-fmk Figure S1. (A) Pan-caspase inhibitor z-vad-fmk inhibits cytochrome c- mediated procaspase-3 cleavage.
A HeLa actin - + + - - + Cytochrome C (1 M) Z-VAD-fmk PMN - + + - - + actin Cytochrome C (1 M) Z-VAD-fmk Figure S1. (A) Pan-caspase inhibitor z-vad-fmk inhibits cytochrome c- mediated procaspase-3 cleavage.