Sodium Information on Nutrition Labels
|
|
|
- Molly Anderson
- 6 years ago
- Views:
Transcription
1 Sodium Information on Nutrition Labels SALT
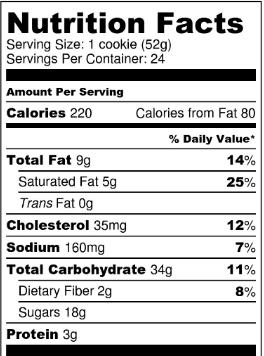
2 PUBLIC HEALTH RESEARCH, PRACTICE, AND POLICY Volume 12, E48 APRIL 2015 ORIGINAL RESEARCH Reported Use and Perceived Understanding of Sodium Information on US Nutrition Labels Jessica Lee Levings, MS, RD, LD; Joyce Maalouf, MS, MPH; Xin Tong, MPH; Mary E. Cogswell, DrPh, RN Suggested citation for this article: Levings JL, Maalouf J, Tong X, Cogswell ME. Reported Use and Perceived Understanding of Sodium Information on US Nutrition Labels. Prev Chronic Dis 2015;12: DOI: PEER REVIEWED Abstract Introduction Comparing nutrition labels and choosing lower sodium foods are tactics to help reduce excessive sodium intake, a major risk factor for hypertension. Our objective was to assess US adult consumers reported use and perceived understanding of sodium information on nutrition labels by sociodemographic and health status. Methods We analyzed responses to questions from 3,729 adults aged 18 years or older participating in 2 national cross-sectional mail panel surveys in Results We found that 19.3% (95% confidence interval [CI], 17.2% 21.6%) of respondents agreed they were confused about how to figure out how much sodium is in the foods they eat; 57.9% (95% CI, 55.4% 60.5%) reported that they or the person who shops for their food buy items labeled low salt or low sodium; and 46.8% (95% CI, 44.3% 49.4%) reported they check nutrition labels for sodium content as a tactic to limit salt. Consumers with a high school education or less were more likely than college graduates to report they were confused about sodium content on labels (adjusted odds ratio [AOR], 1.9; 95% CI, ) and less likely to check labels for sodium as a tactic to limit salt intake (AOR, 0.7; 95% CI, ). Conclusion Most survey respondents in our study reported buying low sodium food items. However, a higher proportion of respondents with low education than respondents with high education reported confusion with and less use of sodium content information, suggesting enhanced efforts may be needed to assist this group. Opportunity exists for health care professionals to educate patients about using and understanding nutrition labels and consuming a diet consistent with the Dietary Approaches to Stop Hypertension (DASH) eating plan. Introduction People who report using sodium information on food labels consume significantly less sodium than those who do not use such information (1). In a 2012 Web-based survey conducted by the International Food Information Council (IFIC), 37% of US consumers reported regularly purchasing products labeled low sodium (2). Additionally, 2014 IFIC data indicated that 95% of US consumers believe sodium information on the Nutrition Facts label is very or somewhat helpful when making decisions about what foods to buy and that more people are trying to limit salt or sodium than are trying to limit calories, sugars, or fats (3). This survey and others suggest that 53% to 58% of consumers limit or are trying to limit, restrict, or avoid salt/sodium (3 5). In the United States, packaged and restaurant foods are the primary source of dietary sodium (6 8). Both the 2010 Dietary Guidelines for Americans and Healthy People 2020 recommend reducing the average US sodium intake, which is currently well above recommended levels (9,10). Excess sodium intake can increase the risk of high blood pressure and subsequent cardiovascular diseases, the leading causes of death in the United States (11). In a 2010 report, the Institute of Medicine (IOM) recommended revising and updating nutrition labels and monitoring consumers ability to estimate sodium intake, and the US Food and Drug Administration is proposing to update the Nutrition Facts label found on most pack- The opinions expressed by authors contributing to this journal do not necessarily reflect the opinions of the U.S. Department of Health and Human Services, Centers for Disease Control and Prevention 1
3 aged food items in the United States; if adopted, one of the proposed changes would reduce the Daily Value for sodium from 2,400 mg to 2,300 mg. Data on consumer s perceived understanding, confusion, and reported use of sodium information on nutrition labels for purchases can serve as a baseline for helping to evaluate the impact of proposed changes. To our knowledge, researchers have not evaluated consumers attitudes and beliefs about their understanding of sodium content on nutrition labels. We hypothesized that adults with a higher risk of heart disease would be more likely to report using sodium information on labels and that those with lower education would be less likely to report understanding sodium information on labels. The primary objective of this analysis was to describe US adult consumers selfreported use and perceived understanding of sodium information on nutrition labels (both on the Nutrition Facts label and on the front of food packages) by sociodemographic and health characteristics. Methods With technical assistance from the Centers for Disease Control and Prevention (CDC), we submitted 5 questions to the 2010 ConsumerStyles and 2 questions to the HealthStyles cross-sectional mail panel surveys conducted by the public relations firm Porter Novelli. We linked data from both surveys to evaluate responses from the same participants to 6 statements and 1 question about self-reported confusion, knowledge, and use of nutrition labels to reduce sodium intake. The ConsumerStyles survey was conducted in April and May Participants were selected according to region of residence, annual household income, population density, age, and household size to create a diverse national sample. Of the 20,000 people selected, 10,328 (51.6%) responded. The Health- Styles survey was conducted in September and October 2010; 6,253 people who responded to the 2010 ConsumerStyles survey were randomly selected to participate, and 4,198 (67.1%) responded. Samples from the 2010 HealthStyles survey were weighted for age, sex, race/ethnicity, annual household income, and household size to represent the US Census Bureau s estimated US population for For this study, data from the 2 surveys were merged and a subsample of people responding to the 2010 Health- Styles survey was used. Of the 4,198 HealthStyles respondents, we consecutively excluded the following: 237 (5.6%) respondents with incomplete responses on at least 1 of the survey statements or questions of interest, 25 respondents missing information on education, 120 respondents missing information on smoking status, 48 respondents missing information on height, and 39 respondents missing information on weight. This process yielded 3,729 respondents. Respondents included in our analyses did not differ from those excluded (n = 469) in terms of sex, education level, region of residence, body mass index (BMI), or diabetes diagnosis (Appendix). The possible responses to the question on smoking were the following: former smoker, nonsmoker and smoker. The categories nonsmoker and former smoker were combined. A higher proportion of included respondents than excluded respondents were aged 18 to 50 (60.5% vs 48.8%; P <.001), were white non-hispanic (69.8% vs 58.9%; P =.02), had an annual household income of $60,000 or more (44.2% vs 29.9% ; P <.001), and were nonsmokers (84.1% vs 77.3%; P =.055 ); a lower proportion of included respondents reported high blood pressure (28.2% vs 35.7%; P =.02) (Appendix). This study was deemed exempt from institutional review board approval under federal regulation 45 CFR (b). During the ConsumerStyles survey, participants were asked to use a 5-point Likert scale to agree or disagree with the following 4 statements: I specifically buy foods labeled low or reduced salt/ sodium, I am confused about how to figure out how much sodium is in the food I eat, Information on nutrition labels often helps me decide what food to buy, and I am confused about how to use the Nutrition Facts label to figure out how much sodium is in the food I eat. Because the objective of our study focused on sodium information, we did not analyze data on the third question (whether nutrition labels helped participants to decide in general what food to buy). Participants also were asked to answer yes or no to the following statement: I check nutrition labels for sodium content as a tactic to lower the salt in my diet. During the Health- Styles survey, participants were asked to use a 5-point Likert scale to agree or disagree with the following statement: I know how to monitor the amount of salt I eat based on the information provided on nutrition labels. They were also asked to respond yes or no to the following question: Do you or the person who shops for your food buy items that are labeled low salt or low sodium? The surveys also included questions about respondents sociodemographic and health characteristics. Self-reported sociodemographic characteristics included (but were not limited to) age, sex, race/ethnicity, annual household income, education level, and region of residence. Self-reported health characteristics included height, weight, smoking status, diagnosed diabetes, and diagnosed high blood pressure. Height and weight were used to calculate each respondent s body mass index ([BMI], weight in kg/height in m 2 ). Weighted percentages and 95% confidence intervals (CIs) were calculated for the responses to the survey questions by sociodemographic and health characteristics. We used χ 2 tests to assess differences in responses between subgroups, where an α level of.05 was considered significant. Multiple logistic regression analyses 2 Centers for Disease Control and Prevention
4 were conducted for each question to determine the associations with sociodemographic and health characteristics. Adjusted odds ratios (AORs) and 95% CIs were obtained from each model after controlling for age, sex, race/ethnicity, annual household income, education level, region of residence, BMI, smoking status, diagnosed diabetes, and diagnosed high blood pressure. Preliminary analyses of the 5-point Likert responses were conducted to examine the AORs for agree versus the 2 other responses ( neither agree nor disagree and disagree ). Responses of strongly agree, moderately agree, and somewhat agree were combined into 1 agree category. All statistical analyses were performed using the following statistical software: SPSS Statistics (version PASW18, 2010; IBM Corp) and SAS (version 9.2, 2012; SAS Institute Inc). SPSS was used to run the descriptive analyses and χ 2 tests, and SAS was used to generate logistic regressions and to replicate the main results. Results Reported understanding of how to monitor sodium content in foods varied by question (Table 1). About 1 in 5 (19.3%) respondents agreed they were confused about how to figure out how much sodium is in the food they eat (29% neither agreed nor disagreed, and 52% disagreed), and 1 in 8 (13.2%) respondents agreed that they were confused about how to use Nutrition Facts label to figure out how much sodium is in the food they eat (23% neither agreed nor disagreed, and 64% disagreed) (Table 1). Most (55.8%) agreed they knew how to monitor the amount of salt they eat based on the information provided on nutrition labels (28% neither agreed nor disagreed, and 16% disagreed). After adjusting for other characteristics, respondents with a high school education or less were more likely than college graduates to agree they were confused about how to figure out how much sodium is in their food (Table 1), as were adults aged 71 or older (compared with adults aged 18 to 50), black non-hispanics (compared with white non- Hispanics), those with an annual household of income $15,000 or less (compared with those with an income of $60,000), and those with a diabetes diagnosis (compared with those who did not report having diabetes). Similarly, when asked about confusion with how to use nutrition facts labels to figure out sodium content, respondents aged 51 or older (compared with respondents aged 18 50); black non-hispanics, Hispanics, and those of other race/ ethnicity (compared with white non-hispanics), those with an annual household income of less than $15,000 (compared with those with an income of $60,000), and non-college graduates (compared with college graduates) were more likely to agree they were confused. Women were more likely than men to report knowing how to monitor the amount of salt they eat based on nutrition labels but were not less likely to agree they were confused. Reported use of sodium information on nutrition labels also varied by question (Table 2). About 1 in 3 (35.6%) respondents agreed they specifically buy foods labeled low or reduced salt or sodium (28% neither agreed nor disagreed, and 37% disagreed), and a little less than half (46.8%) said they check nutrition labels for sodium content as a tactic to lower salt in their diet. Most (57.9%) said they or the person who shops for their food buy items that are labeled low salt or low sodium. Reported use of sodium labeling typically found on the front of food packages (eg, low sodium ) during shopping varied by sociodemographic and health characteristics (Table 2). The percentage of respondents who agreed that they specifically buy foods labeled low or reduced salt/sodium ranged from 27.0% (current smokers) to 52.6% (those aged 71). After adjusting for other characteristics, the likelihood of specifically buying foods labeled low or reduced salt/sodium was higher among respondents aged 51 or older than among those aged 18 to 50. The proportions agreeing were also higher among non-hispanic blacks and those from other race/ethnicity than among non-hispanic whites and among respondents who reported having high blood pressure than among those who did not report having high blood pressure. About 7 of 10 respondents who were aged 71 or older, were non- Hispanic black, or who reported having diabetes or high blood pressure indicated they or the person who shops for their food buys items labeled low salt or low sodium (Table 2). After adjusting for other characteristics, the likelihood of reporting they or the person who shops for their food buy low-salt or low sodium items was higher among those aged 51 or older than among those aged 18 to 50, among non-hispanic blacks than among non-hispanic whites, and among those who reported having diabetes or high blood pressure than among those who did not report having those conditions. Discussion This study suggests that less than 20% of US adult consumers are confused about how to figure out how much sodium is in the foods they eat and that more than half believe they know how to use nutrition labels to monitor the amount of salt they eat. Although these data are from 2010 they are useful in understanding consumers reported use and perceived understanding about the sodium content on nutrition labels. Consumer knowledge and understanding is unlikely to have changed between 2010 and 2015, given that no major education campaigns have taken place in the United States during this time and that our results on reported use of nutrition labels are consistent with the results of other studies (3 5). Centers for Disease Control and Prevention 3
5 Of some concern is that adults with less education or at higher risk of hypertension, such as older adults, non-hispanic blacks, and those with diabetes, were more likely to be confused about how to figure out how much sodium is in the food they eat. Although most respondents to the 2010 ConsumerStyles and HealthStyles surveys reported that information on nutrition labels helps them decide what foods to buy (data not reported), results also suggest that most adults do not check Nutrition Facts labels as a tactic to lower salt in their diet. The difference in reported understanding and behavior could be related to a misunderstanding of 1 or both questions, use of nutrition labels to help make purchasing decisions not related to sodium, use of another tactic or strategy as the primary means to reduce sodium intake (eg, not adding salt at the table), or a lack of translation from knowledge to behavior because of other purchase considerations, such as time, preference, or cost. Not adding salt at the table is less effective than checking nutrition labels and choosing the lower-sodium option, because most sodium consumed in the United States is from sodium in packaged and restaurant foods, and only a small percentage is from salt added by the consumer. As hypothesized, respondents with less education were consistently more likely to agree they were confused about using Nutrition Facts labels to monitor their sodium intake, and less likely to check nutrition labels as a tactic to lower salt in their diet. These data extend findings from previous studies on the association of education with general use of food labels (12 14). Our results suggesting that most US consumers or the person who shops for their food buy items labeled low salt or low sodium is consistent with other research (5,15) and suggests a demand for lower-sodium food choices (4) and the presentation of information on the front of the package to make choices. However, we do not know whether consumers are buying only 1 low sodium product or multiple low sodium products. A standardized front-ofpackage labeling system, similar to that proposed by the IOM in 2011, could help consumers make more healthful choices about their food purchases (16). Counseling consumers about reading and understanding food labels might be especially beneficial among populations with low socioeconomic status and among those who have risk factors for high blood pressure. Consumer knowledge of sodium and corresponding behavior change may be further influenced by counseling on the major sources of sodium and the Dietary Approaches to Stop Hypertension (DASH) eating plan. This approach may be especially beneficial among those who report having high blood pressure, who are already more likely to report that they or the person who shops for their food buy foods labeled low or reduced salt or sodium. However, because individual behavior change is difficult and because sodium is added to the food supply before foods are purchased, gradual reductions of sodium content by the food industry as a primary strategy recommended by the IOM to reduce US sodium intake would require little change on the part of the consumer. Our study has several limitations. First, because ConsumerStyles and HealthStyles are mail panel surveys, they reach a population in which racial/ethnic minority and low-income households may be underrepresented. These surveys are based on a convenience sample of people willing to participate in a panel survey, and the characteristics of respondents to the survey or to certain questions may differ from the characteristics of the general population. Although the data were weighted to have the same distribution of key demographic characteristics as the distribution in the United States, they are not nationally representative. Even so, a previous study suggested that reported behaviors correlate well with representative and population-based surveillance data from CDC s Behavioral Risk Factor Surveillance System (17). Second, because these surveys require literacy in English, people who do not speak English cannot participate. Third, respondents self-report their ability to understand nutrition labels, and the questions asked do not test the respondents actual knowledge. In addition, because the results of this study are based on self-reported data, they do not necessarily translate into consumer action. We do not know how the consumer uses information on sodium content to estimate their sodium intake. The strengths of this research include the large sample size, the contribution to new findings on consumers perceived understanding of sodium information on nutrition labels, and support of recommendations in a 2010 IOM report to strengthen and expand activities to measure population knowledge, attitudes, and behaviors about sodium among US consumers (7). The results of this study suggest that most household food purchasers buy food items labeled low salt or low sodium, but fewer people including members of subpopulations at high risk for high blood pressure and those with a high school education or less check nutrition labels for sodium content as a tactic to limit sodium intake, and some adults are confused about how to determine the amount of sodium in foods. Food manufacturers can meet this demand by producing food items that are lower in sodium and including this information on the front of their packages. Doing so will offer greater choice and availability for the majority of consumers who want to buy low sodium products. Registered dietitians, health care professionals, and public health professionals can help by educating their clients and patients about the major sources of sodium in our diets, the importance of using nutrition labels to choose low-sodium foods, and how to understand and use nutrition labels. 4 Centers for Disease Control and Prevention
6 Acknowledgments We thank Janelle Peralez Gunn for her contribution to this article. Author Information Corresponding Author: Jessica Lee Levings, MS, RD, LD, Contractor, Division for Heart Disease and Stroke Prevention, National Center for Chronic Disease Prevention and Health Promotion, Centers for Disease Control and Prevention, MS K-72, 4770 Buford Hwy, Chamblee, GA Telephone: Author Affiliations: Joyce Maalouf, Xin Tong, Mary E. Cogswell, Division for Heart Disease and Stroke Prevention, National Center for Chronic Disease Prevention and Health Promotion, Centers for Disease Control and Prevention, Atlanta, Georgia. References 1. Ollberding NJ, Wolf RL, Contento I. Food label use and its relation to dietary intake among US adults. J Am Diet Assoc 2010;110(8): International Food Information Council. 2012Food and health survey. Consumer attitudes toward food safety, nutrition and health %20IFIC%20Food%20and%20Health%20Survey%20Re port%20of%20findings%20(for%20website).pdf. Accessed November 19, International Food Information Council. 2014Food and health survey. The pulse of America s diet from beliefs to behaviors %20Food%20and%20Health%20Survey%20Full%20Rep ort.pdf. Accessed November 19, American Heart Association. Infographic: 75% of Americans want less sodium in restaurant and processed food. HealthyEating/75-of-Americans-Want-Less-Sodium-in- Processed-and-Restaurant-Foods- Infographic_UCM_467291_SubHomePage.jsp. Accessed January 12, Fifteen percent of dieters are concerned about salt intake [press release]. London (UK): Mintel Group; Accessed November 19, Mattes RD, Donnelly D. Relative contributions of dietary sodium sources. J Am Coll Nutr 1991;10(4): Institute of Medicine. Strategies to reduce sodium intake in the United States. Washington (DC): The National Academies Press; Accessed November 19, Anderson CA, Appel LJ, Okuda N, Brown IJ, Chan Q, Zhao L, et al. Dietary sources of sodium in China, Japan, the United Kingdom, and the United States, women and men aged 40 to 59 years: the INTERMAP study. J Am Diet Assoc 2010; 110(5): Dietary guidelines for Americans, th edition. Washington (DC): US Department of Health and Human Services, US Department of Agriculture; health.gov/dietaryguidelines/2010.asp. Accessed November 19, What we eat in America, NHANES Nutrient intakes from food and beverages. Beltsville (MD): US Department of Agriculture, Agricultural Research Service, Beltsville Human Nutrition Research Center, Food Surveys Research Group. Hyattsville (MD): US Department of Health and Human Services, Centers for Disease Control and Prevention, National Center for Health Statistics. Table_1_NIN_GEN_11.pdf. Accessed November 19, Go AS, Mozaffarian D, Roger VL, Benjamin EJ, Berry JD, Blaha MJ, et al. Heart disease and stroke statistics 2014 update: a report from the American Heart Association. Circulation 2014;129(3):e Satia JA, Galanko JA, Neuhouser ML. Food nutrition label use is associated with demographic, behavioral, and psychosocial factors and dietary intake among African Americans in North Carolina. J Am Diet Assoc 2005;105(3): , discussion Macon JF, Oakland MJ, Jensen HH, Kissack PA. Food label use by older Americans: data from the Continuing Survey of Food Intakes by Individuals and the Diet and Health Knowledge Survey J Nutr Elder 2004;24(1): Nayga RMJr. Nutrition knowledge, gender, and food label use. J Consum Aff 2000;34(1): International Food Information Council Foundation. 2011Food & Health Survey: consumer attitudes toward food safety, nutrition and health %20IFIC%20FDTN%20Food%20and%20Health%20Sur vey.pdf. Accessed November 20, Institute of Medicine. Examination of front-of-package nutrition rating systems and symbols. Washington (DC): The National Academies Press; openbook.php?record_id= Accessed April 10, Centers for Disease Control and Prevention 5
7 Tables Table 1. Confusion About and Knowledge of Sodium Information on Food Labels Among Selected Respondents (n = 3,729) to ConsumerStyles and HealthStyles Surveys, 2010 a Characteristic I am confused about how to figure out how much sodium is in the food I eat. I am confused about how to use Nutrition Facts label to figure out how much sodium is in the food I eat. I know how to monitor the amount of salt I eat based on the information provided on nutrition labels. Agree, % (95% CI) b AOR (95% CI) Agree, % (95% CI) b AOR (95% CI) Agree, %(95% CI) b AOR (95% CI) Overall 19.3 ( ) 13.2 ( ) 55.8 ( ) Age, y ( ) c 1.0 [Reference] 10.8 ( ) d 1.0 [Reference] 53.8 ( ) c 1.0 [Reference] ( ) 1.05 ( ) 16.0 ( ) 1.7 ( ) 60.5 ( ) 1.2 ( ) ( ) 1.9 ( ) 20.0 ( ) 2.3 ( ) 54.5 ( ) 0.9 ( ) Sex Male 19.1 ( ) 1.0 [Reference] 12.7 ( ) 1.0 [Reference] 51.7 ( ) e 1.0 [Reference] Female 19.5 ( ) 1.05 ( ) 13.7 ( ) 1.1 ( ) 59.7 ( ) 1.5 ( ) Race/ethnicity White, non- Hispanic Black, non- Hispanic 16.5 ( ) d 1.0 [Reference] 11.5 ( ) e 1.0 [Reference] 58.1 ( ) 1.0 [Reference] 31.4 ( ) 2.1 ( ) 17.5 ( ) 1.5 ( ) 50.4 ( ) 0.7 ( ) Hispanic 22.0 ( ) 1.4 ( ) 16.0 ( ) 1.4 ( ) 50.4 ( ) 0.8 ( ) Other f 23.9 ( ) 1.6 ( ) 19.6 ( ) 1.8 ( ) 51.3 ( ) 0.8 ( ) Annual household income, $ <15, ( ) d 1.9 ( ) 23.6 ( ) d 1.8 ( ) 53.4 ( ) c 0.9 ( ) 15,000 24, ,000 39, ,000 59, ( ) 0.9 ( ) 20.0 ( ) 1.5 ( ) 61.4 ( ) 1.2 ( ) 20.5 ( ) 1.06 ( ) 13.2 ( ) 1.1 ( ) 46.9 ( ) 0.7 ( ) 16.4 ( ) 0.9 ( ) 9.9 ( ) 0.8 ( ) 54.0 ( ) 0.8 ( ) 60, ( ) 1.0 [Reference] 10.0 ( ) 1.0 [Reference] 59.0 ( ) 1.0 [Reference] Education level Abbreviations: AOR, adjusted odds ratio; CI, confidence interval. a All estimates are weighted for age, sex, race/ethnicity, annual household income, and household size. The model included age, sex, race/ethnicity, annual household income, education level, region of residence, body mass index, smoking status, diagnosis of diabetes, and diagnosis of high blood pressure. b Responses were offered on a 5-point Likert scale of strongly agree, moderately agree, somewhat agree, neither agree nor disagree and disagree. Strongly agree, moderately agree, and somewhat agree were combined into one agree category. c χ 2 test P <.05. d χ 2 test P <.001. e χ 2 test P <.01. f Other race includes Alaska Native, American Indian, Asian, Native Hawaiian, and Other Pacific Islander. g The possible responses to the question on smoking were the following: former smoker, nonsmoker, and smoker. The categories nonsmoker and former smoker were combined. (continued on next page) Centers for Disease Control and Prevention 7
8 (continued) Table 1. Confusion About and Knowledge of Sodium Information on Food Labels Among Selected Respondents (n = 3,729) to ConsumerStyles and HealthStyles Surveys, 2010 a Characteristic High school graduate I am confused about how to figure out how much sodium is in the food I eat. I am confused about how to use Nutrition Facts label to figure out how much sodium is in the food I eat. I know how to monitor the amount of salt I eat based on the information provided on nutrition labels. Agree, % (95% CI) b AOR (95% CI) Agree, % (95% CI) b AOR (95% CI) Agree, %(95% CI) b AOR (95% CI) 25.6 ( ) d 1.7 ( ) 18.5 ( ) d 1.9 ( ) 54.0 ( ) c 0.8 ( ) Some college 19.7 ( ) 1.4 ( ) 14.0 ( ) 1.6 ( ) 53.1 ( ) 0.7 ( ) College graduate Region 13.9 ( ) 1.0 [Reference] 8.2 ( ) 1.0 [Reference] 60.5 ( ) 1.0 [Reference] Northeast 18.1 ( ) 0.98 ( ) 14.5 ( ) 1.1 ( ) 56.4 ( ) 0.9 ( ) Midwest 19.1 ( ) 0.99 ( ) 11.0 ( ) 0.8 ( ) 53.2 ( ) 0.9 ( ) South 20.8 ( ) 1.0 [Reference] 14.2 ( ) 1.0 [Reference] 56.8 ( ) 1.0 [Reference] West 17.6 ( ) 0.9 ( ) 12.8 ( ) 0.9 ( ) 56.7 ( ) 1.0 ( ) Body mass index, kg/m 2 < ( ) c 1.0 [Reference] 12.1 ( ) c 1.0 [Reference] 56.7 ( ) 1.0 [Reference] ( ) 1.1 ( ) 11.1 ( ) 0.9 ( ) 54.9 ( ) 1.0 ( ) ( ) 1.3 ( ) 16.3 ( ) 1.3 ( ) 56.0 ( ) 0.9 ( ) Current smoking status g No 19.0 ( ) 1.0 [Reference] 12.6 ( ) 1.0 [Reference] 56.2 ( ) 1.0 [Reference] Yes 21.0 ( ) 1.1 ( ) 16.5 ( ) 1.3 ( ) 54.2 ( ) 0.98 ( ) Diagnosed diabetes No 17.9 ( ) d 1.0 [Reference] 12.3 ( ) d 1.0 [Reference] 55.3 ( ) 1.0 [Reference] Yes 29.7 ( ) 1.5 ( ) 20.1 ( ) 1.2 ( ) 59.7 ( ) 1.2 ( ) Diagnosed high blood pressure No 17.6 ( ) c 1.0 [Reference] 11.9 ( ) e 1.0 [Reference] 55.0 ( ) 1.0 [Reference] Yes 23.5 ( ) 1.0 ( ) 16.5 ( ) 0.9 ( ) 58.0 ( ) 1.1 ( ) Abbreviations: AOR, adjusted odds ratio; CI, confidence interval. a All estimates are weighted for age, sex, race/ethnicity, annual household income, and household size. The model included age, sex, race/ethnicity, annual household income, education level, region of residence, body mass index, smoking status, diagnosis of diabetes, and diagnosis of high blood pressure. b Responses were offered on a 5-point Likert scale of strongly agree, moderately agree, somewhat agree, neither agree nor disagree and disagree. Strongly agree, moderately agree, and somewhat agree were combined into one agree category. c χ 2 test P <.05. d χ 2 test P <.001. e χ 2 test P <.01. f Other race includes Alaska Native, American Indian, Asian, Native Hawaiian, and Other Pacific Islander. g The possible responses to the question on smoking were the following: former smoker, nonsmoker, and smoker. The categories nonsmoker and former smoker were combined. 8 Centers for Disease Control and Prevention
9 Table 2. Consumer Use of Food Labels to Monitor Dietary Sodium Intake Among Selected Respondents (n = 3,729) to ConsumerStyles and HealthStyles Surveys, 2010 a Characteristic I specifically buy foods labeled low or reduced salt/sodium. I check nutrition labels for sodium as a tactic to lower salt in my diet. Do you or the person who shops for your food buy items that are labeled low salt or low sodium. Agree, %(95% CI) b AOR (95% CI) Yes, % (95% CI) c AOR (95% CI) Yes, % (95% CI) c AOR (95% CI) Overall 35.6 ( ) 46.8 ( ) 57.9 ( ) Age, y ( ) d 1.0 [Reference] 43.3 ( ) e 1.0 [Reference] 52.4 ( ) e 1.0 [Reference] ( ) 1.4 ( ) 50.3 ( ) 1.2 ( ) 64.7 ( ) 1.4 ( ) ( ) 2.2 ( ) 58.1 ( ) 1.7 ( ) 72.0 ( ) 2.0 ( ) Sex Male 33.6 ( ) 1.0 [Reference] 43.3 ( ) d 1.0 [Reference] 56.7 ( ) 1.0 [Reference] Female 37.4 ( ) 1.2 ( ) 50.0 ( ) 1.4 ( ) 59.1 ( ) 1.1 ( ) Race/ethnicity White non- Hispanic Black non- Hispanic 33.2 ( ) d 1.0 [Reference] 46.6 ( ) 1.0 [Reference] 56.1 ( ) e 1.0 [Reference] 46.2 ( ) 1.7 ( ) 48.7 ( ) 1.1 ( ) 72.2 ( ) 2.1 ( ) Hispanic 35.8 ( ) 1.2 ( ) 45.3 ( ) 0.9 ( ) 60.1 ( ) 1.2 ( ) Other f 43.5 ( ) 2.0 ( ) 49.7 ( ) 1.3 ( ) 47.8 ( ) 0.8 ( ) Annual household income, $ <15, ( ) 1.1 ( ) 48.9 ( ) g 1.2 ( ) 57.3 ( ) 0.8 ( ) 15,000 24, ( ) 0.8 ( ) 35.2 ( ) 0.6 ( ) 55.2 ( ) 0.8 ( ) 25,000 39, ( ) 1.4 ( ) 53.0 ( ) 1.3 ( ) 60.2 ( ) 1.04 ( ) 40,000 59, ( ) 1.3 ( ) 48.1 ( ) 1.1 ( ) 59.1 ( ) 1.05 ( ) 60, ( ) 1.0 [Reference] 46.5 ( ) 1.0 [Reference] 57.6 ( ) 1.0 [Reference] Education level High school graduate 35.1 ( ) 0.9 ( ) 40.8 ( ) g 0.7 ( ) 55.8 ( ) 0.9 ( ) Some college 36.3 ( ) 1.1 ( ) 49.9 ( ) 1.1 ( ) 58.6 ( ) 1.00 ( ) College graduate 35.1 ( ) 1.0 [Reference] 47.7 ( ) 1.0 [Reference] 58.8 ( ) 1.0 [Reference] Abbreviations: AOR, adjusted odds ratio; CI, confidence interval. a Estimate percentages are weighted for age, sex, race/ethnicity, annual household income, and household size. The model included age, sex, race/ ethnicity, annual household income, education level, region of residence, body mass index, smoking status, diagnosis of diabetes, and diagnosis of high blood pressure. b Responses were offered on a 5-point Likert scale of strongly agree, moderately agree, somewhat agree, neither agree nor disagree and disagree. Strongly agree, moderately agree, and somewhat agree were combined into 1 agree category. c Questions were answered as yes or no. d χ 2 test P <.01. e χ 2 test P <.001. f Other race includes Alaska Native, American Indian, Asian, Native Hawaiian, and Other Pacific Islander. g χ 2 test P <.05. h The possible responses to the question on smoking were the following: former smoker, nonsmoker, and smoker. The categories nonsmoker and former smoker were combined. (continued on next page) Centers for Disease Control and Prevention 9
10 (continued) Table 2. Consumer Use of Food Labels to Monitor Dietary Sodium Intake Among Selected Respondents (n = 3,729) to ConsumerStyles and HealthStyles Surveys, 2010 a Characteristic Region I specifically buy foods labeled low or reduced salt/sodium. I check nutrition labels for sodium as a tactic to lower salt in my diet. Do you or the person who shops for your food buy items that are labeled low salt or low sodium. Agree, %(95% CI) b AOR (95% CI) Yes, % (95% CI) c AOR (95% CI) Yes, % (95% CI) c AOR (95% CI) Northeast 36.2 ( ) 1.1 ( ) 48.5 ( ) 1.1 ( ) 62.8 ( ) g 1.2 ( ) Midwest 34.2 ( ) 1.0 ( ) 44.5 ( ) 0.9 ( ) 51.2 ( ) 0.8 ( ) South 36.6 ( ) 1.0 [Reference] 46.6 ( ) 1.0 [Reference] 59.2 ( ) 1.0 [Reference] West 34.6 ( ) 0.9 ( ) 48.7 ( ) 1.04 ( ) 59.3 ( ) 1.1 ( ) Body mass index, kg/m 2 < ( ) 1.0 [Reference] 47.2 ( ) 1.0 [Reference] 54.3 ( ) 1.0 [Reference] ( ) 0.9 ( ) 46.6 ( ) 0.9 ( ) 57.5 ( ) 1.03 (0.8, 1.4) ( ) 0.9 ( ) 46.7 ( ) 0.9 ( ) 61.8 ( ) 1.2 ( ) Current smoking status h No 37.2 ( ) d 1.0 [Reference] 48.1 ( ) g 1.0 [Reference] 59.5 ( ) d 1.0 [Reference] Yes 27.0 ( ) 0.7 ( ) 40.3 ( ) 0.8 ( ) 49.6 ( ) 0.8 ( ) Diagnosed diabetes No 34.1 ( ) e 1.0 [Reference] 45.7 ( ) d 1.0 [Reference] 56.0 ( ) e 1.0 [Reference] Yes 47.1 ( ) 1.2 ( ) 55.3 ( ) 1.3 ( ) 72.4 ( ) 1.5 ( ) Diagnosed high blood pressure No 31.2 ( ) e 1.0 [Reference] 44.7 ( ) d 1.0 [Reference] 53.8 ( ) e 1.0 [Reference] Yes 46.8 ( ) 1.6 ( ) 52.1 ( ) 1.2 ( ) 68.4 ( ) 1.4 ( ) Abbreviations: AOR, adjusted odds ratio; CI, confidence interval. a Estimate percentages are weighted for age, sex, race/ethnicity, annual household income, and household size. The model included age, sex, race/ ethnicity, annual household income, education level, region of residence, body mass index, smoking status, diagnosis of diabetes, and diagnosis of high blood pressure. b Responses were offered on a 5-point Likert scale of strongly agree, moderately agree, somewhat agree, neither agree nor disagree and disagree. Strongly agree, moderately agree, and somewhat agree were combined into 1 agree category. c Questions were answered as yes or no. d χ 2 test P <.01. e χ 2 test P <.001. f Other race includes Alaska Native, American Indian, Asian, Native Hawaiian, and Other Pacific Islander. g χ 2 test P <.05. h The possible responses to the question on smoking were the following: former smoker, nonsmoker, and smoker. The categories nonsmoker and former smoker were combined. 10 Centers for Disease Control and Prevention
11 Appendix. Comparison of Study Participants Whose Data Were Included in Analyses (n = 3,729) and Study Participants Who Were Excluded (n = 469), HealthStyles 2010 Characteristic Age, y Included (n = 3,729) a Excluded (n = 469) N b % c (95% CI) N b % c (95% CI) , ( ) ( ) , ( ) ( ) ( ) ( ) Sex Male 1, ( ) ( ) Female 1, ( ) ( ) Race/ethnicity White non-hispanic 2, ( ) ( ) Black non-hispanic ( ) ( ) Hispanic ( ) ( ) Other d ( ) ( ) Annual household income, $ <15, ( ) ( ) 15,000 24, ( ) ( ) 25,000 39, ( ) ( ) 40,000 59, ( ) ( ) 60,000 1, ( ) ( ) Education level High school graduate ( ) ( ) Some college 1, ( ) ( ) College graduate 1, ( ) ( ) Region Northeast ( ) ( ) Midwest ( ) ( ) South 1, ( ) ( ) West ( ) ( ) Body mass index, kg/m 2 χ 2 P Value Abbreviation: CI, confidence interval. a In this study, we linked the HealthStyles and ConsumerStyles data to obtain data on sodium questions of interest. Among 4,198 HealthStyles participants, we excluded 28 (0.7%) respondents who did not have education information and 441 (10.5%) who had incomplete data on all study questions. The final sample was 3,729. b Unweighted. c All estimates are weighted for age, sex, race/ethnicity, annual household income, and household size. d Other race includes Alaska Native, American Indian, Asian, Native Hawaiian, and Other Pacific Islander. e The possible responses to the question on smoking were the following: former smoker, nonsmoker, and smoker. The categories nonsmoker and former smoker were combined. < < (continued on next page) Centers for Disease Control and Prevention 11
12 (continued) Characteristic Included (n = 3,729) a Excluded (n = 469) N b % c (95% CI) N b % c (95% CI) < , ( ) ( ) ( ) ( ) , ( ) ( ) Current smoking status e Yes ( ) ( ) No ( ) ( ) Diabetes diagnosis No 3, ( ) ( ) Yes ( ) ( ) Hypertension diagnosis No 2, ( ) ( ) Yes 1, ( ) ( ) χ 2 P Value Abbreviation: CI, confidence interval. a In this study, we linked the HealthStyles and ConsumerStyles data to obtain data on sodium questions of interest. Among 4,198 HealthStyles participants, we excluded 28 (0.7%) respondents who did not have education information and 441 (10.5%) who had incomplete data on all study questions. The final sample was 3,729. b Unweighted. c All estimates are weighted for age, sex, race/ethnicity, annual household income, and household size. d Other race includes Alaska Native, American Indian, Asian, Native Hawaiian, and Other Pacific Islander. e The possible responses to the question on smoking were the following: former smoker, nonsmoker, and smoker. The categories nonsmoker and former smoker were combined Centers for Disease Control and Prevention
13 "This course was developed from the document: Reported Use and Perceived Understanding of Sodium Information on US Nutrition Labels Levings JL, Maalouf J, Tong X, Cogswell ME, Preventing Chronic Disease 2015;12: DOI:
Food Labeling Survey ~ January 2019
 Food Labeling Survey ~ January 2019 1 Introduction Research Objective Understand consumer attitudes towards healthy labels and different food packaging aspects that drive purchase behavior. Sampling Research
Sodium Reduction: A Public Health Imperative
 Sodium Reduction: A Public Health Imperative Darwin R. Labart he, MD, MPH, PhD Director, Division for Heart Disease and Stroke Prevention National Center for Chronic Disease Prevention and Health Promotion
Wickramasekaran, R.N., Gase, L.N., Green, G., Wood, M., Kuo, T./ Californian Journal of Health Promotion 2016, Volume 14, Issue 2,
 Consumer Knowledge, Attitudes, and Behaviors of Sodium Intake and Reduction Strategies in Los Angeles County: Results of an Internet Panel Survey (2014-2015) Ranjana N. Wickramasekaran 1, Lauren N. Gase
Consumer Sodium Research
 Consumer Sodium Research Concern, Perceptions and Action April 2009 125 CambridgePark Drive Cambridge, MA 02140 www.cogentresearch.com TABLE OF CONTENTS 2 OBJECTIVES & METHODOLOGY EXECUTIVE SUMMARY RESEARCH
Judy Kruger, PhD, MS, Deborah A. Galuska, PhD, MPH, Mary K. Serdula, MD, MPH, Deborah A. Jones, PhD
 Attempting to Lose Weight Specific Practices Among U.S. Adults Judy Kruger, PhD, MS, Deborah A. Galuska, PhD, MPH, Mary K. Serdula, MD, MPH, Deborah A. Jones, PhD Background: Methods: Results: Conclusions:
Wellness Coaching for People with Prediabetes
 Wellness Coaching for People with Prediabetes PUBLIC HEALTH RESEARCH, PRACTICE, AND POLICY Volume 12, E207 NOVEMBER 2015 ORIGINAL RESEARCH Wellness Coaching for People With Prediabetes: A Randomized Encouragement
Milk Taste Test. Prepared by Shelley Kuklish Epidemiologist. September 2008
 Milk Taste Test 2008 Prepared by Shelley Kuklish Epidemiologist September 2008 Table of Contents Executive Summary..3 Introduction...6 Methods.. 6 Results. 7 Conclusions.. 12 2 Executive Summary The purpose
2017 FOOD & HEALTH SURVEY A Focus on Older Adults Funded by
 A Focus on Older Adults 50-80 TABLE OF CONTENTS Background & Methodology 3 Demographics 4 Healthy Eating 7 Food Confusion 23 Packaged Foods 32 Food Values 37 Background The International Food Information
Current CDC Efforts Concerning Sodium Intake
 Current CDC Efforts Concerning Sodium Intake Robert K. Merritt Chief & Supervisory Health Scientist Epidemiology & Surveillance Branch Division for Heart Disease and Stroke Prevention National Center for
Diet Quality and History of Gestational Diabetes
 Diet Quality and History of Gestational Diabetes PUBLIC HEALTH RESEARCH, PRACTICE, AND POLICY Volume 12, E25 FEBRUARY 2015 ORIGINAL RESEARCH Diet Quality and History of Gestational Diabetes Mellitus Among
Hypertension awareness, treatment, and control
 O r i g i n a l P a p e r Prevalence of Self-Reported High Blood Pressure Awareness, Advice Received From Health Professionals, and Actions Taken to Reduce High Blood Pressure Among US Adults Healthstyles
EFFECTIVE TOOLSAND STRATEGIES
 Topics of Professional Interest Including Added Sugars on the Nutrition Facts Panel: How Consumers Perceive the Proposed Change EFFECTIVE TOOLSAND STRATEGIES for the prevention of chronic disease and the
Knowledge, Attitude and Practice between Medical and Non-Medical Sciences Students about Food Labeling
 ORIGINAL ARTICLE Open Access Knowledge, Attitude and Practice between Medical and Non-Medical Sciences Students about Food Labeling Aida Malek Mahdavi 1, Paria Abdolahi 1, * Reza Mahdavi 2 1 Student Research
Instructions: Please respond to each question as accurately as possible. There may be questions where you may indicate more than one response.
 Thank you for agreeing to participate in in the Assessing faculty knowledge, skills and attitudes about oral health and primary care integration survey. Instructions: Please respond to each question as
PERSPECTIVE A HEALTHY 2017 FOOD & HEALTH SURVEY
 A HEALTHY PERSPECTIVE Healthy is often at the heart of our discussions about food. Still, how Americans think about healthy in the context of dietary decisions remains hotly debated. Defining Healthy Health-promoting
MILLENNIALS AND ORANGE JUICE CONSUMPTION
 MILLENNIALS AND ORANGE JUICE CONSUMPTION Yan Heng, PhD and Lisa House, PhD Presented to the International Citrus Beverage Conference Florida Agricultural Market Research Center Food and Resource Economics
Demographics and Health Data
 Demographics and Health Data Information for Local Planners City of Puyallup, WA Demographic Characteristics Environmental Health Division 3629 South D Street, Tacoma, WA 98418 (253) 798-6470 Table 1 presents
Arizona Youth Tobacco Survey 2005 Report
 Arizona Department of Health Services Arizona Department of Health Services Arizona Youth Tobacco Survey 25 Report November 26 Office of Tobacco Education and Prevention Program Prepared by: Evaluation,
Perceptions of Obesity Risk & Prevention in Chinese Americans
 Perceptions of Obesity Risk & Prevention in Chinese Americans Dr. Doreen Liou Dr. Kathleen Bauer Montclair State University Department of Health & Nutrition Sciences Montclair, New Jersey Obesity is a
Demographics and Health Data
 Demographics and Health Data Information for Local Planners City of Lakewood, WA Demographic Characteristics Environmental Health Division 3629 South D Street, Tacoma, WA 98418 (253) 798-6470 Table 1 presents
It Is All About Food. International Food Information Council Foundation. Framework for Healthful Eating:
 Framework for Healthful Eating: The 2010 Dietary Guidelines for Americans, MyPlate, and Consumer Insight VSFA / Virginia Tech Nutrition Cow College Roanoke, VA February 15, 2012 Presented by : Marianne
birthplace and length of time in the US:
 Cervical cancer screening among foreign-born versus US-born women by birthplace and length of time in the US: 2005-2015 Meheret Endeshaw, MPH CDC/ASPPH Fellow Division Cancer Prevention and Control Office
Household Spending on Alcoholic Beverages by Demographic Characteristic, 2013
 Household Spending on Alcoholic Beverages by Demographic Characteristic, 2013 Spending by Age The biggest spenders on alcoholic beverages are householders aged 45 to 54, who spend 22 percent more than
Flavoured non-cigarette tobacco product use among US adults:
 Additional material is published online only. To view please visit the journal online (http://dx.doi.org/10.1136/ tobaccocontrol-2016-053373). 1 Food and Drug Administration, Center for Tobacco Products,
EATING WELL AND PAYING LESS: A POSITIVE DEVIANCE STUDY. Cara Davis
 EATING WELL AND PAYING LESS: A POSITIVE DEVIANCE STUDY Cara Davis A Thesis Submitted In Partial Fulfillment of the Requirements for the Degree of Master of Public Health University of Washington 2014 Committee:
Predictors of Perceived Risk of the Development of Diabetes
 Predictors of Perceived Risk of the Development of Diabetes Joanne Gallivan, MS, RD, Clarice Brown, MS, Rachel Greenberg, MA, and Charles M. Clark, Jr., MD Adress correspondence to Clarice Brown, MS, Social
Thyroid cancer in the United States: Recent increases
 Thyroid cancer in the United States: Recent increases Meg Watson Epidemiology and Applied Research Branch Division of Cancer Prevention and Control CDC NAACCR Annual Conference June 22, 2011 National Center
Health Impact Assessment
 EMBARGOED UNTIL TUESDAY, JUNE 26 AT 12:01 AM EST. Health Impact Assessment National Nutrition Standards for Snack and a la Carte Foods and Beverages Sold in Schools Executive Summary Introduction The foods
Hong Huang School of Information, University of South Florida, Tampa, FL, USA. ABSTRACT
 SOCIOECONOMIC STATUS, ATTITUDES ON USE OF HEALTH INFORMATION, PREVENTIVE BEHAVIORS, AND COMPLEMENTARY AND ALTERNATIVE MEDICAL THERAPIES: USING A U.S. NATIONAL REPRESENTATIVE SAMPLE Yiu Ming Chan Department
UKnowledge. University of Kentucky. Seth Siameh University of Kentucky. Theses and Dissertations--Public Health (M.P.H. & Dr.P.H.)
") University of Kentucky UKnowledge Theses and Dissertations--Public Health (M.P.H. & Dr.P.H.) College of Public Health 2016 EXAMINING ASSOCIATIONS BETWEEN PREVALENCE OF CHRONIC OBSTRUCTIVE PULMONARY DISEASE
University of Kentucky UKnowledge Theses and Dissertations--Public Health (M.P.H. & Dr.P.H.) College of Public Health 2016 EXAMINING ASSOCIATIONS BETWEEN PREVALENCE OF CHRONIC OBSTRUCTIVE PULMONARY DISEASE
Handouts for Lesson 7 1 SHOPPING SMART
 FY240 Handouts for Lesson 7 1 SHOPPING SMART Linda B. Bobroff 2 1. This document is FCS8648, one of a series of the Department of Family, Youth and Community Sciences, Florida Cooperative Extension Service,
Looking Toward State Health Assessment.
 CONNECTICUT DEPARTMENT OF PUBLIC HEALTH Policy, Planning and Analysis. Looking Toward 2000 - State Health Assessment. Table of Contents Glossary Maps Appendices Publications Public Health Code PP&A Main
Health Status Disparities in New Mexico Identifying and Prioritizing Disparities
 Health Status Disparities in New Mexico Identifying and Prioritizing Disparities Public Health Division March 23 Health Status Disparities in New Mexico Identifying and Prioritizing Disparities New Mexico
CHS 2009 Baltimore City Community Health Survey: Summary Results Report
 CHS 2009 Baltimore City Community Health Survey: Summary Results Report About the Survey: A representative sample of 1,134 Baltimore residents participated in the Community Health Survey The survey reached
AWASH - Consumer survey findings SURVEY OF AUSTRALIAN CONSUMER AWARENESS AND PRACTICES RELATING TO SALT REPORT
 2007 SURVEY OF AUSTRALIAN CONSUMER AWARENESS AND PRACTICES RELATING TO SALT REPORT Prepared by: The Secretariat of the Australian Division of World Action on Salt and Health This report was published in
Trends in the Prevalence of Hypertension, Classification of Blood Pressure for Adults 1
 DRAFT 15 November 2007 the silent killer: hypertension in los angeles county adults Introduction Hypertension (or high blood pressure) is often called the silent killer because many people have the disease
CHRONIC DISEASE PREVALENCE AMONG ADULTS IN OHIO
 OHIO MEDICAID ASSESSMENT SURVEY 2012 Taking the pulse of health in Ohio CHRONIC DISEASE PREVALENCE AMONG ADULTS IN OHIO Amy Ferketich, PhD Ling Wang, MPH The Ohio State University College of Public Health
Some college. Native American/ Other. 4-year degree 13% Grad work
 Access to Affordable Health Care Access to affordable care improves quality of life and health outcomes. Without affordable access to a doctor, residents are more likely to end up in expensive emergency
Adult Immunization: CDC Communication Efforts and the Consumer Perspective
 Adult Immunization: CDC Communication Efforts and the Consumer Perspective Kristine Sheedy, PhD Associate Director for Communication Science National Center for Immunization and Respiratory Diseases Office
WASHINGTON STATE COMPARISONS TO: KITSAP COUNTY CORE PUBLIC HEALTH INDICATORS May 2015
 WASHINGTON STATE COMPARISONS TO: KITSAP COUNTY CORE PUBLIC HEALTH INDICATORS This is a companion document to the Core Public Health Indicators that provides a comparison of to Washington State for the
Greater Atlanta Affiliate of Susan G. Komen Quantitative Data Report
 Greater Atlanta Affiliate of Susan G. Komen Quantitative Data Report 2015-2019 Contents 1. Purpose, Intended Use, and Summary of Findings... 4 2. Quantitative Data... 6 2.1 Data Types... 6 2.2 Breast Cancer
Work-Time Snack Habits and Vending Machine Use Survey2
 Work-Time Snack Habits and Vending Machine Use Survey2 SNACK HABITS: This section asks about the types of snacks you have at work. Please mark how often you have them. Salty Snacks: Popcorn, chips, chex
Nutritional Labeling. University of Connecticut. Emily J. Williams University of Connecticut - Storrs,
 University of Connecticut DigitalCommons@UConn Honors Scholar Theses Honors Scholar Program Spring 5-8-2011 Nutritional Labeling Emily J. Williams University of Connecticut - Storrs, emjw718@gmail.com
Marc J. Tassé, PhD Nisonger Center UCEDD
 FINALLY... AN ADAPTIVE BEHAVIOR SCALE FOCUSED ON PROVIDING PRECISION AT THE DIAGNOSTIC CUT-OFF. How Item Response Theory Contributed to the Development of the DABS Marc J. Tassé, PhD UCEDD The Ohio State
Hae Won KIM. KIM Reproductive Health (2015) 12:91 DOI /s x
 12:91 DOI /s x") KIM Reproductive Health (2015) 12:91 DOI 10.1186/s12978-015-0076-x RESEARCH Open Access Sex differences in the awareness of emergency contraceptive pills associated with unmarried Korean university students
KIM Reproductive Health (2015) 12:91 DOI 10.1186/s12978-015-0076-x RESEARCH Open Access Sex differences in the awareness of emergency contraceptive pills associated with unmarried Korean university students
Survey of U.S. Adult Cigarette Smokers
 Survey of U.S. Adult Cigarette Smokers Topline Report 13 October 2016 ADULT CIGARETTE SMOKERS (U.S. NATIONWIDE): n=1,000 online surveys S1. First, which of the following ranges includes your age? 0% Under
Current Cigarette Smoking Among Workers in Accommodation and Food Services United States,
 Current Cigarette Among Workers in Accommodation and Food Services United States, 2011 2013 Girija Syamlal, MPH 1 ; Ahmed Jamal, MBBS 2 ; Jacek M. Mazurek, MD 1 (Author affiliations at end of text) Tobacco
Infertility services reported by men in the United States: national survey data
 MALE FACTOR Infertility services reported by men in the United States: national survey data John E. Anderson, Ph.D., Sherry L. Farr, Ph.D., M.S.P.H., Denise J. Jamieson, M.D., M.P.H., Lee Warner, Ph.D.,
Food Labels and Weight Loss:
 Food Labels and Weight Loss: Evidence from the National Longitudinal Survey of Youth Bidisha Mandal Washington State University AAEA 08, Orlando Motivation Who reads nutrition labels? Any link with body
Racial Differences in the Prevalence of Depressive Disorders Among U.S. Adult Population
 Georgia State University ScholarWorks @ Georgia State University Mathematics Theses Department of Mathematics and Statistics Fall 12-11-2012 Racial Differences in the Prevalence of Depressive Disorders
Public Opinion Survey on Tobacco Use in Outdoor Dining Areas Survey Specifications and Training Guide
 Public Opinion Survey on Tobacco Use in Outdoor Dining Areas Survey Specifications and Training Guide PURPOSE OF SPECIFICATIONS AND TRAINING GUIDE This guide explains how to use the public opinion survey
A Survey of Public Opinion on Secondhand Smoke Related Issues in Bourbon County, KY
 A Survey of Public Opinion on Secondhand Smoke Related Issues in Bourbon County, KY Findings Presented by Bourbon County Health Department with a grant from the Kentucky Department for Public Health Survey
Oregon Asthma Surveillance Summary Report August 2006
 Oregon Asthma Surveillance Summary Report August 26 Oregon Asthma Program Office of Disease Prevention and Epidemiology Public Health Services Oregon Department of Human Services Mel Kohn, MD, MPH, State
Center for Urban Initiatives and Research Wisconsin Public Health Survey December 2011 N=626. Frequency Tables (Weighted)
") Center for Urban Initiatives and Research Wisconsin Public Health Survey December 2011 N=626 Tables (Weighted) Section 1: Opinions about chronic disease, health care funding, and chronic disease-related
Center for Urban Initiatives and Research Wisconsin Public Health Survey December 2011 N=626 Tables (Weighted) Section 1: Opinions about chronic disease, health care funding, and chronic disease-related
Americans Current Views on Smoking 2013: An AARP Bulletin Survey
 Americans Current Views on Smoking 2013: An AARP Bulletin Survey November 2013 Americans Current Views on Smoking 2013: An AARP Bulletin Survey Report Prepared by Al Hollenbeck, Ph.D. Copyright 2013 AARP
Obesity in Cleveland Center for Health Promotion Research at Case Western Reserve University. Weight Classification of Clevelanders
 Obesity in Cleveland 2005-2006 March 2008 Report Contents Weight Classification of Clevelanders Local, State and National Trends in the Prevalence of Obesity Obesity by Demographic Characteristics Nutrition,
Sodium Reduction: Legal & Policy Options for State & Local Authorities
 Sodium Reduction: Legal & Policy Options for State & Local Authorities Shari A. Dawkins, JD, MPH Public Health Law Center August 21, 2013 Visiting Attorney Fellow Overview Sodium Consumption as a public
IFIC Foundation Survey
 IFIC Foundation Survey Research with Consumers To Test Perceptions and Reactions To Various Stimuli and Visuals Related to Bioengineered Foods June 2018 1 Introduction Research Objectives Measure consumers
Sugar-sweetened Beverage Taxes, Consumption and Obesity. Webinar
 Sugar-sweetened Beverage Taxes, Consumption and Obesity Lisa M. Powell, PhD Distinguished Professor and Director Health Policy and Administration School of Public Health Webinar Healthy Food Retail Policy
PRENATAL/POSTPARTUM SURVEY FOR HEALTH DEPARTMENT STAFF
 PRENATAL/POSTPARTUM SURVEY FOR HEALTH DEPARTMENT STAFF GENERAL INFORMATION 1. Date: TREATING PREGNANT/POSTPARTUM SMOKERS IN YOUR WORKPLACE 2. Please estimate the following for your workplace: a. What percentage
DEPRESSION AND ANXIETY STATUS IN KANSAS
 DEPRESSION AND ANXIETY STATUS IN KANSAS 2011 Behavioral Risk Factor Surveillance System This report was prepared by the Bureau of Health Promotion, Kansas Department of Health and Environment February
CHD in Race & Ethnicity. Gettyimages.com
 CHD in Race & Ethnicity Gettyimages.com Of all the forms of inequality, injustice in health care is the most inhumane. Martin Luther King, Jr. D e a t h s I n LEADING CAUSE OF DEATH FOR ALL MALES AND FEMALES
Fast-Food Consumption and Obesity Among Michigan Adults
 , A71 ORIGINAL RESEARCH Fast-Food Consumption and Obesity Among Michigan Adults Beth Anderson, MPH; Ann P. Rafferty, PhD; Sarah Lyon-Callo, MA, MS; Christopher Fussman, MS; Gwendoline Imes, MS, RD Suggested
SELF-REPORTED HEART DISEASE AMONG ARAB AND CHALDEAN AMERICAN WOMEN RESIDING IN SOUTHEAST MICHIGAN
 SELF-REPORTED HEART DISEASE AMONG ARAB AND CHALDEAN AMERICAN WOMEN RESIDING IN SOUTHEAST MICHIGAN Objectives: This study estimates the prevalence of heart disease among Arab and Chaldean American women
Conceptual framework! Definitions of race and ethnicity Census Questions, Genetics! Social Class, migration, language proficiency!
 Conceptual framework! Definitions of race and ethnicity Census Questions, Genetics! Social Class, migration, language proficiency! Patient-physician communication! Clinical Research Examples! Options for
Attitudes Toward Smoking Restrictions in Work Sites, Restaurants, and Bars Among North Carolinians. Abstract
 ORIGINAL ARTICLE Attitudes Toward Smoking Restrictions in Work Sites, Restaurants, and Bars Among North Carolinians Rachel Loflin Maguire, Jason Brinkley, Christopher Mansfield Abstract Background Public
Sodium and Potassium Intake: NHANES and Other Data
 Sodium and Potassium Intake: NHANES and Other Data Sodium Mary (Molly) E. Cogswell, RN, DrPH Senior Scientist Division for Heart Disease and Stroke Prevention Centers for Disease Control and Prevention
Statistical Fact Sheet Populations
 Statistical Fact Sheet Populations At-a-Glance Summary Tables Men and Cardiovascular Diseases Mexican- American Males Diseases and Risk Factors Total Population Total Males White Males Black Males Total
Smoking Status and Body Mass Index in the United States:
 Smoking Status and Body Mass Index in the United States: 1996-2000 Jun Yang, MD, PhD and Gary Giovino, PhD Roswell Park Cancer Institute Elm and Carlton Streets Buffalo, NY 14263, USA Society for Research
Data Disaggregation to Inform Health Policy
 Data Disaggregation to Inform Health Policy Minh Wendt Data Policy Lead Division of Policy & Data Office of Minority Health Department of Health and Human Services The Report of the Secretary s Task Force
Highlights. Attitudes and Behaviors Regarding Weight and Tobacco. A scientific random sample telephone survey of 956 citizens in. Athens-Clarke County
 Highlights Attitudes and Behaviors Regarding Weight and Tobacco A scientific random sample telephone survey of 956 citizens in Athens-Clarke County July 2003 Northeast Health District Community Health
Cessation and Cessation Measures
 Cessation and Cessation Measures among Adult Daily Smokers: National and State-Specific Data David M. Burns, Christy M. Anderson, Michael Johnson, Jacqueline M. Major, Lois Biener, Jerry Vaughn, Thomas
Howard Memorial Hospital. Community Needs Assessment Summary
 Howard Memorial Hospital Community Needs Assessment Summary May 2013 Design and Purpose of the Survey Howard Memorial Hospital conducted a community needs assessment. Focus of the study was two-fold. First,
Geographical Accuracy of Cell Phone Samples and the Effect on Telephone Survey Bias, Variance, and Cost
 Geographical Accuracy of Cell Phone Samples and the Effect on Telephone Survey Bias, Variance, and Cost Abstract Benjamin Skalland, NORC at the University of Chicago Meena Khare, National Center for Health
Assistant Superintendent of Business &
 THE LAMPHERE SCHOOLS ADMINISTRATION CENTER 3121 Dorchester Madison Heights, Michigan 4871-199 Telephone: (248) 589-199 FAX: (248) 589-2618 DALE STEEN Superintendent Finance PATRICK DILLON Assistant Superintendent
Parental Attitudes toward Human Papilloma Virus Vaccine Participation of Adolescent Daughters in a Rural Population
 Diversity and Equality in Health and Care (2018) 15(4): 164-168 2018 Insight Medical Publishing Group Research Article Parental Attitudes toward Human Papilloma Virus Vaccine Participation of Adolescent
Regional and Hispanic Subgroup Disparities in the Prevalence of Diabetes & Hypertension Among Older Adults
 Regional and Hispanic Subgroup Disparities in the Prevalence of Diabetes & Hypertension Among Older Adults Catherine Pérez Jennifer A. Ailshire Conference Series on Aging in the Americas September 21,
Changing Patient Base. A Knowledge to Practice Program
 Changing Patient Base A Knowledge to Practice Program Learning Objectives By the end of this tutorial, you will: Understand how demographics are changing among patient populations Be aware of the resulting
i EVALUATING THE EFFECTIVENESS OF THE TAKE CONTROL PHILLY CONDOM MAILING DISTRIBUTION PROGRAM by Alexis Adams June 2014
 i EVALUATING THE EFFECTIVENESS OF THE TAKE CONTROL PHILLY CONDOM MAILING DISTRIBUTION PROGRAM by Alexis Adams June 2014 A Community Based Master s Project presented to the faculty of Drexel University
Attitudes about Smoking in the Movies
 Attitudes about Smoking in the Movies Robert Cameron McMillen, PhD Social Science Research Center, Mississippi State University Susanne Tanski, MD Pediatrics, Dartmouth Medical School Jonathan Winickoff,
Measuring Equitable Care to Support Quality Improvement
 Measuring Equitable Care to Support Quality Improvement Berny Gould RN, MNA Sr. Director, Quality, Hospital Oversight, and Equitable Care Prepared by: Sharon Takeda Platt, PhD Center for Healthcare Analytics
ILI Syndromic Surveillance
 ILI Syndromic Surveillance Race/ethnicity of adult respondents with influenza-like illness (ILI) in the U.S., Behavioral Risk Factor Surveillance System (BRFSS), Sept 1- Sep 30, 2009 Race/ethnicity I
Support of local and national regulations and educational campaigns for reduction of population salt consumption.
 14-12 STATEMENT OF POLICY Salt Reduction Policy NACCHO supports local health department leadership in encouraging healthy eating practices in their communities. A healthy level of sodium consumption is
IS THERE A RELATIONSHIP BETWEEN EATING FREQUENCY AND OVERWEIGHT STATUS IN CHILDREN?
 IS THERE A RELATIONSHIP BETWEEN EATING FREQUENCY AND OVERWEIGHT STATUS IN CHILDREN? A Thesis submitted to the Faculty of the Graduate School of Arts and Sciences of Georgetown University in partial fulfillment
Clinical and Public Health Progress Each Contributed About Half to the 50% Reduction in Heart Disease Deaths, US,
 The Beat Goes On Kim La Croix, MPH, RD Nutrition Coordinator/Public Health Nutritionist Public Health Division Center for Prevention & Health Promotion Health Promotion Chronic Disease Prevention Objectives
Indiana Family Nutrition Program Fiscal Year Final Report
 Indiana Family Nutrition Program Fiscal Year 2011-2012 Final Report Submitted to: United States Department of Agriculture Food and Nutrition Service Chicago, Illinois Indiana Family and Social Services
Opinions on Smoking Issues in the Counties of Albany, Rensselaer, And Schenectady Counties
 Opinions on Smoking Issues in the Counties of Albany, Rensselaer, And Schenectady Counties A Survey Conducted June 15-18, 2008 Report: July 7, 2008 Jeff Stonecash Office: 315-443-3629 Fax: 315-443-9082
THE EMERGE SURVEY ON TAKING PART IN BIOBANK RESEARCH: VERSION A
 THE EMERGE SURVEY ON TAKING PART IN BIOBANK RESEARCH: VERSION A What is this survey about? This survey is about your views on taking part in medical research. We want to understand what you think about
Cooking Matters for Adults
 FY2017 Participant Survey First Name 1. What is your sex? Male Female 2. What is your age? under 18 40-49 18-29 50-59 30-39 60 and over 3. What is the highest level of education you have completed? 7.
Table of Contents. 2 P age. Susan G. Komen
 RHODE ISLAND Table of Contents Table of Contents... 2 Introduction... 3 About... 3 Susan G. Komen Affiliate Network... 3 Purpose of the State Community Profile Report... 4 Quantitative Data: Measuring
Rice is a major staple among two-thirds of the world s
 RESEARCH Current Research Rice Consumption in the United States: Recent Evidence from Food Consumption Surveys S. PATRICIA BATRES-MARQUEZ, MS; HELEN H. JENSEN, PhD; JULIE UPTON, MS, RD ABSTRACT Background
Page down (pdf converstion error)
") 1 of 6 2/10/2005 7:57 PM Weekly August6, 1999 / 48(30);649-656 2 of 6 2/10/2005 7:57 PM Achievements in Public Health, 1900-1999: Decline in Deaths from Heart Disease and Stroke -- United States, 1900-1999
1 of 6 2/10/2005 7:57 PM Weekly August6, 1999 / 48(30);649-656 2 of 6 2/10/2005 7:57 PM Achievements in Public Health, 1900-1999: Decline in Deaths from Heart Disease and Stroke -- United States, 1900-1999
ELIMINATING HEALTH DISPARITIES IN AN URBAN AREA. VIRGINIA A. CAINE, M.D., DIRECTOR MARION COUNTY HEALTH DEPARTMENT INDIANAPOLIS, INDIANA May 1, 2002
 ELIMINATING HEALTH DISPARITIES IN AN URBAN AREA VIRGINIA A. CAINE, M.D., DIRECTOR MARION COUNTY HEALTH DEPARTMENT INDIANAPOLIS, INDIANA May 1, 2002 Racial and ethnic disparities in health care are unacceptable
Trends in Pneumonia and Influenza Morbidity and Mortality
 Trends in Pneumonia and Influenza Morbidity and Mortality American Lung Association Epidemiology and Statistics Unit Research and Health Education Division November 2015 Page intentionally left blank Introduction
Breast Cancer in Women from Different Racial/Ethnic Groups
 Cornell University Program on Breast Cancer and Environmental Risk Factors in New York State (BCERF) April 2003 Breast Cancer in Women from Different Racial/Ethnic Groups Women of different racial/ethnic
From the Center for Human Nutrition, Department of International Health, Johns Hopkins Bloomberg School of Public Health, Baltimore, MD.
 Epidemiologic Reviews Copyright ª 2007 by the Johns Hopkins Bloomberg School of Public Health All rights reserved; printed in U.S.A. Vol. 29, 2007 DOI: 10.1093/epirev/mxm007 Advance Access publication