Exploring How Prices and Advertisements for Soda in Food Stores Influence Adolescents Dietary Behavior
|
|
|
- Emil Grant
- 6 years ago
- Views:
Transcription


1 Exploring How Prices and Advertisements for Soda in Food Stores Influence Adolescents Dietary Behavior Lisa M. Powell, PhD (co-authors: Zeynep Isgor, Frank Chaloupka, Lloyd Johnston) Health Policy and Administration, School of Public Health University of Illinois at Chicago Obesity Society Meeting Atlanta, GA November, 2013
2 Presenter Disclosures No relationships to disclose. 2
3 Background
4 SSB consumption (kcal) Daily SSB Consumption among Children & Adolescents, Age Age Age Source: National Health and Nutrition Examination Survey (NHANES) , author s own calculations 4
5 SSB consumption (kcal) Daily U.S. Sugar-Sweetened Beverage Consumption Calories, by Age Energy drink Sport drink Coffee/Tea Juice Soda Age group Source: National Health and Nutrition Examination Survey (NHANES) , author s own calculations 5
6 Mean Estimates of Price Elasticity of Demand for SSBs U.S. studies from Beverage Categories Pricing: Evidence Mean Price Elasticity Estimate SSBs Overall a SSBs Regular Carbonated Soft Drinks Sports Drinks Fruit Drinks Soft Drinks (reg+diet) Notes: a Overall mean (weighted mean based on SSB consumption shares) SSB elasticity estimate based on the estimates from the aggregated SSB category and the estimates from the various disaggregated (regular carbonated soda, sports drinks, and fruit drinks) categories within the beverage demand system. Source: Powell et al. Obesity Reviews,
7 Data and Methods
8 Individual Level Data Monitoring the Future Study Study began in 1975 Nationally representative sample of 8 th, 10 th and 12 th grade students Starting in 2010, study asks students about their soda consumption: How many (if any) 12-ounce cans or bottles (or the equivalent) of regular (non-diet) soft drinks do you drink per day, on average? None, Less than 1, One, Two, Three, Four, Five or six, 7 or more 8
9 BTG - Community Obesity Measures Study Collection of local policy and environmental data in a national sample of catchment areas around MTF schools Systematic observation by trained data collectors Food stores Fast food restaurants Parks Physical activity facilities Street segments Community sample defined by the catchment areas for schools participating in the University of Michigan s Monitoring the Future study Data collected in 154 communities in 2010, 157 communities in 2011, and 160 communities in
10 BTG-COMP Food Store Sample Food store sampling frame developed from two commercial sources Dun & Bradstreet InfoUSA Phone screening conducted to confirm business name, location, and eligibility/classification Sampling frame supplemented with food store outlets discovered in the field Goals for # of field-discovered businesses set based on sensitivity rates from a field validation study (Source: Powell L., et al. Health & Place 2011) 10
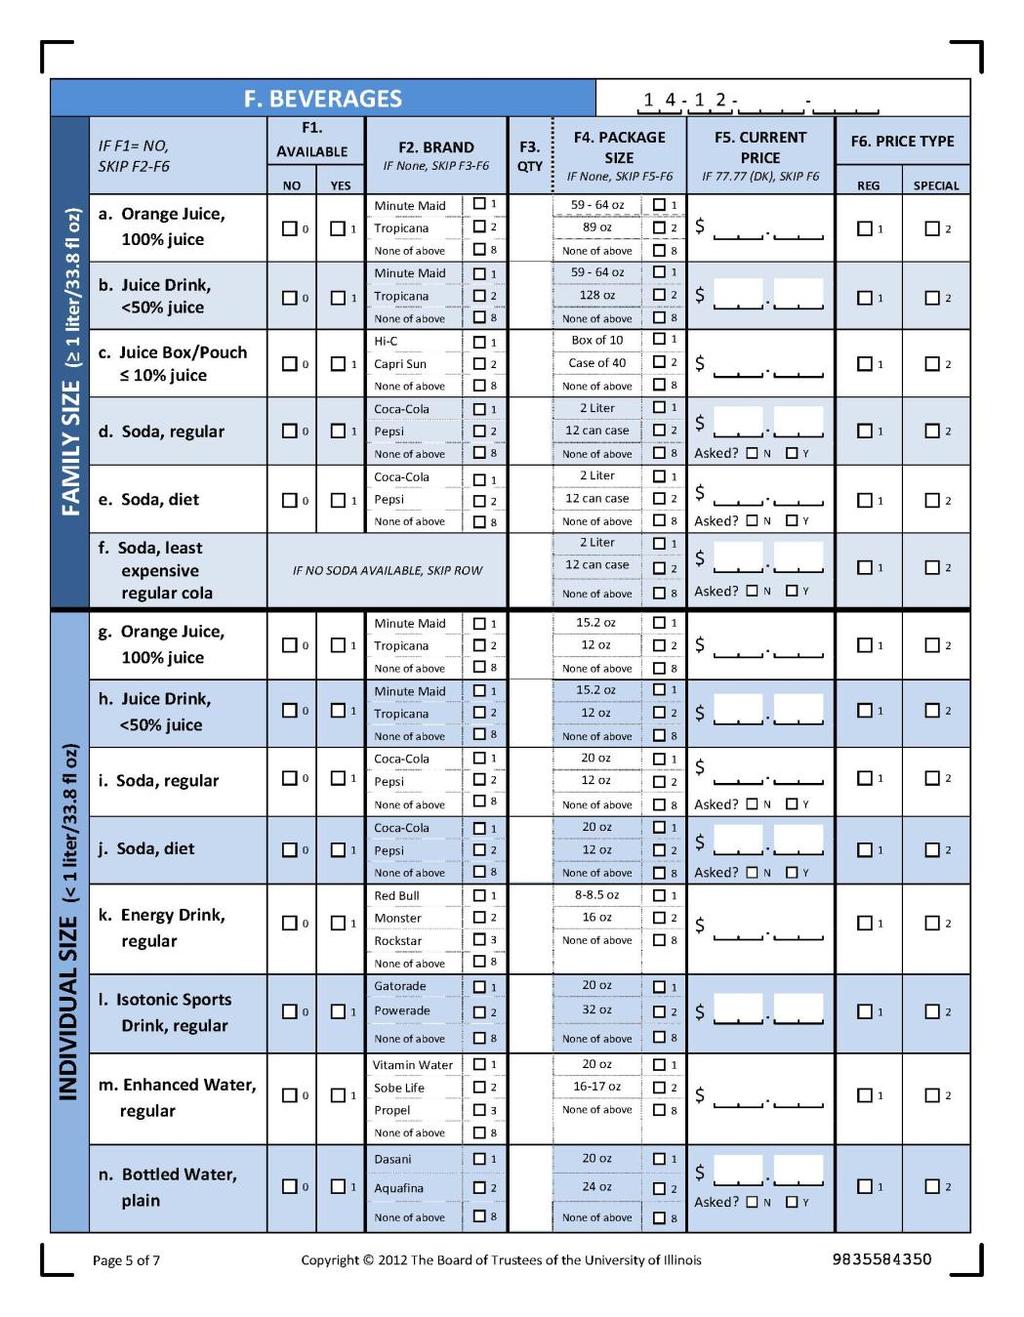
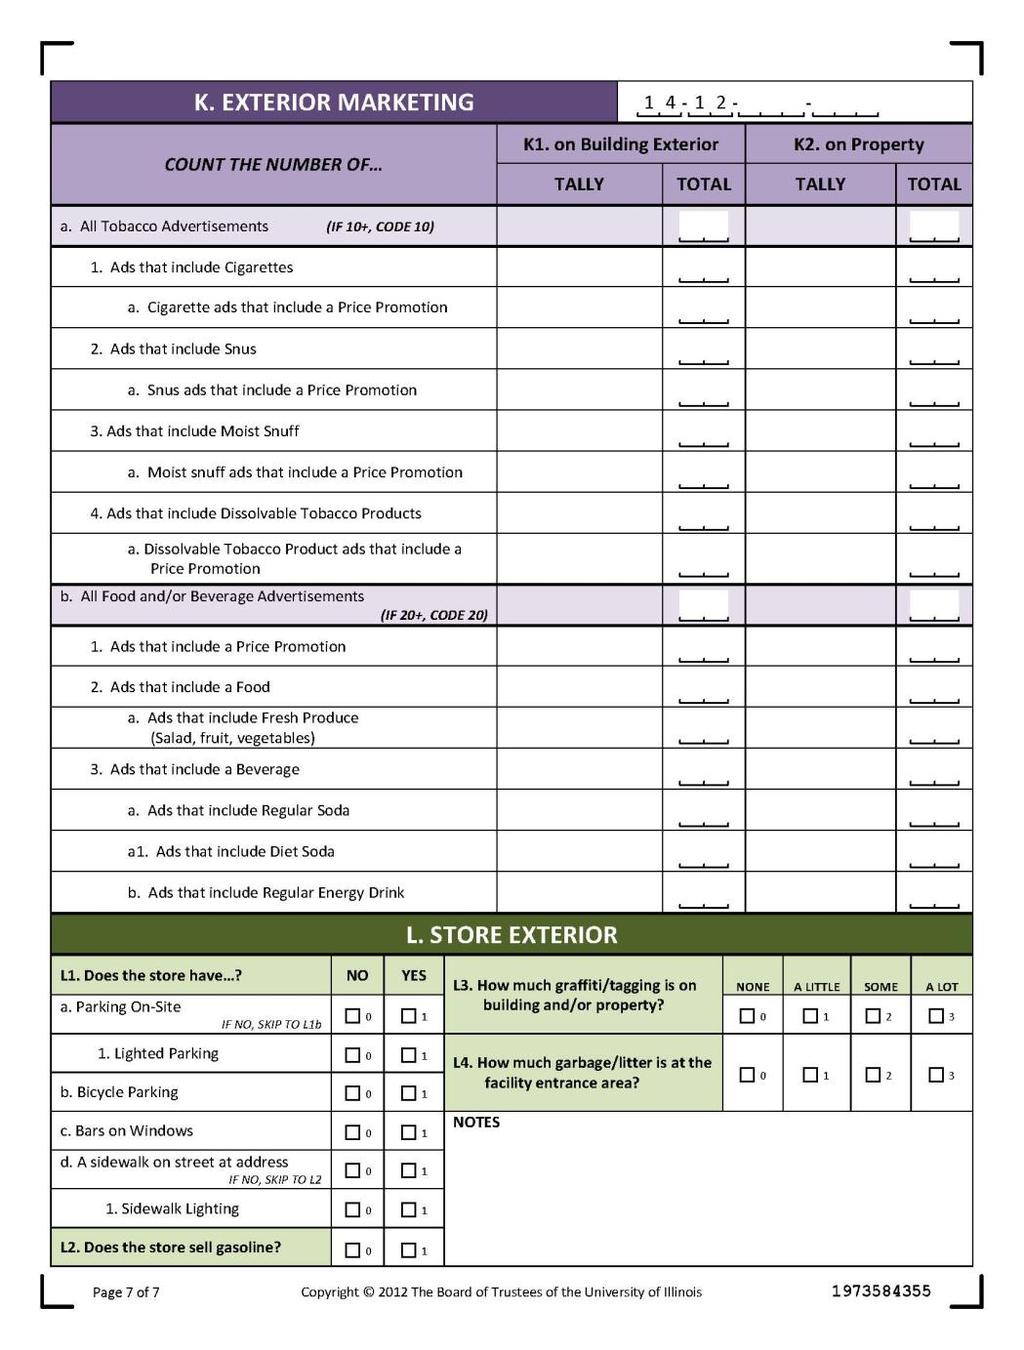
11 Food Store Observation Form Types of stores Store features/amenities Availability of food/beverage items Pricing of food/beverage items Marketing and signage 11
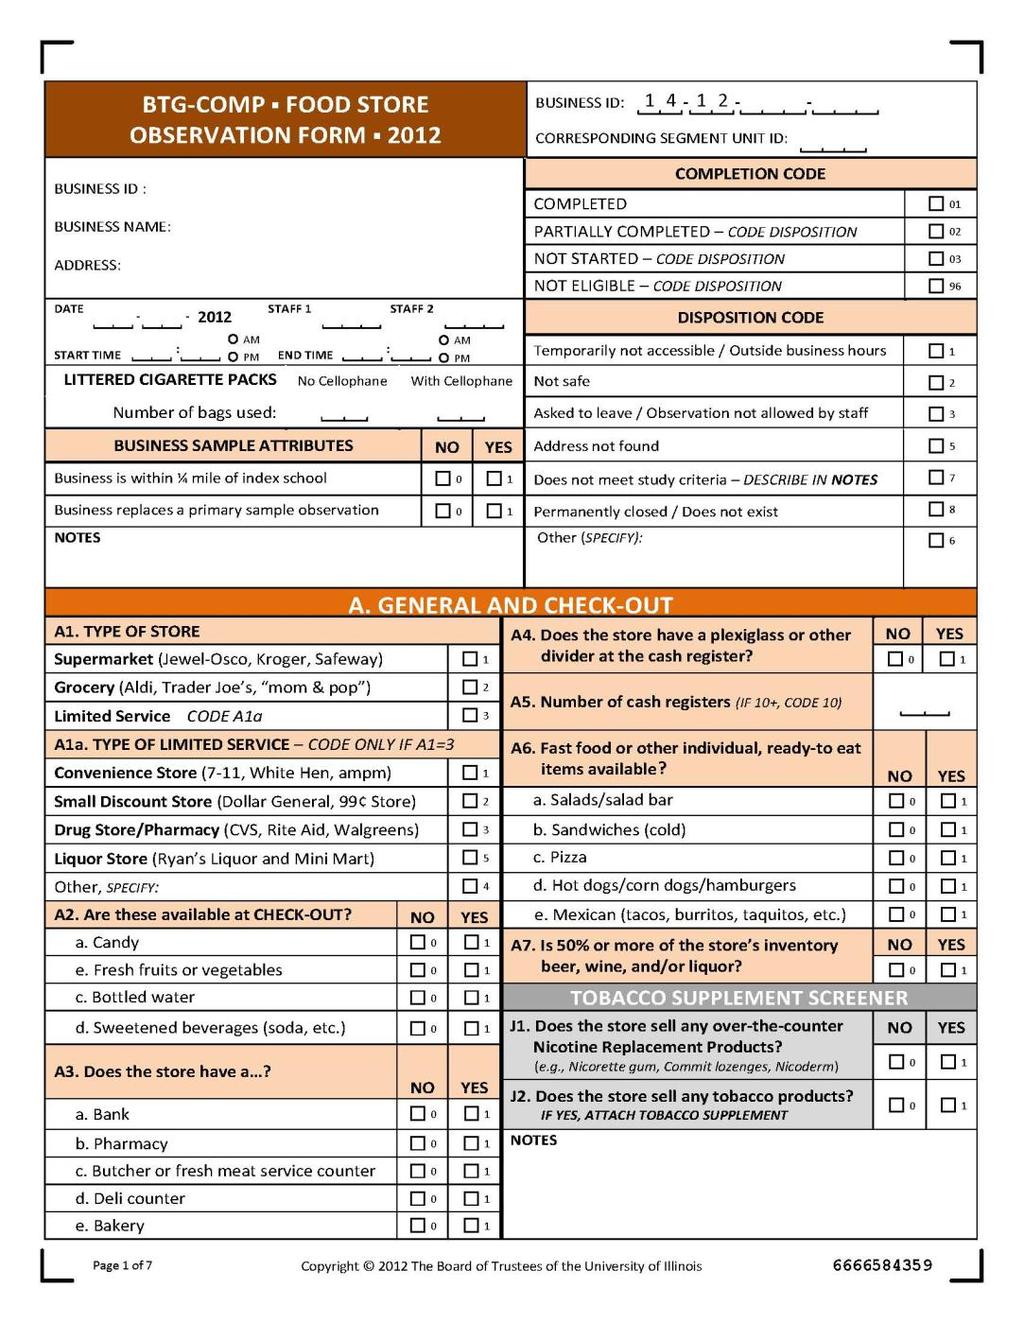
12 12
13 13
14 14
15 Key Exposure Measures Community exposure measures were weighted mean catchmentlevel food store observations. Key measures included: Price of regular individual size (20 ounces) soda (i.e. Coca-cola) in $ Number of regular soda ads found on building exterior and property. 15
16 Estimation Models Regular Soda Consumption = f (price/ads, gender, grade, race, student income, student hours of work, mother hours of work, mother education, region, neighborhood income, year indicators) Estimations Models: 1. Ordinary least squares (OLS) consumption models 2. Probit consumption prevalence models 3. Probit heavy consumption prevalence models Estimation of partially- and fully-adjusted models and by subpopulations. 16
17 Results
18 Summary Statistics: Soda Consumption Outcomes Number of Drinks Per Day Consumption Prevalence Heavy Consumption Prevalence Full Sample (n=12,357) % 27.6% Female (n=6,311) % 23.3% Male (n=6,046) % 32.1% 8 th Grade (n=5,129) % 30.9% 10 th Grade (n=5,118) % 26.0% 12 th Grade (n=2,110) % 24.6% White (n=7,679) % 25.5% Black (n=1,222) % 42.2% Hispanic (n=1,749) % 29.8% Other race (n=1,707) % 24.3% Mother no college (n=3,004) % 37.0% Mother some college or more (n=9,353) % 24.4% Live with one parents (n=2,838) % 34.9% Live with both parent (n=9,519) % 25.4% 18
19 Soda Consumption (Cans/day), by Year
20 Consumption Prevalence Soda and Heavy Soda Consumption Prevalence, by Year % 73.7% 72.6% Non-heavy Consumption Prevalence Heavy Consumption Prevalence % 28.4% 25.8% Year of Survey 20
21 Summary Statistics: Key Exposure and Selected Control Variables Variables of Interest Mean Price of 20oz regular soda ($) 1.56 Regular Soda Exterior Beverage Ads Selected Control Variables 1.02 Age (y) White (%) Black (%) Hispanic (%) Other race (%) Mother some college or more (%) Live with both parents (%) Youth income ($/wk) Youth hours worked per week 3.40 Mother PT job (%) Mother FT job (%)
22 Variable of Interest Regression Results for Price on Consumption Number of Drinks Per Day Price of 20oz regular soda ** [-0.44] Selected Control Variables Consumption Prevalence ** [-0.24] Heavy Consumption Prevalence ** [-0.84] Male 0.273*** 0.081*** 0.085*** 10 th Grade *** *** *** 12 th Grade *** *** *** Black 0.221*** 0.027* 0.085*** Hispanic Other race Median Household Income *** *** *** Mother Some College or More *** *** *** *p< 0.10, **p < 0.05, *** p <0.01; [Elasticity] 22
23 Price Elasticity of Consumption, Alternative Model Specifications Partially- Adjusted Model 1 Partially- Adjusted Model 2 Fully- Adjusted Model Number of Drinks Per Day -1.77*** -0.87*** -0.44** Consumption Prevalence -0.57*** -0.33*** -0.24** Heavy Consumption Prevalence -2.72*** -1.48*** -0.84** *p< 0.10, **p < 0.05, *** p <
24 Price Elasticity of Consumption, by subpopulations Number of Drinks Per Day Consumption Prevalence Heavy Consumption Prevalence Full Sample -0.44** -0.24** -0.84** By Gender Female -0.67** -0.47*** Male ** By Grade Middle School * High School -0.77** -0.30** -1.34** By Race White -0.55** -0.28** -0.98** Black * Hispanic By Mother s Education Mother no college Mother some college or more -0.47** -0.30** -1.02*** *p< 0.10, **p < 0.05, *** p <
25 Regression Results for Regular Soda Advertisements on Consumption Variables of Interest Number of Drinks Per Day Regular Soda Food Store Beverage Ads [0.02] *p< 0.10, **p < 0.05, *** p <0.01; [Elasticity] Consumption Prevalence [-0.00] Heavy Consumption Prevalence 0.009* [0.05] 25
26 Impact of Regular Soda Advertisements on Heavy Consumption, Elasticities by Subpopulations Heavy Consumption Full Sample 0.05* By Gender Female 0.06 Male 0.05 By Grade Middle School 0.09** High School 0.02 By Race White 0.08** Black 0.13** Hispanic By Mother s Education Mother no college 0.02 Mother some college or more 0.08** *p< 0.10, **p < 0.05, *** p <
27 Elasticity for Price and Advertisement Data on Consumption Variables of Interest Number of Drinks Per Day Consumption Prevalence Heavy Consumption Prevalence Price of 20oz regular soda -0.44** -0.24** -0.84** Regular Soda Food Store Beverage Ads * *p< 0.10, **p < 0.05, *** p <
28 Summary of Results Preliminary results show significant associations between regular soda prices and consumption outcomes. A 10% increase in price is associated with 4.4% lower consumption, 2.4% lower consumption prevalence, and 8.4% lower heavy consumption prevalence. Future estimation: Count models of consumption and associations with body weight. Less consistent results found for associations between exterior regular soda ads and consumption; although significant for some populations (middle school, white, black, higher mother s education). 28
29 Policy Implications Tax Design, Revenue, Current Taxes, and Proposed Taxes
30 Policy Landscape - Taxes Food taxes have not generally been introduced with the aim of modifying consumption behavior as they have been used in other public health areas such as tobacco. Food taxes are currently imposed on selected categories of food such as soft drinks, candy and snacks in grocery stores and vending machines but at quite low tax rates. 30

31 State Sales Taxes on Regular, Sugar-Sweetened Beverages, as of July 1,
32 Sales Tax Rate (%) Sales Taxes on Selected Beverages, All States (as of July 1, 2012) Max Mean: All States (51) Mean State Sales Tax (All States=5.01%) Disfavored Amount Mean State Food Tax (All States=0.96%) Reg. Soda Diet Soda Isotonic Bevs. <50% Juice Sweetened Tea Water 51-99% Juice 100% Juice Note: Three states also impose a mandatory statewide local tax that is not reflected in the above data: CA (1%), UT (1.25%), VA (1%). 32
33 Sales Tax Rate (%) Sales Taxes on Selected Beverages, Taxing States (as of July 1, 2012) Max Mean: States with Tax Mean State Food Tax (14 states with avg=3.5%) Mean State Sales Tax (46 states with avg=5.56%) 0.00 # states Reg. Soda (35) Diet Soda (35) Isotonic Bevs. (31) <50% Juice (30) Sweetened Tea (28) Water (18) 51-99% Juice (16) 100% Juice (14) Note: Three states also impose a mandatory statewide local tax that is not reflected in the above data: CA (1%), UT (1.25%), VA (1%). 33
34 Selected Examples of State SSB-related Legislative Activity 2011/12 California ($0.01/ounce tax on distributors of SSBs; revenue to create Children s Health Promotion Fund) Failed to pass 3/1/2012 California (to authorize any county or city to propose to voters a $0.01/ounce excise tax on SSBs) Failed to pass 3/1/2012 Hawaii (7 Bills introduced from 2011 through 2012) All Died in Committee or Failed to pass Illinois ($0.01/ounce tax on SSBs; revenue to create Illinois Health Promotion Fund) Nebraska (sales tax on SSBs; revenue to Obesity Prevention Fund) Postponed 4/23/2012 Rhode Island ($0.01/ounce, revenue for programs to reduce obesity) Held for study 5/5/2011 Tennessee ($0.01/ounce tax on bottled SSBs in exchange for 1% reduction in state sales tax on food referred to as swap legislation ) Died in Committee 9/12/2012 Vermont ($0.01/ounce tax on SSBs; revenue to create Vermont oral health improvement fund) Died in Committee 9/14/2012 West Virginia (series of taxes on bottled soft drinks, syrups and dry mixtures; revenue for state parks) Died in Committee 7/8/2011 Source: Rudd Center for Food Policy & Obesity, Legislation Database 34
35 Global Beverage Taxes Several countries recently adopted beverage taxes as part of effort to curb obesity Denmark: DKK 1.58/litre (US$0.28) for beverages with >0.5 grams of sugar/100 ml; DKK 0.57 (US$0.10) for <0.5 grams/ml France: 7.16/100 litres (US$9.39) on beverages with added sugars and artificially sweetened beverages Hungary: 5 forints/litre ($0.024) on soft drinks; 250 forints ($1.18) on energy drinks; 100 forints on pre-packaged sugar-sweetened products (>25-40g added sugar per 100g; varies by product) Nauru: 30% ad valorem tax on prices of imported carbonated soft drinks, cordials, flavored milks, and drink mixes containing sugar Source: Chriqui et al.,
36 Tax Policy Design Implications Issues of applicability to SNAP (food stamp) purchases Excise tax rather than a sales tax Incorporated at shelf price more apparent to consumers Applicable regardless of where items are sold Applied on a per unit basis rather than a function of price so that quantity discounts are still taxed. Issue of zero marginal cost for free refills. Reduces incentives to switch to cheaper brands Disadvantage: Need to be adjusted for inflation Dedication of tax revenue to nutrition and physical activity programs 36
37 SSB Taxation & Revenues Revenue generating potential of tax is considerable SSB Tax calculator at: Tax of one cent per ounce could generate: $13.1 billion nationally in 2013 Tax of one cent per ounce in Georgia $450.9 million in 2013 Earmarking tax revenues for obesity prevention efforts would add to impact of tax 37

38 PSAs could be paid for with the tax revenue! Example of PSA in New York City: Pour on the Pounds Campaign. 38


39 For more information: Sign up for our list! Follow us on Lisa Powell 39
Taxes, Advertising and Obesity: Public Policy Implications
 Taxes, Advertising and Obesity: Public Policy Implications Consortium to Lower Obesity in Chicago Children: Quarterly Meeting Chicago, IL, U.S.A., September 15, 2010 Lisa M. Powell, PhD University of Illinois
The Economics of Fast Food and Soda: Evidence and Policy Implications for Child and Adolescent Obesity
 The Economics of Fast Food and Soda: Evidence and Policy Implications for Child and Adolescent Obesity Department of Preventive Medicine Rush University Medical Center April, 2012 Lisa M. Powell, PhD Institute
Sugar-sweetened Beverage Taxes, Consumption and Obesity. Webinar
 Sugar-sweetened Beverage Taxes, Consumption and Obesity Lisa M. Powell, PhD Distinguished Professor and Director Health Policy and Administration School of Public Health Webinar Healthy Food Retail Policy
Price, Food Consumption, and Obesity
 Price, Food Consumption, and Obesity Evidence from Bridging the Gap: Research Informing Practice and Policy for Healthy Youth Behavior Jamie F. Chriqui & Frank J. Chaloupka Health Policy Center University
Taxing Caloric Sweetened Beverages To Curb Obesity
 Taxing Caloric Sweetened Beverages To Curb Obesity V O L U M E 8 I S S U E 3 Travis A. Smith, tsmith@ers.usda.gov Biing-Hwan Lin, blin@ers.usda.gov Rosanna Mentzer Morrison, rosanna@ers.usda.gov 22 A M
Reducing Sugary Beverage Consumption Across the US: A Policy Update for RDs
 Reducing Sugary Beverage Consumption Across the US: A Policy Update for RDs Roberta R. Friedman, ScM Director of Public Policy Yale Rudd Center for Food Policy and Obesity AND Webinar September 12, 2013
CAN TAXES ON CALORICALLY SWEETENED BEVERAGES REDUCE OBESITY?
 3rd Quarter 2010 25(3) CAN TAXES ON CALORICALLY SWEETENED BEVERAGES REDUCE OBESITY? Jessica E. Todd and Chen Zhen JEL Classifications: D12, H2, I18 Enlightened by the success of using tobacco taxes to
Bridging the Gap. Research Informing Practice for Healthy Youth Behavior
 Bridging the Gap Research Informing Practice for Healthy Youth Behavior The Relationship Between Youth Smoking and the Retail Environment: Preliminary Results Sandy Slater, MS Frank Chaloupka PhD University
Do students compensate for school beverage laws? Evidence that removing soda from schools is not enough
 Do students compensate for school beverage laws? Evidence that removing soda from schools is not enough Daniel R. Taber, PhD, MPH Jamie F. Chriqui, PhD, MHS Lisa M. Powell, PhD Frank J. Chaloupka, PhD
State Tobacco Control Spending and Youth Smoking
 State Tobacco Control Spending and Youth Smoking John A. Tauras Department of Economics, University of Illinois at Chicago and Health Economics Program, NBER Frank J. Chaloupka Matthew C. Farrelly Gary
Public Health. obesity reviews. L. M. Powell 1,2, J. F. Chriqui 2, T. Khan 3,R.Wada 2 and F. J. Chaloupka 2,3. Summary.
 obesity reviews doi: 10.1111/obr.12002 Public Health Assessing the potential effectiveness of food and beverage taxes and subsidies for improving public health: a systematic review of prices, demand and
How Price Increases Reduce Tobacco Use
 How Price Increases Reduce Tobacco Use Frank J. Chaloupka Director, ImpacTeen, University of Illinois at Chicago www.uic.edu/~fjc www.impacteen.org www.tobaccoevidence.net TUPTI, Kansas City, July 8 2002
Taxing Sugary Drinks in Canada: Evidence and Challenges. Dr. Tom Warshawski Chair, Childhood Obesity Foundation
 Taxing Sugary Drinks in Canada: Evidence and Challenges Dr. Tom Warshawski Chair, Childhood Obesity Foundation Disclosure I have no industry sponsorship I did drink a can of Coke on the plane Thursday
Healthcare Food Environments: Policies and Current Practices
 Healthcare Food Environments: Policies and Current Practices Using Policy and Environmental Approaches to Improve Healthcare/Worksite Environments MWWI meeting webinar December 2, 2010 Maria Boyle, MS,
Snack Food and Beverage Interventions in Schools
 Snack Food and Beverage Interventions in Schools Summary Evidence Table Abbreviations Used in This Document: Outcomes: o SSB: sugar sweetened beverage Measurement terms o BMI: body mass index o CI: confidence
Estimating the Potential Impact of a Sugar-Sweetened Beverage Excise Tax
 Ebarb 1 Intermediate Economics Amber Ebarb Fall 2015, Elasticity Memo Estimating the Potential Impact of a Sugar-Sweetened Beverage Excise Tax Growing awareness of the link between sugar-sweetened beverages
Thank You to Our Sponsors: Evaluations. Sugary Beverages: Why the Fuss and What You Can Do. Disclosure Statements
 Sugary Beverages: Why the Fuss and What You Can Do January 17, 213 Featured Speakers Ian Brissette, PhD New York State Department of Health Melanie Shefchik, MA, CHES Rockland County Department of Health
Sugary Beverages: Why the Fuss and What You Can Do
 Sugary Beverages: Why the Fuss and What You Can Do January 17, 2013 1 Featured Speakers Ian Brissette, PhD New York State Department of Health Melanie Shefchik, MA, CHES Rockland County Department of Health
MILLENNIALS AND ORANGE JUICE CONSUMPTION
 MILLENNIALS AND ORANGE JUICE CONSUMPTION Yan Heng, PhD and Lisa House, PhD Presented to the International Citrus Beverage Conference Florida Agricultural Market Research Center Food and Resource Economics
Associations between State-level Soda Taxes and Adolescent Body Mass Index
 Journal of Adolescent Health 45 (2009) S57 S63 Original article Associations between State-level Soda Taxes and Adolescent Body Mass Index Lisa M. Powell, Ph.D. a, *, Jamie Chriqui, Ph.D., M.H.S. b, and
One Cent Per Ounce Excise Tax on Sugar-Sweetened Beverages* Rossan Chen, MD MSc, Matt Symkowick, MD
 Res. A-09-18 January 14, 2018 TITLE: Introduced by: Endorsed by: One Cent Per Ounce Excise Tax on Sugar-Sweetened Beverages* Rossan Chen, MD MSc, Matt Symkowick, MD Napa and Solano CAFP chapters WHEREAS,
TOBACCO TAXATION, TOBACCO CONTROL POLICY, AND TOBACCO USE
 TOBACCO TAXATION, TOBACCO CONTROL POLICY, AND TOBACCO USE Frank J. Chaloupka Director, ImpacTeen, University of Illinois at Chicago www.uic.edu/~fjc www.impacteen.org The Fact is, Raising Tobacco Prices
Carbonated soft drinks, or soda, and. Soda Taxes, Soft Drink Consumption, And Children s Body Mass Index. Web First
 By Roland Sturm, Lisa M. Powell, Jamie F. Chriqui, and Frank J. Chaloupka Soda Taxes, Soft Drink Consumption, And Children s Body Mass Index doi: 10.1377/hlthaff.2009.0061 HEALTH AFFAIRS 29, NO. 5 (2010):
City of Minneapolis Healthier Beverage Initiative Talking Points - suggested answers for partners
 1 City of Minneapolis Healthier Beverage Initiative Talking Points - suggested answers for partners Being prepared for tough questions from employees, visitors, community members, and the media is an important
Predicting Impacts of Targeted Beverage Taxes: Research Challenges and Potential Solutions
 Predicting Impacts of Targeted Beverage Taxes: Research Challenges and Potential Solutions Presented by Chen Zhen, RTI International Presented at Committee on Valuing Community-Based, Non-Clinical Prevention
Taskforce on Childhood Obesity. Hank Cardello February 23, 2010
 Taskforce on Childhood Obesity Hank Cardello February 23, 2010 Outline I. The forces derailing a solution to obesity Industry Health advocates Consumers II. Overview of select initiatives Industry Public
Tax Sugar-Sweetened Beverages. Janice Macdonald. MEd, RD, FDC Director of Communications Dietitians of Canada
 Tax Sugar-Sweetened Beverages? Janice Macdonald. MEd, RD, FDC Director of Communications Dietitians of Canada Janice Macdonald, MEd, RD, FDC, has been supporting, advocating for and representing dietitians
Rethink Your Drink Campaign DRINK WATER WEEK
 Rethink Your Drink Campaign DRINK WATER WEEK The Countywide Rethink Your Drink Educational Campaign is an opportunity to educate your networks and supporters on the harmful effects of consuming sugar sweetened
Policy 358, Appendix D: RRPS Nutrition Plan
 Policy 358, Appendix D: RRPS Nutrition Plan 1. All schools, school-sponsored organizations, parent /teacher organizations, booster clubs, and vendors will abide by the district guidelines as outlined in
Tobacco use is Wisconsin s
 Focus on... Smoking Increasing tobacco taxes: An evidencebased measure to reduce tobacco use Marion Ceraso, MHS; David Ahrens, MS; Patrick Remington, MD Tobacco use is Wisconsin s single most important
Rethink Your Drink: Efforts to Address Sugary Drinks through Education and Policy Changes
 Rethink Your Drink: Efforts to Address Sugary Drinks through Education and Policy Changes May 13, 2015 Janna Simon, MPH Associate for Policy, Advocacy and Organizing Illinois Public Health Institute 1
IN THE GENERAL ASSEMBLY STATE OF. Competitive School Food and Beverage Act. Be it enacted by the People of the State of, represented in the General
 IN THE GENERAL ASSEMBLY STATE OF Competitive School Food and Beverage Act 1 1 1 1 1 1 1 1 Be it enacted by the People of the State of, represented in the General Assembly: Section 1. Title. This act shall
Nutrition Standards for Foods in Schools
 Nutrition Standards for Foods in Schools Mary McKenna, PhD Division of Adolescent and School Health, CDC Institute of Medicine, Washington, DC October 2005 Overview of Presentation Statement of task Data
SUGAR SWEETENED BEVERAGES POLICY
 SUGAR SWEETENED BEVERAGES POLICY OBJECTIVE This policy supports the health of staff, visitors, and elected members at Nelson City Council workplaces through the provision of healthy beverage choices. This
Improving School Food Environments Through District-Level Policies: Findings from Six California Case Studies. Executive Summary JULY 2006
 JULY 2006 Improving School Food Environments Through District-Level Policies: Findings from Six California Case Studies Executive Summary Prepared by: Sarah E. Samuels, Dr. P.H. Lisa Craypo, M.P.H., R.D.
The sugar reduction environment. Professor Julian G. Mercer Rowett Institute
 The sugar reduction environment Professor Julian G. Mercer Rowett Institute June 2014 Eating too much sugar is bad for us..the steps PHE will take to help families and individuals to reduce their sugar
A Local Perspective New York City s Strategies to Reduce Sugary Drink Consumption
 A Local Perspective New York City s Strategies to Reduce Sugary Drink Consumption Kim Kessler, JD Assistant Commissioner, Bureau of Chronic Disease Prevention and Tobacco Control June 21, 2017 Health Inequities
What should I drink? Monica Esquivel ECHO Diabetes Learning Group December 6, 2017
 What should I drink? Monica Esquivel ECHO Diabetes Learning Group December 6, 2017 Learning Objectives Describe relationship between added sugar and sugar sweetened beverages intake and health Differentiate
Sugary drink policy 2017 State of Play
 Sugary drink policy 2017 State of Play JIM KRIEGER, MD, MPH JUNE 2, 2017 A reminder: Why focus on sugary drinks? o Primary source of added sugar in U.S. diet o Major source of added calories fueling the
ImpacTeen: Related support provided by NIDA, NCI, and CDC
 ImpacTeen: A Policy Research Partnership to Reduce Youth Substance Use Component Part of Bridging the Gap: Research Informing Practice for Healthy Youth Behavior Related support provided by NIDA, NCI,
Use economic tools to address food affordability and purchase incentives
 NOURISHING framework U Use economic tools to address food affordability and purchase incentives This table provides examples of the types of policy action that can be taken within this policy area, examples
Use of Diversion Ratios in Addressing the Consequences of Tax Policies Associated with Non-alcoholic Beverages
 1 Use of Diversion Ratios in Addressing the Consequences of Tax Policies Associated with Non-alcoholic Beverages Senarath Dharmasena and Oral Capps, Jr. Abstract Monthly data derived from the Nielsen HomeScan
Lyon County School District
 Lyon County School District School Wellness Policy Adopted 6/13/06 1 LYON COUNTY SCHOOL DISTRICT WELLNESS POLICY HEALTHY SCHOOL ENVIRONMENT POLICY A healthy school environment is important for student
Household Spending on Alcoholic Beverages by Demographic Characteristic, 2013
 Household Spending on Alcoholic Beverages by Demographic Characteristic, 2013 Spending by Age The biggest spenders on alcoholic beverages are householders aged 45 to 54, who spend 22 percent more than
THE EFFECT OF COMMUNITY CHARACTERISTICS ON THE TOBACCO & ALCOHOL RETAIL ENVIRONMENT
 THE EFFECT OF COMMUNITY CHARACTERISTICS ON THE TOBACCO & ALCOHOL RETAIL ENVIRONMENT Sandy Slater, MS, University of Illinois at Chicago Erin Ruel, MA, University of Illinois at Chicago Frank Chaloupka,
What is the Current Evidence on Taxes and Subsidies on Food? Structure
 What is the Current Evidence on Taxes and Subsidies on Food? Prof Tony Blakely Assoc Prof Nick Wilson (Prof Cliona Ni Mhurchu, Uni Auckland Dr Linda Cobiac, Uni Queensland) Burden of Disease Epidemiology,
The Economics of Alcohol and Cancer/Chronic Disease
 The Economics of Alcohol and Cancer/Chronic Disease Frank J. Chaloupka, University of Illinois at Chicago World Cancer Congress Kuala Lumpur, Malaysia, 2 October 2018 Overview Economic Costs of Excessive
Applications of the CDC National Park Service Healthy Foods Evaluation for State and Local Parks
 Applications of the CDC National Park Service Healthy Foods Evaluation for State and Local Parks Stephen Onufrak, PhD Epidemiologist, Division of Nutrition, Physical Activity & Obesity Division of Nutrition,
Nutrition Standards Policy Business Enterprises of Nevada
 Nutrition Standards Policy Business Enterprises of Nevada Allison Schnitzer, RD, LD Office of Chronic Disease Prevention & Health Promotion Southern Nevada Health District Why Healthy Vending? OCDPHP Goal:
Sugar Reduction: The evidence for action. All Party Parliamentary Food and Health Forum October 2015
 Sugar Reduction: The evidence for action All Party Parliamentary Food and Health Forum October 2015 Scientific Advisory Committee on Nutrition report: Carbohydrates & Health Recommendations on sugar* The
Attracting Funding for Cancer Prevention Using Economic and Fiscal Tools
 Attracting Funding for Cancer Prevention Using Economic and Fiscal Tools Frank J. Chaloupka, University of Illinois at Chicago World Cancer Congress Kuala Lumpur, Malaysia, 3 October 2018 "Sugar, rum,
Prevalence, Trends and Disparities in Beverage Consumption Among Young Children aged 0-24 months from NHANES
 Prevalence, Trends and Disparities in Beverage Consumption Among Young Children aged 0-24 months from NHANES Anna Maria Siega-Riz, PhD Professor of Public Health Sciences and Obstetrics and Gynecology
HEALTH LEVY ON SUGAR- SWEETENED BEVERAGES Rethink Sugary Drink Position Statement
 HEALTH LEVY ON SUGAR- SWEETENED BEVERAGES Rethink Sugary Drink Position Statement KEY MESSAGES 10 members of the Rethink Sugary Drink alliance recommend that the Australian Government introduce a health
PHILADELPHIA SODA TAX EVALUATION HEALTHY IN-STORE MARKETING. SUMR Scholar: Kehinde Oyekanmi Mentor: Karen Glanz, PhD, MPH
 PHILADELPHIA SODA TAX EVALUATION & HEALTHY IN-STORE MARKETING SUMR Scholar: Kehinde Oyekanmi Mentor: Karen Glanz, PhD, MPH AGENDA I. My Objectives II. Philadelphia Soda Tax Evaluation III. Healthy In-Store
Sugary-Drink Excise Tax West Virginia
 Sugary-Drink Excise Tax West Virginia Intervention Strategy Description Implementation of an increase of the state excise tax by either $0.02/ounce or $0.01/ounce of sugar-sweetened beverages (SSBs), administered
THE ECONOMICS OF TOBACCO AND TOBACCO TAXATION IN BANGLADESH
 THE ECONOMICS OF TOBACCO AND TOBACCO TAXATION IN BANGLADESH Abul Barkat, PhD Professor of Economics, University of Dhaka & Chief Advisor (Hon.), HDRC Email: info@hdrc-bd.com Advocacy for Tobacco Taxation
The Effectiveness of Tobacco Tax & Price Policies for Tobacco Control Frank J. Chaloupka University of Illinois at Chicago
 The Effectiveness of Tobacco Tax & Price Policies for Tobacco Control Frank J. Chaloupka University of Illinois at Chicago The 10 th Asia Pacific Conference on Tobacco or Health Symposium 11 Makuhari Messe,
Policies to Prevent Childhood Obesity and Weight Bias
 Policies to Prevent Childhood Obesity and Weight Bias Roberta R. Friedman, ScM Director of Public Policy Women in Government Conference Oklahoma City, Sept 21-22, 2013 www.yaleruddcenter.org Strategic
ORIGINAL INVESTIGATION. Impact of Targeted Beverage Taxes on Higher- and Lower-Income Households
 HEALTH CARE REFORM ORIGINAL INVESTIGATION Impact of Targeted Beverage Taxes on Higher- and Lower-Income Households Eric A. Finkelstein, PhD, MHA; Chen Zhen, PhD; James Nonnemaker, PhD; Jessica E. Todd,
Generating Revenue & Cutting Costs The Health & Economic Benefits of Tobacco Control
 Generating Revenue & Cutting Costs The Health & Economic Benefits of Tobacco Control Frank J. Chaloupka, University of Illinois at Chicago Ministerial Leadership in Health Harvard University, 19 April
Healthy Drinks Fast Facts
 Healthy Drinks Fast Facts To provide you with the best science and to reduce review time, please find the following science-approved facts for use in your campaigns and materials. After each fact, you
Policies Affecting Our Food Environment
 Policies Affecting Our Food Environment Amy L. Yaroch, Ph.D. Gretchen Swanson Center for Nutrition, Omaha, NE About Us Independent research institution providing scientific expertise, partnership and resources
Sugary Drink Webinar
 Sugary Drink Webinar Roberta R. Friedman, ScM Director of Public Policy UCONN Rudd Center for Food Policy and Obesity Childhood Obesity Foundation June 23, 2015 Rudd Center www.uconnruddcenter.org Agenda
Marshall County Schools Wellness Policy Procedures
 Marshall County Schools Wellness Policy Procedures Procedure 5.19.P Nutrition Education Student in kindergarten through grade twelve will receive nutrition education that in interactive and teaches the
Scientific Report of the 2015 Dietary Guidelines Advisory Committee
 Scientific Report of the 2015 Dietary Guidelines Advisory Committee BEVERAGE RECOMMENDATIONS: Sugar Sweetened Beverages & Water Rafael Pérez-Escamilla, PhD Yale School of Public Health National Academies
Strategies to Reduce Sugar- Sweetened Beverage Consumption: Lessons from New York City
 Strategies to Reduce Sugar- Sweetened Beverage Consumption: Lessons from New York City Anne Sperling, MPH Ashley Lederer, MS, RD Bureau of Chronic Disease Prevention NYC Department of Health and Mental
A BRIEF OF A BILL ENTITLED THE
 A BRIEF OF A BILL ENTITLED THE CUSTOMS TARIFF AMENDMENT (NO 2) BILL 2018 Prepared for The Honourable Kim N. Wilson, JP, MP Minister of Health 8 th June 2018 CUSTOMS TARIFF AMENDMENT (No 2) BILL 2018 Overview
Increased city excise tax linked to change in BMI through change in SSB price and consumption. SSB Consumption. SSB Price
 Sugar-Sweetened and Diet Beverage Tax Philadelphia, PA Intervention Strategy Description Implementation of a city excise tax of $0.015/ounce of sugar-sweetened beverages (SSBs) and diet drinks, administered
Multicomponent Interventions to Increase Availability of Healthier Foods and Beverages in Schools
 Multicomponent Interventions to Increase Availability of Healthier Foods and Beverages in Schools Summary Evidence Table Abbreviations Used in This Document: Intervention components o FFVP: fresh fruit
Price-based measures to reduce alcohol consumption
 Price-based measures to reduce alcohol consumption Andrew Leicester (with Rachel Griffith and Martin O Connell) Health Economics Research Unit, University of Aberdeen 12 th March 2013 Introduction Governments
POST-MILLENNIAL BEVERAGE TRENDS AND THE RELATIONSHIP BETWEEN PRICE AND FOOD/BEVERAGE INTAKES AND PURCHASES IN THE U.S. PRESCHOOLER
 POST-MILLENNIAL BEVERAGE TRENDS AND THE RELATIONSHIP BETWEEN PRICE AND FOOD/BEVERAGE INTAKES AND PURCHASES IN THE U.S. PRESCHOOLER Christopher N. Ford A dissertation submitted to the faculty of the University
Restaurant Kids Meals
 Restaurant Kids Meals Southern Obesity Summit October 23, 2018 Hillary Caron, Senior Policy Associate Center for Science in the Public Interest Center for Science in the Public Interest Since 1971, CSPI
Schools and the Prevention of Childhood Obesity
 EXHIBIT G Schools and the Prevention of Childhood Obesity Howell Wechsler, Ed.D., MPH Division of Adolescent and School Health National Center for Chronic Disease Prevention and Health Promotion January
Miao Zhen, John Beghin and Helen Jensen Iowa State University CMD Meeting, Banff, Alberta September 28-30,2009
 Miao Zhen, John Beghin and Helen Jensen Iowa State University CMD Meeting, Banff, Alberta September 28-30,2009 High rates of obesity and overweight 62% of Adults (age 20-74) are overweight/obese Contributors
Case Study Report Classification Quantification. Evaluation of Council Directive 92/83/EEC
 Case Study Report Classification Quantification Evaluation of Council Directive 92/83/EEC 1 1. Introduction This case study should be read as an accompaniment to the case study on classification issues.
Chicago Public Schools Policy Manual
 Chicago Public Schools Policy Manual Title: HEALTHY SNACK AND BEVERAGE Section: 407.3 Board Report: 12-1114-PO1 Date Adopted: November 14, 2012 Policy: THE CHIEF EXECUTIVE OFFICER RECOMMENDS: That the
Bad Food? Tax It, and Subsidize Vegetables
 Bad Food? Tax It, and Subsidize Vegetables The New York Times, July 23, 2011 by Mark Bittman 1 What will it take to get Americans to change our eating habits? The need is indisputable, since heart disease,
Speed & scale to added sugars reduction: The ambition of the European soft drinks industry
 > Speed & scale to added sugars reduction: The ambition of the European soft drinks industry Gloria Gabellini, Public Policy, Government Affairs & Communications Manager EU, PepsiCo Sigrid Ligné, Director
Citywide Healthy Snack and Beverage Vending Policy
 CITY OF GLENDALE CALIFORNIA INTERDEPARTMENTAL COMMUNICATION Community Services and Parks Department DATE: March 21, 2016 TO: FROM: BY: SUBJECT: Parks, Recreation & Community Services Commission Roubik
FROM CAUSE TO IMPACT: MODELLING DETERMINANTS AND EFFECTS OF OBESITY
 FROM CAUSE TO IMPACT: MODELLING DETERMINANTS AND EFFECTS OF OBESITY May 2, 2017 Sahara Graf Andrea Feigl OECD FCAN meeting Rate of obesity Obesity rates will continue to rise 50% 45% 40% 35% 30% 25% 20%
What is the status of child obesity worldwide and in the South East Asia Region?
 Implementing the WHO's Recommendations for "Ending Childhood Obesity": Challenges, Barriers and Enabling Factors to Success in the South East Asia Region 16 May 2017 Jessica Blankenship PhD International
Country profile. Timor-Leste
 WHO Report on the Global Tobacco Epidemic, 2013 Country profile Timor-Leste WHO Framework Convention on Tobacco Control (WHO FCTC) status Date of signature 25 May 2004 Date of ratification (or legal equivalent)
Missouri Eat Smart Guidelines Grades Pre K-12, 2 nd Ed.
 To comment on these guidelines, go to: http://168.166.46.216/dhss_survey/dcph/content/missourieatsmartguidelines/missourieatsmartguidelines.asp. Missouri Eat Smart Guidelines Grades Pre K-12, 2 nd Ed.
CLARK COUNTY SCHOOL DISTRICT REGULATION
 CLARK COUNTY SCHOOL DISTRICT REGULATION 5157 STUDENT WELLNESS Clark County School District is committed to providing an environment in which students can make healthy food choices and have opportunities
Intake of sugar-sweetened beverages and weight gain: a systematic review REVIEW ARTICLE
 Intake of sugar-sweetened beverages and weight gain: a systematic review REVIEW ARTICLE 1 American Journal of Clinical Nutrition Vol. 84, No. 2, 274-288, August 2006 Vasanti S Malik, Matthias B Schulze
YOUR. drink Choose Water!
 rethink YOUR drink Choose Water! Let s Not -coat It! -sweetened beverages (SSBs) are beverages with added sugar These drinks include soda pop, juice/fruit drinks, sweetened teas/coffees, flavored waters,
TITLE. Subtitle Goes Here. Howard County Unsweetened. Policy + Outreach + Media = Change. Marlene B. Schwartz, Ph.D. June 21, 2017
 TITLE Howard County Unsweetened Subtitle Goes Here Policy + Outreach + Media = Change Photo Credit: J. Stephen Conn Marlene B. Schwartz, Ph.D. June 21, 2017 Overview Howard County Campaign components Findings
UNDERSTANDING THE ROLES THAT FOOD MANUFACTURERS, GOVERNMENT, AND CONSUMERS PLAY IN EFFORTS TO REDUCE PURCHASES OF GRAIN-BASED DESSERTS
 UNDERSTANDING THE ROLES THAT FOOD MANUFACTURERS, GOVERNMENT, AND CONSUMERS PLAY IN EFFORTS TO REDUCE PURCHASES OF GRAIN-BASED DESSERTS Kevin Clark Mathias A dissertation submitted to the faculty at the
Sage Academy Wellness Policy
 Sage Academy Wellness Policy The policies outlined within this document are intended to create a school environment that protects and promotes the health of our students. The policy applies to our school.
YOUR. drink Choose Water!
 rethink YOUR drink Choose Water! Let s Not -coat It! -sweetened beverages (SSBs) are beverages with added sugar These drinks include soda pop, juice/fruit drinks, sweetened teas/coffees, flavored waters,
Food Taxes and Subsidies: Evidence and Policies for Obesity Prevention
 Food Taxes and Subsidies: Evidence and Policies for Obesity Prevention Lisa M. Powell, Ph.D. Institute for Health Research and Policy and Department of Economics University of Illinois at Chicago and Jamie
Why the Increase In Obesity
 Obesity From an Economist s Perspective Eric Finkelstein, PhD, MHA RTI INTERNATIONAL The Economics of Obesity (outline) Why the Increase in Obesity Rates Adverse Health Consequences Why do (or should)
Objective. Review USDA s Smart Snacks in Schools and the impact on Fulton County Schools.
 1 Objective Review USDA s Smart Snacks in Schools and the impact on Fulton County Schools. 2 Smart Snacks in School Healthy, Hunger-Free Kids Act of 2010 New USDA regulations for ALL foods and beverages
ADVERTISING - CALIFORNIA
 MEDICAL MARIJUANA ADVERTISING - CALIFORNIA ADVERTISING - ARIZONA STATE LEGISLATION Number of dispensaries Statewide 1 for every 10 pharmacies, Estimated 124 County (minimum 1) City (estimated 3 5) Agents
Health Impact Assessment
 EMBARGOED UNTIL TUESDAY, JUNE 26 AT 12:01 AM EST. Health Impact Assessment National Nutrition Standards for Snack and a la Carte Foods and Beverages Sold in Schools Executive Summary Introduction The foods
Country profile. Myanmar
 WHO Report on the Global Tobacco Epidemic, 2013 Country profile Myanmar WHO Framework Convention on Tobacco Control (WHO FCTC) status Date of signature 23 October 2003 Date of ratification (or legal equivalent)
Country profile. Lebanon
 WHO Report on the Global Tobacco Epidemic, 2013 Country profile Lebanon WHO Framework Convention on Tobacco Control (WHO FCTC) status Date of signature 4 March 2004 Date of ratification (or legal equivalent)
Country profile. Nepal
 WHO Report on the Global Tobacco Epidemic, 2013 Country profile Nepal WHO Framework Convention on Tobacco Control (WHO FCTC) status Date of signature 3 December 2003 Date of ratification (or legal equivalent)
HELPING YOUR CLIENTS MAKE HEALTHY CHOICES: SUGAR
 HELPING YOUR CLIENTS MAKE HEALTHY CHOICES: SUGAR Thursday, April 13, 2017 Presented by: Pam McFarlane (MDA) and Amanda Nash, RD (HSF) Outline About the Heart and Stroke and MDA Oral Health and Dental Care
Country profile. Hungary
 Country profile Hungary WHO Framework Convention on Tobacco Control (WHO FCTC) status Date of signature 16 June 2003 Date of ratification (or legal equivalent) 7 April 2004 Socioeconomic context Population