Cathepsin S inhibition combines control of systemic and peripheral pathomechanisms of autoimmune tissue injury
|
|
|
- Rosamond Lynch
- 6 years ago
- Views:
Transcription
1 Cathepsin S inhibition combines control of systemic and peripheral pathomechanisms of autoimmune tissue injury Maia Tato, Santhosh V. Kumar, Yajuan Liu, Shrikant R. Mulay, Solange Moll, Bastian Popper, Jonathan N. Eberhard, Dana Thomasova, Arne Christian Rufer, Sabine Gruner, Wolfgang Haap, Guido Hartmann, Hans-Joachim Anders
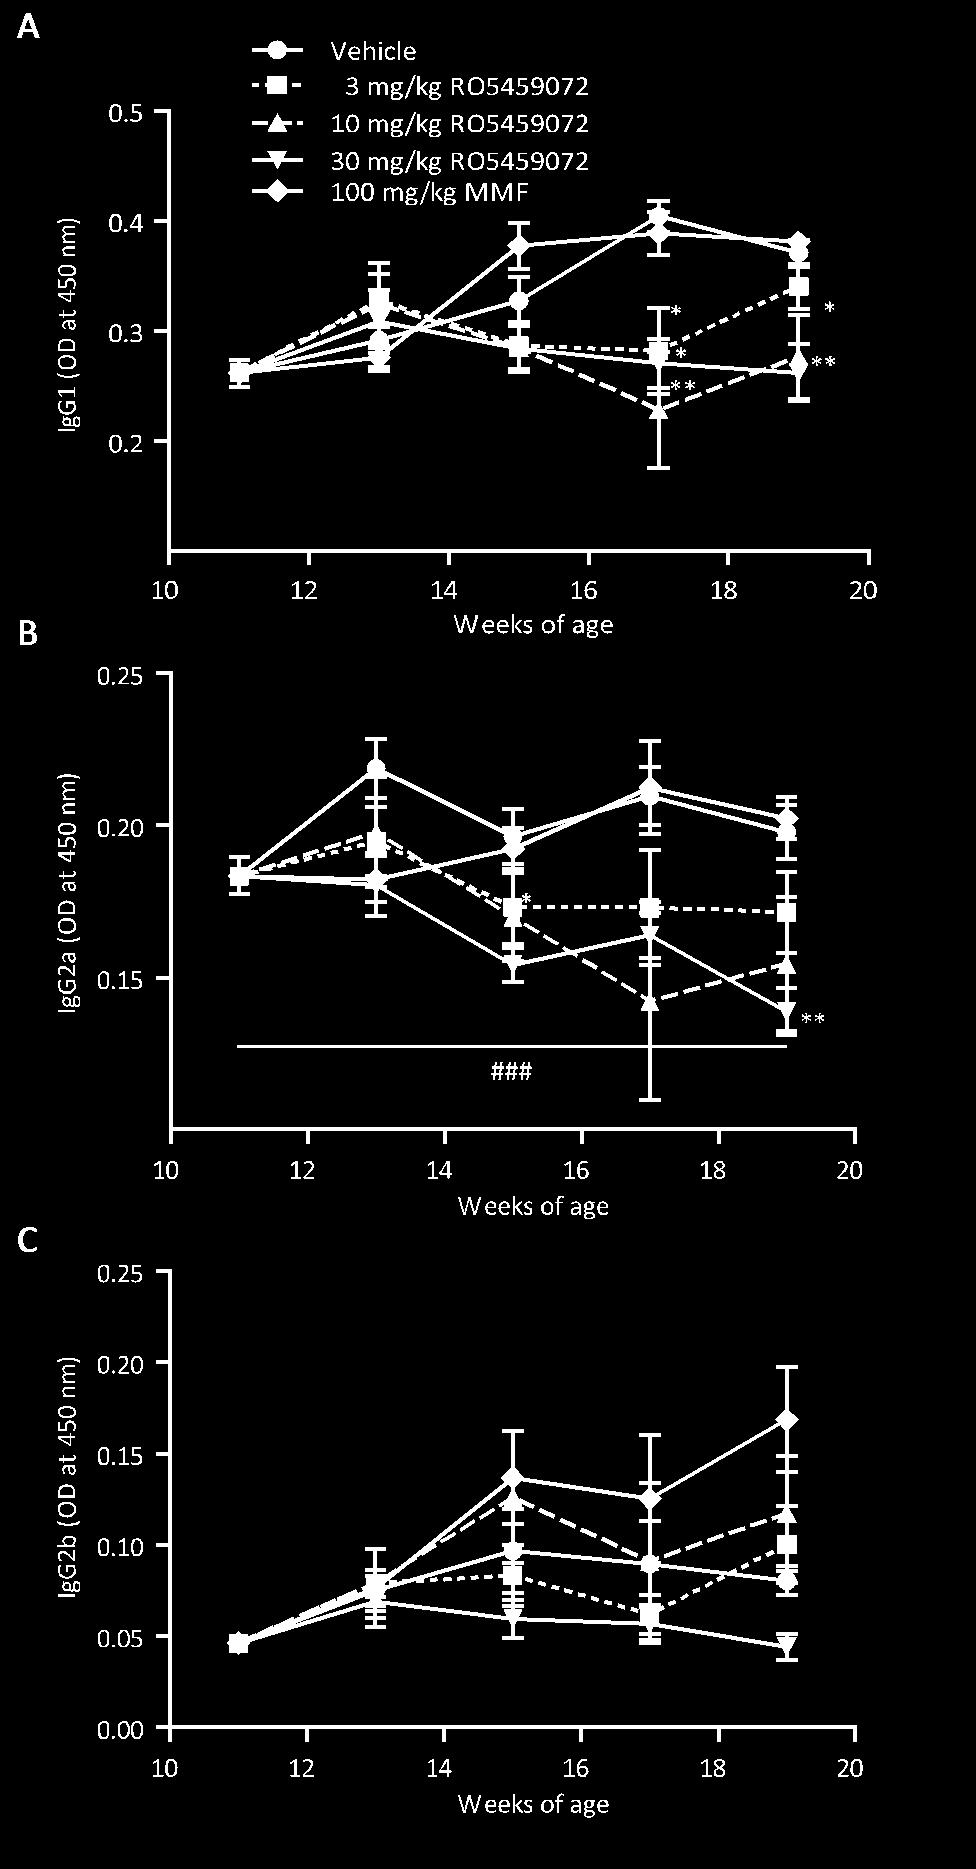
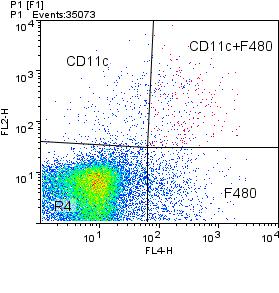
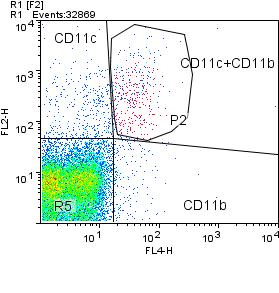
2 Supplementary figures Supplementary figure 1. Biochemical and pharmacological profile of R (A) Upregulation of invariant chain p10 levels in human B-cells was estimated by p10 ELISA, upon treatment with increasing concentration of RO The table shows indiviual EC50 of p10 upregulation in B-cells derived from 6 healthy volunteers. (B) Determination of KM for the fluorogenic substrate Z-Phe-Arg-AMC. (C) Progress curves of hydrolysis of 10 µm Z-Phe-Arg-AMC by 10 nm Cat-S in the presence of no (black dots) or increasing concentration of RO A linear equation was fitted to the data to determine the slope (solid lines). The bottom panel shows the residuals of the fit to the data. (D) Secondary plot of the slopes from panel B as function of RO concentration (dots with color coding from panel B). The Morrison equation was fitted to the data to yield Ki = 66 ± 25 pm (solid black curve; with the concentration of catalytically active Cat-S converged to [E]0 = 6.9 nm). The dashed red lines indicate the 95 % confidence intervals of the fit to the data. (E) Pharmacodynamics of R was determined in C57Bl6 mice with increasing amounts of compound as single dose. Plasma levels of compounds were correlated to the upregulation of p10 in spleenocytes. Supplementary figure 2. FACS gating strategies used for the different splenic immune cell populations. (A-C) Activated dendritic cells CD11c+CD11b+MHC-II, (D-F) activated macrophages CD11c+F480+MHC-II and (G-H) plasma cells CD138+κ-light chain+ Supplementary figure 3. Plasma IgG isotypes in MRL-(Fas)lpr mice. Plasma levels of IgG1 (A), IgG2a (B), and IgG2b (C) were determined by ELISA at different time points from the initiation (week 11) to the end of treatment (week 19). Data are expressed as means ± SEM (n=8 to 10 in
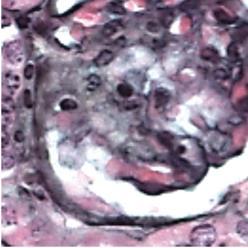
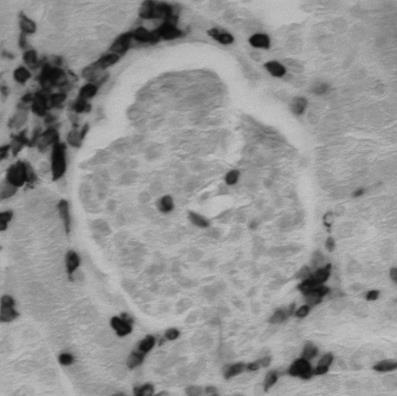
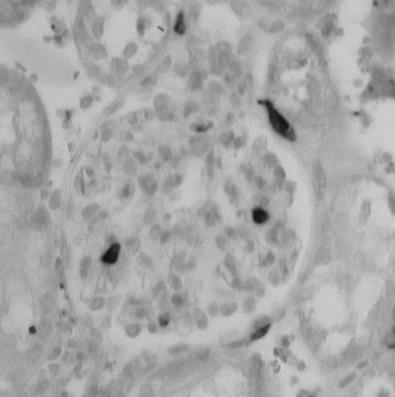
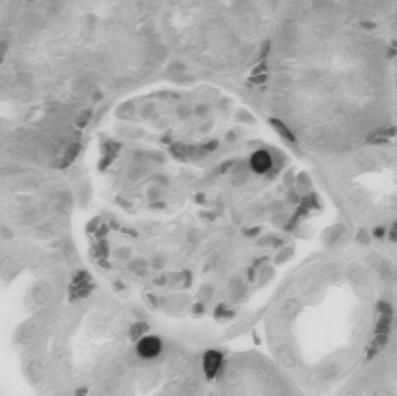
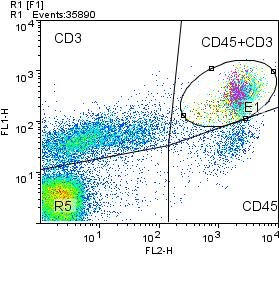
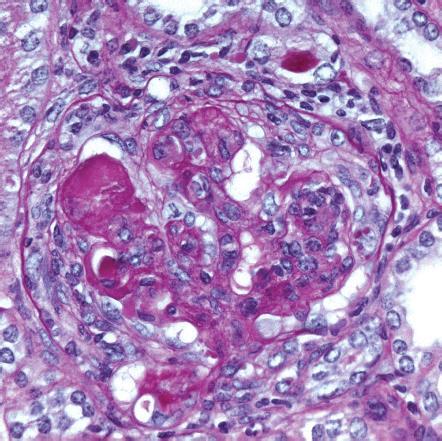
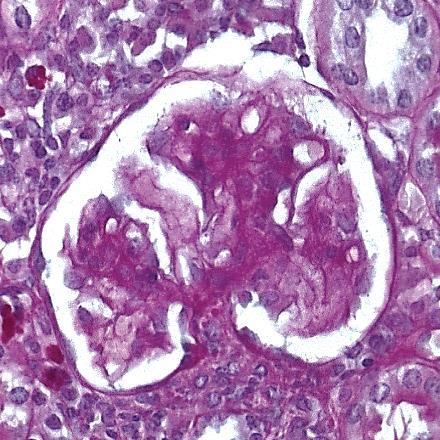
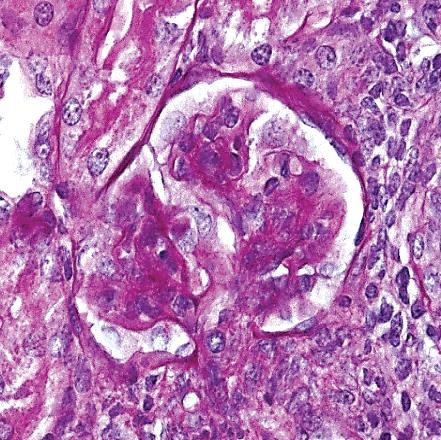
3 each treatment group). *p<0.05, **p<0.01 versus vehicle group. ###p<0.001 base line values versus week 19 values. Supplementary figure 4. Silver staining and CD3 immunostaining of kidney tissue. At the end of the study kidney sections of all mice were stained with Silver (A and C) or for the T cell marker CD3 (B and C). Silver staining was quantified by semiquantitative scoring. The number of intraglomerular CD3 positive cells was counted per glomerulus. Representative images are shown at an original magnification of x400 (scale 25 µm). Data are expressed as means ± SEM. *p<0.05, ***p<0.001 versus vehicle group. Supplementary figure 5. Kidney cytokine and chemokine mrna expression levels. Total kidney cytokine and chemokine mrna expression levels were quantified by real time PCR normalized for the housekeeper 18s rrna. Data represent mean scores ± SEM. *p<0.05, **p<0.01, ***p<0.001 versus vehicle group. Supplementary figure 6. Flow cytometry of intrarenal leukocyte subsets. (A-C) From mice of all groups kidney cell suspensions were prepared for flow cytometry using specific antibodies that identify the respective leukocyte subsets as indicated. Data are expressed as means ± SEM (n=8 to 10 in each treatment group). *p<0.05, **p<0.01, ***p<0.001 versus vehicle group. Supplementary figure 7. Flow cytometric gating strategies. (A-I) FACS gating strategies for identifying different populations of intrarenal immune cells.
4 Supplementary figure 8. Plasma (auto-) antibody profiles in MRL-(Fas)lpr mice with late onset of treatments. Plasma levels of total IgG (A), anti-dsdna IgG (B), IgG2a (C), IgG2b (D), IgM (E), and anti-dsdna IgM (F) were determined by ELISA. Data are expressed as means ± SEM (n=5 to 7 in each treatment group). *p<0.05, **p<0.01 versus vehicle group. ##p<0.01, ###p<0.001 base line values versus week 19 values. Supplementary figure 9. Markers of lupus nephritis in MRL-(Fas)lpr mice with late onset of treatments. Urinary albumin/creatinin (A/C) ratio (A) and blood urea nitrogen (BUN, B) was determined at different time points as indicated. At the end of the study PAS sections were scored for lupus nephritis disease activity (C) and chronicity (D) (scale 25 µm). Data are expressed as means ± SEM (n=5 to 7 in each treatment group). *p<0.05, **p<0.01 versus vehicle group. Representative images are shown at an original magnification of x400 (E). Supplementary figure 10. Cathepsin S levels in ISN-RPN lupus nephritis and CKD patients and Cathepsin S /CD68 double immunostaining in healthy human kidney. (A-D) Cathepsin S levels were measured by ELISA in ISN-RPN lupus nephritis (A) and SLE associated CKD patients (B) and correlation analysis for the same (C and D). Dual immunostaining for Cat-S and the macrophage marker CD68 of healthy human kidney biopsy showed Cat-S positivity in CD68 negative tubular epithelial cells. Representative images are shown at the indicated scale 100 µm.
5 Supplemetary table 1. Slective inhibitory effect of RO on different cathepsins S.NO Cathepsins IC50 (nm) 1 Human Cat-S Mouse Cat-S Human Cat-V Human Cat-K > Human Cat-B > Human Cat-L > Human Cat-F >1000
6 F lu o r e s c e n c e in te n s ity [a.u.] F r a c tio n a l a c tiv ity [v i /v 0 ] V 0 [F U /s ] Supplementary figure 1 A %-Inhibition EC50 in human Bcells RO conc. [nm] B V m a x K M ± 1.2 µ M c (Z -P h e -A r g -A M C ) [µ M ] Donor: D1 D2 D3 D4 D5 D6 Average std RO nm 6.2 C D 7 0 n M n M 6 2 n M 3 n M 4 n M 5 n M n M 7 n M n M 9 n M 1 2 n M 1 5 n M n M 4 0 n M 6 0 n M t [s ] c (R O ) [n M ] E ratio (p10/li) RO x10-9 1x10⁻⁸ 1x10⁻⁷ 1x10⁻⁶ RO (g/ml) (v i /v 0 ) p10/li in vivo: EC50 = 17 nm SD (res.) = c (R O ) [n M ]
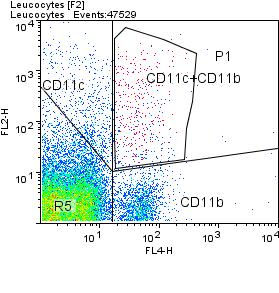
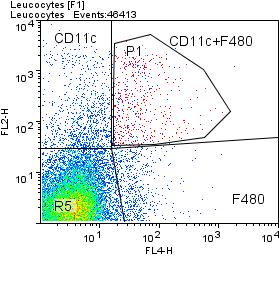
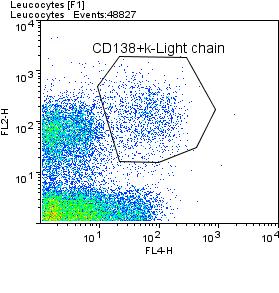
7 Supplementary figure 2 A B C D E F G H
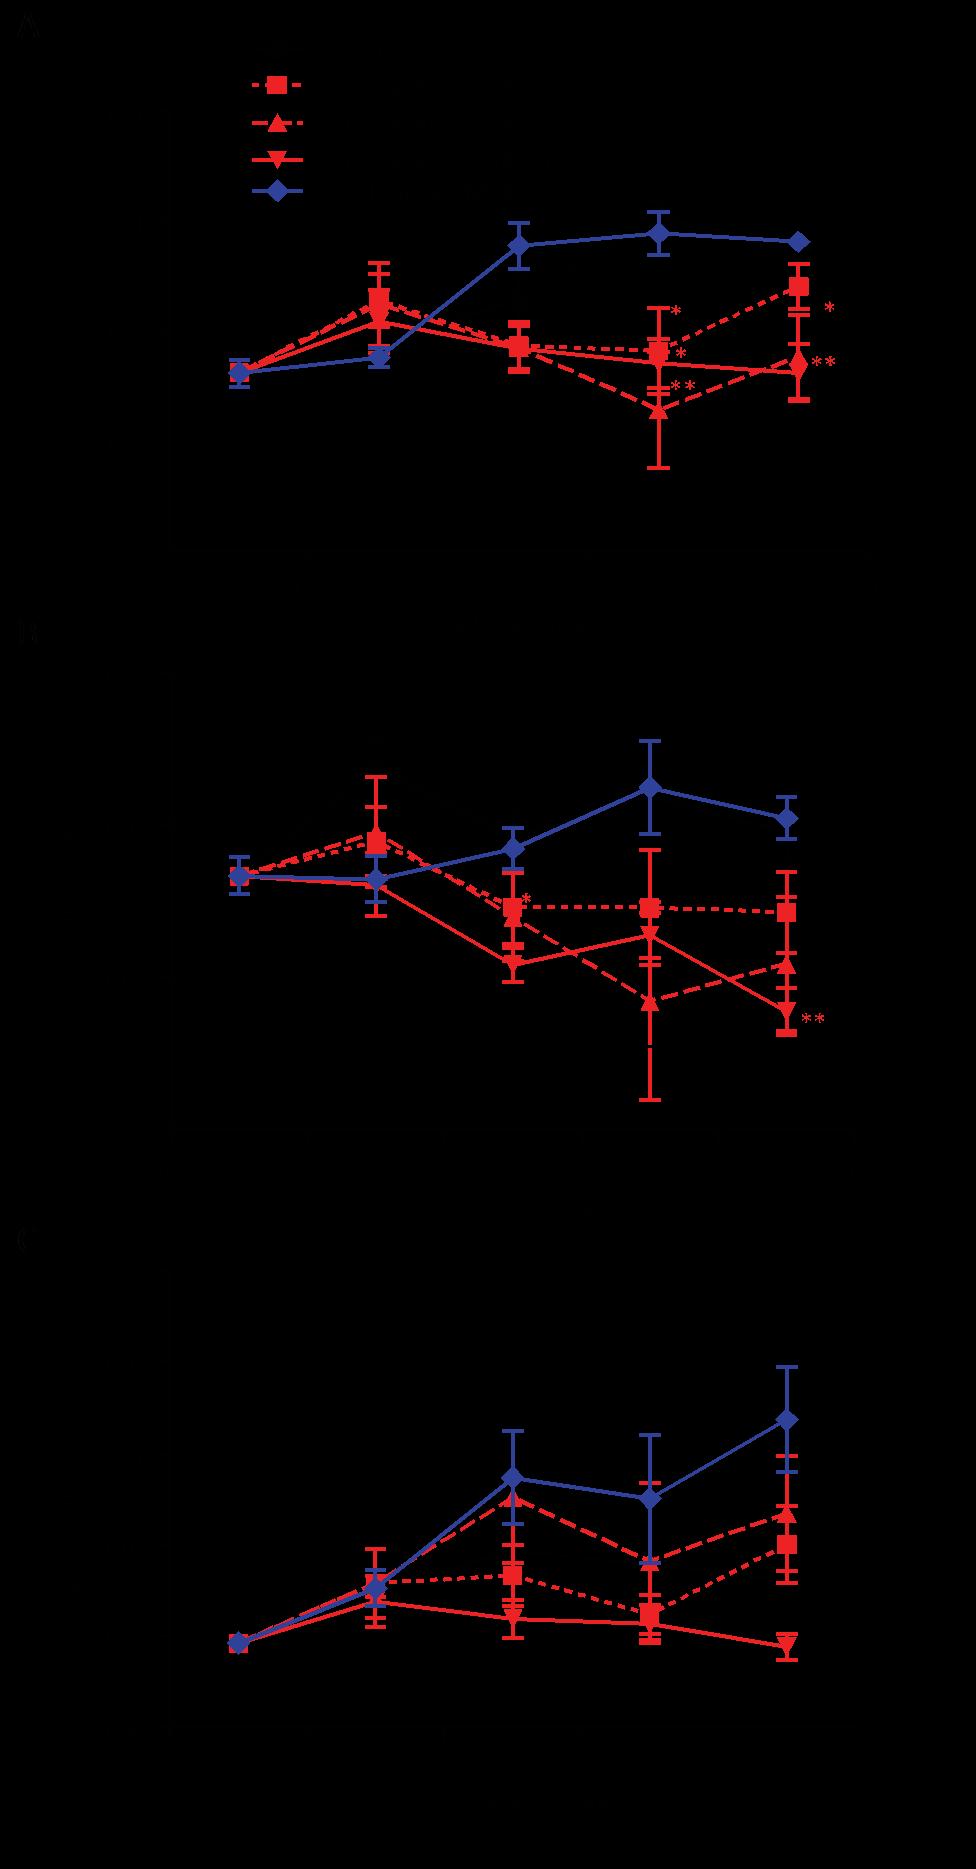
8 Supplementary figure 3
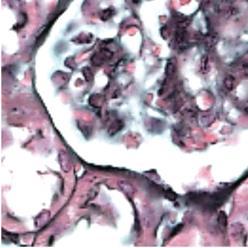
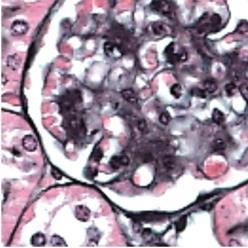
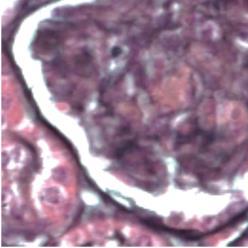
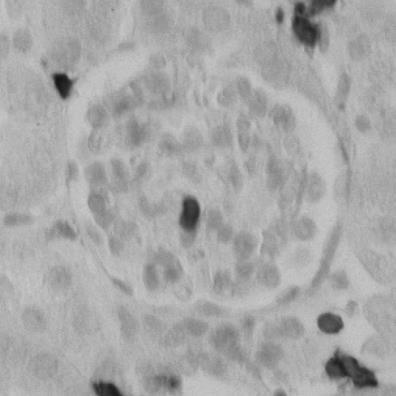
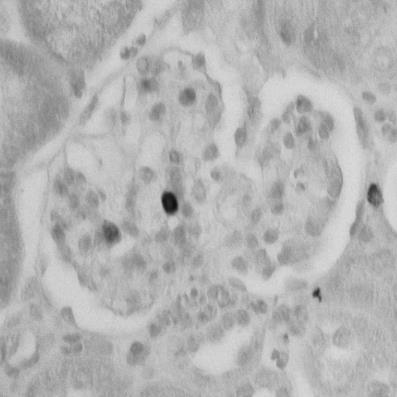
9 Supplementary figure 4 RO MMF 100 mg/kg 30 mg/kg 10 mg/kg 3 mg/kg Vehicle
10 Supplementary figure 5
11 Supplementary figure 6 15 Percentage of total cells * *** * * * ** ** * ** * *** * ** CD45+CD3+ CD45+CD3+CD8+ CD3+CD4-CD8- CD45+CD3+CD4+
12 Supplementary figure 7 A B C D E F G H I
13 Supplementary figure 8
14 Supplementary figure 9 PAS Vehicle 30 mg/kg RO mg/kg MMF
 20 15 10 5 Spearman r -0.")
 0 0 2 4 6 CKD (class) Cat-S CD-68 Cat-S +")
15 Supplementary figure 10 A Cat-S (ng/ml) ** B Cat-S (ng/ml) *** 0 Healthy ISN-RPS LN 0 Healthy CKD C Cat-S (ng/ml) Spearman r p value 0.76 D Cat-S (ng/ml) Spearman r P value E ISN-RPS LN (class) CKD (class) Cat-S CD-68 Cat-S + CD-68
Supporting Information
 Supporting Information Desnues et al. 10.1073/pnas.1314121111 SI Materials and Methods Mice. Toll-like receptor (TLR)8 / and TLR9 / mice were generated as described previously (1, 2). TLR9 / mice were
Supplementary Figure 1. Characterization of basophils after reconstitution of SCID mice
 Supplementary figure legends Supplementary Figure 1. Characterization of after reconstitution of SCID mice with CD4 + CD62L + T cells. (A-C) SCID mice (n = 6 / group) were reconstituted with 2 x 1 6 CD4
Supplementary fig. 1. Crystals induce necroptosis does not involve caspases, TNF receptor or NLRP3. A. Mouse tubular epithelial cells were pretreated
 Supplementary fig. 1. Crystals induce necroptosis does not involve caspases, TNF receptor or NLRP3. A. Mouse tubular epithelial cells were pretreated with zvad-fmk (10µM) and exposed to calcium oxalate
Supplementary Figure 1: TSLP receptor skin expression in dcssc. A: Healthy control (HC) skin with TSLP receptor expression in brown (10x
 skin with TSLP receptor expression in brown (10x") Supplementary Figure 1: TSLP receptor skin expression in dcssc. A: Healthy control (HC) skin with TSLP receptor expression in brown (10x magnification). B: Second HC skin stained for TSLP receptor in brown
Supplementary Figure 1: TSLP receptor skin expression in dcssc. A: Healthy control (HC) skin with TSLP receptor expression in brown (10x magnification). B: Second HC skin stained for TSLP receptor in brown
SUPPLEMENTARY INFORMATION
 doi:1.138/nature1554 a TNF-α + in CD4 + cells [%] 1 GF SPF 6 b IL-1 + in CD4 + cells [%] 5 4 3 2 1 Supplementary Figure 1. Effect of microbiota on cytokine profiles of T cells in GALT. Frequencies of TNF-α
Dual Targeting Nanoparticle Stimulates the Immune
 Dual Targeting Nanoparticle Stimulates the Immune System to Inhibit Tumor Growth Alyssa K. Kosmides, John-William Sidhom, Andrew Fraser, Catherine A. Bessell, Jonathan P. Schneck * Supplemental Figure
Supplementary Figure S1. PTPN2 levels are not altered in proliferating CD8+ T cells. Lymph node (LN) CD8+ T cells from C57BL/6 mice were stained with
 CD8+ T cells from C57BL/6 mice were stained with") Supplementary Figure S1. PTPN2 levels are not altered in proliferating CD8+ T cells. Lymph node (LN) CD8+ T cells from C57BL/6 mice were stained with CFSE and stimulated with plate-bound α-cd3ε (10µg/ml)
Supplementary Figure S1. PTPN2 levels are not altered in proliferating CD8+ T cells. Lymph node (LN) CD8+ T cells from C57BL/6 mice were stained with CFSE and stimulated with plate-bound α-cd3ε (10µg/ml)
Supplementary Information:
 Supplementary Information: Follicular regulatory T cells with Bcl6 expression suppress germinal center reactions by Yeonseok Chung, Shinya Tanaka, Fuliang Chu, Roza Nurieva, Gustavo J. Martinez, Seema
B220 CD4 CD8. Figure 1. Confocal Image of Sensitized HLN. Representative image of a sensitized HLN
 B220 CD4 CD8 Natarajan et al., unpublished data Figure 1. Confocal Image of Sensitized HLN. Representative image of a sensitized HLN showing B cell follicles and T cell areas. 20 µm thick. Image of magnification
SUPPLEMENTAL MATERIAL. Number of patients 14
 SUPPLEMENTAL MATERIAL Supplemental Table 1 Number of patients 14 Age, years 54.9 ± 10.0 Female gender, n (%) 6 (42.9) Diabetes, n (%) 2 (14.3) History of hypertension, n (%) 5 (35.7) Ever smoker, n (%)
LPS CD40 + IL-4. Vorinostat (24 Hours) Vorinostat (24 Hours) Panobinostat (24 Hours) Panobinostat (24 Hours) Romidepsin (48 Hours)
 Vorinostat (24 Hours) Panobinostat (24 Hours) Panobinostat (24 Hours) Romidepsin (48 Hours)") A) CD + IL- B) LPS ( Hours) ( Hours) Cell number (x1-3 ) 1 1 3.7 M 1. M. M.1 M Cell number (x1 - ) 1 1 3. M 1. M.7 M.38 M Cell number (x1-3 ) Cell number (x1-3 ) 3 1 1 1 ( Hours) 7.nM.nM 1.7nM.nM Romidepsin
A) CD + IL- B) LPS ( Hours) ( Hours) Cell number (x1-3 ) 1 1 3.7 M 1. M. M.1 M Cell number (x1 - ) 1 1 3. M 1. M.7 M.38 M Cell number (x1-3 ) Cell number (x1-3 ) 3 1 1 1 ( Hours) 7.nM.nM 1.7nM.nM Romidepsin
Eosinophils are required. for the maintenance of plasma cells in the bone marrow
 Eosinophils are required for the maintenance of plasma cells in the bone marrow Van Trung Chu, Anja Fröhlich, Gudrun Steinhauser, Tobias Scheel, Toralf Roch, Simon Fillatreau, James J. Lee, Max Löhning
Spleen. mlns. E Spleen 4.1. mlns. Spleen. mlns. Mock 17. Mock CD8 HIV-1 CD38 HLA-DR. Ki67. Spleen. Spleen. mlns. Cheng et al. Fig.
 C D E F Mock 17 Mock 4.1 CD38 57 CD8 23.7 HLA-DR Ki67 G H I Cheng et al. Fig.S1 Supplementary Figure 1. persistent infection leads to human T cell depletion and hyper-immune activation. Humanized mice
SUPPLEMENTARY FIGURE 1
 SUPPLEMENTARY FIGURE 1 A LN Cell count (1 ) 1 3 1 CD+ 1 1 CDL lo CD hi 1 CD+FoxP3+ 1 1 1 7 3 3 3 % of cells 9 7 7 % of cells CD+ 3 1 % of cells CDL lo CD hi 1 1 % of CD+ cells CD+FoxP3+ 3 1 % of CD+ T
Integrin CD11b negatively regulates TLR-triggered inflammatory responses by. activating Syk and promoting MyD88 and TRIF degradation via cbl-b
 Integrin CD11b negatively regulates TLR-triggered inflammatory responses by activating Syk and promoting MyD88 and TRIF degradation via cbl-b Chaofeng Han, Jing Jin, Sheng Xu, Haibo Liu, Nan Li, and Xuetao
The toll-like receptor 4 ligands Mrp8 and Mrp14 play a critical role in the development of autoreactive CD8 + T cells
 1 SUPPLEMENTARY INFORMATION The toll-like receptor 4 ligands Mrp8 and Mrp14 play a critical role in the development of autoreactive CD8 + T cells Karin Loser 1,2,6, Thomas Vogl 2,3, Maik Voskort 1, Aloys
NK cell flow cytometric assay In vivo DC viability and migration assay
 NK cell flow cytometric assay 6 NK cells were purified, by negative selection with the NK Cell Isolation Kit (Miltenyi iotec), from spleen and lymph nodes of 6 RAG1KO mice, injected the day before with
Figure S1. Reduction in glomerular mir-146a levels correlate with progression to higher albuminuria in diabetic patients.
 Supplementary Materials Supplementary Figures Figure S1. Reduction in glomerular mir-146a levels correlate with progression to higher albuminuria in diabetic patients. Figure S2. Expression level of podocyte
Supplementary Figure 1. ETBF activate Stat3 in B6 and Min mice colons
 Supplementary Figure 1 ETBF activate Stat3 in B6 and Min mice colons a pstat3 controls Pos Neg ETBF 1 2 3 4 b pstat1 pstat2 pstat3 pstat4 pstat5 pstat6 Actin Figure Legend: (a) ETBF induce predominantly
Supplemental Figure 1. Western blot analysis indicated that MIF was detected in the fractions of
 Supplemental Figure Legends Supplemental Figure 1. Western blot analysis indicated that was detected in the fractions of plasma membrane and cytosol but not in nuclear fraction isolated from Pkd1 null
Therapeutic PD L1 and LAG 3 blockade rapidly clears established blood stage Plasmodium infection
 Supplementary Information Therapeutic PD L1 and LAG 3 blockade rapidly clears established blood stage Plasmodium infection Noah S. Butler, Jacqueline Moebius, Lecia L. Pewe, Boubacar Traore, Ogobara K.
Supplementary figure 1. Systemic delivery of anti-cd47 antibody controls tumor growth in
 T u m o r v o lu m e (m m 3 ) P e rc e n t s u rv iv a l P e rc e n t s u rv iv a l Supplementary data a 1 8 6 4 2 5 1 1 5 2 2 5 3 3 5 4 T im e a fte r tu m o r in o c u la tio n (d ) b c 1 5 1 1 5 * *
Supplementary Figure 1. Antibiotic partially rescues mice from sepsis. (ab) BALB/c mice under CLP were treated with antibiotic or PBS.
 BALB/c mice under CLP were treated with antibiotic or PBS.") 1 Supplementary Figure 1. Antibiotic partially rescues mice from sepsis. (ab) BALB/c mice under CLP were treated with antibiotic or PBS. (a) Survival curves. WT Sham (n=5), WT CLP or WT CLP antibiotic
1 Supplementary Figure 1. Antibiotic partially rescues mice from sepsis. (ab) BALB/c mice under CLP were treated with antibiotic or PBS. (a) Survival curves. WT Sham (n=5), WT CLP or WT CLP antibiotic
Quantitative PPARγ expression affects the balance between tolerance and immunity
 Quantitative PPARγ expression affects the balance between tolerance and immunity Ya-Hui Liu 1, Yau-Sheng Tsai 1,2,3, Shih-Chieh Lin 4, Nan-Shih Liao 5, Ming-Shiou Jan 6, Chung-Tiang Liang 7, Shih-Wen Hsu
Supplementary Figure S I: Effects of D4F on body weight and serum lipids in apoe -/- mice.
 Supplementary Figures: Supplementary Figure S I: Effects of D4F on body weight and serum lipids in apoe -/- mice. Male apoe -/- mice were fed a high-fat diet for 8 weeks, and given PBS (model group) or
Supplemental Information. Aryl Hydrocarbon Receptor Controls. Monocyte Differentiation. into Dendritic Cells versus Macrophages
 Immunity, Volume 47 Supplemental Information Aryl Hydrocarbon Receptor Controls Monocyte Differentiation into Dendritic Cells versus Macrophages Christel Goudot, Alice Coillard, Alexandra-Chloé Villani,
a 10 4 Link et al. Supplementary Figure 1 Nature Immunology: doi: /ni.1842 Cells per mouse ( 10 5 ) TRPV2KO anti-gr1 anti-gr anti-f4/80
 TRPV2KO anti-gr1 anti-gr anti-f4/80") a 10 4 WT 10 4 TRPV2KO 10 3 10 3 anti-gr1 10 2 10 1 anti-gr1 10 2 10 1 10 0 10 0 10 1 10 2 10 3 10 4 anti-f4/80 42.3 45.2 10 0 10 0 10 1 10 2 10 3 10 4 anti-f4/80 10 4 10 4 40 42.5 anti-cd11b 10 3 10 2
a 10 4 WT 10 4 TRPV2KO 10 3 10 3 anti-gr1 10 2 10 1 anti-gr1 10 2 10 1 10 0 10 0 10 1 10 2 10 3 10 4 anti-f4/80 42.3 45.2 10 0 10 0 10 1 10 2 10 3 10 4 anti-f4/80 10 4 10 4 40 42.5 anti-cd11b 10 3 10 2
Supplemental Information. Regulatory T Cells Promote Macrophage. Efferocytosis during Inflammation Resolution
 Immunity, Volume 9 Supplemental Information Regulatory T Cells Promote Macrophage Efferocytosis during Inflammation Resolution Jonathan D. Proto, Amanda C. Doran, Galina Gusarova, Arif Yurdagul Jr., Erdi
Supplementary Figure 1. IL-12 serum levels and frequency of subsets in FL patients. (A) IL-12
 IL-12") 1 Supplementary Data Figure legends Supplementary Figure 1. IL-12 serum levels and frequency of subsets in FL patients. (A) IL-12 serum levels measured by multiplex ELISA (Luminex) in FL patients before
1 Supplementary Data Figure legends Supplementary Figure 1. IL-12 serum levels and frequency of subsets in FL patients. (A) IL-12 serum levels measured by multiplex ELISA (Luminex) in FL patients before
Endogenous TNFα orchestrates the trafficking of neutrophils into and within lymphatic vessels during acute inflammation
 SUPPLEMENTARY INFORMATION Endogenous TNFα orchestrates the trafficking of neutrophils into and within lymphatic vessels during acute inflammation Samantha Arokiasamy 1,2, Christian Zakian 1, Jessica Dilliway
Supplementary Figure 1 Protease allergens induce IgE and IgG1 production. (a-c)
") 1 Supplementary Figure 1 Protease allergens induce IgE and IgG1 production. (a-c) Serum IgG1 (a), IgM (b) and IgG2 (c) concentrations in response to papain immediately before primary immunization (day
1 Supplementary Figure 1 Protease allergens induce IgE and IgG1 production. (a-c) Serum IgG1 (a), IgM (b) and IgG2 (c) concentrations in response to papain immediately before primary immunization (day
The encephalitogenicity of TH17 cells is dependent on IL-1- and IL-23- induced production of the cytokine GM-CSF
 CORRECTION NOTICE Nat.Immunol. 12, 568 575 (2011) The encephalitogenicity of TH17 cells is dependent on IL-1- and IL-23- induced production of the cytokine GM-CSF Mohamed El-Behi, Bogoljub Ciric, Hong
pro-b large pre-b small pre-b CCCP (µm) Rag1 -/- ;33.C9HCki
 Rag1 -/- ;33.C9HCki") a TMRM FI (Median) b TMRM FI (Median) c 20 15 10 5 0 8 6 4 2 0 pro-b large pre-b small pre-b 0 10 20 30 40 50 60 70 80 90 100 TMRM (nm) pro-b large pre-b small pre-b 0 1 2 4 8 16 32 64 128 256 CCCP (mm)
a TMRM FI (Median) b TMRM FI (Median) c 20 15 10 5 0 8 6 4 2 0 pro-b large pre-b small pre-b 0 10 20 30 40 50 60 70 80 90 100 TMRM (nm) pro-b large pre-b small pre-b 0 1 2 4 8 16 32 64 128 256 CCCP (mm)
SUPPLEMENTARY INFORMATION
 doi:10.1038/nature10134 Supplementary Figure 1. Anti-inflammatory activity of sfc. a, Autoantibody immune complexes crosslink activating Fc receptors, promoting activation of macrophages, and WWW.NATURE.COM/NATURE
Suppl Video: Tumor cells (green) and monocytes (white) are seeded on a confluent endothelial
 and monocytes (white) are seeded on a confluent endothelial") Supplementary Information Häuselmann et al. Monocyte induction of E-selectin-mediated endothelial activation releases VE-cadherin junctions to promote tumor cell extravasation in the metastasis cascade
Supplementary Information Häuselmann et al. Monocyte induction of E-selectin-mediated endothelial activation releases VE-cadherin junctions to promote tumor cell extravasation in the metastasis cascade
L1 on PyMT tumor cells but Py117 cells are more responsive to IFN-γ. (A) Flow
 Flow") A MHCI B PD-L1 Fold expression 8 6 4 2 Fold expression 3 2 1 No tx 1Gy 2Gy IFN Py117 Py117 Supplementary Figure 1. Radiation and IFN-γ enhance MHCI expression and PD- L1 on PyMT tumor cells but Py117 cells
A MHCI B PD-L1 Fold expression 8 6 4 2 Fold expression 3 2 1 No tx 1Gy 2Gy IFN Py117 Py117 Supplementary Figure 1. Radiation and IFN-γ enhance MHCI expression and PD- L1 on PyMT tumor cells but Py117 cells
Appendix Figure S1 A B C D E F G H
 ppendix Figure S1 C D E F G H ppendix Figure S1. RT and chemotherapy alter PD-L1 expression in PDC cells. Flow cytometric analysis of PD-L1 expression in () KPC and () Pan02 cells following treatment with
John Langowski, Ph.D. Nektar Therapeutics San Francisco, CA USA
 NKTR-38: a selective, first-in-class IL-2 pathway agonist which increases number and suppressive function of regulatory T cells for the treatment of immune inflammatory disorders John Langowski, Ph.D.
SUPPLEMENTARY INFORMATION
 Supplemental Figure 1. Furin is efficiently deleted in CD4 + and CD8 + T cells. a, Western blot for furin and actin proteins in CD4cre-fur f/f and fur f/f Th1 cells. Wild-type and furin-deficient CD4 +
Supplementary Figure 1. BMS enhances human T cell activation in vitro in a
 Supplementary Figure 1. BMS98662 enhances human T cell activation in vitro in a concentration-dependent manner. Jurkat T cells were activated with anti-cd3 and anti-cd28 antibody in the presence of titrated
Supplementary Figure 1 Chemokine and chemokine receptor expression during muscle regeneration (a) Analysis of CR3CR1 mrna expression by real time-pcr
 Analysis of CR3CR1 mrna expression by real time-pcr") Supplementary Figure 1 Chemokine and chemokine receptor expression during muscle regeneration (a) Analysis of CR3CR1 mrna expression by real time-pcr at day 0, 1, 4, 10 and 21 post- muscle injury. (b)
Supplementary Figure 1 Chemokine and chemokine receptor expression during muscle regeneration (a) Analysis of CR3CR1 mrna expression by real time-pcr at day 0, 1, 4, 10 and 21 post- muscle injury. (b)
well for 2 h at rt. Each dot represents an individual mouse and bar is the mean ±
 Supplementary data: Control DC Blimp-1 ko DC 8 6 4 2-2 IL-1β p=.5 medium 8 6 4 2 IL-2 Medium p=.16 8 6 4 2 IL-6 medium p=.3 5 4 3 2 1-1 medium IL-1 n.s. 25 2 15 1 5 IL-12(p7) p=.15 5 IFNγ p=.65 4 3 2 1
Supplemental Information. CD4 + CD25 + Foxp3 + Regulatory T Cells Promote. Th17 Cells In Vitro and Enhance Host Resistance
 Immunity, Volume 34 Supplemental Information D4 + D25 + + Regulatory T ells Promote Th17 ells In Vitro and Enhance Host Resistance in Mouse andida albicans Th17 ell Infection Model Pushpa Pandiyan, Heather
Supplementary Figures
 Supplementary Figures Supplementary Fig. 1. Galectin-3 is present within tumors. (A) mrna expression levels of Lgals3 (galectin-3) and Lgals8 (galectin-8) in the four classes of cell lines as determined
LPS LPS P6 - + Supplementary Fig. 1.
 P6 LPS - - - + + + - LPS + + - - P6 + Supplementary Fig. 1. Pharmacological inhibition of the JAK/STAT blocks LPS-induced HMGB1 nuclear translocation. RAW 267.4 cells were stimulated with LPS in the absence
Supplemental Figure 1. Cell-bound Cetuximab reduces EGFR staining intensity. Blood
 Antibody-mediated depletion of CD19-CAR T cells Supplemental 1 Supplemental Materials Supplemental Figure 1. Supplemental Figure 1. Cell-bound Cetuximab reduces EGFR staining intensity. Blood cells were
The autoimmune disease-associated PTPN22 variant promotes calpain-mediated Lyp/Pep
 SUPPLEMENTARY INFORMATION The autoimmune disease-associated PTPN22 variant promotes calpain-mediated Lyp/Pep degradation associated with lymphocyte and dendritic cell hyperresponsiveness Jinyi Zhang, Naima
and follicular helper T cells is Egr2-dependent. (a) Diagrammatic representation of the
 Diagrammatic representation of the") Supplementary Figure 1. LAG3 + Treg-mediated regulation of germinal center B cells and follicular helper T cells is Egr2-dependent. (a) Diagrammatic representation of the experimental protocol for the
Supplementary Figure 1. LAG3 + Treg-mediated regulation of germinal center B cells and follicular helper T cells is Egr2-dependent. (a) Diagrammatic representation of the experimental protocol for the
Supplemental Figure 1. Activated splenocytes upregulate Serpina3g and Serpina3f expression.
 Relative Serpin expression 25 2 15 1 5 Serpina3f 1 2 3 4 5 6 8 6 4 2 Serpina3g 1 2 3 4 5 6 C57BL/6 DBA/2 Supplemental Figure 1. Activated splenocytes upregulate Serpina3g and Serpina3f expression. Splenocytes
Figure S1 Generation of γ-gt DTR transgenic mice. (A) Schematic construct of the transgene. (B)
 Schematic construct of the transgene. (B)") Figure S1 Generation of γ-gt DTR transgenic mice. (A) Schematic construct of the transgene. (B) PCR identified expected hhb-egf band (left panel) and HA tag band (right) in kidneys of transgenic (TG) mice
Figure S1 Generation of γ-gt DTR transgenic mice. (A) Schematic construct of the transgene. (B) PCR identified expected hhb-egf band (left panel) and HA tag band (right) in kidneys of transgenic (TG) mice
Nature Medicine: doi: /nm.3922
 Title: Glucocorticoid-induced tumor necrosis factor receptor-related protein co-stimulation facilitates tumor regression by inducing IL-9-producing helper T cells Authors: Il-Kyu Kim, Byung-Seok Kim, Choong-Hyun
Pearson r = P (one-tailed) = n = 9
 = n = 9") 8F4-Specific Lysis, % 1 UPN1 UPN3 8 UPN7 6 Pearson r =.69 UPN2 UPN5 P (one-tailed) =.192 4 UPN8 n = 9 2 UPN9 UPN4 UPN6 5 1 15 2 25 8 8F4, % Max MFI Supplementary Figure S1. AML samples UPN1-UPN9 show variable
8F4-Specific Lysis, % 1 UPN1 UPN3 8 UPN7 6 Pearson r =.69 UPN2 UPN5 P (one-tailed) =.192 4 UPN8 n = 9 2 UPN9 UPN4 UPN6 5 1 15 2 25 8 8F4, % Max MFI Supplementary Figure S1. AML samples UPN1-UPN9 show variable
Cell isolation. Spleen and lymph nodes (axillary, inguinal) were removed from mice
 were removed from mice") Supplementary Methods: Cell isolation. Spleen and lymph nodes (axillary, inguinal) were removed from mice and gently meshed in DMEM containing 10% FBS to prepare for single cell suspensions. CD4 + CD25
Supplementary Methods: Cell isolation. Spleen and lymph nodes (axillary, inguinal) were removed from mice and gently meshed in DMEM containing 10% FBS to prepare for single cell suspensions. CD4 + CD25
Mst1 regulates integrin-dependent thymocyte trafficking and antigen recognition in the thymus
 Mst1 regulates integrin-dependent thymocyte trafficking and antigen recognition in the thymus Yoshihiro Ueda, Koko Katagiri, Takashi Tomiyama, Kaneki Yasuda, Katsuyoshi Habiro, Tomoya Katakai, Susumu Ikehara,
Supplemental Figure Legends
 Supplemental Figure Legends Supplemental Figure 1. SemaB / mice have normal immune cell populations. Cells were prepared from the spleens of WT and SemaB / mice, stained with various antibodies and then
Supplementary Information and Figure legends
 Supplementary Information and Figure legends Table S1. Primers for quantitative RT-PCR Target Sequence (5 -> 3 ) Target Sequence (5 -> 3 ) DAB2IP F:TGGACGATGTGCTCTATGCC R:GGATGGTGATGGTTTGGTAG Snail F:CCTCCCTGTCAGATGAGGAC
Supplemental Figures: Supplemental Figure 1
 Supplemental Figures: Supplemental Figure 1 Suppl. Figure 1. BM-DC infection with H. pylori does not induce cytotoxicity and treatment of BM-DCs with H. pylori sonicate, but not heat-inactivated bacteria,
pplementary Figur Supplementary Figure 1. a.
 pplementary Figur Supplementary Figure 1. a. Quantification by RT-qPCR of YFV-17D and YFV-17D pol- (+) RNA in the supernatant of cultured Huh7.5 cells following viral RNA electroporation of respective
Supplementary Figure 1: Expression of NFAT proteins in Nfat2-deleted B cells (a+b) Protein expression of NFAT2 (a) and NFAT1 (b) in isolated splenic
 Protein expression of NFAT2 (a) and NFAT1 (b) in isolated splenic") Supplementary Figure 1: Expression of NFAT proteins in Nfat2-deleted B cells (a+b) Protein expression of NFAT2 (a) and NFAT1 (b) in isolated splenic B cells from WT Nfat2 +/+, TCL1 Nfat2 +/+ and TCL1 Nfat2
Supplementary Figure 1: Expression of NFAT proteins in Nfat2-deleted B cells (a+b) Protein expression of NFAT2 (a) and NFAT1 (b) in isolated splenic B cells from WT Nfat2 +/+, TCL1 Nfat2 +/+ and TCL1 Nfat2
Supplementary Figure 1
 Supplementary Figure 1 Expression of apoptosis-related genes in tumor T reg cells. (a) Identification of FOXP3 T reg cells by FACS. CD45 + cells were gated as enriched lymphoid cell populations with low-granularity.
Supplementary Figure 1. Genotyping strategies for Mcm3 +/+, Mcm3 +/Lox and Mcm3 +/- mice and luciferase activity in Mcm3 +/Lox mice. A.
 Supplementary Figure 1. Genotyping strategies for Mcm3 +/+, Mcm3 +/Lox and Mcm3 +/- mice and luciferase activity in Mcm3 +/Lox mice. A. Upper part, three-primer PCR strategy at the Mcm3 locus yielding
Supplementary Fig. 1 p38 MAPK negatively regulates DC differentiation. (a) Western blot analysis of p38 isoform expression in BM cells, immature DCs
 Western blot analysis of p38 isoform expression in BM cells, immature DCs") Supplementary Fig. 1 p38 MAPK negatively regulates DC differentiation. (a) Western blot analysis of p38 isoform expression in BM cells, immature DCs (idcs) and mature DCs (mdcs). A myeloma cell line expressing
Supplementary Fig. 1 p38 MAPK negatively regulates DC differentiation. (a) Western blot analysis of p38 isoform expression in BM cells, immature DCs (idcs) and mature DCs (mdcs). A myeloma cell line expressing
Supplementary information. The proton-sensing G protein-coupled receptor T-cell death-associated gene 8
 1 Supplementary information 2 3 The proton-sensing G protein-coupled receptor T-cell death-associated gene 8 4 (TDAG8) shows cardioprotective effects against myocardial infarction 5 Akiomi Nagasaka 1+,
Supplementary Figures
 Supplementary Figures Supplementary Figure 1 Characterization of stable expression of GlucB and sshbira in the CT26 cell line (a) Live cell imaging of stable CT26 cells expressing green fluorescent protein
Supplementary Materials for
 www.sciencemag.org/content/348/6241/aaa825/suppl/dc1 Supplementary Materials for A mucosal vaccine against Chlamydia trachomatis generates two waves of protective memory T cells Georg Stary,* Andrew Olive,
Supplementary Materials for
 www.sciencesignaling.org/cgi/content/full/8/381/ra59/dc1 Supplementary Materials for Analysis of single-cell cytokine secretion reveals a role for paracrine signaling in coordinating macrophage responses
Chronic variable stress activates hematopoietic stem cells
 SUPPLEMENTARY INFORMATION Chronic variable stress activates hematopoietic stem cells Timo Heidt *, Hendrik B. Sager *, Gabriel Courties, Partha Dutta, Yoshiko Iwamoto, Alex Zaltsman, Constantin von zur
a surface permeabilized
 a surface permeabilized RAW 64.7 P388D1 J774 b CD11b + Ly-6G - Blood Monocytes WT Supplementary Figure 1. Cell surface expression on macrophages and DCs. (a) RAW64.7, P388D1, and J774 cells were subjected
SHREE ET AL, SUPPLEMENTAL MATERIALS. (A) Workflow for tumor cell line derivation and orthotopic implantation.
 Workflow for tumor cell line derivation and orthotopic implantation.") SHREE ET AL, SUPPLEMENTAL MATERIALS SUPPLEMENTAL FIGURE AND TABLE LEGENDS Supplemental Figure 1. Derivation and characterization of TS1-TGL and TS2-TGL PyMT cell lines and development of an orthotopic
SHREE ET AL, SUPPLEMENTAL MATERIALS SUPPLEMENTAL FIGURE AND TABLE LEGENDS Supplemental Figure 1. Derivation and characterization of TS1-TGL and TS2-TGL PyMT cell lines and development of an orthotopic
Fig. S1. Upregulation of K18 and K14 mrna levels during ectoderm specification of hescs. Quantitative real-time PCR analysis of mrna levels of OCT4
 Fig. S1. Upregulation of K18 and K14 mrna levels during ectoderm specification of hescs. Quantitative real-time PCR analysis of mrna levels of OCT4 (n=3 independent differentiation experiments for each
Supplementary Figure 1. Expression of EPO and EPOR during self-limited versus delayed
 Supplementary Figure 1. Expression of EPO and EPOR during self-limited versus delayed inflammation resolution. a: Flow cytometry analysis showing the electronic gating strategy used to identify peritoneal
Supplementary Figure 1. mrna expression of chitinase and chitinase-like protein in splenic immune cells. Each splenic immune cell population was
 Supplementary Figure 1. mrna expression of chitinase and chitinase-like protein in splenic immune cells. Each splenic immune cell population was sorted by FACS. Surface markers for sorting were CD11c +
Crucial role for human Toll-like receptor 4 in the development of contact allergy to nickel
 Supplementary Figures 1-8 Crucial role for human Toll-like receptor 4 in the development of contact allergy to nickel Marc Schmidt 1,2, Badrinarayanan Raghavan 1,2, Verena Müller 1,2, Thomas Vogl 3, György
Figure S1 Genetic or pharmacologic COX-2 inhibition led to increased kidney
 SUPPLEMENTAL FIGURE LEGENDS Figure S1 Genetic or pharmacologic COX-2 inhibition led to increased kidney macrophage infiltration. Wild type or COX-2 -/- mice (2 months old, C57/Bl6 background) were treated
Supporting Information
 Supporting Information Idoyaga et al. 10.1073/pnas.0812247106 SSC a) Single cell suspension 99 Aqua b) Live cells 96 -W c) Singlets 92 -A CD19+ER119 d) CD19 ER119 cells 97 CD3 e) CD3 cells 27 f) DX5 cells
Supplementary Materials for
 www.sciencesignaling.org/cgi/content/full/4/199/ra75/dc1 Supplementary Materials for Signaling by the Matrix Proteoglycan Decorin Controls Inflammation and Cancer Through PDCD4 and MicroRNA-21 Rosetta
DC were seeded into tissue culture dishes in IMDM 2% FCS, and added with PMN. (1:1; PMN: DC) for 16h also in the presence of DNAse (100 U/ml); DC were
 for 16h also in the presence of DNAse (100 U/ml); DC were") Supplementary methods Flow cytometric analysis of DCs. DC were seeded into tissue culture dishes in IMDM 2% FCS, and added with PMN (1:1; PMN: DC) for 16h also in the presence of DNAse (100 U/ml); DC were
Supplementary methods Flow cytometric analysis of DCs. DC were seeded into tissue culture dishes in IMDM 2% FCS, and added with PMN (1:1; PMN: DC) for 16h also in the presence of DNAse (100 U/ml); DC were
CD14 + S100A9 + Monocytic Myeloid-Derived Suppressor Cells and Their Clinical Relevance in Non-Small Cell Lung Cancer
 CD14 + S1A9 + Monocytic Myeloid-Derived Suppressor Cells and Their Clinical Relevance in Non-Small Cell Lung Cancer Po-Hao, Feng M.D., Kang-Yun, Lee, M.D. Ph.D., Ya-Ling Chang, Yao-Fei Chan, Lu- Wei, Kuo,Ting-Yu
Generation of ST2-GFP reporter mice and characterization of ILC1 cells following infection
 Supplementary Figure 1 Generation of ST2-GFP reporter mice and characterization of ILC1 cells following infection with influenza virus. (a) ST2-GFP reporter mice were generated as described in Methods.
Supplementary Figure 1.
 Supplementary Figure 1. Female Pro-ins2 -/- mice at 5-6 weeks of age were either inoculated i.p. with a single dose of CVB4 (1x10 5 PFU/mouse) or PBS and treated with αgalcer or control vehicle. On day
Supplementary Figure S1. Flow cytometric analysis of the expression of Thy1 in NH cells. Flow cytometric analysis of the expression of T1/ST2 and
 Supplementary Figure S1. Flow cytometric analysis of the expression of Thy1 in NH cells. Flow cytometric analysis of the expression of T1/ST2 and Thy1 in NH cells derived from the lungs of naïve mice.
Supplemental Table 1: Demographics and characteristics of study participants. Male, n (%) 3 (20%) 6 (50%) Age, years [mean ± SD] 33.3 ± ± 9.
![Supplemental Table 1: Demographics and characteristics of study participants. Male, n (%) 3 (20%) 6 (50%) Age, years [mean ± SD] 33.3 ± ± 9.](/thumbs/90/103696086.jpg "Supplemental Table 1: Demographics and characteristics of study participants. Male, n (%) 3 (20%) 6 (50%) Age, years [mean ± SD] 33.3 ± ± 9.") SUPPLEMENTAL DATA Supplemental Table 1: Demographics and characteristics of study participants Lean (n=15) Obese (n=12) Male, n (%) 3 (20%) 6 (50%) Age, years [mean ± SD] 33.3 ± 9.5 44.8 ± 9.1 White, n
SUPPLEMENTAL DATA Supplemental Table 1: Demographics and characteristics of study participants Lean (n=15) Obese (n=12) Male, n (%) 3 (20%) 6 (50%) Age, years [mean ± SD] 33.3 ± 9.5 44.8 ± 9.1 White, n
Supplementary Table; Supplementary Figures and legends S1-S21; Supplementary Materials and Methods
 Silva et al. PTEN posttranslational inactivation and hyperactivation of the PI3K/Akt pathway sustain primary T cell leukemia viability Supplementary Table; Supplementary Figures and legends S1-S21; Supplementary
COPD lungs show an attached stratified mucus layer that separate. bacteria from the epithelial cells resembling the protective colonic
 COPD lungs show an attached stratified mucus layer that separate bacteria from the epithelial cells resembling the protective colonic mucus SUPPLEMENTARY TABLES AND FIGURES Tables S1 S8, page 1 and separate
Combined Rho-kinase inhibition and immunogenic cell death triggers and propagates immunity against cancer
 Supplementary Information Combined Rho-kinase inhibition and immunogenic cell death triggers and propagates immunity against cancer Gi-Hoon Nam, Eun-Jung Lee, Yoon Kyoung Kim, Yeonsun Hong, Yoonjeong Choi,
Control GST GST-RAP. α2-mg. 170 kda. b-actin. 42 kda LRP-1
 % of max Supplementary Figure 1 Control GST GST-RP 17 kda α2-mg 42 kda b-actin Gate: CD11c+ (DCs) Gate: F4/8+ (Mfs) IgG Cd11cCre + Lrp1 fl/fl LRP-1 Supplementary figure 1. () MDCs were pretreated with
Supporting Information
 Supporting Information Stegbauer et al. 10.1073/pnas.0903602106 SI Methods Analysis of Plasma Renin Activity (PRA) and ACE Activity. PRA and serum ACE activity levels were determined by RIA (RENCTK, DiaSorin;
Supplementary Figure 1. Deletion of Smad3 prevents B16F10 melanoma invasion and metastasis in a mouse s.c. tumor model.
 A B16F1 s.c. Lung LN Distant lymph nodes Colon B B16F1 s.c. Supplementary Figure 1. Deletion of Smad3 prevents B16F1 melanoma invasion and metastasis in a mouse s.c. tumor model. Highly invasive growth
5K ALDEFLUOR-positive/ CXCR1-negative. 5K ALDEFLUOR-positive/ CXCR1-positive BAAA BAAA CXCR1-APC BAAA BAAA CXCR1-APC
 A +DEAB -DEAB K ALDEFLUOR-positive/ CXCR-negative BAAA BAAA CXCR-APC B +DEAB -DEAB K ALDEFLUOR-positive/ CXCR-positive BAAA BAAA CXCR-APC C Supplemental Figure. Tumorigenicity of the ALDEFLUOR-positive/CXCR-positive
<10. IL-1β IL-6 TNF + _ TGF-β + IL-23
 3 ns 25 ns 2 IL-17 (pg/ml) 15 1 ns ns 5 IL-1β IL-6 TNF
Supplemental Material
 Supplemental Material Supplementary Fig. 1. EETs stimulate primary tumor growth. a) Schematic presentation of genetic and pharmacological tools used to manipulate endogenous EET levels. b) Endothelial
Blocking antibodies and peptides. Rat anti-mouse PD-1 (29F.1A12, rat IgG2a, k), PD-
, PD-") Supplementary Methods Blocking antibodies and peptides. Rat anti-mouse PD-1 (29F.1A12, rat IgG2a, k), PD- L1 (10F.9G2, rat IgG2b, k), and PD-L2 (3.2, mouse IgG1) have been described (24). Anti-CTLA-4 (clone
Supplementary Methods Blocking antibodies and peptides. Rat anti-mouse PD-1 (29F.1A12, rat IgG2a, k), PD- L1 (10F.9G2, rat IgG2b, k), and PD-L2 (3.2, mouse IgG1) have been described (24). Anti-CTLA-4 (clone
Nanobiologics Promotes Organ Transplant Acceptance
 Immunity, Volume 49 Supplemental Information Inhibiting Inflammation with Myeloid Cell-Specific Nanobiologics Promotes Organ Transplant Acceptance Mounia S. Braza, Mandy M.T. van Leent, Marnix Lameijer,
Human and mouse T cell regulation mediated by soluble CD52 interaction with Siglec-10. Esther Bandala-Sanchez, Yuxia Zhang, Simone Reinwald,
 Human and mouse T cell regulation mediated by soluble CD52 interaction with Siglec-1 Esther Bandala-Sanchez, Yuxia Zhang, Simone Reinwald, James A. Dromey, Bo Han Lee, Junyan Qian, Ralph M Böhmer and Leonard
Canberra, Australia). CD11c-DTR-OVA-GFP (B6.CD11c-OVA), B6.luc + and. Cancer Research Center, Germany). B6 or BALB/c.FoxP3-DTR-GFP mice were
. CD11c-DTR-OVA-GFP (B6.CD11c-OVA), B6.luc + and. Cancer Research Center, Germany). B6 or BALB/c.FoxP3-DTR-GFP mice were") Supplemental Materials and Methods Mice Female C57BL/6 (B6, I-E null, H-2 b ), BALB/c (H-2 d ) + ), FVB/N (H-2 q, I-E null, CD45.1 + ), and B6D2F1 (H-2 b/d ) mice were purchased from the Animal Resources
Supplemental Materials and Methods Mice Female C57BL/6 (B6, I-E null, H-2 b ), BALB/c (H-2 d ) + ), FVB/N (H-2 q, I-E null, CD45.1 + ), and B6D2F1 (H-2 b/d ) mice were purchased from the Animal Resources
Tbk1-TKO! DN cells (%)! 15! 10!
! 15! 10!") a! T Cells! TKO! B Cells! TKO! b! CD4! 8.9 85.2 3.4 2.88 CD8! Tbk1-TKO! 1.1 84.8 2.51 2.54 c! DN cells (%)! 4 3 2 1 DP cells (%)! 9 8 7 6 CD4 + SP cells (%)! 5 4 3 2 1 5 TKO! TKO! TKO! TKO! 15 1 5 CD8
a! T Cells! TKO! B Cells! TKO! b! CD4! 8.9 85.2 3.4 2.88 CD8! Tbk1-TKO! 1.1 84.8 2.51 2.54 c! DN cells (%)! 4 3 2 1 DP cells (%)! 9 8 7 6 CD4 + SP cells (%)! 5 4 3 2 1 5 TKO! TKO! TKO! TKO! 15 1 5 CD8
Supplementary Information. Tissue-wide immunity against Leishmania. through collective production of nitric oxide
 Supplementary Information Tissue-wide immunity against Leishmania through collective production of nitric oxide Romain Olekhnovitch, Bernhard Ryffel, Andreas J. Müller and Philippe Bousso Supplementary
% of live splenocytes. STAT5 deletion. (open shapes) % ROSA + % floxed
 % ROSA + % floxed") Supp. Figure 1. a 14 1 1 8 6 spleen cells (x1 6 ) 16 % of live splenocytes 5 4 3 1 % of live splenocytes 8 6 4 b 1 1 c % of CD11c + splenocytes (closed shapes) 8 6 4 8 6 4 % ROSA + (open shapes) % floxed
Supp. Figure 1. a 14 1 1 8 6 spleen cells (x1 6 ) 16 % of live splenocytes 5 4 3 1 % of live splenocytes 8 6 4 b 1 1 c % of CD11c + splenocytes (closed shapes) 8 6 4 8 6 4 % ROSA + (open shapes) % floxed
Bead Based Assays for Cytokine Detection
 Bead Based Assays for Cytokine Detection September 27, 2014 6 th EFIS-EJI South East European Immunology School SEEIS 2014 Timisoara, Romania The Cells of the Immune System The Immune Reaction (Th2) (Th1)
NKTR-255: Accessing The Immunotherapeutic Potential Of IL-15 for NK Cell Therapies
 NKTR-255: Accessing The Immunotherapeutic Potential Of IL-15 for NK Cell Therapies Saul Kivimäe Senior Scientist, Research Biology Nektar Therapeutics NK Cell-Based Cancer Immunotherapy, September 26-27,