SUPPLEMENTARY INFORMATION. Supplemental Figure 1. Body weight and blood glucose parameters of chow-diet (CD)
|
|
|
- Kristin Chandler
- 6 years ago
- Views:
Transcription
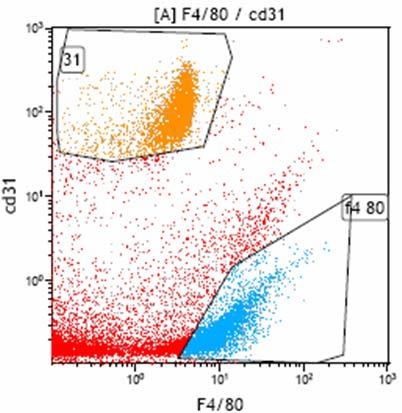
1 SUPPLEMENTARY INFORMATION LEGENDS Supplemental Figure. Body weight and blood glucose parameters of chow-diet (CD) fed and high-fat diet (HFD) fed mice. (A) Body weight was measured at the beginning of diet (day ) and at termination ( months) for both CD-fed and HFD-fed mice. (B) Blood glucose concentration was measured at the beginning of diet (day ) and at the termination ( months) for both CD-fed and HFD-fed mice. (C) Intra-peritoneal glucose tolerance test (ipgtt) was performed at 7 weeks of diet from both CD-fed and HFD-fed mice. Time course measurement of blood glucose concentration was performed following an intra-peritoneal injection of glucose ( g/kg) after 6h of fasting. (D) Iulin tolerance test (ITT) was performed at 7 weeks of diet on both CD-fed and HFD-fed mice. Time course measurement of blood glucose concentration was performed following an intra-peritoneal injection of iulin (.7 IU/kg) after 6h of fasting. Results are plotted as whiskers box (whiskers: minimum to maximum values). p <., p <.. Supplemental Figure. Cell-sorting from SVF from ob/ob mice ewat by FACS. Cells were stained using appropriated antibodies (see Material and Methods) then sorted by FACS. Gating was performed according to the antibody signal inteity for endothelial cells (CD- /CD+, orange), preadipocytes/amscs (CD-/CD-, pink) and macrophages (F/8+, blue). For lymphocytes, gating was performed according both cell size/structure and CD+ signal inteity (green). Results are displayed as coloured isolated cell-type according to gating from signal inteity or size/structure. Supplemental Figure. Expression of markers of adipocytes and preadipocytes/amscs from ob/ob mice ewat. Expression of adipocyte markers (Adiponectin, PPARg and Fabp) and preadipocyte/amsc markers (CD and Sca-) was monitored by qpcr in both
2 adipocyte fraction from ewat from ob/ob mice and preadipocyte/amsc sorted from SVF from ewat from ob/ob mice. Results for (A) Adiponectin, (B) PPARγ and (C) Fabp are displayed as expression relatively to preadipocytes/amscs. Results of expression of (D) CD and (E) Sca- are displayed as fold expression compared to adipocytes. p <., p <.. Supplemental Figure. Expression of markers of macrophages, lymphocytes, haematopoietic cells and endothelial cells from SVF from ob/ob mice ewat. Expression levels of macrophage marker (F/8), lymphocyte marker (CDe), haematopoietic cell marker (CD) and endothelial cell marker (CD) were quantified by qpcr in preadipocytes/amscs (dark blue), endothelial cells (red), macrophages (light blue), lymphocytes (green) sorted from SVF of ob/ob mice ewat. Results for (A) F/8, (B) CDe, (C) CD and (D) CD are displayed as fold-expression compared to non-fractionated SVF. p <., p <.. Supplemental Figure. Cell-sorting from SVF from both CD-fed and HFD-fed mice ewat by FACS. (A) Body weight was measured at the beginning of diet (day ) and at the termination ( months) from both CD-fed and HFD-fed mice. p <. (B) Dendogram depicting the preadipocytes SVF-sorting strategy. (C) Gating strategy for preadipocyte sorting and isolation from ewat from both CD-fed and HFD-fed mice. Preadipocytes were identified as CD - CD - Sca- + CD9 + CD + CD - cells. Supplemental Figure 6. Expression of identified mirna in preadipocytes sorted from SVF from CD-fed and HFD-fed mice ewat. Expression levels of (A) mir-a, (B) mir- b, (C) mir--p, (D) mir--p and (E) mir--p were quantified by qpcr in preadipocytes isolated from SVF from CD-fed and HFD-fed mice ewat. Results are
3 displayed as expression of each mirna in preadipocytes from HFD-fed mice ewat relative to that in preadipocytes from CD-fed mice ewat. n indicates the number of mice used for each experiment. p <.. Supplemental Figure 7. Expression level of mir-a and mir-b in subcutaneous WAT of lean, normoglycemic, glucose intolerant and diabetic patients. Expression level of (A) mir-a and (B) mir-b was quantified by qpcr in the subcutaneous WAT of lean, normoglycemic, glucose intolerant and diabetic patients. Results are displayed as the expression of each mirna in tissue from obese patients relative to that in control lean patients. Results are plotted as whiskers box (whiskers: minimum to maximum values). Supplemental Figure 8. Expression level of VTmR related to each identified mirna in endothelial cells, macrophages and lymphocytes from SVF from ob/ob mice ewat. Deregulated VTmRs related to mir-a (Flt, Gata6, Vcam, Zeb and Zfpm), mir-b (Flt, Ptpn, Zeb and Zfpm), mir--p (Bmp7 and Dnmt) and mir--p (Lrg, Mapk, Rasa and Tnc) in non-fractionated ewat were selected for subsequent expression level analysis in the distinct cell subtypes sorted from SVF from ob/ob mice ewat. Results are displayed as expression of each VTmR in endothelial cells, macrophages and lymphocytes relatively to preadipocytes/amscs from SVF from ob/ob mice ewat. Supplemental Figure 9. Expression of selected VTmRs in preadipocytes sorted from SVF from CD-fed and HFD-fed mice ewat. Expression levels of (A) Flt, (B) Vcam and (C) Bmp7 were quantified by qpcr in preadipocytes isolated from SVF from CD-fed and HFD-fed mice ewat. Results are displayed as expression of each gene in preadipocytes from HFD-fed mice ewat relative to that in preadipocytes from CD-fed mice ewat. n indicates the number of mice used for each experiment. p <..
4 A Oger F. et al., Figure SI Body weight (g) Day months Day months chow diet high fat diet Blood glucose (mg/dl) Day months Day months chow diet high fat diet 8 ipgtt Blood glucose (mg/dl) 6 high fat diet chow diet 6 9 Time (min) ITT Blood glucose (mg/dl) high fat diet chow diet 6 9 Time (min)


5 Oger F. et al., Figure SI
6 A. F/8 Oger F. et al., Figure SI.. SVF preadipocytes /AMSCs endothelial cells macrophages lymphocytes CDe SVF preadipocytes /AMSCs endothelial cells macrophages lymphocytes. CD.. SVF preadipocytes /AMSCs endothelial cells macrophages lymphocytes CD SVF preadipocytes /AMSCs endothelial cells macrophages lymphocytes
7 Oger F. et al., Figure SI A CD B Sca Adipocytes Preadipocytes/AMSCs Adipocytes Preadipocytes/AMSCs Adiponectin D Pparγ Preadipocytes/AMSCs Adipocytes Preadipocytes/AMSCs Adipocytes Fabp Preadipocytes/AMSCs Adipocytes

8 Oger F. et al., Figure SI A 8 B ewat SVF Adipocytes Body weight (g) 6 p=.68 CD- CD+ Sca-- Sca-+ Day months Day months chow diet high fat diet CD+ CD- CD9- CD9+ CD- CD+ mirna expression gene expression Preadipocytes sorted from HFD-fed mice Preadipocytes sorted from CD-fed mice
9 Oger F. et al., Figure SI6 A mir-a B mir-b. p=.7... CD HFD CD HFD n= n= n= n= mir--p D mir--p.. CD HFD CD HFD n= n= n= n= mir--p.. CD HFD n= n=
10 obese patients Oger F. et al., Figure SI7 diabetic obese patients A mir-a B mir-b control normoglycemic glucose intolerant diabetic control normoglycemic glucose intolerant
11 Flt Vcam Oger F. et al., Figure SI8 Zfpm Ptpn Bmp7 Dnmt Tnc Mapk Rasa Lrg 8 Gata6 Zeb 6 6
12 Oger F. et al., Figure SI9 A Vcam.. CD HFD n= n= Bmp7.. CD HFD n= n=
13 Primer sequences ( ) Genes Genebank accession number ACTGTCAAGCTAGAGGTGTCC Flt NM_8 ACCTATAGACACCCTCATCCTC GTGCCTCGACCACTTGCTAT Gata6 NM_8 ACAGAGCCACTGCTGTTACC AACCGAATCCCCAACTTGTGCAG Vcam NM_69 TCTCCAGCTTCTCTCAGGAAATGCC GCATGTGACCTGTGTGACAA Zeb NM_6 CACACTCGTGAGGCCTCTTA AATGCACCAAGAGCTTTTCC Zfpm NM_766 GGGCAGGAACTCTTCCATTT CACAATGGGGAGGACAACTT Ptpn NM_ CCAGTGGCTGTGGGATAAAT AGCGATTTGACAACGAGACC Bmp7 NM_77 GCTGTCCAGCAAGAAGAGGT CCTAGTTCCGTGGCTACGAGGAGAA Dnmt NM_99 TCTCTCTCCTCTGCAGCCGACTCA AGTGGGAGCTTCCAGGAACA Tnc NM_67 TGGTGTCCAGACGACCTTCTG CACGTTGGTACAGAGCTCCA Mapk NM_99 TGTGATTCAGCTGGTCAAGG TGTCCATGACAGTCTCTTCG Rasa NM_ GGAGTTTCTCCTGCAAAGTAAAA AGAATTCCACCGACAGATGG Lrg NM_9796 GCCTCAAGGAATGCCTGATA CATGCTCAACATCTCCCCCTTCTCC Rplp (6B) NM_ GGGAAGGTGTAATCCGTCTCCACAG GTGCAGAAAGAGCTCAGGGAC Sca- NM_76 TCCATCAGGGTAGGGGCAGG TAAGACCACACCAGCCATCTC CD NM_6 TGGAGTTCCAGAGCCTGAAG CCGTGATGGAAGACCACTCG Pparγ NM_6 AGGCCTGTTGTAGAGCTGGGT C GTGATGCCTTTGTGGGAACCTGG Fabp NM_6 TGTGGCAAAGCCCACTCCCACT GTGATGGCAGAGATGGCACT Adipoq (Adiponectin) NM_96 GCTTCTCCAGGCTCTCCTTT CTTTGGCTATGGGCTTCCAGTC F/8 NM_ GCAAGGAGGACAGAGTTTATCGTG
14 CTGCTACACACCAGCCTCAA CAGGTCCACCTCCACACAGT AGGCGACAGAGGTGTCTGAT TTTCTCCAAACTGATTGTATTCCA CACCTGCAAAGTGGAATCAA TCTAACTTCGGCTTGGGAAA CDe CD CD NM_768 NM_ NM_886 Supplemental Table. Primers used for qpcr.
15 MATERIALS AND METHODS SUPPLEMENTAL INFORMATION Intraperitoneal glucose tolerance test (ipgtt) and iulin tolerance test (ITT). For glucose and iulin tolerance tests, g/kg glucose or.7 IU/kg iulin (Actrapid; Novo Nordisk), respectively, was injected intraperitoneally after a 6-h fast and blood glucose was measured (Accu-Check; Roche Diagnostics) at indicated time points. Preparation of stromal vascular fraction cells and isolation of preadipocytes. Epididymal adipose tissue was cut into small pieces and digested at 7 C for min with collagenase type I (Sigma) followed by centrifugation at g for min. Cell pellets were suspended in ice-cold x PBS and filtered through a 7 µm-sieve, and the SVF fraction was collected by centrifugation at g for min. Cells were stained with rat antibody agait CD (clone -F, BD Biosciences), CD (clone 9, BioLegend), Sca- (clone D7, ebioscience), CD (clone HM, BioLegend), CD (clone M/69, BD Biosciences) and CD9 (clone HMB-, BioLegend). Preadipocytes were identified as CD - CD - Sca- + CD9 + CD + CD - cells () and sorted using the FACSAria (BD Bioscience) cell sorter, or analysed using the LSRII Fortessa (BD Bioscience) and FlowJo software (Tree Star Inc). The purity of isolated preadipocytes was > 9% after cell sorting.. Berry R, Rodeheffer MS. Characterization of the adipocyte cellular lineage in vivo. Nat Cell Biol ;():-8.
Supplementary Figure 1. DNA methylation of the adiponectin promoter R1, Pparg2, and Tnfa promoter in adipocytes is not affected by obesity.
 Supplementary Figure 1. DNA methylation of the adiponectin promoter R1, Pparg2, and Tnfa promoter in adipocytes is not affected by obesity. (a) Relative amounts of adiponectin, Ppar 2, C/ebp, and Tnf mrna
SUPPLEMENTARY INFORMATION
 -. -. SUPPLEMENTARY INFORMATION DOI: 1.1/ncb86 a WAT-1 WAT- BAT-1 BAT- sk-muscle-1 sk-muscle- mir-133b mir-133a mir-6 mir-378 mir-1 mir-85 mir-378 mir-6a mir-18 mir-133a mir- mir- mir-341 mir-196a mir-17
We obtained Male C57BL/6J, ob/ob, and Cd8a-deficient mice from Charles River Japan
 Supplementary Methods Animal models We obtained Male C57BL/6J, ob/ob, and Cd8a-deficient mice from Charles River Japan or Jackson Laboratories. All mice were housed under a 12-h light-dark cycle and allowed
SUPPLEMENTARY INFORMATION. CXCR4 inhibitors could benefit to HER2 but not to Triple-Negative. breast cancer patients
 SUPPLEMENTARY INFORMATION CXCR4 inhibitors could benefit to HER2 but not to Triple-Negative breast cancer patients Lefort S. 1,2, Thuleau A. 3, Kieffer Y. 1,2, Sirven P. 1,2, Bieche I. 4, Marangoni E.
Supplementary Figure 1
 Supplementary Figure 1 a Percent of body weight! (%) 4! 3! 1! Epididymal fat Subcutaneous fat Liver SD Percent of body weight! (%) ** 3! 1! SD Percent of body weight! (%) 6! 4! SD ** b Blood glucose (mg/dl)!
General Laboratory methods Plasma analysis: Gene Expression Analysis: Immunoblot analysis: Immunohistochemistry:
 General Laboratory methods Plasma analysis: Plasma insulin (Mercodia, Sweden), leptin (duoset, R&D Systems Europe, Abingdon, United Kingdom), IL-6, TNFα and adiponectin levels (Quantikine kits, R&D Systems
Tissue factor-par2 signaling promotes diet-induced obesity and adipose
 Supplementary figures for Tissue factor-par2 signaling promotes diet-induced obesity and adipose inflammation. Leylla Badeanlou 1, Christian Furlan-Freguia 2, Guang Yang 1, Wolfram Ruf 2,3, and Fahumiya
Supplemental Information Supplementary Table 1. Tph1+/+ Tph1 / Analyte Supplementary Table 2. Tissue Vehicle LP value
 Supplemental Information Supplementary Table. Urinary and adipose tissue catecholamines in Tph +/+ and Tph / mice fed a high fat diet for weeks. Tph +/+ Tph / Analyte ewat ibat ewat ibat Urine (ng/ml)
Supplementary Figure 1
 Supplementary Figure 1 how HFD how HFD Epi WT p p Hypothalamus p p Inguinal WT T Liver Lean mouse adipocytes p p p p p p Obese mouse adipocytes Kidney Muscle Spleen Heart p p p p p p p p Extracellular
1.5 ASK1KO fed. fasted 16 hrs w/o water. Fed. 4th. 4th WT ASK1KO N=29, 11(WT), ,5(ASK1KO) ASK1KO ASK1KO **** Time [h]
![1.5 ASK1KO fed. fasted 16 hrs w/o water. Fed. 4th. 4th WT ASK1KO N=29, 11(WT), ,5(ASK1KO) ASK1KO ASK1KO **** Time [h]](/thumbs/87/97258189.jpg "1.5 ASK1KO fed. fasted 16 hrs w/o water. Fed. 4th. 4th WT ASK1KO N=29, 11(WT), ,5(ASK1KO) ASK1KO ASK1KO **** Time [h]") 7: 13: 19: 1: 7: 151117 a 151117 4th 4th b c RQ.95 KO.9.85.8.75.7 light dark light dark.65 7: 19: 7: 19: 7: Means ± SEM, N=6 RQ 1..9.8.7.6.6 KO CL (-) CL (+) ibat weight ratio (/body weight) [%].5.4.3.2.1
7: 13: 19: 1: 7: 151117 a 151117 4th 4th b c RQ.95 KO.9.85.8.75.7 light dark light dark.65 7: 19: 7: 19: 7: Means ± SEM, N=6 RQ 1..9.8.7.6.6 KO CL (-) CL (+) ibat weight ratio (/body weight) [%].5.4.3.2.1
Supplementary Information
 Supplementary Information GADD34-deficient mice develop obesity, nonalcoholic fatty liver disease, hepatic carcinoma and insulin resistance Naomi Nishio and Ken-ichi Isobe Department of Immunology, Nagoya
Metabolic ER stress and inflammation in white adipose tissue (WAT) of mice with dietary obesity.
 of mice with dietary obesity.") Supplementary Figure 1 Metabolic ER stress and inflammation in white adipose tissue (WAT) of mice with dietary obesity. Male C57BL/6J mice were fed a normal chow (NC, 10% fat) or a high-fat diet (HFD,
Supplementary Figure 1 Metabolic ER stress and inflammation in white adipose tissue (WAT) of mice with dietary obesity. Male C57BL/6J mice were fed a normal chow (NC, 10% fat) or a high-fat diet (HFD,
GPR120 *** * * Liver BAT iwat ewat mwat Ileum Colon. UCP1 mrna ***
 a GPR120 GPR120 mrna/ppia mrna Arbitrary Units 150 100 50 Liver BAT iwat ewat mwat Ileum Colon b UCP1 mrna Fold induction 20 15 10 5 - camp camp SB202190 - - - H89 - - - - - GW7647 Supplementary Figure
a b c Physical appearance of mice Lean mass Adipocyte size d e f
 LFD HFD LFD HFD Area under curve (GTT) HFD-VSL#3 LFD HFD Area under curve (ITT) HFD-VSL#3 Liver TG content (% l) HFD-VSL#3 LFD HFD HFD-VSL#3 LFD HFD HFD-VSL#3 LFD HFD HFD + VSL#3 Lean mass (gm) Mean adipocyte
Mouse Glu-OC (undercarboxylated osteocalcin) and Gla-OC (carboxylated osteocalcin) levels were
 and Gla-OC (carboxylated osteocalcin) levels were") Supplemental Data Supplemental Materials and Methods Plasma measurements Mouse Glu-OC (undercarboxylated osteocalcin) and Gla-OC (carboxylated osteocalcin) levels were determined using ELISA kits according
Supplemental Data Supplemental Materials and Methods Plasma measurements Mouse Glu-OC (undercarboxylated osteocalcin) and Gla-OC (carboxylated osteocalcin) levels were determined using ELISA kits according
Supplementary Figure 1 a
 Supplementary Figure a Normalized expression/tbp (A.U.).6... Trip-br transcripts Trans Trans Trans b..5. Trip-br Ctrl LPS Normalized expression/tbp (A.U.) c Trip-br transcripts. adipocytes.... Trans Trans
Blocking antibodies and peptides. Rat anti-mouse PD-1 (29F.1A12, rat IgG2a, k), PD-
, PD-") Supplementary Methods Blocking antibodies and peptides. Rat anti-mouse PD-1 (29F.1A12, rat IgG2a, k), PD- L1 (10F.9G2, rat IgG2b, k), and PD-L2 (3.2, mouse IgG1) have been described (24). Anti-CTLA-4 (clone
Supplementary Methods Blocking antibodies and peptides. Rat anti-mouse PD-1 (29F.1A12, rat IgG2a, k), PD- L1 (10F.9G2, rat IgG2b, k), and PD-L2 (3.2, mouse IgG1) have been described (24). Anti-CTLA-4 (clone
control kda ATGL ATGLi HSL 82 GAPDH * ** *** WT/cTg WT/cTg ATGLi AKO/cTg AKO/cTg ATGLi WT/cTg WT/cTg ATGLi AKO/cTg AKO/cTg ATGLi iwat gwat ibat
 body weight (g) tissue weights (mg) ATGL protein expression (relative to GAPDH) HSL protein expression (relative to GAPDH) ### # # kda ATGL 55 HSL 82 GAPDH 37 2.5 2. 1.5 1..5 2. 1.5 1..5.. Supplementary
Epigenetic regulation of macrophage polarization and inflammation by DNA methylation in obesity
 Downloaded from http:// on December 17, 2017. https://doi.org/10.1172/jci.insight.87748 Epigenetic regulation of macrophage polarization and inflammation by DNA methylation in obesity Xianfeng Wang, 1
Osteopontin mediates obesity-induced adipose tissue macrophage infiltration and insulin resistance in mice
 Research article Osteopontin mediates obesity-induced adipose tissue macrophage infiltration and insulin resistance in mice Takashi Nomiyama, 1 Diego Perez-Tilve, 2 Daisuke Ogawa, 1 Florence Gizard, 1
Supplementary Figure 1. DJ-1 modulates ROS concentration in mouse skeletal muscle.
 Supplementary Figure 1. DJ-1 modulates ROS concentration in mouse skeletal muscle. (a) mrna levels of Dj1 measured by quantitative RT-PCR in soleus, gastrocnemius (Gastroc.) and extensor digitorum longus
Targeting of the circadian clock via CK1δ/ε to improve glucose homeostasis in obesity
 Targeting of the circadian clock via CK1δ/ε to improve glucose homeostasis in obesity Peter S. Cunningham, Siobhán A. Ahern, Laura C. Smith, Carla S. da Silva Santos, Travis T. Wager and David A. Bechtold
sequences of a styx mutant reveals a T to A transversion in the donor splice site of intron 5
 sfigure 1 Styx mutant mice recapitulate the phenotype of SHIP -/- mice. (A) Analysis of the genomic sequences of a styx mutant reveals a T to A transversion in the donor splice site of intron 5 (GTAAC
York criteria, 6 RA patients and 10 age- and gender-matched healthy controls (HCs).
.") MATERIALS AND METHODS Study population Blood samples were obtained from 15 patients with AS fulfilling the modified New York criteria, 6 RA patients and 10 age- and gender-matched healthy controls (HCs).
MATERIALS AND METHODS Study population Blood samples were obtained from 15 patients with AS fulfilling the modified New York criteria, 6 RA patients and 10 age- and gender-matched healthy controls (HCs).
SUPPLEMENTARY INFORMATION
 DOI: 10.1038/ncb2211 a! mir-143! b! mir-103/107! let-7a! mir-144! mir-122a! mir-126-3p! mir-194! mir-27a! mir-30c! Figure S1 Northern blot analysis of mir-143 expression dependent on feeding conditions.
SUPPLEMENTARY INFORMATION
 doi: 1.138/nature7221 Brown fat selective genes 12 1 Control Q-RT-PCR (% of Control) 8 6 4 2 Ntrk3 Cox7a1 Cox8b Cox5b ATPase b2 ATPase f1a1 Sirt3 ERRα Elovl3/Cig3 PPARα Zic1 Supplementary Figure S1. stimulates
Supplementary Materials for
 www.sciencetranslationalmedicine.org/cgi/content/full/5/213/213ra164/dc1 Supplementary Materials for HIV-1 Vpr Induces Adipose Dysfunction in Vivo Through Reciprocal Effects on PPAR/GR Co-Regulation Neeti
Primer sequences Target Sequence F Sequence R TNF-α (Tnfa) TCAGCCGATTTGCTATCTCAT A
 TCAGCCGATTTGCTATCTCAT A") Supplementary Table 1. Q- and RT-PR primers used in this study. Primer sequences Target Sequence F Sequence R TNF-α (Tnfa) TGGTTTGTTTT GTTTGGGGTTG T hemokine (- motif) ligand 5 (cl5) GTGTTTGTTT TGGTGGTG
Supplementary Table 1. Q- and RT-PR primers used in this study. Primer sequences Target Sequence F Sequence R TNF-α (Tnfa) TGGTTTGTTTT GTTTGGGGTTG T hemokine (- motif) ligand 5 (cl5) GTGTTTGTTT TGGTGGTG
A synergistic anti-obesity effect by a combination of capsinoids and cold temperature through the promotion of beige adipocyte biogenesis
 A synergistic anti-obesity effect by a combination of capsinoids and cold temperature through the promotion of beige adipocyte biogenesis Kana Ohyama, 1,2 Yoshihito Nogusa, 1 Kosaku Shinoda, 2 Katsuya
Interferon γ regulates idiopathic pneumonia syndrome, a. Th17 + CD4 + T-cell-mediated GvH disease
 Interferon γ regulates idiopathic pneumonia syndrome, a Th17 + CD4 + T-cell-mediated GvH disease Nora Mauermann, Julia Burian, Christophe von Garnier, Stefan Dirnhofer, Davide Germano, Christine Schuett,
Supplementary Table 2. Plasma lipid profiles in wild type and mutant female mice submitted to a HFD for 12 weeks wt ERα -/- AF-1 0 AF-2 0
 Supplementary Table 1. List of specific primers used for gene expression analysis. Genes Primer forward Primer reverse Hprt GCAGTACAGCCCCAAAATGG AACAAAGTCTGGCCTGTATCCA Srebp-1c GGAAGCTGTCGGGGTAGCGTC CATGTCTTCAAATGTGCAATCCAT
Table 1. Oligonucleotides and RT-PCR conditions Supplementary Material and Methods Fig. 1
 Table 1. Oligonucleotides and RT-PCR conditions. Overview of PCR templates, gene accession number of sequences used as template, product size, annealing temperatures and optimal cycles, cdna and MgCl 2
Stromal cell cadherin-11 regulates adipose tissue inflammation and diabetes
 Stromal cell cadherin-11 regulates adipose tissue inflammation and diabetes Sook Kyung Chang, 1 Ayano C. Kohlgruber, 1 Fumitaka Mizoguchi, 1 Xavier Michelet, 1 Benjamin J. Wolf, 1 Kevin Wei, 1 Pui Y. Lee,
STAT4 Deficiency Reduces Obesity-Induced Insulin Resistance and Adipose Tissue Inflammation
 ORIGINAL ARTICLE STAT4 Deficiency Reduces Obesity-Induced Insulin Resistance and Adipose Tissue Inflammation Anca D. Dobrian, 1 Elena V. Galkina, 2 Qian Ma, 1 Margaret Hatcher, 1 Sabai Myo Aye, 1 Mathew
Supplemental Table 1. Plasma NEFA and liver triglyceride levels in ap2-hif1ako and ap2-hif2ako mice under control and high fat diets.
 Supplemental Table 1. Plasma NEFA and liver triglyceride levels in Hif1aKO and Hif2aKO mice under control and high fat diets. Hif1a (n=6) Hif1aK O (n=6) Hif2a Hif2aK O Hif1a (n=5) Hif1aKO (n=5) Hif2a Hif2aK
Supplementary Information
 Supplementary Information Notch deficiency decreases hepatic lipid accumulation by induction of fatty acid oxidation No-Joon Song,#, Ui Jeong Yun,#, Sunghee Yang, Chunyan Wu, Cho-Rong Seo, A-Ryeong Gwon,,
Supporting Information
 Supporting Information Desnues et al. 10.1073/pnas.1314121111 SI Materials and Methods Mice. Toll-like receptor (TLR)8 / and TLR9 / mice were generated as described previously (1, 2). TLR9 / mice were
Supplementary Figure S1. Flow cytometric analysis of the expression of Thy1 in NH cells. Flow cytometric analysis of the expression of T1/ST2 and
 Supplementary Figure S1. Flow cytometric analysis of the expression of Thy1 in NH cells. Flow cytometric analysis of the expression of T1/ST2 and Thy1 in NH cells derived from the lungs of naïve mice.
SUPPLEMENTARY INFORMATION
 DOI:.38/ncb3399 a b c d FSP DAPI 5mm mm 5mm 5mm e Correspond to melanoma in-situ Figure a DCT FSP- f MITF mm mm MlanaA melanoma in-situ DCT 5mm FSP- mm mm mm mm mm g melanoma in-situ MITF MlanaA mm mm
Serum Amyloid A3 Gene Expression in Adipocytes is an Indicator. of the Interaction with Macrophages
 Serum Amyloid A3 Gene Expression in Adipocytes is an Indicator of the Interaction with Macrophages Yohei Sanada, Takafumi Yamamoto, Rika Satake, Akiko Yamashita, Sumire Kanai, Norihisa Kato, Fons AJ van
Supporting Information
 Supporting Information Charalambous et al. 10.1073/pnas.1406119111 SI Experimental Procedures Serum and Tissue Biochemistry. Enzymatic assay kits were used for determination of plasma FFAs (Roche), TAGs
A microrna-34a/fgf21 Regulatory Axis and Browning of White Fat
 A microrna-34a/fgf21 Regulatory Axis and Browning of White Fat Jongsook Kim Kemper, Ph.D Department of Molecular and Integrative Physiology, University of Illinois at Urbana-Champaign, USA 213 International
Suppl Video: Tumor cells (green) and monocytes (white) are seeded on a confluent endothelial
 and monocytes (white) are seeded on a confluent endothelial") Supplementary Information Häuselmann et al. Monocyte induction of E-selectin-mediated endothelial activation releases VE-cadherin junctions to promote tumor cell extravasation in the metastasis cascade
Supplementary Information Häuselmann et al. Monocyte induction of E-selectin-mediated endothelial activation releases VE-cadherin junctions to promote tumor cell extravasation in the metastasis cascade
IL-6Rα IL-6RαT-KO KO. IL-6Rα f/f bp. f/f 628 bp deleted 368 bp. 500 bp
 STD H 2 O WT KO IL-6Rα f/f IL-6Rα IL-6RαT-KO KO 1000 bp 500 bp f/f 628 bp deleted 368 bp Supplementary Figure 1 Confirmation of T-cell IL-6Rα deficiency. (a) Representative histograms and (b) quantification
Supplemental Table 1: Demographics and characteristics of study participants. Male, n (%) 3 (20%) 6 (50%) Age, years [mean ± SD] 33.3 ± ± 9.
![Supplemental Table 1: Demographics and characteristics of study participants. Male, n (%) 3 (20%) 6 (50%) Age, years [mean ± SD] 33.3 ± ± 9.](/thumbs/90/103696086.jpg "Supplemental Table 1: Demographics and characteristics of study participants. Male, n (%) 3 (20%) 6 (50%) Age, years [mean ± SD] 33.3 ± ± 9.") SUPPLEMENTAL DATA Supplemental Table 1: Demographics and characteristics of study participants Lean (n=15) Obese (n=12) Male, n (%) 3 (20%) 6 (50%) Age, years [mean ± SD] 33.3 ± 9.5 44.8 ± 9.1 White, n
SUPPLEMENTAL DATA Supplemental Table 1: Demographics and characteristics of study participants Lean (n=15) Obese (n=12) Male, n (%) 3 (20%) 6 (50%) Age, years [mean ± SD] 33.3 ± 9.5 44.8 ± 9.1 White, n
Supporting Online Material for
 www.sciencemag.org/cgi/content/full/science.118828/dc1 Supporting Online Material for Is an Anti-Inflammatory Adipokine That Modulates Metabolic Dysfunction in Obesity Noriyuki Ouchi, Akiko Higuchi, Koji
SUPPLEMENTARY DATA. Supplementary Table 1. Primers used in qpcr
 Supplementary Table 1. Primers used in qpcr Gene forward primer (5'-3') reverse primer (5'-3') β-actin AGAGGGAAATCGTGCGTGAC CAATAGTGATGACCTGGCCGT Hif-p4h-2 CTGGGCAACTACAGGATAAAC GCGTCCCAGTCTTTATTTAGATA
Supplemental Information. Increased 4E-BP1 Expression Protects. against Diet-Induced Obesity and Insulin. Resistance in Male Mice
 Cell Reports, Volume 16 Supplemental Information Increased 4E-BP1 Expression Protects against Diet-Induced Obesity and Insulin Resistance in Male Mice Shih-Yin Tsai, Ariana A. Rodriguez, Somasish G. Dastidar,
Crif1 Deficiency Reduces Adipose OXPHOS Capacity and Triggers Inflammation and Insulin Resistance in Mice
 Crif1 Deficiency Reduces Adipose OXPHOS Capacity and Triggers Inflammation and Insulin Resistance in Mice Min Jeong Ryu 1, Soung Jung Kim 1, Yong Kyung Kim 1, Min Jeong Choi 1, Surendar Tadi 1, Min Hee
Supplementary Table; Supplementary Figures and legends S1-S21; Supplementary Materials and Methods
 Silva et al. PTEN posttranslational inactivation and hyperactivation of the PI3K/Akt pathway sustain primary T cell leukemia viability Supplementary Table; Supplementary Figures and legends S1-S21; Supplementary
Supplemental figure 1. PDGFRα is expressed dominantly by stromal cells surrounding mammary ducts and alveoli. A) IHC staining of PDGFRα in
 IHC staining of PDGFRα in") Supplemental figure 1. PDGFRα is expressed dominantly by stromal cells surrounding mammary ducts and alveoli. A) IHC staining of PDGFRα in nulliparous (left panel) and InvD6 mouse mammary glands (right
Supplemental figure 1. PDGFRα is expressed dominantly by stromal cells surrounding mammary ducts and alveoli. A) IHC staining of PDGFRα in nulliparous (left panel) and InvD6 mouse mammary glands (right
Nature Immunology: doi: /ni.3412
 Supplementary Figure 1 Gata1 expression in heamatopoietic stem and progenitor populations. (a) Unsupervised clustering according to 100 top variable genes across single pre-gm cells. The two main cell
18s AAACGGCTACCACATCCAAG CCTCCAATGGATCCTCGTTA. 36b4 GTTCTTGCCCATCAGCACC AGATGCAGCAGATCCGCAT. Acc1 AGCAGATCCGCAGCTTG ACCTCTGCTCGCTGAGTGC
 Supplementary Table 1. Quantitative PCR primer sequences Gene symbol Sequences (5 to 3 ) Forward Reverse 18s AAACGGCTACCACATCCAAG CCTCCAATGGATCCTCGTTA 36b4 GTTCTTGCCCATCAGCACC AGATGCAGCAGATCCGCAT Acc1
MATERIALS AND METHODS. Neutralizing antibodies specific to mouse Dll1, Dll4, J1 and J2 were prepared as described. 1,2 All
 MATERIALS AND METHODS Antibodies (Abs), flow cytometry analysis and cell lines Neutralizing antibodies specific to mouse Dll1, Dll4, J1 and J2 were prepared as described. 1,2 All other antibodies used
DGAT1-dependent triacylglycerol storage by macrophages protects mice from dietinduced insulin resistance and inflammation
 Research article DGAT1-dependent triacylglycerol storage by macrophages protects mice from dietinduced insulin resistance and inflammation Suneil K. Koliwad, 1,2,3,4 Ryan S. Streeper, 1 Mara Monetti, 1
Supplementary Table 1.
 Supplementary Table 1. Expression of genes involved in brown fat differentiation in WAT of db/db mice treated with HDAC inhibitors. Data are expressed as fold change (FC) versus control. symbol FC SAHA
Supplementary Figure 1.
 Supplementary Figure 1. Transduction of adipocytes after intra-ewat administration of AAV vectors. A: Immunostaining against GFP (green) in sections of ewat two weeks after the intra-ewat administration
Male 30. Female. Body weight (g) Age (weeks) Age (weeks) Atg7 f/f Atg7 ΔCD11c
 Age (weeks) Age (weeks) Atg7 f/f Atg7 ΔCD11c") ody weight (g) ody weight (g) 34 3 Male 3 27 Female 26 24 22 18 7 9 11 13 15 17 19 21 23 21 18 15 7 9 11 13 15 17 19 21 23 Age (weeks) Age (weeks) Supplementary Figure 1. Lean phenotypes in mice regardless
ody weight (g) ody weight (g) 34 3 Male 3 27 Female 26 24 22 18 7 9 11 13 15 17 19 21 23 21 18 15 7 9 11 13 15 17 19 21 23 Age (weeks) Age (weeks) Supplementary Figure 1. Lean phenotypes in mice regardless
MCP-1 contributes to macrophage infiltration into adipose tissue, insulin resistance, and hepatic steatosis in obesity
 Research article MCP-1 contributes to macrophage infiltration into adipose tissue, insulin resistance, and hepatic steatosis in obesity Hajime Kanda, 1 Sanshiro Tateya, 1 Yoshikazu Tamori, 1 Ko Kotani,
TBP (H) CACAGTGAATCTTGGTTGTAAACTTGA AAACCGCTTGGGATTATATTCG ANGPTL8 (H) CTGGGCCCTGCCTACCGAGA CCGATGCTGCTGTGCCACCA [1]
![TBP (H) CACAGTGAATCTTGGTTGTAAACTTGA AAACCGCTTGGGATTATATTCG ANGPTL8 (H) CTGGGCCCTGCCTACCGAGA CCGATGCTGCTGTGCCACCA [1]](/thumbs/89/99233308.jpg "TBP (H) CACAGTGAATCTTGGTTGTAAACTTGA AAACCGCTTGGGATTATATTCG ANGPTL8 (H) CTGGGCCCTGCCTACCGAGA CCGATGCTGCTGTGCCACCA [1]") ESM Table 1. Immunoblot antibodies. Primary Supplier Dilution Antibody Akt Cell Signaling 1:1000 Technology Phosphorylated Cell Signaling 1:1000 Akt (Ser 473) Technology PKCε Cell Signaling 1:1000 Technology
ESM Table 1. Immunoblot antibodies. Primary Supplier Dilution Antibody Akt Cell Signaling 1:1000 Technology Phosphorylated Cell Signaling 1:1000 Akt (Ser 473) Technology PKCε Cell Signaling 1:1000 Technology
Regulation of adipose tissue remodeling by peripheral serotonin
 Regulation of adipose tissue remodeling by peripheral serotonin Sangkyu Park Catholic Kwandong University College of Medicine Department of Biochemistry Serotonin (5-HT) is a signaling molecule Hemostasis
Supplementary Information. Protectin DX alleviates insulin resistance by activating a myokine-liver glucoregulatory axis.
 Supplementary Information Protectin DX alleviates insulin resistance by activating a myokine-liver glucoregulatory axis. Phillip J. White, Philippe St-Pierre, Alexandre Charbonneau, Patricia Mitchell,
Nature Immunology: doi: /ni Supplementary Figure 1. Huwe1 has high expression in HSCs and is necessary for quiescence.
 Supplementary Figure 1 Huwe1 has high expression in HSCs and is necessary for quiescence. (a) Heat map visualizing expression of genes with a known function in ubiquitin-mediated proteolysis (KEGG: Ubiquitin
Supplementary Figure 1: TSLP receptor skin expression in dcssc. A: Healthy control (HC) skin with TSLP receptor expression in brown (10x
 skin with TSLP receptor expression in brown (10x") Supplementary Figure 1: TSLP receptor skin expression in dcssc. A: Healthy control (HC) skin with TSLP receptor expression in brown (10x magnification). B: Second HC skin stained for TSLP receptor in brown
Supplementary Figure 1: TSLP receptor skin expression in dcssc. A: Healthy control (HC) skin with TSLP receptor expression in brown (10x magnification). B: Second HC skin stained for TSLP receptor in brown
a 10 4 Link et al. Supplementary Figure 1 Nature Immunology: doi: /ni.1842 Cells per mouse ( 10 5 ) TRPV2KO anti-gr1 anti-gr anti-f4/80
 TRPV2KO anti-gr1 anti-gr anti-f4/80") a 10 4 WT 10 4 TRPV2KO 10 3 10 3 anti-gr1 10 2 10 1 anti-gr1 10 2 10 1 10 0 10 0 10 1 10 2 10 3 10 4 anti-f4/80 42.3 45.2 10 0 10 0 10 1 10 2 10 3 10 4 anti-f4/80 10 4 10 4 40 42.5 anti-cd11b 10 3 10 2
a 10 4 WT 10 4 TRPV2KO 10 3 10 3 anti-gr1 10 2 10 1 anti-gr1 10 2 10 1 10 0 10 0 10 1 10 2 10 3 10 4 anti-f4/80 42.3 45.2 10 0 10 0 10 1 10 2 10 3 10 4 anti-f4/80 10 4 10 4 40 42.5 anti-cd11b 10 3 10 2
The antiparasitic drug ivermectin is a novel FXR ligand that regulates metabolism
 Supplementary Information The antiparasitic drug ivermectin is a novel FXR ligand that regulates metabolism Address correspondence to Yong Li (yongli@xmu.edu.cn, Tel: 86-592-218151) GW464 CDCA Supplementary
Supplementary Information. MicroRNA-33b knock-in mice for an intron of sterol regulatory
 Supplementary Information MicroRNA-33b knock-in mice for an intron of sterol regulatory element-binding factor 1 (Srebf1) exhibit reduced HDL-C in vivo Takahiro Horie, Tomohiro Nishino, Osamu Baba, Yasuhide
Primary Adult Naïve CD4+ CD45RA+ Cells. Prepared by: David Randolph at University of Alabama, Birmingham
 Primary Adult Naïve CD4+ CD45RA+ Cells Prepared by: David Randolph (drdrdr@uab.edu) at University of Alabama, Birmingham Goal: To obtain large numbers of highly pure primary CD4+ CD45RO- CD25- cells from
(#4685) and p- AKT (S473) Rb mab (#9271) purchased from cell signaling Technology (Beverly,
 and p- AKT (S473) Rb mab (#9271) purchased from cell signaling Technology (Beverly,") 1 Supplemental methods cute insulin challenge: For assay of biochemical responses to insulin stimulation, we 3 4 6 7 8 9 1 anesthetized mice after a 6- h fast. We ligated vessels supplying one side of
1 Supplemental methods cute insulin challenge: For assay of biochemical responses to insulin stimulation, we 3 4 6 7 8 9 1 anesthetized mice after a 6- h fast. We ligated vessels supplying one side of
Pathologic Stage. Lymph node Stage
 ASC ASC a c Patient ID BMI Age Gleason score Non-obese PBMC 1 22.1 81 6 (3+3) PBMC 2 21.9 6 6 (3+3) PBMC 3 22 84 8 (4+4) PBMC 4 24.6 68 7 (3+4) PBMC 24. 6 (3+3) PBMC 6 24.7 73 7 (3+4) PBMC 7 23. 67 7 (3+4)
X P. Supplementary Figure 1. Nature Medicine: doi: /nm Nilotinib LSK LT-HSC. Cytoplasm. Cytoplasm. Nucleus. Nucleus
 a b c Supplementary Figure 1 c-kit-apc-eflu780 Lin-FITC Flt3-Linc-Kit-APC-eflu780 LSK Sca-1-PE-Cy7 d e f CD48-APC LT-HSC CD150-PerCP-cy5.5 g h i j Cytoplasm RCC1 X Exp 5 mir 126 SPRED1 SPRED1 RAN P SPRED1
University of California, San Diego La Jolla CA 92093
 AD Award Number: W81XWH-11-1-0131 TITLE: Role of Inflammation and Insulin Resistance in Mouse Models of Breast Cancer PRINCIPAL INVESTIGATOR: Jerrold Olefsky, M.D. CONTRACTING ORGANIZATION: University
Supplementary Figure 1. mtor LysM and Rictor LysM mice have normal cellularity and percentages of hematopoe>c cells. a. Cell numbers of lung, liver,
 a. b. c. Supplementary Figure 1. mtor LysM and Rictor LysM mice have normal cellularity and percentages of hematopoe>c cells. a. Cell numbers of lung, liver, and spleen. b. Cell numbers of bone marrow
Effects of growth hormone secretagogue receptor agonist and antagonist in nonobese type 2 diabetic MKR mice
 Effects of growth hormone secretagogue receptor agonist and antagonist in nonobese type 2 diabetic MKR mice Rasha Mosa (MBCHC, M.D, PhD candidate) School of Biomedical Sciences University of Queensland
Table S1. Viral load and CD4 count of HIV-infected patient population
 Table S1. Viral load and CD4 count of HIV-infected patient population Subject ID Viral load (No. of copies per ml of plasma) CD4 count (No. of cells/µl of blood) 28 7, 14 29 7, 23 21 361,99 94 217 7, 11
Analysis of AVP functions via V1a and V1b receptors with knockout mice. Akito Tanoue
 Analysis of AVP functions via V1a and V1b receptors with knockout mice Akito Tanoue Department of Pharmacology, National Research Institute for Child Health and Development Arginine-Vasopressin (AVP) is
SUPPLEMENTARY DATA. Supplementary Table 1. Primer sequences for qrt-pcr
 Supplementary Table 1. Primer sequences for qrt-pcr Gene PRDM16 UCP1 PGC1α Dio2 Elovl3 Cidea Cox8b PPARγ AP2 mttfam CyCs Nampt NRF1 16s-rRNA Hexokinase 2, intron 9 β-actin Primer Sequences 5'-CCA CCA GCG
Supplementary Materials for
 immunology.sciencemag.org/cgi/content/full/2/16/eaan6049/dc1 Supplementary Materials for Enzymatic synthesis of core 2 O-glycans governs the tissue-trafficking potential of memory CD8 + T cells Jossef
Supplemental Information. T Cells Enhance Autoimmunity by Restraining Regulatory T Cell Responses via an Interleukin-23-Dependent Mechanism
 Immunity, Volume 33 Supplemental Information T Cells Enhance Autoimmunity by Restraining Regulatory T Cell Responses via an Interleukin-23-Dependent Mechanism Franziska Petermann, Veit Rothhammer, Malte
Supplemental Figures Supplemental Figure 1:
 Supplemental Figures Supplemental Figure 1: Representative FACS data showing Concurrent Brain cell type Acquisition using either Percoll PLUS (top row) or myelin removal beads (bottom two rows). Debris
exposed operative area for presence of small islands (±1-2 cm) of adipose tissue from
 of adipose tissue from") Supplemental Material Details for the biopsy procedure During surgery, both the surgeon (N.B.) and the researcher (G.V.) visually inspected the exposed operative area for presence of small islands (±1-2
Supplemental Material Details for the biopsy procedure During surgery, both the surgeon (N.B.) and the researcher (G.V.) visually inspected the exposed operative area for presence of small islands (±1-2
SUPPLEMENTARY INFORMATION
 doi:10.1038/nature12652 Supplementary Figure 1. PRDM16 interacts with endogenous EHMT1 in brown adipocytes. Immunoprecipitation of PRDM16 complex by flag antibody (M2) followed by Western blot analysis
VEGFR2-Mediated Vascular Dilation as a Mechanism of VEGF-Induced Anemia and Bone Marrow Cell Mobilization
 Cell Reports, Volume 9 Supplemental Information VEGFR2-Mediated Vascular Dilation as a Mechanism of VEGF-Induced Anemia and Bone Marrow Cell Mobilization Sharon Lim, Yin Zhang, Danfang Zhang, Fang Chen,
Data supplement. Netrin-1 promotes adipose tissue macrophage accumulation and insulin resistance in obesity
 Data supplement Netrin- promotes adipose tissue macrophage accumulation and insulin resistance in obesity Bhama Ramkhelawon, Elizabeth J Hennessy, Mickaël Ménager 2, Tathagat D. Ray, Frederick J Sheedy,
SUPPLEMENTARY INFORMATION
 doi:10.1038/nature10134 Supplementary Figure 1. Anti-inflammatory activity of sfc. a, Autoantibody immune complexes crosslink activating Fc receptors, promoting activation of macrophages, and WWW.NATURE.COM/NATURE
NMED-A65251A. Supplementary Figures.
 NMED-A65251A Supplementary Figures. Sup. Fig. 1. ILC3 cells are the main source of in obese mice a. We gated on T cells (upper panels) or T cells (lower panels), and examined production. b. CD45 + - IL-13
Title. CitationCancer science, 109(4): Issue Date Doc URL. Rights(URL)
: Issue Date Doc URL. Rights(URL)") Title Toll-like receptor 3 signal augments radiation-induc Yoshida, Sumito; Shime, Hiroaki; Takeda, Yohei; Nam, Author(s) Hiroki; Kasahara, Masanori; Seya, Tsukasa CitationCancer science, 19(): 956-965
Title Toll-like receptor 3 signal augments radiation-induc Yoshida, Sumito; Shime, Hiroaki; Takeda, Yohei; Nam, Author(s) Hiroki; Kasahara, Masanori; Seya, Tsukasa CitationCancer science, 19(): 956-965
Gut Reaction. Mary ET Boyle, Ph. D. Department of Cognitive Science UCSD
 Gut Reaction Mary ET Boyle, Ph. D. Department of Cognitive Science UCSD Ley, R. et al (2005) PNAS vol. 102 no. 31 Bacterial diversity in the distal gut (ceca) of C57BL6 mice. (A) Phylogenetic tree of
CCR2 deficiency leads to increased eosinophils, alternative macrophage activation, and type 2 cytokine expression in adipose tissue
 Article CCR2 deficiency leads to increased eosinophils, alternative macrophage activation, and type 2 cytokine expression in adipose tissue W. Reid Bolus,*,1 Dario A. Gutierrez,*,1,2 Arion J. Kennedy,*
Eosinophils are required. for the maintenance of plasma cells in the bone marrow
 Eosinophils are required for the maintenance of plasma cells in the bone marrow Van Trung Chu, Anja Fröhlich, Gudrun Steinhauser, Tobias Scheel, Toralf Roch, Simon Fillatreau, James J. Lee, Max Löhning
ALT (U/L) (Relative expression) HDL (mm) (Relative expression) ALT (U/L) (Relative expression)
 (Relative expression) HDL (mm) (Relative expression) ALT (U/L) (Relative expression)") a DMT mrna () 8 6 r =.96 P =. DMT mrna () 8 6 r =. P =.6 DMT mrna () 8 6 r =.99 P =.6 DMT mrna () 8 6 r =. P =.9 DMT mrna () BMI (kg/m ) 8 6 r =.7 P =.966 DMT mrna () 8 ALT (U/L) 8 6 r = -.66 P =.76 DMT
a DMT mrna () 8 6 r =.96 P =. DMT mrna () 8 6 r =. P =.6 DMT mrna () 8 6 r =.99 P =.6 DMT mrna () 8 6 r =. P =.9 DMT mrna () BMI (kg/m ) 8 6 r =.7 P =.966 DMT mrna () 8 ALT (U/L) 8 6 r = -.66 P =.76 DMT
Endocannabinoid-activated Nlrp3 inflammasome in infiltrating macrophages mediates β- cell loss in type 2 diabetes
 Endocannabinoid-activated Nlrp3 inflammasome in infiltrating macrophages mediates β- cell loss in type 2 diabetes T Jourdan, G Godlewski, R Cinar, A Bertola, G Szanda, J Liu, J Tam, T Han, B Mukhopadhyay,
Males- Western Diet WT KO Age (wks) Females- Western Diet WT KO Age (wks)
 Females- Western Diet WT KO Age (wks)") Relative Arv1 mrna Adrenal 33.48 +/- 6.2 Skeletal Muscle 22.4 +/- 4.93 Liver 6.41 +/- 1.48 Heart 5.1 +/- 2.3 Brain 4.98 +/- 2.11 Ovary 4.68 +/- 2.21 Kidney 3.98 +/-.39 Lung 2.15 +/-.6 Inguinal Subcutaneous
Relative Arv1 mrna Adrenal 33.48 +/- 6.2 Skeletal Muscle 22.4 +/- 4.93 Liver 6.41 +/- 1.48 Heart 5.1 +/- 2.3 Brain 4.98 +/- 2.11 Ovary 4.68 +/- 2.21 Kidney 3.98 +/-.39 Lung 2.15 +/-.6 Inguinal Subcutaneous
Supplementary Materials for
 www.sciencesignaling.org/cgi/content/full/8/407/ra127/dc1 Supplementary Materials for Loss of FTO in adipose tissue decreases Angptl4 translation and alters triglyceride metabolism Chao-Yung Wang,* Shian-Sen
SUPPORTING INFORMATIONS
 SUPPORTING INFORMATIONS Mice MT/ret RetCD3ε KO α-cd25 treated MT/ret Age 1 month 3 mnths 6 months 1 month 3 months 6 months 1 month 3 months 6 months 2/87 Survival 87/87 incidence of 17/87 1 ary tumor
SUPPLEMENTARY METHODS
 SUPPLEMENTARY METHODS Histological analysis. Colonic tissues were collected from 5 parts of the middle colon on day 7 after the start of DSS treatment, and then were cut into segments, fixed with 4% paraformaldehyde,
Supplementary Figure S I: Effects of D4F on body weight and serum lipids in apoe -/- mice.
 Supplementary Figures: Supplementary Figure S I: Effects of D4F on body weight and serum lipids in apoe -/- mice. Male apoe -/- mice were fed a high-fat diet for 8 weeks, and given PBS (model group) or
Supplementary Figure S1. Effect of Glucose on Energy Balance in WT and KHK A/C KO
 Supplementary Figure S1. Effect of Glucose on Energy Balance in WT and KHK A/C KO Mice. WT mice and KHK-A/C KO mice were provided drinking water containing 10% glucose or tap water with normal chow ad
Supplementary Figures
 Supplementary Figures mir-150 regulates obesityassociated insulin resistance by controlling B cell functions Wei Ying, Alexander Tseng, Richard Cheng-An Chang, Haiqing Wang, Yu-lieh Lin, Srikanth Kanameni,
Adipocyte Dynamics and Reversible Metabolic Syndrome in Mice with an Inducible Adipocyte- Specific Deletion of the Insulin Receptor
 Article Adipocyte Dynamics and Reversible Metabolic Syndrome in Mice with an Inducible Adipocyte- Specific Deletion of the Insulin Receptor Graphical Abstract Authors Masaji Sakaguchi, Shiho Fujisaka,