Metformin enhances cisplatin cytotoxicity by suppressing Stat3 activity. Chien-Chung Lin, Hsuan-Heng Yeh, Wei-Lun Huang, Jing-Jou Yan, Wu-Wei Lai,
|
|
|
- Emery Perry
- 6 years ago
- Views:
Transcription
1 Metformin enhances cisplatin cytotoxicity by suppressing Stat3 activity independently of the LKB1 AMPK pathway Chien-Chung Lin, Hsuan-Heng Yeh, Wei-Lun Huang, Jing-Jou Yan, Wu-Wei Lai, Wen-Pin Su, Helen H. W. Chen, and Wu-Chou Su ONLINE DATA SUPPLEMENT METHODS Western blotting In western blotting, treated and untreated cells were pelleted and washed twice with ice-cold PBS. Cell lysates were obtained after adding lysis buffer containing phosphatase inhibitors (1 mm Na 3 VO 4 and 1 mm NaF) and protease inhibitors (Roche, Indianapolis, IN). The lysates were clarified by centrifugation at 14, rpm for 1 min and the protein concentration was determined using Bradford s assay (Bio-Rad, Richmond, CA). The lysates were then boiled for 5 min with sample buffer, before separation on SDS-polyacrylamide gels. The proteins were transferred to a nitrocellulose filter (Millipore, Billerica, MA) in Tris-glycine buffer and run at 1 V for 1.5 h using an electro-blotter (Amersham Pharmacia Biotech Inc., Piscataway, NJ). The membranes were blocked using PBS buffer containing 5% non-fat milk before incubation with antibodies. Antibody
2 binding was detected by electro-chemiluminescence (Amersham) according to the manufacturer s instructions. β-actin was used as a loading control. Signals were detected by spot densitometry (Alpha EaseFC software from Alpha Innotech CA, USA). Subcutaneous animal tumor models To generate subcutaneous tumors,.1 ml AS2 cell suspensions (5 1 7 cells/ml) were injected subcutaneously into the dorsal skin where palpable tumors developed after one week. The tumor volumes were calculated daily by measuring the greatest longitudinal diameter (length) and the greatest transverse diameter (width) using the modified ellipsoidal formula (15), as follows. Tumor volume =.5 (length width 2 ) Treatment was started when tumors reached 5 1 mm 3. Metformin (5 mg/kg) was given by lavage feeding tube (16) whereas cisplatin was given once a week by intra-peritoneal injection (4 mg/kg), as described previously (17). Immunohistochemistry and quantitative analysis of ki67 The paraffin-embedded animal tumors were fixed in 1% formalin, embedded in paraffin, and cut into 5-mm thick sections. Before immunohistochemistry, the sections were de-paraffinized, re-hydrated, incubated with 3% H 2 O 2 in methanol for 2 min, and subjected to heat-induced antigen retrieval by boiling for 1 min in.1
3 M sodium citrate. The specimens were then blocked with normal goat serum for 3 min and incubated for 2.5 h at room temperature with anti-ki67 antibody (Proteintech Group, Inc., Chicago, IL, USA) at 1:25 dilutions. The negative controls were treated with 5% normal goat serum without primary antibodies. The software program HistoQuest (TissueGnostics) was used to quantify and analyze the immuno-assayed sections (18). Immunofluorescent images and quantitative analysis of Stat3 The animal subcutaneous tumors were soaked in xylene for 1 h to remove the paraffin. Antigen was retrieved by heating the slides in citrate buffer (ph 6.) for 15 min in a pressure cooker. The slides were then blocked by PBS-T containing 5% normal donkey serum for 1 h and incubated overnight at 4 C with anti-stat3 (Novus Biologicals, Littleton, CO) at a 1:25 dilution. An indirect immunofluorescence assay was performed by incubation with secondary antibodies conjugated to anti-mouse Alexa Fluor 488 and anti-rabbit Alexa546 (Invitrogen Corp., Carlsbad, CA, USA). The nuclei were visualized by 4,6-diamidino-2-phenylindole staining (DAPI; Sigma-Aldrich, Saint Louis, MO) while the cytoplasm and cell membranes were visualized by ALDOA, as described previously (19). The fluorophores were excited by laser at 45, 488, or 543 nm and detected using a scanning confocal microscope (FV-1, Olympus). Pixel-by-pixel
4 analysis with the FV-1 program (19) was used to determine the nuclear localization of Stat3. Triple color images were exported as TIFF images.
5 Supplemental Figure Legends Supplemental Figure 1. Phosphorylation levels of Stat3 in CL1-5 cells. After JSI-124 (Stat3 inhibitor) treatment for 8, 24, 48, and 72 h, the phosphorylation of Stat3 was examined by western blotting and quantified by normalization against total Stat3. Values represent the mean ± SEM from at least three experiments. Supplemental Figure 2. Enhanced cytotoxic effects of metformin and JSI in AS2 cells were detected using trypan blue assay. Cell viability of AS2 cells after treatment with different doses of metformin (1 and 2.5 mm), JSI-124 (.5 and.1 M), or AICAR (1 and 2 mm) with cisplatin (.5 M) for 24 h, which were measured using the trypan blue assay. Supplemental Figure 3. Effect of the combined treatment with cisplatin and metformin or JSI on clonogenic survival in AS2 cells. AS2 cells were incubated with cisplatin (1 M/3 h) alone or in combination with metformin (2.5 mm/24 h) or JSI (1 M/1 h) and plated in triplicate. The colony-forming assay was performed after 14 days. Data represent the mean ± SEM obtained from three independent experiments, which were normalized to the values of the control cells. Supplemental Figure 4. Effects of the AMPK inhibitor on the AS2 cell response to metformin treatment. AS2 cells were treated with metformin alone or in
6 combination with the AMPK inhibitor, compound C. The expression and phosphorylation levels of Stat3, AMPK, mtor, 4EBP1, and p7s6k in AS2 cell lines were examined by western blotting and quantified by normalization against the total protein. The values represent the mean ± SEM from at least three experiments. The cell survival rate was measured using the MTT assay. Supplemental Figure 5. Effects of an mtor inhibitor on Stat3 phosphorylation during the AS2 cell response to metformin treatment. AS2 cells were treated with metformin alone or in combination with an mtor inhibitor, rapamycin, for 24 h. The Stat3 expression and phosphorylation levels were examined by western blotting and quantified by normalization against total Stat3. Supplemental Figure 6. Detection of ROS by flow cytometry. The AS2 cells transfected with vector or LKB1 sirna, and those transfected with AMPK shrna (GFP-V-RS plasmid), were treated with cisplatin and/or metformin for 24 h. The cells were trypsinized, washed with serum-free media, incubated in 5 M DCF-DA or 2.5 M HE, and analyzed by flow cytometry using a FACSCalibur system. The FACS results (A) for DCF-DA-stained AS2 cells and (B) for DCF-DA-stained AS2 cells transfected with the vector, LKB1 sirna, and for HE-stained AS2 cells transfected with AMPK shrna show that the levels of ROS attenuation (ROS (cisplatin-metformin) /ROS cisplatin ) were 49%, 59%,
7 and 6%, respectively. Supplemental Figure 7. Blood sugar and body weight measurements of the first animal cohort (n = 16) and GPT, BUN, and CRE levels of the second cohort (n = 12). (A) There were no differences in blood sugar levels of the four groups and the bodyweights only had a borderline difference in the metformin and combined groups (p =.5). (B) To examine the toxicity of the combined therapy in an animal model, 12 mice were separated into three groups: control group (received water + ip PBS), metformin group (oral metformin, 5 mg/kg + ip PBS), and cisplatin + metformin group (oral metformin, 5 mg/kg + ip cisplatin, 4 mg/kg). AS2 cell suspensions were injected subcutaneously into the dorsal skin where palpable tumors developed within one week. Treatments began when tumors reached 5 1 mm 3. On day 24, the mice were sacrificed due to the large tumor burden and sera were collected to determine GPT, BUN, and CRE levels, which were within the normal ranges in the three groups. Supplemental Figure 8. Analysis of the Ki67 intensity of tumors in the four groups. The intensities of Ki67 in the animal tumors from the four groups were analyzed using the TissueFAXs (TissueGnostics) software while the percentage of Ki67-positive cells on each slide was quantified using HistoQuest (TissueGnostics). The number of Ki67-positive cells on each slide was divided
8 by the total number of cells on each slide using hematoxylin-positive counterstaining. Statistical analyses were conducted using the one-way ANOVA (Tukey s post-test) (***p <.1, compared with control). Supplemental Figure 9. Immunofluorescence using laser-scanning confocal microscopy to determine the Stat3 activity. Immunofluorescent analysis was used to determine the expression and distribution of Stat3 (green, mainly in the nucleus after phosphorylation) and ALDOA (red, mainly in the cytoplasm and cell membrane), while the nuclei were labeled with DAPI (blue) in normal lung tissue and in tumors from the four groups using isotype IgG as the negative control. Immunofluorescent analysis was used to assess a confocal series of fluorescence and differential interference contrast (DIC) images, which were obtained simultaneously at 2-s intervals using a 6 oil immersion objective on an FV1 confocal microscope (Olympus)..Supplemental Figure 1. Metformin inhibited Stat3 phosphorylation and activated AMPK phosphorylation at different doses. The Stat3 and AMPK expression and phosphorylation levels in AS2 after metformin treatment for 4 h, which were analyzed by western blotting.


9 Supplemental figure 1. CL1-5 pstat Stat3 8hr 24hr 48hr hr - + JSl µm Actin 4~ I JSI 2.5 µm D Control... T... ~.!.E 3 s l *** T *** E - r.. Q. 2 CD C> c ns -5 1 ::S! u hr 24hr 48hr 72hr


10 Supplemental figure 2. AS2 Survival (%) Ocis-.SµM E2)JSl-.5µM JSl-.1µM IZZI Cis-.SµM+ JSl-.SµM Cis-.SµM+ JSl-.1 µm 14 Cis-.5µM ~Met-1mM 12> DMet-2.SmM llzjcis-.sµm+ Met-1mM cis-.sµm+ Met-2.SmM ~ r=-i I*** - o,... ~..._,,~..a,..._...j...ju.lll_ 14 D Cis-.SµM 12 1ZZJ AICAR 1 mm 1 OO D AICAR 2mM IZ2I cis-.sµm+ AICAR 1mM - cis-.sµm+aicar 2mM o------a...&.~;.i...&---..l...~~


11 Supplemental figure 3. AS2... (2 1 c: CJ i 1 1U... ~ c: :::J... '?!. ocontrol ~ JSI 1µM Deis 1µM cis 1µM+ JSI 1µM D control D Cis 1 µm ~ Met2.5 mm Cis 1µM+ Met 2.5mM c. *~* t--*** ~--!~-***...=::..., I-***


12 Supplemental figure 4. metformin Compound-C 9 - pstat3 Stat3 72 pampk 72 AMPK P-mTOR mtor P756K P-4EBP1 4EBP ] _ c pampk ~:~ lf3-e:-r-b-b p-mtor 2_ 1 Cl p-4ebp CIP-7s6k 1. r:i *** ***. P=9 1. D *** ***. r:i r:i Survival (%) D control ~Met D comp.c comp. C +Met
 - - - 2.5 2.")


13 Supplemental figure 5. metformin (mm) rapamycin (nm) p V7 5 Stat3 95.==================~ Stat3 95 actin ii ~~ :JI ~ ~psm~ 11 :: -...
 (B) ~ AS2-vector il AS2-LKB1(-) ~ AS2-AMPK(-) _control - cisplatin - cis+met cis+met _control - cisplatin -")
 12 cis cis+met 8.")
14 Supplemental figure 6. (A) -c: ::I (.,) Q) (_) AS2 _ control - Met-1 mm - Met-2.5mM --Cis-1µM +Met-1 mm --- Cis-1µM+Met-2.5 mm FL 1(DCF-DA) (B) ~ AS2-vector il AS2-LKB1(-) ~ AS2-AMPK(-) _control - cisplatin - cis+met cis+met _control - cisplatin - cis+met _control - cisplatin - cis+met 1' 1' FL 1(DCF-DA) FL1(DCF-DA) 1 ' FL2(HE) c: ~o u QI 111- ib-c... I!:! ~ Ill - c.. en E oo a:::~ AS2-vector 2 cis 15 o cis+met % % AS2-LKB1(-) 12 cis cis+met % 4 1 Yo AS2-AMPK(-) 15 cis o cis+met 6% 5 1 % " 1
 Blood sugar (mg/di) 2 control - - c is p la tin metformin -e- cisplatin+metformin 15 1")

15 Supplemental figure 7. (A) Blood sugar (mg/di) 2 control - - c is p la tin metformin -e- cisplatin+metformin day Body weight (gm) control ""'*"" cisplatin metformin -e- cisplatin+metformin 1 5 day o--r---r~""t'"~~--r~""t'"~~--.~-t"~ , ~--~..---~--~~ (B) GPT BUN Cre 6 (mg/di) 1.8 (mg/di) (mg/di) D control D Met I Cis+met

 ~-~A----, r----a----~")
16 Supplemental figure 8. control metformin % 262 ~ % % ao Ki6 7 - Mean I nten sity \. I I I I 4 ~ Ki67 - Mean I nten sity cisplatin - Me.an IM e n.s ltv 223 1~ 25, 21.65% 78.35% - cis+met Me.an l nten.s ity "4 % 25.16% 2!) J... I I II I 4t.> Ki67 - Meain I nten sity I I I I 4 S(l Ki6 7 - Mean I nten sity, *** Ki67+ (%) ~-~A----, r----a----~ r~--.a.--~, 1 ~ +-cisplatin ~ +- cis+met ~
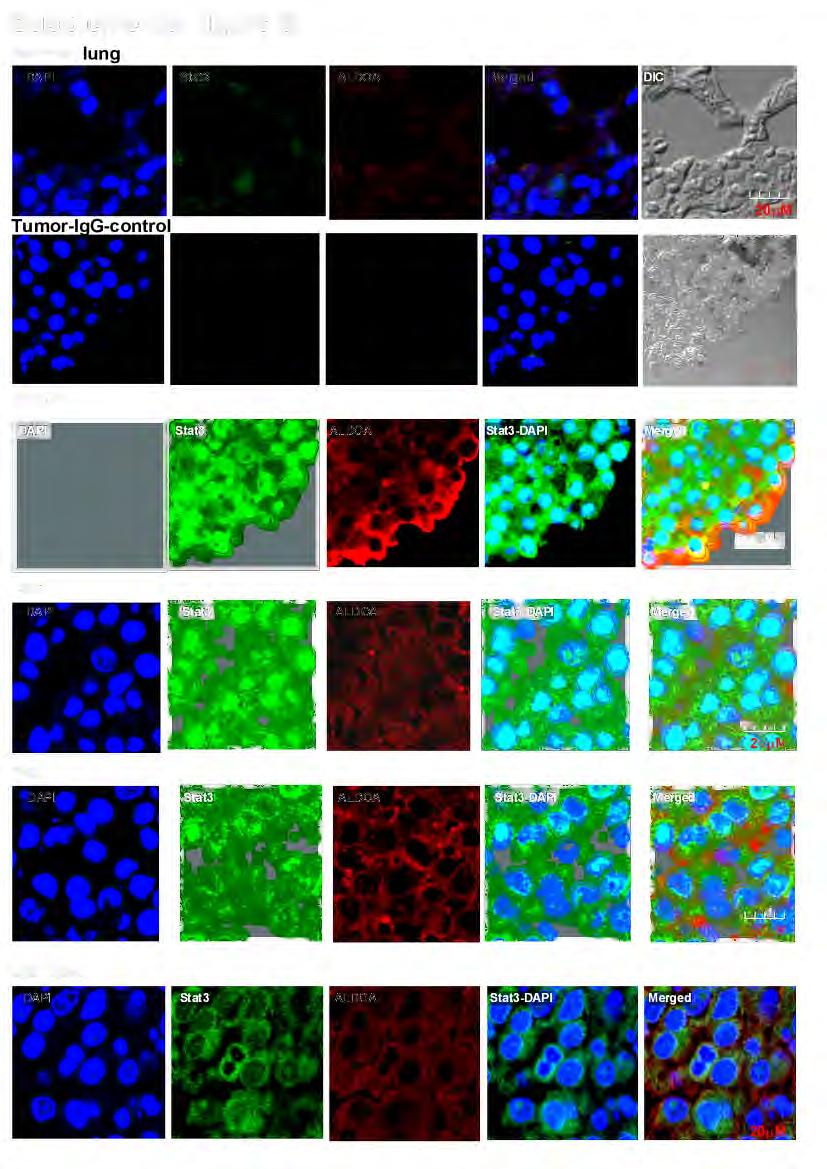
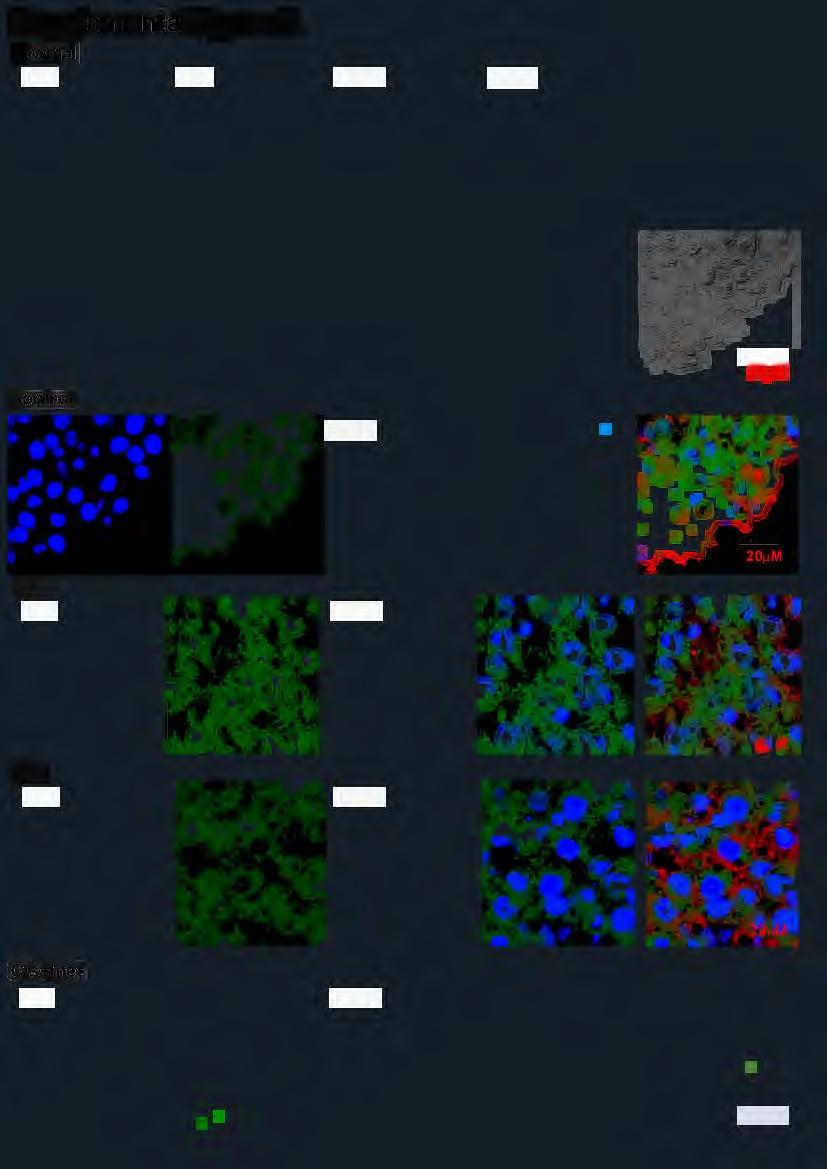
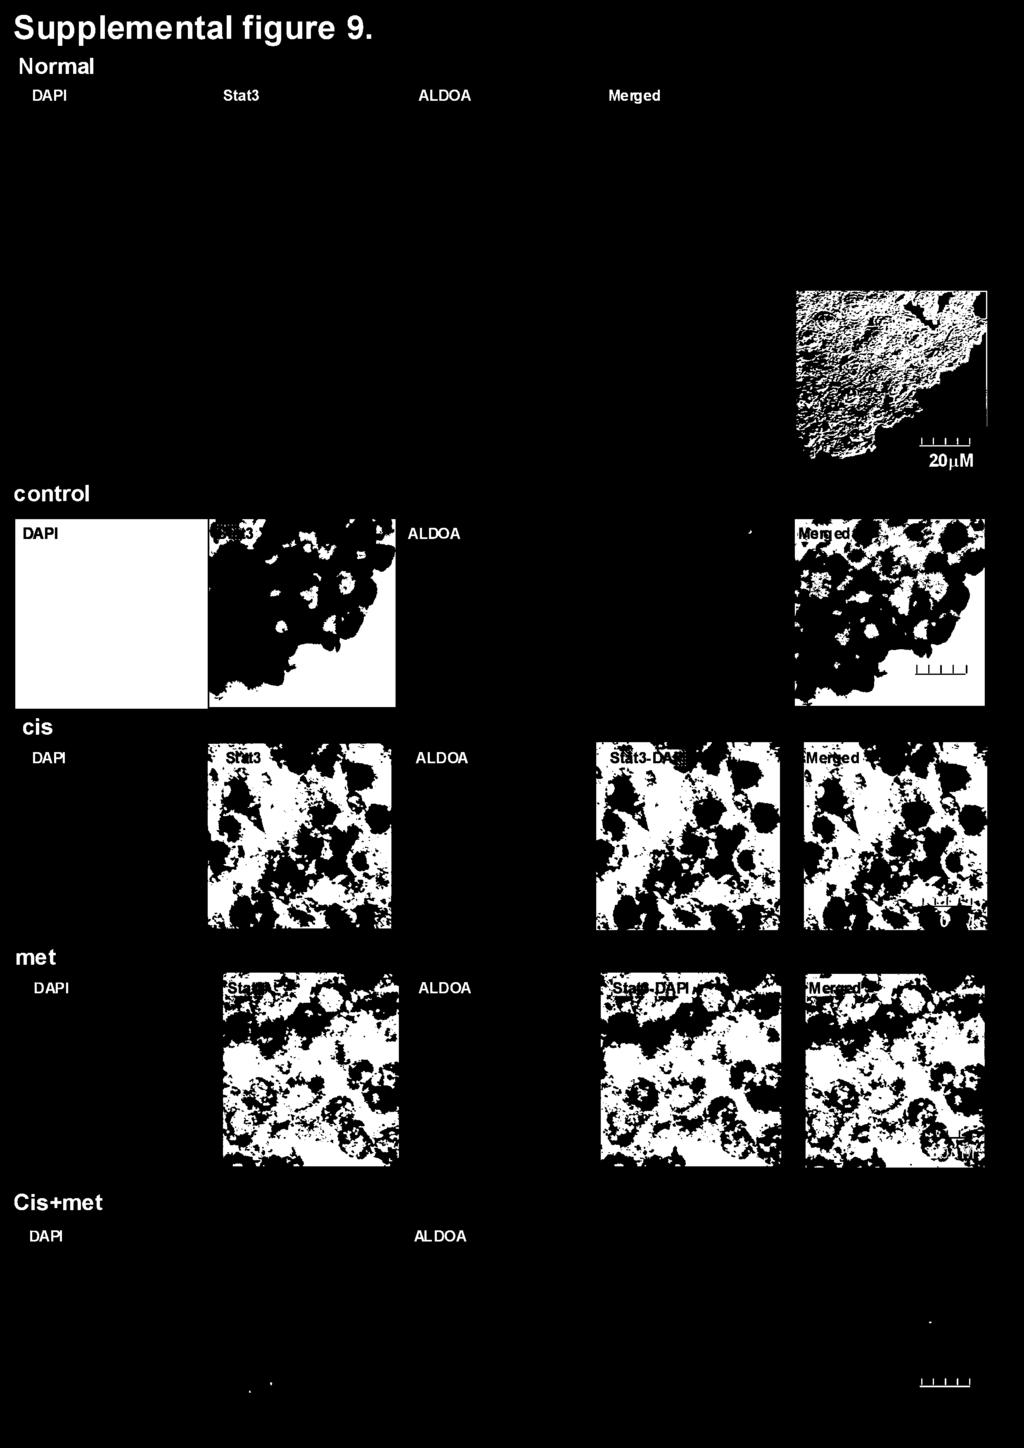
17 Supplemental figure 9. Normal lung control cis met Cis+met


18 Supplemental figure 1. AS2 metformin 4hr (mm) Stat3 72 AMPK actin (IJ!l! g>_gi. (J.s! "C _... ca c:..c: - oc.. LL pstat3 2. ~ ~:~_I I I I c::::j p-ampk *** I I I I D
General Laboratory methods Plasma analysis: Gene Expression Analysis: Immunoblot analysis: Immunohistochemistry:
 General Laboratory methods Plasma analysis: Plasma insulin (Mercodia, Sweden), leptin (duoset, R&D Systems Europe, Abingdon, United Kingdom), IL-6, TNFα and adiponectin levels (Quantikine kits, R&D Systems
(A) PCR primers (arrows) designed to distinguish wild type (P1+P2), targeted (P1+P2) and excised (P1+P3)14-
 PCR primers (arrows) designed to distinguish wild type (P1+P2), targeted (P1+P2) and excised (P1+P3)14-") 1 Supplemental Figure Legends Figure S1. Mammary tumors of ErbB2 KI mice with 14-3-3σ ablation have elevated ErbB2 transcript levels and cell proliferation (A) PCR primers (arrows) designed to distinguish
1 Supplemental Figure Legends Figure S1. Mammary tumors of ErbB2 KI mice with 14-3-3σ ablation have elevated ErbB2 transcript levels and cell proliferation (A) PCR primers (arrows) designed to distinguish
HCC1937 is the HCC1937-pcDNA3 cell line, which was derived from a breast cancer with a mutation
 SUPPLEMENTARY INFORMATION Materials and Methods Human cell lines and culture conditions HCC1937 is the HCC1937-pcDNA3 cell line, which was derived from a breast cancer with a mutation in exon 20 of BRCA1
(a) Significant biological processes (upper panel) and disease biomarkers (lower panel)
 Significant biological processes (upper panel) and disease biomarkers (lower panel)") Supplementary Figure 1. Functional enrichment analyses of secretomic proteins. (a) Significant biological processes (upper panel) and disease biomarkers (lower panel) 2 involved by hrab37-mediated secretory
Supplementary Figure 1. Functional enrichment analyses of secretomic proteins. (a) Significant biological processes (upper panel) and disease biomarkers (lower panel) 2 involved by hrab37-mediated secretory
(A) RT-PCR for components of the Shh/Gli pathway in normal fetus cell (MRC-5) and a
 RT-PCR for components of the Shh/Gli pathway in normal fetus cell (MRC-5) and a") Supplementary figure legends Supplementary Figure 1. Expression of Shh signaling components in a panel of gastric cancer. (A) RT-PCR for components of the Shh/Gli pathway in normal fetus cell (MRC-5) and
Supplementary figure legends Supplementary Figure 1. Expression of Shh signaling components in a panel of gastric cancer. (A) RT-PCR for components of the Shh/Gli pathway in normal fetus cell (MRC-5) and
TFEB-mediated increase in peripheral lysosomes regulates. Store Operated Calcium Entry
 TFEB-mediated increase in peripheral lysosomes regulates Store Operated Calcium Entry Luigi Sbano, Massimo Bonora, Saverio Marchi, Federica Baldassari, Diego L. Medina, Andrea Ballabio, Carlotta Giorgi
CD14 + S100A9 + Monocytic Myeloid-Derived Suppressor Cells and Their Clinical Relevance in Non-Small Cell Lung Cancer
 CD14 + S1A9 + Monocytic Myeloid-Derived Suppressor Cells and Their Clinical Relevance in Non-Small Cell Lung Cancer Po-Hao, Feng M.D., Kang-Yun, Lee, M.D. Ph.D., Ya-Ling Chang, Yao-Fei Chan, Lu- Wei, Kuo,Ting-Yu
VEGFR2-Mediated Vascular Dilation as a Mechanism of VEGF-Induced Anemia and Bone Marrow Cell Mobilization
 Cell Reports, Volume 9 Supplemental Information VEGFR2-Mediated Vascular Dilation as a Mechanism of VEGF-Induced Anemia and Bone Marrow Cell Mobilization Sharon Lim, Yin Zhang, Danfang Zhang, Fang Chen,
Protocol for Gene Transfection & Western Blotting
 The schedule and the manual of basic techniques for cell culture Advanced Protocol for Gene Transfection & Western Blotting Schedule Day 1 26/07/2008 Transfection Day 3 28/07/2008 Cell lysis Immunoprecipitation
Supplementary Figure 1.TRIM33 binds β-catenin in the nucleus. a & b, Co-IP of endogenous TRIM33 with β-catenin in HT-29 cells (a) and HEK 293T cells
 and HEK 293T cells") Supplementary Figure 1.TRIM33 binds β-catenin in the nucleus. a & b, Co-IP of endogenous TRIM33 with β-catenin in HT-29 cells (a) and HEK 293T cells (b). TRIM33 was immunoprecipitated, and the amount of
Supplementary Figure 1.TRIM33 binds β-catenin in the nucleus. a & b, Co-IP of endogenous TRIM33 with β-catenin in HT-29 cells (a) and HEK 293T cells (b). TRIM33 was immunoprecipitated, and the amount of
Rescue of mutant rhodopsin traffic by metformin-induced AMPK activation accelerates photoreceptor degeneration Athanasiou et al
 Supplementary Material Rescue of mutant rhodopsin traffic by metformin-induced AMPK activation accelerates photoreceptor degeneration Athanasiou et al Supplementary Figure 1. AICAR improves P23H rod opsin
SUPPLEMENTARY INFORMATION. Supplementary Figures S1-S9. Supplementary Methods
 SUPPLEMENTARY INFORMATION SUMO1 modification of PTEN regulates tumorigenesis by controlling its association with the plasma membrane Jian Huang 1,2#, Jie Yan 1,2#, Jian Zhang 3#, Shiguo Zhu 1, Yanli Wang
Supplementary Information
 Supplementary Information Supplementary Figure 1. CD4 + T cell activation and lack of apoptosis after crosslinking with anti-cd3 + anti-cd28 + anti-cd160. (a) Flow cytometry of anti-cd160 (5D.10A11) binding
A. Generation and characterization of Ras-expressing autophagycompetent
 Supplemental Material Supplemental Figure Legends Fig. S1 A. Generation and characterization of Ras-expressing autophagycompetent and -deficient cell lines. HA-tagged H-ras V12 was stably expressed in
Supplementary Information POLO-LIKE KINASE 1 FACILITATES LOSS OF PTEN-INDUCED PROSTATE CANCER FORMATION
 Supplementary Information POLO-LIKE KINASE 1 FACILITATES LOSS OF PTEN-INDUCED PROSTATE CANCER FORMATION X. Shawn Liu 1, 3, Bing Song 2, 3, Bennett D. Elzey 3, 4, Timothy L. Ratliff 3, 4, Stephen F. Konieczny
Effective Targeting of Quiescent Chronic Myelogenous
 Cancer Cell, Volume 7 Supplemental Information Effective Targeting of Quiescent Chronic Myelogenous Leukemia Stem Cells by Histone Deacetylase Inhibitors in Combination with Imatinib Mesylate Bin Zhang,
Essential Medium, containing 10% fetal bovine serum, 100 U/ml penicillin and 100 µg/ml streptomycin. Huvec were cultured in
 Supplemental data Methods Cell culture media formulations A-431 and U-87 MG cells were maintained in Dulbecco s Modified Eagle s Medium. FaDu cells were cultured in Eagle's Minimum Essential Medium, containing
Supporting Information
 Supporting Information Pang et al. 10.1073/pnas.1322009111 SI Materials and Methods ELISAs. These assays were performed as previously described (1). ELISA plates (MaxiSorp Nunc; Thermo Fisher Scientific)
Chemical Chaperones Mitigate Experimental Asthma By Attenuating Endoplasmic
 Chemical Chaperones Mitigate Experimental Asthma By Attenuating Endoplasmic Reticulum Stress Lokesh Makhija, BE, Veda Krishnan, MSc, Rakhshinda Rehman, MTech, Samarpana Chakraborty, MSc, Shuvadeep Maity,
The Schedule and the Manual of Basic Techniques for Cell Culture
 The Schedule and the Manual of Basic Techniques for Cell Culture 1 Materials Calcium Phosphate Transfection Kit: Invitrogen Cat.No.K2780-01 Falcon tube (Cat No.35-2054:12 x 75 mm, 5 ml tube) Cell: 293
Supplemental Information
 Supplemental Information Tobacco-specific Carcinogen Induces DNA Methyltransferases 1 Accumulation through AKT/GSK3β/βTrCP/hnRNP-U in Mice and Lung Cancer patients Ruo-Kai Lin, 1 Yi-Shuan Hsieh, 2 Pinpin
Islet viability assay and Glucose Stimulated Insulin Secretion assay RT-PCR and Western Blot
 Islet viability assay and Glucose Stimulated Insulin Secretion assay Islet cell viability was determined by colorimetric (3-(4,5-dimethylthiazol-2-yl)-2,5- diphenyltetrazolium bromide assay using CellTiter
Supplementary data Supplementary Figure 1 Supplementary Figure 2
 Supplementary data Supplementary Figure 1 SPHK1 sirna increases RANKL-induced osteoclastogenesis in RAW264.7 cell culture. (A) RAW264.7 cells were transfected with oligocassettes containing SPHK1 sirna
Figure S1. Western blot analysis of clathrin RNA interference in human DCs Human immature DCs were transfected with 100 nm Clathrin SMARTpool or
 Figure S1. Western blot analysis of clathrin RNA interference in human DCs Human immature DCs were transfected with 100 nm Clathrin SMARTpool or control nontargeting sirnas. At 90 hr after transfection,
Fang et al. NMuMG. PyVmT unstained Anti-CCR2-PE MDA-MB MCF MCF10A
 A NMuMG PyVmT 16.5+.5 47.+7.2 Fang et al. unstained Anti-CCR2-PE 4T1 Control 37.6+6.3 56.1+.65 MCF1A 16.1+3. MCF-7 3.1+5.4 MDA-M-231 42.1+5.5 unstained Secondary antibody only Anti-CCR2 SUPPLEMENTAL FIGURE
SUPPLEMENT. Materials and methods
 SUPPLEMENT Materials and methods Cell culture and reagents Cell media and reagents were from Invitrogen unless otherwise indicated. Antibiotics and Tet-certified serum were from Clontech. In experiments
In vitro bactericidal assay Fig. S8 Gentamicin protection assay Phagocytosis assay
 In vitro bactericidal assay Mouse bone marrow was isolated from the femur and the tibia. Cells were suspended in phosphate buffered saline containing.5% BSA and 2 mm EDTA and filtered through a cell strainer.
Title of file for HTML: Supplementary Information Description: Supplementary Figures and Supplementary Table
 Title of file for HTML: Supplementary Information Description: Supplementary Figures and Supplementary Table Title of file for HTML: Peer Review File Description: Innate Scavenger Receptor-A regulates
Downregulation of angiotensin type 1 receptor and nuclear factor-κb. by sirtuin 1 contributes to renoprotection in unilateral ureteral
 Supplementary Information Downregulation of angiotensin type 1 receptor and nuclear factor-κb by sirtuin 1 contributes to renoprotection in unilateral ureteral obstruction Shao-Yu Yang 1,2, Shuei-Liong
Supporting Information
 Supporting Information Fujishita et al. 10.1073/pnas.0800041105 SI Text Polyp Scoring. Intestinal polyps were counted as described (1). Briefly, the small and large intestines were excised, washed with
SUPPLEMENTARY INFORMATION
 Supplementary Figures Supplementary Figure S1. Binding of full-length OGT and deletion mutants to PIP strips (Echelon Biosciences). Supplementary Figure S2. Binding of the OGT (919-1036) fragments with
Supplementary Figure 1 Lymphocytes can be tracked for at least 4 weeks after
 Supplementary Figure 1 Lymphocytes can be tracked for at least 4 weeks after photoconversion by using H2B-Dendra2. 4-5 PPs of H2B-Dendra2 BM chimeras were photoconverted and analyzed 7 days (upper panel)
B16-F10 (Mus musculus skin melanoma), NCI-H460 (human non-small cell lung cancer
, NCI-H460 (human non-small cell lung cancer") Electronic Supplementary Material (ESI) for ChemComm. This journal is The Royal Society of Chemistry 2017 Experimental Methods Cell culture B16-F10 (Mus musculus skin melanoma), NCI-H460 (human non-small
Electronic Supplementary Material (ESI) for ChemComm. This journal is The Royal Society of Chemistry 2017 Experimental Methods Cell culture B16-F10 (Mus musculus skin melanoma), NCI-H460 (human non-small
Supplementary Figure 1. Expression of CUGBP1 in non-parenchymal liver cells treated with TGF-β
 Supplementary Figures Supplementary Figure 1. Expression of CUGBP1 in non-parenchymal liver cells treated with TGF-β and LPS. Non-parenchymal liver cells were isolated and treated with or without TGF-β
Trehalose, sucrose and raffinose are novel activators of autophagy in human. keratinocytes through an mtor-independent pathway
 Title page Trehalose, sucrose and raffinose are novel activators of autophagy in human keratinocytes through an mtor-independent pathway Xu Chen 1*, Min Li 1*, Li Li 1, Song Xu 1, Dan Huang 1, Mei Ju 1,
Impact of hyper-o-glcnacylation on apoptosis and NF-κB activity SUPPLEMENTARY METHODS
 SUPPLEMENTARY METHODS 3D culture and cell proliferation- MiaPaCa-2 cell culture in 3D was performed as described previously (1). Briefly, 8-well glass chamber slides were evenly coated with 50 µl/well
Argininosuccinate synthetase 1 suppression and arginine restriction inhibit cell
 Argininosuccinate synthetase 1 suppression and arginine restriction inhibit cell migration in gastric cancer cell lines Yan-Shen Shan 1, Hui-Ping Hsu 1, Ming-Derg Lai 2,3, Meng-Chi Yen 2,4, Wei-Ching Chen
Cell Culture. The human thyroid follicular carcinoma cell lines FTC-238, FTC-236 and FTC-
 Supplemental material and methods Reagents. Hydralazine was purchased from Sigma-Aldrich. Cell Culture. The human thyroid follicular carcinoma cell lines FTC-238, FTC-236 and FTC- 133, human thyroid medullary
SUPPLEMENTARY INFORMATION
 DOI:.38/ncb2822 a MTC02 FAO cells EEA1 b +/+ MEFs /DAPI -/- MEFs /DAPI -/- MEFs //DAPI c HEK 293 cells WCE N M C P AKT TBC1D7 Lamin A/C EEA1 VDAC d HeLa cells WCE N M C P AKT Lamin A/C EEA1 VDAC Figure
Programmed necrosis, not apoptosis, is a key mediator of cell loss and DAMP-mediated inflammation in dsrna-induced retinal degeneration
 Programmed necrosis, not apoptosis, is a key mediator of cell loss and DAMP-mediated inflammation in dsrna-induced retinal degeneration The Harvard community has made this article openly available. Please
condition. Left panel, the HCT-116 cells were lysed with RIPA buffer containing 0.1%
 FIGURE LEGENDS Supplementary Fig 1 (A) sumoylation pattern detected under denaturing condition. Left panel, the HCT-116 cells were lysed with RIPA buffer containing 0.1% SDS in the presence and absence
Supplementary Figure S1. Venn diagram analysis of mrna microarray data and mirna target analysis. (a) Western blot analysis of T lymphoblasts (CLS)
 Western blot analysis of T lymphoblasts (CLS)") Supplementary Figure S1. Venn diagram analysis of mrna microarray data and mirna target analysis. (a) Western blot analysis of T lymphoblasts (CLS) and their exosomes (EXO) in resting (REST) and activated
Supplementary Figure S1. Venn diagram analysis of mrna microarray data and mirna target analysis. (a) Western blot analysis of T lymphoblasts (CLS) and their exosomes (EXO) in resting (REST) and activated
Supplementary Data Table of Contents:
 Supplementary Data Table of Contents: - Supplementary Methods - Supplementary Figures S1(A-B) - Supplementary Figures S2 (A-B) - Supplementary Figures S3 - Supplementary Figures S4(A-B) - Supplementary
SUPPLEMENTARY INFORMATION
 SUPPLEMENTARY INFORMATION FOR Liver X Receptor α mediates hepatic triglyceride accumulation through upregulation of G0/G1 Switch Gene 2 (G0S2) expression I: SUPPLEMENTARY METHODS II: SUPPLEMENTARY FIGURES
Supplementary Figure 1.
 Supplementary Figure 1. Increased β cell mass and islet diameter in βtsc2 -/- mice up to 35 weeks A: Reconstruction of multiple anti-insulin immunofluorescence images showing differences in β cell mass
Electron micrograph of phosphotungstanic acid-stained exosomes derived from murine
 1 SUPPLEMENTARY INFORMATION SUPPLEMENTARY FIGURES Supplementary Figure 1. Physical properties of murine DC-derived exosomes. a, Electron micrograph of phosphotungstanic acid-stained exosomes derived from
Supplementary Figure 1: si-craf but not si-braf sensitizes tumor cells to radiation.
 Supplementary Figure 1: si-craf but not si-braf sensitizes tumor cells to radiation. (a) Embryonic fibroblasts isolated from wildtype (WT), BRAF -/-, or CRAF -/- mice were irradiated (6 Gy) and DNA damage
Proteomic profiling of small-molecule inhibitors reveals dispensability of MTH1 for cancer cell survival
 Supplementary Information for Proteomic profiling of small-molecule inhibitors reveals dispensability of MTH1 for cancer cell survival Tatsuro Kawamura 1, Makoto Kawatani 1, Makoto Muroi, Yasumitsu Kondoh,
Evaluation of directed and random motility in microslides Assessment of leukocyte adhesion in flow chambers
 Evaluation of directed and random motility in microslides Motility experiments in IBIDI microslides, image acquisition and processing were performed as described. PMN, which ended up in an angle < 180
Supplemental Information. Menin Deficiency Leads to Depressive-like. Behaviors in Mice by Modulating. Astrocyte-Mediated Neuroinflammation
 Neuron, Volume 100 Supplemental Information Menin Deficiency Leads to Depressive-like Behaviors in Mice by Modulating Astrocyte-Mediated Neuroinflammation Lige Leng, Kai Zhuang, Zeyue Liu, Changquan Huang,
SUPPLEMENTARY INFORMATION
 doi:10.1038/nature12652 Supplementary Figure 1. PRDM16 interacts with endogenous EHMT1 in brown adipocytes. Immunoprecipitation of PRDM16 complex by flag antibody (M2) followed by Western blot analysis
Bone marrow-derived mesenchymal stem cells improve diabetes-induced cognitive impairment by
 Nakano et al. Supplementary information 1. Supplementary Figure 2. Methods 3. References Bone marrow-derived mesenchymal stem cells improve diabetes-induced cognitive impairment by exosome transfer into
") Supplementary Figure 1 (Mu) SBP (mmhg) 2 18 16 p
Supplementary Figure 1 (Mu) SBP (mmhg) 2 18 16 p Supplemental figure 1. PDGFRα is expressed dominantly by stromal cells surrounding mammary ducts and alveoli. A) IHC staining of PDGFRα in
 IHC staining of PDGFRα in") Supplemental figure 1. PDGFRα is expressed dominantly by stromal cells surrounding mammary ducts and alveoli. A) IHC staining of PDGFRα in nulliparous (left panel) and InvD6 mouse mammary glands (right
Supplemental figure 1. PDGFRα is expressed dominantly by stromal cells surrounding mammary ducts and alveoli. A) IHC staining of PDGFRα in nulliparous (left panel) and InvD6 mouse mammary glands (right
Supplemental Information
 Electronic Supplementary Material (ESI) for Food & Function. This journal is The Royal Society of Chemistry 2016 Supplemental Information Supplementary Materials and Methods Materials Assay kits of total
PRODUCT INFORMATION & MANUAL
 PRODUCT INFORMATION & MANUAL Mitochondrial Extraction Kit NBP2-29448 Research use only. Not for diagnostic or therapeutic procedures www.novusbio.com P: 303.760.1950 P: 888.506.6887 F: 303.730.1966 technical@novusbio.com
Supplementary Figure 1.
 Supplementary Figure 1. Visualization of endoplasmic reticulum-mitochondria interaction by in situ proximity ligation assay. A) Illustration of targeted proteins in mitochondria (M), endoplasmic reticulum
Anti-Lamin B1/LMNB1 Picoband Antibody
 Anti-Lamin B1/LMNB1 Picoband Antibody Catalog Number:PB9611 About LMNB1 Lamin-B1 is a protein that in humans is encoded by the LMNB1 gene. The nuclear lamina consists of a two-dimensional matrix of proteins
Supplementary Figure 1 Expression of Crb3 in mouse sciatic nerve: biochemical analysis (a) Schematic of Crb3 isoforms, ERLI and CLPI, indicating the
 Schematic of Crb3 isoforms, ERLI and CLPI, indicating the") Supplementary Figure 1 Expression of Crb3 in mouse sciatic nerve: biochemical analysis (a) Schematic of Crb3 isoforms, ERLI and CLPI, indicating the location of the transmembrane (TM), FRM binding (FB)
Supplementary Figure 1 Expression of Crb3 in mouse sciatic nerve: biochemical analysis (a) Schematic of Crb3 isoforms, ERLI and CLPI, indicating the location of the transmembrane (TM), FRM binding (FB)
Supplementary Materials and Methods
 Supplementary Materials and Methods Immunoblotting Immunoblot analysis was performed as described previously (1). Due to high-molecular weight of MUC4 (~ 950 kda) and MUC1 (~ 250 kda) proteins, electrophoresis
Supplementary Table; Supplementary Figures and legends S1-S21; Supplementary Materials and Methods
 Silva et al. PTEN posttranslational inactivation and hyperactivation of the PI3K/Akt pathway sustain primary T cell leukemia viability Supplementary Table; Supplementary Figures and legends S1-S21; Supplementary
Fluorescence Microscopy
 Fluorescence Microscopy Imaging Organelles Mitochondria Lysosomes Nuclei Endoplasmic Reticulum Plasma Membrane F-Actin AAT Bioquest Introduction: Organelle-Selective Stains Organelles are tiny, specialized
Supplementary Material for
 Supplementary Material for Parathyroid Hormone Signaling through Low-density-lipoprotein-related Protein 6 Mei Wan, Chaozhe Yang, Jun Li, Xiangwei Wu, Hongling Yuan, Hairong Ma, Xi He, Shuyi Nie, Chenbei
Epithelial interleukin-25 is a key mediator in Th2-high, corticosteroid-responsive
 Online Data Supplement: Epithelial interleukin-25 is a key mediator in Th2-high, corticosteroid-responsive asthma Dan Cheng, Zheng Xue, Lingling Yi, Huimin Shi, Kan Zhang, Xiaorong Huo, Luke R. Bonser,
Supplementary Figure (OH) 22 nanoparticles did not affect cell viability and apoposis. MDA-MB-231, MCF-7, MCF-10A and BT549 cells were
 22 nanoparticles did not affect cell viability and apoposis. MDA-MB-231, MCF-7, MCF-10A and BT549 cells were") Supplementary Figure 1. Gd@C 82 (OH) 22 nanoparticles did not affect cell viability and apoposis. MDA-MB-231, MCF-7, MCF-10A and BT549 cells were treated with PBS, Gd@C 82 (OH) 22, C 60 (OH) 22 or GdCl
Supplementary Figure 1. Gd@C 82 (OH) 22 nanoparticles did not affect cell viability and apoposis. MDA-MB-231, MCF-7, MCF-10A and BT549 cells were treated with PBS, Gd@C 82 (OH) 22, C 60 (OH) 22 or GdCl
p47 negatively regulates IKK activation by inducing the lysosomal degradation of polyubiquitinated NEMO
 Supplementary Information p47 negatively regulates IKK activation by inducing the lysosomal degradation of polyubiquitinated NEMO Yuri Shibata, Masaaki Oyama, Hiroko Kozuka-Hata, Xiao Han, Yuetsu Tanaka,
Supporting Information
 Supporting Information Natural small molecule FMHM inhibits lipopolysaccharide-induced inflammatory response by promoting TRAF6 degradation via K48-linked polyubiquitination Ke-Wu Zeng 1, Li-Xi Liao 1,
Supplementary Table 1. Characterization of HNSCC PDX models established at MSKCC
 Supplementary Table 1. Characterization of HNSCC PDX models established at MSKCC Supplementary Table 2. Drug content and loading efficiency estimated with F-NMR and UV- Vis Supplementary Table 3. Complete
TSH Receptor Monoclonal Antibody (49) Catalog Number MA3-218 Product data sheet
 Catalog Number MA3-218 Product data sheet") Website: thermofisher.com Customer Service (US): 1 800 955 6288 ext. 1 Technical Support (US): 1 800 955 6288 ext. 441 TSH Receptor Monoclonal Antibody (49) Catalog Number MA3-218 Product data sheet Details
Website: thermofisher.com Customer Service (US): 1 800 955 6288 ext. 1 Technical Support (US): 1 800 955 6288 ext. 441 TSH Receptor Monoclonal Antibody (49) Catalog Number MA3-218 Product data sheet Details
Sestrin2 and BNIP3 (Bcl-2/adenovirus E1B 19kDa-interacting. protein3) regulate autophagy and mitophagy in renal tubular cells in. acute kidney injury
 regulate autophagy and mitophagy in renal tubular cells in. acute kidney injury") Sestrin2 and BNIP3 (Bcl-2/adenovirus E1B 19kDa-interacting protein3) regulate autophagy and mitophagy in renal tubular cells in acute kidney injury by Masayuki Ishihara 1, Madoka Urushido 2, Kazu Hamada
Sestrin2 and BNIP3 (Bcl-2/adenovirus E1B 19kDa-interacting protein3) regulate autophagy and mitophagy in renal tubular cells in acute kidney injury by Masayuki Ishihara 1, Madoka Urushido 2, Kazu Hamada
Supplementary Figure 1. Normal T lymphocyte populations in Dapk -/- mice. (a) Normal thymic development in Dapk -/- mice. Thymocytes from WT and Dapk
 Normal thymic development in Dapk -/- mice. Thymocytes from WT and Dapk") Supplementary Figure 1. Normal T lymphocyte populations in Dapk -/- mice. (a) Normal thymic development in Dapk -/- mice. Thymocytes from WT and Dapk -/- mice were stained for expression of CD4 and CD8.
Supplementary Figure 1. Normal T lymphocyte populations in Dapk -/- mice. (a) Normal thymic development in Dapk -/- mice. Thymocytes from WT and Dapk -/- mice were stained for expression of CD4 and CD8.
Supplementary Figure 1. Characterization of human carotid plaques. (a) Flash-frozen human plaques were separated into vulnerable (V) and stable (S),
 Flash-frozen human plaques were separated into vulnerable (V) and stable (S),") Supplementary Figure 1. Characterization of human carotid plaques. (a) Flash-frozen human plaques were separated into vulnerable (V) and stable (S), regions which were then quantified for mean fluorescence
Supplementary Figure 1. Characterization of human carotid plaques. (a) Flash-frozen human plaques were separated into vulnerable (V) and stable (S), regions which were then quantified for mean fluorescence
Supplementary Figure 1: Neuregulin 1 increases the growth of mammary organoids compared to EGF. (a) Mammary epithelial cells were freshly isolated,
 Mammary epithelial cells were freshly isolated,") 1 2 3 4 5 6 7 8 9 10 Supplementary Figure 1: Neuregulin 1 increases the growth of mammary organoids compared to EGF. (a) Mammary epithelial cells were freshly isolated, embedded in matrigel and exposed
1 2 3 4 5 6 7 8 9 10 Supplementary Figure 1: Neuregulin 1 increases the growth of mammary organoids compared to EGF. (a) Mammary epithelial cells were freshly isolated, embedded in matrigel and exposed
(Stratagene, La Jolla, CA) (Supplemental Fig. 1A). A 5.4-kb EcoRI fragment
 (Supplemental Fig. 1A). A 5.4-kb EcoRI fragment") SUPPLEMENTAL INFORMATION Supplemental Methods Generation of RyR2-S2808D Mice Murine genomic RyR2 clones were isolated from a 129/SvEvTacfBR λ-phage library (Stratagene, La Jolla, CA) (Supplemental Fig.
SUPPLEMENTAL INFORMATION Supplemental Methods Generation of RyR2-S2808D Mice Murine genomic RyR2 clones were isolated from a 129/SvEvTacfBR λ-phage library (Stratagene, La Jolla, CA) (Supplemental Fig.
Epithelial cell death is an important contributor to oxidant-mediated acute lung injury SUPPORTING INFORMATION 60611, USA
 Epithelial cell death is an important contributor to oxidant-mediated acute lung injury SUPPORTING INFORMATION G.R. Scott Budinger 1,2 *, Gökhan M. Mutlu 1 *, Daniela Urich 2, Saul Soberanes 1, Leonard
Ligand-mediated cytoplasmic retention of the Ah receptor inhibits. Gulsum E. Muku, Tejas S. Lahoti, Iain A. Murray, Michael A.
 Ligand-mediated cytoplasmic retention of the Ah receptor inhibits macrophage mediated acute inflammatory responses Gulsum E. Muku, Tejas S. Lahoti, Iain A. Murray, Michael A. Podolsky, Kayla Smith, Troy
Reviewers' comments: Reviewer #1 Expert in EAE and IL-17a (Remarks to the Author):
:") Reviewers' comments: Reviewer #1 Expert in EAE and IL-17a (Remarks to the Author): This study shows that the inducible camp early repressor (ICER) is involved in development of Th17 cells that are pathogenic
Reviewers' comments: Reviewer #1 Expert in EAE and IL-17a (Remarks to the Author): This study shows that the inducible camp early repressor (ICER) is involved in development of Th17 cells that are pathogenic
hexahistidine tagged GRP78 devoid of the KDEL motif (GRP78-His) on SDS-PAGE. This
 on SDS-PAGE. This") SUPPLEMENTAL FIGURE LEGEND Fig. S1. Generation and characterization of. (A) Coomassie staining of soluble hexahistidine tagged GRP78 devoid of the KDEL motif (GRP78-His) on SDS-PAGE. This protein was expressed
SUPPLEMENTAL FIGURE LEGEND Fig. S1. Generation and characterization of. (A) Coomassie staining of soluble hexahistidine tagged GRP78 devoid of the KDEL motif (GRP78-His) on SDS-PAGE. This protein was expressed
Instructions for Use. APO-AB Annexin V-Biotin Apoptosis Detection Kit 100 tests
 3URGXFW,QIRUPDWLRQ Sigma TACS Annexin V Apoptosis Detection Kits Instructions for Use APO-AB Annexin V-Biotin Apoptosis Detection Kit 100 tests For Research Use Only. Not for use in diagnostic procedures.
Supplementary Figure 1
 Supplementary Figure 1 AAV-GFP injection in the MEC of the mouse brain C57Bl/6 mice at 4 months of age were injected with AAV-GFP into the MEC and sacrificed at 7 days post injection (dpi). (a) Brains
Tumor suppressor Spred2 interaction with LC3 promotes autophagosome maturation and induces autophagy-dependent cell death
 www.impactjournals.com/oncotarget/ Oncotarget, Supplementary Materials 2016 Tumor suppressor Spred2 interaction with LC3 promotes autophagosome maturation and induces autophagy-dependent cell death Supplementary
Figure S1. PMVs from THP-1 cells expose phosphatidylserine and carry actin. A) Flow
 Flow") SUPPLEMENTARY DATA Supplementary Figure Legends Figure S1. PMVs from THP-1 cells expose phosphatidylserine and carry actin. A) Flow cytometry analysis of PMVs labelled with annexin-v-pe (Guava technologies)
SUPPLEMENTARY DATA Supplementary Figure Legends Figure S1. PMVs from THP-1 cells expose phosphatidylserine and carry actin. A) Flow cytometry analysis of PMVs labelled with annexin-v-pe (Guava technologies)
Supplementary figure legends
 Supplementary figure legends Supplementary Figure 1. Exposure of CRT occurs independently from the apoptosisassociated loss of the mitochondrial membrane potential (MMP). (A) HeLa cells treated with MTX
Supplementary Figure 1
 Supplementary Figure 1 a γ-h2ax MDC1 RNF8 FK2 BRCA1 U2OS Cells sgrna-1 ** 60 sgrna 40 20 0 % positive Cells (>5 foci per cell) b ** 80 sgrna sgrna γ-h2ax MDC1 γ-h2ax RNF8 FK2 MDC1 BRCA1 RNF8 FK2 BRCA1
Supplemental information
 Carcinoemryonic antigen-related cell adhesion molecule 6 (CEACAM6) promotes EGF receptor signaling of oral squamous cell carcinoma metastasis via the complex N-glycosylation y Chiang et al. Supplemental
Hopkins University, Howard Hughes Medical Institute, USA) (27). Cells were maintained in DMEM
 (27). Cells were maintained in DMEM") Supplementary Materials and Methods Cell Culture HCT116 (TP53 +/+ and TP53 -/- ) cells were provided by Dr. Bert Vogelstein (Johns Hopkins University, Howard Hughes Medical Institute, USA) (27). Cells
Supplementary Materials and Methods Cell Culture HCT116 (TP53 +/+ and TP53 -/- ) cells were provided by Dr. Bert Vogelstein (Johns Hopkins University, Howard Hughes Medical Institute, USA) (27). Cells
Protocol for Western Blo
 Protocol for Western Blo ng SDS-PAGE separa on 1. Make appropriate percentage of separa on gel according to the MW of target proteins. Related recommenda ons and rou ne recipes of separa on/stacking gels
Figure S1. Sorting nexin 9 (SNX9) specifically binds psmad3 and not psmad 1/5/8. Lysates from AKR-2B cells untreated (-) or stimulated (+) for 45 min
 specifically binds psmad3 and not psmad 1/5/8. Lysates from AKR-2B cells untreated (-) or stimulated (+) for 45 min") Figure S1. Sorting nexin 9 (SNX9) specifically binds psmad3 and not psmad 1/5/8. Lysates from AKR2B cells untreated () or stimulated () for 45 min with 5 ng/ml TGFβ or 10 ng/ml BMP4 were incubated with
Figure S1. Sorting nexin 9 (SNX9) specifically binds psmad3 and not psmad 1/5/8. Lysates from AKR2B cells untreated () or stimulated () for 45 min with 5 ng/ml TGFβ or 10 ng/ml BMP4 were incubated with
Supplementary Figure 1. Validation of astrocytes. Primary astrocytes were
 Supplementary Figure 1. Validation of astrocytes. Primary astrocytes were separated from the glial cultures using a mild trypsinization protocol. Anti-glial fibrillary acidic protein (GFAP) immunofluorescent
GFP-LC3 +/+ CLU -/- kda CLU GFP. Actin. GFP-LC3 +/+ CLU -/- kda CLU GFP. Actin
 Supplementary Fig. 1 a CQ treatment ScrB OGX11 MG132 I II AZD5363 I II b GFP / / GFP / / GFP / / GFP / / GFP GFP Actin Actin ctrl CQ GFP / / GFP / / GFP / / GFP / / GFP GFP Actin Actin rapamycin rapamycincq
Figure S1, related to Figure 1. Escaper p38a-expressing cancer cells repopulate the tumors (A) Scheme of the mt/mg reporter that expresses a
 Scheme of the mt/mg reporter that expresses a") Cancer Cell, Volume 33 Supplemental Information Targeting p38a Increases DNA Damage, Chromosome Instability, and the Anti-tumoral Response to Taxanes in Breast Cancer Cells Begoña Cánovas, Ana Igea, Alessandro
Cancer Cell, Volume 33 Supplemental Information Targeting p38a Increases DNA Damage, Chromosome Instability, and the Anti-tumoral Response to Taxanes in Breast Cancer Cells Begoña Cánovas, Ana Igea, Alessandro
SUPPLEMENTARY MATERIAL. Sample preparation for light microscopy
 SUPPLEMENTARY MATERIAL Sample preparation for light microscopy To characterize the granulocytes and melanomacrophage centers, cross sections were prepared for light microscopy, as described in Material
SHREE ET AL, SUPPLEMENTAL MATERIALS. (A) Workflow for tumor cell line derivation and orthotopic implantation.
 Workflow for tumor cell line derivation and orthotopic implantation.") SHREE ET AL, SUPPLEMENTAL MATERIALS SUPPLEMENTAL FIGURE AND TABLE LEGENDS Supplemental Figure 1. Derivation and characterization of TS1-TGL and TS2-TGL PyMT cell lines and development of an orthotopic
SHREE ET AL, SUPPLEMENTAL MATERIALS SUPPLEMENTAL FIGURE AND TABLE LEGENDS Supplemental Figure 1. Derivation and characterization of TS1-TGL and TS2-TGL PyMT cell lines and development of an orthotopic
Supplementary Materials. for Garmy-Susini, et al, Integrin 4 1 signaling is required for lymphangiogenesis and tumor metastasis
 Supplementary Materials for Garmy-Susini, et al, Integrin 4 1 signaling is required for lymphangiogenesis and tumor metastasis 1 Supplementary Figure Legends Supplementary Figure 1: Integrin expression
AMPK Phosphorylation Assay Kit
 AMPK Phosphorylation Assay Kit Catalog Number KA3789 100 assays Version: 02 Intended for research use only www.abnova.com Table of Contents Introduction... 3 Intended Use... 3 Background... 3 Principle
A263 A352 A204. Pan CK. pstat STAT3 pstat3 STAT3 pstat3. Columns Columns 1-6 Positive control. Omentum. Rectosigmoid A195.
 pstat3 75 Pan CK A A263 A352 A24 B Columns 1-6 Positive control A195 A22 A24 A183 Rectal Nodule STAT3 pstat3 STAT3 pstat3 Columns 7-12 Omentum Rectosigmoid Left Ovary Right Ovary Omentum Uterus Uterus
Supplementary Information
 Supplementary Information Supplementary Figure 1. EBV-gB 23-431 mainly exists as trimer in HEK 293FT cells. (a) Western blotting analysis for DSS crosslinked FLAG-gB 23-431. HEK 293FT cells transfected
Supplementary Table 1. Primer sequences for conventional RT-PCR on mouse islets
 Supplementary Table 1. Primer sequences for conventional RT-PCR on mouse islets Gene 5 Forward 3 5 Reverse 3.T. Product (bp) ( C) mnox1 GTTCTTGGGCTGCCTTGG GCTGGGGCGGCGG 60 300 mnoxa1 GCTTTGCCGCGTGC GGTTCGGGTCCTTTGTGC
LIST OF ORGANS FOR HISTOPATHOLOGICAL ANALYSIS:!! Neural!!!!!!Respiratory:! Brain : Cerebrum,!!! Lungs and trachea! Olfactory, Cerebellum!!!!Other:!
 LIST OF ORGANS FOR HISTOPATHOLOGICAL ANALYSIS:!! Neural!!!!!!Respiratory:! Brain : Cerebrum,!!! Lungs and trachea! Olfactory, Cerebellum!!!!Other:! Spinal cord and peripheral nerves! Eyes, Inner ear, nasal
Ananya Baksi CY11D042
 Insulin-Directed Synthesis of Fluorescent Gold Nanoclusters: Preservation of Insulin Bioactivity and Versatility in Cell Imaging Angew. Chem. Int. Ed. 2011, 50, 7056 7060 Chien-Liang Liu, Hung-Tsung Wu,