NNMB Technical Report No.20 NATIONAL NUTRITION MONITORING BUREAU SPECIAL REPORT
|
|
|
- Magdalen Porter
- 6 years ago
- Views:
Transcription
1
2 NNMB Technical Report No.20 NATIONAL NUTRITION MONITORING BUREAU SPECIAL REPORT NATIONAL INSTITUTE OF NUTRITION Indian Council of Medical Research Hyderabad , India 2000
3
4 NNMB Technical Report No.20 NATIONAL NUTRITION MONITORING BUREAU SPECIAL REPORT NATIONAL INSTITUTE OF NUTRITION Indian Council of Medical Research Jamai-Osmania (P.O.), Hyderabad , INDIA 2000
5 Page Nos. NUTRITIONAL STATUS OF ADOLESCENTS NUTRITIONAL STATUS OF ELDERLY FOOD & NUTRIENT INTAKES OF INDIVIDUALS
6 NATIONAL NUTRITION MONITORING BUREAU REPORT ON DIET AND NUTRITIONAL STATUS OF ADOLESCENTS K. VIJAYARAGHAVAN K.VENKAIAH K. DAMAYANTHI M. UMA NAYAK NATIONAL INSTITUTE OF NUTRITION Indian Council of Medical Research Jamai-Osmania (P.O.) Hyderabad , INDIA 2000
7
8 CONTENTS ACKNOWLEDGEMENTS SUMMARY 1. INTRODUCTION 2. MATERIALS AND METHODS 3. RESULTS 2.1 Sampling Design 2.2 Investigations 2.3 Analysis 3.1 Current Dietary and Nutritional Status 3.2 Food and Nutrient Intake 3.3 Time Trends 4. COMMENTS REFERENCES Page Nos
9 ACKNOWLEDGEMENTS We wish to convey our thanks to Dr.A.Laxmaiah, Dr.R.Hari Kumar and Dr.M.Vishnuvardhana Rao, Senior Research Officers; Dr.N.Arlappa, Mr.Ch.Gal Reddy, Mr.K.Mallikharjuna Rao, Dr.N.Balakrishna and Mr.B. Surya Prakasham, Research Officers; Mr.Sharad Kumar and Mr. M.Ravindranath, Technical Research Officers for their help during analysis. We also thank Ms.G. Madhavi and other staff for their technical help and Mr. G.Hanumantha Rao and Ms. G. Prashanthi for their secretarial help. Authors
10 SUMMARY Adolescence is a period of rapid growth and maturation in human development, after infancy. Since, there is very little information about dietary and nutritional status of adolescents in India, an assessment of the current diet and nutritional status of adolescents was carried out utilizing the data collected by the National Nutrition Monitoring Bureau (NNMB). In addition, the time trends in diet and nutritional status were determined. The anthropometric data obtained on 12,124 adolescents and 24 hour recall dietary information on 2,579 individuals in were analyzed and, were compared with the anthropometric data obtained on 24,683 adolescents and dietary information on 3,313 individuals obtained from the same villages in The results revealed that the proportion of adolescent girls getting married before the age of 18 years was 23%. Among them the proportion that could be considered as 'at risk' due to short stature (<145 cms) was 24.1% and that with under weight (<38 kg) was 18.6%. The food and nutrient intakes, in general, were below the RDA. More than two-thirds of adolescents were consuming <70% RDA for vitamin A and riboflavin. The percent of underweight (<Median -2SD of NCHS weight for age) in males was 53% as compared to females (39.5%). About 39% were stunted. The adolescents measured during were significantly taller and heavier than their counterparts studied in indicating secular changes in growth during a period of twenty years. There was an increase to the extent of 2.5 to 3.5 cms in mean heights and 1 to 1.5 kg in mean weights. In general, there was improvement in the nutrient intakes. The extent of severe deficit with respect to energy (<50% of RDA) decreased from 21% to 9% in boys and 14% to 5% in girls during as compared to The socio-economic variables like type of house, occupation and land holding and per capita monthly income were significantly (p<0.05) associated with weight and height for age. NNMB Adolescent Nutrition
11 1. INTRODUCTION Adolescence is a period of rapid growth and maturation in human development after infancy. The nutritional status of adolescent girls, the 'future mothers' contributes significantly to the nutritional status of the community. It is only recently that efforts, though small, are made to include adolescent girls as beneficiaries in some of the health and nutrition intervention programs. There is very little information about dietary and nutritional status of adolescents in India. Hence, in this report, an assessment of the current diet and nutritional status of adolescents has been made utilizing the large data that was collected by the National Nutrition Monitoring Bureau (NNMB). In addition, the time trends in diet and nutritional status were determined by using the data that was collected by the NNMB in from the same villages. The NNMB, through its annual surveys, since 1972, established a large database on different representative segments of population belonging to different States. It also conducted repeat surveys in 1988 and 1996 in the same villages that were surveyed in In the present report, results of analysis carried out on the data on adolescents collected during have been used to indicate the current status. These were compared with those obtained in to find out whether there were any time trends in the dietary pattern and nutritional status. 2.1 SAMPLING DESIGN Selection of villages 2. METHODS AND MATERIALS In the first repeat survey carried out during , in each State about villages were surveyed. Of these, 75% were those covered during , while the remaining 25% were a new set of villages. A similar sampling procedure was adopted for the second repeat survey, covering 120 villages in each State. Of these, 90 villages were from those covered both in and , while the remaining 30 villages were new. In each State, the villages were selected from 8 districts representing different geographic locations of the State. Thus, ninety villages were covered at all the three points of time and the 30 villages covered for the first time. The sampling design is presented in the following flow chart Selection of households From each of the selected villages, 20 households (HHs) were selected by adopting 'cluster sampling method'. For this purpose, the main village and its hamlets (if any) were divided into 5 natural clusters, consisting of groups of houses/streets/ mohallas/areas, which included at least one cluster inhabited by SC/ST community. From each of the selected clusters, 4 consecutive households were surveyed, by selecting the first household randomly. If the number of households in a given cluster was too large, the cluster was further divided into sub-areas, and one sub area was selected randomly for covering 4 HHs. Thus, in each State, a total of 2400 HHs were targeted for survey. NNMB 2 Adolescent Nutrition
12 NNMB Adolescent Nutrition
13 2.2 INVESTIGATIONS The following investigations were carried out in the selected HHs Household Particulars Demographic and socio-economic particulars such as age, sex, occupation, literacy level, family income, possession of agricultural land and live stock, type of dwelling etc. of all the household members were collected, by administering an household schedule in all the households Nutrition Assessment In each village, all the 20 selected HHs, were covered for nutrition assessment. Anthropometric measurements like height, weight, arm circumference and fat fold at triceps were taken on all the available members of the households, using standard equipment and procedures 1. They were also examined for the presence of clinical signs of nutritional deficiencies Diet Survey Diet survey was conducted in every alternate HH (10 HHs) covered for nutrition assessment. While one-day weighment diet survey was conducted in 5 HHs to assess intakes at the household level, 24-hour recall method of diet survey 2 was conducted in the rest of the households, to assess individual intakes. The following Table presents the number of HHs covered for different investigations in each selected village and the total sample covered for various activities. Method of Survey Household socioeconomic profile, Anthropometry & Clinical Examination No. of HHs Covered 20 Household diet survey 5 Individual diet Survey ANALYSIS Food and Nutrient Intake of Individuals The average daily food and nutrient intakes of different physiological groups in the households surveyed were computed. The nutrient intakes were calculated using the values given in Nutritive Value of Indian Foods 4. The food intakes were compared with the levels recommended in balanced diets for Indians (1981) 5, whereas the average intakes of nutrients were compared with the levels suggested in Nutrient requirements and Recommended Dietary Allowances (RDA) for Indians (1990) Anthropometry Mean heights and weights were calculated according to age and sex. The distance charts for height and weights were compared at both the points of surveys, as well as with those of the National Centre for Health Statistics (NCHS) standards SD Classification Recently, large scale national surveys like National Family Health Survey (1993) 7 have adopted Standard Deviation classification 8 for assessing undernutrition. Therefore, for the purpose of comparison, the percent distribution of adolescents was calculated using NCHS reference values for weight for age to assess undernutrition, and 'height for age', to assess the extent of stunting. Details of the SD classification are given below: NNMB 4 Adolescent Nutrition
14 Cut-off level Nutritional Status Weight for age Height for age >Median-2SD Normal Normal Median-2SD to Median-3SD Moderate undernutrition Moderate stunting <Median -3SD Severe undernutrition Severe stunting 3. RESULTS The anthropometric data obtained on 12,124 adolescents and 24 hour recall dietary information on 2,579 individuals in were analyzed to assess (i) the diet and nutritional status of adolescents from eight States, and (ii) the role of socioeconomic factors on nutritional status. These results were compared with the anthropometric data obtained on 24,683 adolescents and dietary information on 3,313 individuals obtained from the same villages in The distribution of the sample covered in different States is presented in Table-1. Table 1 Distribution of Adolescents sample Covered in Different States State Kerala Tamilnadu Karnataka Andhra Pradesh Maharastra Gujarat Madhya Pradesh Orissa West Bengal Uttar Pradesh Total CURRENT DIETARY AND NUTRITIONAL STATUS Profile of the sample surveyed COVERAGE DIET SURVEY House holds: 2,579 ANTHROPOMETRY Individuals: 12,124 The coverage of children by sex for anthropometry and diet survey is given in -Table-2&3. The socio-economic and demographic profile of the sample covered is given in Table-4. Majority of them (90.8%) belonged to Hindu religion, while about 27% belonged to scheduled caste community. About 30% belonged to backward communities and about 12% were from scheduled tribes. In general, the families NNMB 5 Adolescent Nutrition
15 were large with over 77% belonging to families with 5-10 family members. About 42% of the heads of the households were illiterate. Almost all the adolescents (97.9%) were residing in their own houses. About 61% of the houses were kutcha as compared to 8.1% pucca houses. More than a third (37.3%) of the households did not possess any land. The major occupation was agriculture with most of the families belonging to either labourers (27%) or tenant/owner cultivators (45.5%). The mean per capita income (PCI) per month of the household was about Rs.250/- at prices. Per capita income of different quartiles was also calculated. It was interesting to note that while the Mean PCI in the lowest quartile was Rs.77/-, in the highest quartile group, it was Rs.626/- indicating the wide variations in the socio-economic status of the rural households. Table 2 Age and Sex Wise Distribution of Children Covered for Anthropometry Age (Years) Boys Girls Boys Girls TOTAL Table 3 Sample covered for individual intake Diet Survey according to Age and Sex Age Group (Yrs) Boys Girls Boys Girls TOTAL Table 4 Socio-economic Profile of Households covered Variable Description Percentage Religion Hindu Muslim Christian Others Community ST SC BC Others Contd. NNMB 6 Adolescent Nutrition
16 Table 4 Socio-economic Profile of Households covered (contd.) Variable Description Percentag Type of family Nuclear Joint Extended Family Size > Literacy Illiterate Literate Primary House Own 97. Type of House Land holdings (acres) Occupation Kutcha Semi Pucca Pucca Nil Labourer Agriculturist Artisans/Business/ Service Others Mean Per Capita monthly Income by quartiles Quartiles (Rs.) I 77 II 141 III 228 IV 626 Average Marital Status One of the risk factors among adolescent girls is early marriage causing early cessation of growth leading to birth of low birth weight baby. The proportion of adolescent girls getting married before the legal age of 18 years was 23%. Among the married adolescent girls, the proportion of the girls considered 'at risk' due to short stature (<145 cms) was 24.1% and under weight (<38 kg) was 18.6%. In other words, these adolescent girls could be considered as at risk 9 in terms of pregnancy outcome Nutritional Anthropometry Mean Anthropometric measurements The mean and median anthropometric measurements of adolescent children are presented in Table-5. Distance charts for heights and weights by sex are presented in Fig. 1. The girls overtook boys at about 11 years and the boys over took the girls at about 13 years, after which the boys were significantly taller than girls -(P<0.01). In other words, in the case of the girls, the puberty started about 2 years earlier than the boys. At the age of 17 years, the girls were shorter in height than the boys by about 10 cms and weighed 3 kgs less. At all ages, the adolescents were shorter and lighter than their American counterparts (NCHS). NNMB 7 Adolescent Nutrition
17 Fig -1. DISTANCE CHART FOR HEIGHT AND WEIGHT OF ADOLESCENTS BY SEX NNMB 8 Adolescent Nutrition
18 Age (Years) Table 5 Average Heights and Weights of Boys and Girls according to Age 10+ Mean SD Median 11+ Mean SD Median 12+ Mean SD Median 13+ Mean SD Median 14+ Mean SD Median 15+ Mean SD Median 16+ Mean SD Median 17+ Mean SD Median Boys Girls Height (cm) Weight (kg) Height (cm) Weight (kg) SD Classification The adolescents were categorized into different grades of nutritional status, based on weight for age and height for age by SD classification using NCHS Standards. All those children with weight for age / height for age equal to or more than Median - 2SD were taken as normal, those with Median - 2SD to Median - 3SD as moderately undernourished and all those with <Median - 3SD were taken as severely undernourished. Stunting The Z analysis of data indicated that the over all prevalence of stunting (<Median height -2SD) was similar in both the sexes (boys: 39.5% and girls: 39.1%). The percentage of stunting increased as the age advanced in boys from 34.7% at 10 years to 59.7% at 17 years. In the case of girls, the percentage of stunting increased with increasing age (32.5% to 46.7%) up to 13 years after which it decreased to 37.2% at the age of 17 years (Table-6). Underweight In case of body weights, the percent of undernutrition (<Median -2SD of NCHS weight for age) in males was 53.1% as compared to females (39.5%). As in the case of height, the percent Of boys with undernutrition increased from 41.6% at 10 years to 68.6% at 17 years, while in girls, the extent of under nutrition increased (37.8% to 45.3%) till the age of 12 years and plateaued at 39.0% in the later age groups (Table-6). NNMB 9 Adolescent Nutrition
19 Age (Yrs) Stunting (Height for Age < Median-2SD) Table 6 Per cent Distribution of Adolescents According to Stunting and Underweight Boys Underweight (Weight for Age < Median -2SD) Stunting (Height for Age < Median-2SD) Girls Underweight (Weight for Age < Median -2SD) χ (P< 0.01) (P<0.01) 60.9 (P< 0.01) 23.3 (P< 0.01) ANTHROPOMETRY The proportion of stunted increased with increasing of age. The percent of undernutrition was higher in boys than in girls. Age (Years) Body Mass index It is well known that Body Mass Index (BMI) is not constant with age in growing children. Hence, medians of BMI were calculated to assess the differences between ages (Table-7). These BMI values for age and sex were compared with those reported for NHANES survey in USA. The proportion of adolescents below the 5 th percentile of NHANES ranged from 44% in 17 years age group to 77.6% in 11 years among boys and from 16.4% in 17 years to 62.7% in 10 years among girls. However, the extent of undernutrition was considerably less among girls than their male counterparts in each of the age groups (Table-8). Table 7 Median Body Mass Index of Adolescents NHANES Boys Girls Boys Girls Boys Girls NNI NNMB 10 Adolescent Nutrition
20 Table 8 Distribution of adolescents below 5 th Percentile of NHANES - BMl Age (Years) Boys Girls FOOD AND NUTRIENT INTAKE The Mean daily intakes of different foods of adolescents according to age and sex are presented in Tables- 9 & 10. The mean intakes of all the nutrients were below the RDA in all the age groups of adolescents irrespective of sex. (Tables-11,12 & 13) In order to assess the extent of severity of food deficit, the nutrient intakes were expressed as % of RDA and the distribution of adolescents consuming <50% and <70% of RDA was calculated for both the sexes (Table-14). In general, in both the sexes, the proportion of adolescents consuming inadequate amounts was higher in case of micronutrients than that of protein, energy and total fat. More than twothirds of adolescents were consuming <70% RDA for vitamin A and riboflavin. It was interesting to note that because of higher RDA in boys, the extent of deficiency with respect to iron was higher than in girls. NNMB 11 Adolescent Nutrition
21 Table 9 Food Intakes (g/day) by Age Groups Age Group (Years) Boys Girls Cereals & Millets Millets Cereals Pulses Green Leafy Veg. Other Veg. Roots & Tubers Cereals & Millets Millets Cereals Pulses Mean SD Mean SD Mean SD Mean SD Mean SD Mean SD Green Leafy Veg. Other veg. Roots & Tubers NNMB 12 Adolescent Nutrition
22 Table 10 Food intakes (g/day) by Age Groups Age Group (Years) Boys Girls Nuts & Oil Seeds Condi. & Spices Fats Sugar Fruits Fish Other Flesh Foods Milk& Milk Prod. & Jagg. Nuts & Oil seeds Condi. & Spices Fruits Fish Other Flesh Foods Milk& Milk prod. Fats Sugar Mean SD Mean SD Mean SD Mean SD Mean SD Mean SD & Jagg. NNMB 13 Adolescent Nutrition
23 Table 11 Average daily Intake of Nutrients among year adolescents by Sex and Period of survey Protein (g) Nutrients Total Fat (g) Energy (kcal) Calcium Iron Vitamin A (µg) Thiamin Riboflavin Niacin Vitamin-C Boys Girls Mean Median SD Mean Median SD Mean Median SD Mean Median SD Mean Median SD Mean Median SD Mean Median SD Mean Median SD Mean Median SD Mean Median SD NNMB 14 Adolescent Nutrition
24 Table Average daily Intake of Nutrients among year adolescents by Sex and Period of survey Nutrients Protein (g) Total Fat (g) Energy (kcal) Calcium Iron Vitamin A (µg) Thiamin Riboflavin Niacin Vitamin-C Boys Girls Mean Median SD Mean Median SD Mean Median SD Mean Median SD Mean Median SD Mean Median SD Mean Median SD Mean Median SD Mean Median SD Mean Median SD NNMB 15 Adolescent Nutrition
25 Table Average daily Intake of Nutrients among year adolescents by Sex and Period of survey Nutrients Protein (g) Total Fat (g) Energy (kcal) Calcium Iron Vitamin A (µg) Thiamin Riboflavin Niacin Vitamin-C Boys Girls Mean Median SD Mean Median SD Mean Median SD Mean Median SD Mean Median SD Mean Median SD Mean Median SD Mean Median SD Mean Median SD Mean Median SD NUTRIENT INTAKES Median nutrient intakes were below the RDA. About % of adolescents consumed micronutrients <70% of RDA. NNMB 16 Adolescent Nutrition
26 3.3 TIME TRENDS As indicated earlier, the changes in the diet and nutritional status, if any, were assessed by comparing the data collected during and Secular trends in growth Distance charts for height and weight for each sex according to period of survey are presented in Figs. 2 and 3. The adolescents measured during were significantly taller and heavier than their counterparts studied in indicating secular changes in growth during a period of twenty years. There was an increase to the extent of 2.5 to 3.5 cm and 1 to 1.5 kg, which was statistically significant (P<0.05) Nutrient Intakes The distribution of children according to intakes expressed as % RDA (<70% and <50% of RDA) at both the points of time indicates that in the case of most of the nutrients there was reduction in the proportion of adolescents having deficient dietary intakes over the last two decades. The extent of severe deficit with respect to energy (<50% of RDA) decreased from 21% to 9% in boys and 14% to 5% in girls in as compared to The extent of decline in case of Iron and vitamin 'A' was less as compared to other nutrients. In other words, in general, there was improvement in the nutrient intakes (Table-14; Figs. 4 to 7) over a period of two decades. Table 14 Distribution (%) of Adolescents according to Intake of Nutrients as % of RDA Nutrients Protein Total Fat Energy Calcium Iron Vitamin A Thiamin Riboflavin Niacin Vitamin C Percent Boys Girls RDA < < < < < < < < < < < < < < < < < < < < NNMB 17 Adolescent Nutrition
27 Fig-2. DISTANCE CHART FOR HEIGHT BY YEAR OF SURVEY NNMB 18 Adolescent Nutrition

28 Fig - 3. DISTANCE CHART FOR WEIGHT BY YEAR OF SURVEY NNMB 19 Adolecent Nutrition
29 Fig - 4. DISTRIBUTION OF ADOLESCENTS WITH PROTEIN INTAKE OF <RDA Fig - 5. DISTRIBUTION OF ADOLESCENTS WITH ENERGY INTAKE OF <RDA NNMB 20 Adoloscent Nutrition

30 Fig - 6. DISTRIBUTION OF ADOLESCENTS WITH VITAMIN A INTAKE OF <RDA Fig-7. PERCENT DISTRIBUTION OF ADOLESCENTS WITH IRON INTAKE OF <RDI Percent Percent NNMB 21 Adoloscent Nutrition
31 3.3.3 Socio-economic factors and dietary and nutritional status The association between various demographic and socio-economic on one hand and anthropometric parameters on the other was studied. For the purpose, standard deviation classification of height/age and weight/age were used. For assessing the significance of relationships of each variable χ2 test was used. The adolescents were divided into two groups of normal (Median-2SD) and undernourished (<Median -2SD). The variables like religion, community, type of family, literacy status, type of house, land holdings, occupation and per capita income were significantly associated with the nutritional status as assessed by height/age (P<0.05) (Table-15). The extent of stunting in Christians was marginally less (31.8%) than among Hindus (39.4%), and those of SC community (42.7%). The adolescents belonging to extended family had lower prevalence of stunting (34.6%) as compared to those belonging to joint family (42.0%). The percentage of stunting among adolescents was higher in those living in kutcha houses (40.5%) than those living in pucca houses (31.8%). The extent of stunting was higher in labourer families (40.3%). The extent of stunting decreased with increasing size of land holdings. The prevalence of stunting among adolescents decreased with increasing per capita income. All the demographic variables like religion, community, type of family, family size, literacy status, type of house, land holdings, occupation and per capita income were significantly associated with weight/age (P<0.05) (Table-15). The percentage of undernutrition was higher among Hindus (46.2%) and those from ST community. On the other hand, among the adolescents belonging to extended family, the percentage of undernutrition was less (40.7%) as compared to joint family (48.6%). The adolescents of literate head of the household had lower undernutrition. The extent of undernutrition was higher among those living in kutcha houses; involved in agriculture labour, among the landless and those with lower PCI. NNMB 22 Adolescent Nutrition

32 Table 15 Distribution of Adolescents according to Stunting and Under Weight by Socioeconomic status SOCIO ECONOMIC V/s NUTRITION STATUS Extent of stunting was significantly higher in SC community. Prevalence of undernutrition was higher among ST community. Proportions of stunted were higher, in adolescents living in kutcha houses. The proportion of stunted and undernourished children was higher in the households with low per capita income. NNMB 23 Adolescent Nutrition
33 4. COMMENTS The nutritional status of adolescent girls, the 'future mothers' contributes significantly to the nutritional status of the community. An assessment of the current diet and nutritional status of adolescents was made utilizing the large data collected by the National Nutrition Monitoring Bureau (NNMB). In addition, the time trends in diet and nutritional status were determined by comparing with the data that was collected by the NNMB in from the same villages. Most of the adolescents belonged to families involved in agriculture with a per capita income of about Rs About 23% of adolescent girls were married before the legal age of 18 years. Among the married adolescent girls, about 19-24% of adolescent girls could be considered as 'at risk' because of either short stature or underweight. Undernutrition (<Median -2SD of NCHS weight for age) was widespread both in males (53.1%) and females (39.5%). The prevalence of stunting (<Median height -2SD) in both the sexes was similar (boys: 39.5% and girls: 39.1%). The proportion of adolescents below the 5 th percentile of NHANES-BMI ranged from 44% in 17 years of age to 78% in 11 years among boys and from 16% in 17 years to 63% in 10 years among girls. However, the extent of thinness was considerably less among girls as compared to their male counterparts. The mean intakes of all the nutrients were below the RDA in all the age groups of adolescents irrespective of sex. In general,xin both the sexes, about two-thirds of adolescents were consuming inadequate amounts of micronutrients. Perhaps, because of higher RDA, the extent of dietary deficiency in iron was higher in boys than in girls. There was improvement in the nutrient intakes in as compared to The extent of severe deficit with respect to energy (<50% of RDA) decreased from 21% to 9% in boys and 14% to 5% in girls during to The adolescents measured during were significantly taller and heavier than their counterparts studied about two decades back indicating secular changes in growth during a period of twenty years. There was an increase to the extent of 2.5 to 3.5 cm in height and 1 to 1.5 kg in weight. NNMB 24 Adolescent Nutrition
34 5. REFERENCES 1. Jelliffee, D.B.. Assessment of the Nutritional Status of the Community, WHO Monograph Series No.53.geneva: WHO, Thimmayamma.B.V.S. and Rao.D.H. A comparative study of the Oral Questionnaire Method with Actual Observation of the Dietary Intake of Preschool Children, J.Nutr.Dietet. 1969, 6: Expert Group of the Indian Council of Medical Research, Nutrient Requirements and Recommended Dietary Allowances for Indians, New Delhi: ICMR, Gopalan, C, Ramasastry, B.V. Balasubramanyam, S.C. Narasinga Rao, B.S., Deosthale, Y.G. and Pant, K.C. Nutritive Value of Indian Foods, Hyderabad: NIN, Expert Group of ICMR, Recommended Dietary Intakes for Indians, New Delhi: ICMR, Hamill, P.V.V., Drizd, T.A., Johnson, C.L., Reed, R.B., Roche, A.F. and Moore, W.M.. Physical Growth: National Centre for Health Statistics Percentiles. American J.Clin. Nutr. 1979, 32: National Family Health Survey). India, Bombay: International Institute for Population Sciences, WHO, Physical Status: The use and interpretation of Anthropometry. WHO Technical Report Series, 854, Geneva: WHO, Nutrition Foundation of India, Growth of Affluent Indian Girls during Adolescence. Scientific Report No. 10, New Delhi: Nutrition Foundation of India, NNMB 25 Adolescent Nutrition
35
36 NATIONAL NUTRITION MONITORING BUREAU REPORT ON DIET AND NUTRITIONAL STATUS OF ELDERLY K. VIJAYARAGHAVAN G.N.V. BRAHMAM N. BALAKRISHNA N. ARLAPPA SHARAD KUMAR NATIONAL INSTITUTE OF NUTRITION Indian Council of Medical Research Jamai-Osmania (P.O.), Hyderabad , INDIA 2000
37
38 CONTENTS ACKNOWLEDGEMENTS SUMMARY 1. INTRODUCTION 2. MATERIALS AND METHODS 2.1 Sampling Design 2.2 Statistical Analysis 3. RESULTS AND DISCUSSION 3.1 Socioeconomic Profile 3.2 Dietary Consumption 3.3 Nutritional Status 4. TIME TRENDS IN FOOD AND NUTRIENT INTAKES 5. EFFECT OF SOCIOECONOMIC STATUS 5.1 Body mass Index 5.2 Food Intakes 5.3 Nutrient Intakes 6. CONCLUSIONS ANNEXURES REFERENCES Page Nos
39
40 ACKNOWLEDGEMENTS We wish to convey our thanks to Dr.A. Laxmaiah, Dr.R.Hari Kumar and Dr.M.Vishnuvardhana Rao, Senior Research Officers; Mr.Ch.Gal Reddy, Mr.KMallikharjuna Rao, and Mr.B.Surya Prakasham, Research Officers; Mr. M.Ravindranath, Technical Research Officer and Ms.M.Uma Nayak and Ms.K.Damayanthi, Nutritionists for their help during analysis. We also thank Mr.P.Satish Babu, Mr.G.Govinda Rajulu, Ms. K. Shyamala, Ms.Vani Vijayaratnam, Ms.G.Madhavi and other staff for their technical help. Our thanks are also due to Mr. G. Hanumantha Rao and Ms. G. Prashanthi for their secretarial help. Authors
41 SUMMARY Aging is one of the important developments of the 20 th century. The present aged population in India is about 56 million (6.7%). There is dearth of comprehensive information on the nutritional status of elderly. This report presents the results based on the current status of the elderly population using the available large data collected in different states of the country by the National Nutrition Monitoring Bureau (NNMB). The objectives were to assess the current status of diet and nutritional status of elderly population and the time trends if any, in their diet and nutritional status over two decades. About 922 elderly individuals were covered for diet survey and 3646 for anthropometric measurements during , while the coverage was 858 and 3659 respectively for the period during The mean intakes of cereals and millets together are 445g and 357g in males and females respectively. The consumption of pulses, GLV and other vegetables was less than RDl in both the sexes. The mean intake of Milk and Milk Products was below the RDl. The mean and median intake of protein was slightly below the RDl in both the sexes. The mean intakes of energy for male and females are 2167 and 1764 kcals. About 65% elderly population consumed more than the RDl of energy. In the case of vitamin A and riboflavin, the intakes were below the RDl. In about 59%, the intakes of Vit.A were less than 30% of RDl and only 13% consumed more than the RDl. Protein- Calorie adequacy status was observed in large proportion of elderly (male: 90% and female: 67%). The prevalence of Chronic Energy Deficiency (CED) (BMI <18.5) was relatively more among males (53.5%) than in females (49.4%). The prevalence of overweight/obesity (BMI > 25.0) was 4.2% in males, and 7.7% in females. The mean intakes of cereals & millets, GLV, other vegetables, nuts & oils, milk & milk products and sugar & Jaggery were higher in than those of The median intakes of nutrients among the elderly were higher in than of The median intakes of most of the nutrients, except iron and niacin were statistically significantly different between periods (p<0.05). A comparison between periods revealed that the extent of CED declined from about 62.3% in to 53.5% in among males and from 63.8% to 49.4% among females. An increasing trend was observed in the proportion of normal, overweight and obesity between and NNMB 26 Elderly Nutrition
42 1. INTRODUCTION The twentieth century has seen an unprecedented transition from high birth and death rates to low fertility and mortality rates 1, resulting in increased longevity. Thus, aging of the population is one of the important developments of the 20 th century during which there has been a considerable increase both in absolute and relative numbers of older people (60 years and above) in both developed and developing countries 2. This new development could be attributed to decline in the mortality rates due to improved health care facilities, changed life styles and diversification of food habits. According to the UN estimates 2, the elderly population was about 350 million in The projected figures for the years 2000 and 2025 are 590 and 1,100 million respectively. Currently, it is estimated that there are about 580 million elderly people in the world, of whom 355 million are in the developing countries. By the year 2020, it is estimated that there will be more than 700 million elderly people in the developing world 2. In India, the present population of elderly is about 56 million (6.7%). In 20 years time, the number is expected to increase to 158 million, constituting roughly 8-9 per cent of the total population 2. The increased proportion of aged population, due to higher life expectancy, is not necessarily devoid of any problems, and, in fact it invites a lot of socio-economic, psychological, physiological and health and nutritional problems. Hence, the health of the elderly has been attracting the attention of the medical professionals, psychologists, social scientists, nutritionists and governmental and non-governmental organizations all over the world. Adequate, appropriate and sufficient nutrition is essential to the health and well being of elderly. Generally the elderly people are nutritionally most vulnerable, the primarily due to poor dietary intake. Other factors, which contribute to undernutrition among the aged, are decreased physical activity, mental depression mostly due to isolation, maldistribution of food, poor eating habits, chronic ill health and dental problems. In India, there is dearth of comprehensive information on the nutritional status of elderly. There is, therefore, a need to develop database on the diet and nutritional status of the elderly from different parts of the country to enable the Government and NGOs to formulate policies and initiate strategies, which would contribute to the well being of elderly population. In this report, an attempt has been made to assess the current status of the elderly population using the available large data collected in different states of the country by the National Nutrition Monitoring Bureau (NNMB) during OBJECTIVES 1. To assess the current status of diet and nutritional status of elderly population in eight states where NNMB has been collecting information annually. 2. To assess time trends, if any, in their diet and nutritional status during the last two decades. NNMB 27 Elderly Nutrition
43 2. MATERIALS AND METHODS The NNMB has been carrying out annual diet and nutrition surveys since The data collected during by the NNMB on diet and nutritional in the rural areas of Kerala, Tamil Nadu, Karnataka, Andhra Pradesh, Maharashtra, Madhya Pradesh, Gujarat, Orissa has been utilized to asses the current nutritional status of elderly 3. In addition, to assess the time trends, data collected during in the same villages was utilized. 2.1 SAMPLING DESIGN Selection of villages The NNMB surveyed 120 villages in each state, 90 of which were those surveyed during and 30 were newly selected villages. The sample was so selected as to represent the dietary and nutritional status at the state level Selection of households From each of the selected villages, 20 households were selected by adopting cluster-sampling method. For this purpose, the main village and its hamlets, if any, were divided into five natural clusters consisting of groups of houses/streets/bastis/ mohallas/areas, of which SC community inhabited one cluster. From each of the clusters, 4 consecutive households were surveyed by selecting the first household randomly. Of the 20 HHs, ten were selected for diet survey. Of those 5 were selected for one day household weighment diet survey and remaining 5 HHs were selected for 24 hour dietary recall on all the members of the HH Information The following information has been used: 1. Socio-economic and demographic profile of the HHs and the individuals surveyed. 2. Diet survey of individuals by 24 dietary recall. 3. Anthropometric data on height, body weight, MUAC and FFT and 4. Clinical nutrition profile. 2.2 Statistical Analysis Statistical analysis was performed using SPSS 7.5 windows version. The data was analyzed by dividing the elderly into the following three specific age groups: years years >80 years Mean and SD values of food intakes and mean, median and SD values of nutrient consumption were calculated according to age, sex and the periods of survey. Mean, median and SD's of anthropometric measurements for the three age groups were calculated. Comparison of mean values of food and nutrient intakes were tested by ANOVA 'F' test with multiple comparison procedure and non parametric test of Kruskal Wallis one way ANOVA were utilized, whenever the assumption of homogeneity of variance was violated. Median test was used for comparison of medians between two periods for nutrients. The results were compared with that of the adults below the age of 60 years (i.e. non-elderly adults). The time trends over period were assessed by comparing the data collected in with that collected during NNMB 28 Elderly Nutrition

44 Prevalence rates of chronic energy deficiency (CED) were calculated using Body Mass Index (BMI). BMI is the ratio between weight in kg and the square of height in metres. Association of BMI, food and nutrient intakes with socio economic parameters was analyzed with chi-square test. 3. RESULTS AND DISCUSSION About 922 elderly individuals were covered for diet survey and 3646 for anthropometric measurements during , while the coverage was 858 and 3659 respectively for the period during (Table 1). Table 1 SAMPLE COVERAGE COVERAGE DIET SURVEY Individuals: ANTHROPOMETRY Individuals: ,659 3, SOCIO ECONOMIC PROFILE The details of socioeconomic status of the population surveyed in are presented in Table Religion Majority of households of the elderly surveyed belonged to Hindu Religion (81.6%), while the rest were Christians (5.3%), Muslims (4%) and others (9.1%) Community About 29% belonged to SC and ST population, while the rest belonged to other communities Type of House About 47.4% of the houses were kutcha and the rest were semi pucca (39.0%) or pucca (13.6%) Type of Family About 75% of the households were nuclear or extended nuclear families, while the rest of 25% were joint families. NNMB 29 Elderly Nutrition
45 3.1.5 Major Occupation of Head of Household Agriculture was the major occupation of a majority of the households. About 39% of the households were engaged in agriculture, while about 21% were either agricultural labourers or other labourers Landholdings A majority of the households belonged to either landless (39%) or small farmers having less than 5 acres (45%) Family Size About 30% of the elderly belonged to HHs having < 4 members, 26% of the HH had Literacy Status About 65.6% of heads of the HHs were illiterates. Table 2 SOCIO ECONOMIC PROFILE 3.2 DIETARY CONSUMPTION Foods The consumption of foodstuffs (g/day) according to age and sex is presented in Tables 3 and 4 & Fig. 1. The cereals and millets formed the bulk of dietaries of the elderly, as in other age groups. The intake of cereals and millets in males were 338 g and 107 g respectively, whereas in females, the intakes were 291 g and 66 g respectively. NNMB 30 Elderly Nutrition
46 The variation in dietary intake was large. Mean intakes of cereals and millets together were more than RDI. (Males: 445 g and Females: 357 g). In all the age groups and in both the sexes, the consumption of cereals and millets was above the RDI 5. The cereal intake was considerably reduced in oldest age group of 80 years. The mean intake of pulses in male and female was 31 g and 27 g respectively. The consumption of pulses and green leafy vegetables was less than RDI in all age groups in both the sexes. The intake of other vegetables, though was better than that of green leafy vegetables in all the age groups in both the sexes, was still lower than the RDI. The elderly males consumed higher than the suggested level of (50 g) of roots and tubers in all age groups. Mean intakes of sugar & Jaggery for males and females were 25 g and 21 g respectively Nutrients The mean and median intakes of nutrients, calculated for three age groups and sexes, are presented in Tables 5 & 6 and are compared with RDI values suggested by the Expert Committee of ICMR 4.5 (1990) (Fig.2). The mean and median intakes of protein were slightly less than the RDI in both the sexes. The intakes were higher in the younger age group (60-69 years) than in the other age groups, in both the sexes, though it was statistically significant only in females (p<0.01). The intakes among non-elderly adults were higher than the elderly adults. The median energy intakes of males (2080 Kcal) and females (1689) were less than the RDI. (RDI for energy among elderly was calculated according to their body weights). The mean intakes of energy, which were in marginally higher than the medians for male and females were 2167 and 1764 kcal. The mean intakes decreased with increasing age. The consumption of iron in both the sexes was lower than the RDI. The average consumption of calcium was, however more than the RDI (400 mg) in both the sexes. The intake of vitamin A was below the RDI (600 µg) in all age groups. The median intake was more in males (168 µg) than females (137 µg). The intakes increased with increasing age among the males. The median intake of thiamin was marginally lower than the RDI (Males: 1.2 mg and females: 1.0 mg). In the case of non-elderly adults the intakes were more than the elderly (males: 1.4 mg and females: 1.2 mg). The consumption was more among younger age groups of the elderly in both the sexes. The consumption of riboflavin was less than the RDI in all three age groups. Mean intakes were significantly different between ages in females (p<0.05). The riboflavin intake among non-elderly adults was comparable with the elderly in both the sexes. The mean intake of vitamin C was more than the recommended level of 40 mg for males (46 mg), while it was comparable in females (39 mg), in each age group. The median intakes were, however, less than RDI. NNMB 31 Elderly Nutrition
47 Fig.1 : MEAN DAILY INTAKE OF FOODS (g/cu/day)
 NNMB 33 Elderly")
48 Fig. 2 : MEAN DAILY INTAKE OF NUTRIENTS (per CU/day) NNMB 33 Elderly Nutrition
49 Table 3 INTAKE OF FOOD STUFFS (g/day) AMONG ELDERLY INDIVIDUALS - MALES Table 4 INTAKE OF FOOD STUFFS (g/day) AMONG ELDERLY INDIVIDUALS - FEMALES
50 NNMB Table 5 INTAKES OF NUTRIENTS AMONG ELDERLY INDIVIDUALS - MALES 35 Elderly Nutrition
51 Table 6 INTAKE OF NUTRIENTS AMONG ELDERLY INDIVIDUALS - FEMALES
52 3.2.3 Distribution of Nutrient Intake by per cent of RDI Distributions of individuals according to intake of major nutrients as per cent of RDI are presented in Table 7. About 65% elderly population consumed more than the RDI of energy. The percentage consuming more than RDI were slightly more among the males (71%) than in females (60%). The corresponding figures for the non-elderly adults were 52% and 64% respectively. It may be noted that while the RDI of elderly is based on actual weights. A negligible proportion of elderly (1.4%) consumed energy below 50% of RDI. The consumption of protein was less than 50% of RDI in about 2% of the elderly. As in the other age groups, the micronutrient intakes were inadequate. The intake of vitamin A was very unsatisfactory. In about 59%, the intakes were less than 30% of RDI, while only 13% consumed more than the RDI. The intakes of riboflavin were more than RDI in only 11% of individuals, while 5.2% were consuming <30% RDI (Table 7). About 16% consumed less than 50% of RDI of thiamin. In about 38% the intakes were more than RDI. Table 7 DISTRIBUTION OF ELDERLY ACCORDING TO NUTRIENT INTAKES BY PERCENT OF RDI Protein Calorie adequacy status - The protein and energy requirement curves are assumed to follow gaussian distribution, with a coefficient of variation of 15%. The ICMR Expert Committee suggested mean requirements of energy for different ages, whereas in the case of protein, the RDI corresponded to Mean + 2SD of actual requirements. The NNMB 37 Elderly Nutrition
53 Individuals with less than Mean - 2 SD of requirements of energy/protein were categorized as energy/protein inadequate. Protein-Calorie adequacy status was observed in a large proportion of elderly (Male: 90%; Female: 82%). As the age advanced the inadequacy status also increased in both the sexes. 3.3 NUTRITIONAL STATUS The mean, median and SDs of anthropometric measurements according to age, sex and period of survey are presented in Tables 8 to 10. The mean heights of elderly decreased in both the sexes, as the age advanced. However, such a trend was noticed only among males. The nutritional status of the elderly was assessed based on Body Mass Index (BMI). It is the ratio of weight in kgs, and square of height in meters. The mean BMI was higher in the younger age group of males, while in the case of females it was higher in the older age group. The elderly were grouped into different nutritional grades using James 6-8 Classification, was given below. BMI Nutritional Grade <16.0 III degree CED II degree CED I degree CED Low normal Normal I degree obesity >30.0 II degree obesity Table 8 ANTHROPOMETRIC MEASUREMENTS OF MALES BY AGE AND PERIOD OF SURVEY AGE HEIGHT WEIGHT YEAR N BMI (Years) (Cms) (Kgs) Mean Median SD Mean Median SD Mean Median SD Mean Median SD Mean Median SD Mean Median SD NNMB 38 Elderly Nutrition
54 Table 9 ANTHROPOMETRIC MEASUREMENTS OF FEMALES BY AGE GROUPS AND PERIOD OF SURVEY YEAR AGE HEIGHT WEIGHT N (Years) (cms) (kgs) BMI Mean Median SD Mean Median SD Mean Median SD Mean Median SD Mean Median SD Mean Median SD The prevalence of Chronic Energy Deficiency (CED) (BMI <18.5) was relatively more among males (53.5%) than in females (49.4%). It was observed that the proportion of CED increased with increasing age among males, while it was the lowest among the females of 80 years and above. This may be due to the common observation that, in general, BMI is higher in females than males. The prevalence of obesity (BMI > 25.0) was 4.2% in males, and 7.7% in females (Table-10 & Fig.3a, 3b & 4a, 4b). In the case of non-elderly adults, the prevalence of CED was lower than the elderly in both the sexes (Males: 44.2%; Females: 46.8%). Table 10 DISTRIBUTION (%) OF ELDERLY BY AGE AND SEX ACCORDING TO BMI Age (Years) <18.5 Male <18.5 Female Pooled Non-elderly (18-59yrs) Males: χ 2 = 0.96 (NS); Females: χ 2 =2.34(NS) NNMB 39 Elderly Nutrition
55 Fig.3 PREVALENCE (%) OF CHRONIC ENERGY DEFICIENCY AMONG ELDERLY BY AGE NNMB 40 Elderly Nutrition

56 Fig. 4 DISTRIBUTION (%) OF ELDERLY & NON ELDERLY ACCORDING TO BMI BY YEAR OF SURVEY NNMB 41 Elderly Nutrition
57 4. TIME TRENDS IN FOOD AND NUTRIENT INTAKES The average intakes of different foods are presented in Tables 11 & 12. The mean intakes of all foodstuffs were higher in than those of , except with respect to pulses in case of males and females and roots & tubers among females. The intakes of GLV, millets, fish and foods continued to be negligible at both points of time. The median intakes of nutrients among the elderly were higher in than those of except with respect to thiamin in both the sexes. (Table13 & 14). The medians of most of the nutrients, except iron and niacin were statistically significantly different between periods (p<0.05). A comparison between the two periods revealed that the extent of CED declined from about 62.3% in to 53.5% in among the males and from 63.8% to 49.4% among the females. There was a concomitant increasing trend in the proportion of normal, overweight / obesity between and (Table 15). NNMB 42 Elderly Nutrition

58 Table 11 MEAN INTAKE OF FOOD STUFFS (g/day) AMONG ELDERLY BY AGE AND PERIOD OF SURVEY - MALES NNMB 43 Elderly Nutrition
59 Table 12 MEAN INTAKE OF FOOD STUFFS (g/day) AMONG ELDERLY BY AGE AND PERIOD OF SURVEY - FE MALES NNMB 44 Elderly Nutrition
60 Table 13 INTAKES OF NUTRIENTS AMONG ELDERLY BY AGE AND PERIOD OF SURVEY MALES NNMB 45 Elderly Nutrition

61 Table 14 INTAKE OF NUTRIENTS AMONG ELDERLY FEMALES BY AGE AND PERIOD OF SURVEY NNMB 46 Elderly Nutrition
62 Table 15 DISTRIBUTION (%) OF ELDERLY ACCORDING TO BMI BY AGE AND SEX NNMB 47 Elderly Nutrition
63 5.1 BODY MASS INDEX 5. EFFECT OF SOCIO-ECONOMIC STATUS A comparison of the prevalence of CED (BMI <18.5) among elderly males and females between the two periods indicates that there was evidence of reduction in the prevalence in as compared to among the elderly belonging to SC + ST communities, illiterates, those living in kutcha houses and among landless (Table-16). The distribution of the individuals according to BMI is presented in the (Tables 17 to 22). The proportion of CED (BMI: < 18.5) was much higher among the elderly belonging to SC+ST communities (64.6%), than other communities (36.5%) (Table-17). On the other extreme the extent of overweight was much higher in others (7.1%) than among the SC+ST (2.6%). There were no differences in grade III CED between nuclear and joint families (16.6%). (Table-18). CED was higher in illiterates (57.3%) than among the literates (41%) (PO.001) (Table-19). There was an association between BMI and family size (p<0.05), though the differences were small. The prevalence of CED with III degree was more among the larger families (18.1%), where the mean family size was seven and above than smaller families (15.4%) (P<0.05) (Table-20). The extent of CED was higher among the elderly living Kutcha houses (60.0%) was almost twice as those residing in pucca houses (35%). The proportion of normal (13.1%) was also similarly higher in pucca houses than those living in other types of houses (p<0.05) (Table-21). As expected, the elderly of the labourers families were at a disadvantage with higher prevalence of CED as compared to agriculturist's (52%) and Others (47%) (p<0.001) (Table-22). The prevalence of CED was highest (53.4%) among the elderly belonging to the households who had no land. The extent of CED was the lowest among individuals who had owned more than 10 acres (p<0.001) (Table-23). Table 16 PREVALENCE (%) OF CED (BMI < 18.5) AMONG ELDERLY ACCORDING TO HOUSEHOLD SOCIOECONOMIC CHARACTERISTIC AND PERIOD OF SURVEY - SEXES POOLED Household Particulars Percent of BMI < SC&ST Head of Household Illiterate Family Size > Type of House 'Kutcha' Head of Household Labourers Head of Household Landless NNMB 48 Elderly Nutrition
64 Table 17 DISTRIBUTION (%) OF ELDERLY BY BMI AND COMMUNITY Community BMI < >25 SC + ST Others χ 2 = ; P< Table 18 DISTRIBUTION (%) OF ELDERLY BY BMI AND TYPE OF FAMILY Type of BMI family < >25 Nuclear Joint χ 2 = 1.84; P< 0.05 Table 19 DISTRIBUTION (%) OF ELDERLY BY BMI AND LITERACY STATUS Literacy BMI Status < >25 Illiterates Literates χ 2 = 146.1; P< Table 20 DISTRIBUTION (%) OF ELDERLY BY BMI AND FAMILY SIZE Family Size BMI < >25 < > χ2 = 21.1; P < 0.05 Table 21 DISTRIBUTION (%) OF ELDERLY BY BMI AND TYPE OF HOUSE Type of BMI House < >25 Kutcha Semi pucca Pucca χ 2 = 199.5; P < NNMB 49 Elderly Nutrition


65 Table 22 DISTRIBUTION (%) OF ELDERLY BY BMI AND OCCUPATION Table 23 DISTRIBUTION (%) OF ELDERLY BY BMI AND LAND HOLDING χ 2 = 35.5; P < 0.01 NUTRITIONAL STATUS TIME TRENDS ANTHROPOMETRY 54% of males and 49% of females had CED (BMI <18.5), white about 42% of males and 43% of females were normal The extent of CED declined from 63% in to 53% in FOOD INTAKES The average daily intakes of various foods and nutrients were compared according to socio economic parameters, such as community, type of house, type of family, occupation of head of HH and landholdings, the results are presented in Tables Community The consumption of most of the food stuffs, except cereals & millets and GLV, was lower among elderly of SC & ST community (P<0.05) (Table 24) Type of Family The average intakes of majority of foods were comparable among the elderly of nuclear families and those from the joint families (Table 25) Type of house The type of house is considered as an index of socio economic status. The current intakes of almost all the food stuffs were higher among the elderly who were staying in pucca type of houses except for cereals & millets (448 g) and GLV (20 g) NNMB 50 Elderly Nutrition
66 (Table 26). The consumption of mean food stuffs, except pulses, other vegetables and roots & tubers and fats & oils were different between type of houses in all the foods (p<0.05) Land holdings The consumption of pulses, other vegetables, milk & milk products, fats & oils and sugar & jaggery was higher among the households, which had more than 10 acres of land. Significant differences were observed between the elderly of the households with different sizes of land holdings with respect to cereals, pulses, nuts & oil seeds, fish and milk and milk products (p<0.05) (Table 27) Occupation The consumption of all food stuffs, except cereals & millets (433 g) and GLV (23 g), was lower among the labourers compared to those who were engaged in agriculture and services. The mean intakes of majority foods except fruits, other flesh foods and sugar & jaggery were significantly different between occupational groups (p<0.05) (Table 28) Family size The consumption of cereals & millets (436 g) and pulses (36 g) was higher among the elderly living in households with family size 7 or more compared to small families ( 4 members). However the consumption of milk and milk products was higher among small families (Table 29) Literacy Status Literacy of the head of the household seems to play an important part in determining food intakes. Among the illiterates the current consumption of cereals & millets (421 g), and GLV (17 g) was higher. However, among the illiterates the consumption of milk, fish and other flesh foods, fruits, other vegetables and nuts and oil seeds was lower than those of literate. It was also observed that the mean intakes of all the foods except GLV, other flesh foods and sugar & jaggery were significantly and positively associated with educational status of the head of the household (p<0.05) (Table 30). NNMB 51 Elderly Nutrition
67 Community N Cereals Pulses Table 24 MEAN INTAKE OF FOOD STUFFS (g/day) BY COMMUNITY Green Leafy Veg. Other veg. Roots & tubers Nuts & Oil Seeds Fruits Fish Other Flesh Foods Milk & Milk Prod. Fats& Oils Sugar & Jaggery SC+ST Others "t" Value 4.5 *** 0.5 **p<0.01;***p< ** ** 6.2*** ** * *** ** Type of Family Table 25 MEAN INTAKE OF FOOD STUFFS (g/day) BY TYPE OF FAMILY Roots N Cereals Pulses Fruits Fish Green Leafy Veg. Other veg. & tubers Nuclear Nuts & Oil Seeds Other Flesh Foods Milk& Milk Prod. Fats& Oils Sugar & Jaggery Joint F ratio ** ** p<0.01 Type of House N Cereals Pulses Table 26 MEAN INTAKE OF FOOD STUFFS (g/day) BY TYPE OF HOUSE Green Leafy Veg. Other veg. Roots & tubers Nuts & Oil Seeds Fruits Fish Kutcha Semi - pucca Pucca Other Flesh Foods Milk& Milk Prod. Fats& Oils Sugar & Jaggery F ratio 43.7 *** ** *** 11.6 *** 19.1*** 9.2 *** *** ** **p<q.01;***p<0.001 NNMB 52 Elderly Nutrition
68 Table 27 MEAN INTAKE OF FOOD STUFFS (g/day) BY TOTAL LAND HOLDING Total Land (acres) N Cereals Pulses Green Leafy Veg. Other veg. Roots & tubers Nuts & Oil Seeds Fruits Fish No land Other Flesh Foods Miik& Milk Prod. Fats& Oils Sugar & Jaggery > F ratio 3.7* 4.9 *** *** *** * *p<0.05; *** p<0.001 Table 28 MEAN INTAKE OF FOOD STUFFS (g/day) BY OCCUPATION Total Land (acres) N Cereals Pulses Green Leafy Veg. Other veg. Roots & tubers Nuts & Oil Seeds Fruits Fish Occupation Other Flesh Foods Miik& Milk Prod. Fats& Oils Sugar & Jaggery Labourers Agriculture F ratio 29.5*** 6.3*** 3.8* 6.0** ** *** *** *** 3.7* 1.0 *p<0.05; ** p<0.01; *** p<0.001 NNMB 53 Elderly Nutrition
69 Family size N Cereals Pulses Table 29 MEAN INTAKE OF FOOD STUFFS (g/day) BY FAMILY SIZE Green Leafy Veg. Other veg. Roots & tubers Nuts & Oil Seeds Fruits Fish < Other Flesh Foods Miik& Milk Prod. Fats& Oils Sugar & Jaggery > F ratio 8.4 *** 9.5 * * ** * ** ** * p<0.05; ** p<0.01; *** p<0.001 Table 30 MEAN INTAKE OF FOOD STUFFS (g/day) BY LITERACY STATUS Literacy Status N Cereals Pulses Green Leafy Veg. Other veg. Roots & tubers Nuts & Oil Seeds Fruits Fish Illiterates Other Flesh Foods Milk& Milk Prod. Fats& Oils Sugar & Jaggery Literates F ratio 23.0 ** 7.5** *** 13.5** * *** 10.4** * 88.9 ** * ** * * *p<0.05; ** p<0.01; *** p<0.001 SOCIO ECONOMIC and NUTRITIONAL STATUS Overweight was higher among other communities than SCs & STs CED was more among elderly of Scheduled Castes & Scheduled Tribes, illiterate, landless and those living in kutcha houses. NNMB 54 Elderly Nutrition
70 5.3 NUTRIENT INTAKES The average daily intakes of various nutrients according to socio-economic parameters were given in Tables Community There were no perceptible differences in the nutrient intakes between the households of SC & ST communities and others. The mean intakes of calcium, iron and riboflavin were higher in others than among SC & ST (p<0.05) (Table-31) Type of family The intakes of majority of nutrients, though were more among the nuclear families than those in joint families, were not significantly different between type of families (p>0.05) (Table 32) Type of House The consumption of nutrients like energy, iron, vitamin A and niacin was surprisingly more among individuals who are staying in kutcha type of houses compared to those individuals who are staying in semi-pucca and pucca type of houses (Table 33) Land holdings The nutrient intakes were more among the individuals who had land holdings 10 acres and above (Table 4) Occupation It was observed that the consumption of all the nutrients except that of vitamin A and vitamin C was more among the individuals where the occupation of head of the households was agriculture. The intakes of a majority of nutrients, except vitamin A and vitamin C were significantly different (P<0.05) between occupations (Table 35) Family size Surprisingly the consumption of nutrients like protein (53 g), energy (2025 Kcal), iron (25 mg) and niacin (13.1 mg) was more among the families with 7 or more members, compared to smaller families. This may be because of higher number of earning members. The mean intakes of calcium, iron, thiamin and vitamin 'C' were statistically significant between different family size (Table 36) Literacy The mean intakes of majority nutrients except iron (24.1 mg), vitamin A (295 µg), thiamin (1.1 mg) and niacin (12.1 mg) were more among literates than those among the illiterates. The mean intakes of protein, calcium, iron, thiamin, riboflavin, and vitamin 'C' were significant (p<0.05) by literacy status (Table 37) Per capita Income The consumption of most of the nutrients were more among the individuals who had per capita income of more than Rs (Table 38). Time trends in socio-economic status versus food and nutrient intakes and nutritional status are presented in Annexures NNMB 55 Elderly Nutrition
71 Community Table 31 MEAN INTAKE OF NUTRIENTS (per day) BY COMMUNITY N Protein (g) Energy (Kcal) Calcium Iron Vit. A (μg) Thiamin Ribofl- avin Niacin SC + ST Others Vit.C F ratio *p<0.05; *** p< *** 4.0* * Type of family Table 32 MEAN INTAKE OF NUTRIENTS (per day) BY TYPE OF FAMILY N Protein (g) Energy (Kcal) Calcium Iron Vit.A (μg) Thiamin Ribofl- avin Niacin Nuclear Joint F ratio Vit.C Table 33 MEAN INTAKE OF NUTRIENTS (per day) BY TYPE OF HOUSE Type of House N Protein (g) Energy (Kcal) Calcium Iron Vit. A (μg) Thiamin Riboflavin Niacin Vit.C Kutcha Semi Pucca Pucca F ratio * 7.1 *** 19.3 *** ** *p < 0.05; ** p < 0.01; *** p < Total land holding (acres) Table 34 MEAN INTAKE OF NUTRIENTS (per day) BY TOTAL LAND HOLDING N Protein (g) Energy (Kcal) Calcium Iron Vit.A (μg) Thiamin Ribofl- avin Niacin No land > Vit.C F ratio 2.8 * 3.2 * ** *** 4.3 * *** *p < 0.05;**p < 0.01;***p < NNMB 56 Elderly Nutrition
72 Occupation Table 35 MEAN INTAKE OF NUTRIENTS (per day) BY OCCUPATION N Protein (g) Energy (Kcal) Calcium Iron Vit. A (μg) Thiamin Riboflavin Niacin Labourers Agriculture Others F ratio 7.1 *** 6.8 *** 7.3 *** 13.1 *** *** 8.4 *** 6.1 ** 1.3 *p<0.05;**p<0.01;***p<0.001 Family Size Table 36 MEAN INTAKE OF NUTRIENTS (per day) BY FAMILY SIZE N Protein (g) Energy (Kcal) Calcium Iron VitA (μg) Thiamin Riboflavin Niacin < > F ratio * 4.1* *** ** 3.7** *p < 0.05; ** p <0.01;***p <0.001 Literacy Status Table 37 MEAN INTAKE OF NUTRIENTS (per day) BY LITERACY STATUS N Protein (g) Energy (Kcal) Calcium Iron Vit. A (μg) Thiamin Riboflavin Niacin Illiterate Literate F ratio 4.2* *** 4.6 * ** 10.6 *** *** *p<0.05;**p<0.01;***p<0.001 Vit.C Vit.C Vit.C Per capita Income (Rs.) Table 38 MEAN INTAKE OF NUTRIENTS (per day) BY PERCAPITA INCOME N Protein (g) Energy (Kcal) Calcium Iron VitA (μg) Thiamin Riboflavin Niacin < > F ratio 3.5* * *** ** *** ** ** *p<0.05; ** p<0.01;***p<0.001 Vit.C SOCIO ECONOMIC STATUS Vs. FOOD AND NUTRIENT INTAKE Higher intakes of cereals and GLV reported in SC & ST communities. Higher intakes of income-elastic foods observed among HHs having more than 10 acres. Intakes of Energy, Iron, Vitamin A and Niacin were more in households living in kutcha houses. Intakes of Protein, Energy, Iron and niacin were more in households with large family size. NNMB 57 Elderly Nutrition
73 6. CONCLUSIONS The objective of the study was to assess the current diet and nutritional status of the elderly utilizing the data collected by NNMB during and to study the time trends since This information could perhaps be considered as the first large database on diet and nutritional status of the elderly in India. The results of the study indicated that, the overall intake of various foods except cereals & millets was less than RDI in males. Similarly, the average intake of all the nutrients except calcium, thiamin and Vitamin C was less than RDI. The consumption of foods increased during except in pulses from that observed in The prevalence of CED decreased over the period, with a concomitant increase in the prevalence of overweight among males and females. There is however, a need to conduct comprehensive surveys including information on diet related chronic diseases and behavioral and psychosocial aspects, in addition to diet and nutritional status. NNMB 58 Elderly Nutrition
74 Annexure 1 MEAN INTAKE OF FOOD STUFFS (g/day) BY COMMUNITY Community Year N SC+ST Others Cereals & Millets Pulses Green Leafy Veg. Other Veg. Roots & Tubers Nuts & Oil Seeds Fruits Fish Other Flesh foods Milk& Milk Prod. Fats & Oils Sugar & Jaggery F-Ratio Between yrs *** 21.66*** 14.5*** *** 22.16*** 6.64** Between Communities *p<0.05; ** p<0.01; *** p< *** 5.13* 10.82*** *** * 9.10*** *** 3.89* Family Size Year N <4 Annexure 2 MEAN INTAKE OF FOOD STUFFS (g/day) BY FAMILY SIZE Cereals & Millets Pulses Green Leafy Veg. Other Veg. Roots & Tubers Nuts & Oil Seeds Fruits Fish Other Flesh foods Miik& Milk Prod. Fats & Oils Sugar & Jaggery >7 F-Ratio Between Yrs. 3.7* * *** *** Between Family Size *p<0.05; ** p<0.01; *** p< *** ** *** ** *** *** NNMB 59 Elderly Nutrition
75 Type of House Kutcha Year N Annexure 3 MEAN INTAKE OF FOOD STUFFS (g/day) BY TYPE OF HOUSE Cereals & Millets Pulses Green Leafy Veg. Other Veg. Roots & Tubers Nuts & Oil Seeds Fruits Fish Other Flesh foods Milk& Milk Prod. Fats & Oils Sugar & Jaggery Semi pucca Pucca F-Ratio Between Yrs * *** *** *** 4.24 * *** Between Type of house *p<0.05; ** p<0.01; *** p< *** * *** *** *** 4.70 ** *** 8.83 *** *** Annexure 4 MEAN INTAKE OF FOOD STUFFS (g/day) BY LITERACY STATUS Literacy Status Illiterate Year N Cereals & Millets Pulses Green Leafy Veg. Other Veg. Roots & Tubers Nuts & Oil Seeds Fruits Fish Other Flesh foods Milk& Milk Prod. Fats & Oils Sugar & Jaggery Literate F-Ratio Between Yrs ** * 0.01 Between Literacy Status *** *** *** ** *** *** *** 9.28 ** *** *** *** 6.43 * *** 5.15 * *** 4.08 * * p<0.05; ** p<0.01; *** p<0.001 NNMB 60 Elderly Nutrition
76 Annexure 5 MEAN INTAKE OF FOOD STUFFS (g/day) BY OCCUPATION Occupation Year N Cereals & Millets Pulses Green Leafy Veg. Other Veg. Roots & Tubers Nuts & Oil Seeds Fruits Fish Other Flesh foods Milk& Milk Prod. Fats & Oils Sugar & Jaggery Labourers Agriculture Others Between Yrs * * *** *** *** ** ** 5.97 * F-Ratio * p<0.05; ** Between Type of house p<0.01; *** p< *** *** *** *** 7.46 *** *** *** *** 4.21* Annexure 6 MEAN INTAKE OF FOOD STUFFS (g/day) BY TYPE OF FAMILY Type of Family Nuclear Year N Cereals & Millets Pulses Green Leafy Veg. Other Veg. Roots & Tubers Nuts & Oil Seeds Fruits Fish Other Flesh foods Milk& Milk Prod. Fats & Oils Sugar & Jaggery Joint Between Yrs * *** *** *** *** 4.41 * F-Ratio * p<0.05; ** Between Type of Family p<0.01; *** p< ** * * NNMB 61 Elderly Nutrition
77 Annexure 7 MEAN INTAKE OF FOOD STUFFS (g/day) BY TOTAL LAND HOLDING Total Land (acres) Year N Cereals & Millets Pulses Green Leafy Veg. Other Veg. Roots & Tubers Nuts & Oil Seeds Fruits Fish Other Flesh foods Milk & Milk Prod. Fats & Oils Sugar & Jaggery No land 1-5 F-Ratio 5-10 > Between Yrs *** *** *** *** Between Land Holding *p<0.05; ** p<0.01; *** p< ** *** * 2.86* *** 3.41 * *** 9.82 *** 9.47 *** Annexure 8 MEAN INTAKE OF NUTRIENTS (per day) BY COMMUNITY Community Year N SC + ST Others Protein (g) Energy (Kcal) Calcium Iron Vit. A (μg) Thiamin Riboflavin Niacin Vit. C F-Ratio Between Community p<0.05; ** p<0.01; *** p<0.001 Between Yrs *** *** 27.33*** ** ** ** NNMB 62 Elderly Nutrition
78 Annexure 9 MEAN INTAKE OF NUTRIENTS (per day) BY FAMILY SIZE Family Size Year N <4 5-6 >7 Protein (g) Energy (Kcal) Calcium Iron Vit A (μg) Thiamin Riboflavin Between Yrs *** * *** *** *** Niacin Vit. C F-Ratio Between Family Size ** * * 3.17 * * p<0.05; ** p<0.01; *** p<0.001 Annexure 10 MEAN INTAKE OF NUTRIENTS (per day) BY TYPE OF HOUSE Family Size Year N F-Ratio < >7 Protein (g) Energy (Kcal) Calcium Iron Vit. A (μg) Thiamin Riboflavin Between Yrs *** *** *** 25.99*** 6.65** 11.39*** Between Type of House Niacin *** *** Vit. C ** p<0.01;***p<0.001 NNMB 63 Elderly Nutrition
79 Annexure 11 MEAN INTAKE OF NUTRIENTS (per day) BY LITERACY STATUS Literacy Status Year N Illiterate Literate F-Ratio Protein (g) Energy (Kcal) Calcium Iron Vit A (μg) Thiamin Riboflavin Between Yrs *** Between Literacy Status Niacin *** *** Vit.C *** p< Annexure 12 MEAN INTAKE OF NUTRIENTS (per day) BY OCCUPATION Occupation Year N Labourers Agriculture Others Protein (g) Energy (Kcal) Calcium Iron Vit. A (μg) Thiamin Riboflavin Niacin Vit.C F-Ratio Between Yrs *** * 21.46*** 34.67*** *** Between Types of Occupation 15.81*** ** 11.04*** *** 14.52*** 9.31*** 1.75 *p<0.05; ** p<0.01; *** p<0.001 NNMB 64 Elderly Nutrition
80 Annexure 13 MEAN INTAKE OF NUTRIENTS (per day) BY TYPE OF FAMILY Type of family Year N Nuclear Joint Protein (g) Energy (Kcal) Calcium Iron Vit. A (μg) Thiamin Riboflavin Niacin Vit. C F-Ratio Between Type of Family Between Yrs *** 25.46*** *** 5.04 * 6.74 ** * ** * 0.72 *p<0.05; ** p<0.01; *** p<0.001 Annexure 14 MEAN INTAKE OF NUTRIENTS (per day) BY TOTAL LAND HOLDING Size of Land Holding No Land >10 Year N Protein (g) Energy (Kcal) Calcium Iron vit. A (μg) Thiamin Riboflavin Between Yrs * *** *** 5.65 * *** *** Niacin Vit. C F-Ratio Between Size of Land Holding *p<0.05; ** p<0.01; *** p< *** 7.97 *** *** *** *** *** 5.10 ** NNMB 65 Elderly Nutrition
81 7. REFERENCES 1. UN ACC-SCN, Nutrition & Healthy Aging - SCN News, No. 19, Editorial, 1999: The International year of the older persons. Journal of Indian Medical Association. 97, No.4, April NNMB Second Repeat surveys - Rural ( ) 4. Expert group of Indian Council of Medical Research, Nutrient Requirements and Recommended Dietary Allowances for Indians, New Delhi: Indian Council of Medical Research, National Institute of Nutrition, Dietary Guidelines for Indians. Hyderabad: National Institute of Nutrition, James, W.P.T. Anna. Ferro Luzzi and Waterlow, J.C. Definition of chronic energy deficiency in adults. European J. Clin.Nutr. 1988,42: Anthony, B.J., Nutritional Assessment of the Elderly. Cajanus. 1999, 32: Flegal, K.M., Trends in body weight and overweight in the U.S. Population. Nutrition Reviews, 1996, 54: S97-S100. NNMB 66 Elderly Nutrition
82 NATIONAL NUTRITION MONITORING BUREAU REPORT FOOD & NUTRIENT INTAKES OF INDIVIDUALS ON K. VIJAYARAGHAVAN N. BALAKRISHNA GRACE MARIA ANTONY NATIONAL INSTITUTE OF NUTRITION Indian Council of Medical Research Jamai-Osmania (P.O.), Hyderabad , INDIA 2000
83
84 CONTENTS Page Nos. ACKNOWLEDGEMENTS SUMMARY 1. INTRODUCTION 2. MATERIALS AND METHODS 3. RESULTS 2.1 Analysis 3.1 Sample 3.2 Food Intakes 3.3 Distribution of Intakes as Percent of RDI 4. TIME TRENDS 4.1 Food Consumption 4.2 Nutrient Consumption 5. COMMENTS REFERENCES
85 ACKNOWLEDGEMENTS We wish to convey our thanks to Dr.A.Laxmaiah, Dr R.Hari Kumar and Dr.M.Vishnuvardhana Rao, Senior Research Officers; Dr.N.Ariappa, Mr.Ch.Gal Reddy, Mr.K.Mallikharjuna Rao and Mr.B.Surya Prakasham, Research Officers; Mr.Sharad Kumar and Mr. M.Ravindranath, Technical Research Officers; Ms.M.Uma Nayak and Ms.K.Damayanthi, Nutritionists for their help during analysis. We also thank Mr.P.Satish Babu, Mr.G.Govinda Rajulu, Ms.K. Shyamala, Ms.Vani Vijayaratnam, Ms.G.Madhavi and other staff for their technical help. Our thanks are also due to Mr. G. Hanumantha Rao and Ms. G. Prashanthi for their secretarial help. Authors
86 SUMMARY The report presents the results of the analysis of 24-hour dietary recall data on individuals of different ages, collected by the National Nutrition Monitoring Bureau. The current dietary status was assessed based on the data collected in as a part of second repeat survey in the same villages, which were visited in In addition, time trends in the food and nutrient intakes were assessed by comparing the above two sets of data, collected about two decades apart. The data of about individuals in and in , belonging to different age, sex, physiological and physical activity groups formed the material of the analysis. The results indicated that there was considerable variation in the intakes of both foods and nutrients, with a very high coefficient of variation, ranging from about 40% to more than 100%. The variation was particularly high in the intakes of foods like millets, green leafy vegetables, other vegetables, milk and milk products and fats and oils. Even in the case of nutrients, the variation was high especially in the case of micronutrients, fat, and relatively to a lesser degree in the case of energy and protein. The median intakes of food and nutrients, in general, were below the RDI. There were no differences between the intakes of non-pregnant & non-lactating (NPNL) females and pregnant women, despite the increased requirements due to pregnancy and lactation. About 30-40% of the individuals in different age groups had cereal intakes comparable to RDI. The children appeared to be worse off and about 10% had cereal-millet intakes less than half of RDI. About 83-90% of individuals consumed less than 30% of RDI of GLV. About 13 to 55% of individuals consumed energy more than or equal to RDI. Only about 11% of the population were consuming adequate amounts of Vitamin A, and 50-70% had intakes less than 30% of RDI. Iron consumption was inadequate in more than 90% of the individuals in almost all the age groups. There was an increase in the consumption of mean cereal intakes in all age groups in , except in children of 1-3 years of age, as compared to those of The changes in the consumption of pulses and GLV were negligible (<5% of intakes). Median test revealed that there were no significant differences, between the periods, in the intakes of energy, vitamin A and fat in 1-3 year old children. However, there was significant improvement in the intakes of the above nutrients in the other age groups. But, in the case of iron, there were significant changes only in the intakes of adult males, adult females (NPNL) and lactating women. These results, based on comparison of median intakes of individuals, are different from those reported earlier, which did not reveal any changes in the mean intakes of foods and nutrients of households NNMB 67 Individual Dietary Pattern
87 1. INTRODUCTION The National Nutrition Monitoring Bureau (NNMB) has been continuously collecting information on diet and nutritional status of the communities in 10 States since the year Every year, the bureau collected information in selected households on dietary intakes at the household level using one-day weighment method, and of individuals of different ages by 24-hour dietary recall method. While the results of household diet surveys have been reported in the annual reports of the NNMB, the information on individual intakes has not been regularly presented, particularly since the year In this report, the results of analysis of data on 24 hour recall diet survey, conducted in 8 States, to assess the dietary pattern of individuals of different ages and physiological groups obtained in 8 States are presented. 1.1 Objectives i) To assess the current food and nutrient intakes of individuals of different physiological and age groups in the States surveyed. ii) To assess the time trends, if any, in the dietary pattern, by comparing the data collected in on dietary status of individuals with that from the same villages which were surveyed during MATERIALS AND METHODS The current dietary status was assessed based on the data collected during as a part of second repeat survey 1. This survey was carried out in the States of Andhra Pradesh, Gujarat, Karnataka, Kerala, Maharashtra, Orissa and Tamil Nadu. A total of 120 villages were selected for survey in each State, of which 90 were from those covered in and the remaining were new. In each village, 20 HHs were selected from which 10 were selected for diet survey. In five of these 10 HHs, 24-hour recall diet survey was done on all the members. 2.1 Analysis The mean, median and SD were calculated for the data, collected as a part of second repeat survey. The data collected in were similarly analysed and compared with that collected in to assess time trends. Moving averages were calculated to pool data collected during Distribution of individuals of different age and sex groups according to food and nutrient intakes expressed as percentage of Recommended Dietary Intakes (RDI)2,3 was calculated. 3.1 Sample 3. RESULTS The sample covered in different ages in different States according to the period of survey is presented in Table-1. During , about individuals belonging to different age and physiological groups were surveyed, while individuals were covered during NNMB 68 Individual Dietary Pattern
88 Table 1 SAMPLE COVERAGE ACCORDING TO AGE, SEX AND PERIOD OF SURVEY Age Year of Survey Pooled 4-6 Pooled Pooled boys girls boys girls boys girls Adult males Adult females NPNL Pregnant Lactating Food Intakes The mean, SD and median of intakes of most of the foods were below the RDI levels (Tables-2 to 4). The coefficient of variation of all food intakes was very high. The median values were less than those of means. Cereals (rice/wheat) were the staples in all the States surveyed. The mean intakes of millets ranged from about 31 g in 1-3 year old children to 120 g in adult males. The median intakes however revealed that less than 50% of the individuals were consuming millets. The intakes of protective foods like GLV, fruits, fats and oils, and milk and milk products were woefully inadequate in almost all the ages. Table 2 FOOD INTAKES (g/day) BY AGE GROUPS Age Groups (Years) Food Stuffs Mean SD Mean SD Mean SD Millets Cereals Pulses GLV Other vegetables Roots and Tubers Nuts & Oil seeds (Contd..) NNMB 69 Individual Dietary Pattern
89 Table 2 FOOD INTAKES (g/day) BY AGE GROUPS (Contd..) Age Groups (Years) Food Stuffs Mean SD Mean SD Mean SD Condiments & spices Fruits Fish Other flesh Foods Milk & Milk Products Fats Sugar & Jaggery Table 3 FOOD INTAKES (g/day) BY AGE GROUPS Age Groups (Years) Food Stuffs Boys Girls Boys Girls Boys Girls Mean SD Mean SD Mean SD Mean SD Mean SD Mean SD Millets Cereals Pulses GLV Other vegetables Roots and Tubers Nuts & Oil seeds Condiments& spices Fruits Fish Othe flesh Foods Milk & Milk Products Fats Sugar & Jaggery NNMB 70 Individual Dietary Pattern
90 Table 4 FOOD INTAKES (g/day) BY AGE GROUPS Age Groups Food Stuffs Adult males Females (NPNL) Pregnant Woman Lactating Mothers Mean SD Mean SD Mean SD Mean SD Millets Cereals Pulses GLV Other vegetables Roots and Tubers Nuts & Oil seeds Condiments & spices Fruits Fish Other flesh Foods Milk & Milk Products Fats Sugar & Jaggery NPNL : Non Pregnant & Non Lactating FOOD INTAKES OF INDIVIDUALS Intake of most of the food was below the RDI in all ages, except adults. Protective foods like GLV, fruits, fats and oils and milk and milk products were inadequate in almost all ages. Half of the individuals among different age groups the intake of pulses was grossly less than 30% of RDI. Pregnant and lactating women did not consume any additional quantities of foods over and above the NPNL Nutrient Intakes The energy consumption among adults was comparable to RDI. Interestingly, in the case of females there was no difference between the intakes of non-pregnant & non-lactating (NPNL) females and pregnant women despite the increased requirements due to pregnancy. (Tables- 5 to 7). Though, in general, the median nutrient intakes in all the age groups were below the RDI, these were particularly poor in the case of micronutrients like iron and vitamin A. It may be pointed out that food iron values have been revised and, as per these the median iron intakes were 50% of RDI, contrary to the earlier apparently normal intakes. In this report, iron intakes according to the old as well as revised values are presented. NNMB 71 Individual Dietary Pattern
91 Table 5 AVERAGE DAILY INTAKE OF NUTRIENTS BY AGE GROUP Age Groups (Years ) Nutrients Mean Median SD Mean Median SD Mean Median SD Protein (g) Tot Fat (g) Energy (Kcal) Calcium Iron - Old Iron - New Vit A (µg) Thiamin Ribo Niacin Vit C Folic acid (µg) Distribution of intakes as % RDI Foods The distribution of individuals of different age and sex groups according to intakes of different foods expressed as percent RDI is presented in Tables 8 & 9 and proportion of Households consuming various foods below 70% of RDI are shown in Figs. 1 & 2. In general, about 30-40% of the individuals in different age groups consumed more than or equal to RDI of cereals. The proportion of individuals consuming more than RDI was higher among adult males and females, and also among those involved in moderate physical activity. The children however, appeared to be worse off, as about 10% had poor intakes (<50% of RDI) of cereals and millets. With respect to pulses, while the adults of both the sexes had adequate intakes, only 10-18% of children had intakes comparable to or more than RDI. The consumption of pulses was so poor that about 40-50% of individuals in different groups consumed less than 30% of RDI of pulses. The consumption of GLV was woefully inadequate. The proportion of individuals of different age groups having adequate GLV intake varied from 5% in 1-3 years age group to 14% in adult males. The intakes among females were 4-5% of RDI. About 83-90% of individuals consumed less than 30% of RDI of GLV. NNMB 72 Individual Dietary Pattern

92 Fig. 1 PERCENT DISTRIBUTION OF INDIVIDUALS WITH CEREALS & PULSES INTAKES BELOW 70% OF RDI BY AGE GROUP & SEX NNMB 73 Individual Dietary Intake
93 Fig. 2 PERCENT DISTRIBUTION OF INDIVIDUALS WITH GLV AND MILK & MILK PRODUCTS INTAKES BELOW 70% OF RDI BY AGE GROUP & SEX NNMB 74 Individual Dietary Intake
94 Table 6 AVERAGE DAILY INTAKE OF NUTRIENTS BY AGE GROUPS AND SEX
95 Table 8 PERCENT FREQUENCY DISTRIBUTION OF INDIVIDUALS ACCORDING TO FOOD INTAKE (AS % OF RDI) BY AGE GROUPS & SEX NNMB 76 Individual Dietary Pattern
96 Table 9 PERCENT FREQUENCY DISTRIBUTION OF INDIVIDUALS ACCORDING TO FOOD INTAKE (AS % OF RDI) BY AGE GROUPS & SEX NNMB 77 Individual Dietary Pattern
97 Consumption of other vegetable was also much less than the RDI in almost half of the population surveyed. Milk consumption was unsatisfactory in almost 70% of the individuals, particularly in young children. Over 75% of preschool children consumed less than 30% of RDI of milk. The pregnant and lactating women did not consume any additional quantities of milk over and above those of NPNL. Only 15% of individuals had fat intakes comparable to RDI. About 50% of preschool children had low intakes of sugar (<30% of RDI). The consumption of flesh foods though was low in all the ages, in general, in the State of Kerala the intake of fish and meat was better than that in all the other States Nutrient Intakes The distribution of individuals according to percent of RDI for different nutrients is presented in Tables-10 & 11 and proportion of Households consuming various Nutrients below 70% of RDA are shown in Figs. 3 to 5. Only 12-24% of individuals between 1-6 years and years had adequate energy intakes. In the other ages 13 to 55% of individual were consuming more than or equal to RDI of energy. Protein adequacy was also observed in about a half of the individuals. Only a very small proportion (11%) of the population was consuming adequate amount of vitamin A. The intakes were so poor that about 50-70% had intakes less than 30% of RDI. Iron consumption was inadequate in more than 90% of the individuals in almost all the ages. Calcium intake was also very low in most of the age groups, especially in the children of 1-3 years, pregnant and lactating women. The mean intake of foods and nutrients for (moving average) are given in Tables 12 & 13. The consumption of all the foods was less than RDI in all the age groups. The nutrient intakes were, in general less than RDI. NNMB 78 Individual Dietary Pattern
98 Figure - 3 PERCENT DISTRIBUTION OF INDIVIDUALS WITH INTAKES OF ENERGY BELOW 70% OF RDA BY AGE GROUPS AND SEX NNMB 79 Individual Dietary Intake
99 Figure - 4 PERCENT DISTRIBUTION OF INDIVIDUALS WITH INTAKES OF PROTEIN BELOW 70% OF RDA BY AGE GROUPS AND SEX NNMB 80 Individual Dietary Intake

100 Figure - 5 PERCENT DISTRIBUTION OF INDIVIDUALS WITH INTAKE OF VITAMIN 'A' BELOW 70% OF RDI BY AGE GROUPS AND SEX Age and Sex physiological groups NNMB 81
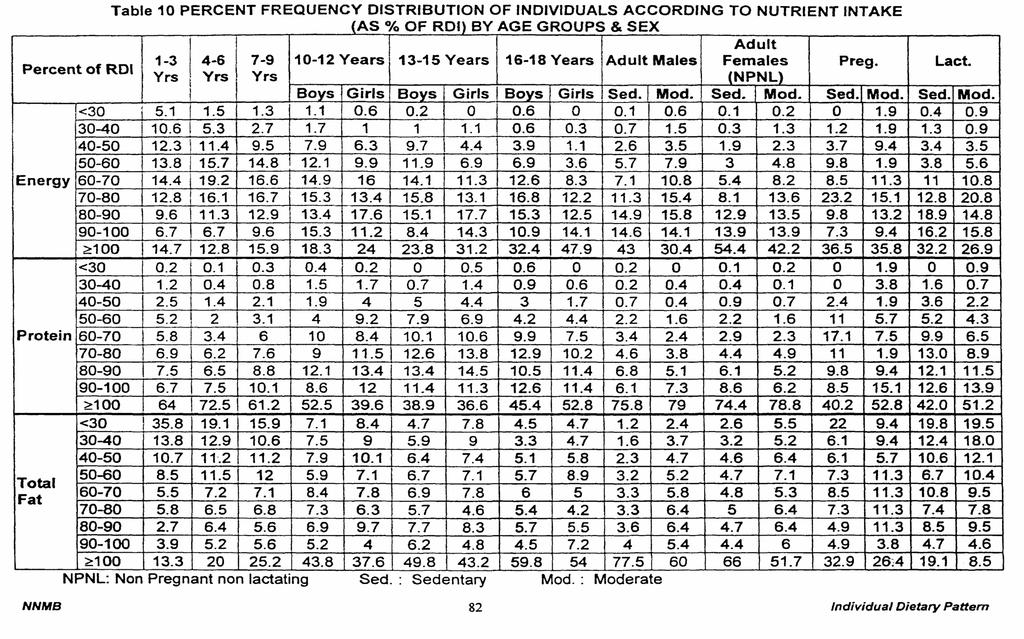
101
102 Table 11 PERCENT FREQUENCY DISTRIBUTION OF INDIVIDUALS ACCORDING TO NUTRIENT INTAKE (AS % OF RD1) BY AGE GROUPS AND SEX NNMB 83 Individual Dietary Pattern
103 Table 12 MEAN INTAKE OF FOODSTUFFS* (per day) FOR Table 13 MEAN DAILY INTAKE OF NUTRIENTS* BY AGE GROUPS AND SEX NNMB 84 Individual Dietary Pattern
104 4.TIME TRENDS 4.1 Food Consumption The changes in mean intakes between and are presented in Tables 14 to16. There was an increase in the consumption of mean cereal intakes in all the age groups, except in 1-3 years of age. The increase ranged from about 12 g (7%) in 4-6 year old children to about 104g (25%) in pregnant women. The median intake of millets did not show any change (zero), indicating that about a half of them did not consume millets at all at both points of time. The changes in pulse consumption were negligible. Like the millets intakes, the median intakes of GLV at both time points was poor with at least 50% of them not consuming GLV at all at both points of time. There was an increasing trend in the consumption of the mean intakes of milk and milk products, though the magnitude of increase was small (<20 g). It was interesting that the milk consumption showed an increasing trend in all age groups except 1-3 years and pregnant women, though these were much below the RDI. Table-14 TIME TRENDS IN MEAN FOOD INTAKES (g/day) NNMB 85 Individual Dietary Pattern
105 NNMB Table 15 TIME TRENDS IN MEAN FOOD INTAKES (g/day) 86 Individual Dietary Pattern

106 'Table 16 TIME TRENDS IN MEAN INTAKE OF FOODS BY AGE GROUPS & SEX 4.2 Nutrient Consumption As already indicated, the coefficient of variation of nutrient intakes was high and ranged from about 40% in energy to about 70% in total fat. Hence, to assess the time trends, the median intakes obtained in among different groups were compared with those of Interestingly, the results are different from those reported earlier based on the mean intakes of one day weighment family diet survey, which had indicated no change in dietary consumption. In general, there was an increasing trend with respect to protein (1 g in 4-7 years to 8.9 g in lactating women) and energy (36 Kcal in 1-3 years to 446 Kcal in lactating women). Similar changes were noticed in fat (1.4 g in 1-3 years to 7.4 g in NPNL) and vitamin A (5 µg in 1-3 years to 64 µg in years old girls). The results are presented in Tables 17 to 19 and Figs. 6 to 9. Median test revealed that there is significant improvement in the intakes of vitamin A and fat in all age groups except 1-3 year children and pregnant women. Energy intake was improved in all age groups except 1-3 year children (Table 20). NNMB 87 Individual Dietary Pattern
 DIETARY ENERGY")
107 kcats Fig. 6 TIME TRENDS IN (Median) DIETARY ENERGY INTAKE NNMB 88 Individual Dietary Intake
 PROTEIN INTAKE")
108 gms Fig. 7 TIME TRENDS IN (Median) PROTEIN INTAKE NNMB 89 Individual Dietary Intake
 TOTAL FAT INTAKE")
109 gms Fig. 8 TIME TRENDS IN (Median) TOTAL FAT INTAKE NNMB 90 Individual Dietary Intake
 VITAMIN A INTAKE")
110 (ug) Fig. 9 TIME TRENDS IN (Median) VITAMIN A INTAKE NNMB 91 Individual Dietary Intake
111 Table 17 TIME TRENDS IN AVERAGE DAILY INTAKE OF NUTRIENTS (Median) BY AGE GROUPS AND SEX NNMB 92 Individual Dietary Pattern
112


113 TABLE 20 STATISTICAL COMPARISION OF INTAKE OF NUTRIENTS # BETWEEN PERIODS ( , ) AMONG DIFFERENT AGE GROUPS/SEX # MEDIANS HAVE BEEN COMPARED USING NON-PARAMETRIC MEDIAN TEST NPNL: Non Pregnant Non Lactating : Increase : Decrease NS : Not Significant ** : p < COMMENTS The report presents intakes of individuals of different ages and physiological status. The variation in food and nutrient intakes was very high, making comparison of mean intakes different. In general, the food and nutrient intakes were much below the RDI. Specifically, the intake of protective foods like pulses, GLV, flesh foods and milk & milk products was unsatisfactory. In fact, the variation in the intakes was large, indicating that the percent of individuals consuming these foods was small. Similarly, the consumption of micronutrients were poor. For example, only about 10% of the individuals were consuming adequate amounts of vitamin A, iron or riboflavin. The results indicated that, by and large, the improvements in the median intakes are at variance with those reported earlier based on family diet survey. While improvement in individual intake is in tune with improvement in nutritional status, there is a need to examine the reasons for the differences between household diet survey and 24 hour recall diet survey. NNMB 94 Individual Dietary Pattern
NNMB Technical Report No:18 NATIONAL NUTRITION MONITORING BUREAU
 NNMB Technical Report No:18 NATIONAL NUTRITION MONITORING BUREAU NATIONAL INSTITUTE OF NUTRITION Indian Council of Medical Research HYDERABAD - 500 007, INDIA 1999 NNMB Technical Report No.18 NATIONAL
NATIONAL NUTRITION MONITORING BUREAU IN INDIA AN OVERVIEW G.N.V. Brahmam, Deputy Director, National Institute of Nutrition, Hyderabad.
 NATIONAL NUTRITION MONITORING BUREAU IN INDIA AN OVERVIEW G.N.V. Brahmam, Deputy Director, National Institute of Nutrition, Hyderabad. Respected Chairpersons and dear friends, I wish you all very good
Diet and Nutritional Status of Rural Preschool Children in the State of Orissa
 Kamla-Raj 2006 J. Hum. Ecol., 19(3): 205-214 (2006) Diet and Nutritional Status of Rural Preschool Children in the State of Orissa Ch. Gal Reddy, N. Arlappa, R. Hari Kumar, Sharad Kumar, G.N.V. Brahmam,
Nutritional Profile of Urban Preschool Children of Punjab
 KamlaRaj 2003 Anthropologist, 5 (3): 149153 (2003) Nutritional Profile of Urban Preschool Children of Punjab Inderjit Singh and Kiran Grover Growth retardation and malnutrition are the major public health
Diet and Nutritional Status of Tribal Population in ITDA Project Areas of Khammam District, Andhra Pradesh
 Kamla-Raj 2007 J. Hum. Ecol., 21(2): 79-86 (2007) Diet and Nutritional Status of Tribal Population in ITDA Project Areas of Khammam District, Andhra Pradesh A. Laxmaiah, K. Mallikharjuna Rao, R. Hari Kumar,
doi: /s
 Public Health Nutrition: 19(5), 767 776 doi:10.1017/s1368980015002268 Trends in nutritional status and nutrient intakes and correlates of overweight/obesity among rural adult women ( 18 60 years) in India:
NUTRITIONAL STATUS OF RURAL POPULATION REPORT OF NNMB SURVEYS ( )
") NUTRITIONAL STATUS OF RURAL POPULATION REPORT OF NNMB SURVEYS (1991-1992) NATIONAL NUTRITION MONITORING BUREAU NATIONAL INSTITUTE OF NUTRITION Indian Council of Medical Research Hyderabad-500 007 1993
NUTRITIONAL STATUS OF RURAL POPULATION REPORT OF NNMB SURVEYS (1991-1992) NATIONAL NUTRITION MONITORING BUREAU NATIONAL INSTITUTE OF NUTRITION Indian Council of Medical Research Hyderabad-500 007 1993
NATIONAL NUTRITION MONITORING BUREAU. Report. for the year 1975
 NATIONAL NUTRITION MONITORING BUREAU Report for the year 1975 NATIONAL INSTITUTE OF NUTRITION Indian Council of Medical Research Hyderabad-500007. 1976 The aims and objectives of the National Nutrition
Nutritional Profile of School Going Children (10-12 years) Belonging to Trans Yamuna Area of Allahabad, India
 Belonging to Trans Yamuna Area of Allahabad, India") International Journal of Current Microbiology and Applied Sciences ISSN: 2319-7706 Special Issue-7 pp. 4728-4736 Journal homepage: http://www.ijcmas.com Original Research Article Nutritional Profile of
International Journal of Current Microbiology and Applied Sciences ISSN: 2319-7706 Special Issue-7 pp. 4728-4736 Journal homepage: http://www.ijcmas.com Original Research Article Nutritional Profile of
Health and nutritional profile of adolescent girls from underprivileged communities residing in Kasturba Gandhi Balika Vidyalaya in Rajasthan
 Asian J. Dairy & Food Res, 37(3) 2018: 237-241 Print ISSN:0971-4456 / Online ISSN:0976-0563 AGRICULTURAL RESEARCH COMMUNICATION CENTRE www.arccjournals.com Health and nutritional profile of adolescent
NATIONAL NUTRITION MONITORING BUREAU
 25 YEARS OF NATIONAL NUTRITION MONITORING BUREAU Kamala Krishnaswamy K. Vijayaraghavan J. Gowrinath Sastry D. Hanumantha Rao G.N.V. Brahmam G. Radhaiah K. Kashinath M. Vishnuvardhan Rao NATIONAL INSTITUTE
NATIONAL N U T R I T I O N MONITORING BUREAU. Report for the year 1976
 1 7 NATIONAL N U T R I T I O N MONITORING BUREAU Report for the year 1976 NATIONAL INSTITUTE OF NUTRITION Indian Council of Medical Research Hyderabad 500 007. 1977 ..2.. CONTENTS page No. Table -15 Nutrient
Volume 5, Issue 1, January 2016, e-issn:
 Volume 5, Issue 1, January 2016, www.ijfans.com e-issn: 2320-7876 e-issn 2320-7876 www.ijfans.com Vol. 5, No. 1, January 2016 All Rights Reserved Research Paper Open Access NUTRITIONAL STATUS OF MIGRANT
Children are our future citizens. They form an
 Asian Journal of Home Science (June, 28) Vol. 3 (1) : 28-33 DIETARY INTAKE AND NUTRITIONAL STATUS OF SCHOOL CHILDREN OF KUMAON HILLS KAVITA BISHT AND RITA S. RAGHUVANSHI See end of the article for authors
NNMB Technical Report No: 24 NATIONAL NUTRITION MONITORING BUREAU
 NNMB Technical Report No: 24 NATIONAL NUTRITION MONITORING BUREAU NATIONAL INSTITUTE OF NUTRITION Indian Council of Medical Research Hyderabad 500 007 2006 NATIONAL NUTRITION MONITORING BUREAU Director
Abstract. Nutritional status and Health implication of ongoing Nutrition Transition in India
 Abstract Nutritional status and Health implication of ongoing Nutrition Transition in India Vandana Bhattacharya Research Officer Department of social science, National Institute of Health and Family Welfare,
Anthropometric profile and nutrient intake of urban women
 (6) 11/15 FOOD SCIENCE RESEARCHPAPER RESEARCH JOURNAL e ISSN-2230-9403 Visit us : www.researchjournal.co.in Volume 6 Issue 2 October, 2015 232-237 DOI : 10.140/HAS/FSRJ/6.2/232-237 Anthropometric profile
Dietary Adequacy of Indian Rural Preschool Children Influencing Factors
 Dietary Adequacy of Indian Rural Preschool Children Influencing Factors by A. Jyothi Lakshmi, Begum Khyrunnisa, G. Saraswathi, and Prakash Jamuna Department of Studies in Food Science and Nutrition, University
7.10. NUTRITIONAL STATUS OF TRIBAL POPULATION
 7.1. NUTRITIONAL STATUS OF TRIBAL POPULATION The tribal populations are is recognised as socially and economically vulnerable. Their lifestyles and food habits are different from that of their rural neighbours.
3. FOOD CONSUMPTION PATTERNS IN INDIA
 3. FOOD CONSUMPTION PATTERNS IN INDIA Introduction India is a vast and varied subcontinent, with 2.4% of its global landmass supporting over one-sixth of the world s population. At the time of independence
DIETARY INTAKE OF PRESCHOOL CHILDREN OF DHARWAD TALUK, KARNATAKA
 DIETARY INTAKE OF PRESCHOOL CHILDREN OF DHARWAD TALUK, KARNATAKA 1 Akkavva Wadakappanavar, S. & 2 Pushpa Bharati Department of Food Science and Nutrition, College of Rural Home Science, University of Agricultural
Diet and Nutritional Situation of the Population in the Severely Drought Affected Areas of Gujarat
 Kamla-Raj 2005 J. Hum. Ecol., 18(4): 319-326 (2005) Diet and Nutritional Situation of the Population in the Severely Drought Affected Areas of Gujarat R. Hari Kumar, K. Venkaiah, N. Arlappa, Sharad Kumar,
6.10. NUTRITIONAL STATUS OF TRIBAL POPULATION
 6.1. NUTRITIONAL STATUS OF TRIBAL POPULATION The tribal populations are is recognised as socially and economically vulnerable. Their lifestyles and food habits are different from that of their rural neighbours.
Nutrient Intake of Lactating Mothers from Rural and Urban Areas. Asha Kawatra and Salil Sehgal
 Kawatra, Asha; Sehgal, Salil : Nutrient Intake of Lactating Mothers from Rural and Urban Areas. Indian Journal of Social Research. 39(2) April-June 1998. P 91-99. ---------------------------------------------------------------------------------------------------------------------
Report on Urban Population
 National Nutrition Monitoring Bureau Report on Urban Population National Institute of Nutrition Indian Council of Medical Research Hyderabad - 500 007 1984 National Nutrition Monitoring Bureau Report
Effect of Socio Economic Factors on Food and Nutrient Consumption of Rural Women
 IOSR Journal Of Humanities And Social Science (IOSR-JHSS) Volume 23, Issue 12, Ver. 4 (December. 2018) 65-79 e-issn: 2279-0837, p-issn: 2279-0845. www.iosrjournals.org Effect of Socio Economic Factors
Nutritional status of preschool children in Anganwadi centers of ICDS projects in united Andhra Pradesh with AP food and local food models
 2017; 6(11): 487-493 ISSN (E): 2277-7695 ISSN (P): 2349-8242 NAAS Rating 2017: 5.03 TPI 2017; 6(11): 487-493 2017 TPI www.thepharmajournal.com Received: 09-09-2017 Accepted: 10-10-2017 Dr. K Uma Maheswari
National Institute of Nutrition, Hyderabad 2. Indira Gandhi Institute of Developmental Research, Mumbai
 Can locally available foods fulfill the requirements of the major essential nutrients of a typical household in Rohtas, Bihar? A Cost of Diet Assessment Ankita Mondal 1, Bharati Kulkarni 1, A. Laxmaiah
NUTRITION MONITORING AND SURVIELLANCE
 NUTRITION MONITORING AND SURVIELLANCE Rationale for nutrition monitoring and surveillance India is a vast and varied country. There are huge differences in per capita income, purchasing power, availability
ASSESSMENT OF BODY MASS INDEX AND NUTRITIONAL MEASUREMENTS OF ADOLESCENT GIRLS
 ASSESSMENT OF BODY MASS INDEX AND NUTRITIONAL MEASUREMENTS OF ADOLESCENT GIRLS ANJNA NEMA DEPARTMENT OF HOME SCIENCE, GOVT. AUTO GIRLS P.G. COLLEGE OF EXCELLENCE SAGAR (M.P.), INDIA. ABSTRACT Girls are
K Venkaiah and T.Longvah NATIONAL INSTITUTE OF NUTRITION HYDERABAD TS, INDIA
 K Venkaiah and T.Longvah NATIONAL INSTITUTE OF NUTRITION HYDERABAD 5 7 TS, INDIA 12 th International Food Data Conference, October 11 13, 17, Buenos Aires Principle use worldwide is in the estimation of
DOI: /HAS/AJHS/11.1/
 AJHS Asian Journal of Home Science Volume 11 Issue 1 June, 2016 142-150 DOI: 10.15740/HAS/AJHS/11.1/142-150 e ISSN-0976-8351 Visit us: www.researchjournal.co.in Research Paper Body mass index, waist hip
A PATH ANALYSIS ON THE NOURISHMENT DIRECTED HAEMOGLOBIN STATUS AND RESULTING ENDURANCE CAPACITY OF ADOLESCENT INDIAN RURAL GIRLS
 J. Dairying, Foods & H.S., 29 (1) : 47-51, 21 AGRICULTURAL RESEARCH COMMUNICATION CENTRE www.arccjournals.com / indianjournals.com A PATH ANALYSIS ON THE NOURISHMENT DIRECTED HAEMOGLOBIN STATUS AND RESULTING
NUTRITION MONITORING AND SURVEILLANCE
 NUTRITION MONITORING AND SURVEILLANCE K. Ramachandran Former Professor and Head, Deptt. of Biostatistics, AIIMS, New Delhi Adequate nutrition is a major prerequisite for the good health of a population
International Journal of Science, Environment and Technology, Vol. 6, No 1, 2017,
 International Journal of Science, Environment and Technology, Vol. 6, No 1, 2017, 276 283 ISSN 2278-3687 (O) 2277-663X (P) FRUIT & NUTRIENT INTAKE IN RELATION TO ANEMIA PREVALENCE IN ADOLESCENTS Swiny
Nutrition and Health Status of School Girls in Bangalore City
 International Journal of Scientific and Research Publications, Volume 3, Issue 12, December 2013 1 Nutrition and Health Status of School Girls in Bangalore City Jamuna K.V., * Rathna H. ** * University
NATIONAL NUTRITION MONITORING BUREAU
 NATIONAL NUTRITION MONITORING BUREAU REPORT FOR THE YEAR 1979 NATIONAL INSTITUTE OF NUTRITON Indian Council of Medical Research Hyderabad-500 007. 1980 NATIONAL NUTRITION MONITORING BUREAU REPORT FOR
CURRENT NUTRITIONAL STATUS OF THE RURAL COMMUNITIES AND WAY FORWARD Dr. G.N.V. Brahmam
 Abstract CURRENT NUTRITIONAL STATUS OF THE RURAL COMMUNITIES AND WAY FORWARD Dr. G.N.V. Brahmam India, in the past few decades has witnessed phenomenal progress in terms of agricultural production and
Food Consumption Pattern and Dietary Adequacy Among Bhils of Udaipur (Rajasthan)
") Food Consumption Pattern and Dietary Adequacy Among Bhils of Udaipur (Rajasthan) Shweta Joshi 1, Vishakha Singh 2 1 Research Scholar, Department of Foods & Nutrition, College of Home Science, GB Pant University
Food Consumption Pattern and Dietary Adequacy Among Bhils of Udaipur (Rajasthan) Shweta Joshi 1, Vishakha Singh 2 1 Research Scholar, Department of Foods & Nutrition, College of Home Science, GB Pant University
DETERMINANTS OF DIETARY ADEQUACY OF NUTRIENTS CONSUMPTION AMONG RURAL SCHOOL AGE CHILDREN
 DETERMINANTS OF DIETARY ADEQUACY OF NUTRIENTS CONSUMPTION AMONG RURAL SCHOOL AGE CHILDREN SAMEENA SULTAN * Department of Home Science, Faculty of Agricultural Sciences, Aligarh Muslim University, Aligarh,
IDSP-NCD Risk Factor Survey
 Sumary: Non-Communicable Disease Risk Factor Survey, 2007-08, Phase-I states of India IDSP-NCD Risk Factor Survey Fact Sheet - India Phase - I States State AP MP MH MZ KE TN UTK Population Household surveyed
An Economic Analysis of Changes in the Per Capita Nutrient Intake and Nutritional Inadequacy in Tamil Nadu, India
 International Journal of Current Microbiology and Applied Sciences ISSN: 2319-7706 Volume 6 Number 3 (2017) pp. 2265-2275 Journal homepage: http://www.ijcmas.com Original Research Article http://doi.org/10.20546/ijcmas.2017.603.259
INTERNATIONAL JOURNAL OF PEDIATRIC NURSING CORRELATION BETWEEN NUTRITIONAL STATUS AND MEMORY AMONG SCHOOL CHILDREN
 26 INTERNATIONAL JOURNAL OF PEDIATRIC NURSING e - ISSN XXXX-XXXX Print ISSN - XXXX-XXXX Journal homepage: www.mcmed.us/journal/ijpn CORRELATION BETWEEN NUTRITIONAL STATUS AND MEMORY AMONG SCHOOL CHILDREN
NUTRITIONAL STATUS OF PRE-SCHOOL CHILDREN
 Chapter 5 Abstract NUTRITIONAL STATUS OF PRE-SCHOOL CHILDREN K. Dhanapa(. J.Lakshmi*, Vijaya Khader*. R. Salhi adha s"~, H.Moharnad Kasim... R.Narayanakumar**. N.S.Sudhakara*** and Femeena Hassan** In
Gender Inequality in Terms of Health and Nutrition in India: Evidence from National Family Health Survey-3
 Pacific Business Review International Volume 5 Issue 12 (June 2013) Gender Inequality in Terms of Health and Nutrition in India: Evidence from National Family Health Survey-3 A K Tiwari * Gender inequality
Food consumption pattern and nutrient intake of elderly
 FOOD SCIENCE RESEARCHPAPER RESEARCH JOURNAL e ISSN-2230-9403 Visit us : www.researchjournal.co.in Volume 6 Issue 2 October, 2015 215-219 DOI : 10.15740/HAS/FSRJ/6.2/215-219 Food consumption pattern and
CHARACTERISTICS OF SURVEY RESPONDENTS 3
 CHARACTERISTICS OF SURVEY RESPONDENTS 3 The health, nutrition, and demographic behaviours of women and men vary by their own characteristics, such as age, marital status, religion, and caste, as well as
INDIAN JOURNAL OF MATERNAL AND CHILD HEALTH
 Volume 13 (1), 2011 Prevalance of Clinical Vitamin A Deficiency (VAD) amongst Preschool going Children in Rural Areas of Kancheepuram District ( Tamil Nadu) Jha Ranjit K S Gopalakrishnan K Mohanraj K Ajitha
NATIONAL NUTRITION MONITORING BUREAU. Report for the year 1978
 TECH. REPORT - 5-A REFERENCE COPY NOT FOR ISSUE NATIONAL NUTRITION MONITORING BUREAU Report for the year 1978 NATIONAL INSTITUTE OF NUTRITION Indian Council of Medical Research Hyderabad - 500 007. 1979
Myanmar Food and Nutrition Security Profiles
 Key Indicators Myanmar Food and Nutrition Security Profiles Myanmar has experienced growth in Dietary Energy Supply (DES). Dietary quality remains poor, low on protein and vitamins and with high carbohydrates.
PREVALENCE OF MICRONUTRIENT DEFICIENCIES
 NNMB Technical Report No. 22 NATIONAL NUTRITION MONITORING BUREAU PREVALENCE OF MICRONUTRIENT DEFICIENCIES NATIONAL INSTITUTE OF NUTRITION Indian Council of Medical Research HYDERABAD 500 007 2003 NATIONAL
Prospective study on nutrition transition in China
 Prospective study on nutrition transition in China Fengying Zhai, Huijun Wang, Shufa Du, Yuna He, Zhihong Wang, Keyou Ge, and Barry M Popkin The aim of the prospective study reported here was to examine
DIET INTERVENTION FOR REDUCING MALNUTRITION AMONG PRESCHOOL CHILDREN
 Indo-Am. J. Agric. & Vet. Sci., 2014 Maharshi ISSN Deepa 2321 9602 and Suratani www.iajavs.com Sreedhar, 2014 Vol. 2, No. 3, September 2014 2014 Meghana Publications. All Rights Reserved Research Paper
P. Nasurudeen, Anil Kuruvila, R. Sendhil and V. Chandresekar*
 Ind. Jn. of Agri. Econ. Vol.61, No.3, July-Sept. 2006 SUBJECT II TRENDS IN FOOD CONSUMPTION AND NUTRITION - FOOD SECURITY CONCERNS The Dynamics and Inequality of Nutrient Consumption in India P. Nasurudeen,
Nutritional status and. fisherwomen in the coastal ecosystem of Andhra Pradesh, Karnataka, Kerala and Tamil Nadu, india
 Nutritional status and socioeconomic empowerment of fisherwomen in the coastal ecosystem of Andhra Pradesh, Karnataka, Kerala and Tamil Nadu, india V. Khader Acharya N.G. Ranga Agricultural University
Myanmar - Food and Nutrition Security Profiles
 Key Indicators Myanmar - Food and Nutrition Security Profiles Myanmar has experienced growth in Dietary Energy Supply (DES). Dietary quality remains poor, low on protein and vitamins and with high carbohydrates.
Macro-nutrient intake of reproductive age group women: findings of a community based study from rural Varanasi
 International Journal of Community Medicine and Public Health Khanam Z et al. Int J Community Med Public Health. 2016 Feb;3(2):566-575 http://www.ijcmph.com pissn 2394-6032 eissn 2394-6040 Research Article
Impact of Nutrition Counselling on Food and Nutrient Intake and Haematological Profile of Rural Pregnant Women
 Kamla-Raj 2004 J. Hum. Ecol., 15(1): 51-55 (2004) Impact of Nutrition Counselling on Food and Nutrient Intake and Haematological Profile of Rural Pregnant Women Paramjit Kaur Chawla, Ravnit Kaur and R.
Breakfast Eating Habit and its Influence on Attention-concentration, Immediate Memory and School Achievement
 RESEARCH PAPER Breakfast Eating Habit and its Influence on Attention-concentration, Immediate Memory and School Achievement NS GAJRE, S FERNANDEZ, N BALAKRISHNA AND S VAZIR From the National Institute
Int.J.Curr.Res.Aca.Rev.2016; 4(6): Impact of Mid Day Meal on Nutritional Status of School Going Children with Special Emphasis on Zinc
: Impact of Mid Day Meal on Nutritional Status of School Going Children with Special Emphasis on Zinc") Impact of Mid Day Meal on Nutritional Status of School Going Children with Special Emphasis on Zinc Iram Khan* and Sangeeta Pandey Department of Nutrition and Dietetics, Mount Carmel College, No.58, Palace
Impact of Mid Day Meal on Nutritional Status of School Going Children with Special Emphasis on Zinc Iram Khan* and Sangeeta Pandey Department of Nutrition and Dietetics, Mount Carmel College, No.58, Palace
Food Habits and Nutrient Intake of Urban School Children (13-15 years)
") Available online at www.ijpab.com DOI: http://dx.doi.org/10.18782/2320-7051.5673 ISSN: 2320 7051 Int. J. Pure App. Biosci. 5 (5): 1565-1573 (2017) Research Article Food Habits and Nutrient Intake of Urban
Available online at www.ijpab.com DOI: http://dx.doi.org/10.18782/2320-7051.5673 ISSN: 2320 7051 Int. J. Pure App. Biosci. 5 (5): 1565-1573 (2017) Research Article Food Habits and Nutrient Intake of Urban
World Journal of Science and Research
 Available online at http://www.harmanpublications.com World Journal of Science and Research Harman Publications. All rights reserved ISSN: 2455 2208 Research Article ANTHROPOMETRICAL PROFILE AND KNOWLEDGE
Undernutrition & risk of infections in preschool children
 Indian J Med Res 130, November 2009, pp 579-583 Undernutrition & risk of infections in preschool children Prema Ramachandran & Hema S. Gopalan Nutrition Foundation of India, New Delhi, India Received April
7.2 VITAMIN A DEFICIENCY
 7.2 VITAMIN A DEFICIENCY Vitamin A is an important micronutrient for maintaining normal growth, regulating cellular proliferation and differentiation, controlling development, and maintaining visual and
Volume 7, Issue 1, January 2018, e-issn:
 Volume 7, Issue 1, January 2018, www.ijfans.com e-issn: 2320-7876 e-issn 2320-7876 www.ijfans.com Vol. 7, No. 1, January 2018 All Rights Reserved Research Paper Open Access ASSESSMENT OF NUTRITIONAL ANTHROPOMETRY
Solomon Islands Food and Nutrition Security Profiles
 Key Indicators Solomon Islands Food and Nutrition Security Profiles Solomon Islands has experienced stagnation in percapita GDP and undernourishment in recent years. Dietary Energy Supply (DES) has continued
Nat.J.Res.Com.Med.,1(2), 2012.
, 2012.") EDITORIAL ARTICLE ISSN - Print: 2277 1522, Online: 2277-3517 Nutritional Assessment of Children in the 3 5 Years of Age Group in Karaikal District, Pudhucherry. Roseline F. William 1, Joel Bijou 2, Mohamad
EDITORIAL ARTICLE ISSN - Print: 2277 1522, Online: 2277-3517 Nutritional Assessment of Children in the 3 5 Years of Age Group in Karaikal District, Pudhucherry. Roseline F. William 1, Joel Bijou 2, Mohamad
PREVALENCE OF IRON DEFICIENCY ANEMIA AMONG ADOLESCENT GIRLS AND ITS RISK FACTORS IN TANGAIL REGION OF BANGLADESH
 PREVALENCE OF IRON DEFICIENCY ANEMIA AMONG ADOLESCENT GIRLS AND ITS RISK FACTORS IN TANGAIL REGION OF BANGLADESH Md. Shamim Miah 1, M. Nannur Rahman 2, UK Prodhan 2, MR Linkon 2, Madumita 4, Md. Sidur
Nutritional status of selected obese school going children in Western Maharashtra
 FOOD SCIENCE RESEARCH PAPER RESEARCH JOURNAL e ISSN-2230-9403 Visit us : www.researchjournal.co.in Volume 7 Issue 2 October, 2016 226-233 DOI : 10.15740/HAS/FSRJ/7.2/226-233 Nutritional status of selected
Title: Nutritional Support for Children Living with HIV
 Title: Nutritional Support for Children Living with HIV Author: PADMAVATHY.K 1, 2, ANITA SHET 1, 2 CHITR DINAKAR 1, 2 KARTHIKA KUMAR 1 PREETHY. H 2, SAJAL CLARENCE SINGH 2 1. St. Johns Research Institute,
Content. The double burden of disease in México
 Can we and Prevent Malnutrition while Addressing the Challenge of NRCD s? Experiences from Mexico Content The double burden of disease in México What is currently being done in México for preventing and
Diet quality and nutritional status of rural adolescent girl beneficiaries of ICDS in north India
 Asia Pac J Clin Nutr 2007;16 (Suppl 1):8-16 8 Original Article Diet quality and nutritional status of rural adolescent girl beneficiaries of ICDS in north India Anita Malhotra PhD 1 and Santosh Jain Passi
Dietary Intake and Nutritional Anthropometry of the Workers of INDAL, Hirakud
 Kamla-Raj 2009 Anthropologist, 11(2): 99-107 (2009) Dietary Intake and Nutritional Anthropometry of the Workers of INDAL, Hirakud Braja Kishori Mishra and Swapna Mohanty Department of Home Sciences, Sambalpur
Chapter 2 Changing Calorie Consumption and Dietary Patterns
 Chapter 2 Changing Calorie Consumption and Dietary Patterns While access to adequate food and appropriate caring practices underlie the formulation of nutrition policy in India, an emerging and different
HUMAN DEVELOPMENT INDEX: STATUS IN TELANGANA
 Chapter6 HUMAN DEVELOPMENT INDEX: STATUS IN TELANGANA People are the real wealth of nations, and human development focuses on enlarging people s choices Human Development Report, 2015, UNDP. Human development
Dietary Assessment of Adolescent Girls and Dissemination of Nutrition Education
 Dietary Assessment of Adolescent Girls and Dissemination of Nutrition Education Sakshi Sharma 1 and Nikita Arya 1 1 Department of Dietetics, Institute of Hotel Management Catering and Nutrition, Pusa,
Nutritional Status and Its Reflection on Having Nutrition Deficiency and Others Diseases in Respondents of Sonbhadra District
 IOSR Journal Of Humanities And Social Science (IOSR-JHSS) Volume 20, Issue 12, Ver. III (Dec. 2015) PP 60-66 e-issn: 2279-0837, p-issn: 2279-0845. www.iosrjournals.org Nutritional Status and Its Reflection
ASSESSMENT OF DIETARY HABITS AMONG DIFFERENT INCOME GROUPS
 ASSESSMENT OF DIETARY HABITS AMONG DIFFERENT INCOME GROUPS *Priya. P and Rari John. K Department of Home Science, College of Agriculture, Vellayani, Thiruvanthapuram, 695001 *Author for Correspondence
CHAPTER TWO: TRENDS IN FAMILY PLANNING USE AND PUBLIC SECTOR OUTLAY IN INDIA
 CHAPTER TWO: TREDS I FAMILY PLAIG USE AD PUBLIC SECTOR OUTLAY I IDIA 2.1 Introduction: This chapter examines the trends in use of family planning methods, changes in use of family planning methods over
7.11. MICRONUTRIENT DEFICIENCIES
 Introduction 7.11. MICRONUTRIENT DEFICIENCIES Goitre due to iodine deficiency, blindness due to Vitamin A deficiency, dry and wet beriberi and pellagra were the major public health problems in preindependent
A study on nutritional status of lactating mothers attending the immunization clinic of a Medical College Hospital of Kolkata, West Bengal
 IOSR Journal of Dental and Medical Sciences (IOSR-JDMS) e-issn: 2279-0853, p-issn: 2279-0861.Volume 16, Issue 7 Ver. IX (July. 2017), PP 30-34 www.iosrjournals.org A study on nutritional status of lactating
Panacea Journal of Health Sciences ISSN :
 EFFECT OF MANNA HEALTH MIX SUPPLEMENTATION ON ANTHROPOMETRIC PARAMETERS AND HEMATOLOGICAL PROFILE OF ANEMIC ADOLESCENT GIRLS Suganya N. * and Dr. D. Estherlydia** *M.Sc Student, ** Assistant Professor,
Brunei Darussalam - Food and Nutrition Security Profiles
 Key Indicators Brunei Darussalam Food and Nutrition Security Profiles Brunei Darussalam has one of the highest rates of GDP per capita and of Dietary Energy Supply (DES) per person in the region. For decades,
Laos - Food and Nutrition Security Profiles
 Key Indicators Laos - Food and Nutrition Security Profiles In Lao PDR, GDP per capita has increased consistently during recent years, as has Dietary Energy Supply (DES) per person. Nevertheless, undernutrition
Assessment of Nutritional Adequacy of Perimenopausal and Menopausal Working Women of Allahabad
 Assessment of Nutritional Adequacy of Perimenopausal and Menopausal Working Women of Allahabad Singh Pallavi *, Paul Virginia** & Prajapati Aditi *** * Research Scholar, Sam Higginbottom Institute of Agriculture,
Food and Nutrient Intakes of Patients with Colorectal Cancer in Calicut District of Kerala
 IOSR Journal of Nursing and Health Science (IOSR-JNHS) e-issn: 2320 1959.p- ISSN: 2320 1940 Volume 3, Issue 1 Ver. III (Jan. 2014), PP 43-47 Food and Nutrient Intakes of Patients with Colorectal Cancer
Prevalance of Lifestyle Associated Risk Factor for Non- Communicable Diseases among Young Male Population in Urban Slum Area At Mayapuri, New Delhi
 IOSR Journal of Dental and Medical Sciences (IOSR-JDMS) e-issn: 2279-0853, p-issn: 2279-0861.Volume 17, Issue 7 Ver. 17 (July. 2018), PP 59-64 www.iosrjournals.org Prevalance of Lifestyle Associated Risk
Brunei Darussalam - Food and Nutrition Security Profiles
 Key Indicators Brunei Darussalam Food and Nutrition Security Profiles Brunei Darussalam has one of the highest rates of GDP per capita and of Dietary Energy Supply (DES) per person in the region. For decades,
CHAPTER 5 FAMILY PLANNING
 CHAPTER 5 FAMILY PLANNING The National Family Welfare Programme in India has traditionally sought to promote responsible and planned parenthood through voluntary and free choice of family planning methods
HealthandNutritionalStatusofaPrimitiveTribeofMadhyaPradeshBhumia
 Global Journal of HUMAN SOCIAL SCIENCE History Archaeology & Anthropology Volume 13 Issue 1 Version 1.0 Year 2013 Type : Double Blind Peer Reviewed International Research Journal Publisher: Global Journals
Effect of dietary intake on serum calcium levels and bone mineral density of menopausal women of Ludhiana city, India
 Journal of Applied and Natural Science 10 (4): 1281-1285 (2018) ISSN : 0974-9411 (Print), 2231-5209 (Online) journals.ansfoundation.org Effect of dietary intake on serum calcium levels and bone mineral
Impact of nutrition counselling on the nutritional status of the gestational diabetics
 Journal of Ecofriendly Agriculture 10(2): 191195 : 2015 Impact of nutrition counselling on the nutritional status of the gestational diabetics Department of Food and Nutrition, College of Home Science,
Cook Islands Food and Nutrition Security Profiles
 Key Indicators Cook Islands Food and Nutrition Security Profiles Mortality in children has shown a constant reduction over the years, but unless further acceleration, Cook Islands will not achieve the
Nutritional Deprivation of children in Rural Kerala An Inter Caste Analysis
 2011 International Conference on Social Science and Humanity IPEDR vol.5 (2011) (2011) IACSIT Press, Singapore Nutritional Deprivation of children in Rural Kerala An Inter Caste Analysis Dr.K.Gangadharan
Evaluation of Nutritional Status of Rural Bengalee Primary School Boys (6-9 Years) in Comparison to Indian Children
 in Comparison to Indian Children") International Journal of Child Health and Nutrition, 2013, 2, 131-142 131 Evaluation of Nutritional Status of Rural Bengalee Primary School Boys (6-9 Years) in Comparison to Indian Children Subrata Dutta
International Journal of Child Health and Nutrition, 2013, 2, 131-142 131 Evaluation of Nutritional Status of Rural Bengalee Primary School Boys (6-9 Years) in Comparison to Indian Children Subrata Dutta
DIETARY ASSESSMENT OF PREGNANT SICKLERS. Kalpana Jadhav* & Saroj Zanjhal**
 DIETARY ASSESSMENT OF PREGNANT SICKLERS Kalpana Jadhav* & Saroj Zanjhal** *Professor & Head, Dept of Home Science, Rashtrasant Tukadoji Maharaj Nagpur University, Nagpur **Associate Professor & Head, Dept
Biofortified pearl millet cultivars to fight iron and zinc deficiencies in India
 Biofortified pearl millet cultivars to fight iron and zinc deficiencies in India Inadequate intake of energy-providing organic macronutrients (largely carbohydrate, followed by protein and fat, in that
Nutritional Status of Anganwadi Children under the Integrated Child Development Services Scheme in a Rural Area in Goa
 Original Article DOI: 10.17354/ijss/015/480 Nutritional Status of Anganwadi Children under the Integrated Child Development Services Scheme in a Rural Area in Goa Vanita G Pinto Silva 1, Savita G Pinto
NUTRITIONAL STATUS OF SCHOOL CHILDREN IN RURAL SCENARIO
 56 Journal of Economic & Social Development, Vol. - XI, No. 2, December 2015 ISSN 0973-886X NUTRITIONAL STATUS OF SCHOOL CHILDREN IN RURAL SCENARIO Barnali Maity* This study investigates the nutritional
Diet and Physical Activity of Pregnant Women Working In Coffee Plantation, Coorg, South India.
 Research and Reviews: Journal of Medical and Health Sciences Diet and Physical Activity of Pregnant Women Working In Coffee Plantation, Coorg, South India. Naveen R 1*, Swaroop N 2, Shweta Murali 2, Christine