The brain renin-angiotensin system in metabolic and cardiovascular regulation
|
|
|
- Kathryn Martin
- 6 years ago
- Views:
Transcription

 thesis, University of Iowa, 2016. http://ir.uiowa.edu/etd/2196. Follow this and additional works at: http://ir.uiowa.edu/etd Part of the Pharmacology Commons")
1 University of Iowa Iowa Research Online Theses and Dissertations Fall 2016 The brain renin-angiotensin system in metabolic and cardiovascular regulation Kristin Elizabeth Claflin University of Iowa Copyright 2016 Kristin Elizabeth Claflin This dissertation is available at Iowa Research Online: Recommended Citation Claflin, Kristin Elizabeth. "The brain renin-angiotensin system in metabolic and cardiovascular regulation." PhD (Doctor of Philosophy) thesis, University of Iowa, Follow this and additional works at: Part of the Pharmacology Commons
2 THE BRAIN RENIN-ANGIOTENSIN SYSTEM IN METABOLIC AND CARDIOVASCULAR REGULATION by Kristin Elizabeth Claflin A thesis submitted in partial fulfillment of the requirements for the Doctor of Philosophy degree in Pharmacology in the Graduate College of The University of Iowa December 2016 Thesis Supervisor: Assistant Professor Justin L. Grobe
3 Copyright by KRISTIN ELIZABETH CLAFLIN 2016 All Rights Reserved
4 Graduate College The University of Iowa Iowa City, Iowa CERTIFICATE OF APPROVAL This is to certify that the Ph.D. thesis of PH.D. THESIS Kristin Elizabeth Claflin has been approved by the Examining Committee for the thesis requirement for the Doctor of Philosophy degree in Pharmacology at the December 2016 graduation. Thesis Committee: Justin L. Grobe, Thesis Supervisor Allyn L. Mark Kamal Rahmouni Robert D. Roghair Curt D. Sigmund
5 To my husband Terry, my parents Dan and Donna, and my brother Matt, for their unconditional love and support ii
6 If you believe in yourself and have the courage, the determination, the dedication, the competitive drive, and if you are willing to sacrifice the little things in life and pay the price for the things that are worthwhile, it can be done. Vince Lombardi iii
7 ACKNOWLEDGEMENTS I would first like to thank my thesis advisor and mentor, Dr. Justin L. Grobe, for his advice and support over the past four years. There were many times during my thesis work when I could have given up, but your passion and persistence encouraged me to continue. I would not have been able to accomplish this without you and the knowledge I have gained while in the lab is invaluable for my future as a scientist. In addition, I would like to thank my thesis committee members: Drs. Allyn L. Mark, Robert D. Roghair, Kamal Rahmouni and Curt D. Sigmund, for their time and guidance. I would also like to thank the Department of Pharmacology for their support in both my research and academic endeavors. I would not have been able to accomplish this without all of the past and present members of the Grobe lab. Thank you for your daily support in the lab and for making sure that I had fun along the way. Special thanks to Nicole Littlejohn for your support and friendship, in and out of the lab. I would also like to thank the past and present members of the Sigmund lab for teaching me valuable techniques and for always being willing to help. Finally, I would like to thank my husband Terry, my parents Dan and Donna, my brother Matt, my aunt Denise, and my dog Rufus for their unconditional love and support. I would not be where I am or who I am without all of you. Thank you for your constant encouragement, laughter and love. iv
8 ABSTRACT Leptin acts within the brain to increase resting metabolic rate (RMR) and blood pressure (BP). The renin-angiotensin system (RAS) elicits similar effects in the brain, as reviewed in chapter 1, and it has previously been shown that central angiotensin II type 1 (AT 1 ) receptors are required for leptin-mediated inductions in sympathetic nerve activity to the brown adipose tissue. Thus, we hypothesize that the brain RAS mediates the metabolic effects of leptin. To investigate the LepR-KO interaction between the RAS and leptin, we generated the AT 1A mouse which lacks the AT 1A receptor in leptin-sensitive cells. In chapter 2, we demonstrated that stimulation of RMR by DOCA-salt and high fat diet requires AT 1A receptors in leptin receptor-expressing cells and that these cells expressing both AT 1A and the leptin receptor appear to be agouti related-peptide (AgRP) neurons. In chapter 3, we investigated the role of AT 1A specifically in AgRP neurons by utilizing AT AgRP-KO LepR-KO AgRP-KO 1A mice. Similar to AT 1A mice, AT 1A mice exhibited deficits in BAT SNA responses to leptin and induction of RMR by alpha melanocyte stimulating hormone. In chapter 4, we utilized a novel transgenic mouse model to demonstrate that microglia do not express the AT 1A receptor under chow or high fat diet fed conditions. Taken together, we conclude that a subset of AgRP neurons, which express both the leptin receptor and the AT 1A receptor, are critical for the control of sympathetic nerve activity and ultimately RMR. v
9 PUBLIC ABSTRACT Obesity is a major health and economic burden in the United States and worldwide, and it represents a major risk factor for cardiovascular disease, diabetes and cancer. Current treatment options for obesity include diet and exercise, bariatric surgery and several drugs that reduce food intake. Although all of these weight loss methods have proven successful with initial use, the chronic, long-term management of obesity remains an issue. Alternative ways to treat obesity are therefore critical as the prevalence of obesity continues to rise. Another possible method to treat obesity is to increase the amount of energy produced by the body at rest. Angiotensin and leptin are two hormones that can act in the brain to increase this resting metabolism and thus promote weight loss. Through the use of genetically altered mice, we show that the action of angiotensin at AT 1A receptors on neurons in the brain is required for leptin to induce resting metabolism and therefore counteract weight gain. Our studies highlight the potential beneficial metabolic effects of activating angiotensin signaling in select regions of the brain. A more complete understanding of the interaction between leptin and angiotensin in the brain could lead to the identification of new drug targets for the treatment of obesity. vi
10 TABLE OF CONTENTS LIST OF TABLES...ix LIST OF FIGURES... x CHAPTER I: INTRODUCTION... 1 The Renin-Angiotensin System (RAS)... 3 The Brain RAS... 5 Leptin A RAS-Leptin Interaction CHAPTER II: ANGIOTENSIN II TYPE 1A (AT 1A ) RECEPTORS ON LEPTIN- EXPRESSING CELLS CONTROL RESTING METABOLISM Abstract Introduction Methods Results Discussion CHAPTER III: CONTROL OF ENERGY BALANCE BY ANGIOTENSIN II TYPE 1A (AT 1A ) RECEPTORS ON AgRP-EXPRESSING CELLS Abstract Methods Results Discussion CHAPTER IV: EXPRESSION OF ANGIOTENSIN II TYPE 1A (AT 1A ) RECEPTORS ON MICROGLIA IN NZ44 MICE Abstract Introduction Methods Results Discussion DISCUSSION AND CONCLUSIONS Summary of Results Implications and Conclusions Discussion vii
11 REFERENCES viii
12 LIST OF TABLES Table 1 Table 2 Tissue masses in AT 1A LepR-KO mice and control littermates on chow and after five weeks of HFD treatment Tissue masses in AT 1A AgRP-KO mice and control littermates on chow and after ten weeks of HFD treatment Table 3 Mean % BAT SNA (RVI) values to ICV MTII (2 μg) over 4 hours in AT 1A AgRP-KO mice and littermate controls ix
13 LIST OF FIGURES Figure 1.1 The Renin Angiotensin System (RAS) Figure 1.2 The brain RAS integrates various inputs to control energy homeostasis Figure 1.3 Leptin receptor signaling Figure 2.1 ICV ANG stimulates RMR via AT 1A receptors Figure 2.2 AT 1A and leptin receptors colocalize within cells in the ARC Figure 2.3 LepR-Cre construct is expressed in the ARC Figure 2.4 LepR-KO Intact leptin signaling in the ARC of AT 1A mice Figure 2.5 Figure 2.6 AT 1A LepR-KO mice exhibit increased body and fat mass after HFD Lack of induction of RMR in response to HFD in AT 1A LepR-KO mice Figure 2.7 Glucose tolerance in AT 1A LepR-KO mice Figure 2.8 Sympathetic nerve responses in AT 1A LepR-KO mice Figure 2.9 Alterations in inguinal WAT in AT 1A LepR-KO mice Figure 2.10 RMR, but not cardiovascular, responses to DOCA-salt are attenuated in AT 1A LepR-KO mice Figure 2.11 Unidirectional interaction between LepR and AT 1A in RMR control Figure 2.12 Hyperactivity of the brain RAS does not increase sensitivity to leptin Figure 2.13 Aberrant signaling downstream of AgRP neurons Figure 2.14 AT 1A receptors localize to AgRP neurons Figure 2.15 AT 1A receptors localize to AgRP neurons after HFD treatment x
14 Figure 2.16 Potential mediators of AT 1A signaling and leptin-at 1A crosstalk within the ARC Figure 2.17 Working model of the interaction between angiotensin signaling at AT 1A receptors and LepR signaling in the control of resting metabolic rate Figure 3.1 Figure 3.2 Male AT 1A AgRP-KO mice exhibit increased body and fat mass after HFD Female AT 1A AgRP-KO mice exhibit decreased body and fat mass after HFD Figure 3.3 Energy balance in AT 1A AgRP-KO mice Figure 3.4 BAT sympathetic nerve responses in male and female AT 1A AgRP-KO mice Figure 3.5 RMR control in AT 1A AgRP-KO mice Figure 3.6 Figure 4.1 Figure 4.2 Figure 4.3 Figure 5 Potential mediators of AT 1A signaling within the ARC of AT 1A AgRP-KO mice AT 1A receptors do not localize to microglia under baseline conditions NZ44 mice exhibit weight gain and increased ARC RAS expression after HFD treatment AT 1A receptors do not localize to microglia after HFD treatment Working hypothesis of the interaction between leptin and the RAS in leptin-sensitive AgRP neurons xi
15 CHAPTER I: INTRODUCTION Obesity is a major health and economic burden worldwide, with current estimates suggesting that 1.9 billion adults over the age of 18 are overweight or obese [1]. In the United States, two in three adults are overweight and one in three adults are obese with a body mass index of 30 kg/mg or greater. Excess weight gain is associated with several co-morbidities including hypertension, type II diabetes, heart disease, stroke and cancer. Obesity can account for 80-90% of the risk for type II diabetes, while the Framingham Heart Study suggests that 78% of primary hypertension in men and 65% in women can be attributed to excess fat accumulation [2]. Taken together, these data highlight the critical need to effectively treat obesity as it would concurrently improve both metabolic and cardiovascular health. Current therapies for obesity include bariatric surgery, lifestyle modifications, including caloric restriction and exercise, and a short list of FDAapproved pharmacological agents. While bariatric surgery has been the most successful for reversal of obesity, it is a highly invasive procedure associated with a higher mortality rate than other treatment options. Further, strict criteria limit the number of patients eligible for the surgery [3]. Treatment of obesity through diet and exercise is initially successful but is not a reliable long-term solution to weight loss as patients slowly regain weight after the first year of intervention [4]. Pharmacological agents utilized to reverse weight gain include 1
16 Lorcaserin, Phentermine/Topiramate, Bupropion/Naltrexone, Liraglutide and Orlistat. Interestingly, all of these drugs work by inhibiting energy intake, either by limiting the amount of calories consumed or absorbed by the body. Consistent with diet and exercise, pharmacological inhibition of energy intake is not effective for long-term management of obesity. Currently, there are no safe therapeutic compounds for obesity that target energy output; however, one of the most potent anti-obesity drugs ever used was a mitochondrial hydrogen ionophore that significantly elevated resting metabolic rate (RMR) to promote weight loss. In 1935, it was demonstrated that administration of 2,4-dinitrophenol (DNP) resulted in significant increases in RMR leading to weight loss of up to three pounds per week in human patients [5]. Despite its dramatic anti-obesity effect, DNP is banned for human use due to a very small therapeutic dosing window and individual variations in DNP dose response, which can lead to side effects like tachycardia, hyperthermia and cataracts. Therefore, while DNP is not a viable pharmacological option for targeting energy ouput, it is a critical proof of concept that increasing RMR is a potent means of treating obesity. There remains a critical need to elucidate the physiological mechanisms associated with RMR so that novel and more effective pharmacological therapies for obesity can be developed. The focus of my dissertation is to elucidate the central control of RMR by the renin-angiotensin system (RAS) and leptin. In chapter 1, a comprehensive review of the roles of both the RAS and leptin in metabolic and cardiovascular control will be presented. In chapter 2, the interaction between angiotensin AT 1A 2
17 receptors and leptin will be investigated through the use of a novel knockout mouse model which lacks the AT 1A receptor in leptin-sensitive cells. In chapter 3, I will utilize a novel knockout animal to determine the role of AT 1A receptors in AgRP neurons in the control of energy balance. Chapter 4 will investigate the expression of AT 1A receptors on microglia under various metabolic conditions. Finally, chapter 5 will provide a general discussion of the conclusions and implications from my work and examine the future directions to further our understanding of the interaction between the RAS and leptin in the control of resting metabolism. The Renin-Angiotensin System (RAS) The RAS is a complex hormone system that regulates blood pressure and fluid balance. In the classic RAS pathway, renin cleaves angiotensinogen to produce angiotensin (ANG) I, which is further processed by angiotensin converting enzyme (ACE) to form the major effector peptide, ANG II. ANG II elicits its effects by binding to several receptors, including the ANG II type I (AT 1 ) or ANG type II (AT 2 ) receptor. Critically, there are two isoforms of the AT 1 receptor in rodents, AT 1A and AT 1B. While these isoforms share 95% sequence homology, they differ in tissue distribution and thus function [6-8]. In the nonclassical RAS pathway, ANG I and ANG II can alternatively be processed by ACE2 to form ANG (1-7) [9]. Through its action at the Mas receptor, ANG (1-7) can counteract the action of ANG II at AT 1 receptors [10]. In addition, Ang II can be processed by aminopeptidases to produce ANG IV, which can interact with 3
18 the AT 4 receptor or insulin-regulated aminopeptidase (IRAP) [11] (Figure 1.1). While numerous studies have established a role for the circulating RAS in cardiovascular regulation, there is an emerging role for the RAS in the control of energy balance. The RAS and obesity Increased activity of the circulating RAS has been correlated with the development of obesity, as obese humans and animal models of obesity exhibit increased plasma angiotensinogen, renin and ACE levels [12-17]. Importantly, increases in circulating RAS activity normalize following weight loss, supporting the concept that body mass or composition likely contributes to circulating RAS activity [18]. Nonetheless, the relationship between circulating RAS activity and obesity is likely bi-directional. The RAS contributes to energy balance, as genetic [19-22] and pharmacological [23-27] inhibition of the RAS in rodent models generally results in a negative energy balance (lean animals and/or resistance to weight gain), and chronic elevations in renin activity can lead to obesity [28]. In addition to its role in the circulation, the RAS is also used by various tissues of the body, including the brain, adipose tissue, heart, kidneys, and vasculature, as a paracrine and autocrine signaling mechanism. Below, the role of the brain RAS will be explored in the control of both energy balance and cardiovascular regulation. 4
19 The Brain RAS In 1961, Bickerton and Buckley demonstrated that administration of angiotensin II to the cerebral circulation increased blood pressure in dogs [29]. Shortly thereafter, it was shown that central administration of angiotensin II within the hypothalamus led to a robust drinking response in rats [30]. Together, these studies established the novel concept that angiotensin II acts centrally to control blood pressure and fluid balance, and suggested that functional angiotensin receptors are expressed within the brain. While brain-specific expression of renin was initially controversial, Fischer-Ferraro et al. and Ganten et al. concomitantly reported renin-like enzymatic activity in the brain in 1971 [31-33]. Subsequent studies utilizing a transgenic mouse model expressing egfp under control of the mouse renin promoter revealed egfp-expressing cells in regions of the brain critical for metabolic and cardiovascular function including the rostral ventrolateral medulla (RVLM), subfornical organ (SFO), nucleus of the solitary tract (NTS), paraventricular nucleus (PVN), supraoptic nucleus (SON) and arcuate nucleus (ARC) [34]. In addition to renin, all other components of the RAS have been documented in the brain [35-39]. Taken together, these data support the existence of a functional tissue-specific brain RAS. The brain RAS in cardiovascular regulation A role for the brain RAS in blood pressure and fluid control has been wellestablished. While these actions are regulated largely by the AT 1 receptor in humans, the two isoforms of the AT 1 receptor in rodents, AT 1A and AT 1B, 5
20 differentially control central angiotensin II action. Despite global deletion of the AT 1B receptor, Agtr1b -/- mice respond to ICV angiotensin II with elevations in blood pressure similar to control mice; however, the angiotensin II-mediated drinking response is significantly diminished in Agtr1b -/- mice. In contrast, mice with global deletion of the AT 1A receptor (Agtr1a -/- ) exhibit minor increases in blood pressure and a significant drinking response following ICV administration of angiotensin. Taken together, these data suggest that the AT 1A receptor is critical for the blood pressure effects of the brain RAS, while AT 1B receptors are important for the dipsogenic effects of central angiotensin action in rodents [40]. Specific brain regions have been implicated in the fluid balance and blood pressure effects of the brain RAS, particularly circumventricular organs as these areas of the brain lack a blood brain barrier [41]. The role of the SFO in regulation of both blood pressure and fluid regulation has been well-established as administration of angiotensin II to the SFO increases mean arterial pressure and fluid intake [42, 43]. Activation of the RAS specifically in the SFO of transgenic mice is sufficient to increase water intake through an AT 1 -dependent mechanism [44]. Additionally, specific populations of neurons in the SFO have been implicated in regulating thirst through use of optogenetic techniques. Photoactivation of CamKII expressing neurons in the SFO elicits a robust drinking response that is specific to water intake while photoactivation of vesicular GABA transporter expressing neurons in the SFO suppressed water intake, even in thirsty animals [45]. Viral-mediated ablation of AT 1A receptors selectively in the SFO prevented hypertension induced by chronic delivery of 6
21 deoxycorticosterone, plus a high dietary sodium load (the DOCA-salt model), thus implicating angiotensin signaling in the SFO in hypertension [46]. Angiotensinergic neural projections from the SFO to the RVLM are also critical for hypertension as ablation of AT 1 receptors in the RVLM prevented hypertension in angiotensin-ii infused mice [47]. Consistent with this, increased activity of the RAS in the RVLM contributes to hypertension in spontaneously hypertensive rats and pharmacological inhibition of AT 1 receptors reduces oxidative stress specifically in the RVLM to prevent obesity hypertension [48-50]. To investigate the impact of RAS activation specifically in the brain, a double-transgenic mouse model of brain RAS hyperactivity was previously generated by the Sigmund group which involved expression of human renin via the neuron-specific synapsin promoter and human angiotensinogen via its endogenous promoter (the sra mouse model) [51, 52]. Consistent with previous research on RAS activation in the brain, sra mice exhibit chronic hypertension and polydipsia which is dependent on increased expression of arginine vasopressin in the SON and angiotensin II in the SFO, respectively [51, 53]. Critically, while sra mice exhibit elevation of the RAS in several regions of the brain, including in the ARC, there is a concurrent suppression of the circulating RAS suggesting that the brain and peripheral RAS may counteract one another to regulate blood pressure and fluid balance. 7
22 The brain RAS in energy balance In addition to its role in the regulation of blood pressure and fluid balance, there is an emerging role for the RAS in the regulation of energy balance. Pharmacological blockade or genetic deletion of any component of the RAS in rodent models results in significant changes in body weight, body composition, food intake, digestive efficiency, physical activity, and/or metabolic rate [19-27], while transgenic expression of renin in rats results in obesity [28]. It is surprising to find, then, that the beneficial metabolic effects of modulating the RAS are largely unimpressive in human subjects [54-59]. Simple RAS blockade is not an effective weight-loss tool for humans and we hypothesize that this is due primarily to functionally opposing, tissue-specific actions of the RAS. While the circulating, gastrointestinal and adipose versions of the RAS may promote weight gain through increasing digestive efficiency and suppressing resting metabolic rate, the brain RAS appears to generally promote negative energy balance by simultaneously reducing energy input and increasing energy output. The brain RAS and energy input Several independent groups have demonstrated that delivery of exogenous angiotensin suppresses food intake behavior. Cassis et al. demonstrated that chronic peripheral infusion of angiotensin II in rats reduced body mass, primarily through reduced food intake [60]. Yoshida et al. also demonstrated that peripheral infusion of angiotensin II in FVB mice suppressed food intake and appetite-regulating genes within the hypothalamus, and that ICV 8
23 infusion caused a similar reduction in food intake [61]. Further, de Kloet et al. found that chronic ICV administration of angiotensin II reduced food intake and elevated expression of anorexigenic corticotrophin- and thyroid-releasing hormones in the hypothalamus in Long-Evans rats [62]. Interestingly, the anorexigenic action of angiotensin II may be mediated by AT 2 receptors as pharmacological blockade or genetic ablation of the AT 2 receptor prevented angiotensin II-mediated suppression of food intake while this response was maintained in mice with pharmacological blockade or genetic ablation of the AT 1 receptor [63]. In addition, mice with global AT 2 receptor gene disruption exhibit reduced body weight and adipose gain during high fat feeding in part through reduced food intake [64]. Exciting new visualization methods from de Kloet et al. demonstrate localization of AT 2 gene expression specifically in GABAergic and cholinergic neurons within brain regions that are known to be involved in the control of ingestive behaviors (appetite / taste / taste preference / malaise) such as the NTS, median preoptic nucleus (MnPO) and area postrema (AP) [65]. The brain RAS and energy output Multiple models also illustrate effects of the brain RAS in the control of energy expenditure. Porter et al. have demonstrated that ICV infusion of angiotensin II causes increased energy expenditure in both young and old rats [66, 67]. Chronic delivery of DOCA-salt results in hypertension that depends upon increased activity of the brain RAS, as ICV infusion of the ACE inhibitor 9
24 captopril or the AT 1 antagonist losartan prevent and reverse DOCA-salt hypertension [68-70]. Similarly, ICV infusion of losartan attenuates the resting metabolic rate increase that occurs with DOCA-salt [71]. de Kloet et al. demonstrated that conditional disruption of the AT 1A receptor in cells expressing Sim1 (which primarily includes the paraventricular nucleus, amygdala, supraoptic nucleus, lateral hypothalamus and mammillary nucleus) results in sensitivity to high fat diet-induced weight gain through increased food intake and reduced energy expenditure [72]. Central administration of angiotensin II or DOCA-salt treatment both lead to decreased plasma renin activity [62, 71], and there is some evidence to support the concept that it is the interaction between the brain and circulating RAS that ultimately determine resting metabolic rate. The previously mentioned sra model of transgenic brain-specific RAS hyperactivity which exhibits reflexive suppression of the circulating RAS also displays a major increase in resting metabolic rate. Notably, the suppressed circulating RAS of sra mice is mechanistically involved in the increased resting metabolism of these animals, as chronic replacement of circulating angiotensin II normalizes their increased metabolic rate [52]. Interactions between the brain and circulating RAS An interaction between the local adipose RAS and circulating RAS may contribute to the increased peripheral RAS during obesity, and subsequent activation of the brain RAS. It has previously been shown that transgenic mice 10
25 overexpressing angiotensinogen specifically in adipocytes exhibit increased circulating angiotensinogen as compared to control littermates [12, 73]. Furthermore, obese mice have significant increases in adipose angiotensinogen expression providing a link between adipose tissue RAS and the elevated circulating RAS observed in obesity [73, 74]. Thus, these data support the concept that increased adiposity during obesity results in enhanced adipose expression of angiotensinogen, thus stimulating the circulating RAS which can signal to the brain to stimulate blood pressure, thereby providing a brake on peripheral RAS action and thus obesity (Figure 1.2). This proposed role for angiotensin is similar to that of leptin, an adipokine released in proportion to total fat that acts primarily in the hypothalamus to induce resting metabolic rate and inhibit food intake [75]. Below, the role of leptin in cardiovascular and metabolic function will be reviewed. Further, the concept of an interaction between leptin and angiotensin in the regulation of energy balance will be examined. Leptin In 1994, Jeffrey Friedman and colleagues discovered that the obese (ob) gene encoded for a circulating factor that controlled fat mass [76]. Shortly thereafter, it was demonstrated that peripheral or central administration of this OB protein, later renamed leptin, could significantly increase energy expenditure, and reduce food intake and fat and body mass [77-79]. Further, it was discovered that levels of circulating leptin were highly correlated with body mass index (BMI) 11
26 in both rodents and human patients supporting the concept that resistance to the physiologic effects of leptin could develop during states of excess fat accumulation [80, 81]. More than twenty years after its discovery, numerous studies have established central leptin action in the hypothalamus as a key mediator of cardiovascular control and energy balance, as discussed below. Leptin receptor signaling Initial studies utilizing mice homozygous for a mutation in the diabetes gene (db/db mice) suggested that the db gene may encode for the leptin receptor. Despite similar metabolic phenotypes as the ob/ob mouse, delivery of exogenous leptin did not reduce fat or body mass in db/db animals [77-79, 82]. Tartaglia et al. were first to identify the leptin receptor (LepR) and report its expression in the hypothalamus. Subsequently, six different isoforms of the leptin receptor have been identified: LepRa, LepRb, LepRc, LepRd, LepRe and LepRf [83]. While the function of some of these isoforms remains unclear, it has been suggested that LepRa plays a role in the transport of leptin across the blood brain barrier [84]. Further, it is well established that leptin action at LepRb is critical for activation of downstream signaling cascades and thus leptin s physiological function. LepRb s are expressed in many peripheral tissues including the liver, kidney, adipose tissue, and skeletal muscle; however, the primary site of leptin action at LepRb s is in the central nervous system, specifically in the hypothalamus, midbrain and hindbrain [85, 86]. Within the hypothalamus, there is 12
27 a well-defined role for leptin at proopiomelanocortin (POMC) and agouti-related peptide (AgRP) neurons in the arcuate nucleus (ARC) in both cardiovascular and metabolic control. Upon binding, leptin stimulates POMC neurons to release alpha melanocyte stimulating hormone (αmsh), which acts on melanocortin 3 and 4 receptors on downstream second-order neurons. In contrast, leptin inhibits AgRP neurons, thereby preventing the release of AgRP, NPY and GABA. Taken together, these actions inhibit food intake and promote SNA and ultimately RMR. Further, LepRb s in the ventromedial and dorsomedial hypothalamus also likely contribute to the control of energy balance by leptin. Binding of leptin to the LepRb promotes receptor homodimerization and activation of tyrosine kinase Janus kinase (JAK) which stimulates both autophosphorylation and the phosphorylation of several critical tyrosine residues on the LepRb (Figure 1.3). Phosphorylation of Tyr 985 recruits SH2-containing tyrosine phosphatase-2 (SHP-2) to facilitate activation of the extracellular signalregulated kinase (ERK) 1/2. Activation of ERK1/2 in the hypothalamus is critical for leptin-induced SNA to the BAT and thus thermogenesis [87]. Phosphorylation of Tyr 985 is also critical for inhibition of leptin signaling as it mediates the recruitment of suppressor of cytokine signaling-3 (SOCS3). Phosphorylation of Tyr 1077 and Tyr 1138 recruits signal transducer and activator of transcription (STAT) 5 and STAT3, respectively. Upon phosphorylation of STAT3, it can dimerize and translocate to the nucleus where it mediates the transcription of several genes, including POMC, AgRP and SOCS3. Mice with neuron-specific ablation of STAT3 exhibit hyperphagia and obesity supporting the critical role of STAT3 13
28 signaling in leptin action [88]. Leptin-mediated phosphorylation of JAK at the LepRb can facilitate the phosphorylation of insulin receptor substrate (IRS) and subsequent activation of phosphatidylinositol 3-OH kinase (PI3K) signaling. While impaired PI3K signaling in POMC neurons does not alter energy balance, female mice exhibiting overactivity of PI3K signaling in POMC neurons are more sensitive to diet-induced obesity [89, 90]. Although the role of PI3K signaling in the metabolic effects of leptin remain unclear, it has been shown that leptininduced PI3K signaling is critical for cardiovascular control by leptin, as discussed below. Leptin in cardiovascular regulation Numerous studies have demonstrated that acute administration of leptin increases SNA to the kidneys [91-93]. Chronic infusion of leptin elicits elevations in blood pressure, which are completely inhibited by administration of α and β adrenergic receptor blockers supporting a critical role for increased SNA in leptins blood pressure effects [94]. Further, elevations in blood pressure and renal SNA induced by high fat diet consumption are attenuated by ICV administration of a leptin receptor antagonist and mice deficient in leptin signaling are normotensive and/or hypotensive despite severe obesity [95, 96]. Taken together, these data support a role for leptin in the control of blood pressure and obesity-hypertension. Leptin receptor signaling through the PI3K signaling cascade has emerged as the major effector of leptin s cardiovascular effects. Treatment of 14
29 mice with LY or Wortmannin specifically attenuated leptin-mediated increases in renal SNA. Mice exhibiting ablated PI3K signaling are normotensive but exhibit attenuated renal SNA responses to leptin. In contrast, mice exhibiting enhanced PI3K signaling are hypertensive and exhibit significantly elevated renal SNA responses to leptin compared to control mice [97]. Genetic disruption of either STAT3 or ERK signaling does not attenuate leptin-induced renal SNA [87, 98], further supporting the specific role of PI3K signaling in the control of renal SNA by leptin. However, mice with deletion of STAT3 specifically in POMC neurons exhibit a complete attenuation of leptin-mediated increases in blood pressure suggesting that in the ARC, leptin may increase blood pressure through a mechanism independent of renal SNA [99]. While many brain regions are critical for cardiovascular control, it appears that the ARC is necessary for many of the cardiovascular effects of leptin. Microinjection of leptin specifically into the ARC increases both renal SNA and blood pressure and site specific deletion of ARC LepRb s attenuates leptinmediated elevations in renal SNA [93]. Moreover, ablation of LepRb s or downstream leptin signaling components specifically in POMC neurons abolishes leptin-mediated increases in blood pressure [99-101]. Interestingly, administration of leptin specifically to the NTS, the other region of the brain expressing POMC neurons, is sufficient to elevate both renal SNA and blood pressure [102]. The role of leptin in cardiovascular control in human patients remains controversial. Consistent with leptin deficient animals, early studies suggested 15
30 that humans with leptin deficiency also exhibit reduced SNA and blood pressure despite severe obesity [103]. However, recently it was demonstrated that administration of leptin to lipodystrophy patients, who exhibit an absence of subcutaneous adipose tissue and thus low levels of leptin, elicited no effect on blood pressure after six months of treatment and significantly decreased blood pressure after 12 months of treatment [104]. Leptin in energy balance In addition to elevating renal SNA, numerous studies have shown that leptin also increases SNA to the thermogenic brown adipose tissue (BAT) [92]. Sympathetic activation of BAT leads to an increase in activation and expression of uncoupling protein 1 (UCP1) which mediates heat production through the uncoupling of oxidative phosphorylation [ ]. This elevation in heat production increases RMR to promote weight loss. db/db mice exhibit significantly reduced RMR when heat production is adjusted for body weight (Figure 2.11). Further, rats receiving ICV leptin exhibit higher RMR and decreased adiposity when compared to pair-fed controls suggesting that leptin prevents the decrease in RMR associated with a reduction in caloric intake [108]. In healthy adult men, serum leptin levels are a strong determinant of RMR [ ]. In addition to increasing RMR, ICV leptin increases spontaneous physical activity prior to changes in food intake or body weight in rats [112]. Further, mice deficient in leptin signaling exhibit decreased physical activity which is 16
31 normalized upon re-expression of the leptin receptor specifically in the ARC [78, 113]. In addition to its effects on energy output, it is well established that leptin inhibits food intake to further promote negative energy balance [114, 115]. Leptin deficient ob/ob mice exhibit severe hyperphagia, which is normalized with the administration of exogenous leptin [79]. In contrast, a 48 hour fast significantly reduces circulating leptin levels [116]. Chronic peripheral administration of leptin reduces food intake to decrease fat and body mass [79]. Numerous publications support the central action of leptin as critical for its control of energy balance. While a low dose of peripherally administered leptin does not change BAT SNA, a significant increase is observed when leptin is given ICV [117]. Neuron-specific restoration of LepRb s is sufficient to normalize body weight, adiposity and food intake of db/db mice to that observed in lean controls and mice with conditional deletion of LepRb in the periphery exhibit normal body weight and composition [86]. Further, synapsin-specific deletion of LepRb s results in severe obesity similar to leptin deficient animals suggesting that LepRb s on neurons are necessary for leptins control of energy balance [85]. Both STAT3 and ERK 1/2 signaling have been implicated in the metabolic effects of leptin. Transgenic mice with specific ablation of leptin-stat3 signaling (s/s mice) exhibit significantly increased body weight and food intake, and decreased RMR and BAT UCP1 expression, all of which are indistinguishable from leptin-deficient animals [118]. Despite a significant attenuation of the metabolic effects of leptin, s/s mice exhibit no changes in leptin-induced renal 17
32 SNA [98]. ICV administration of ERK 1/2 inhibitors prevents the decrease in food intake and body weight by leptin and selectively inhibits BAT SNA to ICV leptin [87]. Similar to the cardiovascular effects of leptin, the ARC appears to be the brain region critical for leptin-mediated control of energy balance. Selective lesioning of the ARC completely attenuates leptin-induced BAT SNA [117]. In response to acute ICV leptin treatment, phosphorylation of STAT3 and ERK 1/2 is significantly elevated in the mediobasal hypothalamus [87]. In addition, ablation of STAT3 from AgRP neurons results in modest obesity, while overexpression of constitutively activated STAT3 elevates RMR to protect against DIO [119, 120]. Initial hypotheses proposed that human obesity was the result of a leptindeficient state such as that observed in the ob/ob mouse; however, it was subsequently demonstrated that most obese humans exhibit high circulating leptin levels [81]. Thus, inadequate leptin production does not underlie most obesity and may instead be the result of leptin resistance. Numerous publications now suggest that a state of selective leptin resistance (SLR) develops in the presence of excess leptin. As discussed below, this SLR limits the use of leptin as a treatment for obesity. Selective leptin resistance (SLR) Despite resistance to the anorexic effects of leptin, agouti yellow obese mice respond to peripheral and central leptin treatment with elevations in renal 18
33 SNA that were analogous to increases observed in control littermates [121, 122]. DIO mice also exhibited a significant attenuation in leptin-induced changes in food intake, weight loss, and induction of BAT SNA while leptin-induced elevation in RSNA and BP were maintained [123]. Taken together, these results support the concept that SLR, in which the beneficial metabolic effects of leptin are lost, while the detrimental cardiovascular effects of leptin are maintained, develops during obesity. The divergent signaling pathways activated by leptin may provide insight into the mechanism of SLR. As detailed above, leptin signaling in POMC neurons and the PI3K pathway throughout the brain appears to be critical for the cardiovascular effects of leptin, while STAT3 and ERK are critically involved in the metabolic responses to leptin. Preservation of leptin-induced renal SNA in obese mice is attenuated by ICV administration of a PI3K inhibitor [124]. Thus, it is plausible that deficits in activation of STAT3 and/or ERK signaling during obesity may be responsible for SLR. In fact, as early as six days after high fat diet consumption, there is a reduction in pstat3 levels specifically in the ARC [125]. These data also support the concept that SLR may be brain site-specific, in which leptin s action in the ARC is attenuated leading to metabolic dysfunction, while leptin action elsewhere is intact, resulting in the maintenance of leptins ability to increase renal SNA and blood pressure. Intriguingly, previous data supports the concept that angiotensin signaling through the AT 1 receptor may be critical for action of leptin, and potentially the development of SLR. 19
34 A RAS-Leptin Interaction The concept of an interaction between leptin and the brain RAS is supported by many previously published anatomical and functional studies. Both leptin and angiotensin receptors are expressed in the hypothalamus of mice and humans and pharmacological or genetic inhibition of the RAS results in decreased circulating leptin [21, 23-25, 27, ]. In addition, ICV administration of leptin leads to elevated AT 1A receptor expression in the ARC and leptin-deficient ob/ob mice exhibit decreased ACE expression [126, 129]. Moreover, administration of leptin to ob/ob mice enhances plasma angiotensinogen expression and leptin-activated second messenger pathways, such as phosphorylated STAT3, have been shown to promote the transcription of angiotensinogen [126, ]. Taken together, the functional and anatomical overlap of leptin and the brain RAS suggests that these systems likely interact with one another to elicit their physiological effects. Consistent with this, global deletion of AT 1A receptors in mice attenuates sympathetic nerve responses to leptin in both the BAT and kidney. ICV administration of losartan, an AT 1 antagonist, or captopril, an ACE inhibitor, also attenuates sympathetic nerve responses to leptin for both BAT and the kidneys, suggesting that the brain RAS mediates the thermogenic and cardiovascular effects of leptin [129]. Further, Young et al. recently demonstrated that AT 1A receptors specifically in the SFO are required for leptin-mediated activation of sympathetic nerve activity to BAT despite demonstrating previously that deletion of the long form of the leptin receptor in the SFO does not alter leptin-mediated activation of the BAT [134, 20
35 135]. Taken together, these data are consistent with the concept that deletion of angiotensin signaling in the SFO disrupts leptin signaling in other brain regions, such as the hypothalamus. Additional studies that investigate the relationship between leptin and AT 1A receptors in the control of resting metabolism, food intake, and overall energy balance will be presented in chapters II and III. 21

36 Figure The Renin-Angiotensin System (RAS). In the classic RAS pathway, angiotensinogen is cleaved by renin to produce angiotensin I and angiotensin I is processed by ACE to produce angiotensin II. Angiotensin II can then bind to the AT 1 or AT 2 receptor. In the nonclassical pathway, Angiotensin I and Angiotensin II can be further processed to produce Angiotenin-(1-7) which binds to the Mas receptor. Angiotensin II can also be further processed to ultimately produce Angiotensin IV which binds to the AT 4 receptor or IRAP. Abbreviations: ACE, angiotensin converting enzyme; NEP, neprilysin; APN, aminopeptidase N; IRAP, insulin-regulated aminopeptidase. 22
37 Figure The brain RAS integrates various inputs to control energy homeostasis. The brain RAS is mechanistically involved in the control of energy intake (ingestive behavior) and output (resting metabolic rate) in response to various stimuli including steroids, leptin, circulating angiotensin, and high fat diets. These effects are mediated through the complex and divergent control of nutrient preferences and appetites, autonomic output, and neurohormonal release. There also appear to be differences in the involvement of brain AT 1 versus AT 2 receptor subtypes in energy intake versus output endpoints. The complexity of the interplay between the brain RAS versus circulating RAS likely explains the failure of simple pharmacological RAS inhibition to cause weight loss in humans. 23

38 Figure Leptin receptor signaling. Leptin binds to the long signaling form of the leptin receptor (LebRb) leading to activation of JAK2, a tyrosine kinase. JAK2 induces the phosphorylation of Y 985, Y 1077 and Y 1138 to activate ERK, STAT5 and STAT3 signaling, respectively. Phosphorylation of STAT3 induces its dimerization and translocation into the nucleus where it can alter the gene expression of many genes, including POMC. Activation of JAK2 can also stimulate PI3K signaling. Abbreviations: JAK, janus kinase; IRS, insulin receptor substrate; PI3K, phosphatidylinositol 3-OH kinase; SHP-2, SH2-containing tyrosine phosphatase-2; ERK, extracellular signal-regulated kinase; STAT, signal transducer and activator of transcription; POMC, proopiomelanocortin. 24
39 CHAPTER II: ANGIOTENSIN II TYPE 1A (AT 1A ) RECEPTORS ON LEPTIN-EXPRESSING CELLS CONTROL RESTING METABOLISM Abstract Leptin contributes to the control of resting metabolic rate (RMR) and blood pressure (BP). The renin-angiotensin system (RAS) and angiotensin AT 1 receptors within the brain are also involved in the control of these processes. Here, we demonstrate the selective requirement of the AT 1A receptor for RMR control by leptin. Mice lacking the AT 1A receptor specifically from leptin receptor (LepR)-expressing cells (AT LepR-KO 1A ) failed to increase RMR with high fat diet and DOCA-salt treatments, but BP control remained intact. Cellular coexpression of AT 1A and LepR is almost exclusive to the arcuate nucleus (ARC), primarily within agouti-related peptide (AgRP) expressing neurons. We conclude that angiotensin activates divergent mechanisms to control BP and RMR, and that the brain RAS acting at leptin-sensitive AgRP cells of the ARC functions as a major integrator for RMR control. Introduction The renin-angiotensin system (RAS) is well-established for its role in blood pressure (BP) and fluid balance control. In addition to the circulating RAS, the local brain RAS has been implicated in cardiovascular control, and all components of the RAS signaling cascade have been documented in the brain. 25
40 While both angiotensin II (ANG) type 1 (AT 1 ) and ANG type 2 (AT 2 ) receptors are expressed in the brain, it is believed that the majority of the central effects of ANG on cardiovascular function are mediated through the AT 1 receptor in humans and its AT 1A homologue in rodents [136, 137]. There is strong expression of AT 1A receptors in brain cardiovascular control regions such as the subfornical organ (SFO) and paraventricular nucleus (PVN) [ ]. Interestingly, AT 1 receptor is robustly expressed in the arcuate nucleus (ARC) [141, 142], a site well-known for metabolic control but less appreciated for cardiovascular control, and it has been shown that ANG strongly binds in the ARC of the human brain [127, 143]. While microinjection of ANG into the ARC increases mean arterial pressure, it remains unclear whether ANG signaling in the ARC is necessary for BP control [144]. In contrast, previous research has established a role for leptin, an adipokine released in proportion to total fat, in proopiomelanocortin (POMC) neurons of the ARC in the regulation of blood pressure [99, 145, 146]. It has been previously shown that intracerebroventricular (ICV) administration of leptin induces expression of AT 1A in the ARC and that leptin requires ANG signaling specifically through the AT 1 receptor to elicit its stimulatory effects upon sympathetic nerve activity (SNA), as ICV administration of the AT 1 antagonist losartan abolishes renal sympathetic nerve responses to leptin [129]. Brown adipose tissue (BAT) SNA responses to leptin are also abolished with ICV losartan, supporting the novel concept that brain ANG may be required for the metabolic effects of leptin. Further, ablation of AT 1A receptors in 26
41 the SFO of mice attenuates BAT SNA responses to leptin while ablation of the leptin receptor from the SFO does not, suggesting that loss of ANG signaling in the SFO mediates leptin action in other brain regions, such as the ARC [134, 135]. Taken together, these data are consistent with previous data from our lab and others that the brain RAS is critical for metabolic control [52, 60, 62, 66, 67, 71, 72, 147, 148]. Herein we examine the concept that AT 1A receptors in the ARC may be involved in metabolic control. Specifically, we document a critical role for AT 1A, expressed in cells which also express the leptin receptor, in the control of resting metabolic rate (RMR). Methods Animal subjects The AT LepR-KO 1A colony was maintained on a C57BL/6J background by iterative breeding of a male mouse expressing cre recombinase under control of the leptin receptor promoter with a female mouse with loxp sites flanking the AT 1A allele. Mice were housed at 25 C on a standard 12:12 light:dark cycle with ad libitum access to water and standard chow (18% kcal from fat; Teklad 7013) or a high fat diet (45% kcal from fat; OpenSource D12451). Inbred male C57BL/6J and db/db mice maintained on the C57BL/6J background were obtained from the Jackson Laboratories. NZ44 mice backcrossed onto the C57BL/6J background (originally derived by the GENSAT Project at the 27
42 Rockefeller University) were obtained from Teresa Milner s laboratory at Weill Cornell Medical College [149]. ICV cannula implants Mice were instrumented with an ICV cannula (Alzet Brain Infusion Kit III) connected to an osmotic minipump (Alzet Model 1004) for chronic ICV administration of artificial cerebral spinal fluid (acsf; Tocris, 3525) or angiotensin II (5 ng/hr, Sigma-Aldrich, A9525). Under anesthesia with intraperitoneal ketamine/xylazine, the mice were placed in a stereotaxic frame, the minipump was inserted under the skin and the cannula was implanted using the following coordinates: 1.1 mm lateral, 0.5 mm caudal to Bregma and 3.0 mm ventral from the surface of the skull. The cannula was secured to the skull using Vetbond (3M) and dental cement. DOCA-salt model A 50 mg pellet of deoxycorticosterone acetate (DOCA; Sigma) was implanted into the subcutaneous cavity under isoflurane anesthesia. Animals were subsequently singly housed and allowed ad libitium access to standard chow and both tap water and 0.15 M NaCl water for 3 weeks. Brain punches Mice were euthanized and brains were harvested, frozen in 2- methylbutane followed by embedding medium (tissue-tek O.C.T. Compound, 28
43 Sakura Finetek) and stored at -80 C. 50 μm coronal sections of the brain were cut using a cryostat and micropunches of the cortex and the SFO were obtained using a 0.75 mm needle (Stoelting). Bilateral punches of the PVN and ARC and SON were taken using a 0.50 mm needle and 0.75 mm needle, respectively. Genomic DNA was isolated using the AllPrep DNA/RNA Micro Kit (Qiagen, Cat # 80284) and cre-mediated recombination was examined by PCR using Taq Platinum (Invitrogen). AT 1A R gene primers were designed to produce a 2761bp band for the intact AT 1A R gene or a 309bp band for the recombined fragment, due to the excision of exon 3, as described previously [46]. Total RNA was isolated from brain punches by TRIzol extraction and cdna was made using SuperScript III reverse transcriptase (Invitrogen). Real-time quantitative PCR for mouse POMC, AgRP, ACE, AGT, GAD1, GAD2 and β-actin were performed using TaqMan Gene Expression Assays (Life Technologies; Mm _m1, Mm _g1, Mm _m1, Mm _m1, Mm _g1, and Mm _m1, respectively). Gene expression levels were compared using the Livak method [150]. Adipose gene expression Total RNA was isolated from WAT and BAT by TRIzol extraction using the Purelink RNA mini kit (Invitrogen) and cdna was made using SuperScript III reverse transcriptase (Invitrogen). Real-time quantitative PCR were determined using SYBR Green assays (Applied Biosystems). Gene expression levels were compared using the Livak method [151]. 29
44 The following primers were used: ACC1 forward (f) 5'-ggacagactgatcgcagagaaag-3' reverse (r) 5'-tggagagccccacacaca-3' ATGL (f) 5'-gaagatctccatgttcccgagggag-3' (r) 5 -ccgctcgagtcagcaaggcgggag-3 β-actin (f) 5 -catcctcttcctccctggagaaga-3 (r) 5 -acaggattccatacccaagaaggaagg-3 β1ar (f) 5'-ccgctgccacgaccccaag-3' (r) 5 -agccagttgaagaagagcaagaggcg-3 β2ar (f) 5'-ggttatcgtcctggccatcgtgtttg-3' (r) 5 -tggttcgtgaagaagtcacagcaagtctc-3 β3ar (f) 5'-tctagttcccagcggagttttcatcg-3' (r) 5 -cgcgcaccttcatagccatcaaacc-3 Cidea (f) 5 -tgctcttctgtatcgcccagt-3 (r) 5 -gccgtgttaaggaatctgctg-3 Eva1 (f) 5 -cacttctcctgagtttacagc-3 (r) 5 -gcattttaaccgaacatctgtcc-3 FAS (f) 5 -gctgcggaaacttcaggaaat-3 (r) 5 -agagacgtgtcactcctggactt-3 HSL (f) 5 -acgctacacaaaggctgctt-3 (r) 5 -tcgttgcgtttgtagtgctc-3 SCD (f) 5 -ccggagaccccttagatcga-3 (r) 5 -tagcctgtaaaagatttctgcaaacc-3 UCP1 (f) 5 -gtgaaggtcagaatgcaagc -3 (r) 5 -agggcccccttcatgaggtc -3 SNA recording BAT and renal sympathetic nerves were recorded under alpha-chloralose anesthesia as previously [52, 129]. Briefly, animals were anesthetized and instrumented with a colonic temperature probe. Cannulae were implanted into the common carotid artery (to record blood pressure) and jugular vein (for intravenous injections). A sympathetic nerve subserving BAT or kidney was isolated and suspended on 36-gauge platinum-iridium electrodes and secured with silicone gel. Electrodes were interfaced to a high-impedance probe (HIP- 511, Grass Instruments), and the signal was amplified (0.5-1 x 10 5 for renal, 5.5 x 10 6 for adipose; Grass P5 AC preamplifier filtered at 100 and 1000 Hz cutoffs) and routed to a resetting voltage integrator (B600c, University of Iowa Bioengineering). Data were recorded using an ADInstruments PowerLab with associated Chart software. 30
45 Home cage experiments Mice were singly housed in home cages and standard bedding was replaced by an absorbent pad to facilitate measurement of food intake and collection of feces at both 10 and 15 weeks of age or after 7 days of ICV acsf or ANG treatment. Mice were acclimated to the cages for 72 hours before data collection. Body mass and food intake measurements and feces collection were done at the same time daily for 4 days. Energy per gram feces was determined by bomb calorimetry as previously [152, 153]. This energy was applied to feces and food intake to determine energy intake and output, and thus caloric absorption. Resting metabolic rate RMR was determined using respirometry as previously [46, 52, 71, 154]. Briefly, mice were placed into thermally controlled air-tight chambers maintained at thermoneutrality (30 C) and oxygen consumption and carbon dioxide content of effluent air (flowing at 300 ml/min, corrected to standard temperature and pressure) were continually recorded (AEI analyzers, logged using an ADInstruments PowerLab with associated Chart software). Analyzers were calibrated daily using soda lime and calibration gas (Praxair). To determine the effect of αmsh treatment on RMR, baseline RMR measurements were taken in the morning and again in the afternoon following i.p. injection of αmsh. 31
46 Blood pressure by radiotelemetry Blood pressure and heart rate were assessed using radiotelemetric blood pressure probes (DSI, model TA11PA-C10), with cannulae implanted into the common carotid artery, as previously [71]. Briefly, probes were implanted under ketamine/xylazine anesthesia. Animals were allowed to recover for at least one week before three consecutive 24-hour periods were recorded ( baseline ). Data were recorded for 30 seconds every 5 minutes during the recording period, and averaged across days within subject before statistical comparisons across groups. Body composition Body composition was determined using nuclear magnetic resonance (NMR; Bruker LF90) as previously [ ]. Awake animals were lightly restrained in a polycarbonate tube during the 1 minute recording and then immediately placed back into home cages. Immunohistochemistry Brain tissue used for immunohistochemistry was perfused with 4% PFA and incubated in 30% sucrose. Coronal sections (40 um) were cut using a frozen sledge microtome (American Optical Scientific Instruments) and primary antibodies were added to free-floating sections at 4 C overnight. After washing with 1X PBS, secondary antibodies were added at room temperature for one hour. pstat3 staining was performed as previously [157]. Briefly, mice were 32
47 fasted overnight and administered 1 ug/g leptin i.p. the following morning. 30 minutes later, mice were perfused and brains were sectioned as above. Freefloating sections were incubated in primary antibody for 72 hours followed by secondary antibody for one hour. All sections were mounted onto microscopy slides and viewed using a Nikon Labophot 2 microscope. Primary antibodies: Chicken GFP (Aves Lab Inc, GFP-1010); ACTH (Harbor-UCLA Research and Education Institute); pstat3 (Cell Signaling, 9131S). Secondary antibodies: Alexa Fluor 488 goat anti-chicken (Life Technologies, A11039); Alexa Fluor 488 goat anti-rabbit, Alexa Fluor 568 goat anti-rabbit. Quantification was performed by a blinded observer using ImageJ (NIH). Fluorescent in situ hybridization (RNAscope) Mice were euthanized and brain tissue used for fluorescent in situ hybridization (ISH) was collected and frozen in 2-methylbutane followed by embedding medium (tissue-tek O.C.T. Compound, Sakura Finetek) and stored at -80 C. 10 μm coronal sections were cut using a cryostat and underwent the RNAscope Multiplex Fluorescent ISH protocol for fresh frozen tissue (Advanced Cell Diagnostics). Briefly, sections were pretreated with protease IV followed by hybridization with target probes, which contain 20 double Z oligo probe pairs for the specific RNA target of interest (Agtr1a, ; AgRP, ; POMC, ). Subsequent hybridization was completed with RNAscope detection reagents to amplify the fluorescent signal. All images were captured using a 33
48 Leica Sted 3x at 20-40x magnification. Each punctate dot represents a single mrna target. Plasma leptin Trunk blood was collected at sacrifice and plasma was isolated and stored at -80 C. After thawing plasma, leptin levels were measured using a commercially available ELISA (Cayman Chemicals). Glucose tolerance test Blood glucose levels were measured every 15 min (t= -30, -15, 0 min) from the tail using an ACCU-CHEK meter (Roche). At t=0, mice were injected with D-glucose (2 mg/kg lean body mass, i.p.). Blood glucose levels were serially measured over the course of 2 hrs (t= 15, 30, 45, 60, 90, 120 min). Statistics All quantitative data were analyzed using Student s t-test, ANOVA, or ANCOVA as indicated in the text, followed by Tukey multiple-comparisons procedures. Gene expression data were analyzed using the Livak method [151]. Data are reported as mean ± sem throughout, and p<0.05 was used as the threshold for statistical significance. 34
49 Results ICV ANG stimulates RMR via AT 1A receptors To determine if central administration of ANG increases RMR in C57BL/6J male mice, we implanted ICV minipumps containing artificial cerebral spinal fluid (acsf) or ANG (Figure 2.1A). Consistent with an increase in central ANG signaling, ANG-treated mice exhibited significant increases in water intake after ten days of treatment (Figure 2.1B), with no significant alterations in food intake, digestive efficiency, or body mass (Figure 2.1C-E). Mice receiving ICV ANG exhibited a significant induction in RMR compared to acsf-treated animals (Figure 2.1F, 2.1G). To investigate whether the induction of RMR in response to ICV ANG was mediated by the AT 1 receptor, mice were treated with losartan in their drinking water for seven days (0.8 mg/ml). Water intake remained elevated in ICV ANG animals, leading to a slight increase in the dose of losartan (Figure 2.1 H, 2.1 I). While ICV acsf animals did not exhibit a change in RMR to losartan, ICV ANG mice exhibited a significant reduction in RMR (Figure 2.1J). Taken together, these data suggest that central ANG signaling stimulates RMR via the ANG AT 1 receptor. Leptin receptors and AT 1A receptors colocalize on cells within the arcuate nucleus To confirm that AT 1A receptors are expressed in the ARC, we utilized the NZ44 BAC transgenic mouse, which expresses a GFP transgene via the AT 1A receptor promoter [149], originally developed by the GenSat project 35
50 ( and shared by Teresa A. Milner, PhD of Cornell University. Consistent with previous reports localizing AT 1 to the ARC, GFP fluorescence was detected in the ARC, specifically in the ventromedial ARC (Figure 2.2A). In addition, there was abundant AT 1A expression in the subfornical organ (SFO) and paraventricular nucleus (PVN), which is consistent with the well-established role of ANG signaling in these brain regions (Figure 2.2A). Previous studies have established that central ANG signaling through AT 1 receptors is required for leptin to mediate its effects on SNA [129], and thus we aimed to determine whether AT 1A -expressing cells in the ARC also express the leptin receptor. To investigate whether leptin receptors and AT 1A receptors colocalize to cells in a specific region in the brain, we bred the NZ44 mouse with mice that express a conditionally-activatable red fluorescent tdtomato reporter (ROSAstop flox -tdtomato) and mice that express Cre-recombinase via the leptin receptor promoter (LepR-Cre) [158, 159] to create a novel triple-transgenic mouse model (LepR-Cre x ROSA-stop flox -tdtomato x NZ44). These animals were then examined for colocalization of red and green fluorescent reporters throughout the brain. Cells expressing both fluorophores were abundant in the ARC of the hypothalamus, with minimal colocalization in the lateral hypothalamus (LH), dorsomedial hypothalamus (DMH) and nucleus tractus solitarii (NTS) (Figure 2.2B). Reporters were not colocalized in cells of the ventromedial hypothalamus (VMH), PVN, SFO, hippocampus, or cortex. These findings are consistent with the well-established role for leptin action in the ARC in control of SNA and energy 36
51 balance; however, it remains unclear what role ANG receptors in the ARC might play in energy homeostasis. Generation of AT LepR-KO 1A mice To determine whether ANG signaling specifically in leptin-sensitive cells is involved in the control of energy balance, we created a novel transgenic mouse which lacks the AT 1A receptor in any cell expressing the long (b) signaling form of the leptin receptor (AT LepR-KO 1A mice). Genetic recombination of the AT 1A receptor gene was determined in specific brain regions by polymerase chain reaction (PCR) using primers that span the flox ed region (Figure 2.3A). Recombination was observed in the supraoptic nucleus (SON) and ARC, but not in the SFO, PVN or cortex (Figure 2.3B). Critically, no changes in AT 1A mrna expression were observed in peripheral tissues (Figure 2.3C). Thus, physiological LepR-KO phenotypes observed in AT 1A mice are likely due to the loss of ANG receptor signaling on LepR-containing cells within the ventromedial ARC. Importantly, the loss of AT 1A receptors on LepR-containing cells does not block leptin signaling, as phosphorylation of STAT3 was preserved in the ARC of LepR-KO AT 1A mice (Figure 2.4A-B). AT 1A in leptin-sensitive cells is necessary for energy homeostasis Next, we assessed whether AT 1A LepR-KO mice exhibit altered energy homeostasis. Under ad libitum chow-fed conditions (Teklad 7013; 18% kcal from fat), AT 1A LepR-KO mice exhibited normal body and fat masses (Figure 2.5A and 37
52 2.5B). When maintained on chow diet, these mice exhibited normal lean and fluid mass, food intake, digestive efficiency, physical activity, RMR, brown adipose tissue (BAT) uncoupling protein-1 (UCP1) mrna, and glucose tolerance (Figures 2.5C-D, 2.6A-C, 2.6E, 2.7A-C). AT LepR-KO 1A mice appeared to exhibit elevated baseline plasma leptin levels (Figure 2.6F), however, the difference in plasma leptin is completely accounted for by the higher fat mass in AT LepR-KO 1A mice when compared to control littermates (Figure 2.6G). While both control and AT LepR-KO 1A mice responded to five weeks of 45% high fat diet (HFD; OpenSource D12451) treatment with elevations in body weight, fat mass, and plasma leptin, AT 1A LepR-KO mice gained significantly more weight and fat mass, and higher plasma leptin levels, as compared to control littermates (Figure 2.5A, Figure 2.5B, Figure 2.6F and Figure 2.6G; Table 1). There were no significant differences in food intake (Figure 2.6A) or digestive efficiency (Figure 2.6B) between AT LepR-KO 1A and littermate control mice during HFD treatment, indicating a normal total daily energy input. Whereas control littermates responded to HFD treatment with a significant induction of RMR after just two weeks of treatment (Figure 2.6D), AT LepR-KO 1A mice failed to induce RMR, and the induction of BAT UCP1 expression was severely compromised (Figure 2.6E). Critically, the lack of RMR induction in response to HFD occurred prior to significant alterations in body weight and composition, suggesting that the reduced induction of RMR is causal for the increased body adiposity observed in AT LepR-KO 1A mice. 38
53 AT 1A R in LepRb cells mediates leptin control of SNA SNA responses to leptin are attenuated in mice with global AT 1A disruption and in rats administered ICV losartan [129], suggesting that central ANG signaling through AT 1A receptors is required for leptin action. To determine whether SNA responses to leptin are altered in AT LepR-KO 1A animals, we recorded both renal SNA (RSNA) and BAT SNA at baseline and in response to intravenous leptin administration. Despite intact basal BAT SNA (Figure 2.8A), AT 1A LepR-KO mice exhibited significantly attenuated BAT SNA induction in response to leptin (Figure 2.8B). Consistent with reduced BAT SNA to leptin, LepR-KO AT 1A mice exhibited a significant decrease in BAT β3-adrenergic receptor (β3-ar) expression after HFD treatment (Figure 2.8C). In contrast, both basal LepR-KO RSNA and RSNA in response to leptin were attenuated in AT 1A mice LepR-KO (Figure 2.8D and Figure 2.8E). Consistent with reduced RSNA, AT 1A mice exhibited significantly decreased renal renin expression (Figure 2.8F). In LepR-KO addition, HFD-fed AT 1A mice exhibit attenuated expression of β-adrenergic receptors (Figure 2.9A) and brown and beige fat makers Cidea and Eva1 (Figure 2.9B) in inguinal white adipose tissue (iwat). Consistent with reduced SNA, iwat from AT 1A LepR-KO mice also exhibit decreased expression of genes associated with lipolysis, including hormone sensitive lipase (HSL) and adipocyte triglyceride lipase (ATGL) (Figure 2.9C), with no significant differences in lipogenic markers acetyl-coa carboxylase 1 (ACC1), fatty acid synthase (FAS) or stearoyl-coa desaturase (SCD) (Figure 2.9D) Critically, there were no differences in genes associated with lipolysis or lipogenesis in the liver of 39
54 LepR-KO AT 1A mice (Figure 2.9E and Figure 2.9F). Taken together, these data suggest that ablation of AT 1A receptors specifically from leptin-sensitive cells is sufficient to phenocopy the sympathetic nerve effects of global AT 1A receptor deletion or ICV losartan administration. The reduction in leptin-mediated BAT SNA in AT LepR-KO 1A mice likely explains the loss of β3-ar, UCP1 and ultimately RMR responses to HFD in these animals and the subsequent elevation in fat mass, as it has been previously shown that enhanced SNA is necessary to counteract weight gain following high caloric intake [159]. Thus, AT 1A receptors expressed in LepR-expressing cells are required for SNA and RMR control in response to HFD and leptin. RMR, but not BP, responses to DOCA-salt are attenuated in AT LepR-KO 1A mice Previously, we demonstrated that exogenous deoxycorticosterone acetate plus a high dietary sodium load (the DOCA-salt model) results in a robust stimulation of RMR, and that brain AT 1 receptors are involved in this response as ICV losartan attenuates the effect [71]. The DOCA-salt model is also a wellaccepted model of low-circulating renin hypertension, and ANG and AT 1 within the brain are critically involved in the blood pressure (BP) response to this LepR-KO stimulus [68-70]. To determine if RMR and BP could be stimulated in AT 1A mice through a brain-ang-dependent mechanism, mice were chronically treated with DOCA-salt. Despite no change in body mass or physical activity (Figure 2.10A and Figure 2.10B), control littermates responded to DOCA-salt treatment with a significant elevation in RMR, but this induction was markedly blunted in 40
55 AT LepR-KO 1A mice (Figure 2.10C). This suggests that the RMR response to both leptin (HFD) and ANG (DOCA-salt) is impaired in AT LepR-KO 1A mice. In contrast, DOCA-salt treatment resulted in expected, normal increases in BP and reduction in heart rate (Figure 2.10D and 2.10E) in AT LepR-KO 1A mice. Taken together, these results are consistent with a necessary role for AT 1A receptors in leptin-sensitive cells for metabolic, but not cardiovascular, control physiology. A unidirectional interaction between AT 1A and LepR in RMR control To elucidate the directionality of the central interaction between leptin and ANG in RMR control, we next examined the effects of stimulating the brain RAS in leptin signaling-deficient animals (db/db mice). At baseline, db/db mice exhibited significant elevations in body and fat mass as previously reported (Figure 2.11A and 2.11B). Following DOCA-salt stimulation of RMR, both control and db/db mice responded with significant elevations in RMR (Figure 2.11C). Consistent with robust increases in RMR, DOCA-salt treated db/db mice exhibited a significant reduction in fat mass (Figure 2.11B). These results support the conclusion that the metabolic effects of leptin require functional AT 1A receptors, however, the RMR effects of the brain RAS, as stimulated by DOCAsalt, do not require functional leptin signaling. Thus, we conclude that there is a specific directionality to the central interaction between leptin and ANG in RMR control. Additionally, as it was previously demonstrated that BP responses to DOCA-salt are normal in db/db mice [160], these data further support a model of divergent BP and RMR control by the brain RAS; AT 1A localized to leptin 41
56 receptor-expressing cells are specifically involved in the control of RMR but not BP. To determine if hyperactivity of the brain RAS alters the metabolic effects of leptin, we used double transgenic sra mice, which express human renin via the synapsin promoter and human angiotensinogen under its own promoter. It has been previously documented that sra mice exhibit a lean phenotype due to increased RMR, and that levels of ANG are elevated specifically in the hypothalamus [52]. Following twice daily i.p. injections of leptin, sra mice exhibited reductions in caloric intake and body mass similar to littermate controls when maintained at room temperature (Figure 2.12A and 2.12B). Despite elevated basal BAT SNA, sra mice exhibited normal RMR (Figure 2.12C) and sympathetic nerve responses to leptin (Figure 2.12D). Collectively, these data support the concept that control of RMR (but not food intake) by leptin requires AT 1A signaling within LepR-expressing cells, while RMR control by ANG does not require LepR signaling. These data underscore a specific role for AT 1A, downstream of LepR signaling within the ARC, in RMR control. αmsh action on second order neurons is suppressed in AT LepR-KO 1A mice To determine if loss of ANG signaling in leptin-sensitive cells elicits an effect on second-order neurons, we administered an analogue of α-melanocyte stimulating hormone (αmsh) to both control and AT LepR-KO 1A mice and examined RMR responses. While both control littermates and AT LepR-KO 1A mice responded 42
57 to acute αmsh treatment with significant elevations in RMR, this response was blunted in AT 1A LepR-KO mice as compared to control animals (Figure 2.13A). These results indicate that loss of AT 1A receptors in leptin-sensitive cells interfere with the action of αmsh on second order neurons and thereby leptin-mediated control of SNA and RMR. We speculate that AT 1A in LepR-expressing cells are required to disinhibit SNA and RMR activation by αmsh signaling. Consistent with a role for AT 1A within the ARC in the control of αmsh signaling, the induction of POMC and AgRP transcripts during HFD feeding was altered in AT 1A LepR-KO mice. Five weeks of HFD feeding caused a significant increase in POMC expression in the hypothalamus of both AT 1A LepR-KO and control littermate mice (Figure 2.13B). In contrast, HFD feeding caused a significant suppression of hypothalamic AgRP mrna in control mice, but no suppression was observed in AT 1A LepR-KO mice (Figure 2.13C). These data support the concept that loss of AT 1A in LepR-expressing cells has a specific effect to modulate the function of AgRP, but possibly not POMC neurons of the hypothalamus. AT 1A in AgRP, but not POMC, neurons While we conclude that leptin and AT 1A receptors colocalize to cells in the ARC, it is unclear whether this colocalization is specific to a certain population of cells in this brain region. Thus, we investigated the colocalization of AT 1A receptors with POMC and AgRP neurons. To determine if POMC neurons express the AT 1A receptor, we immunostained brain tissue from NZ44 mice for 43
58 adrenocorticotropin (ACTH), a cleavage product of the POMC gene that is used as a marker for POMC neurons. To determine whether AgRP-expressing neurons express the AT 1A receptor, mice expressing tdtomato under control of the AgRP promoter (AgRP-Cre x ROSA-stop flox -tdtomato mice) were bred with NZ44 mice. While POMC neurons do not appear to express the AT 1A receptor; there was a significant localization of the AT 1A receptor to AgRP neurons under both chow and HFD-fed conditions (Figure 2.14A and Figure 2.15A). To complement this reporter-based method, colocalization of endogenous AT 1A, POMC and AgRP mrna transcripts in the ARC of wildtype C57BL/6J mice was also examined using fluorescent in situ hybridization (RNAscope). As expected, AT 1A transcripts were detected in cells also expressing AgRP, but not in cells expressing POMC (Figure 2.14B). These data are consistent with previously published RNA-sequencing data demonstrating expression of AT 1A receptors on AgRP, but not POMC, neurons [161]. While AT 1A receptors do not appear to be expressed in POMC neurons, it is possible that a loss of ANG signaling in AgRP neurons may functionally impact AgRP, as well as POMC neurons, as it has been shown that AgRP neurons can directly inhibit POMC neurons as well as interfere with second-order targets of POMC neurons [162, 163]. Aberrant signaling downstream of cells expressing AT 1A and leptin receptors To determine if there are alterations in signaling cascades associated with AgRP neurons in AT LepR-KO 1A mice, we investigated the expression of glutamate decarboxylase (GAD) 1 and 2 in the ARC. AT LepR-KO 1A mice exhibited significant 44
59 inductions of GAD1 and GAD2 in the ARC (Figure 2.16A) supporting the hypothesis that ablation of ANG signaling in AgRP neurons results in increased GABA release, which will ultimately attenuate SNA and RMR. Previously, it was demonstrated that ICV leptin increases AT 1A receptor expression in the ARC. To determine if other RAS components are changed in response to leptin, we examined expression of angiotensin converting enzyme (ACE) and angiotensinogen (AGT) in the ARC of control and AT LepR-KO 1A mice following two weeks of HFD treatment. Both ACE and AGT expression were significantly attenuated in the ARC of AT 1A LepR-KO mice (Figure 2.16B and Figure 2.16C) suggesting that loss of ANG signaling or the subsequent reduction in leptin action impairs the de novo synthesis of ANG in the ARC. Discussion Collectively these data underscore a major role for the renin-angiotensin system within the brain in the control of energy homeostasis. This is mediated in large part through actions of ANG upon AT 1A, localized to the subset of LepRexpressing neurons within the ARC which also express AgRP. Leptin signaling to the ARC appears to require AT 1A within these neurons to fully stimulate SNA and ultimately RMR (Figure 2.17). Notably, these AT 1A receptors appear to only be involved in the regulation of RMR, but not cardiovascular control. It is well-established that the central nervous system develops resistance to leptin during obesity. More recently it has been suggested that this resistance is selective, where the cardiovascular effects of leptin remain intact while the 45
60 metabolic effects of leptin are abolished [164]. Current research on the mechanisms underlying selective leptin resistance (SLR) has focused on deficits in leptin signaling; however, our data support a possible role for central ANG signaling in SLR as we have shown ANG AT 1A receptors specifically in leptinsensitive cells are dispensable for BP control, but necessary for the control of resting metabolism and thus energy balance. Further, it was recently demonstrated that a majority of AgRP neurons may lie outside of the blood-brain barrier, which would allow for direct interaction with circulating factors like ANG and leptin [165]. As a result, AgRP neurons were more susceptible to leptin resistance, which is consistent with our work demonstrating a role for ANG signaling in AgRP neurons in the control of RMR, but not BP. We found that leptin and AT 1A receptors colocalize to cells in the ARC, which is consistent with the well-established role of the ARC in control of energy balance [93, 166, 167]. Further, it appears that AT 1A receptors are expressed by AgRP, but not POMC, neurons in the ARC. While AgRP and POMC neurons comprise the two major types of neurons in the ARC, we cannot rule out a role for rat insulin promoter 2 (RIP)-expressing neurons in the control of RMR by cells that express both leptin and AT 1A receptors. It has been previously demonstrated that RIP-expressing neurons are leptin sensitive and localize to the ARC [168]; however, it is unknown if these cells also express the AT 1A receptor. Further, RIP-expressing neurons have previously been implicated in the control of thermogenesis as deletion of the vesicular γ-aminobutyric acid (GABA) 46
61 transporter (VGAT) from RIP-expressing neurons resulted in increased sensitivity to HFD treatment due entirely to a lack of RMR induction [169]. The contribution of WAT sympathetic nerve activity in the excess fat and LepR-KO body mass gain observed in AT 1A mice remains unclear. We have LepR-KO demonstrated that iwat from HFD-fed AT 1A mice exhibits gene expression patterns consistent with decreased sympathetic innervation, including attenuated βar and lipolysis gene expression, as well as a decrease in markers of brown or beige fat. It is well established that both WAT and BAT are innervated by the sympathetic nervous system, however, it is believed that this innervation is greater in the BAT and thus more subject to neural control [170]. Additionally, it has previously been shown that central ANG administration increases expression of β 3 -AR s in WAT, supporting the idea that the brain RAS can increase WAT SNA [62]. However, sympathetic denervation of WAT does not prevent peripheral leptin administration from reducing fat mass suggesting that a mechanism independent of central control may contribute [171]. Despite this, sympathetic stimulation of WAT has not been as thoroughly investigated as sympathetic innervation in BAT, thus the relationship between central leptin action and WAT SNA is contentious [172]. However, it is reasonable to propose that SNAinduced WAT lipolysis by leptin or ANG would mobilize free fatty acids that are subsequently utilized by the BAT to increase thermogenesis in response to HFD. Taken together, future studies should further investigate the role of central leptin and the brain RAS on WAT SNA and lipolysis and its possible contributions to BAT thermogenesis and obesity. In addition, it will be interesting to determine if 47
62 these mechanisms are altered in AT LepR-KO 1A mice, thus contributing to elevated fat and body mass. Despite attenuated renal sympathetic nerve activation (RSNA) at baseline and in response to leptin, AT LepR-KO 1A mice exhibit normal MAP and heartrate under baseline, chow-fed conditions. It is possible that changes in other mechanisms controlling blood pressure may be in place to compensate for the decreased RSNA in AT 1A LepR-KO mice. Consistent with decreased RSNA, AT 1A LepR-KO mice exhibit significantly decreased renal renin expression, suggesting that peripheral RAS signaling is likely not elevated to maintain normal blood pressure. Further, AT LepR-KO 1A mice exhibit similar levels of urine copeptin (control, 8.45 μg/day; AT LepR-KO 1A, 7.29 μg/day; p > 0.05) as control littermates suggesting that vasopressin is not elevated and thus does not increase blood pressure in response to decreased RSNA. It is unknown if AT 1A LepR-KO mice exhibit changes in salt reabsorption, however, it has been demonstrated that leptin can act directly on the adrenal glands to increase release of aldosterone [173], thus it is possible that AT LepR-KO 1A mice have increased aldosterone levels, leading to increased salt reabsorption and water retention to maintain blood pressure. Moreover, it is possible that AT LepR-KO 1A mice exhibit changes in lumbar SNA to promote vasoconstriction and increase blood pressure in the face of decreased RSNA. It remains possible that leptin-mediated elevations in blood pressure, such as those caused by HFD treatment, may be altered given that activation of αmsh is critical in the development of obesity-hypertension in both animal models [174, 175] and human patients [176]. 48
63 Despite elevated brain RAS activity, sra mice did not exhibit enhanced brown adipose tissue SNA or RMR responses to exogenous leptin administration. We speculate this is likely because both BAT SNA and RMR are maximally stimulated in sra mice. Further, while it has been previously demonstrated that these mice exhibit enhanced levels of angiotensin in the AV3V region of the brain [52], it is unknown if expression of the AT 1A receptor is altered in the ARC or other regions of the hypothalamus. Future studies examining the effect of ICV leptin receptor antagonist administration on BAT SNA and RMR in sra mice would be of interest to determine if leptin plays a role in the lean phenotype observed in sra animals. sra mice also exhibited similar changes in food intake and body weight to exogenous leptin treatment compared to control littermates. This is consistent with previous data showing that global AT 1A receptor knockout animals exhibit no significant differences in leptin-induced changes in food intake or body weight [129] suggesting that angiotensin signaling through the AT 1A receptor does not mediate the effects of leptin on food intake. It remains unclear what cellular mechanisms mediate the cross-talk between leptin and ANG, however the intact activation of STAT3 signaling following acute leptin administration suggests that leptin action on first order neurons is functional in AT LepR-KO 1A animals. The attenuated RMR responses to αmsh treatment in AT LepR-KO AgRP-KO 1A and AT 1A mice support a model in which dysfunctional RMR control is due to inhibition of αmsh action on second order neurons, likely in the PVN or LH [177, 178]. It is well-established that AgRP neurons can release AgRP, neuropeptide Y (NPY) and GABA to antagonize 49
64 LepR-KO αmsh. Under chow-fed conditions AT 1A exhibit elevated expression of both GAD1 and GAD2 in the ARC, thus, it is possible that loss of ANG signaling in AgRP neurons results in hyperactivity of these cells as has been observed in neurons in other brain regions [179]. It is also possible that intact leptin signaling is required for the transcriptional regulation of RAS signaling components. It was previously shown that ICV administration of leptin leads to elevated AT 1A receptor expression in the ARC and ob/ob mice exhibit decreased expression and activity of ACE [126, 129, 180]. Further, administration of leptin to ob/ob mice enhances plasma angiotensinogen expression [126, 180], and it has been shown that angiotensinogen is expressed in AgRP neurons of the ARC [161]. Leptinactivated second messenger pathways have also been shown to promote the transcription of angiotensinogen in other cell types [ , 181, 182]. Thus, it is reasonable to hypothesize that leptin signaling may activate an autocrine RAS signaling mechanism within the ARC to mediate RMR control. Previous research has demonstrated that ICV administration of the ACE inhibitor captopril attenuated SNA responses to central leptin [129] thus supporting the concept that stimulation of a local, de novo ANG synthesis by leptin may be required for LepR-KO the SNA and RMR effects of leptin. In addition, AT 1A mice exhibit a significant decrease in ACE expression in the ARC at baseline. Taken together, activation of the LepR may induce the expression or production of ACE and/or angiotensinogen within the ARC that can promote local generation of ANG, which can then act upon AT 1A on AgRP neurons to modulate RMR (Figure 2.17). 50
65 In conclusion, our data demonstrate a critical requirement of the angiotensin AT 1A receptor, specifically localized to leptin-sensitive AgRP neurons, in the control of resting metabolism. This functional interaction appears to be specific to the control of resting metabolism, as food intake behavior and blood pressure control appear to be largely unaffected. Future work is required to determine the implications of altered brain ANG signaling in the development of selective leptin resistance, and to more fully elucidate the role of an autocrine RAS within the ARC in RMR control. 51
66 Figure 2.1 ICV ANG stimulates RMR via AT 1A receptors. (A) Timeline of experiment. (B-G) Water intake (B), food intake (C), digestive efficiency (D), body mass (E), body mass vs RMR (F) and ANCOVA-adjusted RMR (G) of C57BL/6J mice after ten days ICV acsf or ANG treatment (n=16 acsf; 13 ANG). (H-J) Water intake (H), dose of losartan (I) and change in RMR (J) in ICV acsf or ANG treated mice after seven days of losartan treatment (n=6 acsf; 11 ANG). All data are mean ± SEM (*p < 0.05). 52
 Representative photomicrographs of egfp expression via the AT 1A promoter in the SFO, PVN and ARC of NZ44 mice.")
67 Figure AT 1A and leptin receptors colocalize within cells in the ARC. (A) Representative photomicrographs of egfp expression via the AT 1A promoter in the SFO, PVN and ARC of NZ44 mice. (B) Representative photomicrographs highlighting activities of the AT 1A and leptin receptor promoters in the ARC, LH, DMH, VMH, NTS, PVN, SFO, hippocampus and cortex. 53
, and ARC of control and AT 1A LepR-KO animals.")
68 Figure LepR-Cre construct is expressed in the ARC. (A) Primers for detection of genetic recombination of the AT 1A gene span the flox ed region. Intact and recombined AT 1A flox gene expression in SFO, cortex, PVN, supraoptic nucleus (SON), and ARC of control and AT 1A LepR-KO animals. (B) AT 1A expression in peripheral tissues, including heart, kidney, liver, lung, BAT, epididymal white adipose tissue (ewat), inguinal WAT (iwat) and skeletal muscle, of control and AT 1A LepR-KO mice (n=6/group). All data are mean ± SEM (*p < 0.05). 54

69 Figure 2.4 Intact leptin signaling in the ARC of AT 1A LepR-KO mice. (A-B) ARC pstat3 expression following i.p. PBS or leptin (1 μg/g) in control (n=2 PBS, 3 leptin) or AT 1A LepR-KO mice (n=1 PBS, 6 leptin) after two weeks of HFD treatment. All data are mean ± SEM (*p < 0.05). 55
70 Figure AT 1A LepR-KO mice exhibit increased body and fat mass after HFD. (A-D) Body mass (A), fat mass (B), lean mass (C), and fluid mass (D) of control and AT 1A LepR- KO mice on chow (n=28 control, 26 AT 1A LepR-KO ) or after five weeks of 45% HFD treatment (n=35 control, 31 AT 1A LepR-KO ). All data are mean ± SEM (*p < 0.05). 56
71 Figure 2.6 Lack of induction of RMR in response to HFD in AT 1A LepR-KO mice. (A) Home cage food intake in g/day of control and AT 1A LepR-KO mice on chow (n=12 control, 15 AT 1A LepR-KO ) or after five weeks of 45% HFD feeding (n=29 control, 14 AT 1A LepR-KO ). (B) Digestive efficiency of control and AT 1A LepR-KO mice on chow or after five weeks of 45% HFD feeding (n=5/group). (C) Physical activity in control (n=10) and AT 1A LepR-KO mice (n=9) on chow. (D) ANCOVA-adjusted RMR in control and AT 1A LepR-KO mice on chow (n=13 control, 15 AT 1A LepR-KO ) or after two weeks of HFD feeding (n=22 control, 12 AT 1A LepR-KO ). (E) BAT UCP1 expression on chow (n=4 control, 5 AT 1A LepR-KO ) or after two weeks of HFD feeding (n=4 control, 8 AT 1A LepR-KO ). (F-G) Plasma leptin levels in control and AT 1A LepR-KO mice on chow (n=9 control, 7 AT 1A LepR-KO ) or after two weeks of HFD treatment (n=5 control, 6 AT 1A LepR-KO ). All data are mean ± SEM (*p < 0.05). 57
72 Figure 2.7 Glucose tolerance in AT 1A LepR-KO mice. (A-C) 5-hour fasted blood glucose levels (A) and blood glucose levels in male (B) and female (C) AT 1A LepR-KO (n=5 males, 7 females) and control littermates (n=14 males, 9 females) following i.p. administration of glucose (2 mg/g lean mass). All data presented as mean ± sem (* p<0.05). 58
73 LepR-KO Figure 2.8 Sympathetic nerve responses in AT 1A mice. (A-B) Basal BAT SNA (n=5/group) (A) and changes in BAT SNA following i.v. administration of leptin (60 μg; n=6 control, 5 AT LepR-KO LepR-KO 1A ) (B) in AT 1A and control littermates. (C) BAT β3-ar LepR-KO expression in AT 1A (n=6) and control littermates (n=4) after two weeks of HFD. (D- E) Basal RSNA (n=5/group) (D) and changes in RSNA following i.v. administration of LepR-KO leptin (60 μg; n=3/group) (E) in AT 1A and control littermates. (F) Renal renin LepR-KO expression in AT 1A mice and control littermates at baseline (n=4/group). All data presented as mean ± sem (*p<0.05). 59
74 Figure 2.9 Alterations in inguinal WAT in AT 1A LepR-KO mice. (A-D) Expression of β- adrenergic receptor subtypes (A), brown and beige fat markers (B), and genes associated with lipolysis (C) and lipogenesis (D) in iwat from control and AT 1A LepR-KO mice after two weeks of HFD treatment (n=14/group). (E-F) Expression of genes associated with lipolysis (E) and lipogenesis (F) in the liver of control and AT 1A LepR-KO mice after two weeks of HFD treatment (n=14/group). All data presented as mean ± sem (*p<0.05). 60
75 Figure 2.10 RMR, but not cardiovascular, responses to DOCA-salt are attenuated in AT 1A LepR-KO mice. (A-B) Body mass (A) and ANCOVA-adjusted RMR (B) at baseline and following three weeks of DOCA-salt treatment in control (n=12 baseline, 10 DOCA) and AT 1A LepR-KO mice (n=13 baseline, 6 DOCA). (C-E) Activity (C), MAP (D), and HR (E) at baseline and following three weeks of DOCA-salt treatment in control (n= 10 baseline, 8 DOCA) and AT 1A LepR-KO mice (n=9 baseline, 7 DOCA). All data are mean ± SEM (*p < 0.05). 61
 Body mass (A), fat mass (B) and ANCOVA-adjusted RMR (C) in C57BL/6J (n=7 sham, 9 DOCA) and db/db mice (n=6 sham, 12 DOCA)")
76 Figure Unidirectional interaction between LepR and AT 1A in RMR control. (A- C) Body mass (A), fat mass (B) and ANCOVA-adjusted RMR (C) in C57BL/6J (n=7 sham, 9 DOCA) and db/db mice (n=6 sham, 12 DOCA) treated with DOCA-salt. All data are mean ± SEM (*p < 0.05). 62
77 Figure 2.12 Hyperactivity of the brain RAS does not increase sensitivity to leptin. (A-B) Body mass (A) and food intake (B) responses to twice daily i.p. leptin (1 μg/g) treatment in control and sra mice (n=5/group). (C) Change in RMR to one i.p. injection of leptin (1 μg/g) in control and sra mice (n=8/group). (D) BAT SNA responses to i.v. leptin (60 μg) administration in sra mice and control littermates (n=4/group). All data are mean ± SEM (*p < 0.05). 63
78 Figure 2.13 Aberrant signaling downstream of AgRP neurons. (A) ANCOVAadjusted RMR at baseline and in response to i.p. administration of αmsh (4.5 μg/g) in control (n=3) and AT 1A LepR-KO mice (n=7). (B-C) Change in POMC (B) and AgRP (C) mrna with five weeks of HFD feeding in control (n=12 chow, 4 HFD) and AT 1A LepR-KO mice (n=4 chow, 5 HFD). All data are mean ± SEM (*p < 0.05). 64
 Representative photomicrographs of AT 1A receptor and POMC or AgRP in the ARC of chow fed animals.")
79 Figure 2.14 AT 1A receptors localize to AgRP neurons. (A) Representative photomicrographs of AT 1A receptor and POMC or AgRP in the ARC of chow fed animals. (B) Representative photomicrographs of mrna expression of AT 1A receptor and POMC or AgRP in the ARC of chow fed animals. 65
 Representative photomicrographs of AT 1A receptor and POMC or AgRP in the ARC of animals on")
80 Figure 2.15 AT 1A receptors localize to AgRP neurons after HFD treatment. (A) Representative photomicrographs of AT 1A receptor and POMC or AgRP in the ARC of animals on HFD for five weeks. 66
 Expression of ACE (B) and AGT (C) in control and AT 1A LepR-KO mice on chow (n=5 control, 4 AT 1A LepR-KO ) or after two weeks of HFD (n=13 control, 15 AT 1A LepR-KO ).")
81 Figure 2.16 Potential mediators of AT 1A signaling and leptin-at 1A crosstalk within the ARC (A) Expression of GAD1 and GAD2 in control and AT 1A LepR-KO mice on chow (n=14/group). (B-C) Expression of ACE (B) and AGT (C) in control and AT 1A LepR-KO mice on chow (n=5 control, 4 AT 1A LepR-KO ) or after two weeks of HFD (n=13 control, 15 AT 1A LepR-KO ). All data are mean ± SEM (*p < 0.05). 67

82 Figure 2.17 Working model of the interaction between angiotensin signaling at AT 1A receptors and LepR signaling in the control of resting metabolic rate. 68
83 Table 1 Tissue masses in AT 1A LepR-KO mice and control littermates on chow and after five weeks of HFD treatment. Control Body mass (g) Chow HFD AT 1A LepR-KO Control AT 1A LepR-KO Males 26.8 ± ± ± 1.0 * 33.1 ± 1.5 Females 22.7 ± ± ± ± 1.3 BAT (mg) Males 59.4 ± ± ± 9.0 * ± 12.8 Females 57.7 ± ± ± ± 10.3 iwat (mg) Males ± ± ± 48.9 * ± 69.2 Females ± ± ± 41.0 * ± 66.1 ewat (mg) Males ± ± ± * ± Liver (mg) Heart (mg) Kidney (mg) Females ± 91.0 Males ± Females ± ± ± ± ± ± ± ± ± 37.3 * ± 57.9 Males ± ± ± ± ± 6.8 Females ± ± ± 4.2 Males ± ± ± ± 9.1 Females ± ± ± ±
84 Table 1 continued Chow HFD Control AT 1A LepR-KO Control AT 1A LepR-KO Body mass (g) Males 26.8 ± ± ± 1.0 * 33.1 ± 1.5 Females 22.7 ± ± ± ± 1.3 BAT (mg/g body mass) Males 2.3 ± ± ± ± 0.4 Females 2.5 ± ± ± ± 0.4 iwat (mg/g body mass) Males 6.9 ± ± ± 1.2 * 14.9 ± 1.8 Females 12.6 ± ± ± 1.5 * 9.8 ± 2.3 ewat (mg/g body mass) Males 14.2 ± ± ± 2.8 * 33.8 ± 3.9 Females 15.3 ± ± ± ± 3.9 Liver (mg/g body mass) Males 51.0 ± ± ± ± 2.0 Females 48.0 ± ± ± 0.9 * 39.4 ± 1.5 Heart (mg/g body mass) Males 4.1 ± ± ± ± 0.3 Females 4.6 ± ± ± ± 0.4 Kidney (mg/g body mass) Males 4.8 ± ± ± ± 0.4 Females 5.1 ± ± ± 0.1 * 5.5 ± 0.2 Brown adipose tissue (BAT); inguinal white adipose tissue (iwat); epididymal white adipose tissue (ewat) *p<0.05 vs chow control, p<0.05 vs chow AT 1A LepR-KO, and p<0.05 vs HFD control 70
85 CHAPTER III: CONTROL OF ENERGY BALANCE BY ANGIOTENSIN II TYPE 1A (AT 1A ) RECEPTORS ON AgRP-EXPRESSING CELLS Abstract We have previously shown that angiotensin AT 1A receptors on leptin receptor-expressing cells are critical for the control of resting metabolic rate (RMR) and thus fat and body mass gain in response to high fat diet (HFD) consumption. Immunohistochemistry and RNA in situ hybridization studies suggest that AT 1A receptors localize to AgRP neurons in the arcuate nucleus (ARC) of the hypothalamus. Here, we determine that AT 1A receptors in AgRP neurons are necessary for the control of RMR. Mice lacking AT 1A receptors in AgRP neurons (AT AgRP-KO 1A ) exhibit deficits in RMR responses to alphamelanocyte stimulating hormone (αmsh), similar to the attenuation observed in mice lacking AT 1A receptors in all leptin-sensitive cells (AT LepR-KO 1A ). Further, AT 1A AgRP-KO mice exhibit significant deficits in BAT SNA responses to leptin. Interestingly, following ten weeks of HFD treatment, male AT 1A AgRP-KO mice exhibit significantly increased fat and body mass, despite no differences in food intake or digestive efficiency. In contrast, female AT 1A AgRP-KO mice exhibit decreased fat and body mass, also with no differences in food intake or digestive efficiency. Taken together, these data are consistent with our working hypothesis that AT 1A, localized to the subset of leptin receptor-expressing neurons, which also express AgRP, are critically involved in the control of RMR and thus total energy output. 71
86 Introduction The renin-angiotensin system (RAS) is well-established for its role in blood pressure and fluid balance control. In addition to the circulating RAS, the local brain RAS has been implicated in cardiovascular control, and all components of the RAS signaling cascade have been documented in the brain. More recently, a role for the brain RAS in metabolic control has become appreciated. Porter et al. demonstrated that intracerebroventricular (ICV) administration of angiotensin II (ANG) to rats increased the expression of uncoupling protein 1 (UCP1), a mitochondrial inner membrane protein that positively correlates with heat production, in the brown adipose tissue (BAT) [67]. In addition, transgenic sra mice, which exhibit hyperactivity of the brain RAS, are lean due to elevated resting metabolic rate (RMR) [52]. Genetic ablation of the angiotensin AT 1A receptor in the paraventricular nucleus (PVN) results in significant weight gain after high fat diet consumption when compared to control littermates, in part due to attenuated RMR [72]. Taken together, previous data supports the concept that brain RAS signaling is critical for the control of energy expenditure and thus the regulation of body weight. The AT 1 receptor is robustly expressed in the arcuate nucleus (ARC) [141, 142] and it has been shown that ANG strongly binds in the ARC of the human brain [127, 143]. The ARC is well-known for its role in metabolic control, in particular as the primary site of action for leptin, an adipokine released in proportion to total fat. Intriguingly, it has been previously shown that ICV 72
87 administration of leptin induces expression of AT 1A in the ARC and that leptin requires ANG signaling specifically through the AT 1 receptor to elicit its stimulatory effects upon sympathetic nerve activity (SNA), as ICV administration of the AT 1 antagonist losartan abolishes renal sympathetic nerve responses to leptin [129]. Brown adipose tissue (BAT) SNA responses to leptin are also abolished with ICV losartan, supporting the novel concept that brain ANG may be required for the metabolic effects of leptin. Further, ablation of AT 1A receptors in the SFO of mice attenuates BAT SNA responses to leptin while ablation of the leptin receptor from the SFO does not, suggesting that loss of ANG signaling in the SFO affects downstream leptin signaling in other brain regions, such as the ARC [134, 135]. Taken together, these data are consistent with previous data from our lab and others that the brain RAS is critical for metabolic control [52, 60, 62, 66, 67, 71, 72, 147, 148]. Immunohistochemistry and RNA in situ hybridization studies presented in chapter II suggest that within the ARC, AT 1A receptors are expressed on agoutirelated peptide (AgRP), but not proopiomelanocortin (POMC), neurons. The LepR-KO deficit in RMR induction in response to ANG or leptin in AT 1A mice is consistent with previous data supporting a role for AgRP neurons in the control of resting metabolism [ ]. Herein we examine the concept that AT 1A receptors in AgRP neurons may be involved in metabolic control. Specifically, we document a critical role for AT 1A, expressed in cells which also express AgRP, in the control of RMR. 73
88 Methods Animal subjects AgRP-KO The AT 1A colony was maintained on a C57BL/6J background by iterative breeding of a male mouse expressing cre recombinase under control of the AgRP promoter with a female mouse with loxp sites flanking the AT 1A allele. Mice were housed at 25 C on a standard 12:12 light:dark cycle with ad libitum access to water and standard chow (18% kcal from fat; Teklad 7013) or a high fat diet (45% kcal from fat; OpenSource D12451). SNA recording BAT sympathetic nerves were recorded under alpha-chloralose anesthesia as previously [52, 129]. Briefly, animals were anesthetized and instrumented with a colonic temperature probe. Cannulae were implanted into the common carotid artery (to record blood pressure), and jugular vein (for intravenous injections) or third ventricle (for intracerebraventricular injections). A sympathetic nerve subserving BAT was isolated and suspended on 36-gauge platinum-iridium electrodes and secured with silicone gel. Electrodes were interfaced to a high-impedance probe (HIP-511, Grass Instruments), and the signal was amplified (0.5-1 x 10 5 for renal, 5.5 x 10 6 for adipose; Grass P5 AC preamplifier filtered at 100 and 1000 Hz cutoffs) and routed to a resetting voltage integrator (B600c, University of Iowa Bioengineering). Data were recorded using an ADInstruments PowerLab with associated Chart software. 74
89 Home cage experiments Mice were singly housed in home cages and standard bedding was replaced by an absorbent pad to facilitate measurement of food intake and collection of feces at both 10 and 15 weeks of age. Mice were acclimated to the cages for 72 hours before data collection. Body mass and food intake measurements and feces collection were done at the same time daily for 4 days. Energy per gram feces was determined by bomb calorimetry as previously [152, 153]. This energy was applied to feces and food intake to determine energy intake and output, and thus caloric absorption. Resting metabolic rate RMR was determined using respirometry as previously [46, 52, 71, 154]. Briefly, mice were placed into thermally controlled air-tight chambers maintained at thermoneutrality (30 C) and oxygen consumption and carbon dioxide content of effluent air (flowing at 300 ml/min, corrected to standard temperature and pressure) were continually recorded (AEI analyzers, logged using an ADInstruments PowerLab with associated Chart software). Analyzers were calibrated daily using soda lime and calibration gas (Praxair). To determine the effect of αmsh treatment on RMR, baseline RMR measurements were taken in the morning and again in the afternoon following i.p. injection of αmsh. 75
90 Body composition Body composition was determined using nuclear magnetic resonance (NMR; Bruker LF90) as previously [ ]. Awake animals were lightly restrained in a polycarbonate tube during the 1 minute recording and then immediately placed back into home cages. Gene expression Total RNA was isolated from BAT by TRIzol extraction using the Purelink RNA mini kit (Invitrogen) and cdna was made using SuperScript III reverse transcriptase (Invitrogen). Real-time quantitative PCR for mouse beta adrenergic receptors was performed using SYBR Green assays (Applied Biosystems). Gene expression levels were compared using the Livak method [151]. Statistics All quantitative data were analyzed using Student s t-test, ANOVA, or ANCOVA as indicated in the text, followed by Tukey multiple-comparisons procedures. Data are reported as mean ± sem throughout, and p<0.05 was used as the threshold for statistical significance. 76
91 Results AT 1A in AgRP neurons is necessary for energy homeostasis To determine whether ANG signaling specifically in AgRP neurons is involved in the control of energy balance, we created a novel transgenic mouse AgRP-KO which lacks the AT 1A receptor in any cell expressing AgRP (AT 1A mice). AgRP-KO We first assessed whether AT 1A mice exhibit altered energy homeostasis. Under ad libitum chow-fed conditions (Teklad 7013; 18% kcal from fat), male AgRP-KO AT 1A mice exhibited increased food intake, but normal body, fat, lean and fluid mass, digestive efficiency respiratory exchange ratio (RER), and RMR AgRP-KO (Figure 3.4A, Figure 3.1 A-D, Figure 3.3 B-D). Chow-fed female AT 1A mice exhibited normal food intake, digestive efficiency, RER, RMR and body, fat, lean and fluid mass (Figure 3.3 E-H, Figure 3.2 A-D). While both control and male AgRP-KO AT 1A mice responded to ten weeks of 45% high fat diet (HFD; OpenSource AgRP-KO D12451) with elevations in body weight and fat mass, AT 1A mice gained significantly more weight and fat mass compared to littermate controls (Figure LepR-KO 3.1 E-I; Table 2), which is consistent with phenotypes observed in AT 1A mice. There were no significant differences in food intake or digestive efficiency AgRP-KO between male AT 1A mice and littermate controls during HFD treatment (Figure 3.3 A-B), indicating a normal total daily energy input and consistent with a AgRP-KO decrease in total daily energy output. In contrast, female AT 1A mice exhibited decreased weight and fat mass in response to HFD consumption compared to control littermates, despite no differences in food intake or digestive efficiency (Figure 3.2 E-I, Figure 3.3 E-F; Table 2), suggesting that differences in 77
92 total daily energy output exist in female AT 1A AgRP-KO mice compared to littermate controls. Taken together, these data support the conclusion that AT 1A AgRP-KO mice exhibit alterations in energy output in response to HFD treatment. AT 1A receptors in AgRP neurons in control of SNA BAT SNA responses to leptin are attenuated in mice with global AT 1A disruption, in rats administered ICV losartan and in mice with ablation of AT 1A in leptin-sensitive cells, suggesting that central ANG signaling through AT 1A receptors is required for leptin action. Consistent with reduced BAT SNA, AgRP-KO AT 1A mice exhibited a decrease in BAT β3 adrenergic receptor expression after HFD treatment (Figure 3.4A). To determine whether BAT SNA responses are altered in AT AgRP-KO 1A animals, we recorded BAT SNA in response to both ICV leptin and melanocortin II (MTII) administration. AT AgRP-KO 1A mice exhibited significantly decreased BAT SNA responses to leptin (Figure 3.4C), consistent with the decreased BAT SNA to IV leptin that we observed in mice lacking AT 1A receptors in leptin-sensitive cells (Figure 2.9D and Figure 3.4D). Surprisingly, AT 1A AgRP-KO mice exhibited an increase in BAT SNA responses to MTII (Figure 3.4B; Table 3). Taken together, these data suggest that ablation of AT 1A receptors specifically from AgRP neurons is sufficient to phenocopy the sympathetic nerve effects of ICV losartan administration or deletion of AT 1A receptors from leptin-sensitive cells. Thus, AT 1A receptors expressed in AgRP neurons are required for full activation of BAT SNA in response to leptin. 78
93 αmsh action on second order neurons is suppressed in AT 1A AgRP-KO mice To determine if loss of ANG signaling in AgRP neurons elicits an effect on second-order neurons, we administered an analogue of α-melanocyte stimulating hormone (αmsh) to both control and AT 1A AgRP-KO mice and examined RMR responses. In parallel to AT LepR-KO 1A mice, AT AgRP-KO 1A mice exhibited suppressed RMR responses to acute αmsh injection (Figure 3.5A). Together, these data support our working hypothesis that AT 1A, localized to the subset of LepRexpressing cells within the ARC which also express AgRP, are critically and specifically involved in the control of RMR (Figure 2.17). Disinhibition of AgRP neurons in AT AgRP-KO 1A mice Finally, we investigated possible mediators of AT 1A signaling, focusing on mechanisms which have been documented in AgRP neurons such as AgRP, neuropeptide Y (NPY) and γ-aminobutyric acid (GABA) signaling. As it has been demonstrated that expression of glutamate decarboxylase enzyme (GAD) 1 positively correlates with GABA release [187], we examined expression of GABA synthetic enzymes within the ARC. Consistent with increased expression of GAD1 and GAD2 in the ARC of AT 1A LepR-KO mice, mrna for both of the glutamate decarboxylase enzymes, GAD1 and GAD2 (Figure 3.6A and 3.6B), and the vesicular GABA transporter (VGAT) (Figure 3.6C) were significantly increased in AT AgRP-KO 1A mice compared to littermate controls. AT AgRP-KO 1A mice also exhibited significantly increased expression of both AgRP (Figure 3.6D) and NPY (Figure 3.6E) in the ARC under chow fed conditions. Together these 79
94 findings support a role for AT 1A receptors in the suppression of neurotransmission by AgRP neurons. Discussion Collectively these data underscore a role for the renin-angiotensin system within the brain in the control of energy homeostasis. This is mediated in large part through actions of ANG upon AT 1A, localized to the subset of LepRexpressing neurons within the ARC which also express AgRP. Leptin signaling to the ARC appears to require AT 1A within AgRP neurons to fully stimulate SNA and ultimately RMR (Figure 2.17). Despite the anorexigenic action of central angiotensin and the critical role of AgRP neurons in food intake, it is not unexpected that ablation of AT 1A receptors in AgRP neurons only mildly effects food intake in male AT 1A AgRP-KO mice and has no impact on food intake in female AT 1A AgRP-KO mice. Previous data suggests that attenuation of food intake by angiotensin is mediated by the AT 2 receptor as pharmacological blockade or genetic ablation of the AT 2 receptor prevented the anorexigenic action of angiotensin II while this response was maintained in mice with pharmacological blockade or genetic ablation of the AT 1 receptor [63]. Further, while AgRP neurons are undeniably important for the regulation of food intake, several publications have demonstrated that manipulation of proteins expressed in AgRP neurons does not impact food intake [120, ]. It is possible that this is due to compensatory mechanisms that develop when AgRP neurons are compromised during early development [188]; 80
95 however, it is also possible that a subpopulation of AgRP neurons may be responsible for food intake, while another is critical for the control of RMR. Future studies utilizing a tamoxifen-inducible AgRP-cre to ablate AT 1A receptor expression in AgRP neurons of adult mice may help to elucidate the exact role of AgRP ANG signaling in the control of both food intake and RMR. Surprisingly, deletion of the AT 1A receptor from AgRP neurons led to significantly enhanced BAT SNA responses to ICV MTII. It is possible that this is due to lower than expected increases in MTII-induced BAT SNA in control littermates (Table 3). However, previous data suggests that leptin resistance causes impaired endogenous melanocortin tone, resulting in hyperactivation to exogenous melanocortin stimulation [186, ]. This would be consistent with our hypothesis that loss of ANG signaling causes hyperactivity of AgRP neurons, thus impairing endogenous melanocortin signaling and ultimately RMR. Seemingly, this may contradict our data demonstrating a loss of RMR responses AgRP-KO to peripheral αmsh treatment in AT 1A mice; however, we did not do a dose-response to examine the effect of αmsh on RMR. Thus, it will be critical to complete this in future studies or to utilize an established dose of central MT II to determine if the hyperactivity of AgRP neurons can be overcome by enhanced stimulation of central melanocortin signaling. In addition, it will be critical to increase the number of control littermates receiving ICV MTII to determine if AT AgRP-KO 1A mice truly exhibit elevated BAT SNA responses to MTII. AgRP-KO While the metabolic phenotypes of female AT 1A mice need to be more thoroughly investigated before definitive conclusions can be made, it is 81
96 interesting that they appear to be resistant to diet-induced obesity in preliminary AgRP-KO studies. Female AT 1A mice do not exhibit changes in food intake or digestive efficiency on chow or HFD suggesting normal total energy intake and supporting the hypothesis that they may exhibit changes in energy output. While AgRP-KO baseline physical activity is unknown, female AT 1A mice exhibit a slight increase in RMR. Despite attenuated RMR responses to αmsh, it is unknown how RMR changes in response to leptin or ANG. Previous research suggests that endogenous estrogen signaling promotes RMR [194]. It is possible that ANG inhibits estrogen signaling, thus the ablation of AT 1A receptors from AgRP neurons may disinhibit estrogen in female knockout mice to ultimately stimulate RMR. In contrast, it is well-established that estrogen can inhibit ANG signaling through the AT 1 receptor. Thus, it is possible that deletion of the AT 1A receptor AgRP-KO from AgRP neurons does not elicit a strong response in female AT 1A mice as endogenous estrogen may already inhibit ANG signaling in AgRP neurons. However, recent work suggests that estrogen receptor α is expressed on POMC, but not AgRP neurons [195]. As it is well-established that AgRP neurons have direct connections to POMC neurons, we hypothesize that loss of ANG signaling from AgRP neurons may impact the subsequent inhibition of POMC neurons, ultimately stimulating RMR [162, 196, 197]. In conclusion, our data demonstrate a critical requirement of the angiotensin AT 1A receptor, specifically localized to leptin-sensitive AgRP neurons, in the control of energy balance. Future work is required to determine the implications of altered brain ANG signaling in the development of selective 82
97 leptin resistance, and to more fully elucidate the role of an autocrine RAS within the ARC in RMR control. 83
 Body mass (A), fat mass (B), lean mass (C), and fluid mass (D) of male control (n=16 chow, 22 HFD) and AT 1A AgRP-KO mice (n=4 chow, 11 HFD) at 10 weeks of age.")
98 Figure 3.1 Male AT 1A AgRP-KO mice exhibit increased body and fat mass after HFD. (A-D) Body mass (A), fat mass (B), lean mass (C), and fluid mass (D) of male control (n=16 chow, 22 HFD) and AT 1A AgRP-KO mice (n=4 chow, 11 HFD) at 10 weeks of age. (E- H) Body mass (E), fat mass (F), lean mass (G), and fluid mass (H) of male control and AT 1A AgRP-KO mice on chow (n=18 control, 5 AT 1A AgRP-KO ) or after 10 weeks of 45% HFD treatment (n=20 control, 9 AT 1A AgRP-KO ). (I) Body mass of male control and AT 1A AgRP-KO mice on chow (n=18 control, 5 AT 1A AgRP-KO ) or HFD (n=17 control, 9 AT 1A AgRP-KO ). All data are mean ± SEM (*p < 0.05 vs. control HFD). 84
 Body mass (A), fat mass (B), lean mass (C), and fluid mass (D) of female control (n=21 chow, 7 HFD) and AT 1A AgRP-KO mice (n=4 chow, 6 HFD) at 10 weeks of age.")
99 Figure 3.2 Female AT 1A AgRP-KO mice exhibit decreased body and fat mass after HFD. (A-D) Body mass (A), fat mass (B), lean mass (C), and fluid mass (D) of female control (n=21 chow, 7 HFD) and AT 1A AgRP-KO mice (n=4 chow, 6 HFD) at 10 weeks of age. (E-H) Body mass (E), fat mass (F), lean mass (G), and fluid mass (H) of female control and AT 1A AgRP-KO mice on chow (23 control, 6 AT 1A AgRP-KO ) or after 10 weeks of 45% HFD treatment (n=7 control, 6 AT 1A AgRP-KO ). (I) Body mass of female control and AT 1A AgRP-KO mice on chow (n=25 control, 6 AT 1A AgRP-KO ) or HFD (n=7 control, 4 AT 1A AgRP-KO ). All data are mean ± SEM (*p < 0.05 vs. control HFD). 85
100 Figure 3.3 Energy balance in AT 1A AgRP-KO mice. (A-B) Food intake (A) and digestive efficiency (B) in male control and AT 1A AgRP-KO mice on chow (n=16 control, 4 AT 1A AgRP-KO ) or after HFD treatment (n=22 control, 12 AT 1A AgRP-KO ). (C-D) RER (C) and RMR (D) of male control (n=9) and AT 1A AgRP-KO mice (n=8) on chow. (E-F) Food intake (E) and digestive efficiency (F) in female control and AT 1A AgRP-KO mice on chow (n=12 control, 6 AT 1A AgRP-KO ) or after HFD treatment (n=7 control, 7 AT 1A AgRP-KO ). (G-H) RER (G) and RMR (H) of female control (n=12) and AT 1A AgRP-KO mice (n=8) on chow. All data are mean ± SEM (*p < 0.05). 86
101 Figure 3.4 BAT sympathetic nerve responses in male and female AT 1A AgRP-KO mice. (A) BAT β3-ar expression in AT 1A AgRP-KO and control littermates after 10 weeks of HFD (n=7/group). (B) Changes in BAT SNA in AT 1A AgRP-KO and control littermates following ICV administration of MTII (2 μg) (n=4/group). (C) Changes in BAT SNA in AT 1A AgRP-KO (n=5) and control littermates (n=4) following ICV administration of leptin (2 μg). (D) Changes in BAT SNA in the fourth hour after leptin administration in AT 1A LepR-KO mice (n=5) and control littermates (n=6; 60 μg IV leptin), and AT 1A AgRP-KO mice (n=5) and control littermates (n=4; 2 μg ICV leptin). All data presented as mean ± sem (*p<0.05). 87
102 Figure 3.5 RMR control in AT 1A AgRP-KO mice. (A) Changes in ANCOVA-adjusted RMR in response to i.p. administration of αmsh (4.5 μg/g) in control (n=13), AT 1A LepR-KO (n=7) and AT 1A AgRP-KO mice (n=9). All data are mean ± SEM (*p < 0.05). 88
103 Figure 3.6 Potential mediators of AT 1A signaling within the ARC of AT 1A AgRP-KO mice. (A-E) mrna for GAD1 (A), GAD2 (B), VGAT (C), AgRP (D), and NPY (E) in the ARC of male control (n=10) and AT 1A AgRP-KO mice (n=5) after chow. All data are mean ± SEM (*p < 0.05).). 89
104 Table 2 Tissue masses in AT 1A AgRP-KO mice and control littermates on chow and after ten weeks of HFD treatment. Chow HFD Control AT 1A AgRP-KO Control AT 1A AgRP-KO Body mass (g) Males 34.6 ± ± ± 1.1 * 47.4 ± 2.0 Females 25.4 ± ± ± 1.3 * 31.5 ± 1.6 BAT (mg) Males ± ± ± 9.5* ± 16.5 Females 65.1 ± ± ± 8.3* 67.9 ± 10.1 iwat (mg) Males 531 ± ± ± 96.3* ± Females ± ± ± 87.6* ± ewat (mg) Males ± ± ± 105.4* ± Females ± ± ± 161.9* ± Chow HFD Control AT 1A AgRP-KO Control AT 1A AgRP-KO Body mass (g) Males 34.6 ± ± ± 1.1 * 47.4 ± 2.0 Females 25.4 ± ± ± 1.3 * 31.5 ± 1.6 BAT (mg/g body mass) Males 3.2 ± ± ± ± 0.4 Females 2.5 ± ± ± 0.2 * 2.2 ± 0.3 iwat (mg/g body mass) Males 15.0 ± ± ± 1.9 * 45.7 ± 3.3 Females 19.1 ± ± ± 2.2 * 28.4 ± 2.6 ewat (mg/g body mass) Males 32.5 ± ± ± 2.5 * 58.4 ± 4.3 Females 29 ± ± 5.2 * 53.5 ± 4.3 * 49.7 ± 5.2 Brown adipose tissue (BAT); inguinal white adipose tissue (iwat); epididymal white adipose tissue (ewat) *p<0.05 vs chow control, p<0.05 vs chow AT AgRP-KO 1A, and p<0.07 vs HFD control 90
105 Table 3 Mean % BAT SNA (RVI) values to ICV MTII (2μg) over4 hours in AT 1A AgRP-KO mice and littermate controls. Control (n=2, 2 ) AT 1A AgRP-KO (n=3, 3 ) mean sem mean sem
106 CHAPTER IV: EXPRESSION OF ANGIOTENSIN II TYPE 1A (AT 1A ) RECEPTORS ON MICROGLIA IN NZ44 MICE Abstract The renin-angiotensin system (RAS) has been implicated in control of resting metabolic rate and blood pressure through its action at the angiotensin AT 1A receptor and thus may contribute to obesity-hypertension. Further, it has been shown that microglial activation is necessary for angiotensin-dependent hypertension and that microglial infiltration occurs following high fat diet (HFD) treatment. The expression of angiotensin AT 1 receptors on microglia is controversial; however, it has been suggested that expression of the AT 1 receptor may be induced upon microglial activation. To investigate the expression of AT 1A receptors on microglia under chow and HFD-fed conditions, we stained brain tissue from NZ44 mice, which express green fluorescent protein (GFP) via the AT 1A promoter, with ionized calcium binding adaptor molecule 1 (IBA1) conjugated to a red fluorescent protein. Under both standard chow and HFD conditions, we observed a substantial number of singly-fluorescent cells in the subfornical organ (SFO), paraventricular nucleus (PVN), dorsomedial hypothalamus (DMH), ventromedial hypothalamus (VMH), lateral hypothalamus (LH), nucleus tractus solitarii (NTS) and arcuate nucleus (ARC). However, we did not observe any dual fluorescent cells in these brain regions under either chow or HFD-fed conditions. Taken together, these data support the conclusion that 92
107 microglia do not express the AT 1A receptor under baseline conditions or in response to eight weeks of HFD treatment. Introduction As detailed in chapter I, the renin-angiotensin system (RAS) exhibits a critical role in both hypertension and obesity. In addition to its effects on fluid balance, blood pressure (BP) and metabolism, elevation of the RAS promotes inflammation both peripherally and centrally. Previous research demonstrated that systemic angiotensin II (ANG) administration upregulated expression of proinflammatory cytokines, including TNF-α, IL-1β and IL-6, in the brain. Blockade of the AT 1 receptor prevented the increased expression of proinflammatory cytokines caused by systemic ANG administration [198]. Further, sra mice, exhibit increased proinflammatory cytokine expression, and increased activation and infiltration of microglia in the brain [199]. Taken together, these data support the idea that through its action at AT 1 receptors, ANG promotes inflammation in the brain. Obese animals exhibit increased RAS activity, as well as increased levels of ANG and AT 1 receptor expression in the hypothalamus [72, 200]. In addition, high fat diet (HFD) intake significantly increases hypothalamic inflammation, which is elevated after only three days of HFD exposure, prior to any weight or fat mass gain. Interestingly, the brain exhibits a concomitant increase in the number and activation of microglia in both the arcuate nucleus (ARC) and paraventricular nucleus (PVN) [201]. Obese humans also exhibit gliosis in the 93
108 mediobasal hypothalamus as determined by MRI [202]. Therefore, it is possible that the infiltration and activation of microglia plays a role in the pathogenesis of obesity. Obesity is a major risk factor for the development of hypertension, however the mechanism by which obesity directly increases BP is still unknown. It has been suggested that obesity-induced elevation in the RAS could underlie the pathogenesis of obesity-hypertension [203]. Intriguingly, ANG-induced hypertension is attenuated with intracebroventricular (ICV) administration of minocycline, a broad-spectrum antibiotic that inhibits the activation of microglia. However, minocycline also prevents ANG-induced plasma norepinephrine and proinflammatory factors such as reactive oxygen species and TNFα, thus it is difficult to attribute the attenuation of ANG-induced hypertension directly to the activity of microglia. Overexpression of IL-10, an anti-inflammatory cytokine, in the PVN also attenuates ANG-induced hypertension supporting a role for cytokines in the pathogenesis of hypertension [204]. Interestingly, Xue et al. demonstrated that three weeks of HFD diet treatment in rats exacerbated the BP response to peripheral ANG, which was attenuated by ICV inhibition of microglia, TNFα or AT 1 receptors [205]. Furthermore, the sensitization to ANG hypertension by HFD appears to be mediated by leptin as ICV leptin mimicked the elevation of ANG hypertension by HFD alone and an ICV leptin antagonist prevented the HFD-induced BP sensitization to ANG [206]. Taken together, it is possible that obesity increases ANG in the brain, thus activating microglia to produce proinflammatory cytokines, ultimately causing an increase in BP. 94
109 It remains unclear whether ANG can act directly on microglia as expression of AT 1 or AT 2 receptors is controversial. Biancardi et al. suggest that isolated hypothalamic microglia express AT 1A mrna and that mice with ablation of AT 1A in Sim1 positive cells respond to ANG treatment with an increase in ROS, which is completely ablated following treatment with minocycline, while Li et al. suggest that expression of ANG and its receptors are progressively reduced with the transformation of amoeboid microglial cells into mature microglia [207, 208]. The use of genetic mouse models and in situ hybridization further support the idea that ANG receptors are expressed on neurons, but not microglia, under normal conditions [65, 149]. It is possible that neurons expressing ANG receptors release proinflammatory factors that promote the infiltration of microglia to the brain. In contrast, the expression of ANG receptors on microglia may be induced under pathophysiological conditions. Previous data suggests that both AT 1 and AT 2 receptors are expressed in activated microglia one week after ischemic brain injury [209]; however, it remains unknown whether this occurs following consumption of HFD. Herein we examine whether AT 1A receptors are expressed on microglia under chow or HFD fed conditions. Specifically, we document that AT 1A receptors are not expressed on microglia after chow or eight weeks of HFD consumption. Methods Animal subjects NZ44 mice backcrossed onto the C57BL/6J background (originally derived by the GENSAT Project at the Rockefeller University) were obtained from Teresa 95
110 Milner s laboratory at Weill Cornell Medical College [149]. At ten weeks of age, mice were maintained on standard chow diet or placed on 45% HFD for eight weeks. Immunohistochemistry Brain tissue used for immunohistochemistry was perfused with 4% PFA and incubated in 30% sucrose. Coronal sections (40 um) were cut using a frozen sledge microtome (American Optical Scientific Instruments) and primary antibodies were added to free-floating sections at 4 C overnight. After washing with 1X PBS, secondary antibodies were added at room temperature for one hour. All sections were mounted onto microscopy slides and viewed using a Nikon Labophot 2 microscope. Primary antibodies: Chicken GFP (Aves Lab Inc, GFP-1010); Iba1 (Wako). Secondary antibodies: Alexa Fluor 488 goat antichicken (Life Technologies, A11039), Alexa Fluor 568 goat anti-rabbit. Results To overcome the lack of specificity of AT 1A receptor antibodies, we utilized a bacterial artificial chromosome (BAC) transgenic mouse model that expresses GFP via the AT 1A promoter (NZ44 mice) to examine if microglia express AT 1A receptors under baseline, chow fed conditions. Immunohistochemistry staining for ionized calcium binding adaptor molecule 1 (Iba1) was done in brain tissue from NZ44 mice to determine if microglia express the AT 1A receptor. While there was abundant staining of cells expressing AT 1A or cells expressing Iba1 in the 96
111 subfornical organ (SFO), paraventricular nucleus (PVN), dorsomedial hypothalamus (DMH), ventromedial hypothalamus (VMH), lateral hypothalamus (LH), nucleus tractus solitarii (NTS) and arcuate nucleus (ARC) (Figure 4.1), we did not observe any cells that exhibited coexpression of AT 1A and Iba1 in any brain region. Consistent with previous studies, these data suggest that under baseline, chow fed conditions microglia do not express AT 1A in the examined brain regions. It has been previously shown that HFD treatment increases the activation and infiltration of microglia in the brain, particularly in the hypothalamus [201]. To determine if HFD consumption induces the expression of AT 1A in microglia, we exposed NZ44 mice to 45% HFD (OpenSource D12451). After eight weeks of HFD treatment, NZ44 mice gained significant weight similar to NZ44- animals, resulting in increased expression of RAS signaling components, including AT 1A receptor and angiotensin converting enzyme (ACE) (Figure 4.2). Similar to chowfed NZ44 mice, HFD-fed mice exhibited numerous cells expressing AT 1A or Iba1, but we did not observe any cells expressing both in the SFO, PVN, DMH, VMH, LH, NTS or ARC (Figure 4.3). Taken together, these data support the idea that HFD consumption and significant weight gain does not induce expression of AT 1A receptors on microglia in NZ44 mice. Discussion Here we used the NZ44 mouse model to examine whether microglia express the ANG AT 1A receptor. Consistent with previous studies done using 97
112 genetic mouse models or in situ hybridization, we did not observe expression of AT 1A receptors on microglia under normal, chow-fed conditions [149]. While it has been suggested that expression of ANG receptors may be induced under pathophysiological conditions, eight weeks of HFD did not stimulate the expression of the AT 1A receptor on microglia in NZ44 mice. These data support the concept that ANG signals through neurons to release proinflammatory factors which promote the infiltration and activation of microglia during obesity. Consistent with our florescent immunohistochemistry data, Gonzalez et al. utilized light and electron microscopy to demonstrate that cells expressing AT 1A exhibited the morphology of neurons in NZ44 mice [149]. Despite this, it is possible that the BAC transgenic model is not consistent with in vivo endogenous expression of AT 1A. However, de Kloet et al. recently demonstrated that a BAC transgenic mouse expressing GFP via the AT 2 promoter colocalized with expression of AT 2 receptors identified by RNA in situ hybridization [65]. Further, the distribution of AT 1A receptor expression in the NZ44 mouse is consistent with previous studies using ANG binding or in situ hybridization [139, 141, ]. While microglia in mice may not express the AT 1A receptor under normal physiological conditions, it is possible that higher species do as the differences between mouse and human microglia are well-documented [214]. Further, as we did not investigate the expression of AT 1A on astrocytes, it is possible that some of the AT 1A positive cells are not neurons, but astrocytes. Previous studies have identified expression of ANG receptors on astrocytes and it is well-established that astrocytes are the primary source of angiotensinogen within the brain, 98
113 presenting the possibility that autocrine/paracrine ANG signaling could occur within these cells [ ]. While it has been previously shown that eight weeks of 60% HFD consumption is sufficient to induce activation and infiltration of microglia in the hypothalamus, it is possible that this is not enough time to induce the expression of AT 1A receptors on microglia [201]. Further, while eight weeks of 45% HFD treatment induces expression of RAS signaling components, such as angiotensin converting enzyme and AT 1A receptors in the ARC (Figure 4.2), it is possible that this is not enough time to induce hypertension. Thus, it would be interesting to investigate the expression of AT 1A receptors on microglia in response to a pressor dose of ICV ANG. Further, investigating the expression of ANG receptors on microglia in higher species following obesity-hypertension would be of interest. The data presented here suggests that consumption of HFD and the subsequent increase in fat and body mass does not modulate the expression of AT 1A receptors on microglia in NZ44 mice. Future studies determining the contribution of microglia to obesity-hypertension should be done as targeting microglia would present a novel therapeutic option for the treatment of obesity and/or hypertension. 99
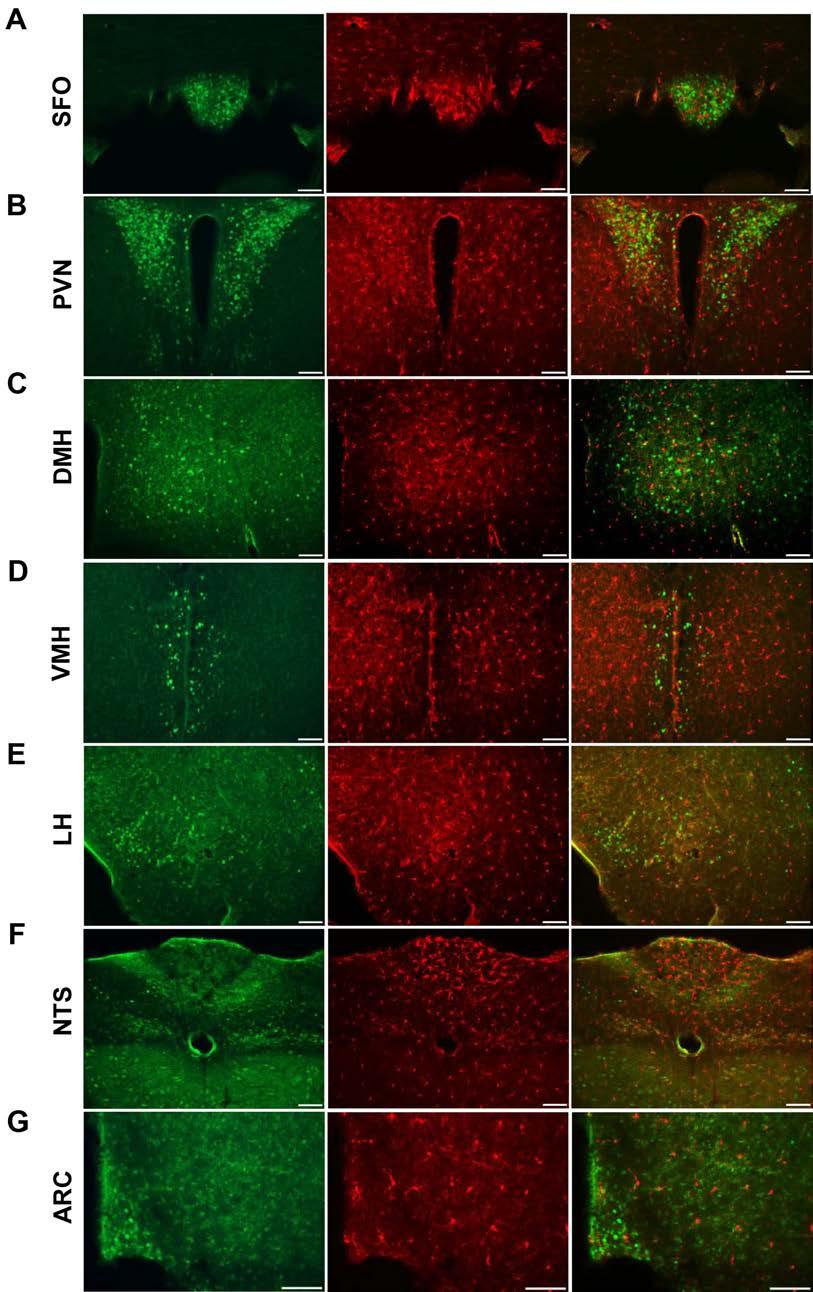
114 100
115 Figure 4.1 AT 1A receptors do not localize to microglia under baseline conditions. (A-G) Representative photomicrographs of AT 1A receptor and microglia in the SFO (A), PVN (B), DMH (C), VMH (D), LH (E), NTS (F), and ARC (G) under chow-fed conditions. 101
116 Figure 4.2 NZ44 mice exhibit weight gain and increased ARC RAS expression after HFD treatment. (A) Body mass in male and female control (n= 20 males, 7 females) and NZ44+ mice (n=7 males, 3 females) after consumption of 45% HFD. (B) Expression of AT 1A (n=6/group) and ACE (n=9 chow, 5 HFD) after eight weeks of HFD treatment. All data are mean ± SEM (*p < 0.05). 102
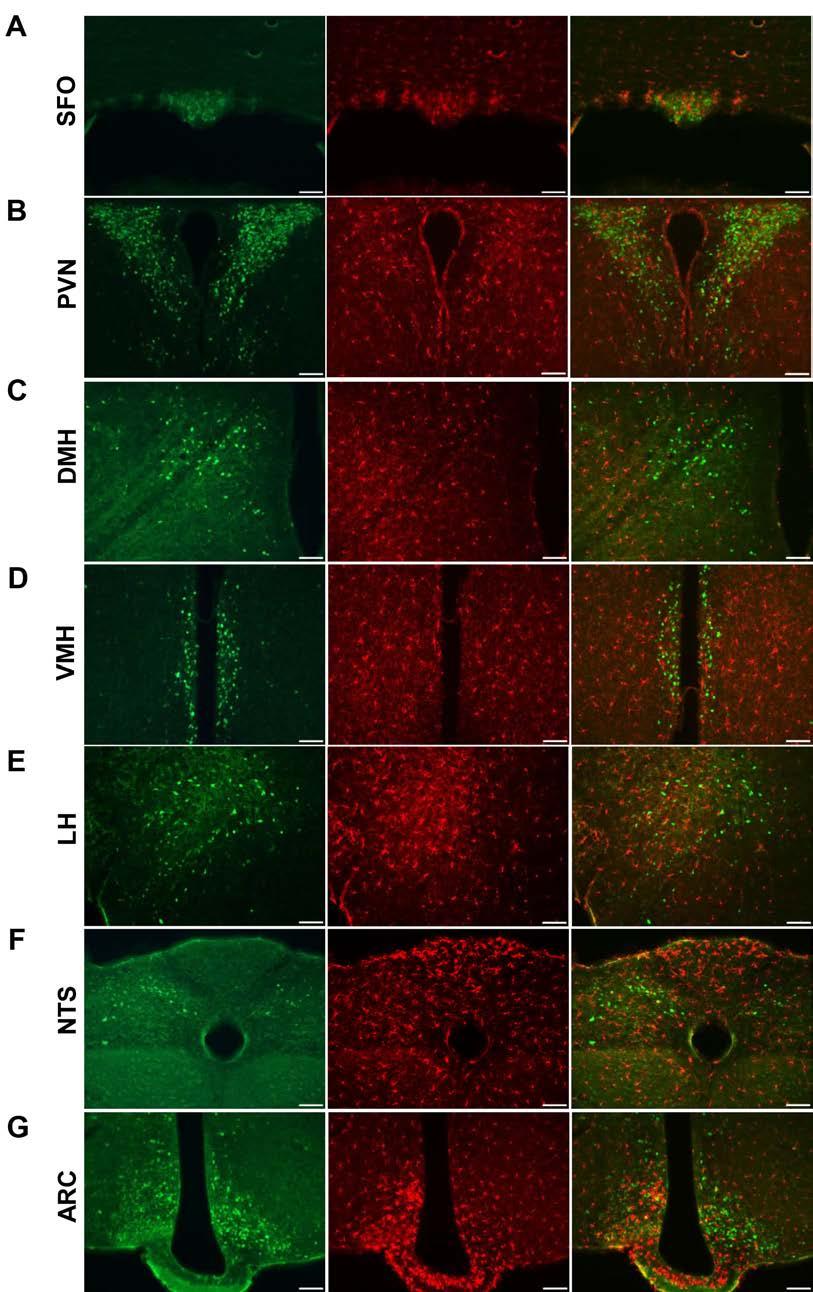
117 103
BIOL212 Biochemistry of Disease. Metabolic Disorders - Obesity
 BIOL212 Biochemistry of Disease Metabolic Disorders - Obesity Obesity Approx. 23% of adults are obese in the U.K. The number of obese children has tripled in 20 years. 10% of six year olds are obese, rising
CNS Control of Food Intake. Adena Zadourian & Andrea Shelton
 CNS Control of Food Intake Adena Zadourian & Andrea Shelton Controlling Food Intake Energy Homeostasis (Change in body adiposity + compensatory changes in food intake) Background Information/Review Insulin
Chapter 12. Ingestive Behavior
 Chapter 12 Ingestive Behavior Drinking a. fluid compartments b. osmometric thirst c. volumetric thirst Eating a. energy sources b. starting a meal c. stopping a meal d. eating disordersd Drinking a. fluid
Insulin-Leptin Interactions
 Insulin-Leptin Interactions Ahmed S., Al-Azzam N., Cao B. Karshaleva B., Sriram S., Vu K. If you understand a system, you can predict it. Agenda - Energy homeostasis Overview of leptin and insulin Signaling
Hormones. Prof. Dr. Volker Haucke Institut für Chemie-Biochemie Takustrasse 6
 Hormones Prof. Dr. Volker Haucke Institut für Chemie-Biochemie Takustrasse 6 Tel. 030-8385-6920 (Sekret.) 030-8385-6922 (direkt) e-mail: vhaucke@chemie.fu-berlin.de http://userpage.chemie.fu-berlin.de/biochemie/aghaucke/teaching.html
Bi156 lecture 2, 1/6/12. Eating and weight regulation
 Bi156 lecture 2, 1/6/12 Eating and weight regulation Introduction: weight regulation in an affluent society In our society much effort and money is expended on regulation of weight. Failure to maintain
Angiotensin AT 1A receptors on leptin receptor expressing cells control resting metabolism
 Angiotensin receptors on leptin receptor expressing cells control resting metabolism Kristin E. Claflin,, Kamal Rahmouni, Justin L. Grobe J Clin Invest. 2017;127(4):1414-1424. https://doi.org/10.1172/jci88641.
Monday, 17 April 2017 BODY FLUID HOMEOSTASIS
 Monday, 17 April 2017 BODY FLUID HOMEOSTASIS Phenomenon: shipwrecked sailor on raft in ocean ("water, water everywhere but not a drop to drink") Why are the sailors thirsty? (What stimulated thirst?) Why
Neurophysiology of the Regulation of Food Intake and the Common Reward Pathways of Obesity and Addiction. Laura Gunter
 Neurophysiology of the Regulation of Food Intake and the Common Reward Pathways of Obesity and Addiction Laura Gunter The Brain as the Regulatory Center for Appetite The brain is the integration center
Leptin and the Central Nervous System Control of Glucose Metabolism
 Physiol Rev 91: 389 411, 2011; doi:10.1152/physrev.00007.2010. Leptin and the Central Nervous System Control of Glucose Metabolism GREGORY J. MORTON AND MICHAEL W. SCHWARTZ Diabetes and Obesity Center
Leptin Intro/Signaling. ATeamP: Angelo, Anthony, Charlie, Gabby, Joseph
 Leptin Intro/Signaling ATeamP: Angelo, Anthony, Charlie, Gabby, Joseph Overview Intro to Leptin Definition & Sources Physiology Bound vs. Free Receptors Signaling JAK/STAT MAPK PI3K ACC Experimental findings
Peripubertal, leptin-deficient ob/ob female mice were used in an investigation of
 ESSICK-BROOKSHIRE, ELIZABETH ANN, M.S. The Effects of Peripherally Administered 17-β Estradiol and BIBP3226, a NPY Y1 Receptor Antagonist, on Food Intake, Body Mass, Reproductive Development and Behavior
Figure 1: The leptin/melanocortin pathway Neuronal populations propagate the signaling of various molecules (leptin, insulin, ghrelin) to control
 to control") Leptin Deficiency Introduction The leptin/melanocortin pathway plays a key role in the hypothalamic control of food intake. It is activated following the systemic release of the adipokine leptin (LEP)
Leptin Deficiency Introduction The leptin/melanocortin pathway plays a key role in the hypothalamic control of food intake. It is activated following the systemic release of the adipokine leptin (LEP)
Motivation 1 of 6. during the prandial state when the blood is filled
 Motivation 1 of 6 I. INTRODUCTION A. Motivation: a condition (usually internal) that initiates, activates, or maintains goal-directed behavior. B. Archery analogy 1. undrawn bow has no potential energy
Copyright 2017 The Guilford Press
 This is a chapter excerpt from Guilford Publications. Eating Disorders and Obesity: A Comprehensive Handbook, Third Edition. Edited by Kelly D. Brownell and B. Timothy Walsh. Copyright 2017. Purchase this
Leptin-Insulin Signaling in the Brain. BY TEAM CEPHALIC Aman Hamdard, Kevin Artiga, Megan Imreh, Ronald Baldonado, and Sharri Mo
 Leptin-Insulin Signaling in the Brain BY TEAM CEPHALIC Aman Hamdard, Kevin Artiga, Megan Imreh, Ronald Baldonado, and Sharri Mo Agenda Leptin in the Hypothalamus: Pathways and Roles Cross-talk between
Hypertension Compendium
 Hypertension Compendium Circulation Research Compendium on Hypertension The Epidemiology of Blood Pressure and Its Worldwide Management Genetic and Molecular Aspects of Hypertension Hypertension: Renin
Homeostasis and Mechanisms of Weight Regulation
 Homeostasis and Mechanisms of Weight Regulation Purpose In this activity students will investigate how negative feedback mechanisms function to maintain homeostatic balance using a recently discovered
Internal Regulation II Energy
 Internal Regulation II Energy Reading: BCP Chapter 16 lookfordiagnosis.com Homeostasis Biologically, what is necessary for life is a coordinated set of chemical reactions. These reactions take place in
Ingestive Behavior: Feeding & Weight Regulation. Hypovolemic vs. Osmotic Thirst
 Ingestive Behavior: Feeding & Weight Regulation 1 Hypovolemic Thirst Receptors, CNS, Responses Salt Appetite Digestive components Glucose Homeostasis: Insulin & Glucagon Diabetes Mellitus 1 & 2 CNS Hypothalamic
Temperature, Regulation, Thirst, and Hunger
 PSYB64 Lecture 6 Temperature, Regulation, Thirst, and Hunger 1. Homeostasis 2. Temperature 3. Thirst 4. Hunger 5. Obesity & Hunger Disorders HOMEOSTASIS Homeostasis: Physiological equilibrium Motivation:
FLASH CARDS. Kalat s Book Chapter 10 Alphabetical
 FLASH CARDS www.biologicalpsych.com Kalat s Book Chapter 10 Alphabetical AgRP AgRP Agouti-related peptide; synthesized in hypothalamus. Acts as an appetite stimulator. Also decreases metabolism. aldosterone
An important function of the central nervous
 Perspectives in Diabetes Insulin Signaling in the Central Nervous System A Critical Role in Metabolic Homeostasis and Disease From C. elegans to Humans Daniel Porte, Jr., 1,2,3 Denis G. Baskin, 3 and Michael
SH2B1 Regulates Insulin Sensitivity and Glucose Homeostasis by Multiple Mechanisms. David L. Morris
 SH2B1 Regulates Insulin Sensitivity and Glucose Homeostasis by Multiple Mechanisms by David L. Morris A dissertation submitted in partial fulfillment of the requirements for the degree of Doctor of Philosophy
THE ROLE OF DIETARY FAT IN HYPOTHALAMIC INSULIN AND LEPTIN RESISTANCE AND THE PATHOGENESIS OF OBESITY. Kelly Ann Posey.
 THE ROLE OF DIETARY FAT IN HYPOTHALAMIC INSULIN AND LEPTIN RESISTANCE AND THE PATHOGENESIS OF OBESITY By Kelly Ann Posey Dissertation Submitted to the Faculty of the Graduate School of Vanderbilt University
The role of leptin receptor signaling in feeding and neuroendocrine function
 Review TRENDS in Endocrinology and Metabolism Vol.14 No.10 December 2003 447 The role of leptin receptor signaling in feeding and neuroendocrine function Sarah H. Bates and Martin G. Myers Jr Research
Nature Neuroscience: doi: /nn Supplementary Figure 1. Visualization of AT1a-positive cells using AT1a lacz/+ mouse.
 Supplementary Figure 1 Visualization of AT1a-positive cells using AT1a lacz/+ mouse. (a f) Immunohistochemical detection of β-gal in the mouse brain. Coronal sections at the respective anteroposterior
THE ROLE OF ENDOCANNABINOID RECEPTOR ACTIVITY IN YOUNG AND AGED RATS WITH HIGH-FAT FEEDING
 THE ROLE OF ENDOCANNABINOID RECEPTOR ACTIVITY IN YOUNG AND AGED RATS WITH HIGH-FAT FEEDING By MELANIE KAE JUDGE A DISSERTATION PRESENTED TO THE GRADUATE SCHOOL OF THE UNIVERSITY OF FLORIDA IN PARTIAL FULFILLMENT
BEIGE AND BROWN FAT: BASIC BIOLOGY AND NOVEL THERAPEUTICS Dr. Carl Ascoli
 BEIGE AND BROWN FAT: BASIC BIOLOGY AND NOVEL THERAPEUTICS Dr. Carl Ascoli Symposium Co-Chairs: Bruce M. Spiegelman (Harvard/Dana Farber) and Sven Enerbäck (U.Gothenburg) April 17-23, 2015 Snowbird Resort,
Supplementary Figure 1) GABAergic enhancement by leptin hyperpolarizes POMC neurons A) Representative recording samples showing the membrane
 GABAergic enhancement by leptin hyperpolarizes POMC neurons A) Representative recording samples showing the membrane") Supplementary Figure 1) GABAergic enhancement by leptin hyperpolarizes POMC neurons A) Representative recording samples showing the membrane potential recorded from POMC neurons following treatment with
Supplementary Figure 1) GABAergic enhancement by leptin hyperpolarizes POMC neurons A) Representative recording samples showing the membrane potential recorded from POMC neurons following treatment with
Leptin part 2. Mary ET Boyle
 Leptin part 2 Mary ET Boyle Leptin Feedback: leptin levels drop during starvation, when fat depots are depleted to support the organism s basic energy needs, leptin levels rise during refeeding where fat
Chapter 1. General introduction. Part of this chapter is adapted from Adan et.al., Br.J.Pharmacol. 2006;149:815
 Chapter 1 General introduction Part of this chapter is adapted from Adan et.al., Br.J.Pharmacol. 2006;149:815 Chapter 1 B. Tiesjema, 2007 GENERAL INTRODUCTION NEURAL CIRCUITS INVOLVED IN ENERGY BALANCE
UNRAVELING NOVEL LEPTIN-DEPENDENT SIGNALING PATHWAYS IN THE BASOMEDIAL HYPOTHALAMUS. Eneida Cristina Villanueva
 UNRAVELING NOVEL LEPTIN-DEPENDENT SIGNALING PATHWAYS IN THE BASOMEDIAL HYPOTHALAMUS by Eneida Cristina Villanueva A dissertation submitted in partial fulfillment of the requirements for the degree of Doctor
Hypothalamus. Small, central, & essential.
 Hypothalamus Small, central, & essential. Summary: You can t live without a hypothalamus. Located at the junction between the brain stem and the forebrain Medial hypothalamus: interface between the brain
Amylinergic control of food intake in lean and obese rodents
 Zurich Open Repository and Archive University of Zurich Main Library Winterthurerstr. 190 CH-8057 Zurich www.zora.uzh.ch Year: 2011 Amylinergic control of food intake in lean and obese rodents Boyle, C
Blood pressure control Contin. Reflex Mechanisms. Dr. Hiwa Shafiq
 Blood pressure control Contin. Reflex Mechanisms Dr. Hiwa Shafiq 17-12-2018 A. Baroreceptor reflexes Baroreceptors (stretch receptors) located in the walls of several large systemic arteries( specially
Ghrelin mediates stressinduced. behavior in mice. Chuang et al 2011 L3: Love, Lust, Labor
 Ghrelin mediates stressinduced food-reward behavior in mice Chuang et al 2011 L3: Love, Lust, Labor Agenda Introduction What is Ghrelin? Previous Models New model Methods Results Discussion Conclusion
Ingestive Behaviors 21. Introduction. Page 1. control and story lines. (a review of general endocrinology) Integration (or the basic reflex arc model)
 Integration (or the basic reflex arc model)") Ingestive Behaviors 21 (a review of general endocrinology) A neuroendocrine system: components, a reflex arc, the endocrine system, the AN, endocrine / nervous systems as afferents and efferents, the theoretical
Ingestive Behaviors 21 (a review of general endocrinology) A neuroendocrine system: components, a reflex arc, the endocrine system, the AN, endocrine / nervous systems as afferents and efferents, the theoretical
Νευροφυσιολογία και Αισθήσεις
 Biomedical Imaging & Applied Optics University of Cyprus Νευροφυσιολογία και Αισθήσεις Διάλεξη 16 Κίνητρα Συμπεριφοράς ή Υποκίνηση (Motivation) Introduction Types of behavior Unconscious reflexes Voluntary
Molecular pathways linking metabolic inflammation and thermogenesis G. Solinas Summary
 Published in "" which should be cited to refer to this work. Molecular pathways linking metabolic inflammation and thermogenesis G. Solinas http://doc.rero.ch Laboratory of Metabolic Stress Biology, Division
Method of leptin dosing, strain, and group housing influence leptin sensitivity in high-fat-fed weanling mice
 Am J Physiol Regul Integr Comp Physiol 284: R87 R100, 2003; 10.1152/ajpregu.00431.2002. Method of leptin dosing, strain, and group housing influence leptin sensitivity in high-fat-fed weanling mice HEATHER
Investigation of the role of nesfatin-1/nucb2 in the central nervous system. Ph.D. thesis Katalin Könczöl
 Investigation of the role of nesfatin-1/nucb2 in the central nervous system Ph.D. thesis Katalin Könczöl Semmelweis University János Szentágothai Doctoral School of Neurosciences Supervisor: Official reviewers:
Neurobiology of food intake in health and disease
 Neurobiology of food intake in health and disease Gregory J. Morton, Thomas H. Meek and Michael W. Schwartz Abstract Under normal conditions, food intake and energy expenditure are balanced by a homeostatic
In The Name Of God. In The Name Of. EMRI Modeling Group
 In The Name Of God In The Name Of God EMRI Modeling Group Cells work together in functionally related groups called tissues Types of tissues: Epithelial lining and covering Connective support Muscle movement
Chapter Nine. Temperature Regulation, Thirst, and Hunger
 Chapter Nine Temperature Regulation, Thirst, and Hunger Regulating Systems Homeostasis: Physiological equilibrium Epic FAIL with weight? Obesity rates 1980-2000 Motivation: Activating and directing behavior
Blood Pressure Fox Chapter 14 part 2
 Vert Phys PCB3743 Blood Pressure Fox Chapter 14 part 2 T. Houpt, Ph.D. 1 Cardiac Output and Blood Pressure How to Measure Blood Pressure Contribution of vascular resistance to blood pressure Cardiovascular
Regulation of Arterial Blood Pressure 2 George D. Ford, Ph.D.
 Regulation of Arterial Blood Pressure 2 George D. Ford, Ph.D. OBJECTIVES: 1. Describe the Central Nervous System Ischemic Response. 2. Describe chemical sensitivities of arterial and cardiopulmonary chemoreceptors,
Central insulin action regulates peripheral glucose and fat metabolism in mice
 Research article Central insulin action regulates peripheral glucose and fat metabolism in mice Linda Koch, 1 F. Thomas Wunderlich, 1 Jost Seibler, 2 A. Christine Könner, 1 Brigitte Hampel, 1 Sigrid Irlenbusch,
Molecular and Physiological Adaptations to Weight Perturbation in Mice. Yann Ravussin. Submitted in partial fulfillment of the
 Molecular and Physiological Adaptations to Weight Perturbation in Mice Yann Ravussin Submitted in partial fulfillment of the requirements for the degree of Doctor of Philosophy under the Executive Committee
Role of the ventromedial hypothalamic Steroidogenic Factor 1/ Adrenal 4. glucose metabolism in mice.
 Role of the ventromedial hypothalamic Steroidogenic Factor 1/ Adrenal 4 Binding Protein neurons in the regulation of whole body energy and glucose metabolism in mice. Eulalia Coutinho Department of Physiological
In the name of GOD. Animal models of cardiovascular diseases: myocardial infarction & hypertension
 In the name of GOD Animal models of cardiovascular diseases: myocardial infarction & hypertension 44 Presentation outline: Cardiovascular diseases Acute myocardial infarction Animal models for myocardial
Mary ET Boyle, Ph. D. Department of Cognitive Science UCSD
 Mary ET Boyle, Ph. D. Department of Cognitive Science UCSD Is obesity a brain disorder? What is the evidence to support obesity is a brain disorder? Environmental, biological, and behavioral issues Over
Energy flow in the organism
 I. Parameters of energy metabolism, basal metabolic rate, measurements. II. Control of food intake, hunger and satiety Péter Sántha, 12.02. 2017. Energy flow in the organism NUTRIENTS PHYSICAL WORK HEAT
Chapter 24 Cholesterol, Energy Balance and Body Temperature. 10/28/13 MDufilho
 Chapter 24 Cholesterol, Energy Balance and Body Temperature 10/28/13 MDufilho 1 Metabolic Role of the Liver Hepatocytes ~500 metabolic functions Process nearly every class of nutrient Play major role in
Chronic Stimulation of Leptin on Food Intake and Body Weight after Microinjection into the Ventromedial Hypothalamus of Conscious Rats
 TAJ December 2006; Volume 19 Number 2 ISSN 1019-8555 The Journal of Teachers Association RMC, Rajshahi Original Article Chronic Stimulation of Leptin on Food Intake and Body Weight after Micro into the
Angiotensin IV and the Molecular Mechanisms Involved in the Development of Insulin Resistance in 3T3-L1 Adipocytes
 University of Tennessee, Knoxville Trace: Tennessee Research and Creative Exchange Masters Theses Graduate School 8-2011 Angiotensin IV and the Molecular Mechanisms Involved in the Development of Insulin
Browning of white adipose tissue: role of hypothalamic signaling
 Ann. N.Y. Acad. Sci. ISSN 0077-8923 ANNALS OF THE NEW YORK ACADEMY OF SCIENCES Issue: Understanding Adipogenesis and Functions of Brown Fat Browning of white adipose tissue: role of hypothalamic signaling
Supplementary Figure 1
 Supplementary Figure 1 how HFD how HFD Epi WT p p Hypothalamus p p Inguinal WT T Liver Lean mouse adipocytes p p p p p p Obese mouse adipocytes Kidney Muscle Spleen Heart p p p p p p p p Extracellular
Management of Obesity. Objectives. Background Impact and scope of Obesity. Control of Energy Homeostasis Methods of treatment Medications.
 Medical Management of Obesity Ben O Donnell, MD 1 Objectives Background Impact and scope of Obesity Control of Energy Homeostasis Methods of treatment Medications 2 O'Donnell 1 Impact of Obesity According
LESSON 3.3 WORKBOOK. How do we decide when and how much to eat?
 Appetite The psychological desire to eat, driven by feelings of pleasure from the brain. Hunger The biological or physiological need to eat, caused by a release of hormones from the digestive tract. LESSON
Obesity in aging: Hormonal contribution
 Obesity in aging: Hormonal contribution Hormonal issues in obesity and aging Hormonal role in regulation of energy balance Genetic component in hormonal regulation Life style contribution to hormonal changes
Ingestive Behaviors 33. Introduction. Page 1. control and story lines. (a review of general endocrinology) Integration (or the basic reflex arc model)
 Integration (or the basic reflex arc model)") Ingestive Behaviors 33 (a review of general endocrinology) A neuroendocrine system: components, a reflex arc, the endocrine system, the AN, endocrine / nervous systems as afferents and efferents, the theoretical
Ingestive Behaviors 33 (a review of general endocrinology) A neuroendocrine system: components, a reflex arc, the endocrine system, the AN, endocrine / nervous systems as afferents and efferents, the theoretical
Hypertension in obesity: is leptin the culprit?
 Review Special issue: neural control of appetite Hypertension in obesity: is leptin the culprit? Stephanie E. Simonds and Michael A. Cowley Monash Obesity & Diabetes Institute, Department of Physiology,
Fatty Acid Induced Insulin Resistance in the Brain
 Utah State University DigitalCommons@USU All Graduate Theses and Dissertations Graduate Studies 5-2013 Fatty Acid Induced Insulin Resistance in the Brain Hyoung Il Oh Utah State University Follow this
Supplementary Figure 1
 Supplementary Figure 1 Arcuate ChIEF-tdTomato neurons expressed TH These micrographs show that TH-Cre-ChIEF-tdTomato (magenta), expressed by AAV in a TH-Cre mouse, were immunostained with TH (green) in
Therefore MAP=CO x TPR = HR x SV x TPR
 Regulation of MAP Flow = pressure gradient resistance CO = MAP TPR Therefore MAP=CO x TPR = HR x SV x TPR TPR is the total peripheral resistance: this is the combined resistance of all blood vessels (remember
MBB317. Dr D MANGNALL OBESITY. Lecture 2
 MBB317 Dr D MANGNALL OBESITY Lecture 2 When the structure of the insulin receptor was first discovered it was assumed that the active beta subunit tyrosine kinase would phosphorylate some intracellular
The Physiology of Weight Regulation: Implications for Effective Clinical Care
 Roundtable on Obesity Solutions The Physiology of Weight Regulation: Implications for Effective Clinical Care Lee M. Kaplan, MD, PhD Obesity, Metabolism & Nutrition Institute Massachusetts General Hospital
Low ambient temperature lowers cholecystokinin and leptin plasma concentrations in adult men
 ISPUB.COM The Internet Journal of Gastroenterology Volume 7 Number 2 Low ambient temperature lowers cholecystokinin and leptin plasma concentrations in adult men M Pizon, P Tomasic, K Sztefko, Z Szafran
CHAPTER 15 LECTURE OUTLINE
 CHAPTER 15 LECTURE OUTLINE I. INTRODUCTION A. The autonomic nervous system (ANS) regulates the activity of smooth muscle, cardiac muscle, and certain glands. B. Operation of the ANS to maintain homeostasis,
THE ROLE OF INSULIN RECEPTOR SIGNALING IN THE BRAIN. COGS 163 By: Pranav Singh Alexandra Villar
 THE ROLE OF INSULIN RECEPTOR SIGNALING IN THE BRAIN COGS 163 By: Pranav Singh Alexandra Villar INTRODUCTION Insulin is a hormone produced in the pancreas by the islets of Langerhans that regulates the
Central nervous system control of food intake
 insight review article Central nervous system control of food intake Michael W. Schwartz*, Stephen C. Woods, Daniel Porte Jr*, Randy J. Seeley & Denis G. Baskin* Departments of Medicine* and Biological
Obesity D R. A I S H A H A L I E K H Z A I M Y
 Obesity D R. A I S H A H A L I E K H Z A I M Y Objectives Definition Pathogenesis of obesity Factors predisposing to obesity Complications of obesity Assessment and screening of obesity Management of obesity
! acts via the autonomic nervous system. ! maintaining body weight within tight limits. ! ventromedial (VMN) ! arcuate (ARC) ! neuropeptide Y (NPY)
 ! arcuate (ARC) ! neuropeptide Y (NPY)") Brain Regulates energy homeostatis Glucose Sensing in the Brain Seminar 2012 Gareth Price! acts in response to circulating signals of nutrient states! acts via the autonomic nervous system Ensures a balance
Brain Regulates energy homeostatis Glucose Sensing in the Brain Seminar 2012 Gareth Price! acts in response to circulating signals of nutrient states! acts via the autonomic nervous system Ensures a balance
Molecular and anatomical determinants of central leptin resistance
 FEEDING REGULATION AND OBESITY 2005 Nature ublishing Group http://www.nature.com/natureneuroscience Molecular and anatomical determinants of central leptin resistance Heike Münzberg & Martin G Myers, Jr
Energy Balance. Applied Human Metabolism VII. Energy Out. Factors that effect BMR/RMR 17/03/2016
 Energy Balance Applied Human Metabolism VII Weight Regulation The balance of energy taken in or leaving the body determines body mass Energy In = Energy Out Weight Maintenance Energy In < Energy Out Weight
Analysis of AVP functions via V1a and V1b receptors with knockout mice. Akito Tanoue
 Analysis of AVP functions via V1a and V1b receptors with knockout mice Akito Tanoue Department of Pharmacology, National Research Institute for Child Health and Development Arginine-Vasopressin (AVP) is
Interactions between bone and the central nervous system Florent Elefteriou, PhD
 Interactions between bone and the central nervous system Florent Elefteriou, PhD Department of Medicine Center for Bone Biology VANDERBILT UNIVERSITY Nashville, USA BONE REMODELING Bone marrow cells Estrogen
Fat-Pad Specific Effects of Lipectomy on Appetitive and Consummatory Ingestive Behaviors in Siberian Hamsters (Phodopus sungorus)
") Georgia State University ScholarWorks @ Georgia State University Biology Honors Theses Department of Biology 6-9-2006 Fat-Pad Specific Effects of Lipectomy on Appetitive and Consummatory Ingestive Behaviors
Georgia State University ScholarWorks @ Georgia State University Biology Honors Theses Department of Biology 6-9-2006 Fat-Pad Specific Effects of Lipectomy on Appetitive and Consummatory Ingestive Behaviors
Inhibition of renin angiotensin system improves leptin and insulin sensitivity, but causes severe anemia due to hypothyroidism.
 Inhibition of renin angiotensin system improves leptin and insulin sensitivity, but causes severe anemia due to hypothyroidism Chih-Hong Wang A dissertation submitted to the faculty of the University of
Receptors and Drug Action. Dr. Subasini Pharmacology Department Ishik University, Erbil
 Receptors and Drug Action Dr. Subasini Pharmacology Department Ishik University, Erbil Receptors and Drug Action Receptor Receptor is defined as a macromolecule or binding site located on the surface or
HISTAMINE INHIBITS EATING WITHOUT ALTERING POSTPRANDIAL SATIETY IN RATS KELLY TSCHANTZ
 HISTAMINE INHIBITS EATING WITHOUT ALTERING POSTPRANDIAL SATIETY IN RATS KELLY TSCHANTZ Abstract Exogenous histamine decreases food intake and injection of H-1 antagonists increases food intake in rats.
Motility Conference Ghrelin
 Motility Conference Ghrelin Emori Bizer, M.D. Division of Gastroenterology/Hepatology November 21, 2007 Ghrelin: Basics Hormone produced by the A-like A endocrine cells in the oxyntic mucosa (stomach body
renoprotection therapy goals 208, 209
 Subject Index Aldosterone, plasminogen activator inhibitor-1 induction 163, 164, 168 Aminopeptidases angiotensin II processing 64 66, 214 diabetic expression 214, 215 Angiotensin I intrarenal compartmentalization
2013 W. H. Freeman and Company. 12 Signal Transduction
 2013 W. H. Freeman and Company 12 Signal Transduction CHAPTER 12 Signal Transduction Key topics: General features of signal transduction Structure and function of G protein coupled receptors Structure
University of California, San Diego La Jolla CA 92093
 AD Award Number: W81XWH-11-1-0131 TITLE: Role of Inflammation and Insulin Resistance in Mouse Models of Breast Cancer PRINCIPAL INVESTIGATOR: Jerrold Olefsky, M.D. CONTRACTING ORGANIZATION: University
Neuro-Physiology Kamal Mohammed Lecturer Of Physiology LECTURE NO (-) Hypothalamus. Faculty Of Medicine Dept.Of Physiology
 Hypothalamus. Faculty Of Medicine Dept.Of Physiology") LECTURE NO (-) Neuro-Physiology Kamal Mohammed Lecturer Of Physiology Hypothalamus Faculty Of Medicine Dept.Of Physiology Hypothalamus Less than 1% of the brain mass Many connect the hypothalamus to the
LECTURE NO (-) Neuro-Physiology Kamal Mohammed Lecturer Of Physiology Hypothalamus Faculty Of Medicine Dept.Of Physiology Hypothalamus Less than 1% of the brain mass Many connect the hypothalamus to the
THE PERENNIAL STRUGGLE TO LOSE WEIGHT AND MAINTAIN: WHY IS IT SO DIFFICULT?
 THE PERENNIAL STRUGGLE TO LOSE WEIGHT AND MAINTAIN: WHY IS IT SO DIFFICULT? Robert Ferraro, MD Medical Director Southwest Endocrinology Associates, PA Diabetes and Weight Management Center OBESITY The
CNS Effects of Aldosterone :
 CNS Effects of Aldosterone : Critical Roles in salt-sensitive sensitive hypertension and CHF. Frans HH Leenen MD, PhD, FRCPC, FAHA 2 Renin Angiotensin Aldosterone System Circulatory RAAS Tissue RAAS: -
Antibodies. Product Name Cat. No. Size. GH (Growth Hormone) Antibody µg, 100 µg GM-CSF Antibody µg, 100 µg
 Antibody µg, 100 µg GM-CSF Antibody µg, 100 µg") JAK/STAT Signaling The JAK/STAT signaling pathway transmits a signal from outside the cell eventually resulting in DNA transcription and activity in the cell. Leptin (a product of the obese gene) can induce
JAK/STAT Signaling The JAK/STAT signaling pathway transmits a signal from outside the cell eventually resulting in DNA transcription and activity in the cell. Leptin (a product of the obese gene) can induce
1 Neuroregulation of Appetite
 Chapter 1 / Neuroregulation of Appetite 3 1 Neuroregulation of Appetite Ofer Reizes, PhD, Stephen C. Benoit, PhD, and Deborah J. Clegg, PhD CONTENTS INTRODUCTION THE DUAL-CENTERS HYPOTHESIS CONTROL OF
BMI risk SNPs associate with increased CADM1 and CADM2 expression in the cerebellum of human subjects.
 Supplementary Figure 1 BMI risk SNPs associate with increased CADM1 and CADM2 expression in the cerebellum of human subjects. Boxplots show the 25% and 75% quantiles of normalized mrna expression levels
Understanding obesity by local overexpression of neuropeptides: a viral vector based approach
 Understanding obesity by local overexpression of neuropeptides: a viral vector based approach Cover photo: Chris Timmers Cover design: Marije Tiesjema Print: Gildeprint, Enschede ISBN: 978-90-39344675
Jaemin Lee, Ph.D. Department of New Biology Daegu Gyeongbuk Institute of Science and Technology (DGIST)
") Jaemin Lee, Ph.D. Department of New Biology Daegu Gyeongbuk Institute of Science and Technology (DGIST) No Actual or Potential Conflict of Interest https://www.flickr.com/photos/luchoedu/2453267732/ 1985
Jaemin Lee, Ph.D. Department of New Biology Daegu Gyeongbuk Institute of Science and Technology (DGIST) No Actual or Potential Conflict of Interest https://www.flickr.com/photos/luchoedu/2453267732/ 1985
THIRST AND SODIUM APPETITE IN MICE: ANGIOTENSIN, BRAIN Fos, BLOOD PLASMA HORMONES, AND FLUID INTAKE
 THIRST AND SODIUM APPETITE IN MICE: ANGIOTENSIN, BRAIN Fos, BLOOD PLASMA HORMONES, AND FLUID INTAKE By BRADLEY E. GOLDSTEIN A THESIS PRESENTED TO THE GRADUATE SCHOOL OF THE UNIVERSITY OF FLORIDA IN PARTIAL
Molecular pathways linking adipose innervation to insulin action in obesity and diabetes mellitus
 Molecular pathways linking adipose innervation to insulin action in obesity and diabetes mellitus Adilson Guilherme, Felipe Henriques, Alexander H. Bedard and Michael P. Czech* Abstract Adipose tissue
Eligibility The NCSF online quizzes are open to any currently certified fitness professional, 18 years or older.
 Eligibility The NCSF online quizzes are open to any currently certified fitness professional, 18 years or older. Deadlines Course completion deadlines correspond with the NCSF Certified Professionals certification
Developing nations vs. developed nations Availability of food contributes to overweight and obesity
 KNH 406 1 Developing nations vs. developed nations Availability of food contributes to overweight and obesity Intake Measured in kilojoules (kj) or kilocalories (kcal) - food energy Determined by bomb
Regulation of Systemic Energy Balance and Glucose Homeostasis by Protein-Tyrosine Phosphatase 1B
 Regulation of Systemic Energy Balance and Glucose Homeostasis by Protein-Tyrosine Phosphatase 1B Fawaz G. Haj Associate Professor Diagnosed Obesity and Diabetes for Adults aged 20 years in United States
Estrogen receptor α in medial amygdala neurons regulates body weight
 The Journal of Clinical Investigation Research article Estrogen receptor α in medial amygdala neurons regulates body weight Pingwen Xu, 1 Xuehong Cao, 1 Yanlin He, 1 Liangru Zhu, 1,2 Yongjie Yang, 1 Kenji