18s AAACGGCTACCACATCCAAG CCTCCAATGGATCCTCGTTA. 36b4 GTTCTTGCCCATCAGCACC AGATGCAGCAGATCCGCAT. Acc1 AGCAGATCCGCAGCTTG ACCTCTGCTCGCTGAGTGC
|
|
|
- Jessica Carson
- 6 years ago
- Views:
Transcription
1 Supplementary Table 1. Quantitative PCR primer sequences Gene symbol Sequences (5 to 3 ) Forward Reverse 18s AAACGGCTACCACATCCAAG CCTCCAATGGATCCTCGTTA 36b4 GTTCTTGCCCATCAGCACC AGATGCAGCAGATCCGCAT Acc1 AGCAGATCCGCAGCTTG ACCTCTGCTCGCTGAGTGC Acc2 ACAGAGATTTCACCGTTGCGT CGCAGCGATGCCATTGT Acox GTGCAGCTCAGAGTCTGTCCAA TACTGCTGCGTCTGAAAATCCA Cpt1a TGCACTACGGAGTCCTGCAA GGACAACCTCCATGGCTCAG Dgat1 TGGTGTGTGGTGATGCTGATC GCCAGGCGCTTCTCAA Fasn CTGACTCGGCTACTGACACG TGAGCTGGGTTAGGGTAGGA G6pc GTCTGGATTCTACCTGCTAC AAAGACTTCTTGTGTGTCTGTC Insig1 TCACAGTGACTGAGCTTCAGCA TCATCTTCATCACACCCAGGAC Insig2a CCCTCAATGAATGTACTGAAGGATT TGTGAAGTGAAGCAGACCAATGT Insig2b CCGGGCAGAGCTCAGGAT GAAGCAGACCAATGTTTCAATG Pck1 CCTGGAAGAACAAGGAGTGG AGGGTCAATAATGGGGCACT Pdk4 TTCCATGAGAAGAGCCCAGAAG ATCCGAGTAGAAATGCGGTTCA Phlpp1 AGGGTCCCGGAGACGATAAG AGGGCGGAGATGTCTTTTGC Phlpp2 GCCACAATCTTCTTACAGAGGTC TCGAGGGGAATGTGCTCCA PPARalpha GGGTACCACTACGGAGTTCACG CAGACAGGCACTTGTGAAAACG PPARgamma GTGCCAGTTTCGATCCGTAGA GGCCAGCATCGTGTAGATGA Scd1 CTCCTGCTGATGTGCTTCAT AGGGTGCTAACGAACAGGCT Srebp1c GAAGCTGTCGGGGTAGCGTCT CTCTCAGGAGAGTTGGCACCTG
 (short) (long) (short) c d 2 2 NCD HFD 1.4 1.2 P=.64 1.8.")
 Rictor -tubulin 2 Rictor (long) 2 G L IP Rictor (short) -tubulin 2 G L 5%")
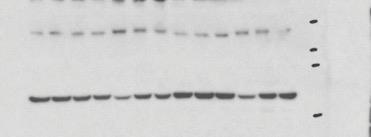
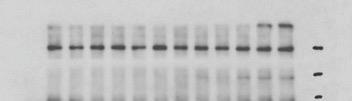
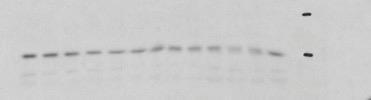
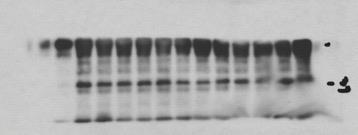
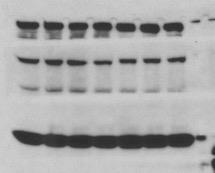
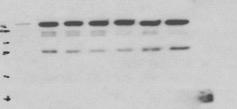
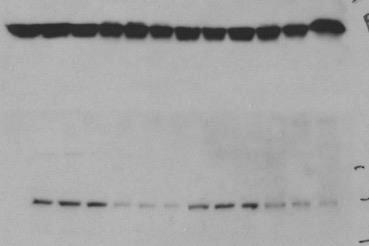
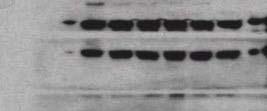
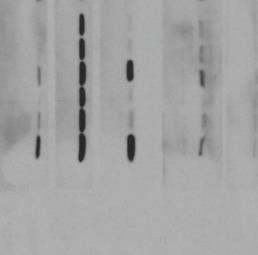
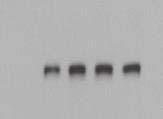
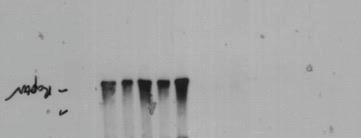
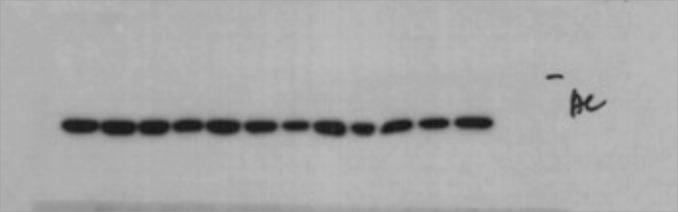
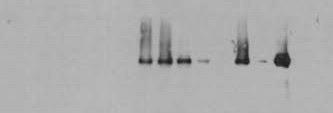
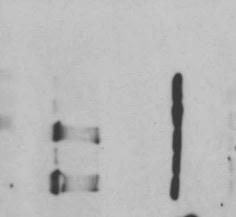
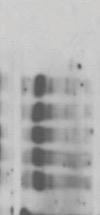
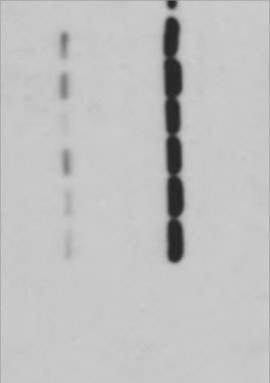
2 Supplementary Figure 1 a DMSO DSS young adult young adult b DMSO DSS NCD HFD NCD HFD (long) (short) (long) (short) c d 2 2 NCD HFD P= Rictor IgG IP: anti- DMSO DSP lean ob/ob lean ob/ob Signal intensity (a.u.) Rictor -tubulin 2 Rictor (long) 2 G L IP Rictor (short) -tubulin 2 G L 5% input
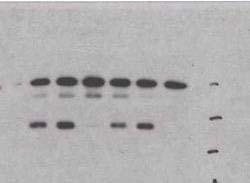
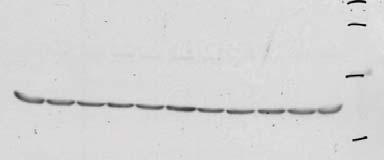
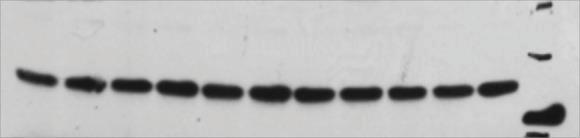
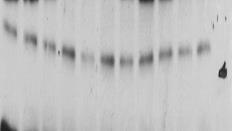
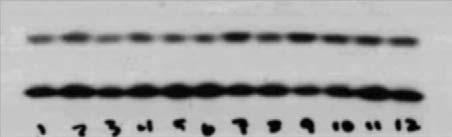
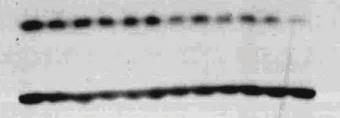
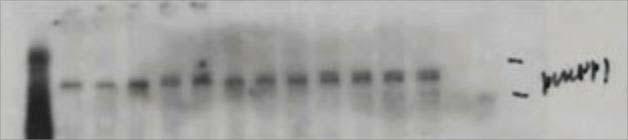
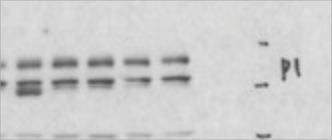
3 e 2 IgG IP: anti- lean ob/ob G L IP f 2 2 Ctrl -AAs Rapa Supplementary Figure 1 IP: anti- 5% input 2 G L 5% input g DMSO DSS Insulin (nm) Supplementary Figure 1. C1-independent is reduced in insulin-resistant liver (a-c) Western blots from livers of (a) young (8-week-old) or adult (24-week-old) male mice, showing the whole blots corresponding to Figure 1c, and(b) normal chow diet (NCD) or HFD-fed male mice, crosslinked with DSS, and (c) quantitation of signal as a percentage of control (DMSO-treated liver lysate). (d,e) Western blots from livers of lean or ob/ob mice (8-week-old) following immunoprecipitation (IP) with anti-, (d) with or without prior crosslinking with DSP, (e) or in the presence of CHAPS to sustain - interaction. (f) Western blot from primary hepatocytes deprived of amino acids (-AA) or treated with rapamycin (Rapa) for 1 h prior to IP with anti-. (g) Western blot from Hepa1c1c7 cells, treated with varying concentrations of insulin for 24 hours, prior to DSS crosslinking. Statistical analysis were performed using two-way ANOVA. All data are shown as the means s.e.m. Blots are representative of three independent experiments, and samples within groups chosen randomly.
4 Supplementary Figure 2 a young adult Ad- Ad- -tubulin b Hepatic triglyceride (mg per mg protein) young adult aged c Liver weight (g per g BW) * Ad- d Liver weight (g per g BW) p=.79 Ad- Supplementary Figure 2. Rescue of free reduces liver weight and TG content in older or obese mice (a) Western blot from livers of young or adult and Ad- mice sacrificed after a 16 h fast followed by 4 h refeeding (n=6/group). (b) Hepatic TG content in young (8-week-old), adult (24-week-old) or aged (1- to 12-month-old) male mice sacrificed after a 16 h fast followed by 4 h refeeding (n=6/group). (c,d) Liver weight in (c) aged (1- to 12-month-old, n=7/group) or (d) DIO (n=5 or 4/group) and Ad- mice. *P <.5 as compared to the indicated control by two-way ANOVA. All data are shown as the means s.e.m. Blots are representative of three independent experiments, and samples within groups chosen randomly.
5 d mrna (a.u.) a Body weight (g) Ad- young, young Ad-, young, adult Ad-, adult adult b ewat weight (g per g BW) Ad- young adult c NEFA (meq L -1 ) e -OH butyrate (mm) Supplementary Figure 3 Ad- young adult Ad- fasted refed f mrna (a.u.) Ad- * * ** Srebp1c Fasn Acc1 Scd1 Supplementary Figure 3. Free reduces lipogenesis without affecting body weight, adiposity or fatty acid oxidation (a-e) Body weight (a), epidydimal fat pad (ewat) weight (b), non-esterified fatty acid (NEFA) levels (c), liver mrna expression (d) and plasma hydroxybutyrate levels (e) in young or adult and Ad- mice, sacrificed after a 16 h fast followed by 4 h refeeding (n=6/group). (f) Srebp1c-dependent lipogenic gene expression in primary hepatocytes transduced with or Ad- (n=4 biologic replicates). *P <.5 and **P <.1 as compared to the indicated control control by two-way ANOVA. All data are shown as the means s.e.m.
6 c a Hepatic protein (mg per mg liver) f IP: anti- fasted refed Ad- Ad- Ad- young adult d young adult Ad- Ad- p-4e-bp1 (T/46) Ad- g PKC 2 p-akt (T4) C1 kinase assay Total lysates e b p-irs1 (S636/639) 2 2 Supplementary Figure 4 Ad- p-s6k1 (T389) p-s6 (S24/244) p-4e-bp1 (T/46) IgG IP: anti- Ad- young adult young adult young adult fasted refed fasted refed Ad- Ad- Ad- Ad- Rictor G L Rictor G L Rictor IP 5% input p-akt (T4) PKC Supplementary Figure 4. Increase in free levels does not affect C1 or C2 activity (a) C1 kinase activity on 4E-BP1 substrate. (b-d) Western blots (b and d) and protein concentration (c) measured from livers of adult and Ad- male mice, sacrificed after a 16 h fast followed by 4 h refeeding (n=6/group). (e-g) Western blots following IP with anti- antibody (e) from livers of young or adult and Ad- male mice, sacrificed after a 16 h fast followed by 4 h refeeding (f), or after a 16 h fast with or without 4 h refeeding (g). Blots are representative of three independent experiments, and samples within groups chosen randomly
 Akt e Insulin (ng ml -1 ) 8 6 4 2 young adult Ad- Supplementary Figure 5.")
7 a adult Ad- p-gsk3 (S9) b 2 1 adult Ad- p-akt substrate Supplementary Figure 5 c mrna (a.u.) ** Ad- Insig1 Insig2a Insig2b d 25 young adult Ad- Ad- p-akt (S473) Akt e Insulin (ng ml -1 ) young adult Ad- Supplementary Figure 5. Free reduces hepatocyte Akt activity (a, b) Western blots from liver of adult or Ad- male mice, sacrificed after a 16 h fast with or without 4 h refeeding. c) Liver mrna expression in adult and Ad- mice (n=6/group). (d) Western blots from ewat of young or adult and Ad- male mice sacrificed after a 16 h fast followed by 4 h refeeding. (e) Plasma insulin levels in young or adult and Ad- male mice sacrificed after a 16 h fast followed by 4 h refeeding (n=6/group). **P <.1 as compared to the indicated control control by two-way ANOVA. All data are shown as the means Blots are representative of three independent experiments, and samples within groups chosen randomly.
8 d a AAV-TBG -GFP fold (a.u.) Hepa1c1c7 fl/fl i AAV-TBG -Cre ** TBG-GFP TBG-Cre 2 Liver 2 p-s6 (S24/244) S6 e PHLPP1 fold (a.u.) PHLPP PHLPP1 1.5 b GFP Rapamycin Torin1 AAV-TBG -GFP fl/fl AAV-TBG -Cre TBG-GFP TBG-Cre ** p-s6 (S24/244) S6 j f g IgG mrna (a.u.) Supplementary Figure 6 c sh - #1 #2 Ad- Tsc2 +/+ Tsc2 -/- 2 Phlpp1 Phlpp2 IP: anti- h mrna (a.u.) DMSO MG GFP TrCP -TrCP p-s6k1 (T389) S6K1 p-s6 (S24/244) S6 shrictor IP 5% input GFP Phlpp1 Rictor Phlpp2
9 Supplementary Figure 6 Supplementary Figure 6., but not C1 activity, post-transcriptionally regulates (a) Western blots of PHLPP isoforms from Hepa1c1c7 cells and liver. (b,c) Western blots from primary hepatocytes transduced with or Ad-, then treated with vehicle, Rapamycin, or Torin1 (b), or Tsc +/+ and Tsc2 -/- MEFs (c). (d,e) Western blot from adult (d) orhfd-fed(e) fl/fl liver transduced with AAV8-TBG-GFP or AAV8-TBG-Cre, normalized to. (f) Western blot from primary hepatocytes transduced with Ad-shControl, Ad-sh, or Ad-shRictor. (g,h) Phlpp1 and Phlpp2 gene expression in Ad- GFP or Ad--transduced liver (n=6/group) (g) or primary hepatocytes (n=4/group) (h). (i) Western blot of primary hepatocytes co-transduced with PHLPP1 or and Ad- (or control). (j) Western blot of (or GFP control)-transduced Hepa1c1c7 cells following immunoprecipitation with anti-, with or without MG-132. Blots are representative of two independent experiments. **P <.1 as compared to the indicated control control by two-way ANOVA. All data are shown as the means s.e.m. Blots are representative of three independent experiments, and samples within groups chosen randomly, unless otherwise stated.
 b Liver weight (g per g BW).9.8.7.6.5.4.3.2.")

 Western blot from primary hepatocytes transduced")
 Liver weight (b) and Oil-Red-O or H&E staining (c) in")


10 a shcontrol shphlpp shphlpp2 PHLPP1 p-akt (S473) b Liver weight (g per g BW) Supplementary Figure 7 ** c Ad-shControl Ad-shPhlpp1 Ad-shPhlpp2 Oil Red O H&E 2 m Supplementary Figure 7. knockdown increases Akt S473 phosphorylation and causes hepatic steatosis (a) Western blot from primary hepatocytes transduced with Ad-shControl, Ad-shPhlpp1, or Ad-shPhlpp2. (b,c) Liver weight (b) and Oil-Red-O or H&E staining (c) in livers of adult Ad-shControl, Ad-shPhlpp1, or Ad-shPhlpp2 mice sacrificed after a 16 h fast followed by 4 h refeeding (n=6/group). **P <.1as compared to the indicated control by two-way ANOVA. All data are shown as the means s.e.m. Blots are representative of three independent experiments, and samples within groups chosen randomly.
11 Supplementary Figure 8 a b.4 c Ad Body weight (g) fasted refed ewat weight (g per g BW) Ad- Liver weight (g per g BW) * Ad- Supplementary Figure 8. Rescue of aging/obesity-reduced levels prevents hepatic steatosis (a-c) body weight (a), ewat weight (b), and liver weight (c) in adult, HFD-fed or Ad- male mice, sacrificed after a 16 h fast followed by 4 h refeeding (n=6 or 7/group). *P <.5comparedtothe indicated control by two-way ANOVA. All data are shown as the means s.e.m.
12 a Body weight (g) Ad-shControl Ad-shPhlpp1 Ad-shPhlpp2 Ad- Ad- fasted refed b ewat weight (g per g BW).2.1 Ad-shControl Ad-shPhlpp1 Ad-shPhlpp2 Ad- c -OH butyrate (mm) Supplementary Figure 9 Ad-shControl Ad-shPhlpp1 Ad-shPhlpp2 Ad- Ad- fasted refed d NEFA (meq L -1 ) Ad-shControl Ad-shPhlpp1 Ad-shPhlpp2 e Hepatic protein (mg per mg liver) Ad-shControl Ad-shPhlpp1 Ad-shPhlpp2 Ad- Ad- Ad- fasted refed Supplementary Figure 9. Metabolic effects of free are -dependent (a-e) Body weight (a), ewat weight (b), -hydroxybutyrate (c), NEFA levels (d), and hepatic protein concentration (e) of adult and Ad- mice co-transduced with control (Ad-shControl), AdshPHLPP1 or Ad-sh adenoviruses, sacrificed after a 16 h fast followed by 4 h refeeding (n=6/group). **P <.1 as compared to the indicated control by two-way ANOVA. All data are shown as the means s.e.m.
13 a Blood glucose level (mg dl -1 ) Ad- fasted refed fasted refed young d Blood glucose level (mg dl -1 ) adult b mrna (a.u.) Ad- fasted 2 refed fasted refed fasted refed G6pc e Insulin (ng ml -1 ) Ad- Pck1 Ad- fasted Supplementary Figure 1 c Blood glucose level (mg dl -1 ) refed , young Ad-, young, adult Ad-, adult Time after injection (min) Supplementary Figure 1. Rescue of free or does not affect glucose homeostasis (a,b) Blood glucose levels (a) and hepatic gluconeogenic gene expression (b) in young or adult and Ad- male mice sacrificed after a 16 h fast with or without 4 h refeeding (n=6/group). (c) Intraperitoneal glucose tolerance test (GTT) in young or adult and Ad- mice (n=6/group). (d,e) Blood glucose (d) and plasma insulin levels (e) in adult, HFD-fed and Ad- male mice, sacrificed after a 16 h fast followed by 4 h refeeding (n=6 or 7/group). All data are shown as the means s.e.m.

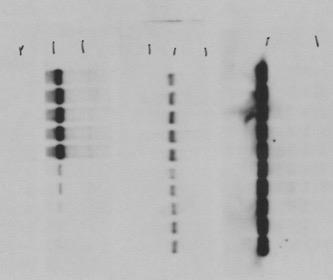
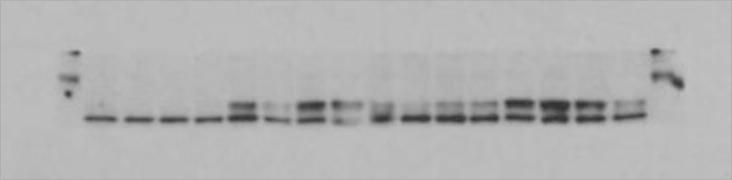
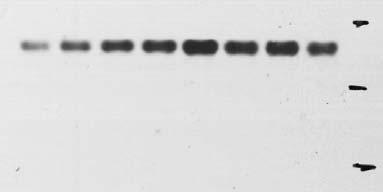
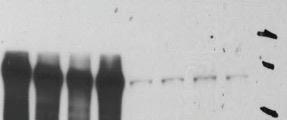
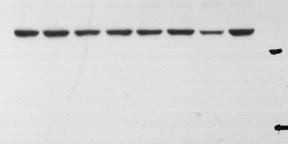
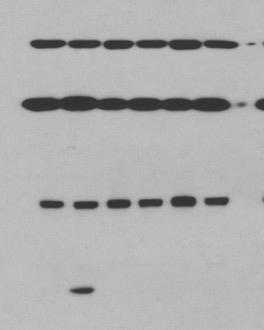
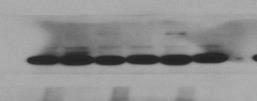
14 Supplementary Figure 11 Uncropped images of the original scans of representative immunoblots Figure 1a young G L adult G L ob/ob G L


15 Figure 1c Top Bottom Rictor 2 Rictor -tubulin -tubulin


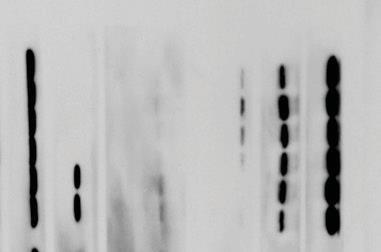
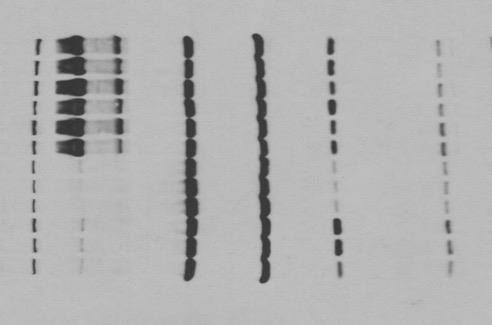
16 Figure 1e Figure 1f Figure 2a 2 G L


,")


")
17 Figure 3a top pakt (S473) Akt bottom pakt (S473) Akt Stripped 45 (Restore), then reprobed for actin Figure 3b top Stripped 45 (Restore), then reprobed for total Akt pakt (T38) bottom pakt (T38) Stripped 45 (Restore), then reprobed for actin
")
, then")
 p-akt (T38)")
18 Figure 3c Figure 3d Akt kinase assay p-gsk3 (S9) Akt Total lysates Stripped 45 (Restore), then reprobed for total Akt p-akt (S473) p-akt (T38) Akt PHLPP1 2 2

")

19 Figure 3e Figure 3f p-s6 (S24/244) S6 25 2


 IP")
")

20 Figure 3g Figure 3h Figure 3i 2 -TrCP IP 2 HA (Ub) IP -tubulin 2 HA (Ub) 2 -TrCP 2 5% input 2 HA (Ub) 5% input 2 2 -tubulin


21 Figure 4b 2 PHLPP1 2 Figure 4c Figure 4d PHLPP1 2 2 PHLPP1 2 2

")


22 Figure 4e Figure 5a p-akt (S473) p-akt (T38) p-akt (T4) Akt p-akt (S473) GSK3 p-gsk3 (S9) Akt 2
23 Supplementary Figure 1b Supplementary Figure 1d 2 2 Rictor 2 IP G L -tubulin 5% input 2 G L

24 Supplementary Figure 1e Supplementary Figure 1f IP 2 IP 2 G L 5% input 2 5% input 2 G L Supplementary Figure 1g 2
 -tubulin 2 5% input")
25 Supplementary Figure 2c Supplementary Figure 4a IP 2 p-4e-bp1 (T/46) -tubulin 2 5% input 2

")

")
26 Supplementary Figure 4b Supplementary Figure 4d p-s6k1 (T389) ps6 (S24/244) p4e-bp1-t/46 2 p-irs1 (S636/639)

27 Supplementary Figure 4e Supplementary Figure 4f 2 PKC IP Rictor 2 pakt (T4) G L Stripped 45 (Restore), then reprobed for actin 2 2 Rictor 5% input G L
28 Supplementary Figure 4g 2 Rictor p-akt (T4) PKC Supplementary Figure 5a p-gsk3 Stripped 45 (Restore), then reprobed for actin
29 Supplementary Figure 5d p-akt (S473) Akt Supplementary Figure 6a Left Right 2 PHLPP1 2
30 Supplementary Figure 6b Supplementary Figure 6c S6K1 p-s6 (S24/244) p-s6k1 (T389) S6
31 Supplementary Figure 6d Supplementary Figure 6e p-s6 (S24/244) S6 p-s6 (S24/244) S6

32 Supplementary Figure 6f Left Right 2 Rictor
33 Supplmentary Figure 6i Supplementary Figure 6j PHLPP1 -TrCP IP -TrCP 5% input
34 Supplementary Figure 7a 2 PHLPP1 p-akt (S473)
mtorc1-independent Raptor prevents hepatic steatosis by stabilizing PHLPP2
 Received 7 Sep 25 Accepted 23 Nov 25 Published 8 Jan 26 DOI:.38/ncomms255 OPEN C-independent prevents hepatic steatosis by stabilizing KyeongJin Kim, Li Qiang, Matthew S. Hayden 2,3, David P. Sparling
AAV-TBGp-Cre treatment resulted in hepatocyte-specific GH receptor gene recombination
 AAV-TBGp-Cre treatment resulted in hepatocyte-specific GH receptor gene recombination Supplementary Figure 1. Generation of the adult-onset, liver-specific GH receptor knock-down (alivghrkd, Kd) mouse
Supplemental Information. Increased 4E-BP1 Expression Protects. against Diet-Induced Obesity and Insulin. Resistance in Male Mice
 Cell Reports, Volume 16 Supplemental Information Increased 4E-BP1 Expression Protects against Diet-Induced Obesity and Insulin Resistance in Male Mice Shih-Yin Tsai, Ariana A. Rodriguez, Somasish G. Dastidar,
1.5 ASK1KO fed. fasted 16 hrs w/o water. Fed. 4th. 4th WT ASK1KO N=29, 11(WT), ,5(ASK1KO) ASK1KO ASK1KO **** Time [h]
![1.5 ASK1KO fed. fasted 16 hrs w/o water. Fed. 4th. 4th WT ASK1KO N=29, 11(WT), ,5(ASK1KO) ASK1KO ASK1KO **** Time [h]](/thumbs/87/97258189.jpg "1.5 ASK1KO fed. fasted 16 hrs w/o water. Fed. 4th. 4th WT ASK1KO N=29, 11(WT), ,5(ASK1KO) ASK1KO ASK1KO **** Time [h]") 7: 13: 19: 1: 7: 151117 a 151117 4th 4th b c RQ.95 KO.9.85.8.75.7 light dark light dark.65 7: 19: 7: 19: 7: Means ± SEM, N=6 RQ 1..9.8.7.6.6 KO CL (-) CL (+) ibat weight ratio (/body weight) [%].5.4.3.2.1
7: 13: 19: 1: 7: 151117 a 151117 4th 4th b c RQ.95 KO.9.85.8.75.7 light dark light dark.65 7: 19: 7: 19: 7: Means ± SEM, N=6 RQ 1..9.8.7.6.6 KO CL (-) CL (+) ibat weight ratio (/body weight) [%].5.4.3.2.1
Effect of BI-1 on insulin resistance through regulation of CYP2E1
 Effect of BI-1 on insulin resistance through regulation of CYP2E1 Geum-Hwa Lee 1, Kyoung-Jin Oh 2, 3, Hyung-Ryong Kim 4, Hye-Sook Han 2, Hwa-Young Lee 1, Keun-Gyu Park 5, Ki-Hoan Nam 6, Seung-Hoi Koo 2
Requires Signaling though Akt2 Independent of the. Transcription Factors FoxA2, FoxO1, and SREBP1c
 Cell Metabolism, Volume 14 Supplemental Information Postprandial Hepatic Lipid Metabolism Requires Signaling though Akt2 Independent of the Transcription Factors FoxA2, FoxO1, and SREBP1c Min Wan, Karla
ACC ELOVL MCAD. CPT1α 1.5 *** 0.5. Reverbα *** *** 0.5. Fasted. Refed
 Supplementary Figure A 8 SREBPc 6 5 FASN ELOVL6.5.5.5 ACC.5.5 CLOCK.5.5 CRY.5.5 PPARα.5.5 ACSL CPTα.5.5.5.5 MCAD.5.5 PEPCK.5.5 G6Pase 5.5.5.5 BMAL.5.5 Reverbα.5.5 Reverbβ.5.5 PER.5.5 PER B Fasted Refed
Defective Hepatic Autophagy in Obesity Promotes ER Stress and Causes Insulin Resistance
 Cell Metabolism, Volume 11 Supplemental Information Defective Hepatic Autophagy in Obesity Promotes ER Stress and Causes Insulin Resistance Ling Yang, Ping Li, Suneng Fu, Ediz S. Calay, and Gökhan S. Hotamisligil
ZL ZDF ZDF + E2 *** Visceral (g) ZDF
 ZDF") Body Weight (g) 4 3 2 1 ** * ZL ZDF 6 8 1 12 14 16 Age (weeks) B * Sub-cutaneous (g) 16 12 8 4 ZL ZDF Visceral (g) 25 2 15 1 5 ZL ZDF Total fat pad weight (g) 4 3 2 1 ZDF ZL Supplemental Figure 1: Effect
Body Weight (g) 4 3 2 1 ** * ZL ZDF 6 8 1 12 14 16 Age (weeks) B * Sub-cutaneous (g) 16 12 8 4 ZL ZDF Visceral (g) 25 2 15 1 5 ZL ZDF Total fat pad weight (g) 4 3 2 1 ZDF ZL Supplemental Figure 1: Effect
Supplementary Table 1. Metabolic parameters in GFP and OGT-treated mice
 Supplementary Table 1. Metabolic parameters in GFP and OGT-treated mice Fasted Refed GFP OGT GFP OGT Liver G6P (mmol/g) 0.03±0.01 0.04±0.02 0.60±0.04 0.42±0.10 A TGs (mg/g of liver) 20.08±5.17 16.29±0.8
General Laboratory methods Plasma analysis: Gene Expression Analysis: Immunoblot analysis: Immunohistochemistry:
 General Laboratory methods Plasma analysis: Plasma insulin (Mercodia, Sweden), leptin (duoset, R&D Systems Europe, Abingdon, United Kingdom), IL-6, TNFα and adiponectin levels (Quantikine kits, R&D Systems
SUPPLEMENTARY INFORMATION
 DOI: 10.1038/ncb3461 In the format provided by the authors and unedited. Supplementary Figure 1 (associated to Figure 1). Cpeb4 gene-targeted mice develop liver steatosis. a, Immunoblot displaying CPEB4
Supplementary Figure 1
 VO (ml kg - min - ) VCO (ml kg - min - ) Respiratory exchange ratio Energy expenditure (cal kg - min - ) Locomotor activity (x count) Body temperature ( C) Relative mrna expression TA Sol EDL PT Heart
Over-expression of MKP-3 and knockdown of MKP-3 and FOXO1 in primary rat. day, cells were transduced with adenoviruses expressing GFP, MKP-3 or shgfp,
 SUPPLEMENTAL METHODS Over-expression of MKP-3 and knockdown of MKP-3 and FOXO1 in primary rat hepatocytes Primary rat hepatocytes were seeded as described in experimental procedures. The next day, cells
ALT (U/L) (Relative expression) HDL (mm) (Relative expression) ALT (U/L) (Relative expression)
 (Relative expression) HDL (mm) (Relative expression) ALT (U/L) (Relative expression)") a DMT mrna () 8 6 r =.96 P =. DMT mrna () 8 6 r =. P =.6 DMT mrna () 8 6 r =.99 P =.6 DMT mrna () 8 6 r =. P =.9 DMT mrna () BMI (kg/m ) 8 6 r =.7 P =.966 DMT mrna () 8 ALT (U/L) 8 6 r = -.66 P =.76 DMT
a DMT mrna () 8 6 r =.96 P =. DMT mrna () 8 6 r =. P =.6 DMT mrna () 8 6 r =.99 P =.6 DMT mrna () 8 6 r =. P =.9 DMT mrna () BMI (kg/m ) 8 6 r =.7 P =.966 DMT mrna () 8 ALT (U/L) 8 6 r = -.66 P =.76 DMT
Supplementary Fig. 1 eif6 +/- mice show a reduction in white adipose tissue, blood lipids and normal glycogen synthesis. The cohort of the original
 Supplementary Fig. 1 eif6 +/- mice show a reduction in white adipose tissue, blood lipids and normal glycogen synthesis. The cohort of the original phenotypic screening was n=40. For specific tests, the
Supplementary Figure 1. DJ-1 modulates ROS concentration in mouse skeletal muscle.
 Supplementary Figure 1. DJ-1 modulates ROS concentration in mouse skeletal muscle. (a) mrna levels of Dj1 measured by quantitative RT-PCR in soleus, gastrocnemius (Gastroc.) and extensor digitorum longus
Supplementary Materials for
 www.sciencesignaling.org/cgi/content/full/8/407/ra127/dc1 Supplementary Materials for Loss of FTO in adipose tissue decreases Angptl4 translation and alters triglyceride metabolism Chao-Yung Wang,* Shian-Sen
Identified proteins interacting with TMBIM1 by mass spectrometry
 Supplementary Information Journal: Nature Medicine Article Title: Corresponding Author: A novel multivesicular body regulator TMBIM1 protects against non-alcoholic fatty liver disease in mice and monkeys
Supplementary Information
 Supplementary Information Akt regulates hepatic metabolism by suppressing a Foxo1 dependent global inhibition of adaptation to nutrient intake Mingjian Lu 1, Min Wan 1, Karla F. Leavens 1, Qingwei Chu
Supplementary Table 2. Plasma lipid profiles in wild type and mutant female mice submitted to a HFD for 12 weeks wt ERα -/- AF-1 0 AF-2 0
 Supplementary Table 1. List of specific primers used for gene expression analysis. Genes Primer forward Primer reverse Hprt GCAGTACAGCCCCAAAATGG AACAAAGTCTGGCCTGTATCCA Srebp-1c GGAAGCTGTCGGGGTAGCGTC CATGTCTTCAAATGTGCAATCCAT
Males- Western Diet WT KO Age (wks) Females- Western Diet WT KO Age (wks)
 Females- Western Diet WT KO Age (wks)") Relative Arv1 mrna Adrenal 33.48 +/- 6.2 Skeletal Muscle 22.4 +/- 4.93 Liver 6.41 +/- 1.48 Heart 5.1 +/- 2.3 Brain 4.98 +/- 2.11 Ovary 4.68 +/- 2.21 Kidney 3.98 +/-.39 Lung 2.15 +/-.6 Inguinal Subcutaneous
Relative Arv1 mrna Adrenal 33.48 +/- 6.2 Skeletal Muscle 22.4 +/- 4.93 Liver 6.41 +/- 1.48 Heart 5.1 +/- 2.3 Brain 4.98 +/- 2.11 Ovary 4.68 +/- 2.21 Kidney 3.98 +/-.39 Lung 2.15 +/-.6 Inguinal Subcutaneous
Supplementary Figure 1
 Supplementary Figure 1 A B mir-141, human cell lines mir-2c, human cell lines mir-141, hepatocytes mir-2c, hepatocytes Relative RNA.1.8.6.4.2 Relative RNA.3.2.1 Relative RNA 1.5 1..5 Relative RNA 2. 1.5
Supplemental Table 1. Plasma NEFA and liver triglyceride levels in ap2-hif1ako and ap2-hif2ako mice under control and high fat diets.
 Supplemental Table 1. Plasma NEFA and liver triglyceride levels in Hif1aKO and Hif2aKO mice under control and high fat diets. Hif1a (n=6) Hif1aK O (n=6) Hif2a Hif2aK O Hif1a (n=5) Hif1aKO (n=5) Hif2a Hif2aK
Supplementary Figure 1
 Supplementary Figure 1 Supplementary Figure 1 Schematic depiction of the tandem Fc GDF15. Supplementary Figure 2 Supplementary Figure 2 Gfral mrna levels in the brains of both wild-type and knockout Gfral
SUPPLEMENTARY INFORMATION
 SUPPLEMENTARY INFORMATION doi:10.1038/nature11464 Supplemental Figure S1. The expression of Vegfb is increased in obese and diabetic mice as compared to lean mice. a-b, Body weight and postprandial blood
Supplemental Information. Human Carboxylesterase 2 Reverses. Obesity-Induced Diacylglycerol Accumulation. and Glucose Intolerance
 Cell Reports, Volume 18 Supplemental Information Human Carboxylesterase 2 Reverses Obesity-Induced Diacylglycerol Accumulation and Glucose Intolerance Maxwell A. Ruby, Julie Massart, Devon M. Hunerdosse,
Supplemental Table 1 Primer sequences (mouse) used for real-time qrt-pcr studies
 used for real-time qrt-pcr studies") Supplemental Table 1 Primer sequences (mouse) used for real-time qrt-pcr studies Gene symbol Forward primer Reverse primer ACC1 5'-TGAGGAGGACCGCATTTATC 5'-GCATGGAATGGCAGTAAGGT ACLY 5'-GACACCATCTGTGATCTTG
Supplemental Table 1 Primer sequences (mouse) used for real-time qrt-pcr studies Gene symbol Forward primer Reverse primer ACC1 5'-TGAGGAGGACCGCATTTATC 5'-GCATGGAATGGCAGTAAGGT ACLY 5'-GACACCATCTGTGATCTTG
Supplementary Figure 1: Additional metabolic parameters of obesity mouse models and controls. (a) Body weight, (b) blood glucose and (c) insulin
 Body weight, (b) blood glucose and (c) insulin") Supplementary Figure 1: Additional metabolic parameters of obesity mouse models and controls. (a) Body weight, (b) blood glucose and (c) insulin resistance index of homeostatic model assessment (HOMA IR)
Supplementary Figure 1: Additional metabolic parameters of obesity mouse models and controls. (a) Body weight, (b) blood glucose and (c) insulin resistance index of homeostatic model assessment (HOMA IR)
Supplementary Figure 1. DNA methylation of the adiponectin promoter R1, Pparg2, and Tnfa promoter in adipocytes is not affected by obesity.
 Supplementary Figure 1. DNA methylation of the adiponectin promoter R1, Pparg2, and Tnfa promoter in adipocytes is not affected by obesity. (a) Relative amounts of adiponectin, Ppar 2, C/ebp, and Tnf mrna
Supplementary Information
 Supplementary Information Notch deficiency decreases hepatic lipid accumulation by induction of fatty acid oxidation No-Joon Song,#, Ui Jeong Yun,#, Sunghee Yang, Chunyan Wu, Cho-Rong Seo, A-Ryeong Gwon,,
Expanded View Figures
 Expanded View Figures A B C D E F G H I J K L Figure EV1. The dysregulated lipid metabolic phenotype of mouse models of metabolic dysfunction is most pronounced in the fasted state. A L Male 12-weeks-old
Gene Polymorphisms and Carbohydrate Diets. James M. Ntambi Ph.D
 Gene Polymorphisms and Carbohydrate Diets James M. Ntambi Ph.D Fatty Acids that Flux into Tissue Lipids are from Dietary Sources or are Made De novo from Glucose or Fructose Glucose Fructose Acetyl-CoA
SUPPLEMENTARY DATA. Nature Medicine: doi: /nm.4171
 SUPPLEMENTARY DATA Supplementary Figure 1 a b c PF %Change - -4-6 Body weight Lean mass Body fat Tissue weight (g).4.3.2.1. PF GC iwat awat BAT PF d e f g week 2 week 3 NEFA (mmol/l) 1..5. PF phsl (Ser565)
A Hepatocyte Growth Factor Receptor (Met) Insulin Receptor hybrid governs hepatic glucose metabolism SUPPLEMENTARY FIGURES, LEGENDS AND METHODS
 Insulin Receptor hybrid governs hepatic glucose metabolism SUPPLEMENTARY FIGURES, LEGENDS AND METHODS") A Hepatocyte Growth Factor Receptor (Met) Insulin Receptor hybrid governs hepatic glucose metabolism Arlee Fafalios, Jihong Ma, Xinping Tan, John Stoops, Jianhua Luo, Marie C. DeFrances and Reza Zarnegar
A Hepatocyte Growth Factor Receptor (Met) Insulin Receptor hybrid governs hepatic glucose metabolism Arlee Fafalios, Jihong Ma, Xinping Tan, John Stoops, Jianhua Luo, Marie C. DeFrances and Reza Zarnegar
Supporting Information. Supporting Tables. S-Table 1 Primer pairs for RT-PCR. Product size. Gene Primer pairs
 Supporting Information Supporting Tables S-Table 1 Primer pairs for RT-PCR. Gene Primer pairs Product size (bp) FAS F: 5 TCTTGGAAGCGATGGGTA 3 429 R: 5 GGGATGTATCATTCTTGGAC 3 SREBP-1c F: 5 CGCTACCGTTCCTCTATCA
Supplementary Figure 1 a
 Supplementary Figure a Normalized expression/tbp (A.U.).6... Trip-br transcripts Trans Trans Trans b..5. Trip-br Ctrl LPS Normalized expression/tbp (A.U.) c Trip-br transcripts. adipocytes.... Trans Trans
Supplementary Information. MicroRNA-33b knock-in mice for an intron of sterol regulatory
 Supplementary Information MicroRNA-33b knock-in mice for an intron of sterol regulatory element-binding factor 1 (Srebf1) exhibit reduced HDL-C in vivo Takahiro Horie, Tomohiro Nishino, Osamu Baba, Yasuhide
SUPPLEMENTARY INFORMATION
 doi: 1.138/nature7221 Brown fat selective genes 12 1 Control Q-RT-PCR (% of Control) 8 6 4 2 Ntrk3 Cox7a1 Cox8b Cox5b ATPase b2 ATPase f1a1 Sirt3 ERRα Elovl3/Cig3 PPARα Zic1 Supplementary Figure S1. stimulates
SUPPLEMENTARY INFORMATION
 DOI:.38/ncb2822 a MTC02 FAO cells EEA1 b +/+ MEFs /DAPI -/- MEFs /DAPI -/- MEFs //DAPI c HEK 293 cells WCE N M C P AKT TBC1D7 Lamin A/C EEA1 VDAC d HeLa cells WCE N M C P AKT Lamin A/C EEA1 VDAC Figure
RAW264.7 cells stably expressing control shrna (Con) or GSK3b-specific shrna (sh-
 or GSK3b-specific shrna (sh-") 1 a b Supplementary Figure 1. Effects of GSK3b knockdown on poly I:C-induced cytokine production. RAW264.7 cells stably expressing control shrna (Con) or GSK3b-specific shrna (sh- GSK3b) were stimulated
1 a b Supplementary Figure 1. Effects of GSK3b knockdown on poly I:C-induced cytokine production. RAW264.7 cells stably expressing control shrna (Con) or GSK3b-specific shrna (sh- GSK3b) were stimulated
A Central Role of MG53 in Metabolic Syndrome. and Type-2 Diabetes
 A Central Role of MG53 in Metabolic Syndrome and Type-2 Diabetes Yan Zhang, Chunmei Cao, Rui-Ping Xiao Institute of Molecular Medicine (IMM) Peking University, Beijing, China Accelerated Aging in China
Supplementary Materials for
 www.sciencesignaling.org/cgi/content/full/7/308/ra4/dc1 Supplementary Materials for Antipsychotics Activate mtorc1-dependent Translation to Enhance Neuronal Morphological Complexity Heather Bowling, Guoan
hexahistidine tagged GRP78 devoid of the KDEL motif (GRP78-His) on SDS-PAGE. This
 on SDS-PAGE. This") SUPPLEMENTAL FIGURE LEGEND Fig. S1. Generation and characterization of. (A) Coomassie staining of soluble hexahistidine tagged GRP78 devoid of the KDEL motif (GRP78-His) on SDS-PAGE. This protein was expressed
SUPPLEMENTAL FIGURE LEGEND Fig. S1. Generation and characterization of. (A) Coomassie staining of soluble hexahistidine tagged GRP78 devoid of the KDEL motif (GRP78-His) on SDS-PAGE. This protein was expressed
a Supplementary Figure 1 Celastrol Withaferin A Individual drugs
 Supplementary Figure 1 a 17 27 HSPA1A SLC7A11 HMOX1 GSTA1 DUSP4 GML CHAC1 CDKN1A GSTA4 CA6 BHLHE41 NR1D1 HSPB1 PTX3 HP NFKBIA VDR MVD HAS2 ANGPT1 WDR6 TGFB3 IDI1 VCAM1 H1F HMGCS1 CXCL5 STEAP4 NOS2 b Enrichment
Supplementary Information
 Supplementary Information GADD34-deficient mice develop obesity, nonalcoholic fatty liver disease, hepatic carcinoma and insulin resistance Naomi Nishio and Ken-ichi Isobe Department of Immunology, Nagoya
SUPPLEMENTARY FIGURES AND TABLE
 SUPPLEMENTARY FIGURES AND TABLE Supplementary Figure S1: Characterization of IRE1α mutants. A. U87-LUC cells were transduced with the lentiviral vector containing the GFP sequence (U87-LUC Tet-ON GFP).
PKCδ regulates hepatic insulin sensitivity and hepatosteatosis in mice and humans
 Research article PKCδ regulates hepatic insulin sensitivity and hepatosteatosis in mice and humans Olivier Bezy, 1 Thien T. Tran, 1 Jussi Pihlajamäki, 2 Ryo Suzuki, 1 Brice Emanuelli, 1 Jonathan Winnay,
Tbk1-TKO! DN cells (%)! 15! 10!
! 15! 10!") a! T Cells! TKO! B Cells! TKO! b! CD4! 8.9 85.2 3.4 2.88 CD8! Tbk1-TKO! 1.1 84.8 2.51 2.54 c! DN cells (%)! 4 3 2 1 DP cells (%)! 9 8 7 6 CD4 + SP cells (%)! 5 4 3 2 1 5 TKO! TKO! TKO! TKO! 15 1 5 CD8
a! T Cells! TKO! B Cells! TKO! b! CD4! 8.9 85.2 3.4 2.88 CD8! Tbk1-TKO! 1.1 84.8 2.51 2.54 c! DN cells (%)! 4 3 2 1 DP cells (%)! 9 8 7 6 CD4 + SP cells (%)! 5 4 3 2 1 5 TKO! TKO! TKO! TKO! 15 1 5 CD8
SUPPLEMENTARY INFORMATION
 doi:10.1038/nature12652 Supplementary Figure 1. PRDM16 interacts with endogenous EHMT1 in brown adipocytes. Immunoprecipitation of PRDM16 complex by flag antibody (M2) followed by Western blot analysis
a b c Physical appearance of mice Lean mass Adipocyte size d e f
 LFD HFD LFD HFD Area under curve (GTT) HFD-VSL#3 LFD HFD Area under curve (ITT) HFD-VSL#3 Liver TG content (% l) HFD-VSL#3 LFD HFD HFD-VSL#3 LFD HFD HFD-VSL#3 LFD HFD HFD + VSL#3 Lean mass (gm) Mean adipocyte
Central injection of fibroblast growth factor 1 induces sustained remission of diabetic hyperglycemia in rodents
 Central injection of fibroblast growth factor 1 induces sustained remission of diabetic hyperglycemia in rodents Jarrad M Scarlett 1,,1, Jennifer M Rojas 1,1, Miles E Matsen 1, Karl J Kaiyala 3, Darko
Supplementary Fig. 1. GPRC5A post-transcriptionally down-regulates EGFR expression. (a) Plot of the changes in steady state mrna levels versus
 Plot of the changes in steady state mrna levels versus") Supplementary Fig. 1. GPRC5A post-transcriptionally down-regulates EGFR expression. (a) Plot of the changes in steady state mrna levels versus changes in corresponding proteins between wild type and Gprc5a-/-
Supplementary Fig. 1. GPRC5A post-transcriptionally down-regulates EGFR expression. (a) Plot of the changes in steady state mrna levels versus changes in corresponding proteins between wild type and Gprc5a-/-
SUPPLEMENTARY INFORMATION
 DOI: 10.1038/ncb2211 a! mir-143! b! mir-103/107! let-7a! mir-144! mir-122a! mir-126-3p! mir-194! mir-27a! mir-30c! Figure S1 Northern blot analysis of mir-143 expression dependent on feeding conditions.
Salt-inducible kinase 2 links transcriptional coactivator p300 phosphorylation to the prevention of ChREBP-dependent hepatic steatosis in mice
 Salt-inducible kinase 2 links transcriptional coactivator p300 phosphorylation to the prevention of ChREBP-dependent hepatic steatosis in mice Julien Bricambert,, Catherine Postic, Renaud Dentin J Clin
Supplemental Information Supplementary Table 1. Tph1+/+ Tph1 / Analyte Supplementary Table 2. Tissue Vehicle LP value
 Supplemental Information Supplementary Table. Urinary and adipose tissue catecholamines in Tph +/+ and Tph / mice fed a high fat diet for weeks. Tph +/+ Tph / Analyte ewat ibat ewat ibat Urine (ng/ml)
Supplementary Figure 1. PAQR3 knockdown inhibits SREBP-2 processing in CHO-7 cells CHO-7 cells were transfected with control sirna or a sirna
 Supplementary Figure 1. PAQR3 knockdown inhibits SREBP-2 processing in CHO-7 cells CHO-7 cells were transfected with control sirna or a sirna targeted for hamster PAQR3. At 24 h after the transfection,
Baf60c drives glycolytic muscle formation and improves glucose homeostasis through Deptor-mediated Akt activation
 Baf6c drives glycolytic muscle formation and improves glucose homeostasis through Deptor-mediated Akt activation Zhuo-Xian Meng,2, Siming Li,2, Lin Wang,2, Hwi Jin Ko 3, Yongjin Lee 3, Dae Young Jung 3,
Figure S1. Body composition, energy homeostasis and substrate utilization in LRH-1 hep+/+ (white bars) and LRH-1 hep-/- (black bars) mice.
 and LRH-1 hep-/- (black bars) mice.") Figure S1. Body composition, energy homeostasis and substrate utilization in LRH-1 hep+/+ (white bars) and LRH-1 hep-/- (black bars) mice. (A) Lean and fat masses, determined by EchoMRI. (B) Food and water
Figure S1. Body composition, energy homeostasis and substrate utilization in LRH-1 hep+/+ (white bars) and LRH-1 hep-/- (black bars) mice. (A) Lean and fat masses, determined by EchoMRI. (B) Food and water
Figure S1A. Blood glucose levels in mice after glucose injection
 ## Figure S1A. Blood glucose levels in mice after glucose injection Blood glucose (mm/l) 25 2 15 1 5 # 15 3 6 3+3 Time after glucose injection (min) # Figure S1B. α-kg levels in mouse livers after glucose
SUPPLEMENTARY FIGURES
 SUPPLEMENTARY FIGURES Figure S1. Effect of a HFD on the Acox gene expression in the livers of WT and IL-6 -/- mice. Expression of Acox in the livers of WT and IL-6 -/- mice fed STD or HFD determined through
Supplemental Table 1. List of primers used for real time PCR.
 Supplemental Table 1. List of primers used for real time PCR. Primer Sequence Primer Sequence Mouse Pcsk9-F TTGCAGCAGCTGGGAACTT Mouse Scd1-F CATCATTCTCATGGTCCTGCT Mouse Pcsk9-R CCGACTGTGATGACCTCTGGA Mouse
control kda ATGL ATGLi HSL 82 GAPDH * ** *** WT/cTg WT/cTg ATGLi AKO/cTg AKO/cTg ATGLi WT/cTg WT/cTg ATGLi AKO/cTg AKO/cTg ATGLi iwat gwat ibat
 body weight (g) tissue weights (mg) ATGL protein expression (relative to GAPDH) HSL protein expression (relative to GAPDH) ### # # kda ATGL 55 HSL 82 GAPDH 37 2.5 2. 1.5 1..5 2. 1.5 1..5.. Supplementary
Supplementary Figure 1. Blood glucose and insulin levels in mice during 4-day infusion.
 Supplementary Figure 1. Blood glucose and insulin levels in mice during 4-day infusion. (A-B) WT and HT mice infused with saline or glucose had overlapping achieved blood glucose and insulin levels, necessitating
The lipogenic transcription factor ChREBP dissociates hepatic steatosis from insulin resistance in mice and humans
 Research article The lipogenic transcription factor ChREBP dissociates hepatic steatosis from insulin resistance in mice and humans Fadila Benhamed, 1,2,3 Pierre-Damien Denechaud, 1,2,3 Maud Lemoine, 4,5,6
Supplementary Materials
 Supplementary Materials 1 Supplementary Table 1. List of primers used for quantitative PCR analysis. Gene name Gene symbol Accession IDs Sequence range Product Primer sequences size (bp) β-actin Actb gi
Supplemental Table 1: Demographics and characteristics of study participants. Male, n (%) 3 (20%) 6 (50%) Age, years [mean ± SD] 33.3 ± ± 9.
![Supplemental Table 1: Demographics and characteristics of study participants. Male, n (%) 3 (20%) 6 (50%) Age, years [mean ± SD] 33.3 ± ± 9.](/thumbs/90/103696086.jpg "Supplemental Table 1: Demographics and characteristics of study participants. Male, n (%) 3 (20%) 6 (50%) Age, years [mean ± SD] 33.3 ± ± 9.") SUPPLEMENTAL DATA Supplemental Table 1: Demographics and characteristics of study participants Lean (n=15) Obese (n=12) Male, n (%) 3 (20%) 6 (50%) Age, years [mean ± SD] 33.3 ± 9.5 44.8 ± 9.1 White, n
SUPPLEMENTAL DATA Supplemental Table 1: Demographics and characteristics of study participants Lean (n=15) Obese (n=12) Male, n (%) 3 (20%) 6 (50%) Age, years [mean ± SD] 33.3 ± 9.5 44.8 ± 9.1 White, n
Supplementary Information. Glycogen shortage during fasting triggers liver-brain-adipose. neurocircuitry to facilitate fat utilization
 Supplementary Information Glycogen shortage during fasting triggers liver-brain-adipose neurocircuitry to facilitate fat utilization Supplementary Figure S1. Liver-Brain-Adipose neurocircuitry Starvation
GENE Forward primer Reverse primer FABP4 CCTTTGTGGGGACCTGGAAA TGACCGGATGACGACCAAGT CD68 AATGTGTCCTTCCCACAAGC GGCAGCAAGAGAGATTGGTC
 Published in "" which should be cited to refer to this work. mrna extraction and RT-PCR Total RNA from 5 15 mg of crushed white adipose tissue was isolated using the technique described by Chomczynski
IL-6Rα IL-6RαT-KO KO. IL-6Rα f/f bp. f/f 628 bp deleted 368 bp. 500 bp
 STD H 2 O WT KO IL-6Rα f/f IL-6Rα IL-6RαT-KO KO 1000 bp 500 bp f/f 628 bp deleted 368 bp Supplementary Figure 1 Confirmation of T-cell IL-6Rα deficiency. (a) Representative histograms and (b) quantification
Supplemental Information. FGF19, FGF21, and an FGFR1/b-Klotho-Activating. Antibody Act on the Nervous System. to Regulate Body Weight and Glycemia
 Cell Metabolism, Volume 26 Supplemental Information FGF19, FGF21, and an FGFR1/b-Klotho-Activating Antibody Act on the Nervous System to Regulate Body Weight and Glycemia Tian Lan, Donald A. Morgan, Kamal
Supplemental Fig. 1. Relative mrna Expression. Relative mrna Expression WT KO WT KO RT 4 0 C
 Supplemental Fig. 1 A 1.5 1..5 Hdac11 (ibat) n=4 n=4 n=4 n=4 n=4 n=4 n=4 n=4 WT KO WT KO WT KO WT KO RT 4 C RT 4 C Supplemental Figure 1. Hdac11 mrna is undetectable in KO adipose tissue. Quantitative
Hepatic Insulin Signaling Is Required for Obesity-Dependent Expression of SREBP-1c mrna but Not for Feeding-Dependent Expression
 Article Hepatic Insulin Signaling Is Required for Obesity-Dependent Expression of SREBP-c mrna but Not for Feeding-Dependent Expression Joel T. Haas,,8 Ji Miao, 3,8 Dipanjan Chanda, 3 Yanning Wang, 3 Enpeng
Predictive PP1Ca binding region in BIG3 : 1,228 1,232aa (-KAVSF-) HEK293T cells *** *** *** KPL-3C cells - E E2 treatment time (h)
 HEK293T cells *** *** *** KPL-3C cells - E E2 treatment time (h)") Relative expression ERE-luciferase activity activity (pmole/min) activity (pmole/min) activity (pmole/min) activity (pmole/min) MCF-7 KPL-3C ZR--1 BT-474 T47D HCC15 KPL-1 HBC4 activity (pmole/min) a d
Relative expression ERE-luciferase activity activity (pmole/min) activity (pmole/min) activity (pmole/min) activity (pmole/min) MCF-7 KPL-3C ZR--1 BT-474 T47D HCC15 KPL-1 HBC4 activity (pmole/min) a d
Male 30. Female. Body weight (g) Age (weeks) Age (weeks) Atg7 f/f Atg7 ΔCD11c
 Age (weeks) Age (weeks) Atg7 f/f Atg7 ΔCD11c") ody weight (g) ody weight (g) 34 3 Male 3 27 Female 26 24 22 18 7 9 11 13 15 17 19 21 23 21 18 15 7 9 11 13 15 17 19 21 23 Age (weeks) Age (weeks) Supplementary Figure 1. Lean phenotypes in mice regardless
ody weight (g) ody weight (g) 34 3 Male 3 27 Female 26 24 22 18 7 9 11 13 15 17 19 21 23 21 18 15 7 9 11 13 15 17 19 21 23 Age (weeks) Age (weeks) Supplementary Figure 1. Lean phenotypes in mice regardless
Rescue of mutant rhodopsin traffic by metformin-induced AMPK activation accelerates photoreceptor degeneration Athanasiou et al
 Supplementary Material Rescue of mutant rhodopsin traffic by metformin-induced AMPK activation accelerates photoreceptor degeneration Athanasiou et al Supplementary Figure 1. AICAR improves P23H rod opsin
KSRP is critical in governing hepatic lipid metabolism
 KSRP is critical in governing hepatic lipid metabolism through controlling Per2 expression Chu-Fang Chou, 1, * Xiaolin Zhu, 1, Yi-Yu Lin, * Karen L. Gamble, W. Timothy Garvey, and Ching-Yi Chen 2, * Department
Supplementary Figure 1. Characterization of NMuMG-ErbB2 and NIC breast cancer cells expressing shrnas targeting LPP. NMuMG-ErbB2 cells (a) and NIC
 and NIC") Supplementary Figure 1. Characterization of NMuMG-ErbB2 and NIC breast cancer cells expressing shrnas targeting LPP. NMuMG-ErbB2 cells (a) and NIC cells (b) were engineered to stably express either a LucA-shRNA
Supplementary Figure 1. Characterization of NMuMG-ErbB2 and NIC breast cancer cells expressing shrnas targeting LPP. NMuMG-ErbB2 cells (a) and NIC cells (b) were engineered to stably express either a LucA-shRNA
Crucial role of a long-chain fatty acid elongase, Elovl6, in obesity-induced insulin resistance
 Crucial role of a long-chain fatty acid elongase, Elovl6, in obesity-induced insulin resistance 7 Nature Publishing Group http://www.nature.com/naturemedicine Takashi Matsuzaka,, Hitoshi Shimano,, Naoya
Supporting Information
 Supporting Information Charalambous et al. 10.1073/pnas.1406119111 SI Experimental Procedures Serum and Tissue Biochemistry. Enzymatic assay kits were used for determination of plasma FFAs (Roche), TAGs
SUPPLEMENTARY DATA. Supplementary Table 1. Primers used in qpcr
 Supplementary Table 1. Primers used in qpcr Gene forward primer (5'-3') reverse primer (5'-3') β-actin AGAGGGAAATCGTGCGTGAC CAATAGTGATGACCTGGCCGT Hif-p4h-2 CTGGGCAACTACAGGATAAAC GCGTCCCAGTCTTTATTTAGATA
p = formed with HCI-001 p = Relative # of blood vessels that formed with HCI-002 Control Bevacizumab + 17AAG Bevacizumab 17AAG
 A.. Relative # of ECs associated with HCI-001 1.4 1.2 1.0 0.8 0.6 0.4 0.2 0.0 ol b p < 0.001 Relative # of blood vessels that formed with HCI-001 1.4 1.2 1.0 0.8 0.6 0.4 0.2 0.0 l b p = 0.002 Control IHC:
ANSC/NUTR 601 GENERAL ANIMAL NUTRITION Stearoyl-CoA desaturase, VLDL metabolism, and obesity
 ANSC/NUTR 601 GENERAL ANIMAL NUTRITION Stearoyl-CoA desaturase, VLDL metabolism, and obesity I. Stearoyl coenzyme A desaturase and obesity in rodents A. Stearoyl coenzyme A desaturase (SCD) is the 9 desaturase.
Supplementary Information. Protectin DX alleviates insulin resistance by activating a myokine-liver glucoregulatory axis.
 Supplementary Information Protectin DX alleviates insulin resistance by activating a myokine-liver glucoregulatory axis. Phillip J. White, Philippe St-Pierre, Alexandre Charbonneau, Patricia Mitchell,
SUPPLEMENTARY INFORMATION
 Supplementary Figures Supplementary Figure S1. Binding of full-length OGT and deletion mutants to PIP strips (Echelon Biosciences). Supplementary Figure S2. Binding of the OGT (919-1036) fragments with
SUPPLEMENTARY INFORMATION
 SUPPLEMENTARY INFORMATION FOR Liver X Receptor α mediates hepatic triglyceride accumulation through upregulation of G0/G1 Switch Gene 2 (G0S2) expression I: SUPPLEMENTARY METHODS II: SUPPLEMENTARY FIGURES
Supplementary Figure 1. Repression of hepcidin expression in the liver of mice treated with
 Supplementary Figure 1. Repression of hepcidin expression in the liver of mice treated with DMN Immunohistochemistry for hepcidin and H&E staining (left). qrt-pcr assays for hepcidin in the liver (right).
Metabolism dysregulation induces a specific lipid signature of nonalcoholic steatohepatitis in patients
 Metaolism dysregulation induces a specific lipid signature of nonalcoholic steatohepatitis in patients Franck Chiappini, Audrey Coilly, Hanane Kadar, Philippe Gual, Alert Tran, Christophe Desterke, Didier
HIV VPR alters fat metabolism. Dorothy E Lewis PhD/Ashok Balasubramanyam MD
 HIV VPR alters fat metabolism Dorothy E Lewis PhD/Ashok Balasubramanyam MD Old Dogma for HIV associated lipodystrophy Differentiation Block (PI) Lipoatrophy Apoptosis (NRTI) Stem cell Preadipocyte Adipocyte
Supplementary Figure 1: si-craf but not si-braf sensitizes tumor cells to radiation.
 Supplementary Figure 1: si-craf but not si-braf sensitizes tumor cells to radiation. (a) Embryonic fibroblasts isolated from wildtype (WT), BRAF -/-, or CRAF -/- mice were irradiated (6 Gy) and DNA damage
Supplementary Figure S1. Effect of Glucose on Energy Balance in WT and KHK A/C KO
 Supplementary Figure S1. Effect of Glucose on Energy Balance in WT and KHK A/C KO Mice. WT mice and KHK-A/C KO mice were provided drinking water containing 10% glucose or tap water with normal chow ad
Supplementary Figure 1) GABAergic enhancement by leptin hyperpolarizes POMC neurons A) Representative recording samples showing the membrane
 GABAergic enhancement by leptin hyperpolarizes POMC neurons A) Representative recording samples showing the membrane") Supplementary Figure 1) GABAergic enhancement by leptin hyperpolarizes POMC neurons A) Representative recording samples showing the membrane potential recorded from POMC neurons following treatment with
Supplementary Figure 1) GABAergic enhancement by leptin hyperpolarizes POMC neurons A) Representative recording samples showing the membrane potential recorded from POMC neurons following treatment with
Supplementary Figure 1. Expression of CUGBP1 in non-parenchymal liver cells treated with TGF-β
 Supplementary Figures Supplementary Figure 1. Expression of CUGBP1 in non-parenchymal liver cells treated with TGF-β and LPS. Non-parenchymal liver cells were isolated and treated with or without TGF-β
SET-ting the Stage for SREBP Dependent Regulation of Lipid Metabolism
 SET-ting the Stage for SREBP Dependent Regulation of Lipid Metabolism SET-ting the Stage for SREBP Dependent Regulation of Lipid Metabolism Sterol Regulatory Element Binding Proteins (SREBPs) relative
a b c d e C 3 ]Aspartate [ 20 minutes C 3 ]Hexose-P * * *
![a b c d e C 3 ]Aspartate [ 20 minutes C 3 ]Hexose-P * * *](/thumbs/92/110334219.jpg "a b c d e C 3 ]Aspartate [ 20 minutes C 3 ]Hexose-P * * *") Supplemental Figure 1 Metabolic flux with [U- C]Lactate - [ 12 C]Glutamine in primary hepatocytes a b c d e [ C 3 ]Pyruvate [ C 3 ]Malate [ C 3 ]Aspartate [ C 3 ]Citrate [ C 2 ] -Ketoglutarate f g h [
Supplemental Figure 1 Metabolic flux with [U- C]Lactate - [ 12 C]Glutamine in primary hepatocytes a b c d e [ C 3 ]Pyruvate [ C 3 ]Malate [ C 3 ]Aspartate [ C 3 ]Citrate [ C 2 ] -Ketoglutarate f g h [
GPR120 *** * * Liver BAT iwat ewat mwat Ileum Colon. UCP1 mrna ***
 a GPR120 GPR120 mrna/ppia mrna Arbitrary Units 150 100 50 Liver BAT iwat ewat mwat Ileum Colon b UCP1 mrna Fold induction 20 15 10 5 - camp camp SB202190 - - - H89 - - - - - GW7647 Supplementary Figure
The Enhancement of Toxin-Induced Liver Fibrosis in Fatty Liver Disease. Ekihiro Seki, M.D.,Ph.D. University of California San Diego
 The Enhancement of Toxin-Induced Liver Fibrosis in Fatty Liver Disease Ekihiro Seki, M.D.,Ph.D. University of California San Diego - A manufactured chemical. - Does not exist naturally. Carbon tetrachloride
Interplay between FGF21 and insulin action in the liver regulates metabolism
 Research article Interplay between FGF21 and insulin action in the liver regulates metabolism Brice Emanuelli, 1 Sara G. Vienberg, 1 Graham Smyth, 1 Christine Cheng, 2 Kristin I. Stanford, 1 Manimozhiyan
perk/erk STAT5B
 pakt/akt relative to saline (fold).5.5.5 control perk/erk relative to saline (fold).6.4..8.6.4. p=.6 control db/+ Hsp6 VDAC Hsp6/VDAC (relative to db/+) 8 6 4 db/+ C db/+ Hsp6 Hsp6/actin (relative to db/+)