Nature Structural & Molecular Biology: doi: /nsmb.3218
|
|
|
- Brendan Hamilton
- 6 years ago
- Views:
Transcription
1
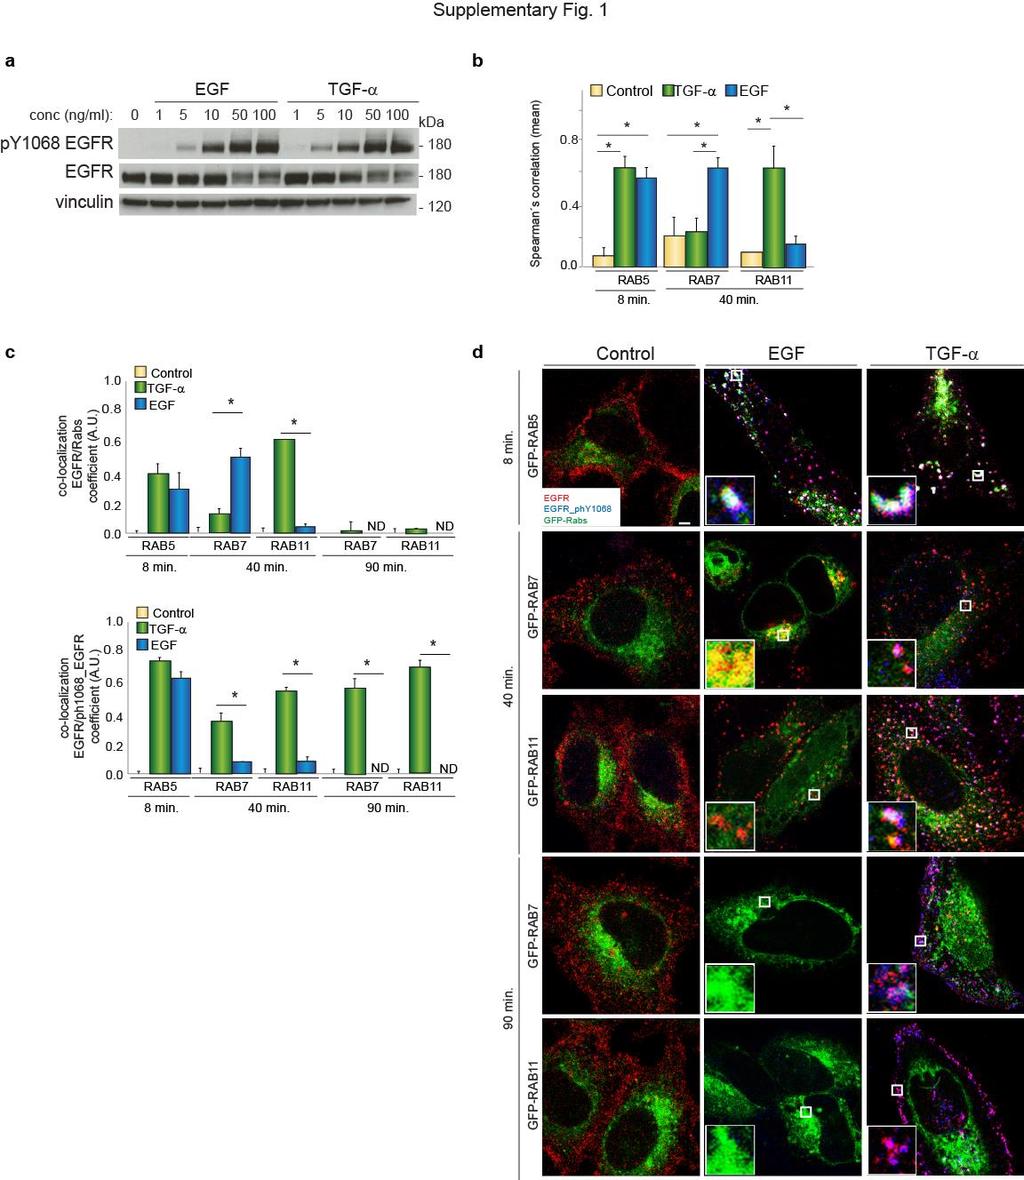
2 Supplementary Figure 1 Endogenous EGFR trafficking and responses depend on biased ligands. (a) Lysates from HeLa cells stimulated for 2 min. with increasing concentration of ligands were immunoblotted as indicated. (b) Object-based co-localization (see Online Methods) of the experiment shown in Fig. 1d. Values in the graph represent the median ± SD of four images from independent experiments. *, p value<0.02 (Wilcoxon test with alpha 0.05). These results were consistent with those shown in Fig. 1c. (c) Quantification (see Online Methods) of the presence of EGFR in endocytic markers-positive regions upon EGF- or TGF- - stimulation. Values in the graph represent the means ± SD. of three experiments. A.U., arbitrary units.*, p value<0.01. (d) Representative images from (c), showing the presence of EGF- or TGF- -stimulated EGFR (red) in intracellular markers (green)-positive regions at different time intervals. Activated EGFR is in blue. Bar, 5 m. See also Supplementary Data Set 1 for uncropped gels.
3
4 Supplementary Figure 2 Assessment of the multilayered proteomics dataset shows overall data quality. (a) Experimental design of MS-based quantitative analysis of EGF- and TGF- -induced signaling dynamics and changes in protein abundance. (b) The correlation of each of the five data sets shows good reproducibility between biological replicates. The distribution of peptide mass error (c) and peptide intensity (d) shows that most of the peptides were identified with high mass accuracy (mass error less than 2 p.p.m.) and high intensity. (e) Number of identified sites and proteins at each time point. See Fig.3a for number of regulated sites at each time point. (f) Distribution of Serine (Ser), Threonine (Thr) and Tyrosine (Tyr) phosphorylated sites identified in this study. (g) Distribution of phosphopeptides with one, two, or more phosphorylated sites. (h) Distribution of ubiquitylated peptides with one, two, or more ubiquitylated sites.
5
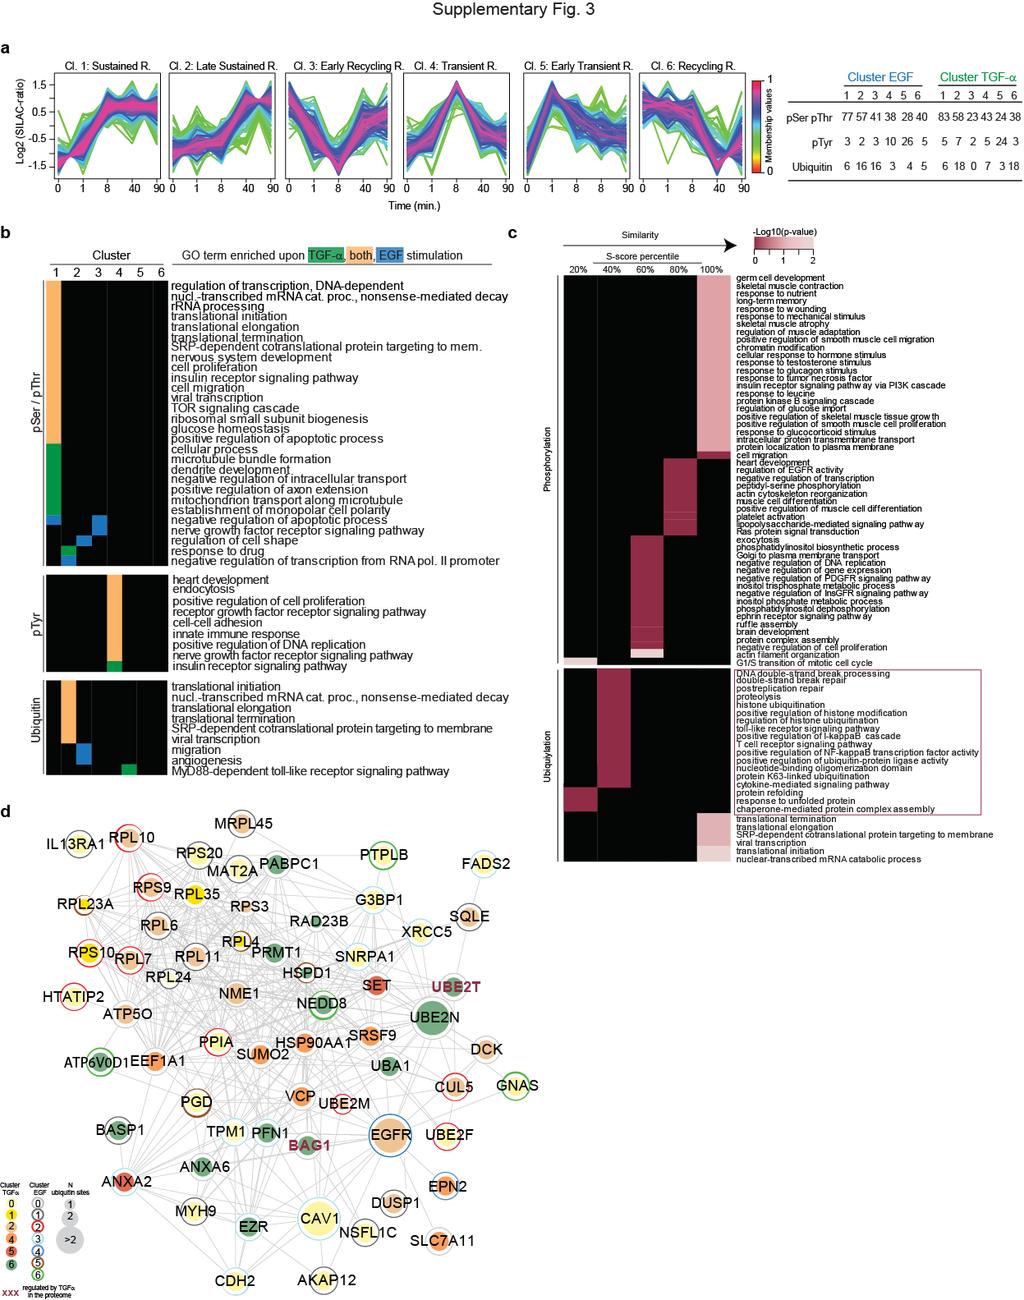
6 Supplementary Figure 3 Clustering and S-score analyses reveal ligand-dependent regulation of phosphorylation and ubiquitination. (a) Left, clustering based on fuzzy c-means of the 330 phosphorylation sites and 52 ubiquitylated sites quantified at all time points. Right, number of sites in each cluster. Each cluster included both phosphorylated and ubiquitylated sites whose SILAC ratios were as similar as possible within the same cluster and as dissimilar as possible between clusters (see Online Methods). However, sites with similar patterns were not necessarily co-regulated and sites could belong to more than one cluster. For instance, phosphorylated tyrosine 998 on EGFR belonged to cluster 4 in case of EGF-stimulated cells and to cluster 1 in case of TGF- -treated samples. This indicates a different regulation based on experimental conditions. Ubiquitylated lysine K867 on EGFR belonged to cluster 4 in case of EGF-stimulated cells, showing similar regulation as tyrosine 998. On the contrary, it was found in cluster 5 in TGF- -treated samples, suggesting again context-dependent regulation. (b) GO terms enrichment analysis of clustering shown in (a). (c) Phosphorylation and ubiquitylation sites were portioned in five equally sized groups based on S-score (Rigbolt, K.T. et al. Sci Signal 4, rs3, 2011), and each group was tested for over-represented GO Biological Process terms compared to the sites from the remaining groups. Enriched GO terms for the most stimulus-specific sites are found at the left (S score<40) whereas events common to both stimuli increase towards the right (S score >40). The results are color-coded to indicate the S-score percentile bins where the GO term was found over-represented. GO terms with S- score <40, whose members are shown in (d), are highlighted in the magenta box. (d) Overview of the 66 ubiquitylated proteins that are differentially regulated between EGF and TGF- color-coded based on the clustering shown in (a). Two proteins have been found to be specifically regulated by TGF- the late proteome analysis (magenta font). in
7
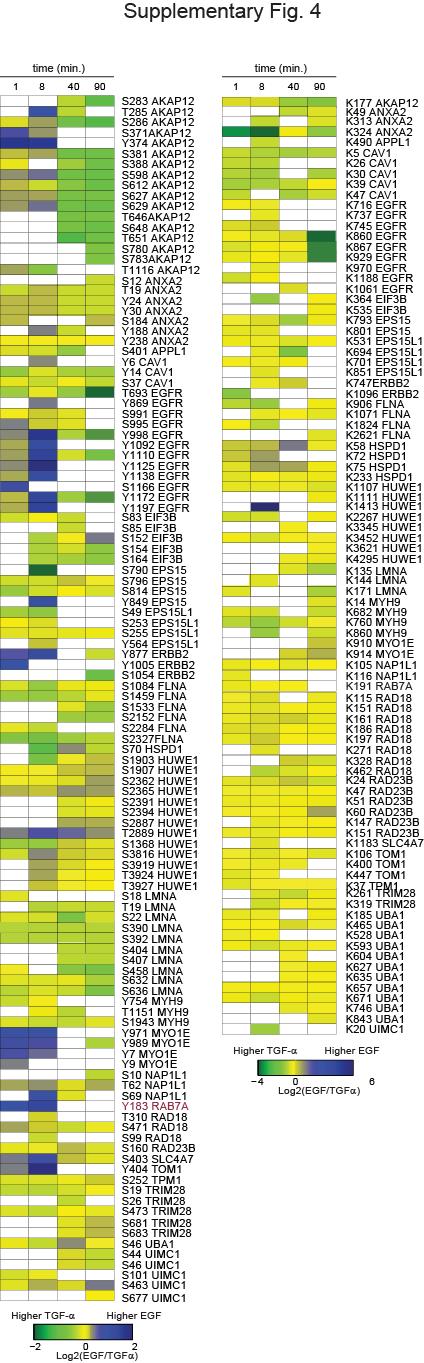
8 Supplementary Figure 4 The cross-talk between phosphorylation and ubiquitination is stimulus dependent. Heat maps of the 25 doubly modified proteins shown in Fig.4d-e and color-coded according to regulation upon EGF or TGF- Phosphorylated proteins are shown on the left and ubiquitylated proteins on the right. The validated candidate Rab7A is shown in magenta.
9 Supplementary Figure 5 RAB7 phosphorylation on Y183 is enhanced by EGF. (a) Experimental design of MS-based quantitative analysis of EGF- or TGF- -dependent phosphoproteome in HeLa cells stimulated for 1, 8, 90 min.. (b) The correlation between EGF vs. TGF- -stimulated cells in two biological replicates shows an overall similar phosphoproteome. The proteins whose phosphorylated site is differentially regulated upon one or the other stimulus are highlighted in colors (blue, EGF regulated; green, TGF- regulated). (c, d) Quantitation by MS of Erk1 and Erk2 Y202/T204-containing doubly phosphorylated peptide (c) and Rab7 Y183 phosphorylated peptide (d) upon EGF (blue) or TGF- (green) stimulation. Values are the median ± SD of two replicates. A.U., arbitrary units In (d) the values of the experiment shown in Supplementary Table 2 are also reported for comparison.. Data presented in (c) confirmed the temporal profiles of Erk activation shown in Fig. 2d-f and in Supplementary Tables 2 and 6.
10
11 Supplementary Figure 6 RAB7 phosphorylation on Y183 influences the RAB7 interactome. (a) Experimental design of MS-based quantitative analysis of EGF-stimulated cells transfected with Rab7 or its mutant. (b) The correlation of the two biological replicates shows good reproducibility. (c) Ion extracted chromatogram of the wild type and Y F mutant Rab7 peptide. (d) Full-scan MS (left) and representative MS/MS spectrum (right) of the ubiquitylated K191 peptide of wt and mutant Rab7. (d) Table with information of the chemical composition of the Rab7 peptides. (e) List of the significant interactors of mutant Rab7 with a role in endocytosis upon EGF stimulation. (f) Lysates from notstimulated HeLa cells transfected with Rab7-GFP were immunoblotted as indicated. See also Supplementary Data Set 1 for uncropped gels.
12
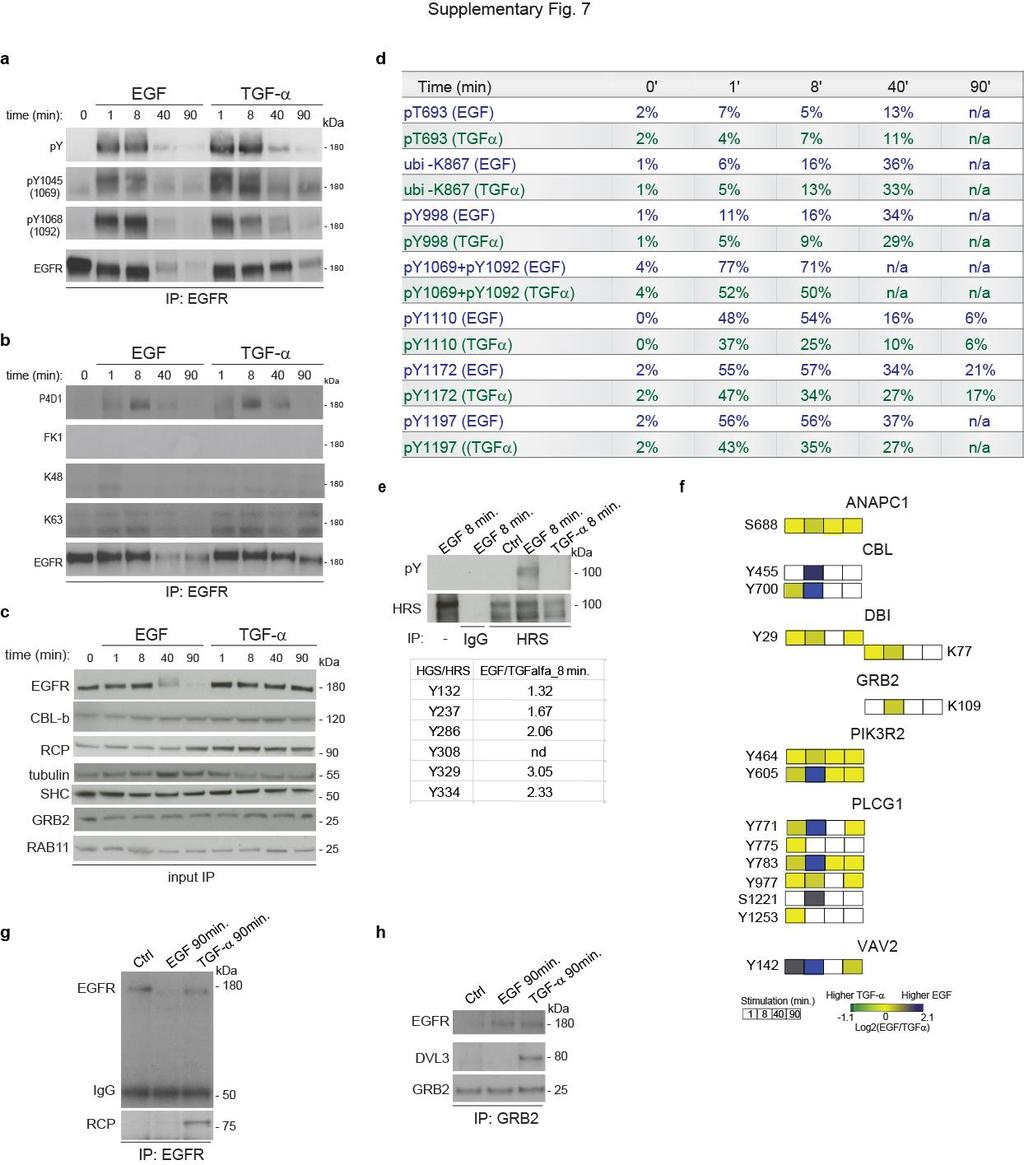
13 Supplementary Figure 7 The phosphorylation and ubiquitination patterns on EGFR and EGFR interactors are ligand dependent. (a, b) Lysates from stimulated cells were immunoprecipitated and immunoblotted with the indicated antibodies. py, anti-phosphorylated Tyr antibody. py1045, anti-phosphorylated Tyr1045 antibody. This antibody recognizes Y1069 on EGFR sequence. py1068, anti-phosphorylated Tyr1068 antibody. This antibody recognizes Y1092 on EGFR sequence. P4D1, antibody recognizing both polyubiquitin and monoubiquitin (Haglund, K. et al., Nat Cell Biol 5, ). FK1, antibody recognizing only polyubiquitin (both as ubiquitin monomers and polymers) but not single ubiquitin monomers 2. Since EGFR was immunoreactive with P4D1 but not with FK1 antibody, we concluded that the receptor was monoubiquitinated. Monoubiquitination has a role in lysosomal degradation, protein-protein interaction or recruitment to a certain sub-cellular compartment (Komander, D. & Rape, M. Annu Rev Biochem 81, ). K48, antibody recognizing ubiquitin linked to Lysine 48, a marker for proteasomal degradation or transcription factor regulation Komander, D. & Rape, M. Annu Rev Biochem 81, ). K63, antibody recognizing ubiquitin linked to Lysine 63, a marker for lysosomal degradation, signaling, receptor trafficking or protein-protein interaction 3. (c) Lysates from stimulated HeLa cells were immunoblotted as indicated before immunoprecipitation. (d) Summary of the estimated occupancy of phosphorylated tyrosine and ubiquitylated lysine residues on EGFR at different time points. (e) Top, lysates from stimulated HeLa cells were immunoblotted as indicated before immunoprecipitation of HRS (also known as HGS). Bottom, log2 ratio of the difference between EGF and TGF- of the identified phosphorylated tyrosine residues on HRS at 8 min. stimulation These data together indicate that HRS was more phosphorylated on tyrosine residues upon EGF than upon TGFstimulation. (f) Overview of the PTM regulation on the EGFR interactors identified by MS. Each square indicates a time point and the color-scale represents the difference between the regulation upon EGF divided by the regulation upon TGF- stimulation. (g, h) Lysates from stimulated HeLa cells were immunoprecipitated and immunoblotted with the indicated antibodies. See also Supplementary Data Set 1 for uncropped gels.
Department of Chemistry, Université de Montréal, C.P. 6128, Succursale centre-ville, Montréal, Québec, H3C 3J7, Canada.
 Phosphoproteome dynamics of Saccharomyces cerevisiae under heat shock and cold stress Evgeny Kanshin 1,5, Peter Kubiniok 1,2,5, Yogitha Thattikota 1,3, Damien D Amours 1,3 and Pierre Thibault 1,2,4 * 1
Supplementary Figure 1. PD-L1 is glycosylated in cancer cells. (a) Western blot analysis of PD-L1 in breast cancer cells. (b) Western blot analysis
 Western blot analysis of PD-L1 in breast cancer cells. (b) Western blot analysis") Supplementary Figure 1. PD-L1 is glycosylated in cancer cells. (a) Western blot analysis of PD-L1 in breast cancer cells. (b) Western blot analysis of PD-L1 in ovarian cancer cells. (c) Western blot analysis
Supplementary Figure 1. PD-L1 is glycosylated in cancer cells. (a) Western blot analysis of PD-L1 in breast cancer cells. (b) Western blot analysis of PD-L1 in ovarian cancer cells. (c) Western blot analysis
Nature Structural and Molecular Biology: doi: /nsmb Supplementary Figure 1
 Supplementary Figure 1 Mutational analysis of the SA2-Scc1 interaction in vitro and in human cells. (a) Autoradiograph (top) and Coomassie stained gel (bottom) of 35 S-labeled Myc-SA2 proteins (input)
Supplementary Materials for
 www.sciencesignaling.org/cgi/content/full/6/278/rs11/dc1 Supplementary Materials for In Vivo Phosphoproteomics Analysis Reveals the Cardiac Targets of β-adrenergic Receptor Signaling Alicia Lundby,* Martin
Supplementary Materials for
 www.sciencesignaling.org/cgi/content/full/8/364/ra18/dc1 Supplementary Materials for The tyrosine phosphatase (Pez) inhibits metastasis by altering protein trafficking Leila Belle, Naveid Ali, Ana Lonic,
Supplementary Materials for
 www.sciencesignaling.org/cgi/content/full/8/398/rs12/dc1 Supplementary Materials for Quantitative phosphoproteomics reveals new roles for the protein phosphatase PP6 in mitotic cells Scott F. Rusin, Kate
Supplementary Materials for
 www.sciencesignaling.org/cgi/content/full/7/308/ra4/dc1 Supplementary Materials for Antipsychotics Activate mtorc1-dependent Translation to Enhance Neuronal Morphological Complexity Heather Bowling, Guoan
SUPPLEMENTAL FIGURE LEGENDS
 SUPPLEMENTAL FIGURE LEGENDS Supplemental Figure S1: Endogenous interaction between RNF2 and H2AX: Whole cell extracts from 293T were subjected to immunoprecipitation with anti-rnf2 or anti-γ-h2ax antibodies
Nature Biotechnology: doi: /nbt Supplementary Figure 1. Experimental design and workflow utilized to generate the WMG Protein Atlas.
 Supplementary Figure 1 Experimental design and workflow utilized to generate the WMG Protein Atlas. (a) Illustration of the plant organs and nodule infection time points analyzed. (b) Proteomic workflow
Supplementary Figure 1.TRIM33 binds β-catenin in the nucleus. a & b, Co-IP of endogenous TRIM33 with β-catenin in HT-29 cells (a) and HEK 293T cells
 and HEK 293T cells") Supplementary Figure 1.TRIM33 binds β-catenin in the nucleus. a & b, Co-IP of endogenous TRIM33 with β-catenin in HT-29 cells (a) and HEK 293T cells (b). TRIM33 was immunoprecipitated, and the amount of
Supplementary Figure 1.TRIM33 binds β-catenin in the nucleus. a & b, Co-IP of endogenous TRIM33 with β-catenin in HT-29 cells (a) and HEK 293T cells (b). TRIM33 was immunoprecipitated, and the amount of
Supplementary Materials for
 www.sciencesignaling.org/cgi/content/full/6/283/ra57/dc1 Supplementary Materials for JNK3 Couples the Neuronal Stress Response to Inhibition of Secretory Trafficking Guang Yang,* Xun Zhou, Jingyan Zhu,
Supplementary Materials
 Supplementary Materials Supplementary Figure S1 Regulation of Ubl4A stability by its assembly partner A, The translation rate of Ubl4A is not affected in the absence of Bag6. Control, Bag6 and Ubl4A CRISPR
Appendix. Table of Contents
 Appendix Table of Contents Appendix Figures Figure S1: Gp78 is not required for the degradation of mcherry-cl1 in Hela Cells. Figure S2: Indel formation in the MARCH6 sgrna targeted HeLa clones. Figure
SUPPLEMENTARY INFORMATION
 doi:10.1038/nature10962 Supplementary Figure 1. Expression of AvrAC-FLAG in protoplasts. Total protein extracted from protoplasts described in Fig. 1a was subjected to anti-flag immunoblot to detect AvrAC-FLAG
Supplementary Fig. 1. GPRC5A post-transcriptionally down-regulates EGFR expression. (a) Plot of the changes in steady state mrna levels versus
 Plot of the changes in steady state mrna levels versus") Supplementary Fig. 1. GPRC5A post-transcriptionally down-regulates EGFR expression. (a) Plot of the changes in steady state mrna levels versus changes in corresponding proteins between wild type and Gprc5a-/-
Supplementary Fig. 1. GPRC5A post-transcriptionally down-regulates EGFR expression. (a) Plot of the changes in steady state mrna levels versus changes in corresponding proteins between wild type and Gprc5a-/-
SUPPLEMENTARY FIGURES
 SUPPLEMENTARY FIGURES Figure S1. Clinical significance of ZNF322A overexpression in Caucasian lung cancer patients. (A) Representative immunohistochemistry images of ZNF322A protein expression in tissue
4.2 RESULTS AND DISCUSSION
 phosphorylated proteins on treatment with Erlotinib.This chapter describes the finding of the SILAC experiment. 4.2 RESULTS AND DISCUSSION This is the first global report of its kind using dual strategies
Tyrosine phosphorylation and protein degradation control the transcriptional activity of WRKY involved in benzylisoquinoline alkaloid biosynthesis
 Supplementary information Tyrosine phosphorylation and protein degradation control the transcriptional activity of WRKY involved in benzylisoquinoline alkaloid biosynthesis Yasuyuki Yamada, Fumihiko Sato
EGF receptor transactivation is crucial for cholinergic MAP kinase signaling in human keratinocytes
 1st Electronic Conference on Molecular Science EGF receptor transactivation is crucial for cholinergic MAP kinase signaling in human keratinocytes Wymke Ockenga, Sina Kühne, Antje Banning and Ritva Tikkanen
Supplementary Figure 1
 Supplementary Figure 1 6 HE-50 HE-116 E-1 HE-108 Supplementary Figure 1. Targeted drug response curves of endometrial cancer cells. Endometrial cancer cell lines were incubated with serial dilutions of
crossmark Ca V subunits interact with the voltage-gated calcium channel
 crossmark THE JOURNAL OF BIOLOGICAL CHEMISTRY VOL. 291, NO. 39, pp. 20402 20416, September 23, 2016 Author s Choice 2016 by The American Society for Biochemistry and Molecular Biology, Inc. Published in
SUPPLEMENTARY INFORMATION
 DOI: 10.1038/ncb3311 A B TSC2 -/- MEFs C Rapa Hours WCL 0 6 12 24 36 pakt.s473 AKT ps6k S6K CM IGF-1 Recipient WCL - + - + - + pigf-1r IGF-1R pakt ps6 AKT D 1 st SILAC 2 nd SILAC E GAPDH FGF21 ALKPGVIQILGVK
Study of different types of ubiquitination
 Study of different types of ubiquitination Rudi Beyaert (rudi.beyaert@irc.vib-ugent.be) VIB UGent Center for Inflammation Research Ghent, Belgium VIB Training Novel Proteomics Tools: Identifying PTMs October
Supplemental information contains 7 movies and 4 supplemental Figures
 1 2 3 4 5 6 7 8 9 10 11 12 13 14 15 16 17 18 19 20 21 22 23 24 25 26 27 Supplemental information contains 7 movies and 4 supplemental Figures Movies: Movie 1. Single virus tracking of A4-mCherry-WR MV
SUPPLEMENTARY FIGURE LEGENDS
 SUPPLEMENTARY FIGURE LEGENDS Supplemental FIG. 1. Localization of myosin Vb in cultured neurons varies with maturation stage. A and B, localization of myosin Vb in cultured hippocampal neurons. A, in DIV
SUPPLEMENTARY INFORMATION
 DOI:.38/ncb2822 a MTC02 FAO cells EEA1 b +/+ MEFs /DAPI -/- MEFs /DAPI -/- MEFs //DAPI c HEK 293 cells WCE N M C P AKT TBC1D7 Lamin A/C EEA1 VDAC d HeLa cells WCE N M C P AKT Lamin A/C EEA1 VDAC Figure
SUPPLEMENTARY FIGURES
 SUPPLEMENTARY FIGURES Supplementary Figure 1. (A) Left, western blot analysis of ISGylated proteins in Jurkat T cells treated with 1000U ml -1 IFN for 16h (IFN) or left untreated (CONT); right, western
Figure S1. Effect of bafilomycin on EGF-induced Akt and Erk signaling. Effect of chloroquine on EGF-stimulated mtorc1, Akt and Erk
 EGF induced VATPase assembly and mtorc1 activation Supplemental Information Supplemental Figure Legends Figure S1. Effect of bafilomycin on EGFinduced Akt and Erk signaling. A. Hepatocytes were treated
Supplementary Figure 1. Normal T lymphocyte populations in Dapk -/- mice. (a) Normal thymic development in Dapk -/- mice. Thymocytes from WT and Dapk
 Normal thymic development in Dapk -/- mice. Thymocytes from WT and Dapk") Supplementary Figure 1. Normal T lymphocyte populations in Dapk -/- mice. (a) Normal thymic development in Dapk -/- mice. Thymocytes from WT and Dapk -/- mice were stained for expression of CD4 and CD8.
Supplementary Figure 1. Normal T lymphocyte populations in Dapk -/- mice. (a) Normal thymic development in Dapk -/- mice. Thymocytes from WT and Dapk -/- mice were stained for expression of CD4 and CD8.
Supplementary Figure 1. Procedures for p38 activity imaging in living cells. (a) Schematic model of the p38 activity reporter. The reporter consists
 Schematic model of the p38 activity reporter. The reporter consists") Supplementary Figure 1. Procedures for p38 activity imaging in living cells. (a) Schematic model of the p38 activity reporter. The reporter consists of: (i) the YPet domain (an enhanced YFP); (ii) the
Supplementary Figure 1. Procedures for p38 activity imaging in living cells. (a) Schematic model of the p38 activity reporter. The reporter consists of: (i) the YPet domain (an enhanced YFP); (ii) the
Supplementary Figure 1. The CagA-dependent wound healing or transwell migration of gastric cancer cell. AGS cells transfected with vector control or
 Supplementary Figure 1. The CagA-dependent wound healing or transwell migration of gastric cancer cell. AGS cells transfected with vector control or 3xflag-CagA expression vector were wounded using a pipette
Figure S6. A-J) Annotated UVPD mass spectra for top ten peptides found among the peptides identified by Byonic but not SEQUEST + Percolator.
 Annotated UVPD mass spectra for top ten peptides found among the peptides identified by Byonic but not SEQUEST + Percolator.") Extending Proteome Coverage by Combining MS/MS Methods and a Modified Bioinformatics Platform adapted for Database Searching of Positive and Negative Polarity 193 nm Ultraviolet Photodissociation Mass
Extending Proteome Coverage by Combining MS/MS Methods and a Modified Bioinformatics Platform adapted for Database Searching of Positive and Negative Polarity 193 nm Ultraviolet Photodissociation Mass
Supplementary Materials for
 www.sciencesignaling.org/cgi/content/full/6/271/ra25/dc1 Supplementary Materials for Phosphoproteomic Analysis Implicates the mtorc2-foxo1 Axis in VEGF Signaling and Feedback Activation of Receptor Tyrosine
Minimalistic encapsulated proteomic sample processing applied to copy number
 Nature Methods Minimalistic encapsulated proteomic sample processing applied to copy number estimation in eukaryotic cells Nils A. Kulak, Garwin Pichler, Igor Paron, Nagarjuna Nagaraj and Matthias Mann
Supplementary Figure 1. Comparative analysis of thermal denaturation of enzymatically
 Supplementary Figures Supplementary Figure 1. Comparative analysis of thermal denaturation of enzymatically synthesized polyubiquitin chains of different length. a, Differential scanning calorimetry traces
Supplementary Figure 1
 Supplementary Figure 1 YAP negatively regulates IFN- signaling. (a) Immunoblot analysis of Yap knockdown efficiency with sh-yap (#1 to #4 independent constructs) in Raw264.7 cells. (b) IFN- -Luc and PRDs
One Gene, Many Proteins. Applications of Mass Spectrometry to Proteomics. Why Proteomics? Raghothama Chaerkady, Ph.D.
 Applications of Mass Spectrometry to Proteomics Raghothama Chaerkady, Ph.D. McKusick-Nathans Institute of Genetic Medicine and the Department of Biological Chemistry Why Proteomics? One Gene, Many Proteins
Supplementary Figure 1. MAT IIα is Acetylated at Lysine 81.
 IP: Flag a Mascot PTM Modified Mass Error Position Gene Names Score Score Sequence m/z [ppm] 81 MAT2A;AMS2;MATA2 35.6 137.28 _AAVDYQK(ac)VVR_ 595.83-2.28 b Pre-immu After-immu Flag- WT K81R WT K81R / Flag
Supplementary Figure 1: Characterisation of phospho-fgfr-y463 antibody. (A)
") Supplementary Figure 1: Characterisation of phospho-fgfr-y463 antibody. (A) Cells over-expressing hfgfr1-pcdna3 (+) or pcdna3 (-) were stimulated for 10 minutes with 50ng/ml FGF2 and lysates immunoblotted
Supplementary Figure 1: Characterisation of phospho-fgfr-y463 antibody. (A) Cells over-expressing hfgfr1-pcdna3 (+) or pcdna3 (-) were stimulated for 10 minutes with 50ng/ml FGF2 and lysates immunoblotted
293T cells were transfected with indicated expression vectors and the whole-cell extracts were subjected
 SUPPLEMENTARY INFORMATION Supplementary Figure 1. Formation of a complex between Slo1 and CRL4A CRBN E3 ligase. (a) HEK 293T cells were transfected with indicated expression vectors and the whole-cell
Nature Structural & Molecular Biology: doi: /nsmb Supplementary Figure 1. Differential expression of mirnas from the pri-mir-17-92a locus.
 Supplementary Figure 1 Differential expression of mirnas from the pri-mir-17-92a locus. (a) The mir-17-92a expression unit in the third intron of the host mir-17hg transcript. (b,c) Impact of knockdown
SUPPLEMENTARY INFORMATION
 SUPPLEMENTARY INFORMATION doi:1.138/nature9814 a A SHARPIN FL B SHARPIN ΔNZF C SHARPIN T38L, F39V b His-SHARPIN FL -1xUb -2xUb -4xUb α-his c Linear 4xUb -SHARPIN FL -SHARPIN TF_LV -SHARPINΔNZF -SHARPIN
SUPPLEMENTARY INFORMATION
 doi:.8/nature8 Zheng et al. Temporal regulation of EGF signaling networks by the scaffold protein Shc SUPPLEMENTARY TEXT EGF concentration selection and optimization EGF levels vary greatly in various
IP: anti-gfp VPS29-GFP. IP: anti-vps26. IP: anti-gfp - + +
 FAM21 Strump. WASH1 IP: anti- 1 2 3 4 5 6 FAM21 Strump. FKBP IP: anti-gfp VPS29- GFP GFP-FAM21 tail H H/P P H H/P P c FAM21 FKBP Strump. VPS29-GFP IP: anti-gfp 1 2 3 FKBP VPS VPS VPS VPS29 1 = VPS29-GFP
Lysosomes and endocytic pathways 9/27/2012 Phyllis Hanson
 Lysosomes and endocytic pathways 9/27/2012 Phyllis Hanson General principles Properties of lysosomes Delivery of enzymes to lysosomes Endocytic uptake clathrin, others Endocytic pathways recycling vs.
Table S1. Relative abundance of AGO1/4 proteins in different organs. Table S2. Summary of smrna datasets from various samples.
 Supplementary files Table S1. Relative abundance of AGO1/4 proteins in different organs. Table S2. Summary of smrna datasets from various samples. Table S3. Specificity of AGO1- and AGO4-preferred 24-nt
supplementary information
 DOI: 10.1038/ncb1875 Figure S1 (a) The 79 surgical specimens from NSCLC patients were analysed by immunohistochemistry with an anti-p53 antibody and control serum (data not shown). The normal bronchi served
(a) Significant biological processes (upper panel) and disease biomarkers (lower panel)
 Significant biological processes (upper panel) and disease biomarkers (lower panel)") Supplementary Figure 1. Functional enrichment analyses of secretomic proteins. (a) Significant biological processes (upper panel) and disease biomarkers (lower panel) 2 involved by hrab37-mediated secretory
Supplementary Figure 1. Functional enrichment analyses of secretomic proteins. (a) Significant biological processes (upper panel) and disease biomarkers (lower panel) 2 involved by hrab37-mediated secretory
Section 1 Proteins and Proteomics
 Section 1 Proteins and Proteomics Learning Objectives At the end of this assignment, you should be able to: 1. Draw the chemical structure of an amino acid and small peptide. 2. Describe the difference
Schwarz et al. Activity-Dependent Ubiquitination of GluA1 Mediates a Distinct AMPAR Endocytosis
 Schwarz et al Activity-Dependent Ubiquitination of GluA1 Mediates a Distinct AMPAR Endocytosis and Sorting Pathway Supplemental Data Supplemental Fie 1: AMPARs undergo activity-mediated ubiquitination
Supplementary Figure 1
 Supplementary Figure 1 a γ-h2ax MDC1 RNF8 FK2 BRCA1 U2OS Cells sgrna-1 ** 60 sgrna 40 20 0 % positive Cells (>5 foci per cell) b ** 80 sgrna sgrna γ-h2ax MDC1 γ-h2ax RNF8 FK2 MDC1 BRCA1 RNF8 FK2 BRCA1
William C. Comb, Jessica E. Hutti, Patricia Cogswell, Lewis C. Cantley, and Albert S. Baldwin
 Molecular Cell, Volume 45 Supplemental Information p85 SH2 Domain Phosphorylation by IKK Promotes Feedback Inhibition of PI3K and Akt in Response to Cellular Starvation William C. Comb, Jessica E. Hutti,
(A) SW480, DLD1, RKO and HCT116 cells were treated with DMSO or XAV939 (5 µm)
 SW480, DLD1, RKO and HCT116 cells were treated with DMSO or XAV939 (5 µm)") Supplementary Figure Legends Figure S1. Tankyrase inhibition suppresses cell proliferation in an axin/β-catenin independent manner. (A) SW480, DLD1, RKO and HCT116 cells were treated with DMSO or XAV939
Supplementary Figure Legends Figure S1. Tankyrase inhibition suppresses cell proliferation in an axin/β-catenin independent manner. (A) SW480, DLD1, RKO and HCT116 cells were treated with DMSO or XAV939
2. Ionization Sources 3. Mass Analyzers 4. Tandem Mass Spectrometry
 Dr. Sanjeeva Srivastava 1. Fundamental of Mass Spectrometry Role of MS and basic concepts 2. Ionization Sources 3. Mass Analyzers 4. Tandem Mass Spectrometry 2 1 MS basic concepts Mass spectrometry - technique
a b G75 G60 Sw-2 Sw-1 Supplementary Figure 1. Structure predictions by I-TASSER Server.
 a b G75 2 2 G60 Sw-2 Sw-1 Supplementary Figure 1. Structure predictions by I-TASSER Server. a. Overlay of top 10 models generated by I-TASSER illustrates the potential effect of 7 amino acid insertion
Supplemental Information. NRF2 Is a Major Target of ARF. in p53-independent Tumor Suppression
 Molecular Cell, Volume 68 Supplemental Information NRF2 Is a Major Target of ARF in p53-independent Tumor Suppression Delin Chen, Omid Tavana, Bo Chu, Luke Erber, Yue Chen, Richard Baer, and Wei Gu Figure
Nature Methods: doi: /nmeth.3177
 Supplementary Figure 1 Characterization of LysargiNase, trypsin and LysN missed cleavages. (a) Proportion of peptides identified in LysargiNase and trypsin digests of MDA-MB-231 cell lysates carrying 0,
SUPPLEMENTARY INFORMATION
 DOI: 10.1038/ncb3076 Supplementary Figure 1 btrcp targets Cep68 for degradation during mitosis. a) Cep68 immunofluorescence in interphase and metaphase. U-2OS cells were transfected with control sirna
Nature Medicine: doi: /nm.4078
 Supplementary Figure 1. Cetuximab induces ER stress response in DiFi cells. (a) Scheme of SILAC proteome. (b) MS-base read out of SILAC experiment. The histogram of log 2 -transformed normalized H/L ratios
Supplementary Figure 1
 Supplementary Figure 1 Constitutive EGFR signaling does not activate canonical EGFR signals (a) U251EGFRInd cells with or without tetracycline exposure (24h, 1µg/ml) were treated with EGF for 15 minutes
Effects of UBL5 knockdown on cell cycle distribution and sister chromatid cohesion
 Supplementary Figure S1. Effects of UBL5 knockdown on cell cycle distribution and sister chromatid cohesion A. Representative examples of flow cytometry profiles of HeLa cells transfected with indicated
SUPPLEMENTARY INFORMATION
 sirna pool: Control Tetherin -HA-GFP HA-Tetherin -Tubulin Supplementary Figure S1. Knockdown of HA-tagged tetherin expression by tetherin specific sirnas. HeLa cells were cotransfected with plasmids expressing
RAW264.7 cells stably expressing control shrna (Con) or GSK3b-specific shrna (sh-
 or GSK3b-specific shrna (sh-") 1 a b Supplementary Figure 1. Effects of GSK3b knockdown on poly I:C-induced cytokine production. RAW264.7 cells stably expressing control shrna (Con) or GSK3b-specific shrna (sh- GSK3b) were stimulated
1 a b Supplementary Figure 1. Effects of GSK3b knockdown on poly I:C-induced cytokine production. RAW264.7 cells stably expressing control shrna (Con) or GSK3b-specific shrna (sh- GSK3b) were stimulated
Quantification with Proteome Discoverer. Bernard Delanghe
 Quantification with Proteome Discoverer Bernard Delanghe Overview: Which approach to use? Proteome Discoverer Quantification Method What When to use Metabolic labeling SILAC Cell culture systems Small
SUPPLEMENTARY INFORMATION
 Figure S1. Silver staining and immunoblotting of the purified TAK1 kinase complex. The TAK1 kinase complex was purified through tandem affinity methods (Protein A and FLAG), and aliquots of the purified
HEK293FT cells were transiently transfected with reporters, N3-ICD construct and
 Supplementary Information Luciferase reporter assay HEK293FT cells were transiently transfected with reporters, N3-ICD construct and increased amounts of wild type or kinase inactive EGFR. Transfections
Supplementary Figure 1
 Supplementary Figure 1 how HFD how HFD Epi WT p p Hypothalamus p p Inguinal WT T Liver Lean mouse adipocytes p p p p p p Obese mouse adipocytes Kidney Muscle Spleen Heart p p p p p p p p Extracellular
T H E J O U R N A L O F C E L L B I O L O G Y
 T H E J O U R N A L O F C E L L B I O L O G Y Supplemental material Krenn et al., http://www.jcb.org/cgi/content/full/jcb.201110013/dc1 Figure S1. Levels of expressed proteins and demonstration that C-terminal
MAPK Pathway
 MAPK Pathway Mitogen-activated protein kinases (MAPK) are proteins that are serine/ threonine specific kinases which are activated by a wide range of stimuli including proinflammatory cytokines, growth
 DOI: 10.1038/ncb2210 b. ICAM1 ng ml -1 P = 0.0001 Small RNA (15-30nts) ng ml -1 Cell Lysate Exosome HDL Plasma HDL Normal Human HDL mirnas R = 0.45 P < 0.0001 Normal Human Exosome mirnas Figure S1. Characterization
Supplementary Figure 1: si-craf but not si-braf sensitizes tumor cells to radiation.
 Supplementary Figure 1: si-craf but not si-braf sensitizes tumor cells to radiation. (a) Embryonic fibroblasts isolated from wildtype (WT), BRAF -/-, or CRAF -/- mice were irradiated (6 Gy) and DNA damage
SUPPLEMENTARY INFORMATION
 doi: 10.1038/nature06994 A phosphatase cascade by which rewarding stimuli control nucleosomal response A. Stipanovich*, E. Valjent*, M. Matamales*, A. Nishi, J.H. Ahn, M. Maroteaux, J. Bertran-Gonzalez,
SUPPLEMENTARY INFORMATION
 SUPPLEMENTARY INFORMATION doi:10.1038/nature11429 S1a 6 7 8 9 Nlrc4 allele S1b Nlrc4 +/+ Nlrc4 +/F Nlrc4 F/F 9 Targeting construct 422 bp 273 bp FRT-neo-gb-PGK-FRT 3x.STOP S1c Nlrc4 +/+ Nlrc4 F/F casp1
A Hepatocyte Growth Factor Receptor (Met) Insulin Receptor hybrid governs hepatic glucose metabolism SUPPLEMENTARY FIGURES, LEGENDS AND METHODS
 Insulin Receptor hybrid governs hepatic glucose metabolism SUPPLEMENTARY FIGURES, LEGENDS AND METHODS") A Hepatocyte Growth Factor Receptor (Met) Insulin Receptor hybrid governs hepatic glucose metabolism Arlee Fafalios, Jihong Ma, Xinping Tan, John Stoops, Jianhua Luo, Marie C. DeFrances and Reza Zarnegar
A Hepatocyte Growth Factor Receptor (Met) Insulin Receptor hybrid governs hepatic glucose metabolism Arlee Fafalios, Jihong Ma, Xinping Tan, John Stoops, Jianhua Luo, Marie C. DeFrances and Reza Zarnegar
a Anti-Dab2 RGD Merge
 a Anti-Da Merge *** ** Percentage of cells adhered 8 6 4 RGE RAD RGE RAD Supplementary Figure Da are localized at clusters. (a) Endogenous Da is localized at clusters. (), ut not RGE nor RAD peptides can
(a) Schematic diagram of the FS mutation of UVRAG in exon 8 containing the highly instable
 Schematic diagram of the FS mutation of UVRAG in exon 8 containing the highly instable") Supplementary Figure 1. Frameshift (FS) mutation in UVRAG. (a) Schematic diagram of the FS mutation of UVRAG in exon 8 containing the highly instable A 10 DNA repeat, generating a premature stop codon
Supplementary Figure 1. Frameshift (FS) mutation in UVRAG. (a) Schematic diagram of the FS mutation of UVRAG in exon 8 containing the highly instable A 10 DNA repeat, generating a premature stop codon
supplementary information
 DOI: 1.138/ncb1 Control Atg7 / NAC 1 1 1 1 (mm) Control Atg7 / NAC 1 1 1 1 (mm) Lamin B Gstm1 Figure S1 Neither the translocation of into the nucleus nor the induction of antioxidant proteins in autophagydeficient
T H E J O U R N A L O F C E L L B I O L O G Y
 Supplemental material Jewell et al., http://www.jcb.org/cgi/content/full/jcb.201007176/dc1 T H E J O U R N A L O F C E L L B I O L O G Y Figure S1. IR Munc18c association is independent of IRS-1. (A and
SUPPLEMENTARY INFORMATION
 SUPPLEMENTARY INFORMATION doi:10.10/nature10195 NCBI gene: Tagged Subunit(s: HA-Vpx; FLAG-Cul4 HA-DCAF1 FLAG-Cul4 HA-FLAG-Vpx Mock Vpx (SIVmac 100 (a ; 0.159 (b ; 0.05 DCAF1 DDB1 DDA1 Cul4A 1; 0.024591
PTM Discovery Method for Automated Identification and Sequencing of Phosphopeptides Using the Q TRAP LC/MS/MS System
 Application Note LC/MS PTM Discovery Method for Automated Identification and Sequencing of Phosphopeptides Using the Q TRAP LC/MS/MS System Purpose This application note describes an automated workflow
Supplementary Figure 1. Characterization of NMuMG-ErbB2 and NIC breast cancer cells expressing shrnas targeting LPP. NMuMG-ErbB2 cells (a) and NIC
 and NIC") Supplementary Figure 1. Characterization of NMuMG-ErbB2 and NIC breast cancer cells expressing shrnas targeting LPP. NMuMG-ErbB2 cells (a) and NIC cells (b) were engineered to stably express either a LucA-shRNA
Supplementary Figure 1. Characterization of NMuMG-ErbB2 and NIC breast cancer cells expressing shrnas targeting LPP. NMuMG-ErbB2 cells (a) and NIC cells (b) were engineered to stably express either a LucA-shRNA
m 6 A mrna methylation regulates AKT activity to promote the proliferation and tumorigenicity of endometrial cancer
 SUPPLEMENTARY INFORMATION Articles https://doi.org/10.1038/s41556-018-0174-4 In the format provided by the authors and unedited. m 6 A mrna methylation regulates AKT activity to promote the proliferation
Supplementary data Table S3. GO terms, pathways and networks enriched among the significantly correlating genes using Tox-Profiler
 Supplementary data Table S3. GO terms, pathways and networks enriched among the significantly correlating genes using Tox-Profiler DR CALUX Boys Girls Database Systemic lupus erythematosus 4.4 0.0021 6.7
Supplementary Materials for
 www.sciencesignaling.org/cgi/content/full/7/322/ra38/dc1 Supplementary Materials for Dynamic Reprogramming of Signaling Upon Met Inhibition Reveals a Mechanism of Drug Resistance in Gastric Cancer Andrea
PREPARED FOR: U.S. Army Medical Research and Materiel Command Fort Detrick, Maryland
 AD Award Number: W81XWH-12-1-0248 TITLE: Targeted Inhibition of Tyrosine Kinase-Mediated Epigenetic Alterations to Prevent Resurgence of Castration-Resistant Prostate Cancer PRINCIPAL INVESTIGATOR: Dr.
SUPPLEMENTARY INFORMATION
 DOI: 10.1038/ncb2566 Figure S1 CDKL5 protein expression pattern and localization in mouse brain. (a) Multiple-tissue western blot from a postnatal day (P) 21 mouse probed with an antibody against CDKL5.
Supplementary Materials for
 www.sciencesignaling.org/cgi/content/full/8/385/ra70/dc1 Supplementary Materials for The interaction of heparan sulfate proteoglycans with endothelial transglutaminase-2 limits VEGF 165 -induced angiogenesis
Proteins: Proteomics & Protein-Protein Interactions Part I
 Proteins: Proteomics & Protein-Protein Interactions Part I Jesse Rinehart, PhD Department of Cellular & Molecular Physiology Systems Biology Institute DNA RNA PROTEIN DNA RNA PROTEIN Proteins: Proteomics
SUPPLEMENTARY INFORMATION
 SUPPLEMENTARY INFORMATION doi:10.1038/nature13418 Supplementary Results: USP30 opposes autophagic flux In HEK-293 cells, USP30 overexpression increased basal LC3-II levels, dependent on enzymatic activity,
Supplemental Figure 1
 Supplemental Figure 1 1a 1c PD-1 MFI fold change 6 5 4 3 2 1 IL-1α IL-2 IL-4 IL-6 IL-1 IL-12 IL-13 IL-15 IL-17 IL-18 IL-21 IL-23 IFN-α Mut Human PD-1 promoter SBE-D 5 -GTCTG- -1.2kb SBE-P -CAGAC- -1.kb
Nature Genetics: doi: /ng Supplementary Figure 1. SEER data for male and female cancer incidence from
 Supplementary Figure 1 SEER data for male and female cancer incidence from 1975 2013. (a,b) Incidence rates of oral cavity and pharynx cancer (a) and leukemia (b) are plotted, grouped by males (blue),
Supplementary Figure 1. Spatial distribution of LRP5 and β-catenin in intact cardiomyocytes. (a) and (b) Immunofluorescence staining of endogenous
 and (b) Immunofluorescence staining of endogenous") Supplementary Figure 1. Spatial distribution of LRP5 and β-catenin in intact cardiomyocytes. (a) and (b) Immunofluorescence staining of endogenous LRP5 in intact adult mouse ventricular myocytes (AMVMs)
Supplementary Figure 1. Spatial distribution of LRP5 and β-catenin in intact cardiomyocytes. (a) and (b) Immunofluorescence staining of endogenous LRP5 in intact adult mouse ventricular myocytes (AMVMs)
Nature Immunology doi: /ni.3268
 Supplementary Figure 1 Loss of Mst1 and Mst2 increases susceptibility to bacterial sepsis. (a) H&E staining of colon and kidney sections from wild type and Mst1 -/- Mst2 fl/fl Vav-Cre mice. Scale bar,
Proteins are sometimes only produced in one cell type or cell compartment (brain has 15,000 expressed proteins, gut has 2,000).
.") Lecture 2: Principles of Protein Structure: Amino Acids Why study proteins? Proteins underpin every aspect of biological activity and therefore are targets for drug design and medicinal therapy, and in
Lecture 2: Principles of Protein Structure: Amino Acids Why study proteins? Proteins underpin every aspect of biological activity and therefore are targets for drug design and medicinal therapy, and in
genome edited transient transfection, CMV promoter
 Supplementary Figure 1. In the absence of new protein translation, overexpressed caveolin-1-gfp is degraded faster than caveolin-1-gfp expressed from the endogenous caveolin 1 locus % loss of total caveolin-1-gfp
Supplementary Figure 1 (previous page). EM analysis of full-length GCGR. (a) Exemplary tilt pair images of the GCGR mab23 complex acquired for Random
. EM analysis of full-length GCGR. (a) Exemplary tilt pair images of the GCGR mab23 complex acquired for Random") S1 Supplementary Figure 1 (previous page). EM analysis of full-length GCGR. (a) Exemplary tilt pair images of the GCGR mab23 complex acquired for Random Conical Tilt (RCT) reconstruction (left: -50,right:
S1 Supplementary Figure 1 (previous page). EM analysis of full-length GCGR. (a) Exemplary tilt pair images of the GCGR mab23 complex acquired for Random Conical Tilt (RCT) reconstruction (left: -50,right:
Supplementary Table 1. Properties of lysates of E. coli strains expressing CcLpxI point mutants
 Supplementary Table 1. Properties of lysates of E. coli strains expressing CcLpxI point mutants Species UDP-2,3- diacylglucosamine hydrolase specific activity (nmol min -1 mg -1 ) Fold vectorcontrol specific
TITLE: Effect of MUC1 Expression on EGFR Endocytosis and Degradation in Human Breast Cancer Cell Lines
 AD AWARD NUMBER: W81XWH-06-1-0464 TITLE: Effect of MUC1 Expression on EGFR Endocytosis and Degradation in Human Breast Cancer Cell Lines PRINCIPAL INVESTIGATOR: Rachid M El Bejjani CONTRACTING ORGANIZATION:
7SK ChIRP-seq is specifically RNA dependent and conserved between mice and humans.
 Supplementary Figure 1 7SK ChIRP-seq is specifically RNA dependent and conserved between mice and humans. Regions targeted by the Even and Odd ChIRP probes mapped to a secondary structure model 56 of the
Supplementary Table 1. Metabolic parameters in GFP and OGT-treated mice
 Supplementary Table 1. Metabolic parameters in GFP and OGT-treated mice Fasted Refed GFP OGT GFP OGT Liver G6P (mmol/g) 0.03±0.01 0.04±0.02 0.60±0.04 0.42±0.10 A TGs (mg/g of liver) 20.08±5.17 16.29±0.8