Height Growth Paths and Production Relations in Guatemala and the Philippines
|
|
|
- Easter Wells
- 5 years ago
- Views:
Transcription
1 Height Growth Paths and Production Relations in Guatemala and the Philippines Fan Wang, University of Pennsylvania Esteban Puentes, Universidad de Chile Jere R. Behrman, University of Pennsylvania Flavio Cunha, University of Pennsylvania John Hoddinott, International Food Policy Research Institute John A. Maluccio, Middlebury College Reynaldo Martorell, Emory University December 2014 Very Preliminary Version Abstract We use high frequency data from the Philippines and Guatemala in the first 2 years of life to study the impact of protein on height. First, we estimate individual specific height profile functions using various parametric forms from economics and the natural sciences. Based on insample and out-of-sample fits, we find that biologically-based models for predicting height profiles perform very well in capturing the variance of height at different ages. Second, taking advantage of a protein supplementation experiment in Guatemala and extensive information on food prices, we estimate the impact of protein intake on individual-specific height profile function coefficients. We use this information to estimate structural models with referencedependent preferences for the two countries. We evaluate the impact of various counterfactuals on child height growth, including changing parental reference points and providing households with cash transfers or in-kind protein transfers.! 1
2 1. Introduction Growth retardation during the first years of life apparently has several important damaging effects. Stunted children, that is, children whose length or height 1 is below two standard deviations below the standards of healthy children according to the World Health Organization (WHO), are less likely to enroll in school, tend to enroll late, attain lower levels of schooling, have lower levels of cognition and have less satisfactory adult health, labor market and marriage market outcomes(grantham-mcgregor, et al., (2007); Engle, et al., (2007); Engle, et al., (2011); Victora, et al., (2008); Behrman, et al., (2009); Hoddinott, et al., (2008, 2013) and Maluccio, et al., (2009). It has been estimated, that stunted children could lose 22% of their yearly adult income (Grantham-McGregor, et al. (2007)). In 2010, 171 million children under the age of 5 were considered stunted in the world (de Onis, Blössner Borghi (2011)). Moreover, children that suffer from stunting tend to come from low-income families, then configuring a clear path of intergenerational poverty transmission (Grantham-McGregor, et al. (2007)). The main proximate factors responsible for growth retardation are lack of proper nutrition and infection (Victoria, et al. (2008)). In the economics literature, some papers have studied the effect of nutrition correcting for the endogeneity of intakes (Liu, Morz and Adair (2009), de Cao (2011), Griffen (2014) and Puentes, et al. (2014)), finding consistent evidence of the importance of nutrition in height and weight growth. Moreover, Moradi (2010) and Puentes et al. (2014) find that protein intakes, in particular, have a high impact on height. These and other studies (e.g., Behrman and Wolfe (1984); Pitt and Rosenzweig (1985); Behrman and Deolalikar (1987); Bouis and Haddad (1992); Subramanian and Deaton (1996)) link the determinants of nutrient intakes inter alia to a number of familial characteristics, typically primarily family resources (income, wealth), parental schooling attainment, and family demographics. Most of these estimates of the links of familial characteristics with child nutrient intakes are reduced-form demand relations (perhaps as the first-stage for 2SLS production function estimates). An exception is Liu et al. (2009), who embody the production relations and nutrient demands into a structural model that!!!!!!!!!!!!!!!!!!!!!!!!!!!!!!!!!!!!!!!!!!!!!!!!!!!!!!!!!!!! 1 Typically for very young children (e.g., 24 months and younger) length is measured while they are prone, but for older children height is measured. There are standard conversion factors between length and height measures. For more discussion and comparisons, see WHO (2006). For simplicity in what follows we refer to height for all ages.! 2
3 explicitly models parental reactions to shocks. This model allows them to study how different counterfactual policies could affect children s nutrition and height. However, familial decisions about allocating nutrients to their children would seem to depend critically on parental beliefs about what is the normal or average height for their children. For parents who live in poor villages in which most of the children are stunted, for example, that their own children are stunted or nearly-stunted may not cause parents to be concerned if their reference for normal or expected child growth is other children in their village. But understanding how such parental beliefs translate into nutrition has not been studied even though understanding how parents perceptions about normal growth affect actual growth may be a key for developing policies that might help break the circle of poverty and help children to develop their full potential. Therefore we develop and estimate a simple structural model to study how parents choose diet intakes that incorporates the beliefs that parents have about the expected height of their children. To study the role of beliefs, through such reference points, we follow Koszegi and Rabin (2006). These reference points indicate what parents believe would be adequate height of their children. In our model, parents can modify their children s height by changing protein intakes and parents know what is the production function for height, but their choices depend in part on their beliefs about the average or normal height expected for their children. Our paper is the first to our knowledge that investigates the potential role of beliefs in children s height growth. Using data from Guatemala and the Philippines we first estimate and compare different parametric height functions for children between 0 and 24 months of age. These functions allow us to describe the biological processes of height growth. This has been studied in the literature, for example by Stein et al (2010), but we expand on their work by including more potential parametric functions. We then estimate the effect of protein consumption on the key growth parameter of these functions; in this way we study how nutrition affects height growth. To control for the endogeneity of protein intakes, we use prices of different food products, and in the case of Guatemala, we take advantage of a nutritional intervention that randomly assigned a protein-rich supplement to some villages, while other villages received no protein supplement. Then, we develop a structural model that considers income, price of protein and preferences for height to calculate optimal protein levels. We include in this model explicitly the beliefs of! 3
4 parents about height. The model allows us to study the impacts of children s height of changes in prices, income transfers and parental beliefs regarding the normal height of children. Our preliminary results indicate that the growth process is very similar between children of the same age that live in two different countries and at two different points in time. This is striking considering the differences in environment, diet and genetic components between these two samples. We also find that protein plays a key role in children s height. In terms of parents beliefs, we find that what parents consider an average or normal height can have an important effect on their children s heights. Our simulations indicate that if parents were to update their beliefs to even conservative measures of normal height, protein intakes could increase considerably with substantial impacts on the heights of their children. The paper is divided in six sections. The first is this introduction, the second describes the data, the third presents the estimation of the height parametric functions and how protein affects height growth, the fourth presents the structural model and the fifth estimates the structural model and conducts the counterfactual analysis, and the sixth presents the conclusions of the paper. 2. Data We estimate the models in this paper using Guatemalan and Filipino databases that contain a unique combination of information about children s height and protein consumption, as well as prices and familial background. In this section we describe the data collection process for each country. 2.1 Guatemala The Guatemalan data are from a study conducted by The Institute of Nutrition of Central America and Panama (INCAP), which started a nutritional supplementation trial in Four villages from eastern Guatemala were selected, one pair of villages that were relatively large (900 residents each) and one pair that were smaller (500 residents each). The villages were similar in child nutritional status, measured as height at three years of age (Habitch, Martorell and Rivera, (1995)). Over 50% of children lacked proper nutrition, measured as height-for-age z-! 4
5 scores less than -3 (severely stunted). The intervention consisted of randomly assigning nutritional supplements. One large and one small village were selected to receive a high-protein drink called Atole, and the other two were selected to receive an alternative supplement called Fresco. Each serving of Atole (180 ml) contained 11.5 grams of protein and 163 kcal. Fresco had no proteins and each serving (180 ml) had 59 kcal. The main hypothesis was that better nutrition would accelerate mental development. However, at the same time, it was expected that the nutritional supplement would also have an effect on physical growth (Habitch et al., 1995). The intervention started in February 1969 in the larger villages and in May 1969 in the smaller villages, and lasted until the end of February 1977 with data collection taking place until September 1977 (Maluccio et al., 2009; Islam and Hoddinott, 2009). The nutritional supplements were distributed in feeding centers located centrally in each village. The centers were open twice a day, two to three hours in the mid-morning and two to three hours in the midafternoon. All village members had access to the feeding centers. 2 Information on supplement intake was collected daily for all pregnant women and children up to seven years old. Home dietary information was collected every 3 months for children between 0 and 24 months. The home dietary data corresponds to a 24-hour recall in the large villages and a 72-hour recall in the small villages. From the home dietary data it is possible to calculate protein intakes, which we use in our estimations. Anthropometric measures were collected every three months for children 0 to 24 months-old. 2.2 The Philippines The Cebu Longitudinal Health and Nutritional Survey (CLHNS) is an ongoing survey of more than 2,000 Filipino children born between May 1983 and April 1984 in 33 communities in the Metropolitan Cebu area. The baseline study collected information for 3327 women at a median gestation week of 30, which resulted in 3080 single live births. 3 During the first two years of each child s life, researchers from the University of North Carolina in collaboration with the Office of Population Studies in Cebu collected data every two months. This data included each!!!!!!!!!!!!!!!!!!!!!!!!!!!!!!!!!!!!!!!!!!!!!!!!!!!!!!!!!!!! 2!Less than 2% of the families refused to participate in the study (Martorell, et al. (1995))! 3!There were 27 twin births, 170 women who migrated before the childbirth or refused to be interviewed, 37 stillbirths and 13 miscarriages (Liu, et al. (2009)).!! 5
6 child s height and weight, food consumption in the past 24-hours, and recent history of illness. The 24-hour food intake history recorded the types and amounts of food eaten in the past day. Total protein intake information was calculated by summing up the nutritional content for each type of food. It is difficult to impute nutritional value from breast-milk time given heterogeneity across mothers; hence, nutrients from breast-feeding were not included in the nutritional intake calculations. 3. Growth Curves and the Role of Protein! In this section of the paper we estimate growth curves for children between 0 to 24 months of age. For each child in the Philippines and Guatemala we estimate nine parametric growth functions, and we study which of the functions have a better fit in and out of sample. We find that four functions tend to outperform the rest of the specifications. We also study how protein intakes during the first 24 months of life affect the parameters of the production function. We find that despite the differences in nutrition and environment between the countries, there are important similarities in terms of best fit and the effect of proteins on the coefficients of the production functions. 3.1 Parametric functions In figure 1 we show the growth patterns of children in the Philippines and Guatemala, each point in the graph correspond to a child age-height combinations. We observe that children in the Philippines on average are taller than children in Guatemala; at the same time in both countries there is a concave relationship between age and height. Table 1 also shows how at birth, children in Guatemala and Philippines had similar height, but at age 24 months, children in the Philippines were almost two centimeters taller than children in Guatemala and similar differences can be observed throughout the height distributions. Because there is not a definitive growth equation that explains height growth, we estimate several specifications. These are: (1) Difference Quadratic: h! h! = a t + b t! (2) Difference Exponential: h! h! = a t!! 6
7 (3) Quadratic Exponential: h! = h! exp a log t (4) Power Exponential: h! = h! exp a t! (5) AR1: h! = a + b h!!! (6) AR1 Transformed h! = a!!!!!!! + b! log h! (7) Weibull (Bridge): h! h! = h! h!"#$%'() 1 b exp!( a t) (7 ) Weibull (Bridge) Linearized: log log 1!!!!!!!!!!"#$%'() = log a + log t b (8) Monomolecular: h! = h!"#$%%'( 1 b exp a t (8 ) Monomolecular Linearized: log 1!!!!"#$%%'( = log b a t (9) Chapman Richard: h! h! = h!"#$%'() h! 1 exp at! Where, h! corresponds to height at age t, h! is height at birth, h!"#$%'() is final height and a, b are the parameters that we estimate in each case. All of these equations have two parameters with the single exception of equation (3), the quadratic exponential, which has one parameter. We estimate these nine equations for each child who has a minimum of 8 height observations in Guatemala and a minimum of 12 height observations of the Philippines. For equations 1 to 6 we use the information of height and age from ages 0 to 24 months, for equations 7 to 9, we include final height, defined as height at age 20 years. There are approximately 300 children for Guatemala and 1,600 children for the Philippines that meet all the data requirements. Fit of the specifications Instead of comparing the estimates of each function, that by themselves are not very informative, we compare the fit of each of the nine growth specifications to the data. In Figure 2, we compare the residuals for each child at each age in both countries. Each graph in the figure is for a different specification of the growth equation, one striking finding is that the fit of the data does! 7!
8 not vary much by country; in all graphs the nature of the fit is similar. For instance, for equation (3), the quadratic exponential, we observe a very good fit at age 0 months; however, the model over predicts for the first 400 days of life, and under predicts afterwards for both countries. In Figure 3, the R-squared of each child-equation is plotted, for each growth specification. We observe that equation (1), the Difference Quadratic, has a large dispersion for R-squared, while equations (7), Weibull, and (9), Chapman Richards, show higher and more homogenous R- squareds. In order to compare which specifications have better fits to the data we use the R-squareds for all specifications, calculating the number of times each specification has the first, second and third best fit for every child. The results of this horse race comparison are shown in Figure 4A for Guatemala and Figure 4B for the Philippines. For both countries, the Weibull specification provides the best fit, measured as the times it has the highest R-squared. The other specifications that also provide good in-sample fits are the Weibull, AR, Power Exponential and Difference Power. Despite not being the specification that mostly wins this horse race, the Chapman Richards function has also a good fit to the data, since it is frequently among the first three specifications in terms of R-squared. Next, we perform an out-of-sample analysis for each specification. In each country, there is information on height available after age 24 months. In the case of Guatemala, there is information on height from ages 30 to 84 months in the original study, and for the Philippines, there is information for ages 7 to 22 years across various survey rounds. In Figure 5 gives the residuals of each out-of-sample prediction for both countries. Again, we find a very consistent pattern by specification for both countries. The Monomolecular (8) and Chapman Richards (9) specifications present superior fits out of sample, while the Difference Exponential (2) and Power Exponential (4) also provide on average good fits, but with more variability. For the out-of-sample predictions we compare the fit of each of specification using the Bayesian Information Criteria (BIC), calculating the number of times each specification is the best, second and third in terms of BIC. The horse race summary is presented in Figure 6A for Guatemala and 6B for the Philippines. The graphs show that the Monomonecular (specially for Guatemala), Chapman Richards, Difference Exponential, Power Exponential and Weibull outperform the rest of the specifications.! 8
9 The results in this section show how similar are the fits of very different parametric functions to changes in height. These important similarities probably reveal deeper biological growth processes despite that the final heights observed in these populations are very different and, as we observed in Puentes, et al (2014), nutrition, breastfeeding and diseases patterns are very different too. In terms of the functions that provide the best fit, we find that the Difference Equation with a Power term and the Chapman Richard specifications have good performances in-sample and out-of-sample, while the Weibull specification has a good performance in-sample, but not so good out-of-sample. While the Monomolecular specification performs relatively poorly in-sample, it is the best out-of-sample. In the following sections we study the role of diet and beliefs in the growth process. Based on the in-sample and out-of-sample fits, we selected only four of the nine functions to study robustness of our results: Difference Equation with a power, Chapman Richards, Weibull, and Monomolecular. 3.2 Impact of Protein on Parameters of Growth Curves In this section we study how heterogeneity in growth paths among children can be explained by differences in diets, particularly of proteins. Height paths are the result of several factors, but proteins intakes play a key role. Moradi (2010) finds that high quality protein, compared to other energy, is a better predict of height in some African countries, and Puentes, et al. (2014), find that protein consistently increases height for children but energy from fat and carbs are not robustly related to height 4. To study the role of proteins in this context, we use the parameters obtained for each child and for each specification and regress them on the amount of protein consumed over the 0 to 24 month period. We control for initial height, weight and gender. As mentioned in the last section, we restrict our analysis to the following specifications: Difference Equation with a Power, Chapman Richards, Weibull, and Monomolecular. In detail, the way we study the role of proteins can be illustrated with the monomolecular equation, in which case the parametric function is:!!!!!!!!!!!!!!!!!!!!!!!!!!!!!!!!!!!!!!!!!!!!!!!!!!!!!!!!!!!! 4!Proteins are needed to balance nitrogen loss, maintain the body s protein mass and fulfill needs related to tissue deposition (WHO, (2007). Moreover, the nutritional literature emphasizes the role of high quality protein, specially animal-based protein, on height growth (Molgaard et al. (2001), Michaeslen (2013) and Dewey (2013)).!! 9
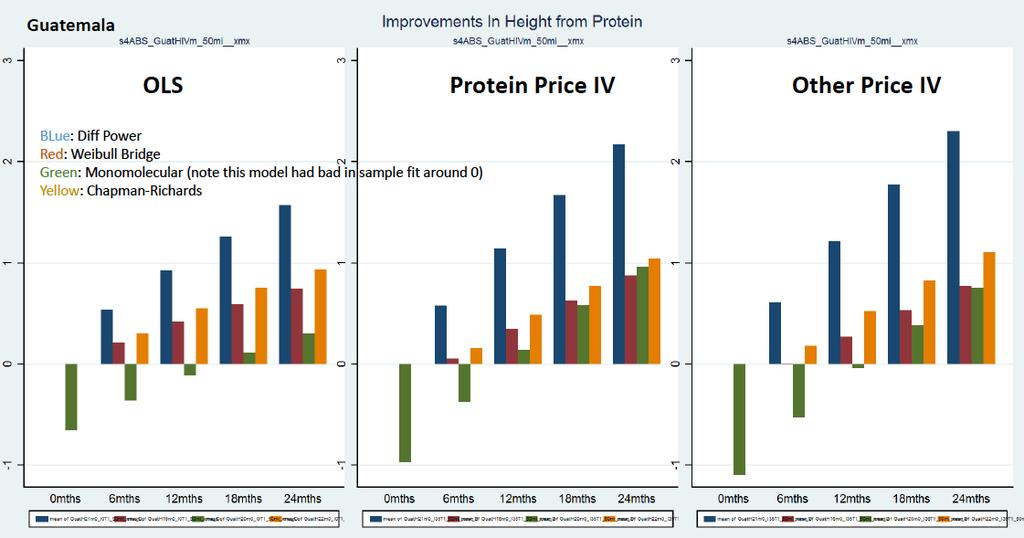
10 h!" = h!"#$%'() 1!!!"#!!! This equation first is estimated for each child in the Philippines and Guatemala. Then, for each set of parameters, the following set of equations are estimated to study how proteins affect the growth path: a! = α! + α! H!,! + α! W!,! + α! Male! + α! Prot!,!" b! = β! + β! H!,! + β! W!,! + β! Male! + β! Prot!,!" Where H!,! is height at birth, W!,! is weight at birth, Male! is a dummy variable equal 1 if the child is a boy and Prot!,!" is the amount of proteins consumed from ages 0 to 24 months. Because nutrient intakes reflect choices, we use instrumental variables techniques to control for endogeneity. The instruments used vary by country. For Guatemala we use the Atole supplement intervention that took place during 1969 to 1977 and annual prices of several goods that affect the relative demand for proteins: chicken, beef, corn and rice. For the Philippines, we use bimonthly prices, collected in each Barangay: formula milk, rice and dried fish. Also a hedonic price of protein is constructed using a larger set of prices and the protein content of each good as weights. The hedonic protein price is calculated for Guatemala and the Philippines. Tables 3A and 3B for Guatemala and 4A and 4B for the Philippines give the estimated impacts of the average protein intakes from ages 0 to 24 months on the coefficients of each specification. In Guatemala, when we use food prices and the Atole dummy, we find a significant impact of protein intake on the coefficients of the growth functions. When the protein price is used, standard errors tend to increase, lowering the significance of the protein coefficients. For the Philippines, in Tables 4A and 4B, we find a similar pattern when only prices are used as instruments, all protein coefficients are significant; however, the hedonic protein price increases standard errors, affecting the significance of the parameters. From the equations it is not directly possible to evaluate if the effect of protein intake on growth is positive or negative. Therefore, to approximate the effect of changing protein intake of growth we calculate counterfactuals. In Figures 7A (Guatemala) and 7B (Philippines) we compare the average difference in height when children eat no protein during their first 24 months of life versus eating the median of protein intake. In each figure we compare the counterfactual exercise! 10!
11 using the OLS coefficients, the IV coefficients when food prices are used as instruments and the IV coefficients when the hedonic protein price is used as instrument. At the same time, we compare the effect for the four different growth models. In almost all cases, increasing protein intake increases height, except for the monomolecular model at early ages. 5 At age 24 months, the differences in height could be of at least 1 cm. These results are consistent with previous research that finds an important effect of protein intakes on height (Moradi (2010), Puentes, et al. (2014)). The effect of protein is related to the importance of protein on tissue accumulation and bone growth, a further discussion can be found in Puentes, et al. (2014). The result of the protein effect on height is important by itself, but we also use this relationship as an input of a structural model of household decisions that we study in next section. 4. Structural Model In this section we present a structural model for how households choose the level of protein children consume, considering the beliefs that parents have about how tall their children could be. This model allows us to simulate how different policies that affect parental beliefs can affect their choices and, thus, their children s height. Household utility depends on consumption other than proteins for the children and height of children. The model is static with households making one choice of protein intakes for the first 24 months of children s lives. Following Koszegi and Rabin (2006), households care about children s height relative to a reference point, which is the expected height of children at 24 months of age. Parents form their beliefs about expected height comparing and averaging the height of children that live in their village. In terms of budget constraints, households have to allocate incomes to protein consumption of children and the rest of the goods for children and the family. Incomes and the price of proteins are exogenous. 6 We assume the following quadratic household utility function:!!!!!!!!!!!!!!!!!!!!!!!!!!!!!!!!!!!!!!!!!!!!!!!!!!!!!!!!!!!! 5!In the previous section we observed that the monomolecular model had a very bad fit for height at age 0; this explains the bad fit of the model for the early ages.! 6!We generate income in Guatemala based on a household wealth index and village average and standard deviation income. For the Philippines we use a wealth index and income collected in the baseline.!! 11!
12 ! =! +!!! +!! h +!! h! +! h! +!!"# h Where! is household consumption other than for child proteins, h is the height of the child at age 24 months and!"# h is the reference point that parents use when comparing the height of their children with a reference group. For comparison purposes we also consider a linear utility! =! +!! h +!!"# h and a quadratic utility without a reference point! =! +!!! +!! h +!! h! +! h!. We assume that parents try to minimize the expected distance between their children s height (h) and the average-reference height (!"#$), taking into consideration that there is a distribution of potential heights of children. The average height that parents expect their children to obtain is the average height of children of the same sex and age in the village where they live. Parents beliefs about the standard deviation of the reference distribution is the observed standard deviation of the mean of heights of children of the same age and sex in the village where they live. Household utility decreases only if the expected distance is negative. Then the reference point part of the household utility we consider is:!"# h =!!"#$ h!"#$ 1 h <!"#$ = h!!"#$ 1 Φ!!!"#$!!"#$!!!!!!"#$!!"#$ Where 1{} is an indicator function,!!"#$ is the average height of children of the same sex, in the same village at age 24 months, and!!"#$ is the standard deviation of the mean of heights of children of the same sex, in the same village at age 24 months. We assume that beliefs follow a normal distribution, under which assumptions we can express the expected value as a function of densities and cumulative functions of a normal distribution. Since the reference point is assumed to vary by village, we can take advantage of the geographic variation in height to identify!. We assume that height variation in the village is exogenous for individual households and that the village height distribution is unrelated to the choice of living in that village. Then parents face! 12!
13 the height distribution of other children in their village as relevant information about the height potential of their own children. 7 The budget constraint varies by country. In Guatemala, to take into account that some villages received free protein, we characterize the amount of protein other than the free protein to enter into the budget constraint, treating as exogenous the level consumed of free protein. 8 Then, the budget constraint in villages with free protein is:! =!!!"#$!"##$"%!"# Where!"#$ is the protein consumed by children in the first 24 months of life,! is income and!"##$"%#'( is the amount of protein consumed from Atole. The budget constraint of Filipino households and households in Guatemala that did not received free protein is:! =!!!"#$ Finally, we assume that parents know the height production function, that is, how protein intake affects the coefficients of the height production function. We estimate the structural model using the Weibull, Chapman Richards, Monomolecular and Difference in Power production functions. 5. Estimation The structural models are estimated using maximum likelihood. For each household we calculate the optimal protein intake and compare this amount with the actual amount, assuming that the actual amount of protein intake is measured with error, and the error term follows a normal distribution with mean zero and standard deviation!!. The estimates are presented in table 5. We restricted the quadratic terms to be negative, and the interaction between height and! was constraint to be positive.!!!!!!!!!!!!!!!!!!!!!!!!!!!!!!!!!!!!!!!!!!!!!!!!!!!!!!!!!!!! 7!For the Philippines, instead of using information by village, we grouped urban and rural villages and used four reference points, by zone and gender. In Guatemala we have eight reference points, by (four) villages and gender.! 8!In US dollars of 2004 the average income in the Philippines is $1973, and $2278 in Guatemala. The price of 100 grams of protein in the Philippines is $0.84, in Guatemala is $2.49.!! 13!
14 Tables 6A and 6B show the fit of the structural model for Guatemala and the Philippines, respectively. Each table shows the fit for three different household utility functions and the four parametric height equations. We compare the mean, standard deviation and the 10th, 25 th, 50 th, 75 th and 90 th percentiles of child actual and predicted protein consumption. 9 We also report the R-squared when regressing the actual protein consumption of the model prediction and a constant. For Guatemala we find that the quadratic utility function with a reference point performs better than the other utility functions in terms of R-squared fit. Also the difference equation with a power of height performs better than the other three parametric height functions. In terms of the distribution of protein consumption, all utility functions and parametric height functions predict zero protein consumption for too many children. In all the 12 possible cases, the 25 th percentile predicts zero protein consumption, however predictions for the 75 th and 90 th percentile are more accurate. The results of the predicted distributions explain why these models predict generally low mean protein consumption and high standard deviations, compare with the actual means and standard deviations. Table 6B shows the results for the Philippines. We find a better fit in terms of the R-squares and for the overall distribution of protein consumption. Again, the quadratic utility function with the reference point outperforms the other two utility functions, but for the Philippines the Monomolecular height function provides the better fit in terms of R-squared. Similarly to Guatemala, the model tends to over predict zero protein intakes; however, at the 25 th percentile the predictions for the Philippines are closer to the actual intakes. In terms of the means and standard deviations of the predictions, the models tend to under predict the means and over predict the standard deviations, though the models perform markedly better than for Guatemala. Counterfactuals Using the estimates of the height production functions and the structural model, we simulated three counterfactual exercises: The first one is to equalize Atole and Fresco villages in Guatemala; to do that we first subtract from Atole villages the protein consumption from the!!!!!!!!!!!!!!!!!!!!!!!!!!!!!!!!!!!!!!!!!!!!!!!!!!!!!!!!!!!! 9!The model predicts consumption without measurement error, while the actual protein consumption includes measurement error.!!! 14!
15 Atole consumption and force the Atole villages to adopt the reference point of the Fresco villages. Similarly, in a second part of the exercise, we give to Fresco villages the average protein intake from the drink Atole consumed in Atole villages, and we then study the change in protein in Fresco villages if they were to have the reference point of the Atole villages. In figures 8A we show the results of this counterfactual exercise. In the first panel of figure 8A we observe the height distribution: a) in the baseline of Atole villages; b) in the baseline of Fresco villages; c) when Atole villages have the reference point of Fresco villages; d) when Atole villages are assumed to lose their Atole protein intake and; and e) which is c) and d) together. We observe that when Atole villages lose their Atole intake children s height is reduced from an average of 77 cm to 76.7 cm. Next, if only the reference point changes, the average height is now 76.6 cm. Finally, when both the reference point and the intake changes, the average height drops to 76.1 cm, close to the average of the Fresco villages of 76 cm. The second panel of figure 8A is similar to the first panel, in this case we observe the height distribution for the following cases: a) baseline of Atole villages; b) baseline of Fresco villages; c) when Fresco villages have the reference point of Atole villages; d) when Fresco villages are assumed to receive the average Atole protein intake of Atole villages and; e) which c) and d) together. Similarly to figure 8A, we observe that if Fresco villages had the reference point of Atole villages, average children s height would increase from 76 cm to 76.7 cm, and if Fresco villages were given only the average Atole consumption, height would also increase to Finally, in the case of changing the reference point and receiving the average Atole proteins, the average height of children in Fresco villages would be 77.3 cm, higher that the average of 77 cm in Atole villages. These exercises show the importance of reference points and the Atole intervention to explain the differences in heights in Atole and Fresco villages. In figure 8B we perform the same counterfactuals, but using different height production function, similar patterns are found, in all cases the changes in reference points and free proteins make Atole and Fresco villages more alike. In the second counterfactual, households in the Philippines receive 8.4 grams of protein for free; this is average of proteins from Atole consumed in Atole villages. Figure 9A shows the change in height and protein distributions. In the first panel we see that the average height increases from! 15!
16 79 cm to 79.5 cm, while mean protein consumption increases from 7.8 grams to 14.5 grams, which is less than the free proteins given to the households. This substitution of proteins was also found for Guatemalan Atole households (Islam and Hoddinott, 2009). Figure 9B shows the same counterfactual exercise but using different height production functions; the same results hold. The third counterfactual corresponds to changing the reference points that parents have for the WHO height reference (WHO, 2006). We assume that households use the 10 th and the 50 th percentile of the WHO height distribution as their new reference points. Figure 10A shows the changes in the height distribution for the Philippines and Guatemala, using the 4 parametric height production functions. The graphs show an important increment in height for both countries. In the case of the Philippines, height could increase close to 3 cm if households were to use as reference point the 10 th percentile of the WHO height distribution, and close to 6 cm if they were using the 50 th percentile. In the case of Guatemala, the changes are more moderate and depend on the parametric height production function assumed. If households were to use the 10 th percentile of the WHO distribution, height could increase between 0.6 and 3 cm, while if households were considering the 50 th percentile of the WHO height distribution the increase in height ranges from 0.9 to 5.4 cm. Figure 10B shows the changes of protein consumption of children when parents adopt different reference points. For the Philippines we observe important changes in average protein consumption, more than doubling if parents use the 50 th percentile of the WHO height distribution as reference points. For Guatemala we also observe important increments in protein consumption. The counterfactual exercises suggest that households in Guatemala and the Philippines would react more substantially to information about optimal height of their children being the WHO distribution for well-nourished children than to food interventions that provide food for free on the order of magnitude of the INCAP trial. This is an important result because it suggests that health interventions should consider transfer of information as a key component to increase health of children. 6. Conclusion! We adapt and study how parametric functions can describe changes in height for infants between 0 and 24 months of age, finding striking similarities for two different countries at two different! 16!
17 points in time. This result indicates that human biology is very similar despite the observed differences in final height across countries and over time. Additionally, we find that protein intakes play a key role in height growth during the first two years of life. Another important contribution of our paper is to consider parents beliefs as important factors that may determine the growth process of their children. Our preliminary results suggest that parents in the Philippines and Guatemala have beliefs about the average height their children that are affecting the potential growth of their children. Our simulations suggest that if parents update their beliefs from local height distributions to even conservative WHO standards, the heights of their children could increase importantly. Moreover, the usual policies to combat under-nutrition such as cash transfers or delivery of nutrients free of charge do not have nearly as strong effects on children s height. These results indicate that a comprehensive policy that includes information about expected height for age, nutritional information and transfers may be needed to improve the health of children. Future research should study how parents create and update their beliefs about what is healthy for their children and what role policies can play in this process. References Behrman, J. R.; Calderon, M. C.; Preston, S. H.; Hoddinott, J. F.; Martorell, R.; Stein, A. D. (2009). Nutritional Supplementation of Girls Influences the Growth of Their Children: Prospective Study in Guatemala. American Journal of Clinical Nutrition, 90 (5), Behrman JR, Deolalikar AB. Will Developing Country Nutrition Improve with Income? A Case Study for Rural South India. Journal of Political Economy 1987; 95:3(June): Behrman JR, Wolfe BL. More Evidence on Nutrition Demand: Income Seems Overrated and Women's Schooling Underemphasized. Journal of Development Economics 1984; 14:1 and 2(January-February): Bouis HE, Haddad LJ. Are Estimates of Calorie-Income Elasticities Too High? A Recalibration of the Plausible Range. Journal of Development Economics 1992; 39:2(October): de Cao, E. (2011). The Height Production Function From Birth To Early Adulthood. Dondena Working Papers (43), de Onis, M., M. Blössner E. Borghi "Prevalence and Trends of Stunting among Pre- School Children, " Public Health Nutrition, 1(1), 1-7. Dewey, K. (2013). Meeting protein needs at 6 to 25 months of age. Food and Nutrition Bulletin, vol. 34. No 2. The United Nations University.! 17!
18 Engle, P. L.; Black, M. M.; Behrman, J. R.; Cabral de Mello, M.; Gertler, P. J.; Kapiriri, L.; Martorell, R.; Young, M. E. and the International Child Development Steering G; (2007). Strategies to Avoid the Loss of Developmental Potential in More Than 200 Million Children in the Developing World. The Lancet, 369 (9557), Engle, P. L.; Fernald, L. C. H.; Alderman, H.; Behrman, J. R.; O'Gara, C.; Yousafzai, A.; de Mello, M. C.; Hidrobo, M.; Ulkuer, N.; Ertem, I.; Global Child Development Steering Group (2011). Strategies for Reducing Inequalities and Improving Developmental Outcomes for Young Children in Low and Middle Income Countries. The Lancet, 378 (9799), Grantham-McGregor, S.; Cheung, Y. B.; Cueto, S.; Glewwe, P.; Ritcher, L.; Strupp, B. (2007). Developmental Potential in the First 5 Years for Children in Developing Countries. The Lancet, 369 (9555), Griffen, A. S. (2014). Height and Calories in Early Childhood. Mimeo, Habicht, J.P.; Martorell, R. Rivera, J. A. (1995). Nutritional Impact Of Supplementation In The INCAP Longitudinal Study: Analytic Strategies And Inferences. The Journal of Nutrition, 125, 1042S 50S. Hoddinott, John, Jere R. Behrman, John A. Maluccio, Paul Melgar, Agnes R. Quisumbing, Manuel Ramirez-Zea, Aryeh D. Stein, Kathryn M. Yount and Reynaldo Martorell. (2013). Adult Consequences of Growth Failure in Early Childhood. The American Journal of Clinical Nutrition, 98 (5), Hoddinott, J. F.; Maluccio, J. A.; Behrman, J. R.; Flores, R. Martorell, R. (2008). Effect of a Nutrition Intervention During Early Childhood on Economic Productivity in Guatemalan Adults. The Lancet, 371 (9610), Islam, M. Hoddinott, J. (2009). Evidence Of Intrahousehold Flypaper Effects From A Nutrition Intervention In Rural Guatemala. Economic Development and Cultural Change, 57 (2), Koszegi, B, Rabin, M. (2006). A Model Of Reference-Dependent Preferences. The Quarterly Journal of Economics. Vol. 121, Nº 4, pp Liu, H.; Mroz, T. Adair, L. (2009). Parental Compensatory Behaviors And Early Child Health Outcomes In Cebu, Philippines. Journal of Development Economics, 90 (2), Maluccio, J. A.; Hoddinott, J. F.; Behrman, J. R.; Quisumbing, A. R.; Martorell, R. Stein, A. D. (2009). The Impact of Nutrition During Early Childhood on Education among Guatemalan Adults. Economic Journal, 119 (537), Martorell, R.; Habicht, J. P.; Rivera, J. A. (1995). History and Design of the INCAP Longitudinal Study ( ) and its Follow-up ( ). The Journal of Nutrition, 125, 1027S 41S. Michaelsen, K. (2013). Cow s milk in the prevention and treatment of stunting and wasting. Food and Nutrition Bulletin, vol. 34. No 2. The United Nations University! 18!
19 Moradi, A (2010). Nutritional Status and Economic Development in sub-saharan Africa, Economics and Human Biology, 8, Mølgaard C, A.Larnkjær, K. Arnberg and K Michaelsen, (2011). Milk and growth in children: effects of whey and casein. Nestle Nutrition Workshop Series, Pediatrics 67: Pitt MM, Rosenzweig MR. Health and Nutrient Consumption Across and Within Farm Households. Review of Economics and Statistics 1985; 67:2(May): Puentes E, Wang F, Behrman J, Cunha F, Hoddinott J, Maluccio J, Adair L, Borja J, Martorell R, Stein A (2014). Early Life Height and Weight Production Functions with Endogenous Energy and Protein Inputs. Mimeo. Stein AD, Wang M, Martorell R, Norris SA, Adair LS, Bas I, et al. (2010). Growth Patterns in Early Childhood and Final Attained Stature: Data from Five Birth Cohorts from Low- And Middle-Income Countries. American Journal of Human Biology, 22(3): Subramanian S, Deaton A. The Demand for Food and Calories. Journal of Political Economy 1996; 104:1(February): Victora, C. G.; Adair, L.; Fall, C.; Hallal, P. C.; Martorell, R.; Rithcer, L.; Sachdev, H. S. for the Maternal and Child Undernutrition Study Group (2008). Maternal and Child Undernutrition: Consequences for Adult Health and Human Capital. The Lancet, 371 (9609), WHO (2006). WHO Child Growth Standards: Length/Height-For-Age, Weight-For-Age, Weight-For-Length, Weight-For Height And Body Mass Index-For-Age: Methods And Development. World Health Organization. WHO (2007). Protein and Amino Acid Requirements In Human Nutrition. Report of a Joint WHO/FAO/UNU Expert Consultation. World Health Organization technical report series, no 935.!! 19!
20 Tables'and'Figures' Table'1:'Descriptive'Statistics' Summary'Statistics'for'Height,'Protein'and'Protein'prices' ' ' ' ' ' ' ' ' ' ' ' ' mean' sd' p5' p10' p25' p50' p75' p90' p95' count' Cebu' ' ' ' ' ' ' ' ' ' ' Average'Protein'Intake' ' 9.129' 4.737' 5.926' 8.712' ' ' ' ' 1576' Between'Month'6'and'24' Height'at'Month'0' ' 2.093' ' ' ' ' ' ' ' 1576' Height'at'Month'12' ' 2.899' ' ' ' ' ' ' ' 1566' Height'at'Month'24' ' 3.610' ' ' ' ' ' ' ' 1576' hgtfin' ' 8.214' ' ' ' ' ' ' ' 1576' Average'Protein'Price' ' ' ' ' ' ' ' ' ' 1576' Between'Month'6'and'24' Guat' ' ' ' ' ' ' ' ' ' ' Average'Protein'Intake' ' 8.791' 8.350' ' ' ' ' ' ' 296' Between'Month'6'and'24' Height'at'Month'0' ' 2.325' ' ' ' ' ' ' ' 296' Height'at'Month'12' ' 2.941' ' ' ' ' ' ' ' 287' Height'at'Month'24' ' 3.446' ' ' ' ' ' ' ' 296' hgtfin' ' 8.411' ' ' ' ' ' ' ' 296' Average'Protein'Price' Between'Month'6'and'24' ' 3.527' ' ' ' ' ' ' ' 296'
21 ' Table'2A:'Number'of'Observations'available,'Guatemala' Guatemala,'Number'of'Rounds'Observed'for'Each'Child'Between'0'and'24'months' ' 1U5'rounds' 6'rounds' 7'rounds' 8'rounds' 9'rounds' ' observed' observed' observed' observed' observed' Number'of'Children'WITHOUT:' ' ' ' ' ' month'0'hgt' 305' 71' 92' 84' 0' month'24'hgt' 375' 51' 41' 27' 0' adult'hgt' 286' 30' 58' 65' 132' Number'of'Children'WITH:' ' ' ' ' ' any'month'hgt' 559' 121' 149' 214' 370' mth'0'and'mth'24'hgt' 3' 10' 28' 103' 370' mth'0,'mth'24,'adult'hgt' 0' 6' 18' 67' 238' 1.1,'Value'in'cells'represent'the'number'of'children'whose'height'is'observed'for'x'number'of'rounds'between'month'0'and'month'24' 1.2,'For'example,'top'left'first'cell'is:'the'number'of'children'with'height'observed'0U9'times'between'0U24'mth'who'were'not'obsered'on' mth'0' 2.1,'For'proper'comparison'across'individuals,'we'require'children'used'for'estimation'to'have'observation'on'month'0'and'month'24'' 2.3,'For'proper'comparison'across'individuals,'we'require'children'used'for'estimation'to'have'at'least'8'observations' 2.4,'For'the'3'biological'models,'we'require'children'to'have'final'height' ' ' Table'2B:'Number'of'Observations'available,'Philippines' Philippines,'Number'of'Rounds'Observed'for'Each'Child'Between'0'and'24'months' ' 1U9'rounds' 10'rounds' 11'rounds' 12'rounds' 13'rounds' ' observed' observed' observed' observed' observed' Number'of'Children'WITHOUT:' ' ' ' ' ' month'0'hgt' 4' 0' 2' 1' 0' month'24'hgt' 236' 27' 33' 41' 0' adult'hgt' 222' 31' 44' 85' 535' Number'of'Children'WITH:' ' ' ' ' ' any'month'hgt' 263' 55' 89' 201' 2105' mth'0'and'mth'24'hgt' 27' 28' 55' 159' 2105' mth'0,'mth'24,'adult'hgt' 17' 17' 34' 99' 1570' 1.1,'Value'in'cells'represent'the'number'of'children'whose'height'is'observed'for'x'number'of'rounds'between'month'0'and'month'24' 1.2,'For'example,'top'left'first'cell'is:'the'number'of'children'with'height'observed'0U9'times'between'0U24'mth'who'were'not'obsered'on' mth'0' 2.1,'For'proper'comparison'across'individuals,'we'require'children'used'for'estimation'to'have'observation'on'month'0'and'month'24'' 2.3,'For'proper'comparison'across'individuals,'we'require'children'used'for'estimation'to'have'at'least'12'observations' 2.4,'For'the'3'biological'models,'we'require'children'to'have'final'height'
22 ' Table'3A:'Protein'effect'on'coefficients,'Guatemala' Guat, Instrument Set Multiple Prices (1) (2) (3) (4) (5) (6) (7) (8) DPOW a DPOW b CHPM a CHPM b BRIDGE a BRIDGE b MONO a MONO b 0-24 mths avg GM/DAY Protein * * ** * *** *** (-0.89) (1.90) (1.77) (2.47) (-1.64) (1.93) (4.35) (-4.12) wgt *** ** ** -1.65e *** ** *** 4.64e-09 (2.71) (-2.42) (-2.40) (-1.52) (2.76) (-2.28) (-2.88) (0.62) hgt *** *** *** ** *** *** *** * (-6.72) (5.66) (5.79) (2.44) (-6.60) (5.18) (-3.13) (1.81) Male *** *** *** *** *** *** *** *** (6.86) (-6.56) (-7.00) (-8.78) (5.30) (-6.80) (13.82) (9.99) Constant *** *** *** (6.18) (-0.80) (-1.14) (-0.62) (-0.15) (-0.18) (-14.57) (-8.17) Hansen-J p Ander Under p 1.07e e e e e e e e-20 First Stage F Atole instru instru instru instru instru instru instru instru Egg Price instru instru instru instru instru instru instru instru Chicken Price instru instru instru instru instru instru instru instru Pig Price instru instru instru instru instru instru instru instru Beef Price instru instru instru instru instru instru instru instru Corn Price instru instru instru instru instru instru instru instru Rice Price instru instru instru instru instru instru instru instru N r t statistics in parentheses * p < 0.10, ** p < 0.05, *** p < 0.01 ' '
23 Table'3B:'Protein'effect'on'coefficients,'Guatemala' Guatemala, Instrument Only Protein Price (1) (2) (3) (4) (5) (6) (7) (8) DPOW a DPOW b CHPM a CHPM b BRIDGE a BRIDGE b MONO a MONO b 0-24 mths avg GM/DAY Protein ** *** *** (-0.72) (1.56) (1.47) (2.04) (-1.32) (1.62) (3.37) (-3.85) wgt *** ** ** -1.62e *** ** *** 5.02e-09 (2.69) (-2.39) (-2.38) (-1.49) (2.73) (-2.25) (-2.81) (0.66) hgt *** *** *** ** *** *** *** * (-6.69) (5.62) (5.77) (2.41) (-6.56) (5.14) (-3.20) (1.76) Male *** *** *** *** *** *** *** *** (6.85) (-6.55) (-6.99) (-8.77) (5.29) (-6.78) (13.94) (9.93) Constant *** *** *** (6.09) (-0.77) (-1.12) (-0.58) (-0.18) (-0.16) (-14.45) (-8.01) Hansen-J p Ander Under p 5.56e e e e e e e e-17 First Stage F Atole instru instru instru instru instru instru instru instru Hedonic Protein Price instru instru instru instru instru instru instru instru N r t statistics in parentheses * p < 0.10, ** p < 0.05, *** p < 0.01 ' ' '
24 Table'4A:'Protein'effect'on'coefficients,'Philippines' Cebu, Instrument Set Multiple Prices (1) (2) (3) (4) (5) (6) (7) (8) DPOW a DPOW b CHPM a CHPM b BRIDGE a BRIDGE b MONO a MONO b 0-24 mths avg GM/DAY Protein *** *** *** *** *** *** *** *** (-3.24) (3.64) (3.55) (4.09) (-3.24) (3.95) (2.62) (-5.56) wgt *** *** *** -5.51e-08 *** *** *** *** -2.35e-09 (9.36) (-8.89) (-8.88) (-7.11) (9.18) (-8.38) (-2.59) (-0.54) hgt *** *** *** *** *** *** *** *** (-14.65) (13.50) (13.86) (8.84) (-15.01) (13.13) (-7.69) (4.75) Male *** *** *** *** *** *** *** *** (7.50) (-6.44) (-7.13) (-10.57) (5.34) (-7.65) (29.70) (15.53) Constant *** *** *** *** *** *** *** *** (14.80) (-6.27) (-7.34) (-6.30) (4.78) (-5.57) (-21.37) (-16.25) Hansen-J p Ander Under p 1.50e e e e e e e e-22 First Stage F Formula Milk Price instru instru instru instru instru instru instru instru Egg Price instru instru instru instru instru instru instru instru Rice Price instru instru instru instru instru instru instru instru Dried fish Price instru instru instru instru instru instru instru instru N r t statistics in parentheses * p < 0.10, ** p < 0.05, *** p < 0.01 ' ' ' '
25 Table'4B:'Protein'effect'on'coefficients,'Philippines' Cebu, Instrument Only Protein Price (1) (2) (3) (4) (5) (6) (7) (8) DPOW a DPOW b CHPM a CHPM b BRIDGE a BRIDGE b MONO a MONO b 0-24 mths avg GM/DAY Protein wgt0 hgt0 Male Constant (-0.69) *** (9.00) *** (-15.35) *** (7.56) *** (15.77) (1.52) *** (-8.50) *** (13.77) *** (-6.51) *** (-6.36) (1.59) *** (-8.43) *** (13.84) *** (-7.23) *** (-7.24) *** (2.93) -4.90e-08 *** (-6.66) *** (8.56) *** (-10.98) *** (-6.19) (-1.10) *** (8.78) *** (-15.39) *** (5.28) *** (4.83) ** (2.05) *** (-8.00) *** (13.20) *** (-7.80) *** (-5.45) (0.74) ** (-2.21) *** (-7.79) *** (31.54) *** (-22.20) *** (-5.14) -1.77e-09 (-0.40) *** (5.16) *** (15.23) *** (-16.23) Ander Under p 1.03e e e e e e e e-14 First Stage F Hedonic Protein Price Instru instru instru instru instru instru instru instru N r t statistics in parentheses * p < 0.10, ** p < 0.05, *** p < 0.01 ' ' ' ' '
26 Table'5:'Model'Coefficients' Model!1:!Linear!utility!reference!!! point!!! HEIGHT!Coefficients!!! C!Quadratic!!! C*Height!!! Protein!Mrs!Error!!!!! Lambda Height!!!!!!!!!!!!!! MeasuErrSD Guatemala( Weibull! 0.031!!! 1.46EG21!!!!!!!!!!!!!!! ! Guatemala( Chapman!Richards! 0.024!!! 8.00EG16!!!!!!!!!!!!!!! ! Guatemala( Monomolecular! 0.042!!! 6.27EG18!!!!!!!!!!!!!!! ! Guatemala( Difference!Power! 0.029!!! 3.11EG21!!!!!!!!!!!!!!! !!!!!!!!!!!!!!!!!!!!!!!!!!! Cebu( Weibull! 1.571!!! 3.16EG18!!!!!!!!!!!!!!! ! Cebu( Chapman!Richards! 1.618!!! 4.38EG212!!!!!!!!!!!!!!! ! Cebu( Monomolecular! 1.730!!! 6.62EG32!!!!!!!!!!!!!!! ! Cebu( Difference!Power! 1.647!!! 4.73EG245!!!!!!!!!!!!!!! !!!!!!!!!!!!!!!!!!!!!!!!!!!!! Model!2!Quadratic!Utility!and! Reference!Point! HEIGHT!Coefficients!!!!!!!!!!! Protein!Mrs!Error! Height!!!! Lambda Height Squared CQuadratic C*Height!! MeasuErrSD Guatemala( Weibull! 0.419!!! 0.791!!! G0.073!!! G0.146!!! 0.000!!! ! Guatemala( Chapman!Richards! 0.001!!! 0.000!!! G9.77EG06!!! G2.89EG17!!! 0.167!!! ! Guatemala( Monomolecular! 0.140!!! 3.923!!! G0.260!!! G0.042!!! 0.000!!! ! Guatemala( Difference!Power! !!! !!! G6.551!!! G17.354!!! 0.000!!! !!!!!!!!!!!!!!!!!!!!!!!!!!! Cebu( Weibull! 3.346!!! 0.027!!! G0.115!!! G8.49EG09!!! 0.023!!! 9.551! Cebu( Chapman!Richards! !!! 0.000!!! G31.628!!! G2.21EG08!!! 0.680!!! 9.852! Cebu( Monomolecular! !!! 0.026!!! G28.231!!! G9.52EG09!!! 0.663!!! 9.051! Cebu( Difference!Power! 1.840!!! 4.202!!! G0.003!!! G2.16EG06!!! 0.004!!! !!!!!!!!!!!!!!!!!!!!!!!!!!!!! MODEL!3:!Quadratic!Utility!!! HEIGHT!Coefficients!!!!!!!!!!! Protein!Mrs!Error! Height!!!!!!!! Height Squared CQuadratic C*Height!! MeasuErrSD Guatemala( Weibull!!!!! 3.123!!! G0.206!!! G3.69EG05!!! 4.10EG10!!! ! Guatemala( Chapman!Richards!!!!! 0.491!!! G0.914!!! G1.68EG05!!! 4.31EG09!!! ! Guatemala( Monomolecular!!!!! 2.983!!! G0.194!!! G2.25EG05!!! 5.12EG10!!! ! Guatemala( Difference!Power!!!!! 3.044!!! G0.204!!! G0.174!!! 1.00EG13!!! ! ((!!!!!!!!!!!!!!!!!!!!!!!! Cebu( Weibull!!!!! !!! G21.512!!! G0.005!!! 4.74EG08!!! 9.657! Cebu( Chapman!Richards!!!!! !!! G2.44EG06!!! G1.82EG29!!! 5.319!!! ! Cebu( Monomolecular!!!!! !!! G1.02EG05!!! G1.29EG194!!! !!! 9.448! Cebu( Difference!Power!!!!! EG33!!! G1.11E+10!!! G !!! 0.706!!! !
27 Table6A:StructuralModelFit
28 Table6B:StructuralModelFit

29 Figure1:Heightprofiles

30 Figure2:HeightEquationsFit,Residuals

31 Figure3:HeightEquationsFit,RCSquare

32 Figure4A:ComparingbestFitforGuatemala Figure4B:ComparingbestFitforthePhilippines

33 Figure5:HeightEquations,OutofSamplePrediction
34 Figure6A:HeightEquations,Bestfiroutofsample.Guatemala Figure6B:HeightEquationsBestfiroutofsample.Philippines

35 Figure7A:Effectsofincreasingproteinintakes,Guatemala Figure7B:Effectsofincreasingproteinintakes,Philippines


36 Figure8A:Counterfactual1:Guatemala,CloseAtoleandFrescoGap. Figure8B:Counterfactual1,differentheightequations


37 Figure9A:Counterfactual2,FreeProteinintakeinthePhilippines Figure9B:Counterfactual2,otherheightequations


38 Figure10A:Counterfactual3,ChangingReferencePoints Figure10B:Counterfactual3,ChangingReferencePoints
A Framework for the Analysis of Early Life Interventions
 A Framework for the Analysis of Early Life Interventions Jere Behrman, University of Pennsylvania Flavio Cunha, University of Pennsylvania Linda Adair, University of North Carolina Judith Borja, University
ECONOMIC CASE FOR INVESTING IN NUTRITION IN AFRICA: KEY MESSAGES
 ECONOMIC CASE FOR INVESTING IN NUTRITION IN AFRICA: KEY MESSAGES Based on the background paper: Hoddinott, J., 2016. The economics of reducing malnutrition in Sub-Saharan Africa Key Messages Nutrition
Nutrition-sensitive Social Protection Programs: How Can They Help Accelerate Progress in Improving Maternal and Child Nutrition?
 Nutrition-sensitive Social Protection Programs: How Can They Help Accelerate Progress in Improving Maternal and Child Nutrition? Harold Alderman Dec. 13, 2013 Why Focus on Nutrition Sensitive Programs?
HIGH QUALITY NUTRITION IN CHILDHOOD, BODY SIZE AND WAGES IN EARLY ADULTHOOD: EVIDENCE FROM GUATEMALAN WORKERS MARIA CECILIA CALDERON 1
 HIGH QUALITY NUTRITION IN CHILDHOOD, BODY SIZE AND WAGES IN EARLY ADULTHOOD: EVIDENCE FROM GUATEMALAN WORKERS MARIA CECILIA CALDERON ABSTRACT Establishing a causal relationship between health and productivity
Underweight Children in Ghana: Evidence of Policy Effects. Samuel Kobina Annim
 Underweight Children in Ghana: Evidence of Policy Effects Samuel Kobina Annim Correspondence: Economics Discipline Area School of Social Sciences University of Manchester Oxford Road, M13 9PL Manchester,
Food Consumption Pattern and Dietary Diversity
 12Round I survey of CFPR phase II Food Consumption Pattern and Dietary Diversity Chowdhury SB Jalal, Nuzhat Choudhury and Munshi Suliman INTRODUCTION This chapter provides information about the quantities
Does Economic Growth Reduce Child Malnutrition?
 Does Economic Growth Reduce Child Malnutrition? By Rasmus Heltberg Institute of Economics University of Copenhagen Studiestr 6, 1455 København K, Denmark Email: Rasmus.heltberg@econ.ku.dk Contact details
Early Life Nutrition and Subsequent Education, Health, Wage, and Intergenerational Effects
 WORKING PAPER NO.33 Early Life Nutrition and Subsequent Education, Health, Wage, and Intergenerational Effects Jere R. Behrman WORKING PAPER NO. 33 Early Life Nutrition and Subsequent Education, Health,
Nutrition in the Post-2015 Context. Lynnda Kiess Head, Nutrition and HIV Unit, WFP
 Nutrition in the Post-2015 Context Lynnda Kiess Head, Nutrition and HIV Unit, WFP Presentation Different Dimensions of Malnutrition Consequences Food Security and Nutrition Looking forward Key Points Nutrition
Empirical Analysis of the Impact of Income on Dietary Calorie Intake in Nigeria. Babatunde, R. O
 Empirical Analysis of the Impact of Income on Dietary Calorie Intake in Nigeria. Babatunde, R. O Department of Agricultural Economics and Social Sciences (490b), University of Hohenheim, D-70593 Stuttgart,
Agriculture and Nutrition Global Learning and Evidence Exchange (AgN-GLEE)
") This presentation is part of the Agriculture and Nutrition Global Learning and Evidence Exchange (AgN-GLEE) held in Bangkok, Thailand from March 19-21, 2013. For additional presentations and related event
This presentation is part of the Agriculture and Nutrition Global Learning and Evidence Exchange (AgN-GLEE) held in Bangkok, Thailand from March 19-21, 2013. For additional presentations and related event
Unleashing Gains in Economic Productivity with Investments in Nutrition
 Unleashing Gains in Economic Productivity with Investments in Nutrition By Jakub Kakietek, Julia Dayton Eberwein, Dylan Walters, and Meera Shekar Key Messages Investments in optimum nutrition particularly
Gender and Generational Effects of Family Planning and Health Interventions: Learning from a Quasi- Social Experiment in Matlab,
 Gender and Generational Effects of Family Planning and Health Interventions: Learning from a Quasi- Social Experiment in Matlab, 1977-1996 T. Paul Schultz* * I gratefully acknowledge research support from
Does Male Education Affect Fertility? Evidence from Mali
 Does Male Education Affect Fertility? Evidence from Mali Raphael Godefroy (University of Montreal) Joshua Lewis (University of Montreal) April 6, 2018 Abstract This paper studies how school access affects
India s Malnutrition Enigmas: Why They Must Not Be a Distraction from Action
 India s Malnutrition Enigmas: Why They Must Not Be a Distraction from Action Lawrence Haddad Institute of Development Studies Sussex, UK November 2013 India has one of the highest child stunting rates
Effects of Market Work and Own Household Work on Nutrition Intake of Rural Adults: The Case of Vietnam
 Effects of Market Work and Own Household Work on Nutrition Intake of Rural Adults: The Case of Vietnam Tadashi Sonoda Nagoya University sonoda@soec.nagoya-u.ac.jp Ashok Mishra Arizona State University
An Investment Framework for Meeting the Global Nutrition Target for Stunting
 Public Disclosure Authorized Public Disclosure Authorized Public Disclosure Authorized An Investment Framework for Meeting the Global Nutrition Target for Stunting Meera Shekar a, Jakub Kakietek a, Julia
Content. The double burden of disease in México
 Can we and Prevent Malnutrition while Addressing the Challenge of NRCD s? Experiences from Mexico Content The double burden of disease in México What is currently being done in México for preventing and
The Effects of Maternal Alcohol Use and Smoking on Children s Mental Health: Evidence from the National Longitudinal Survey of Children and Youth
 1 The Effects of Maternal Alcohol Use and Smoking on Children s Mental Health: Evidence from the National Longitudinal Survey of Children and Youth Madeleine Benjamin, MA Policy Research, Economics and
Malnutrition in Ecuador: differentiating the impact of several interventions
 Malnutrition in Ecuador: differentiating the impact of several interventions JUAN PONCE AND DEBORAH HINES Abstract This paper analyzes the impact of several interventions on malnutrition in Ecuador using
PROJECT Ntshembo: Improving adolescent health and interrupting mother-infant transfer of health risk in Africa. INDEPTH Network
 PROJECT Ntshembo: Improving adolescent health and interrupting mother-infant transfer of health risk in Africa INDEPTH Network Overview Transitions across countries Transitions within countries - South
Rapid decline of female genital circumcision in Egypt: An exploration of pathways. Jenny X. Liu 1 RAND Corporation. Sepideh Modrek Stanford University
 Rapid decline of female genital circumcision in Egypt: An exploration of pathways Jenny X. Liu 1 RAND Corporation Sepideh Modrek Stanford University This version: February 3, 2010 Abstract Egypt is currently
Contribution of Calories and Fats to Nutritional Outcomes
 Contribution of Calories and Fats to Nutritional Outcomes EPAR Brief No. 119 Karina Derksen-Schrock Associate Professor Mary Kay Gugerty Prepared for the Agricultural Development Group Evans School Policy
Myanmar Food and Nutrition Security Profiles
 Key Indicators Myanmar Food and Nutrition Security Profiles Myanmar has experienced growth in Dietary Energy Supply (DES). Dietary quality remains poor, low on protein and vitamins and with high carbohydrates.
Myanmar - Food and Nutrition Security Profiles
 Key Indicators Myanmar - Food and Nutrition Security Profiles Myanmar has experienced growth in Dietary Energy Supply (DES). Dietary quality remains poor, low on protein and vitamins and with high carbohydrates.
By the end of the activities described in Section 5, consensus has
 6 Selecting Indicators 81 By the end of the activities described in Section 5, consensus has been reached on the goals and objectives of the project, the information which needs to be collected and analyzed
The Lancet Series on Maternal and Child Nutrition Launch Symposium 6 June, 2013
 The Lancet Series on Maternal and Child Nutrition Launch Symposium 6 June, 2013 Imperial College St Mary s Campus Rothschild Lecture Hall, School of Medicine Norfolk Place, London Maternal and Child Undernutrition
ARTICLE. Influence of Prenatal and Postnatal Growth on Intellectual Functioning in School-aged Children
 GLOBAL HEALTH ARTICLE Influence of Prenatal and Postnatal Growth on Intellectual Functioning in School-aged Children Tippawan Pongcharoen, PhD; Usha Ramakrishnan, PhD; Ann M. DiGirolamo, PhD; Pattanee
Fig. 64 Framework describing causes and consequences of maternal and child undernutriton
 9.0 PREVALENCE OF MALNUTRITION 118 This chapter presents the prevalence of the three types of malnutrition (wasting, stunting and underweight) by background characteristic and livelihood zones in children
SELECTED FACTORS LEADING TO THE TRANSMISSION OF FEMALE GENITAL MUTILATION ACROSS GENERATIONS: QUANTITATIVE ANALYSIS FOR SIX AFRICAN COUNTRIES
 Public Disclosure Authorized Public Disclosure Authorized Public Disclosure Authorized Public Disclosure Authorized ENDING VIOLENCE AGAINST WOMEN AND GIRLS SELECTED FACTORS LEADING TO THE TRANSMISSION
Rising Incomes and Nutrition in China
 Rising Incomes and Nutrition in China John A. Bishop East Carolina University, USA Haiyong Liu* East Carolina University, USA Buhong Zheng University of Colorado-Denver, USA Abstract. Rising incomes in
MALNUTRITION: NIGERIA S SILENT CRISIS
 Malnutrition: Nigeria s Silent Crisis u Throughout the years, Nigeria has undergone some remarkable changes: more children are surviving, the economy is growing, girls are better educated, and Nigerians
Chronic undernutrition: Retrospect and prospects
 Chronic undernutrition: Retrospect and prospects John Hoddinott Cornell University Keynote Address Center for Child Wellbeing and Development: Annual Conference University of Zurich March 2017 Introduction:
From malnutrition to nutrition security
 From malnutrition to nutrition security Martin W. Bloem, MD, PhD Senior Nutrition Advisor/WFP Global Coordinator UNAIDS World Food Program Nurturing development: Improving human nutrition with animal-source
Bangladesh Perspectives
 Post-2015 Development Agenda Bangladesh Perspectives Nutrition SPEAKERS DR. RUDABA KHONDKER OF THE GLOBAL ALLIANCE FOR IMPROVED NUTRITION (GAIN) GAIN is an international organization that was launched
Application of the WHO Growth Reference (2007) to Assess the Nutritional Status of Children in China
 to Assess the Nutritional Status of Children in China") BIOMEDICAL AND ENVIRONMENTAL SCIENCES 22, 130-135 (2009) www.besjournal.com Application of the WHO Growth Reference (2007) to Assess the Nutritional Status of Children in China YAN-PING LI, XIAO-QI HU,
BIOMEDICAL AND ENVIRONMENTAL SCIENCES 22, 130-135 (2009) www.besjournal.com Application of the WHO Growth Reference (2007) to Assess the Nutritional Status of Children in China YAN-PING LI, XIAO-QI HU,
Nutritional Assessment & Monitoring of Hospitalized Children
 Nutritional Assessment & Monitoring of Hospitalized Children Kehkashan Zehra, Clinical Dietitian Sindh Institute of Urology & Transplantation, Karachi In Pakistan 42% of children aged < 5 years are stunted
Motherhood and Female Labor Force Participation: Evidence from Infertility Shocks
 Motherhood and Female Labor Force Participation: Evidence from Infertility Shocks Jorge M. Agüero Univ. of California, Riverside jorge.aguero@ucr.edu Mindy S. Marks Univ. of California, Riverside mindy.marks@ucr.edu
Critical Issues in Child and Maternal Nutrition. Mainul Hoque
 Critical Issues in Child and Maternal Nutrition Mainul Hoque Nutrition and Economic Development Nutrition is a critical factor for improved health and successful economic development about one-third of
The Millennium Development Goals Report. asdf. Gender Chart UNITED NATIONS. Photo: Quoc Nguyen/ UNDP Picture This
 The Millennium Development Goals Report Gender Chart asdf UNITED NATIONS Photo: Quoc Nguyen/ UNDP Picture This Goal Eradicate extreme poverty and hunger Women in sub- are more likely than men to live in
Education, Literacy & Health Outcomes Findings
 2014/ED/EFA/MRT/PI/05 Background paper prepared for the Education for All Global Monitoring Report 2013/4 Teaching and learning: Achieving quality for all Education, Literacy & Health Outcomes Findings
Factors affecting child development in developing countries
 Factors affecting child development in developing countries S Grantham-McGregor Centre for Health and Development, Institute of Child Health, University College London Figure 1.1 The Lancet series: The
Russian food consumption patterns during economic transition and its effects on the prevalence of chronic diseases
 Russian food consumption patterns during economic transition and its effects on the prevalence of chronic diseases C. Burggraf; T. Glauben; R. Teuber IAMO Forum 2014 25/Jun/2014 Overview 1 Motivation 2
MALNUTRITION. At the end of the lecture students should be able to:
 MALNUTRITION 1 MALNUTRITION OBJECTIVES: At the end of the lecture students should be able to: Define and classify malnutrition Enumerate causes and effects of malnutrition Identify strategies for prevention
Maternal and Child Undernutrition 2 Maternal and child undernutrition: consequences for adult health and human capital
 Maternal and Child Undernutrition 2 Maternal and child undernutrition: consequences for adult health and human capital Cesar G Victora, Linda Adair, Caroline Fall, Pedro C Hallal, Reynaldo Martorell, Linda
Child undernutrition based on the new WHO growth standards and rates of reduction to 2015
 1 Child undernutrition based on the new WHO growth standards and rates of reduction to 2015 Dr Mercedes de Onis SCN Annual Session, Hanoi, Viet Nam 2008 2 Intergenerational cycle of growth failure Child
Maternal and Infant Nutrition Briefs
 Maternal and Infant Nutrition Briefs November/December 2002 A research-based newsletter prepared by the University of California for professionals interested in maternal and infant nutrition Recent Trends
Drivers of nutritional change in four South Asian countries: a dynamic observational analysis
 Original Article Drivers of nutritional change in four South Asian countries: a dynamic observational analysis DOI: 10.1111/mcn.12274 Derek Headey *,JohnHoddinott and Seollee Park * International Food
How Early Health Affects Children s Life Chances
 How Early Health Affects Children s Life Chances David Figlio* Director, Institute for Policy Research Northwestern University Sulzberger Lecture, Duke University, January 13, 2015 *Collaborative research
Early life predictors of motor, cognitive, and language development: a pooled multi-country analysis
 Early life predictors of motor, cognitive, and language development: a pooled multi-country analysis Ayesha Sania Christopher Sudfeld Dana McCoy Goodarz Danaei Günther Fink Majid Ezzati Wafaie Fawzi Background
Study Guide for the Final Exam
 Study Guide for the Final Exam When studying, remember that the computational portion of the exam will only involve new material (covered after the second midterm), that material from Exam 1 will make
The Paradox of Malnutrition in Developing Countries (Pp.40-48)
") An International Multi-Disciplinary Journal, Ethiopia Vol. 5 (2), Serial No. 19, April, 2011 ISSN 1994-9057 (Print) ISSN 2070-0083 (Online) The Paradox of Malnutrition in Developing Countries (Pp.40-48)
An International Multi-Disciplinary Journal, Ethiopia Vol. 5 (2), Serial No. 19, April, 2011 ISSN 1994-9057 (Print) ISSN 2070-0083 (Online) The Paradox of Malnutrition in Developing Countries (Pp.40-48)
DIET INTERVENTION FOR REDUCING MALNUTRITION AMONG PRESCHOOL CHILDREN
 Indo-Am. J. Agric. & Vet. Sci., 2014 Maharshi ISSN Deepa 2321 9602 and Suratani www.iajavs.com Sreedhar, 2014 Vol. 2, No. 3, September 2014 2014 Meghana Publications. All Rights Reserved Research Paper
HEALTH EXPENDITURES AND CHILD MORTALITY: EVIDENCE FROM KENYA
 HEALTH EXPENDITURES AND CHILD MORTALITY: EVIDENCE FROM KENYA David Muthaka, PhD Deputy Director, Policy and Planning Salaries and Remuneration Commission 4 th AfHEA INTERNATIONAL CONFERENCE, RABAT, MOROCCO
Citation for published version (APA): Ebbes, P. (2004). Latent instrumental variables: a new approach to solve for endogeneity s.n.
: Ebbes, P. (2004). Latent instrumental variables: a new approach to solve for endogeneity s.n.") University of Groningen Latent instrumental variables Ebbes, P. IMPORTANT NOTE: You are advised to consult the publisher's version (publisher's PDF) if you wish to cite from it. Please check the document
University of Groningen Latent instrumental variables Ebbes, P. IMPORTANT NOTE: You are advised to consult the publisher's version (publisher's PDF) if you wish to cite from it. Please check the document
Econometric Game 2012: infants birthweight?
 Econometric Game 2012: How does maternal smoking during pregnancy affect infants birthweight? Case A April 18, 2012 1 Introduction Low birthweight is associated with adverse health related and economic
Following in Your Father s Footsteps: A Note on the Intergenerational Transmission of Income between Twin Fathers and their Sons
 D I S C U S S I O N P A P E R S E R I E S IZA DP No. 5990 Following in Your Father s Footsteps: A Note on the Intergenerational Transmission of Income between Twin Fathers and their Sons Vikesh Amin Petter
Inequalities in childhood immunization coverage in Ethiopia: Evidence from DHS 2011
 Inequalities in childhood immunization coverage in Ethiopia: Evidence from DHS 2011 Bezuhan Aemro, Yibeltal Tebekaw Abstract The main objective of the research is to examine inequalities in child immunization
The costs of stunting in South Asia and the benefits of public investments in nutrition
 Original Article DOI: 10.1111/mcn.12281 The costs of stunting in South Asia and the benefits of public investments in nutrition Meera Shekar, Julia Dayton Eberwein and Jakub Kakietek Health, Nutrition
FANTA III TECHNICAL BRIEF. Food and Nutrition Technical Assistance III Project. Introduction. June 2018
 TECHNICAL BRIEF Food and Nutrition Technical Assistance III Project June 2018 Estimating the Impact of Two Common Risk Factors for Stunting Inadequate Dietary Diversity and Teenage Pregnancy: Models in
The global evidence-base for what different sectors can do to contribute to undernutrition
 The global evidence-base for what different sectors can do to contribute to undernutrition Marie Ruel Director, Poverty, Health and Nutrition, International Food Policy Research Institute (IFPRI) October
Update on the nutrition situation in the Asia Pacific region
 Update on the nutrition situation in the Asia Pacific region Mike Toole 13 th National Rural Health Conference, Darwin, 24-27 May 2015 Source: DFAT, Port Moresby, Papua New Guinea Conceptual framework
Institutional information. Concepts and definitions
 Goal 2: End hunger, achieve food security and improved nutrition, and promote sustainable agriculture Target 2.2: by 2030 end all forms of malnutrition, including achieving by 2025 the internationally
The Impacts of Hurricane Mitch on Child Health: Evidence from Nicaragua. Makiko Omitsu* and Takashi Yamano**
 The Impacts of Hurricane Mch on Child Health: Evidence from Nicaragua Makiko Omsu* and Takashi Yamano** * FASID/GRIPS Joint Program on International Development Study ** Foundation for Advanced Studies
Prospective study on nutrition transition in China
 Prospective study on nutrition transition in China Fengying Zhai, Huijun Wang, Shufa Du, Yuna He, Zhihong Wang, Keyou Ge, and Barry M Popkin The aim of the prospective study reported here was to examine
INFANT FEEDING AND CHILDREN S AND WOMEN S NUTRITIONAL STATUS
 INFANT FEEDING AND CHILDREN S AND WOMEN S NUTRITIONAL STATUS 10 The 2001 Nepal Demographic and Health Survey (NDHS) included questions about the nutritional status and their mothers, including infant feeding
Projecting the Economic Consequences of Malnutrition in Lao PDR
 1 Projecting the Economic Consequences of Malnutrition in Lao PDR Dr. Saykham Voladet (National Economic Research Institute (NERI), Ministry of Planning and Investment, Lao PDR) Child Poverty and Social
Nourishing the World. Fixing Food Systems. Lawrence Haddad. Executive Director Global Alliance for Improved Nutrition (GAIN)
") Nourishing the World by Fixing Food Systems Lawrence Haddad Executive Director Global Alliance for Improved Nutrition (GAIN) 1 in 3 people worldwide are malnourished Overweight or Obese Deficient in in
Nourishing the World by Fixing Food Systems Lawrence Haddad Executive Director Global Alliance for Improved Nutrition (GAIN) 1 in 3 people worldwide are malnourished Overweight or Obese Deficient in in
Ma. Erlinda Tarrayo, Imelda Agdeppa, Ph.D., Carmina DD. Cuarteros
 The Interplay of Immunization, Low Birth Weight, Feeding Practices and Food Intake On The Nutritional Status and Anemia Prevalence Among Young Children 6-23 Months old Ma. Erlinda Tarrayo, Imelda Agdeppa,
Causes of health inequalities in Uganda: Evidence from the demographic and health surveys
 RESEARCH SERIES No. 96 Causes of health inequalities in Uganda: Evidence from the demographic and health surveys SSEWANYANA SARAH KASIRYE IBRAHIM OCTOBER, 2012 RESEARCH SERIES No. 96 Causes of health inequalities
Records identified through database searching (n = 548): CINAHL (135), PubMed (39), Medline (190), ProQuest Nursing (39), PsyInFo (145)
: CINAHL (135), PubMed (39), Medline (190), ProQuest Nursing (39), PsyInFo (145)") Included Eligibility Screening Identification Figure S1: PRISMA 2009 flow diagram* Records identified through database searching (n = 548): CINAHL (135), PubMed (39), Medline (190), ProQuest Nursing (39),
Included Eligibility Screening Identification Figure S1: PRISMA 2009 flow diagram* Records identified through database searching (n = 548): CINAHL (135), PubMed (39), Medline (190), ProQuest Nursing (39),
Nutrition Knowledge Versus Schooling in the Demand for Child Micronutrient Status. Steven Block. CID Working Paper No.
 Nutrition Knowledge Versus Schooling in the Demand for Child Micronutrient Status Steven Block CID Working Paper No. 93 August 2002 Copyright 2002 Steven Block and the President and Fellows of Harvard
Making Social Protection More Nutrition Sensitive: A Global Overview Harold Alderman Oct. 16, 2015
 Making Social Protection More Nutrition Sensitive: A Global Overview Harold Alderman Oct. 16, 2015 Why Focus on Nutrition Sensitive Programs? The 2013 Lancet Nutrition Series estimated that scaling up
Solomon Islands Food and Nutrition Security Profiles
 Key Indicators Solomon Islands Food and Nutrition Security Profiles Solomon Islands has experienced stagnation in percapita GDP and undernourishment in recent years. Dietary Energy Supply (DES) has continued
Karnataka Comprehensive Nutrition Mission
 Karnataka Comprehensive Nutrition Mission Karnataka Multi-Sectoral Nutrition Pilot Project Project Background The Karnataka Comprehensive Nutrition Mission (KCNM), through the Karnataka State Rural Livelihoods
At the change of government, South Africa faced important health challenges. The country was bearing
 Health Challenges Past and Future Cally Ardington and Anne Case Chapter 41 in The Oxford Companion to the Economics of South Africa, Haroon Bhorat, Alan Hirsch, Ravi Kanbur and Mthuli Ncube (eds.), Oxford
Reading and maths skills at age 10 and earnings in later life: a brief analysis using the British Cohort Study
 Reading and maths skills at age 10 and earnings in later life: a brief analysis using the British Cohort Study CAYT Impact Study: REP03 Claire Crawford Jonathan Cribb The Centre for Analysis of Youth Transitions
Laos - Food and Nutrition Security Profiles
 Key Indicators Laos - Food and Nutrition Security Profiles In Lao PDR, GDP per capita has increased consistently during recent years, as has Dietary Energy Supply (DES) per person. Nevertheless, undernutrition
Invest in Nutrition Now A Smart Start for Our Children, Our Future
 Invest in Nutrition Now A Smart Start for Our Children, Our Future For more information, contact: Dr Kavita Sethuraman, USAID FANTA Project, FHI 360 at ksethuraman@fhi360.org A Fact Sheet on Agriculture
first three years of life
 Journal of Epidemiology and Community Health, 1981, 35, 18-184 Parental smoking and lower respiratory illness in the first three years of life D. M. FERGUSSON, L. J. HORWOOD, F. T. SHANNON, AND BRENT TAYLOR
2018 Global Nutrition
 Professor Corinna Hawkes Director, Centre for Food Policy, City, University of London Co-Chair, Independent Expert Group of the Global Nutrition Report 2018 Global Nutrition Report November 2018 About
Cost of the Diet: a Method and New Software
 Cost of the Diet: a Method and New Software Outline of the presentation To understand what the Cost of the Diet method is, what it does, and why it was developed To learn what information is needed to
SESSION 3B: IMPROVING NUTRITION THROUGH SOCIAL PROTECTION PROGRAMS
 SESSION 3B: IMPROVING NUTRITION THROUGH SOCIAL PROTECTION PROGRAMS Harold Alderman Senior Research Fellow Poverty, Health, and Nutrition IFPRI Keynote Presentation Moscow, September 10 Why Focus on Nutrition
Childhood Undernutrition: a biological perspective
 Childhood Undernutrition: a biological perspective Vinod Paul MD, PhD, FIAP, FNNF, FAMS ALL INDIA INSTITUTE OF MEDICAL SCIENCES, NEW DELHI WHO Collaborating Centre for Training an Research in Newborn Care
Private Health Investments under Competing Risks: Evidence from Malaria Control in Senegal
 Private Health Investments under Competing Risks: Evidence from Malaria Control in Senegal Pauline ROSSI (UvA) and Paola VILLAR (PSE) UNU-WIDER Seminar October 18, 2017 Motivation Malaria has long been
Appendix III Individual-level analysis
 Appendix III Individual-level analysis Our user-friendly experimental interface makes it possible to present each subject with many choices in the course of a single experiment, yielding a rich individual-level
Lao PDR. Maternal and Child Health and Nutrition status in Lao PDR. Outline
 Maternal and Child Health and Nutrition status in Lao PDR Outline Brief overview of maternal and child health and Nutrition Key interventions Challenges Priorities Dr. Kopkeo Souphanthong Deputy Director
The Effects of Soybean Protein Changes on Major Agricultural Markets
 The Effects of Soybean Protein Changes on Major Agricultural Markets Prem V. Premakumar Working Paper 96-WP 16 June 1996 Center for Agricultural and Rural Development Iowa State University Ames, Iowa 511-17
Mama SASHA Baseline survey: Dietary Diversity Indices (DDI) Preliminary results. By Christine Kiria
 Preliminary results. By Christine Kiria") Mama SASHA Baseline survey: Preliminary results Dietary Diversity Indices (DDI) By Christine Kiria 4 th SSP meeting for East and Central Africa Esella Country Hotel, Kampala, Uganda 16 th November 2011
Mama SASHA Baseline survey: Preliminary results Dietary Diversity Indices (DDI) By Christine Kiria 4 th SSP meeting for East and Central Africa Esella Country Hotel, Kampala, Uganda 16 th November 2011
THEORY OF POPULATION CHANGE: R. A. EASTERLIN AND THE AMERICAN FERTILITY SWING
 Lecture on R. A. Easterlin American Fertility Swing THEORY OF POPULATION CHANGE: R. A. EASTERLIN AND THE AMERICAN FERTILITY SWING 1 Comparison and Contrast of Malthus and Easterlin: Malthus' approach is
The countries included in this analysis are presented in Table 1 below along with the years in which the surveys were conducted.
 Extended Abstract Trends and Inequalities in Access to Reproductive Health Services in Developing Countries: Which services are reaching the poor? Emmanuela Gakidou, Cecilia Vidal, Margaret Hogan, Angelica
14.74 Foundations of Development Policy Spring 2009
 MIT OpenCourseWare http://ocw.mit.edu 14.74 Foundations of Development Policy Spring 2009 For information about citing these materials or our Terms of Use, visit: http://ocw.mit.edu/terms. 14.74 Lecture
Does the Poor s Consumption of Calories Respond to Changes in Income? Evidence from Pakistan
 The Pakistan Development Review 35 : 3 (Autumn 1996) pp. 257 283 Does the Poor s Consumption of Calories Respond to Changes in Income? Evidence from Pakistan FRANQUE GRIMARD This paper examines the relationship
Methodology of Poverty Measurement Since 2009
 MEASURING POVERTY IN ARMENIA: METHODOLOGICAL CLARIFICATIONS 169 Methodology of Poverty Measurement Since 2009 A consumption aggregate is used to approximate well-being in Armenia. It is assumed that consumption
Countdown to 2015: tracking progress, fostering accountability
 Countdown to 2015: tracking progress, fostering accountability Countdown to 2015 is a global movement to track, stimulate and support country progress towards achieving the health-related Millennium Development
Institutional information. Concepts and definitions
 Goal 2: End hunger, achieve food security and improved nutrition, and promote sustainable agriculture Target 2.2: by 2030 end all forms of malnutrition, including achieving by 2025 the internationally
MODELLING THE SPREAD OF PNEUMONIA IN THE PHILIPPINES USING SUSCEPTIBLE-INFECTED-RECOVERED (SIR) MODEL WITH DEMOGRAPHIC CHANGES
 MODEL WITH DEMOGRAPHIC CHANGES") MODELLING THE SPREAD OF PNEUMONIA IN THE PHILIPPINES USING SUSCEPTIBLE-INFECTED-RECOVERED (SIR) MODEL WITH DEMOGRAPHIC CHANGES Bill William M. Soliman 1, Aldous Cesar F. Bueno 2 1, 2 Philippine Science
MODELLING THE SPREAD OF PNEUMONIA IN THE PHILIPPINES USING SUSCEPTIBLE-INFECTED-RECOVERED (SIR) MODEL WITH DEMOGRAPHIC CHANGES Bill William M. Soliman 1, Aldous Cesar F. Bueno 2 1, 2 Philippine Science
Nutrition News for Africa 05/2017
 Predictors and pathways of language and motor development in four prospective cohorts of young children in Ghana, Malawi, and Burkina Faso. Prado EL, Abbeddou S, Adu-Afarwuah S, et al. Journal of Child
Empowered lives. Resilient Nations. MILLENNIUM DEVELOPMENT GOALS (MDGs)
") Empowered lives. Resilient Nations. MILLENNIUM DEVELOPMENT GOALS (MDGs) PROVINCIAL PROFILE / LUAPULA PROVINCE / 2013 Copyright 2013 By the United Nations Development Programme Alick Nkhata Road P. O Box
Empowered lives. Resilient Nations. MILLENNIUM DEVELOPMENT GOALS (MDGs) PROVINCIAL PROFILE / LUAPULA PROVINCE / 2013 Copyright 2013 By the United Nations Development Programme Alick Nkhata Road P. O Box
Existing approaches to costing, financing and estimating cost-efficiencies for nutrition
 Existing approaches to costing, financing and estimating cost-efficiencies for nutrition February 2016 Meera Shekar Global Lead for Nutrition 1 Global Stunting Rates 159 million children stunted worldwide