ACC ELOVL MCAD. CPT1α 1.5 *** 0.5. Reverbα *** *** 0.5. Fasted. Refed
|
|
|
- Steven Day
- 5 years ago
- Views:
Transcription
1 Supplementary Figure A 8 SREBPc 6 5 FASN ELOVL ACC.5.5 CLOCK.5.5 CRY.5.5 PPARα.5.5 ACSL CPTα MCAD.5.5 PEPCK.5.5 G6Pase BMAL.5.5 Reverbα.5.5 Reverbβ.5.5 PER.5.5 PER B Fasted Refed psrebp nsrebp Supplementary Figure. is increased by feeding (A and B) C57BL/6 mice were fasted for hours and then refed for hours. Both fasted and refed mice were sacrificed at ZT.In the liver, levels of the mrna (A) and protein (B) were determined using qrt-pcr with normalization to TBP mrna levels and western blotting, respectively. Data are represented as mean ±SD, N= for each group. P<.5, P<. (Student s t-test).
2 Supplementary Figure A ZT ZT Fasted Refed Fasted Refed psrebp nsrebp B 5 SREBPc PEPCK.5.5 G6Pase FOXO Fasted Refed CRY.5.5 BMAL.5.5 CLOCK 5 5 Reverbα 8 6 Reverbβ 8 6 PER 6 PER Supplementary Figure. is increased by feeding regardless of time periods (A and B) C57BL/6 mice were fasted for hours and then refed for hours. Both fasted and refed mice were sacrificed at ZT and ZT. In the liver, the levels of protein (A) and mrna (B) were determined using western blotting and qrt-pcr with normalization to TBP mrna levels, respectively. Data are represented as mean ±SD, N= for each group. P<.5, P<., P<. (Student s t-test).
 SRE motifs and E-BOX sequences in the promoter from various species.")
3 Supplementary Figure A MONKEY COW SHEEP HUMAN RAT MOUSE -75 E-BOX MONKEY COW SHEEP HUMAN RAT MOUSE -5 SRE SRE +5 MONKEY COW SHEEP HUMAN RAT MOUSE SRE +85 B Relative luciferase unit (RLU) 8 6 N.S. MOCK SREBPc Supplementary Figure. promoter analysis usingluciferase assay (A) SRE motifs and E-BOX sequences in the promoter from various species. (B) HEK9T cells were co-transfected with a reporter plasmid containing the WT or E-BOX mutant mouse promoter along with expression plasmids encoding either MOCK or SREBPc. The values represent the mean ± SD (N= for each group). P<.5, P<. (Student s t-test).
4 Supplementary Figure A 8 6 Ad-MOCK Ad-SREBPc B Ad-MOCK Ad-SREBPc Supplementary Figure. Gene expression profiles (A) Mouse primary hepatocytes were adenovirally infected with Ad-MOCK or Ad-SREBPc in Figure A and B. The levels of the SREBPc mrna were determined using qrt-pcr with normalization to TBP mrna levels. Data are represented as mean ±SD, N= for each group. P<.5, P<., P<. (Student s t-test). (B) C57BL/6 mice were infected with adenoviruses encoding either MOCK or SREBPc (adenoviral dose of 5 9 viral particles per mouse) through the tail vein in Figure B. Mice were sacrificed 5 days following the injection of adenoviruses and relative mrna levels were determined by qrt-pcr and normalized to the TBP mrna levels. Data are represented as mean ±SD, N=- for each group. P<.5, P<., P<. (Student s t-test).
5 Supplementary Figure 5 A levels. Relative mrna sicon si B 9 6 Ad-MOCK Ad- C G6Pase N.S SREBPc Ad-MOCK Ad-SREBPc Supplementary Figure 5. Gene expression profiles (A) HIIE cells were transfected with sicon or si as shown in Figure G. Relative mrna levels were determined by qrt-pcr and normalized to cyclophilin mrna levels. Data are represented as mean ±SD, N= for each group. P<. (Student s t-test). (B) Mouse primary hepatocytes were infected with Ad-MOCK or Ad- in Figure H. Relative mrna levels were determined by qrt-pcr and normalized to TBP mrna levels. Data are represented as mean ±SD, N= for each group. P<. (Student s t-test). (C) Mouse primary hepatocytes isolated from +/+ and -/- mice were infected with Ad-MOCK or Ad-SREBPc in Figure K. Relative mrna levels were determined by qrt-pcr and normalized to TBP mrna levels. Data are represented as mean ±SD, N= for each group. P<. (Student s t-test).
6 Supplementary Figure 6 A B SREBPc +/+ Ad-MOCK Ad-Mock Ad-Mock Ad- SREBPc SREBPc SREBPc -/- SREBP +/+ SREBPc -/- -/- Ad-MOCK Ad- SREBPc +/+, Ad-MOCK SREBPc -/-, Ad-MOCK SREBPc -/-, Ad- psrebp FOXO Supplementary Figure 6. overexpression reduces PEPCK mrna and FOXO protein levels in SREBPc -/- mice (A and B) SREBPc +/+ mice injected with Ad-MOCK and in SREBPc -/- mice injected with either Ad- MOCK or Ad- in Figure L and M. In the liver, levels of the mrna (A) and protein (B) were determined using qrt-pcr with normalization to TBP mrna levels and western blotting, respectively. Data are represented as mean ±SD, N=7~ for each group. P<.5, P<. (Student s t-test).
7 Supplementary Figure SREBPc +/+ SREBPc -/- Supplementary Figure 7. Gluconeogenic gene expression is elevated in SREBPc -/- mice In the liver, the levels of the G6Pase and PEPCK mrna were determined using qrt-pcr with normalization to TBP mrna levels. Data are represented as mean ±SD, N=~ for each group. P<.5 (Student s t-test).


8 Supplementary Figure 8 DAPI GFP FLAG-MDM Merged GFP- WT GFP- NLS Supplementary Figure 8. MDM subcellular localization in WT and cytosolic overexpressing cells FLAG-MDM was co-transfected with GFP-WT or GFP-cytosolic ( NLS ) in HEK9T cells. Immunocytochemical analysis of FLAG-MDM and GFP was carried out. DAPI,,6-diamidino--phenylindole. Scale bars= µm.
9 Supplementary Figure 9 A SREBPc G6Pase PEPCK FOXO B NCD HFD nsrebp FOXO Supplementary Figure 9. Expression profiles of various genes in the liver of NCD and HFD fed mice (A and B) Eight-week-old C57BL/6 mice were fed a NCD or HFD for 8 weeks and sacrificed at ZT. Hepatic gene expression levels (A) were determined by qrt-pcr and normalized by the level of the TBP mrna. N=5 in each group. Hepatic protein levels (B) were analyzed by western blotting.
10 Supplementary Figure A db/+ db/db ZT: FOXO nsrebp B SREBPc G6Pase PEPCK CRY db/ Time(ZT) Time(ZT) Time(ZT) Time(ZT) Time(ZT) db/db 8 6 Reverbβ Reverbα.5.5 CLOCK Time(ZT) Time(ZT) Time(ZT) Time(ZT) Time(ZT) Time(ZT) BMAL PER 8 6 PER Supplementary Figure. Diurnal gene expression profiles of db/+ and db/db mice liver (A and B) Ten-week-old male db/+ and db/db mice were sacrificed at ZT, 6,, and 8. Protein levels (A) were determined with western blotting. The relative mrna levels of various hepatic genes (B) were determined by qrt-pcr analyses and normalized to the TBP mrna level. Data are represented as mean ±SD, N= for each group.
11 Supplementary Figure A G6Pase Control Forskolin Control db-camp PEPCK B G6Pase PEPCK C Control G6Pase Dexamethasone PEPCK Supplementary Figure. Gluconeogenic gene expression is partially attenuated by overexpression upon incubation with forskolin, db-camp, and dexamethasone (A, B and C) Mouse primary hepatocytes were adenovirally infected with Ad-MOCK or Ad-. The cells were treated with µm forskolin (A), 5 µm db-camp (B), and µm dexamethasone (C) or vehicle (Control) for hours. PEPCK and G6Pase mrna levels were determined using qrt-pcr and normalized to the level of the TBP mrna. The values represent the mean ± SD (N= for each group). P<.5, P<., P<. (Student s t-test).
12 Supplementary Figure SREBPc +/+ SREBPc -/- SREBPc BMAL CRY Time (CT) Time (CT) Time (CT) Time (CT) Reverbβ RORα CLOCK PER Time (CT) Time (CT) Time (CT) Time (CT) SCD FASN G6Pase PEPCK Time (CT) Time (CT) Time (CT) Time (CT) Supplementary Figure. Expression profiles of various genes in the liver of SREBPc +/+ and SREBPc -/- mice Livers were isolated every 6 hours from SREBPc +/+ and SREBPc -/- mice fed with normal chow diet and kept under hours: dark, hours: dark cycle for week. were determined by qrt-pcr and normalized by the level of the TBP mrna. N=- at each time point.


13 Figure E G6Pase - - SREBPc (FLAG) Figure B - - nsrebp FOXO Figure A - FOXO - Figure D - FOXO Figure E - nsrebp psrebp - - FOXO Figure G Figure B - nsrebp - psrebp Supplementary Figure


14 - pakt - AKT - pfoxo FOXO - Figure 5A - - pakt - AKT FOXO - pfoxo - Figure 5C - - pakt - AKT pfoxo FOXO - Figure 5F

")


")
 IP")
")

15 FOXO (Short exposure) (Long exposure) Figure 5I FOXO - - Figure 6A Figure 6B Figure 6C - (GFP) - - FOXO (GFP) FOXO IP Input - - Ub- FOXO (HA) - - FOXO


")


16 Figure 6D FOXO FOXO - GAPDH - POL II Nucleus Cytosol Figure 6E - UbnFOXO (HA) - nfoxo - FOXO MDM - Figure 7A IP (GFP) MDM (FLAG) nfoxo - nfoxo MDM (FLAG) (GFP) Input Figure 7B


17 UbnFOXO (HA) nfoxo nfoxo MDM (FLAG) Figure 7C IP Input IP Input UbnFOXO (HA) nfoxo nfoxo MDM (FLAG) Figure 7C


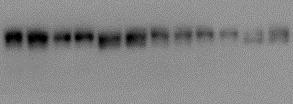
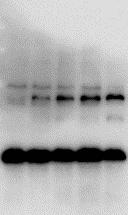
18 Figure 8H - - nsrebp FOXO MDM FOXO - Figure 8K nsrebp FOXO - - Figure 8B Figure 8F FOXO - psrebp nsrebp - - Supplementary figure B


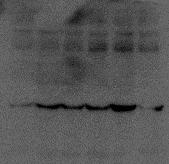
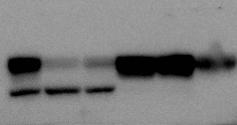
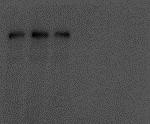
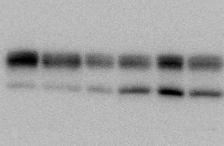
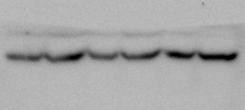
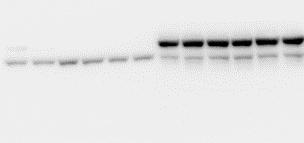
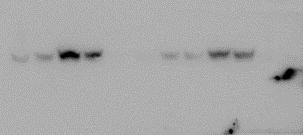
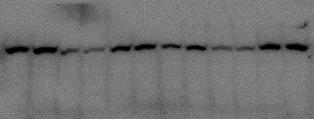
19 Supplementary figure A Supplementary figure 6B - psrebp - psrebp nsrebp - FOXO - - Supplementary figure 9B Supplementary figure 9B nsrebp FOXO FOXO nsrebp - - Supplementary Figure. The original full immunoblot presented in main figures and supplementary figures
20 Supplementary Table. Sequence of primers for q-rt-pcr Primer Sequences mrsrebpc mr mrpepck mrg6pase hmrfoxo hmfasn mbmal mclock mper hmrcry mscd melovl6 mtbp mper mreverbα mreverbβ Sense 5 -GGAGCCATGGATTGCACATT Antisense 5 -CAGGAAGGCTTCCAGAGAGG Sense 5 -CGTTTGGAAAGGCATTTGG Antisense 5 -CTTCCATTTTGTCAAAGCGTG Sense 5 -AGCCTTTGGTCAACAACTGG Antisense 5 -TGCCTTCGGGGTTAGTTATG Sense 5 -ACACCGACTACTACAGCAACAG Antisense 5 -CCTCGAAAGATAGCAAGAGTAG Sense 5 -CCAAGGCCATCGAGAGC Antisense 5 -GATTGAGCATCCACCAAGAACT Sense 5 -GCTGCGGAAACTTCAGGAAAT Antisense 5 -AGAGACGTGTCACTCCTGGACTT Sense 5 -AACCTTCCCGCAGCTAACAG Antisense 5 -AGTCCTCTTTGGGCCACCTT Sense 5 -TTGCGTCTGTGGGTGTTG Antisense 5 -TGCTTTGTCCTTGTCATCTTCT Sense 5 -TGTGCGATGATGATTCGTGA Antisense 5 -GGTGAAGGTACGTTTGGTTTGC Sense 5 -GGAGCTGCCCAAGAAGC Antisense 5 -AGTAGAAGAGGCGGCAGGA Sense 5 -CCGGAGACCCCTTAGATCGA Antisense 5 -TAGCCTGTAAAGATTTCTGCAAACC Sense 5 -TGCCATGTTCATCACCTTGT Antisense 5 -TACTCAGCCTTCGTGGCTTT Sense 5 -GGGAGAATCATGGACCAGAA Antisense 5 -CCGTAAGGCATCATTGGACT Sense 5 -GGGAGCTCAAACTTCGACTG Antisense 5 -TCGGATGTGATATGCTCCAA Sense 5 -CTGGAGGGCTGCAGTATAGC Antisense 5 -TATTGGAGTCCAGGGTCGTC Sense 5 -TCCTCTAGCTCTGCCTCCAG Antisense 5 -TGGTTTTGCCTGTTTTCACA (m: mouse, h: human, r: rat)
21 Supplementary Table. sirna Sequences Primer Rat FOXO Mouse Mouse MDM Negative Control Sequences 5 -GAAUGAAGGAACUGGGAAA 5 -CCUCGCAACUGAAGUUGGU 5 -CAGAGAAUGAUGGUAAAGA 5 -CCUACGCCACCAAUUUCGU
Jang, H; Lee, GY; Selby, CP; Lee, G; Jeon, YG; Lee, JH; Cheng, KY; Titchenell, P; Birnbaum, MJ; Xu, A; Sancar, A; Kim, JB
 Title SREBPc- signalling represses hepatic glucose production by promoting FOXO degradation during refeeding Author(s) Jang, H; Lee, GY; Selby, CP; Lee, G; Jeon, YG; Lee, JH; Cheng, KY; Titchenell, P;
Supplementary Table 1. Metabolic parameters in GFP and OGT-treated mice
 Supplementary Table 1. Metabolic parameters in GFP and OGT-treated mice Fasted Refed GFP OGT GFP OGT Liver G6P (mmol/g) 0.03±0.01 0.04±0.02 0.60±0.04 0.42±0.10 A TGs (mg/g of liver) 20.08±5.17 16.29±0.8
Supplementary Figure 1. PAQR3 knockdown inhibits SREBP-2 processing in CHO-7 cells CHO-7 cells were transfected with control sirna or a sirna
 Supplementary Figure 1. PAQR3 knockdown inhibits SREBP-2 processing in CHO-7 cells CHO-7 cells were transfected with control sirna or a sirna targeted for hamster PAQR3. At 24 h after the transfection,
Over-expression of MKP-3 and knockdown of MKP-3 and FOXO1 in primary rat. day, cells were transduced with adenoviruses expressing GFP, MKP-3 or shgfp,
 SUPPLEMENTAL METHODS Over-expression of MKP-3 and knockdown of MKP-3 and FOXO1 in primary rat hepatocytes Primary rat hepatocytes were seeded as described in experimental procedures. The next day, cells
18s AAACGGCTACCACATCCAAG CCTCCAATGGATCCTCGTTA. 36b4 GTTCTTGCCCATCAGCACC AGATGCAGCAGATCCGCAT. Acc1 AGCAGATCCGCAGCTTG ACCTCTGCTCGCTGAGTGC
 Supplementary Table 1. Quantitative PCR primer sequences Gene symbol Sequences (5 to 3 ) Forward Reverse 18s AAACGGCTACCACATCCAAG CCTCCAATGGATCCTCGTTA 36b4 GTTCTTGCCCATCAGCACC AGATGCAGCAGATCCGCAT Acc1
AAV-TBGp-Cre treatment resulted in hepatocyte-specific GH receptor gene recombination
 AAV-TBGp-Cre treatment resulted in hepatocyte-specific GH receptor gene recombination Supplementary Figure 1. Generation of the adult-onset, liver-specific GH receptor knock-down (alivghrkd, Kd) mouse
SUPPLEMENTARY INFORMATION
 DOI: 10.1038/ncb3461 In the format provided by the authors and unedited. Supplementary Figure 1 (associated to Figure 1). Cpeb4 gene-targeted mice develop liver steatosis. a, Immunoblot displaying CPEB4
RAW264.7 cells stably expressing control shrna (Con) or GSK3b-specific shrna (sh-
 or GSK3b-specific shrna (sh-") 1 a b Supplementary Figure 1. Effects of GSK3b knockdown on poly I:C-induced cytokine production. RAW264.7 cells stably expressing control shrna (Con) or GSK3b-specific shrna (sh- GSK3b) were stimulated
1 a b Supplementary Figure 1. Effects of GSK3b knockdown on poly I:C-induced cytokine production. RAW264.7 cells stably expressing control shrna (Con) or GSK3b-specific shrna (sh- GSK3b) were stimulated
Supplementary Figure 1.TRIM33 binds β-catenin in the nucleus. a & b, Co-IP of endogenous TRIM33 with β-catenin in HT-29 cells (a) and HEK 293T cells
 and HEK 293T cells") Supplementary Figure 1.TRIM33 binds β-catenin in the nucleus. a & b, Co-IP of endogenous TRIM33 with β-catenin in HT-29 cells (a) and HEK 293T cells (b). TRIM33 was immunoprecipitated, and the amount of
Supplementary Figure 1.TRIM33 binds β-catenin in the nucleus. a & b, Co-IP of endogenous TRIM33 with β-catenin in HT-29 cells (a) and HEK 293T cells (b). TRIM33 was immunoprecipitated, and the amount of
SUPPLEMENTARY INFORMATION
 doi:10.1038/nature12652 Supplementary Figure 1. PRDM16 interacts with endogenous EHMT1 in brown adipocytes. Immunoprecipitation of PRDM16 complex by flag antibody (M2) followed by Western blot analysis
Supplementary Figure 1.
 Supplementary Figure 1. FGF21 does not exert direct effects on hepatic glucose production. The liver explants from C57BL/6J mice (A, B) or primary rat hepatocytes (C, D) were incubated with rmfgf21 (2
Effect of BI-1 on insulin resistance through regulation of CYP2E1
 Effect of BI-1 on insulin resistance through regulation of CYP2E1 Geum-Hwa Lee 1, Kyoung-Jin Oh 2, 3, Hyung-Ryong Kim 4, Hye-Sook Han 2, Hwa-Young Lee 1, Keun-Gyu Park 5, Ki-Hoan Nam 6, Seung-Hoi Koo 2
Figure S1. Reduction in glomerular mir-146a levels correlate with progression to higher albuminuria in diabetic patients.
 Supplementary Materials Supplementary Figures Figure S1. Reduction in glomerular mir-146a levels correlate with progression to higher albuminuria in diabetic patients. Figure S2. Expression level of podocyte
Supplementary Figure 1. Repression of hepcidin expression in the liver of mice treated with
 Supplementary Figure 1. Repression of hepcidin expression in the liver of mice treated with DMN Immunohistochemistry for hepcidin and H&E staining (left). qrt-pcr assays for hepcidin in the liver (right).
Supplementary Figure 1. SC35M polymerase activity in the presence of Bat or SC35M NP encoded from the phw2000 rescue plasmid.
 1 2 3 4 5 6 7 8 9 10 11 12 13 14 15 16 17 18 19 20 21 22 23 24 25 26 27 Supplementary Figure 1. SC35M polymerase activity in the presence of Bat or SC35M NP encoded from the phw2000 rescue plasmid. HEK293T
Supplementary Figure 1. Prevalence of U539C and G540A nucleotide and E172K amino acid substitutions among H9N2 viruses. Full-length H9N2 NS
 Supplementary Figure 1. Prevalence of U539C and G540A nucleotide and E172K amino acid substitutions among H9N2 viruses. Full-length H9N2 NS nucleotide sequences (a, b) or amino acid sequences (c) from
Supplementary Table 2. Plasma lipid profiles in wild type and mutant female mice submitted to a HFD for 12 weeks wt ERα -/- AF-1 0 AF-2 0
 Supplementary Table 1. List of specific primers used for gene expression analysis. Genes Primer forward Primer reverse Hprt GCAGTACAGCCCCAAAATGG AACAAAGTCTGGCCTGTATCCA Srebp-1c GGAAGCTGTCGGGGTAGCGTC CATGTCTTCAAATGTGCAATCCAT
Supplemental Table 1. List of primers used for real time PCR.
 Supplemental Table 1. List of primers used for real time PCR. Primer Sequence Primer Sequence Mouse Pcsk9-F TTGCAGCAGCTGGGAACTT Mouse Scd1-F CATCATTCTCATGGTCCTGCT Mouse Pcsk9-R CCGACTGTGATGACCTCTGGA Mouse
Supplementary Figures
 Supplementary Figures Supplementary Figure 1 Characterization of stable expression of GlucB and sshbira in the CT26 cell line (a) Live cell imaging of stable CT26 cells expressing green fluorescent protein
Supplementary Information
 Supplementary Information mediates STAT3 activation at retromer-positive structures to promote colitis and colitis-associated carcinogenesis Zhang et al. a b d e g h Rel. Luc. Act. Rel. mrna Rel. mrna
Supplemental Table 1 Primer sequences (mouse) used for real-time qrt-pcr studies
 used for real-time qrt-pcr studies") Supplemental Table 1 Primer sequences (mouse) used for real-time qrt-pcr studies Gene symbol Forward primer Reverse primer ACC1 5'-TGAGGAGGACCGCATTTATC 5'-GCATGGAATGGCAGTAAGGT ACLY 5'-GACACCATCTGTGATCTTG
Supplemental Table 1 Primer sequences (mouse) used for real-time qrt-pcr studies Gene symbol Forward primer Reverse primer ACC1 5'-TGAGGAGGACCGCATTTATC 5'-GCATGGAATGGCAGTAAGGT ACLY 5'-GACACCATCTGTGATCTTG
Supplemental Information. Menin Deficiency Leads to Depressive-like. Behaviors in Mice by Modulating. Astrocyte-Mediated Neuroinflammation
 Neuron, Volume 100 Supplemental Information Menin Deficiency Leads to Depressive-like Behaviors in Mice by Modulating Astrocyte-Mediated Neuroinflammation Lige Leng, Kai Zhuang, Zeyue Liu, Changquan Huang,
Supplementary Figure 1 Validation of Per2 deletion in neuronal cells in N Per2 -/- mice. (a) Western blot from liver extracts of mice held under ad
 Western blot from liver extracts of mice held under ad") Supplementary Figure 1 Validation of Per2 deletion in neuronal cells in N Per2 -/- mice. (a) Western blot from liver extracts of mice held under ad libitum conditions detecting PER2 protein in brain and
Supplementary Figure 1 Validation of Per2 deletion in neuronal cells in N Per2 -/- mice. (a) Western blot from liver extracts of mice held under ad libitum conditions detecting PER2 protein in brain and
Nature Structural and Molecular Biology: doi: /nsmb Supplementary Figure 1
 Supplementary Figure 1 Mutational analysis of the SA2-Scc1 interaction in vitro and in human cells. (a) Autoradiograph (top) and Coomassie stained gel (bottom) of 35 S-labeled Myc-SA2 proteins (input)
Supplementary Fig. 1. GPRC5A post-transcriptionally down-regulates EGFR expression. (a) Plot of the changes in steady state mrna levels versus
 Plot of the changes in steady state mrna levels versus") Supplementary Fig. 1. GPRC5A post-transcriptionally down-regulates EGFR expression. (a) Plot of the changes in steady state mrna levels versus changes in corresponding proteins between wild type and Gprc5a-/-
Supplementary Fig. 1. GPRC5A post-transcriptionally down-regulates EGFR expression. (a) Plot of the changes in steady state mrna levels versus changes in corresponding proteins between wild type and Gprc5a-/-
Loss of Calreticulin Uncovers a Critical Role for Calcium in Regulating Cellular Lipid Homeostasis
 SUPPLEMENTARY MATERIAL Loss of Calreticulin Uncovers a Critical Role for Calcium in Regulating Cellular Lipid Homeostasis Wen-An Wang 1, Wen-Xin Liu 1, Serpen Durnaoglu 2, Sun-Kyung Lee 2, Jihong Lian
Supplementary Figure 1. DNA methylation of the adiponectin promoter R1, Pparg2, and Tnfa promoter in adipocytes is not affected by obesity.
 Supplementary Figure 1. DNA methylation of the adiponectin promoter R1, Pparg2, and Tnfa promoter in adipocytes is not affected by obesity. (a) Relative amounts of adiponectin, Ppar 2, C/ebp, and Tnf mrna
Predictive PP1Ca binding region in BIG3 : 1,228 1,232aa (-KAVSF-) HEK293T cells *** *** *** KPL-3C cells - E E2 treatment time (h)
 HEK293T cells *** *** *** KPL-3C cells - E E2 treatment time (h)") Relative expression ERE-luciferase activity activity (pmole/min) activity (pmole/min) activity (pmole/min) activity (pmole/min) MCF-7 KPL-3C ZR--1 BT-474 T47D HCC15 KPL-1 HBC4 activity (pmole/min) a d
Relative expression ERE-luciferase activity activity (pmole/min) activity (pmole/min) activity (pmole/min) activity (pmole/min) MCF-7 KPL-3C ZR--1 BT-474 T47D HCC15 KPL-1 HBC4 activity (pmole/min) a d
KSRP is critical in governing hepatic lipid metabolism
 KSRP is critical in governing hepatic lipid metabolism through controlling Per2 expression Chu-Fang Chou, 1, * Xiaolin Zhu, 1, Yi-Yu Lin, * Karen L. Gamble, W. Timothy Garvey, and Ching-Yi Chen 2, * Department
Requires Signaling though Akt2 Independent of the. Transcription Factors FoxA2, FoxO1, and SREBP1c
 Cell Metabolism, Volume 14 Supplemental Information Postprandial Hepatic Lipid Metabolism Requires Signaling though Akt2 Independent of the Transcription Factors FoxA2, FoxO1, and SREBP1c Min Wan, Karla
Supplemental Information. Human Carboxylesterase 2 Reverses. Obesity-Induced Diacylglycerol Accumulation. and Glucose Intolerance
 Cell Reports, Volume 18 Supplemental Information Human Carboxylesterase 2 Reverses Obesity-Induced Diacylglycerol Accumulation and Glucose Intolerance Maxwell A. Ruby, Julie Massart, Devon M. Hunerdosse,
FIG S1 Examination of eif4b expression after virus infection. (A) A549 cells
 A549 cells") Supplementary Figure Legends FIG S1 Examination of expression after virus infection. () 549 cells were infected with herpes simplex virus (HSV) (MOI = 1), and harvested at the indicated times, followed
Supplementary Figure Legends FIG S1 Examination of expression after virus infection. () 549 cells were infected with herpes simplex virus (HSV) (MOI = 1), and harvested at the indicated times, followed
A Hepatocyte Growth Factor Receptor (Met) Insulin Receptor hybrid governs hepatic glucose metabolism SUPPLEMENTARY FIGURES, LEGENDS AND METHODS
 Insulin Receptor hybrid governs hepatic glucose metabolism SUPPLEMENTARY FIGURES, LEGENDS AND METHODS") A Hepatocyte Growth Factor Receptor (Met) Insulin Receptor hybrid governs hepatic glucose metabolism Arlee Fafalios, Jihong Ma, Xinping Tan, John Stoops, Jianhua Luo, Marie C. DeFrances and Reza Zarnegar
A Hepatocyte Growth Factor Receptor (Met) Insulin Receptor hybrid governs hepatic glucose metabolism Arlee Fafalios, Jihong Ma, Xinping Tan, John Stoops, Jianhua Luo, Marie C. DeFrances and Reza Zarnegar
(a) Significant biological processes (upper panel) and disease biomarkers (lower panel)
 Significant biological processes (upper panel) and disease biomarkers (lower panel)") Supplementary Figure 1. Functional enrichment analyses of secretomic proteins. (a) Significant biological processes (upper panel) and disease biomarkers (lower panel) 2 involved by hrab37-mediated secretory
Supplementary Figure 1. Functional enrichment analyses of secretomic proteins. (a) Significant biological processes (upper panel) and disease biomarkers (lower panel) 2 involved by hrab37-mediated secretory
(A) RT-PCR for components of the Shh/Gli pathway in normal fetus cell (MRC-5) and a
 RT-PCR for components of the Shh/Gli pathway in normal fetus cell (MRC-5) and a") Supplementary figure legends Supplementary Figure 1. Expression of Shh signaling components in a panel of gastric cancer. (A) RT-PCR for components of the Shh/Gli pathway in normal fetus cell (MRC-5) and
Supplementary figure legends Supplementary Figure 1. Expression of Shh signaling components in a panel of gastric cancer. (A) RT-PCR for components of the Shh/Gli pathway in normal fetus cell (MRC-5) and
SUPPLEMENTARY INFORMATION
 DOI: 10.1038/ncb2607 Figure S1 Elf5 loss promotes EMT in mammary epithelium while Elf5 overexpression inhibits TGFβ induced EMT. (a, c) Different confocal slices through the Z stack image. (b, d) 3D rendering
1.5 ASK1KO fed. fasted 16 hrs w/o water. Fed. 4th. 4th WT ASK1KO N=29, 11(WT), ,5(ASK1KO) ASK1KO ASK1KO **** Time [h]
![1.5 ASK1KO fed. fasted 16 hrs w/o water. Fed. 4th. 4th WT ASK1KO N=29, 11(WT), ,5(ASK1KO) ASK1KO ASK1KO **** Time [h]](/thumbs/87/97258189.jpg "1.5 ASK1KO fed. fasted 16 hrs w/o water. Fed. 4th. 4th WT ASK1KO N=29, 11(WT), ,5(ASK1KO) ASK1KO ASK1KO **** Time [h]") 7: 13: 19: 1: 7: 151117 a 151117 4th 4th b c RQ.95 KO.9.85.8.75.7 light dark light dark.65 7: 19: 7: 19: 7: Means ± SEM, N=6 RQ 1..9.8.7.6.6 KO CL (-) CL (+) ibat weight ratio (/body weight) [%].5.4.3.2.1
7: 13: 19: 1: 7: 151117 a 151117 4th 4th b c RQ.95 KO.9.85.8.75.7 light dark light dark.65 7: 19: 7: 19: 7: Means ± SEM, N=6 RQ 1..9.8.7.6.6 KO CL (-) CL (+) ibat weight ratio (/body weight) [%].5.4.3.2.1
SUPPLEMENTARY INFORMATION
 DOI:.38/ncb2822 a MTC02 FAO cells EEA1 b +/+ MEFs /DAPI -/- MEFs /DAPI -/- MEFs //DAPI c HEK 293 cells WCE N M C P AKT TBC1D7 Lamin A/C EEA1 VDAC d HeLa cells WCE N M C P AKT Lamin A/C EEA1 VDAC Figure
SUPPLEMENTARY FIGURES
 SUPPLEMENTARY FIGURES Supplementary Figure 1. (A) Left, western blot analysis of ISGylated proteins in Jurkat T cells treated with 1000U ml -1 IFN for 16h (IFN) or left untreated (CONT); right, western
Supplementary Figure 1: si-craf but not si-braf sensitizes tumor cells to radiation.
 Supplementary Figure 1: si-craf but not si-braf sensitizes tumor cells to radiation. (a) Embryonic fibroblasts isolated from wildtype (WT), BRAF -/-, or CRAF -/- mice were irradiated (6 Gy) and DNA damage
Supplementary Information
 Supplementary Information Notch deficiency decreases hepatic lipid accumulation by induction of fatty acid oxidation No-Joon Song,#, Ui Jeong Yun,#, Sunghee Yang, Chunyan Wu, Cho-Rong Seo, A-Ryeong Gwon,,
SUPPLEMENTARY INFORMATION
 DOI: 10.1038/ncb2566 Figure S1 CDKL5 protein expression pattern and localization in mouse brain. (a) Multiple-tissue western blot from a postnatal day (P) 21 mouse probed with an antibody against CDKL5.
SUPPLEMENTARY DATA. Supplementary Table 1. Primer sequences for qrt-pcr
 Supplementary Table 1. Primer sequences for qrt-pcr Gene PRDM16 UCP1 PGC1α Dio2 Elovl3 Cidea Cox8b PPARγ AP2 mttfam CyCs Nampt NRF1 16s-rRNA Hexokinase 2, intron 9 β-actin Primer Sequences 5'-CCA CCA GCG
Supplementary Table 1. List of primers used in this study
 Supplementary Table 1. List of primers used in this study Gene Forward primer Reverse primer Rat Met 5 -aggtcgcttcatgcaggt-3 5 -tccggagacacaggatgg-3 Rat Runx1 5 -cctccttgaaccactccact-3 5 -ctggatctgcctggcatc-3
Supplementary Figure 1. Expression of CUGBP1 in non-parenchymal liver cells treated with TGF-β
 Supplementary Figures Supplementary Figure 1. Expression of CUGBP1 in non-parenchymal liver cells treated with TGF-β and LPS. Non-parenchymal liver cells were isolated and treated with or without TGF-β
T H E J O U R N A L O F C E L L B I O L O G Y
 Supplemental material Chairoungdua et al., http://www.jcb.org/cgi/content/full/jcb.201002049/dc1 T H E J O U R N A L O F C E L L B I O L O G Y Figure S1. Expression of CD9 and CD82 inhibits Wnt/ -catenin
Supplemental information contains 7 movies and 4 supplemental Figures
 1 2 3 4 5 6 7 8 9 10 11 12 13 14 15 16 17 18 19 20 21 22 23 24 25 26 27 Supplemental information contains 7 movies and 4 supplemental Figures Movies: Movie 1. Single virus tracking of A4-mCherry-WR MV
Supplementary information
 Supplementary information Human Cytomegalovirus MicroRNA mir-us4-1 Inhibits CD8 + T Cell Response by Targeting ERAP1 Sungchul Kim, Sanghyun Lee, Jinwook Shin, Youngkyun Kim, Irini Evnouchidou, Donghyun
Table S1. Primer sequences used for qrt-pcr. CACCATTGGCAATGAGCGGTTC AGGTCTTTGCGGATGTCCACGT ACTB AAGTCCATGTGCTGGCAGCACT ATCACCACTCCGAAGTCCGTCT LCOR
 Table S1. Primer sequences used for qrt-pcr. ACTB LCOR KLF6 CTBP1 CDKN1A CDH1 ATF3 PLAU MMP9 TFPI2 CACCATTGGCAATGAGCGGTTC AGGTCTTTGCGGATGTCCACGT AAGTCCATGTGCTGGCAGCACT ATCACCACTCCGAAGTCCGTCT CGGCTGCAGGAAAGTTTACA
Supplementary information. MARCH8 inhibits HIV-1 infection by reducing virion incorporation of envelope glycoproteins
 Supplementary information inhibits HIV-1 infection by reducing virion incorporation of envelope glycoproteins Takuya Tada, Yanzhao Zhang, Takayoshi Koyama, Minoru Tobiume, Yasuko Tsunetsugu-Yokota, Shoji
Supplementary Information
 Supplementary Information Temozolomide suppresses MYC via activation of TAp63 to inhibit progression of human glioblastoma Tomohiro Yamaki, Yusuke Suenaga, Toshihiko Iuchi, Jennifer Alagu, Atsushi Takatori,
Supplementary Figure 1
 VO (ml kg - min - ) VCO (ml kg - min - ) Respiratory exchange ratio Energy expenditure (cal kg - min - ) Locomotor activity (x count) Body temperature ( C) Relative mrna expression TA Sol EDL PT Heart
2.5. AMPK activity
 Supplement Fig. A 3 B phos-ampk 2.5 * Control AICAR AMPK AMPK activity (Absorbance at 45 nm) 2.5.5 Control AICAR Supplement Fig. Effects of AICAR on AMPK activation in macrophages. J774. macrophages were
Supplementary Information. Cryptochrome Mediates Circadian Regulation of camp. Signalling and Hepatic Gluconeogenesis
 Supplementary Information Cryptochrome Mediates Circadian Regulation of camp Signalling and Hepatic Gluconeogenesis Eric E. Zhang 1,2*, Yi Liu 3,5*, Renaud Dentin 3, Pagkapol Y. Pongsawakul 1, Andrew C.
SUPPLEMENTARY FIGURES AND TABLE
 SUPPLEMENTARY FIGURES AND TABLE Supplementary Figure S1: Characterization of IRE1α mutants. A. U87-LUC cells were transduced with the lentiviral vector containing the GFP sequence (U87-LUC Tet-ON GFP).
Tbk1-TKO! DN cells (%)! 15! 10!
! 15! 10!") a! T Cells! TKO! B Cells! TKO! b! CD4! 8.9 85.2 3.4 2.88 CD8! Tbk1-TKO! 1.1 84.8 2.51 2.54 c! DN cells (%)! 4 3 2 1 DP cells (%)! 9 8 7 6 CD4 + SP cells (%)! 5 4 3 2 1 5 TKO! TKO! TKO! TKO! 15 1 5 CD8
a! T Cells! TKO! B Cells! TKO! b! CD4! 8.9 85.2 3.4 2.88 CD8! Tbk1-TKO! 1.1 84.8 2.51 2.54 c! DN cells (%)! 4 3 2 1 DP cells (%)! 9 8 7 6 CD4 + SP cells (%)! 5 4 3 2 1 5 TKO! TKO! TKO! TKO! 15 1 5 CD8
Supplementary fig. 1. Crystals induce necroptosis does not involve caspases, TNF receptor or NLRP3. A. Mouse tubular epithelial cells were pretreated
 Supplementary fig. 1. Crystals induce necroptosis does not involve caspases, TNF receptor or NLRP3. A. Mouse tubular epithelial cells were pretreated with zvad-fmk (10µM) and exposed to calcium oxalate
Supplementary Figure S1 Supplementary Figure S2
 Supplementary Figure S A) The blots shown in Figure B were qualified by using Gel-Pro analyzer software (Rockville, MD, USA). The ratio of LC3II/LC3I to actin was then calculated. The data are represented
FH- FH+ DM. 52 Volunteers. Oral & IV Glucose Tolerance Test Hyperinsulinemic Euglycemic Clamp in Non-DM Subjects ACADSB MYSM1. Mouse Skeletal Muscle
 A 52 Volunteers B 6 5 4 3 2 FH- FH+ DM 1 Oral & IV Glucose Tolerance Test Hyperinsulinemic Euglycemic Clamp in Non-DM Subjects ZYX EGR2 NR4A1 SRF target TPM1 ACADSB MYSM1 Non SRF target FH- FH+ DM2 C SRF
Sterol regulatory element binding proteins
 STEATOHEPATITIS/METABOLIC LIVER DISEASE Ring Finger Protein20 Regulates Hepatic Lipid Metabolism Through Protein Kinase A-Dependent Sterol Regulatory Element Binding Protein1c Degradation Jae Ho Lee, 1
A synergistic anti-obesity effect by a combination of capsinoids and cold temperature through the promotion of beige adipocyte biogenesis
 A synergistic anti-obesity effect by a combination of capsinoids and cold temperature through the promotion of beige adipocyte biogenesis Kana Ohyama, 1,2 Yoshihito Nogusa, 1 Kosaku Shinoda, 2 Katsuya
A Central Role of MG53 in Metabolic Syndrome. and Type-2 Diabetes
 A Central Role of MG53 in Metabolic Syndrome and Type-2 Diabetes Yan Zhang, Chunmei Cao, Rui-Ping Xiao Institute of Molecular Medicine (IMM) Peking University, Beijing, China Accelerated Aging in China
Supplementary Figure 1
 Supplementary Figure 1 AAV-GFP injection in the MEC of the mouse brain C57Bl/6 mice at 4 months of age were injected with AAV-GFP into the MEC and sacrificed at 7 days post injection (dpi). (a) Brains
ZL ZDF ZDF + E2 *** Visceral (g) ZDF
 ZDF") Body Weight (g) 4 3 2 1 ** * ZL ZDF 6 8 1 12 14 16 Age (weeks) B * Sub-cutaneous (g) 16 12 8 4 ZL ZDF Visceral (g) 25 2 15 1 5 ZL ZDF Total fat pad weight (g) 4 3 2 1 ZDF ZL Supplemental Figure 1: Effect
Body Weight (g) 4 3 2 1 ** * ZL ZDF 6 8 1 12 14 16 Age (weeks) B * Sub-cutaneous (g) 16 12 8 4 ZL ZDF Visceral (g) 25 2 15 1 5 ZL ZDF Total fat pad weight (g) 4 3 2 1 ZDF ZL Supplemental Figure 1: Effect
SUPPLEMENTARY INFORMATION
 DOI: 10.1038/ncb2211 a! mir-143! b! mir-103/107! let-7a! mir-144! mir-122a! mir-126-3p! mir-194! mir-27a! mir-30c! Figure S1 Northern blot analysis of mir-143 expression dependent on feeding conditions.
Supplementary Figures
 Supplementary Figures Supplementary Figure 1 DOT1L regulates the expression of epithelial and mesenchymal markers. (a) The expression levels and cellular localizations of EMT markers were confirmed by
Supplementary Figure 1. Normal T lymphocyte populations in Dapk -/- mice. (a) Normal thymic development in Dapk -/- mice. Thymocytes from WT and Dapk
 Normal thymic development in Dapk -/- mice. Thymocytes from WT and Dapk") Supplementary Figure 1. Normal T lymphocyte populations in Dapk -/- mice. (a) Normal thymic development in Dapk -/- mice. Thymocytes from WT and Dapk -/- mice were stained for expression of CD4 and CD8.
Supplementary Figure 1. Normal T lymphocyte populations in Dapk -/- mice. (a) Normal thymic development in Dapk -/- mice. Thymocytes from WT and Dapk -/- mice were stained for expression of CD4 and CD8.
Figures S1-S5, Figure Legends, Table S1 List of primers used in the study
 Insulin receptor alternative splicing is regulated by insulin signaling and modulates beta cell survival Pushkar Malakar,4, Lital Chartarifsky,4, Ayat Hija, Gil Leibowitz 3, Benjamin Glaser 3, Yuval Dor,
A. List of selected proteins with high SILAC (H/L) ratios identified in mass
 ratios identified in mass") Supplementary material Figure S1. Interaction between UBL5 and FANCI A. List of selected proteins with high SILAC (H/L) ratios identified in mass spectrometry (MS)-based analysis of UBL5-interacting proteins,
Supplementary material Figure S1. Interaction between UBL5 and FANCI A. List of selected proteins with high SILAC (H/L) ratios identified in mass spectrometry (MS)-based analysis of UBL5-interacting proteins,
Baf60c drives glycolytic muscle formation and improves glucose homeostasis through Deptor-mediated Akt activation
 Baf6c drives glycolytic muscle formation and improves glucose homeostasis through Deptor-mediated Akt activation Zhuo-Xian Meng,2, Siming Li,2, Lin Wang,2, Hwi Jin Ko 3, Yongjin Lee 3, Dae Young Jung 3,
The antiparasitic drug ivermectin is a novel FXR ligand that regulates metabolism
 Supplementary Information The antiparasitic drug ivermectin is a novel FXR ligand that regulates metabolism Address correspondence to Yong Li (yongli@xmu.edu.cn, Tel: 86-592-218151) GW464 CDCA Supplementary
Supplementary Figure S I: Effects of D4F on body weight and serum lipids in apoe -/- mice.
 Supplementary Figures: Supplementary Figure S I: Effects of D4F on body weight and serum lipids in apoe -/- mice. Male apoe -/- mice were fed a high-fat diet for 8 weeks, and given PBS (model group) or
Supplementary Materials for
 www.sciencesignaling.org/cgi/content/full/9/439/ra78/dc1 Supplementary Materials for Small heterodimer partner mediates liver X receptor (LXR) dependent suppression of inflammatory signaling by promoting
Regulation of Hepatic Gluconeogenesis by an ER-Bound Transcription Factor, CREBH
 Cell Metabolism, Volume 11 Supplemental Information Regulation of Hepatic Gluconeogenesis by an ER-Bound Transcription Factor, CREBH Min-Woo Lee, Dipanjan Chanda, Jianqi Yang, Hyunhee Oh, Su Sung Kim,
SREBPs suppress IRS-2-mediated insulin signalling in the liver
 SREBPs suppress -mediated insulin signalling in the liver Tomohiro Ide 1,Hitoshi Shimano 2,,Naoya Yahagi 2,Takashi Matsuzaka 1,Masanori Nakakuki 1, Takashi Yamamoto 1,Yoshimi Nakagawa 2,Akimitsu Takahashi
SUPPLEMENTARY INFORMATION
 SUPPLEMENTARY INFORMATION FOR Liver X Receptor α mediates hepatic triglyceride accumulation through upregulation of G0/G1 Switch Gene 2 (G0S2) expression I: SUPPLEMENTARY METHODS II: SUPPLEMENTARY FIGURES
Supplementary Figure 1
 Supplementary Figure 1 Supplementary Figure 1 Schematic depiction of the tandem Fc GDF15. Supplementary Figure 2 Supplementary Figure 2 Gfral mrna levels in the brains of both wild-type and knockout Gfral
Nature Structural & Molecular Biology: doi: /nsmb Supplementary Figure 1. Differential expression of mirnas from the pri-mir-17-92a locus.
 Supplementary Figure 1 Differential expression of mirnas from the pri-mir-17-92a locus. (a) The mir-17-92a expression unit in the third intron of the host mir-17hg transcript. (b,c) Impact of knockdown
Nature Genetics: doi: /ng.3731
 Supplementary Figure 1 Circadian profiles of Adarb1 transcript and ADARB1 protein in mouse tissues. (a) Overlap of rhythmic transcripts identified in the previous transcriptome analyses. The mouse liver
Supplement Figure S1. Real Time PCR analysis of mrna levels of C/EBPα and PU.1 in wild type (WT) and NQO1-null (NQO1-/-) mice.
 and NQO1-null (NQO1-/-) mice.") competes with 20S proteasome for binding with C/EBP leading to its stabilization and Relative mrna levels Supplement Figure S1. Real Time PCR analysis of mrna levels of C/EBPα and PU.1 in wild type (WT)
competes with 20S proteasome for binding with C/EBP leading to its stabilization and Relative mrna levels Supplement Figure S1. Real Time PCR analysis of mrna levels of C/EBPα and PU.1 in wild type (WT)
Supplementary Figure 1. DJ-1 modulates ROS concentration in mouse skeletal muscle.
 Supplementary Figure 1. DJ-1 modulates ROS concentration in mouse skeletal muscle. (a) mrna levels of Dj1 measured by quantitative RT-PCR in soleus, gastrocnemius (Gastroc.) and extensor digitorum longus
ALT (U/L) (Relative expression) HDL (mm) (Relative expression) ALT (U/L) (Relative expression)
 (Relative expression) HDL (mm) (Relative expression) ALT (U/L) (Relative expression)") a DMT mrna () 8 6 r =.96 P =. DMT mrna () 8 6 r =. P =.6 DMT mrna () 8 6 r =.99 P =.6 DMT mrna () 8 6 r =. P =.9 DMT mrna () BMI (kg/m ) 8 6 r =.7 P =.966 DMT mrna () 8 ALT (U/L) 8 6 r = -.66 P =.76 DMT
a DMT mrna () 8 6 r =.96 P =. DMT mrna () 8 6 r =. P =.6 DMT mrna () 8 6 r =.99 P =.6 DMT mrna () 8 6 r =. P =.9 DMT mrna () BMI (kg/m ) 8 6 r =.7 P =.966 DMT mrna () 8 ALT (U/L) 8 6 r = -.66 P =.76 DMT
glucagon receptor AgRP merged color map I corr = 0.76±0.024 glucagon receptor DAPI merged
 Hypothalamic glucagon signaling inhibits glucose production Patricia I. Mighiu*, Jessica T.Y. Yue*, Beatrice M. Filippi, Mona A. Abraham, Madhu Chari, Carol K.L. Lam, Clair S. Yang, Nikita R. Christian,
SUPPLEMENTARY INFORMATION
 SUPPLEMENTARY INFORMATION doi:10.1038/nature11429 S1a 6 7 8 9 Nlrc4 allele S1b Nlrc4 +/+ Nlrc4 +/F Nlrc4 F/F 9 Targeting construct 422 bp 273 bp FRT-neo-gb-PGK-FRT 3x.STOP S1c Nlrc4 +/+ Nlrc4 F/F casp1
GPR120 *** * * Liver BAT iwat ewat mwat Ileum Colon. UCP1 mrna ***
 a GPR120 GPR120 mrna/ppia mrna Arbitrary Units 150 100 50 Liver BAT iwat ewat mwat Ileum Colon b UCP1 mrna Fold induction 20 15 10 5 - camp camp SB202190 - - - H89 - - - - - GW7647 Supplementary Figure
(A) SW480, DLD1, RKO and HCT116 cells were treated with DMSO or XAV939 (5 µm)
 SW480, DLD1, RKO and HCT116 cells were treated with DMSO or XAV939 (5 µm)") Supplementary Figure Legends Figure S1. Tankyrase inhibition suppresses cell proliferation in an axin/β-catenin independent manner. (A) SW480, DLD1, RKO and HCT116 cells were treated with DMSO or XAV939
Supplementary Figure Legends Figure S1. Tankyrase inhibition suppresses cell proliferation in an axin/β-catenin independent manner. (A) SW480, DLD1, RKO and HCT116 cells were treated with DMSO or XAV939
General Laboratory methods Plasma analysis: Gene Expression Analysis: Immunoblot analysis: Immunohistochemistry:
 General Laboratory methods Plasma analysis: Plasma insulin (Mercodia, Sweden), leptin (duoset, R&D Systems Europe, Abingdon, United Kingdom), IL-6, TNFα and adiponectin levels (Quantikine kits, R&D Systems
Supplementary Information
 Supplementary Information GADD34-deficient mice develop obesity, nonalcoholic fatty liver disease, hepatic carcinoma and insulin resistance Naomi Nishio and Ken-ichi Isobe Department of Immunology, Nagoya
Quantitative Real-Time PCR was performed as same as Materials and Methods.
 Supplemental Material Quantitative Real-Time PCR Quantitative Real-Time PCR was performed as same as Materials and Methods. Expression levels in the aorta were normalized to peptidylprolyl isomerase B
Supplementary Fig. S1. Schematic diagram of minigenome segments.
 open reading frame 1565 (segment 5) 47 (-) 3 5 (+) 76 101 125 149 173 197 221 246 287 open reading frame 890 (segment 8) 60 (-) 3 5 (+) 172 Supplementary Fig. S1. Schematic diagram of minigenome segments.
Targeting of the circadian clock via CK1δ/ε to improve glucose homeostasis in obesity
 Targeting of the circadian clock via CK1δ/ε to improve glucose homeostasis in obesity Peter S. Cunningham, Siobhán A. Ahern, Laura C. Smith, Carla S. da Silva Santos, Travis T. Wager and David A. Bechtold
Supporting Information Table of content
 Supporting Information Table of content Supporting Information Fig. S1 Supporting Information Fig. S2 Supporting Information Fig. S3 Supporting Information Fig. S4 Supporting Information Fig. S5 Supporting
HIV VPR alters fat metabolism. Dorothy E Lewis PhD/Ashok Balasubramanyam MD
 HIV VPR alters fat metabolism Dorothy E Lewis PhD/Ashok Balasubramanyam MD Old Dogma for HIV associated lipodystrophy Differentiation Block (PI) Lipoatrophy Apoptosis (NRTI) Stem cell Preadipocyte Adipocyte
Identified proteins interacting with TMBIM1 by mass spectrometry
 Supplementary Information Journal: Nature Medicine Article Title: Corresponding Author: A novel multivesicular body regulator TMBIM1 protects against non-alcoholic fatty liver disease in mice and monkeys
Reviewers' comments: Reviewer #1 (Remarks to the Author):
:") Reviewers' comments: Reviewer #1 (Remarks to the Author): In this manuscript, Song et al. identified FBXW7 as a new positive regulator for RIG-Itriggered type I IFN signaling pathway. The authors observed
Reviewers' comments: Reviewer #1 (Remarks to the Author): In this manuscript, Song et al. identified FBXW7 as a new positive regulator for RIG-Itriggered type I IFN signaling pathway. The authors observed
Involvement of FKBP6 in hepatitis C virus replication
 Supplementary Information Involvement of FKBP6 in hepatitis C virus replication Hirotake Kasai 1,*, Kunihiro Kawakami 2,*, Hiromasa Yokoe 3, Kentaro Yoshimura 4, Masanori Matsuda 5, Jun Yasumoto 1, Shinya
Supplementary Information for
 Supplementary Information for Involvement of urinary bladder Connexin43 and the circadian clock in the coordination of diurnal micturition rhythm Hiromitsu Negoro, 1,2 Akihiro Kanematsu, 1,3 Masao Doi,
Figure S1A. Blood glucose levels in mice after glucose injection
 ## Figure S1A. Blood glucose levels in mice after glucose injection Blood glucose (mm/l) 25 2 15 1 5 # 15 3 6 3+3 Time after glucose injection (min) # Figure S1B. α-kg levels in mouse livers after glucose
Liver Med23 ablation improves glucose and lipid metabolism through modulating FOXO1 activity
 ORIGINAL ARTICLE Cell Research (2014) 24:1250-1265. 2014 IBCB, SIBS, CAS All rights reserved 1001-0602/14 www.nature.com/cr npg Liver Med23 ablation improves glucose and lipid metabolism through modulating
Nature Immunology: doi: /ni.3866
 Nature Immunology: doi:10.1038/ni.3866 Supplementary Figure 1 The effect of TIPE2 on chemotaxis. a, The expression of TIPE2 in dhl-60c, dhl-60t, TIPE2-expressing and 15/16Q-expressing dhl-60t neutrophils